1. Introduction
Drilling and blasting are common operations in rock fragmentation to facilitate rock excavation in mining and civil works. The fragmentation process occurs quickly and involves several mechanisms, making its study challenging. From a single blasthole, the fracture mechanism involves a combined action of shock waves and explosion gases where shock waves act first, causing the initial fracturing, followed by the explosion gases wedging into the cracks and extending fractures.
Three main damage zones form around the blasthole: the crushed, fracture/fragmentation, and seismic zones. The crushed and fracture zones are the major focus when blasting for rock excavation. The crushed zone is formed from the higher compressive stresses from the detonation wave and the rapid expansion of detonation gases, producing higher shock waves acting on the inner side of the blasthole and the surrounding rock. After it travels through a distance, the shock wave attenuates and falls below the dynamic compressive strength of the rock. As the rock yields, it releases the tangential stress, causing longer and more spaced radial cracks in the fractured zone. These cracks propagate as long as the tensile component of the compressive stress is higher than the dynamic tensile strength of the rock [
1]. When the wave encounters a free surface, it is reflected, and if it is strong enough, it causes further fracturing (spalling). As the wave travels outwards, it attenuates further and becomes an elastic wave that can deform but not fracture rock within the seismic zone. The size of these zones varies vastly depending on the explosive strength and encountered rock mass. The explosive gases expand into the cracks, extending fractures and forming the fragmentation.
In mining production, surface or underground, several holes are initiated in the blast shots. The total number of blastholes and their arrangement, as well as the design of the initiation pattern and decision between simultaneous or sequential initiation, is critical in the rock fragmentation and the safety and stability of the remaining rock and structures. In multi-hole blasting, spacing between the holes and time delay are important in enhancing fragmentation by allowing enough time for the cracks to grow between the holes with minimum interference.
From a series of small-scale tests, Katsabanis, et al. [
2] concluded that simultaneous initiation results in coarser fragmentation. Studies conducted by Rossmanith [
3] and Vanbrabant and Espinosa [
4] indicated that shorter delays are favourable in improving fragmentation because the stress wave interaction between the holes enhances the tensile tail of the stress wave. On the contrary, the theoretical and numerical investigation conducted by Yi et al. [
5] and Yi et al. [
6] indicated that it is impossible to improve fragmentation from wave superimposition when the stress waves interact between the blastholes because the increase in tensile stress occurs in a very small area around the collision zone. A series of small-scale tests done by Johansson and Ouchterlony [
7] also observed no significant improvements in fragmentation with interaction of shock waves.
Stagg and Rholl [
8] observed that the optimum fragmentation is achieved when the second hole is initiated after the failure process in the first hole is completed. Saadatmand Hashemi and Katsabanis [
9] suggested that the optimum delay is the delay that allows enough time for cracks to grow and precondition the surrounding rock for neighbouring blasthole and it is a function of the rise and duration of the stress wave pulse, the stress wave speed, and crack propagation in the rock mass. These studies provide important insight into the interaction between stress waves produced by the adjacent blastholes, but the influence of heterogeneous rock mass on the blast process and how it affects this interaction is still unclear.
Extensive studies conducted on the factors influencing fragmentation by blasting indicate that the intact rock’s physical, mechanical, and structural properties highly influence the blast outcomes [
10,
11,
12,
13,
14]. The study conducted by Dotto and Pourrahimian [
15] concluded that the presence of rock structures influences the propagation of stress waves and fractures and especially depends on the properties of infill materials and the width, continuity, intensity, and orientation of such structures. Since the rock mass properties can not be changed, the choice of explosives, geometric design parameters, and initiation sequencing can be tailored to mitigate the influence of rock mass properties and achieve the desired outcomes.
Due to the complex nature of the rock mass and its interaction with explosive energy, numerical modelling has been used extensively for several decades to study the blast wave behaviour and provide insight into the blasting process [
14,
16]. The ability to track the growth and nucleation of cracks of brittle material from the damage evolution laws has made finite element modelling (FEM) more desirable in blasting simulation [
17]. The Riedel-Hiermaier-Thoma (RHT) constitutive material model with homogenized micromechanical description and interdependences between stress, strain, plastic strain, strain rate, damage, and failure implemented in LS-DYNA was successfully used to model the dynamic behaviour of concrete [
18]. This model is vastly used to study rock fragmentation by blasting [
17,
19,
20,
21].
This study implements the RHT model in LS-DYNA to study the interaction of explosive energy between two blastholes. The study is divided into two sections. In the first section, the effect of initiation delay on burden-induced damage of the intact rock is investigated. The second part studies the influence of variability in rock mass properties and how it varies the initiation delay and firing sequence in achieving better fracturing. Overall observations are used to propose techniques to improve blast-induced fragmentation in variable rock masses by firing sequence and initiation delays. The model uses data from an existing mine, and the simulation results are verified and validated by the field blast results.
2. Numerical Modelling Verification and Validation
LS-DYNA, a nonlinear transient dynamic finite element code, is used to simulate rock blasting [
22]. LS-DYNA can successfully model the interaction between the solid material (rock) and fluid and gas flow (explosion gases) using the Lagrangian algorithm and Arbitrary Lagrangian-Eulerian (ALE), respectively, incorporate coupling between Lagrangian and ALE interface and apply boundary conditions to restrict elements’ movements as needed. Two-dimensional (2D) and three-dimensional (3D) models are used in this study. The 3D model is used in the initial modelling to illustrate stress distribution and overall damage in a full-size bench, and later on in the analysis, the 2D model is used to study the fragmentation process and the interaction between blastholes, preferably due to the computational simplicity.
2.1. The RHT Material Model
The numerical model consists of rock medium and explosives. The RHT model developed by Riedel et al. [
23] and implemented by Borrvall and Riedel [
18] in LS-DYNA is calibrated to capture the effect of strain rate on strength and used to model the rock medium and track damage development under blast loading. The material model contains three limit surfaces that define the strength of the material: the initial elastic yield surface, residual friction surface, and failure surface, as illustrated in
Figure 1. The surfaces represent the reduction in material strength in different meridians and the effect of strain rate. The first surface is the yield surface below which the model is elastic. Beyond the yield surface, the material deforms plastically with linear hardening description. When stress reaches the failure surface, the damage strain accumulation governs damage evolution. The damage variable of the RHT model (D) is defined using the Equation (1), where
is the accumulated plastic strain and
the plastic strain failure. D varies from 0 to 1; 0 represents undisturbed material, and 1 is a fully damaged material. More information about the RHT model can be found in Borrvall and Riedel [
18].
The RHT model parameters were determined for the Banded Iron Formation rock (BIF) studied by Dotto et al. [
10] from Nyankanga Pit, Geita Gold Mine in Tanzania. The mechanical properties of the rock are presented in
Table 1. The calibrated RHT model parameters can be found in Dotto and Pourrahimian [
15].
2.2. Explosive Properties and Parameters
The explosive detonation was modelled using the high explosive burn material and Jones-Wilkins-Lee (JWL) EOS. The JWL equation of state is a high-energy combustion model that can reliably predict higher explosion pressures. The model calculates the pressure detonation products P
cj from the expression in the Equation (2) [
24].
A, B, R
1, and R
2 and ꞷ are material constants, E is detonation energy per unit volume, and V
1 is the relative specific volume of detonation products. The explosive used for blasting in Nyankanga Pit is a manufactured emulsion by ORICA; Fortis Extra [
25], with properties summarized in
Table 2. The explosive parameters were obtained from site measurements done by Dotto et al. [
10], and the material constants were adapted from a similar emulsion explosive E682 calibrated by Hansson [
26]. The JWL parameters used are presented in
Table 3.
2.3. Simulation Model Preparation, Verification, and Validation
Using the RHT material model, a rectangular rock specimen with a height of 13.5 m, representing a bench height of 10 m, a sub-drill of 1.5 m, and a pit floor of 2 m was generated. The bench design parameters are the blasthole diameter of 203 mm, the burden of 5.5 m, spacing of 6.5 m, the charge column height of 7 m, and the stemming height of 4.5 m, as illustrated in
Figure 2. The RHT material was modelled using Lagrangian element formulation and the explosive as ALE media. The coupling mechanism was introduced using Lagrange in solid formulation with Eulerian elements as master and Lagrangian elements as slave. The size of elements in the model ranges from 2.5 cm around the blasthole to 8 cm. Non-reflecting boundaries are selected for the four sides, and two sides are left as free faces with reflecting boundaries. Blasthole initiation takes place 1.5 m from the bottom of the blasthole at 0.0 ms, and the model runs for 3 ms. The damage contours for Section A and Section B at 3 ms in
Figure 2 are presented in
Figure 3(a) and (b), respectively. The crushed zone is initially 0.184 mm at 0.56 ms and later extends to 0.31 mm at 3 ms. The pressure and PPV at the blasthole wall are 2640 MPa and 202 m/s, respectively.
The results obtained from the numerical simulation are similar to those of field measurements done by Dotto, et al. [
10] and Dotto and Pourrahimian [
15]. Since the simulation model works as it is intended and provides similar results to the field measurements, the model is verified and validated.
Rapid attenuation takes place when the blasthole wall and the surrounding rock are pulverized, making the pressure and PPV at the end of the crushed zone 1230 MPa and 94.3 m/s, respectively. Gentle attenuation occurs in the fractured zone from spreading, and the wave energy usage is in stress wave and fracture propagation. The pressure and PPV at the boundaries of the model, which is also the limit of the fractured zone, are 18.7 MPa and 1.77 m/s, respectively.
2.4. Full-Scale and 2D Model Comparison
A 2D model is constructed along an x-y plane with the same dimensions as the full-scale model in the same plane. The stress wave pulse monitored at the blasthole wall is shown in
Figure 4(a) for full-scale and 2D models. From the figure, the stress of the shock wave at the blasthole wall is around 2,750 MPa and is observed to diminish at 1 ms with a faster rate in the full-scale model.
The stress wave monitoring mid bench at the burden 2.75 m and spacing 3.25m in
Figure 4(b), indicate that the wave arrives at 0.6 ms from the initiation in both models. A higher spike is observed on a 2D model, and the wave reflection at the free face causes a second spike. The average stress is similar in both models. The comparison of damage intensity indicates more damage on a 2D model, while the fracture pattern and extent are more or less the same as described in
Figure 5.
3. Multi-Hole Blasting and Interaction Between Blastholes
The initiation delay and the spacing between the blastholes play an important role in blast fragmentation from the interaction between stress waves from the adjacent holes. Two blastholes were modelled with a 6.5 m spacing distance between them to analyze the effect of initiation delays on burden fragmentation. The initiation delay timing on the second blasthole varies from 0 to 1.5 ms for the same distance. The initial analysis indicates no further damage evolves after 2 ms from the detonation of the last blasthole. To ensure this time frame is achieved, all models are run for 4.2 ms. The stress wave interaction was analyzed for various rock mass properties, including the intact rock, soft and hard rock contact, and a joint between the blastholes.
3.1. Intact Rock
BIF rock properties are used in the RHT material model to simulate intact rock with emulsion as the explosive. A 2D axisymmetric model consisting of 2 blastholes is used for analysis. The results for the damage intensity as a function of delay timing are illustrated in
Figure 6.
Fracturing is reduced significantly in the absence of a free face. When adjacent blastholes are fired simultaneously, the damage is concentrated directly across the blastholes axis where the stress wave is intensive. A wider area of the burden between the blastholes remains un-fractured. This is caused by destructive interference of the stress wave as illustrated by the elements’ velocity vectors in
Figure 7 and the stress curve plots at the mid-burden (spacing, burden = 3.25 m, 2.75m) in
Figure 8. When a 0.5 ms delay is applied on the second hole, the damage from the first hole increases with increased delay; the interference moves closer to the second hole, causing less damage around it, as seen in
Figure 6(c).
Further delay increase to 1 ms allows the formation of fractures around the first hole with minimum influence on the second hole. The stress wave from the first hole attenuates quite significantly when the second hole detonates. As seen in
Figure 8(d), constructive interference occurs, increasing the wave pulse, fracturing between the blastholes, and, eventually, the overall damage, as seen in
Figure 6(d). Further increase in delay timing causes no further improvements.
As seen in
Figure 8(b), when blastholes are fired simultaneously, the second peak of the stress wave at the center of the burden diminishes to almost zero once the waves meet, shortening the wave pulse. When the delay is 0.3 ms, the second peak appears much quicker and is short-lived. At 1 ms delay, the stress wave is in phase with one hole blast; it is therefore enhanced, and the wave pulse is extended.
Shorter delays, in addition to causing destructive interference between the blastholes, also influence stress concentration around the succeeding blasthole, as demonstrated in
Figure 9. When the blastholes are initiated simultaneously, the stress around the first and the second blasthole is 1,070 MPa and 1,020 MPa, respectively; there is no influence on the second hole. The stress around the first hole remains the same throughout the delays. The stress on the second blasthole increases to 1,420 MPa when the delay is 0.3 and 0.5 ms and falls back to 1,020 MPa with a similar shape as the first hole at 1 ms.
The optimum delay allows enough time for the fractures to form around the preceding hole and reduces interference with the detonation of the succeeding holes and between the blastholes, hence improving fragmentation, as illustrated in
Figure 10(a). The optimum delay forms a smooth peak stress curve from the stress wave monitoring between holes at various distances, as seen in
Figure 10(b). The optimum delay for the intact rock used in the study is 1 ms, causing a 10% improvement in fracturing. A further increase in delay timing does not yield any improvements in fracturing.
3.2. Stress Wave Interaction Across Contacts
The rock
mass is made of several features and structures. Rock contacts are geological features that form during deposition or intrusion of magma, or faulting, which moves the rock and makes two different rocks with different properties come into contact. Rock contacts are common features in mining and can present challenges in rock mass fragmentation by blasting. To study the influence of rock contacts in stress wave interaction and fracturing from blasting, sandstone with RHT parameters calibrated from the experiment results by Jeong and Jeon [
27] in
Table 4 was introduced as a soft rock. The contact between hard rock and soft rock i.e., between BIF and sandstone, is studied where the contact is introduced at 1.5 m from the first blasthole, as illustrated in
Figure 11. More discussion can be found in Dotto and Pourrahimian [
15]
Several techniques are applied to analyze the influence of stress wave interaction on rock fracturing across the contact, such as varying the firing direction, varying the initiation delays, and the distance from the first blasthole to the contact. From the results in
Figure 12, when the contact is at 1.5 m and monitoring points are set up on locations 1 m and 2 m, firing a single blasthole, it is observed that the stress wave is enhanced across from soft rock to hard rock (comparing b to d), and it attenuates in the opposite direction (comparing a to c).
Firing two adjacent blastholes across a contact, case A analyzed the firing sequence is from ‘hard to soft’ (H-S), the interface is at 1.5 m; the second charge (on soft rock) is fired at variable delays. With increasing delays, the damage to the soft rock declines, as shown in
Figure 13(a) and (b). The stress wave from the first blasthole influences detonation on the second hole with shorter delays, as seen in 0.3 and 0.5 ms delays in
Figure 13(b).
Figure 13(c) shows the peak stress monitored from various distances. The first peak 1 m distance is caused by the wave reflection at the contact followed by rapid attenuation across the contact as observed at a 2 m distance. Waves interaction occurs at various distances depending on the timing delay. The increased delay allows more fractures to form across the joint from the first hole, while the development of fractures around the second hole is significantly halted by the increased confinement, as seen in
Figure 13(a).
In the second case (Case B), the firing sequence is from ‘soft to hard’, the interface is at 1.5 m, and the blasthole on a hard rock is fired at various delays. The damage contours in
Figure 14(a) and the plot in
Figure 14(b) show that damage is the highest at 0.3 ms delay with damage improvement of 5%. The stress wave is enhanced through the joint, and as the delay increases, the confinement shifts towards the second hole, as observed in the damage contours in
Figure 14(a) and peak stress curves for various distances in
Figure 14(c).
At 0 ms delay, a larger area between blastholes is affected by the high confinement between blastholes. As the delay increases to 0.3 ms, most of the fractures around the first hole are formed before the second one detonates, and because the delay is shorter and the wave travels at a slower speed in the soft rock, the second hole is not affected. As the delay further increases, more fractures are formed around the first hole and across the joint before 2nd charge detonates. Considering that the stress wave is enhanced across from soft to hard rock, the stress wave interaction shifts towards the second hole and reduces fracturing, as seen in the 1 ms delay in
Figure 14(a) and (c).
In the third case (Case C), the firing sequence is from ‘soft to hard’, the interface is at 5.0 m from the first charge and 1.5 m from the second; the second charge (on a hard rock) is fired at various delays. The results in
Figure 15 suggest the use of longer delays to allow fractures to form around the first rock before the second hole detonates. Shorter delays permit fracture development beyond the contact from the second charge, but the higher confinement limits fracture development around the blasthole and the contact on the first charge side. This improves by increasing delays. The optimum delay is 1.2 ms with fracture improvement of 7%; beyond 1.2 ms, no further improvements occur, as seen in
Figure 15(b).
3.3. Stress Wave Interaction Across the Joint
Other common features in rock mass formation are the joints that can appear alone or in a family with the same properties and orientation, termed joint sets. Joints are formed from the brittle fracture of rock, usually by tensile stress. The joints can be empty or filled with various minerals or materials such as clay, sand, etc. The analysis will cover joints filled with clay and empty joints.
3.3.1. Clay Infill
A single joint 1.5 m from the first blasthole, 10 cm wide, filled with clay material with properties in
Table 5, is studied for the influence of joints in stress wave interaction between blastholes. The main rock is BIF. The joint is modelled as plastic kinematic material and a Lagrangian part.
Two cases are studied; in the first case, a closer charge to the joint is fired first, followed by further at various delays. In the second case, the further hole is fired first, followed by the close charge at various delays. The results indicate that when the closer charge is fired first, with a good delay to the detonation of the further charge, the fractures develop across the joint with less interaction between the holes. A further increase in delay interferes with the formation of fractures around the second charge, as seen in the 1.2 ms delay in
Figure 16.
When the further charge is fired first in Case 2, the stress wave attenuates when it reaches the joint. With shorter delays, stress wave interaction between the two holes hinders fracturing around the joint on the first charge side. Further delay, for example, between 0.9 and 1.2 ms delay fractures form with less interaction from the second hole, improving fracturing. Beyond the 1.2 ms delay, fracturing around the second hole is halted.
The optimum delay is 0.9 ms regardless of the firing direction, with better results obtained when the charge closer to the joint is fired first, as illustrated in
Figure 17(a). The fracturing improvement for Case 1 and Case 2 is 14% and 5%, respectively. The stress plot in
Figure 17(b) indicates a smooth transition of the peak stress along the bench when the delay is 0.9 ms, which, as for the intact rock in
Section 3.1, results in better fracturing. Fracturing a jointed rock mass requires a slightly shorter delay (0.9 ms) than the intact rock (1 ms) since the stress waves attenuate at the joint and reduce the interference’s strength when they meet.
3.3.2. Empty Joints
Similar to the clay-filled joint, an empty joint 10 cm wide is introduced through a BIF rock 1.5 m from the first blasthole. A NULL material model and a polynomial equation of state are used to model the joint. Air is modelled as an Eulerial part. The material and equation of state properties are shown in
Table 6. Similar cases to the clay-filled joint are used in the analysis.
The results in
Figure 18 indicate that when there is a wider empty joint between the blastholes, regardless of the firing sequence, the two holes act as individual elements with the least to no interaction between them. The joint acts as a free face from which most to all of the energy is reflected. The maximum fracturing is obtained when the holes are fired simultaneously; no improvement is seen when delays are introduced. For a narrower joint (3 mm), a slight improvement of 0.3% is observed when the further hole is detonated 0.25 ms ahead of the closer hole, which is insignificant.
4. Discussion and Application in the Blasting
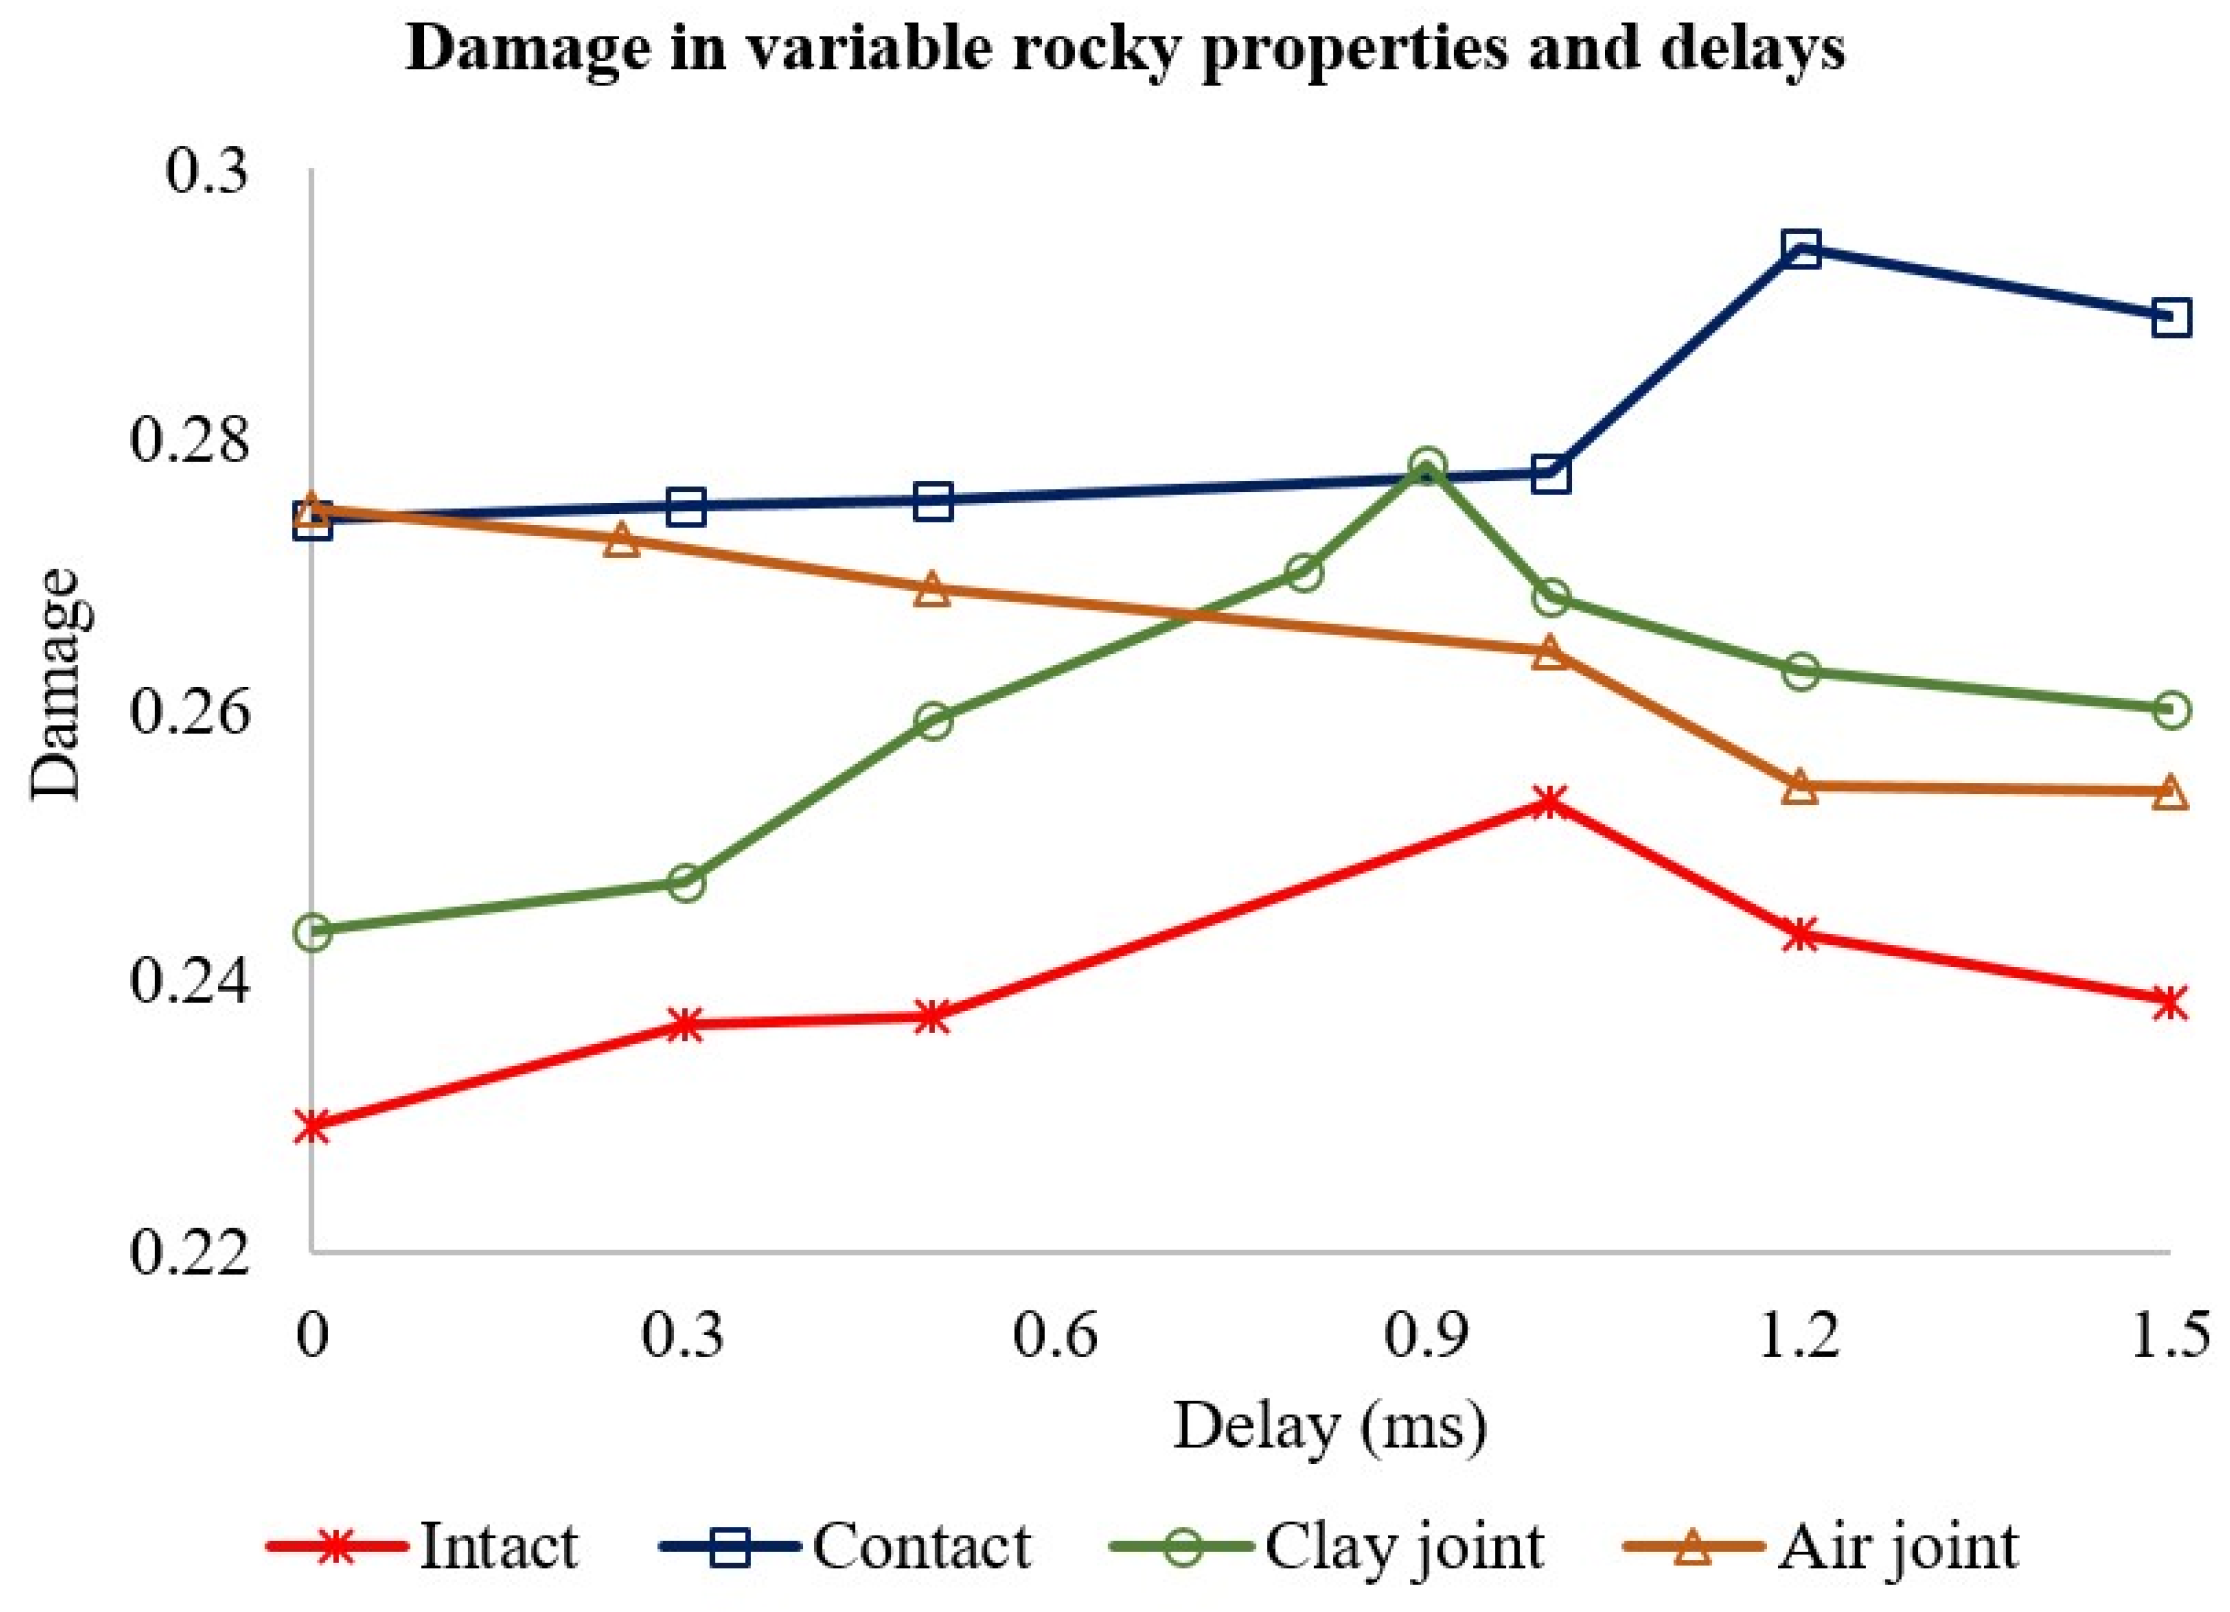
Section 3 covered the analysis of the stress wave interaction between blastholes on various rock masses. The analysis covered the intact rock, the contact between soft and hard rock, and the hard rock with a joint between blastholes clay-filled in one scenario and empty in the other. It has been observed that the interaction between blastholes is a significant factor in the development and distribution of fractures from blasting. Various rock properties influence the interaction differently, so the decision on initiation delays is critical to achieving good fragmentation.
Figure 19 summarizes the analysis.
Fracturing can be increased by 10% on the intact rock by using a delay between adjacent charge initiations; the firing direction does not have an influence. The delay should ensure fractures around the first hole are formed with minimum interference on detonation and fracturing of the succeeding hole. Shorter delays increase destructive stress wave interference between the blastholes, causing less fracturing. Longer delays hinder fracture development around the succeeding hole.
The same concept applies to the other rock properties. Firing direction from hard rock to soft rock increases confinement on the soft rock, hence less fracturing regardless of the delay. Firing soft rock first increases fracturing by 7% with the optimum delay, which in this case is 1.2 ms, slightly higher than 1 ms for the intact hard rock. Additional delay is explained by the fact that the wave travels slower in the soft rock than in hard rock, in addition to disruption at the interface. Overall damage is higher than that of a hard rock due to the application of a higher-strength explosive on a softer rock.
When a clay-filled joint is cutting across two blastholes, a good fracturing is achieved by first firing the blasthole closer to the structure. Allowing enough delay for the fractures to form around the blasthole and across the joint, and the attenuations from the interaction of stress waves with the joint lower the disruption of fractures formation around the succeeding blasthole. The optimum delay is slightly less than the intact rock (0.9 ms) since some energy is reflected at the joint, minimizing destructive interaction with the succeeding blasthole. Overall damage increases compared to intact rock from the interaction of the stress wave with the joint’s interface similar to the observations made by Dotto and Pourrahimian [
15].
When the joint is empty, the blastholes act as independent charges with little to no interaction. The joint acts as a free face from which most or all of the energy reflects. Sequential initiation does not improve fracturing, making simultaneous initiation a favourable option. Firing the further hole first at a very small delay might slightly improve the fracturing.
5. Conclusions
In this study, the effect of initiation delay on fracturing for various rock mass properties is conducted using numerical simulation. The 3D and 2D models were used in this case. 3D models offer a better insight into damage distribution 3D set up like a bench. A 2D model is a simplified computation that is favourable for damage distribution analysis in a plane of choice. From the comparison between the models, the extent and distribution of fractures for the two models are more or less the same. Fracture intensity is higher in a 2D setup. 2D models are, for that reason, helpful in studying the pattern and extent of fractures, but they can overestimate the damage.
The analysis demonstrates that the overall fragmentation can be improved by applying a proper initiation delay between adjacent blastholes. An optimum delay allows enough time for fractures to form on the preceding blasthole before firing the succeeding and the stress wave to attenuate, hence less interference with the detonation and formation of fractures on the subsequent. With a suitable delay, the wave pulse can be enhanced through constructive interaction between stress waves from the adjacent holes, and so the fracturing.
While in the intact rock, blasting firing direction is not significant, it is vital when dealing with a varying rock mass. With appropriate delay when blasting through contact of soft and hard rock, fragmentation improves when firing from soft to hard rock. The opposite increases confinement on the soft rock in addition to stress wave interaction, halting fracturing significantly. The delay can be slightly higher than in the intact hard rock blasting due to a lower stress wave speed on the soft rock. This means that when blasting the intact soft rock, the timing can be higher depending on the distance between the blastholes and the stress attenuation factor.
Depending on the type and properties of the joints’ infill material, fracturing can be improved by initiation delay and firing direction. For the clay-filled joint, fracturing is enhanced by first firing the charge closer to the joint. With the appropriate delay, the fractures form around the first charge and across the joint before the preceding blasthole is fired, thus allowing less interaction in the detonation and fracturing of the subsequent blasthole. The timing is slightly lower than the intact hard rock since the stress wave attenuates through the joint, causing less interaction between adjacent blastholes.
Initiation delay does not improve fragmentation when blasting adjacent blastholes separated by an empty joint. The joint acts as a free face from which most or all energy from the stress wave is reflected. In this study, an insignificant improvement was observed on a narrower joint when firing the further blasthole from the joint first at a very small delay.
Author Contributions
Conceptualization, Magreth Sungwa Dotto and Yashar Pourrahimian; Data curation, Magreth Sungwa Dotto; Formal analysis, Magreth Sungwa Dotto; Investigation, Magreth Sungwa Dotto; Resources, Yashar Pourrahimian; Software, Magreth Sungwa Dotto and Yashar Pourrahimian; Supervision, Yashar Pourrahimian; Validation, Magreth Sungwa Dotto; Visualization, Magreth Sungwa Dotto; Writing—original draft, Magreth Sungwa Dotto; Writing—review & editing, Yashar Pourrahimian.
Funding
This research received no external funding.
Data Availability Statement
Not Applicable.
Acknowledgments
The authors would like to thank Geita Gold Mine for allowing field access for data collection.
Conflicts of Interest
The authors declare no conflict of interest.
References
- Zhu Z, Mohanty B, Xie H. (2007). Numerical investigation of blasting-induced crack initiation and propagation in rocks. International Journal of Rock Mechanics and Mining Sciences, 44(3), 412-24. [CrossRef]
- Katsabanis PD, Tawadrous A, Braun C, Kennedy C. (2006). Timing effects on the fragmentation of small scale blocks of granodiorite. Fragblast, 10(1-2), 83-93. [CrossRef]
- Rossmanith HP. (2002). The Use of Lagrange Diagrams in Precise Initiation Blasting. Part I: Two Interacting Blastholes. Fragblast, 6(1), 104-36. [CrossRef]
- Vanbrabant F, Espinosa A. (2006). Impact of short delays sequence on fragmentation by means of electronic detonators: Theoretical concepts and field validation. Proc 8th Int Symp on Rock Fragmentation by Blasting- Fragblast, 8, 326-31.
- Yi C, Johansson D, Nyberg U, Beyglou A. (2016). Stress Wave Interaction Between Two Adjacent Blast Holes. Rock Mechanics and Rock Engineering, 49(5), 1803-12. [CrossRef]
- Yi C, Sjöberg J, Johansson D, Petropoulos N. (2017). A numerical study of the impact of short delays on rock fragmentation. International Journal of Rock Mechanics and Mining Sciences, 100, 250-4. [CrossRef]
- Johansson D, Ouchterlony F. (2013). Shock Wave Interactions in Rock Blasting: the Use of Short Delays to Improve Fragmentation in Model-Scale. Rock Mechanics and Rock Engineering, 46(1), 1-18. [CrossRef]
- Stagg MS, Rholl SA. (1987). Effects of accurate delays on fragmentation for single-row blasting in a 6.7 m (22 ft) bench. Proceedings of the Second International Symposium on Rock Fragmentation by Blasting, 210-23.
- Saadatmand Hashemi A, Katsabanis P. (2020). The Effect of Stress Wave Interaction and Delay Timing on Blast-Induced Rock Damage and Fragmentation. Rock Mechanics and Rock Engineering, 53(5), 2327-46. [CrossRef]
- Dotto M, Pourrahimian Y, Joseph T, Apel D. (2022). Assessment of blast energy usage and induced rock damage in hard rock surface mines. CIM Journal, 13(4), 166-80. [CrossRef]
- Zhang ZX. Rock Fracture and Blasting: Theory and Applications Amsterdam: Elsevier; 2016.
- Fan LF, Wang LJ, Wu ZJ. (2018). Wave transmission across linearly jointed complex rock masses. International Journal of Rock Mechanics and Mining Sciences, 112, 193-200. [CrossRef]
- Dotto MS, Apel D, Pourrahimian Y. (2024). Investigating the influence of discontinuity parameters on blast-induced fragmentation. International Journal of Mining, Reclamation and Environment, 1-25. [CrossRef]
- Wang J, Yin Y, Esmaieli K. (2018). Numerical simulations of rock blasting damage based on laboratory-scale experiments. Journal of Geophysics and Engineering, 15(6), 2399-417. [CrossRef]
- Dotto MS, Pourrahimian Y. (2024). The Influence of Explosive and Rock Mass Properties on Blast Damage in a Single-Hole Blasting. Mining, 4(1), 168-88.
- Sim Y, Cho G-C, Song K-I. (2017). Prediction of Fragmentation Zone Induced by Blasting in Rock. Rock Mechanics and Rock Engineering, 50(8), 2177-92. [CrossRef]
- Wang Z, Huang Y, Xiong F. (2019). Three-Dimensional Numerical Analysis of Blast-Induced Damage Characteristics of the Intact and Jointed Rockmass. Computers, Materials \& Continua, 60(3), 1189 -206.
- Borrvall T, Riedel W, editors. The RHT concrete model in LS-DYNA. 8th European LS-DYNA users conference; 2011; Strasbourg, Austria.
- Jiang X, Xue Y, Kong F, Gong H, Fu Y, Zhang W. (2023). Dynamic responses and damage mechanism of rock with discontinuity subjected to confining stresses and blasting loads. International Journal of Impact Engineering, 172, 104404. [CrossRef]
- Dotto MS, Pourrahimian, Y., editor The effects of rock mass properties on explosive energy in rock blasting. The Application of Computers and Operations Research in the Mineral Industry (APCOM); 2023; Rapid City, SD: Society of Mining. Metallurgy & Exploration (SME).
- Xie LX, Lu WB, Zhang QB, Jiang QH, Chen M, Zhao J. (2017). Analysis of damage mechanisms and optimization of cut blasting design under high in-situ stresses. Tunnelling and Underground Space Technology, 66, 19-33. [CrossRef]
- Livermore Software Technology Corporation L. LS-DYNA Keyword User’s Manual R11 Volume II Material Models2018 June 15, 2023; 2. Available from: https://www.dynasupport.com/manuals/ls-dyna-manuals/ls-dyna_manual_volume_ii_r11.pdf.
- Riedel W, Thoma K, Hiermaier S, Schmolinske E, editors. Penetration of Reinforced Concrete by BETA-B-500 Numerical Analysis using a New Macroscopic Concrete Model for Hydrocodes. 9th international symposiumon interaction of the effects of munitions with structures; 1999; Berlin, Germany.
- Lee EL, Hornig HC, Kury JW. Adiabatic Expansion Of High Explosive Detonation Products. United States; 1968. Contract No.: UCRL-50422.
- ORICA. (2018). Technical data sheet—Fortis Extra System—Africa.
- Hansson H. Determination of Properties for Emulsion Explosives Using Cylinder Expansion Tests and Numerical Simulation. Stockholm and Luleå, Sweden; 2009.
- Jeong H, Jeon S. (2018). Characteristic of size distribution rock chip produced by rock cutting with a pick cutter. Geomechanics and Engineering, 15. [CrossRef]
Figure 1.
Stress limit surfaces and loading scenario [
18].
Figure 1.
Stress limit surfaces and loading scenario [
18].
Figure 2.
Full-scale simulation model.
Figure 2.
Full-scale simulation model.
Figure 3.
Damage distribution in a bench.
Figure 3.
Damage distribution in a bench.
Figure 4.
Stress distribution comparison between full bench and 2D model.
Figure 4.
Stress distribution comparison between full bench and 2D model.
Figure 5.
Damage intensity comparison between full bench and 2D model.
Figure 5.
Damage intensity comparison between full bench and 2D model.
Figure 6.
Damage intensity with delay in the intact rock.
Figure 6.
Damage intensity with delay in the intact rock.
Figure 7.
Velocity vector for various delays.
Figure 7.
Velocity vector for various delays.
Figure 8.
Stress curves mid burden.
Figure 8.
Stress curves mid burden.
Figure 9.
Stress around blastholes for various delays.
Figure 9.
Stress around blastholes for various delays.
Figure 10.
Stress and damage curves for intact rock.
Figure 10.
Stress and damage curves for intact rock.
Figure 11.
Rock contacts model.
Figure 11.
Rock contacts model.
Figure 12.
Stress wave across the contacts.
Figure 12.
Stress wave across the contacts.
Figure 13.
Case A—Damage distribution firing hard rock first.
Figure 13.
Case A—Damage distribution firing hard rock first.
Figure 14.
Case B—Damage distribution when firing soft rock first.
Figure 14.
Case B—Damage distribution when firing soft rock first.
Figure 15.
Case C—Damage distribution when firing soft rock first with a longer interface.
Figure 15.
Case C—Damage distribution when firing soft rock first with a longer interface.
Figure 16.
Damage across the joint for various delays.
Figure 16.
Damage across the joint for various delays.
Figure 17.
Damage and stress plots for stress interaction across the joint.
Figure 17.
Damage and stress plots for stress interaction across the joint.
Figure 18.
Damage distribution across an empty joint.
Figure 18.
Damage distribution across an empty joint.
Figure 19.
Analysis summary.
Figure 19.
Analysis summary.
Table 1.
Mechanical properties of BIF rock.
Table 1.
Mechanical properties of BIF rock.
| Rock property (units) |
Density (g/cm3) |
UCS (MPa) |
Tensile strength (MPa) |
Young Modulus
(GPa)
|
Poisson ratio |
| Value |
2,680 |
126.02 |
14 |
90.8 |
0.24 |
Table 2.
Explosive properties.
Table 2.
Explosive properties.
| Explosive property (units) |
Density (g/cm3) |
Minimum diameter (mm) |
VOD (km/s) |
Bulk energy (MJ/kg) |
| Value |
1.10–1.25 |
64 |
4.1–6.7 |
3.47–4.35 |
Table 3.
Parameters of JWL equation.
Table 3.
Parameters of JWL equation.
| Explosive Type |
Density (kg/m3) |
VOD(m/s)
|
Pcj
(GPa)
|
A
(GPa)
|
B
(GPa)
|
R1 |
R2 |
ꞷ |
Eo(kJ/cm3)
|
vo |
| E682 |
1,207 |
4,789 |
6.926 |
276.2 |
8.44 |
5.2 |
2.1 |
0.5 |
3.87 |
0 |
Table 4.
Sandstone physical and mechanical properties.
Table 4.
Sandstone physical and mechanical properties.
| Density (kg/m3) |
UCS (MPa) |
Tensile strength (MPa) |
Young modulus
(GPa)
|
Poisson ratio |
P-wave velocity
(m/s)
|
| 2400 |
88 |
0.1xUCS |
25 |
0.3 |
2,589 |
Table 5.
Clay infill properties.
Table 5.
Clay infill properties.
| Density (kg/m3) |
Young’s modulus (GPa) |
Poisson’s ratio |
Yield stress, (MPa) |
Tangent Modulus, (GPa) |
Hardening parameter |
Failure strain, FS |
| 1,160 |
5 |
0.35 |
0.4 |
4 |
0 |
0.5 |
Table 6.
Air properties.
| Density (kg/m3) |
C4 |
C5 |
C6 |
Eo (MPa) |
Vo |
| 1.29 |
0.4 |
0.4 |
0 |
0.5 |
1 |
|
Disclaimer/Publisher’s Note: The statements, opinions and data contained in all publications are solely those of the individual author(s) and contributor(s) and not of MDPI and/or the editor(s). MDPI and/or the editor(s) disclaim responsibility for any injury to people or property resulting from any ideas, methods, instructions or products referred to in the content. |
© 2025 by the authors. Licensee MDPI, Basel, Switzerland. This article is an open access article distributed under the terms and conditions of the Creative Commons Attribution (CC BY) license (http://creativecommons.org/licenses/by/4.0/).