
Submitted:
02 January 2025
Posted:
03 January 2025
You are already at the latest version
Abstract
Cotton is the most important natural fiber crop in the world. Cotton fiber cells are not only the major economic product of cotton, but also an ideal material for studying the growth and development of plant cell. The fiber cell elongation and secondary cell wall development of short and thick fiber mutant ligon lintless-1 (li-1) are severely impaired. However, its mechanism is still unclear. Boosting evidence showed that sphingolipids and sterols play important roles in the growth and development of fiber cell. But it is unknown that the changes of these lipids are in the li-1 fiber cells. In the study, we detected the lipid profiles of 10-DPA and 20-DPA fiber cells of wild type (TM-1), and 10-DPA fiber cells of li-1 mutant by untargeted and targeted lipidomics. In the result, seven lipid classes, 33 lipid sub-classes, and 793 lipid molecular species were detected by untargeted lipidomics. Nine sphingolipid species and seven sterols were detected by targeted lipidomics. The PA, PC, PE, PI, CER, CerG1, DG, TG, and AGlcSiE enriched in fiber cells. 23 lipid sub-classes and 82 lipid molecular species were altered significantly between 10-DPA and 20-DPA fiber cells. Compared with 10-DPA fibers, the lipid intensity of 16 sub-classes and 56 lipid molecular species decreased while 7 lipid sub-classes and 26 lipid molecular species increased in the fibers at stage of SCW deposition (20-DPA). Similarly, obvious difference was detected between li-1 and TM-1 fibers. Compared with TM-1, 20 lipid sub-classes and 60 lipid molecular species increased significantly, only five lipid sub-classes and eight lipid molecular species decreased in li-1 mutant. It is surprising that the sitosterol ester increased by 59.56 fold in li-1 fibers. Detailed sphingolipid and sterol profiles indicated all molecular species of S1P, PhytoCer-OHFA, and GluCer increased while all molecular species of Sph, PhytoSph, and GIPC decreased in li-1 fibers. The mutant fiber cells showed a significantly increase in campesteryl ester, sitosteryl ester, and total steryl ester, with 21.8, 48.7, and 45.5 fold increases, respectively. Moreover, transcriptome analysis indicated that the different expression genes between TM-1 and li-1 fibers enriched in the pathway of fatty acid elongation and degradation, glycosphingolipid biosynthesis, glycerophospholipid metabolism, and brassinosteroid biosynthesis. Furthermore, the number of oil body also increased in li-1 leaf and fiber cell when compared with wild type. These results illuminated that fiber cell elongation was blocked in the li-1 mutant was not due to a lack of lipids, but rather lipid over-accumulation (obesity), which may result from the disruption of sphingolipid and sterol metabolism. This study provides a new perspective for further studying the regulatory mechanisms of fiber development.
Keywords:
cotton fiber elongation
; lipid
; sphingolipid
; sterol
; ligon lintless-1 (li-1)
; oil body
1. Introduction
Cotton fiber cells are one of the longest plant cells. Their growth and development includes four stages, fiber cell initiation, elongation, secondary cell wall (SCW) deposition, and mature dehydration [1]. Fiber cells are not only the major economic product of cotton, but also an ideal material for studying plant cell development. The stages of elongation and SCW deposition are the two main stages of fiber cell growth, which last for a long time and are key stages determining fiber quality (length, strength, and fineness). Therefore, they are the focus of study on cotton fiber cell development [1,2,3]. Based on the publication of the cotton genome sequence, significant progress has been made in the study of cotton fiber development [2,3,4,5]. However, the regulatory mechanisms of fiber cell development still need further exploration.
Cotton fiber mutant is a powerful resource to study the regulatory mechanism of fiber cell development owing to the morphological and biochemical variances in their fiber cells. The fiber cells of ligon-lintless 1 (li-1) are very short (about 6 mm in length), and there is no significant difference from fuzz fibers [6]. The fiber initiation and early elongation of li-1 was similar to that of its wild-type TM-1 (Texas marker-1). At 7 DPA (Days Post Anthesis), the fiber elongation was inhibited and stopped completely at 14 DPA. During 7-14 DPA, the fiber elongation rate of li-1 mutant was much lower than that of wild type in the same period [6,7,8].
Lipids are essential components of all plant cells, not only as the main component of cell membranes, but also as an important energy source and quality indicator [9,10]. They are involved in the regulation of various life processes, such as transport, signaling, energy conversion, cell development and differentiation, and apoptosis [11]. In plants, fatty acid signaling plays a crucial role in defense and development. These studies are of great significance to basic biology and agriculture. Both rapid elongation and SCW deposition, lipid synthesis is required for cotton fiber cell development [12]. Previous studies reported that the transcript of genes involved in lipid synthesis such as fatty acid desaturase, acyl carrier protein, glycerol-3-phosphate acyltransferase, acyltransferase, lipid transfer proteins, and elongase are significantly enriched in fibers [12,13,14,15,16,17,18,19]. Furthermore, a few studies have been conducted by metabolomics. Glycerides was detected in fibers and showed that polar lipids phosphatidylglycerol (PC, PE, PI, PA), monogalactosyldiacylglycerol (MGDG), and digalactosyldiacylglycerol (DGDG) had the highest content in elongation fibers (7-10 DPA) [20]. Six glycerophospholipids (GPLs) was detected in the wild-type fast elongation fibers and ovules, as well as the lintless-fuzzless mutant ovules by targeted lipidomics. Phosphatidylinositol (PI) (containing linolenic acid group) was significantly accumulated in the elongating fibers, indicating the PI play a role in the elongation of fibers [12]. The content of saturated VLCFA in elongating fibers is significantly higher than that in ovules and lintless-fuzzless mutant ovules. The exogenous application of ACE, a fatty acid synthesis inhibitor inhibited fiber elongation, while VLCFA promoted fiber elongation by induced ethylene synthesis [17]. By analyzing the differences of metabonomics between the elongation stage and the secondary wall synthesis stage of fibers, the result showed that the lipid metabolism was active in fiber elongation stage [16]. These studies indicated that lipid metabolism plays important roles in the elongation and secondary wall synthesis of fibers.
Sphingolipids are complex lipids which consists of three main components, the long chain fatty acids (LCFA) or the very long chain fatty acids (VLCFA), the long chain base (LCB) of sphingosine, and the polar head group [21,22,23]. Recently, a few documents revealed sphingolipid was essential for fiber growth and development. The exogenous application of FB1 (Fumonisin B1), a sphingolipid synthesis inhibitor, strongly inhibited fiber elongation and altered the activity of lipid raft activity in fiber cell [24,25,26]. One kind of phytoceramide molecules containing hydroxylated and saturated VLCFA is important for fiber cell elongation [27]. The contents of all GluCer and GIPC molecular species were decreased in 0-DPA ovules of Xuzhou142 lintless-fuzzless mutants and Xinxiangxiaoji lintless-fuzzless mutants when compared with the wild-type Xuzhou142 [28]. Overexpressing GhCS1, a ceramide synthase gene inhibited fiber cell initiation and elongation [29]. Since VLCFA is a composition of sphingolipid molecule, down-regulating GhKCRL1, a gene involved in VLCFA biosynthesis pathway blocked sphingolipid synthesis and suppressed fiber cell elongation [30]. Regulating the GhLCBK1, a sphingosine kinase in cotton, could regulate fiber elongation and SCW deposition through affecting sphingosine-1-phophate and auxin synthesis [31]. These reports indicated that sphingolipid play important roles in fiber cell development. However, the sphingolipid profile in the short fibers of li-1 mutant is unknown.
High-throughput lipid mass spectrometry is used to track metabolic changes and rapidly analyze the changes of individual lipid molecules in wild-type and mutant as well as various developmental stages. The untargeted lipidomics model can realize systematic analysis of various types of lipids in the sample without bias. In this study, we analyzed the lipidomics in the fast elongation stage and secondary wall synthesis stage of fibers, as well as in the li-1 untargeted lipidomics assay. Furthermore, given the sphingolipid and steryl ester were altered strikingly in li-1, we further detected the sphingolipid and sterol profile by targeted lipidomics. Two novel results were found in our study. The content of most lipid species and lipid molecule species were higher rather than lipid deficient in li-1 short fibers when compared with wild type fibers. The steryl ester content was elevated greatly in li-1 mutant fibers. It is suggested that the disruption of lipid metabolism, transport, signaling and distribution might be a major cause suppressing fiber elongation in li-1 mutant, which provides a new clue for understanding the regulatory mechanism of fiber growth and development.
2. Results
2.1. Untargeted Lipidomics Analysis in Fiber Cells
To identify the lipid differences in cotton fiber cells at rapid elongation stage and secondary wall synthesis stage, as well as the lipid differences in fibers of li-1 mutant, the OPLS-DA (Orthogonal Partial Least Squares Discriminant Analysis) model was used. Both R2Y and Q2 are the evaluation parameters of the model. As shown in the score plot (Figure 1A and B), there were six scores of each group and two groups were clearly separated. In the model, R2Y=0.994 and Q2=0.980 in the group of 10-DPA fiber and 20-DPA fiber of wild type, and R2Y=0.949 and Q2=0.870 in the group of 10-DPA fiber of li-1 mutant and 10-DPA fiber of wild type, indicating that the quality of the OPLS-DA model was excellent to screen the key lipids between two samples.
Seven lipid classes (glycospholipids, sphingolipids, glycolipids, sterol esters, prenol lipids, fatty acyls, and Saccharolipids) were identified in fiber cells including 33 lipid sub-classes and 793 lipid molecular species (Figure 1C). Sphingolipids comprised seven lipid sub-classes and 197 lipid molecule species (129 ceramides, three phosphoceramides, six sphingosine, one phytosphingosine, one sphingomyelin, 54 Glucosylceramides and three disaccharide ceramides). Glycerophospholipids included 11 lipid sub-classes and 313 lipid molecule species, the number of molecular species in each sub-class was 10 CL, 1 LPA, 16 LPC, 15 LPE, 1 LPI, 80 PA, 66 PC, 48 PE, 23 PG, 41 PI, and 12 PS. Glycerolipids had three lipid sub-classes: MG, DG, and TG, the number of molecular species was 1, 73, and 128, respectively. Three lipid sub-classes of fatty acyls were detected such as FA, OAHFA, and WE, the number of molecular species was 4, 1, and 3, respectively. Five lipid sub-classes of saccharolipids: DGDG, DGMG, MGDG, SQDG, and MGMG were detected, the number of molecular species was 23, 1, 15, 7, and 2, respectively. Sterol esters included three lipid sub-classes: AGlcSiE, SiE, and StE, the number of molecular species was 17, 2, and 1, respectively. One lipid class Co (comprised 5 lipid molecular species) was detected in fiber cells (Figure 1C). In 10-DPA fiber cells, the lipid sub-classes: PA, PC, PE, PI, Cer, CerG1, DG, TG, and AGlcSiE possessed higher lipid intensity while the lipid sub-classes: LPI, Mg, DGMG, MGMG, and StE had lower lipid intensity (Figure 2). The results indicated that glycerophspholipid, glycerolipid, and sphingolipid are predominant lipids and contained more kinds of lipid molecule species in fiber cell.
2.2. The Lipid Difference Between the Stage of Rapid Elongation and SCW Deposition of Fiber Cells
The rapid elongation period of fiber cell is around 10 DPA. After 15 DPA, the SCW of fiber begins to synthesize and a large amount of cellulose is deposited, while the cell elongation stops gradually. Around 20 DPA, fiber cell ceased elongation completely. In order to reveal the lipid difference in various developmental stages of fiber, we analyzed the lipid difference between 10-DPA fiber and 20-DPA fiber from TM-1. The results as showed in (Figure 3A), Compared with 10-DPA fibers, 13 lipid sub-classes increased and 20 lipid sub-classes decreased in 20-DPA fibers. By statistical analysis, 23 lipid classes changed significantly (P < 0.05). Among them, the seven lipid sub-classes increased such as MGMG, SiE, MG, and so on. While 16 lipid sub-classes decreased and the top five lipid sub-classes with the decrease mostly were So, TG, LPC, PG, CerG2. The results indicated that the lipid intensity of various lipid classes significantly changed between the rapid elongation and SCW synthesis stages, and the lipids major enriched in rapid elongation fiber cell.
Detailed lipid profile was further analyzed. Compared with 10-DPA fibers, 82 lipid molecule species significantly changed in 20-DPA fibers (VIP > 1 and P < 0.05). Among them, the lipid intensity of 26 lipid molecule species increased and 56 lipid molecule species decreased (Figure 3B and Figure S1). The top five lipid molecule species with the largest increase in lipid intensity were PA (15:0 / 18:3), TG (38:2), cerg1 (d32:3), CER (d18:0 / 23:0), and CER (d18:0 / 25:0), and their increase folds were 22.54, 13.92, 10.63, 6.87, and 6.72, respectively. The top five lipid molecule species with the largest decrease folds were TG (20:1 / 18:2 / 18:3), TG (19:1 / 18:3 / 18:4), TG (18:3 / 18:3), TG (19:1 / 18:2 / 18:3), TG (16:1 / 18:3 / 18:3) decreased by 34.48, 32.26, 22.73, 16.67 and 15.15 fold, respectively (Figure 3B). The lipid molecule species with significant change in lipid intensity mainly belonged to glycerophspholipid (57%), glycerolipid (27%), and sphingolipid (12%), and mainly involved in the lipid sub-classes of PA (22%), TG (21%), PC (15%), and PE (11%) (Figure 3C and D). The results indicated that most lipid molecule species of GP, GL, and SP strikingly enriched in rapid elongation stage, and a few lipid molecule species enriched at the stage of SCW deposition, which might play some roles in SCW formation.
2.3. The Lipid Change of Fiber Cell of li-1 Mutant
The li-1 mutant is a super short fiber mutant with less than 6 mm length fibers, which is an ideal model for studying fiber development [7]. To explore the role of lipids in cotton fiber elongation, we identified the lipid changes between li-1 mutant and its wild-type (TM-1) in 10-DPA fiber. As showed in (Figure 4A), compared with 10-DPA fibers of TM-1, 23 lipid sub-classes increased and 10 lipid sub-classes decreased li-1 mutant, and 25 of 33 lipid sub-classes changed significantly (p<0.05). Among them, 20 lipid sub-classes increased and the top five lipid sub-classes (fold change) with the largest increase were SiE (64.37), StE (3.99), TG (2.46), OAHFA (2.06), and CL (1.94), while only five lipid sub-classes decreased and the top five with the largest decrease were SM (3.13), FA (1.85), CerG2 (1.67), LPE (1.64), and LPC (1.37). The results indicated that the lipid intensity of most lipid classes increased significantly in 10-DPA fiber cell of li-1 mutant compared with 10-DPA fiber cells of wild type.
Compared with 10-DPA fibers of TM-1, the lipid intensity of 68 lipid molecule species changed significantly in 10-DPA fibers of mutant (VIP > 1 and P < 0.05). Among them, 60 lipid molecule species increased and eight decreased (Figure 4B and Figure S2). The top five lipid molecule species with the largest increase were SiE(18:3), TG (18:1/18:1/18:1), TG (16:0/18:1/18:1), TG (16:0/16:0/18:1), and TG (18:0/18:1/18:3), and their increase folds were 59.56, 19.94, 19.10, 13.64, and 8.99, respectively. The top five lipid molecule species with the largest decrease folds were PLE (18:3), PLC (16:0), PLC (18:3), CerG1 (d18:2/18:0), and CerG2 (d34:4), and their decreased folds were 3.04, 2.64, 2.57, 2.42, and 1.73 fold, respectively (Figure 4B). The lipid molecule species with significant change in lipid intensity mainly belonged to glycerolipid (43%) and glycerophspholipid (35%), and mainly involved in the lipid sub-classes of TG (38%) and PA (15%) (Figure 4C and D). The results indicated that most lipid molecule species of TG and GP enriched strikingly in 10-DPA fiber of li-1 mutant. Interestingly, the lipid molecule species of SiE (18:3) increased by 59.56 fold, indicating it may be a key factor contributed for short fiber.
2.4. The Changes of Sphingolipids in li-1 Mutant Fiber Cells
The results of the untargeted lipidomics showed significant changes in sphingolipids in mutant fiber cells compared with it wildtype fibers. To further illuminate the detailed changes in sphingolipid composition and content, we detected the sphingolipid profile of 10-DPA fiber cells from li-1 mutant and TM-1 by means of UHPLC–MS/MS. The results showed that 6 sub-classes of sphingolipids and 69 molecular species of sphingolipids were detected (Figure 5A), including sphingosines (Sph), sphingosine-1-phosphate (S1P), ceramides (Cer), phytoceramides (PhytoCer), glucosylceramides (GluCer), and glycosyl-inositol-phospho-ceramides (GIPC), the number of molecular species was 4, 2, 14, 31, 13, and 5 for each class, respectively. Compared with the wild type, the content of Sph (PhytoSph and Sph) and GIPC classes decreased. While PhytoCer-OHFA, GluCer, and Phyto-GluCer increased (Figure 5B). Further analysis revealed that the content of all molecular species of sphingosine and GIPC decreased (Figure 5C, F, and Fig. S4). On the contrary, the content of all molecular species of GluCer (Phyto-GluCer and GluCer) and PhytoCer OHFA increased (Figure 5G, H and Fig. S4). These results indicated that the sphingolipid profile was significant altered in li-1 fiber. It is suggested that GIPC synthesis was impaired which resulted in all GIPCs decrease and all GluCer, Cers increase.
2.5. The Changes of Phytosterols in li-1 Mutant Fiber Cells
In the untargeted lipidomics analysis, the content of sitosteryl ester (SiE) was 59.56 times higher in li-1 mutant fibers than in TM-1 fibers, indicating a striking change of steryl ester was occurred in mutant fiber cells. To further detail the changes of phytosterols in mutant, we detected the phytosterol profile both in li-1 and TM-1 10-DPA fibers. Five sterols (cholesterol, sitosterol, campesterol, stigmasterol, and stigmastanol) and two steryl esters were detected in 10-DPA fiber cells (Figure 6A). Compared with the wild type, total sterol and all sub-classes of sterols were increased in mutant fibers. Among which, the cholesterol, sitosterol, and stigmastanol were increased by 85%, 36%, and 31%, respectively (Figure 6A). Meanwhile, compared to the wild-type, the mutant fiber cells showed a striking increase in campesteryl ester, sitosteryl ester, and total steryl ester, with 21.8, 48.7, and 45.5 fold increases, respectively (Figure 6B). Given the proportion between sitosterol, campesterol, and stigmasterol is important for sterol function in the plant development (Valitova et al., 2016), we analysis the ratio of campesterol to sitosterol (C/S), and stigmasterol to sitosterol (St/Si). The result showed that the ratios of C/S and St/Si were declined in the fiber of li-1 mutant (Figure 6C), which might result from the content of sitosterol increased greatly in li-1 fiber cells. These results indicated that the contents of sterol and steryl ester were altered dramatically in li-1 mutant fiber cells.
2.6. The Expression of Genes Involved in Lipid Metabolism Was Altered in li-1 Fiber Cells
To clarify the metabolic pathways and key genes that undergo significant changes in the mutant short fiber cells, we analyzed the transcriptome of the 10-DPA fiber cells of the li-1 mutant and its wild-type TM-1. The results showed that significant changes in the expression of 8180 genes in the li-1 mutant 10-DPA fibers, with 5600 genes upregulated and 3580 genes downregulated (Fig. S5). The results of GO annotations analysis indicated that the differentially expressed genes enriched in biological process (catalytic activity and binding), cellular component (membrane part and membrane), and molecular function (cellular process and metabolic process) (Figure 7). The results of KEGG enrichment analysis revealed that the differentially expressed genes enriched in lipid metabolism pathways, including fatty acid association and degradation, Glycerolipid and Glycerophospholipid metabolism, Glycosphingolipid biosynthesis, and Brassinosteroid biosynthesis, seven out of the top 20 metabolic pathways (Figure 7). These results illuminated that lipid metabolism was disrupted in li-1 mutant fiber cell compared with TM-1.
2.7. The Expression Levels of Key Genes in Lipid Metabolism Were Elevated in li-1 Fiber Cells
To confirm the expression change of genes involved in lipid metabolism, we detected the expression levels of selected genes in li-1 and TM-1 fibers by RT-qPCR. Gh_D12G0217 (LAG1 longevity assurance homolog 2), Gh_A07G0513 (LAG1 longevity assurance homolog 3), and Gh_D10G0211 (Lactosylceramide 4-alpha-galactosyltransferase were involved in sphingolipid biosynthesis and down-regulated in li-1 mutant [29,32]. Gh_A08G1600 and Gh_A06G0144 encoded phospholipase D beta 1 and phospholipase A 2A, respectively. They are play a role in phospholipid metabolism and up-regulated in li-1 fiber cells. Gh_A02G0884 (GDSL-domain protein) and Gh_D06G2376 (3-ketoacyl-CoA synthase 19) decreased in li-1 mutant. Gh_D03G1074 and Gh_A05G3810 encoded two HXXXD-type acyl-transferase family proteins increased in li-1 mutant. Gh_A01G1605 (alcohol dehydrogenase 1) might function in fatty acid degradation and strikingly increased in li-1 mutant (Figure 8). The result indicated the expression levels of genes involved in lipid biosynthesis and degradation were changed greatly, suggesting that the lipid metabolism was disrupted in li-1 mutant fiber cells.
2.8. The Number of Oil Body Was Increased in li-1 Leaf and Fiber Cell
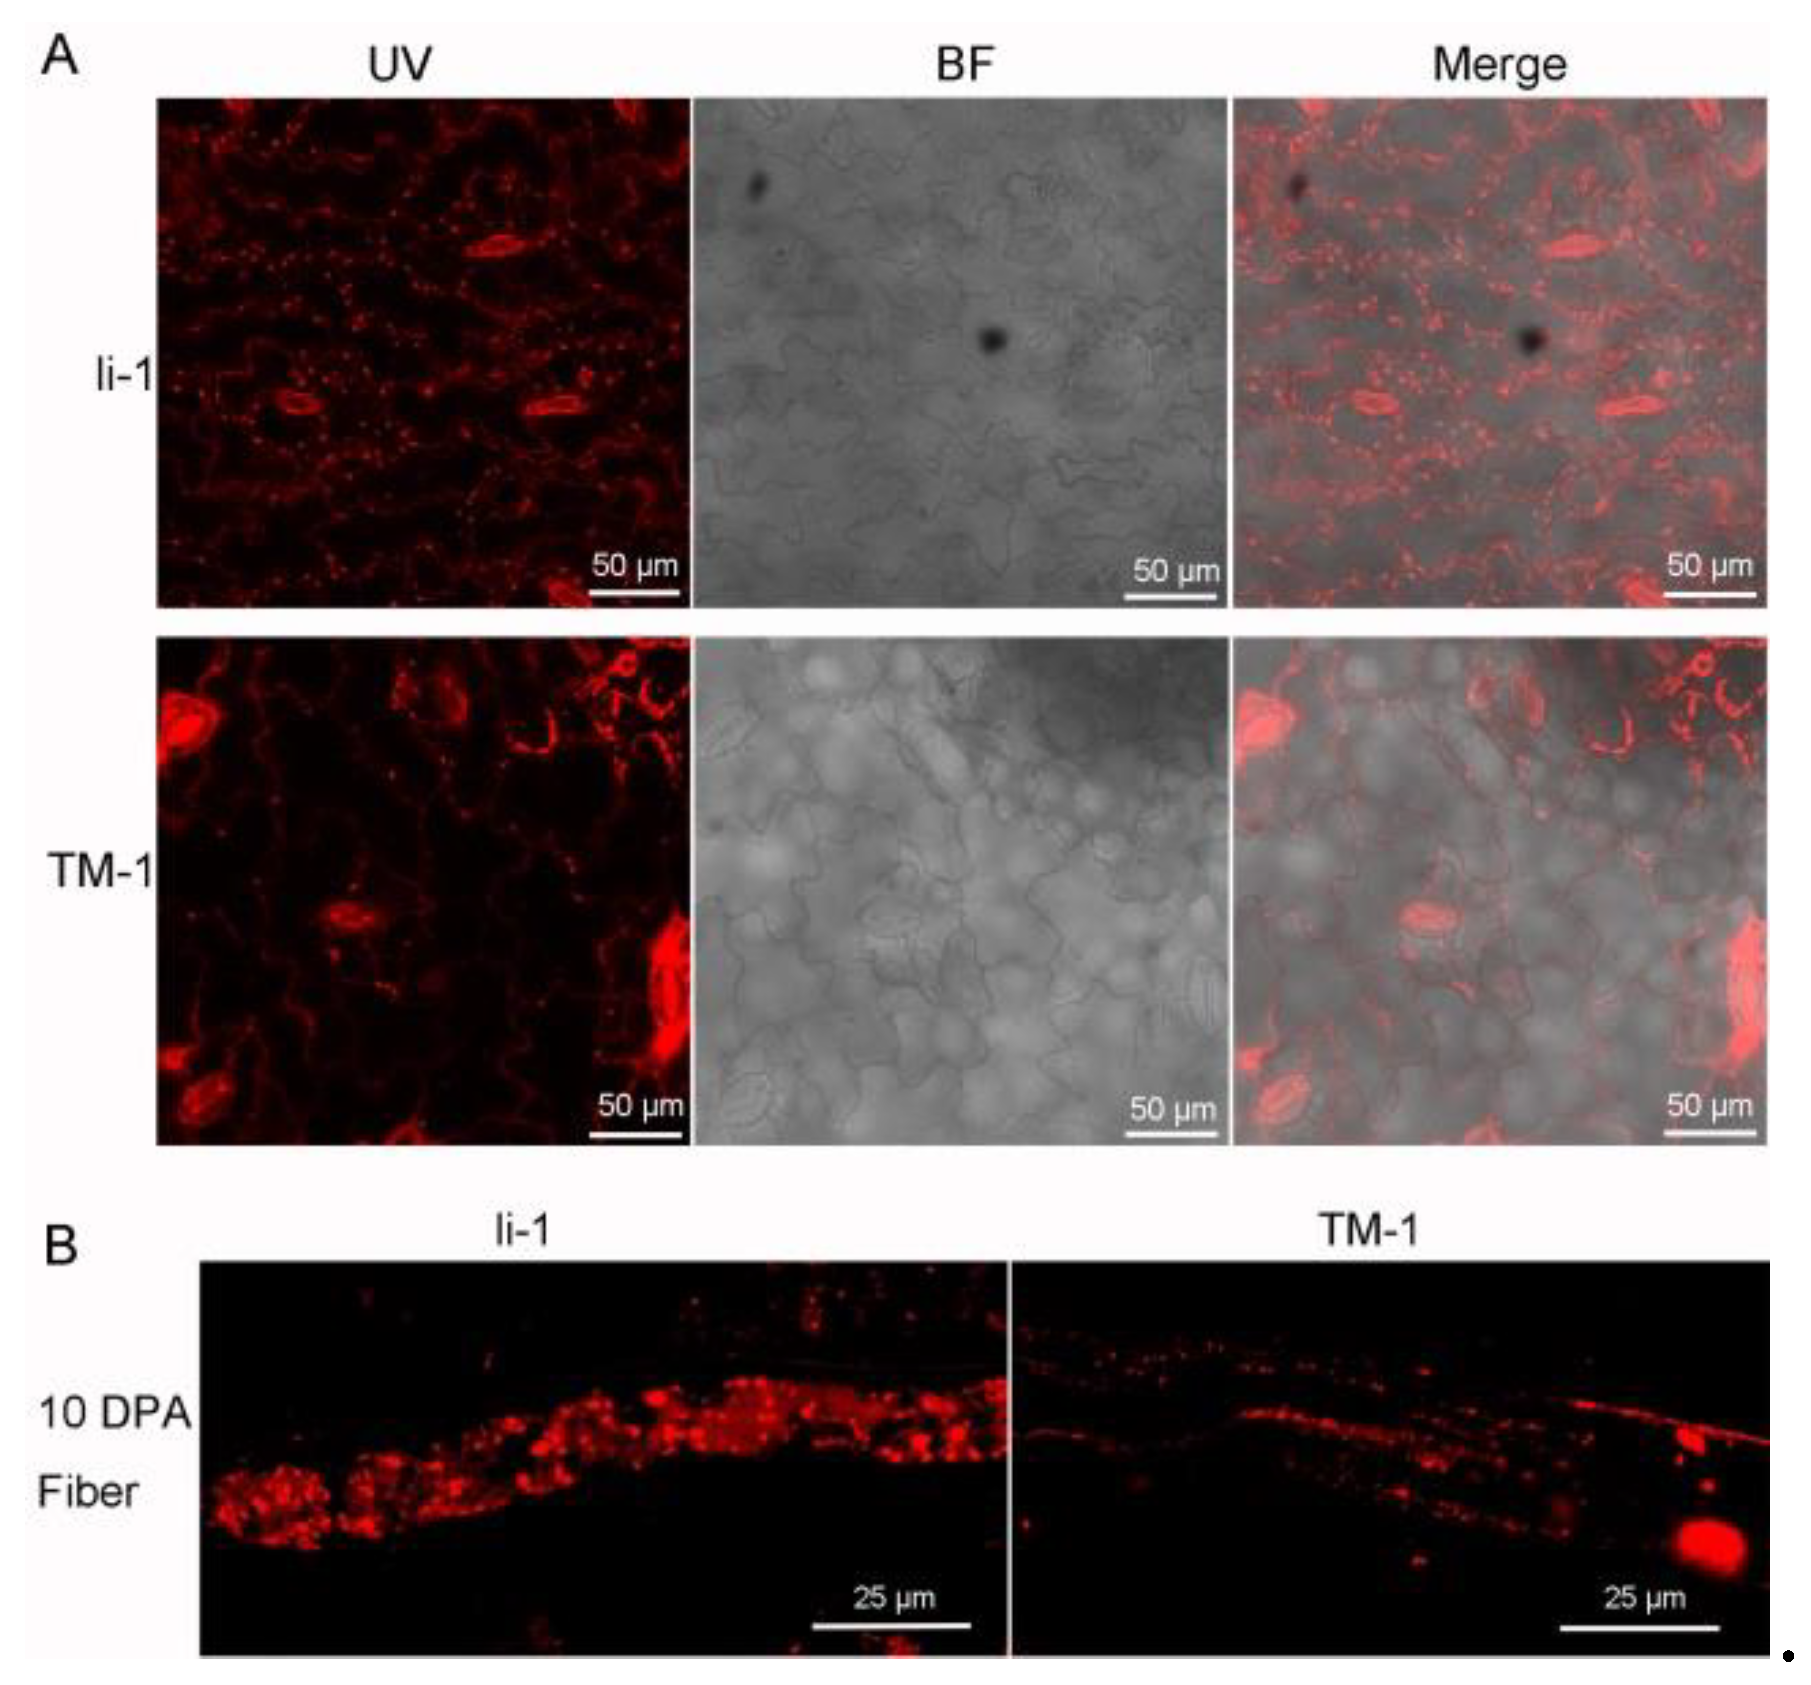
As mentioned earlier, the content of triglycerides (TG) and steryl esters is far higher in li-1 fibers than in TM-1 fibers. Given that the hydrophobic core of oil body (lipid droplet) is mainly composed of TG and steryl esters [33,34], we further detected the distribution and quantity of oil bodies in mutant leaves and fiber cells by Nile red staining. The results showed that only few and small oil bodies present in TM-1 leaves and fiber cells while a great number of oil bodies in present li-1 leaves and fiber cells (Figure 9). This result further confirmed that lipid metabolism was disrupted in the li-1 mutant.
3. Discussion
3.1. The Role of Lipids in Fiber Elongation and SCW Deposition
During the fast elongation period, the cell size and membrane area expand rapidly, and various metabolic activities need to be increased accordingly. This process requires a lot of lipids [2,17,24]. At the stage of SCW deposition, cell expansion stopped and cellulose synthesis, transportation and deposition proceeded steadily. The cellulose synthase complex is located in the plasma membrane. The lipid composition and membrane features at this stage are conducive to the synthesis and organization of cellulose [3]. In this study, we analyzed the difference of lipid groups between the fast elongation stage and the SCW formation stage of fibers. Most of the lipid components (16/23 lipid sub-classes and 56/82 lipid molecular species) were higher in elongating fibers, and only a few lipid components (7/23 lipid sub-classes and 26/82 lipid molecular species) were higher in SCW formation stage. Among them, glycerophospholipids (GP), sphingolipids (SP) and glycerolipids (GL) were enriched in elongated fibers, which was similar to previous studies. It was reported that the content of polar lipid such as PC, PE, PI, PA, PG was the highest lipids in elongating fibers (7-10 DPA) [20]. These results suggested that the accumulation of these lipids may be necessary for fiber elongating. The lipids of 10-DPA fiber and ovule of wild-type, and 10-DPA ovule of fuzzless-lintless mutant were detected by targeted lipidomics. The result showed that phosphatidylinositol (PI) was enriched in fiber cells and PI (34:3) was the highest lipid molecule species [12]. Consistently, in our study, the lipid intensity of PI and molecular species PI (18:3/18:3), PI (16:0/18:3) molecules was significantly higher in 10-DPA fiber cells than in 20-DPA fiber cells of TM-1. The PI intensity of 10-DPA fiber from li-1 mutant was also significantly higher than that of 10-DPA fiber from wild-type. However, the increased PI molecules were PI (16:0/18:1), PI (16:0/18:2), PI (18:2/18:2), which indicated that the PI molecules enriched in mutant 10-DPA fibers was different from that enriched in wild-type 10-DPA fibers. Phospholipase D (PLD) can hydrolyze phospholipid to phospholipid acid (PA). GhPLDα1 highly expressed in 20-DPA fiber, which may lead to the decrease of phospholipid content and the increase of PA in 20-DPA fiber [35]. Consistently, most PA enriched in 20-DPA fiber. On the other hand, phospholipid acid can promote the production of hydrogen peroxide and induce the synthesis of SCW [35]. These results indicate that phospholipids play some roles in the regulation of fiber elongation and SCW synthesis. The intensity of saccharlipid (SL), sterol ester (ST) and wax ester (WE) enriched at the stage of SCW deposition, which indicated that the enrichment of these lipid components may promote cellulose synthesis and SCW formation.
Phytosterols play important roles in the development of fiber cells [36,37,38,39]. Sterols are comprised of free sterols and conjugated sterols such as sitosterol ester (SiE), campesterol ester, stigmasterol (StE) ester, sterol glycosides (SGS) and acetyl sterol glycosides (ASGS). Conjugated sterols play a role in the dynamic balance of sterols and in the synthesis of WEs [40]. Three lipid classes of steryl esters: SiE, AGlcSiE, and StE were detected in the study. Among which, the AGlcSiE intensity is the highest in the rapid elongating fibers, and the intensity of SiE significantly increased in the stage of SCW synthesis. It was suggested that SiE might be associated with cellulose synthesis and SCW formation. Sterol glycosides and acetylsterol glycosides are enriched in elongating fibers. They may play roles in maintaining the balance between sterols and sphingolipids in fiber cell elongation [40,41]. Sterols and sphingolipids are two key components of lipid rafts, which are functional regions of membrane [42,43,44].
Sphingolipids is necessary for plant growth and development, which response to biotic stress or abiotic stress [45,46,47,48]. Sphingolipids also played a role in cotton fiber elongation. FB1 (Fumonisin B1), an inhibitor of sphingolipid synthesis, significantly inhibited fiber elongation and altered the activity of lipid raft activity in fiber cell[24,26]. In this study, CerG1, CerG2, CerG1 (d18:2/18:0), CerG1 (d18:2/18:1), CerG1 (d36:2), and CerG2 (d34:4) are enriched in the elongating fiber cells. Moreover, these molecules are closely associated to AGlcSiE lipid molecule (figure S3), which indicated that these molecules play a role in the regulation of fiber cell elongation. On the other hand, VLCFA is a component of sphingolipid molecule and plays an important role in fiber cell elongation. Application of ACE inhibited the fiber elongation while VLCFA promoted cell elongation by promoting ethylene synthesis [16,17,49]. These results indicated that there is a close relationship between sphingolipids, sterol, and membrane lipid rafts during the process of fiber elongation. The future study on these relationships may be an important aspect to reveal the regulatory mechanism in the growth and development of fibers.
3.2. The Lipid Metabolism Disruption in the li-1 Mutant Fibers
Ligon lintless-1 (li-1) is a dominant mutant of Gossypium hirsutum, which has the phenotype of damaged vegetative growth and short fiber. Although the gene identification and gene expression profile of the fiber of li-1 mutant have been studied for many years, the regulatory mechanism on the fiber growth deficiency is still unclear (Bolton et al. 2009, Gilbert et al. 2013, Liang et al. 2015). Compared with wild type, unexpectedly, most lipid classes and lipid molecule species have higher rather than lower intensity in mutant fibers (20/25 lipid species, 60/68 lipid molecular species), and only 5 lipid species and 8 lipid molecule species are lower in mutant fibers. In the fibers of li-1 mutant, the lipid classes and lipid molecule species of TG and SL were enriched. Consistently, GL and SL were enriched in the stage of SCW synthesis in wild-type fiber. The high intensity of GL and SL in li-1 fiber may promote the SCW synthesis and inhibit the fiber elongation. Sphingolipids and GPs were the major lipids in li-1 cells. LPC and PLE were enriched in 10-DPA fibers during fiber development in wild type, but decreased in li-1 fiber cells. These two GPs may play key role in fiber elongation.
FB1 is an inhibitor of ceramide synthase that is the center of sphingolipid metabolism and biology (Ternes et al. 2011, Mullen et al. 2012). The exogenous application of FB1 strongly inhibited the fiber cell growth and its fiber phenotype is similar to that of the li-1 fiber (Wang et al. 2020). FB1 treatment resulted in a decrease in total GIPC and all GIPC molecular species (Wang et al. 2020). Consistent with FB1 treatment, the total GIPC and all molecular species were reduced in the li-1 mutant fibers (Figure 5F). Furthermore, the expression levels of two genes encoding ceramide synthases Gh_D12G0217 and Gh_A07G0513 were significantly reduced (Figure 8). These results revealed that GIPC synthesis was inhibited in li-1 fibers and GIPC might play an important role in fiber cell elongation. There are 10 homologous genes encoding ceramide synthase in the upland cotton genome. In our previous studies, overexpression of GhCS1 (Gh_D07G0583) promoted the synthesis of ceramide molecules containing dihydroxy LCB and VLCFA, and inhibited the initiation and elongation of fiber cells (Li et al. 2022). Consistently, the most ceramide molecules containing dihydroxy LCB and VLCFA significantly increased in the li-1 mutant fibers (Figure 5D). Taken together, given sphingolipids are regarded as major regulators of lipid metabolism (Worgall 2007), sphingolipid balance might be an important factor for the normal growth of fiber cells.
During the fiber development, SiE was enriched in 20-DPA fiber while acetylglycosyl sterol ester and StE were enriched in 10-DPA fiber. However, the lipid intensity of three sterol esters in mutant fiber was higher than that in wild-type fiber, and the intensity of SiE molecule (SiE (18:3)) was 59.56 times of that in wild-type 10-DPA fiber. This change was further confirmed by the targeted lipidomics of phytosterols. Compared with TM-1, the content of campesteryl ester, sitosteryl ester, and total steryl ester were strikingly increased in li-1 fibers by 21.8, 48.7, and 45.5 fold, respectively (Fig6B). In plant cell, too high or too low levels of sterols will inhibit plant growth, and sterol esters play a role in regulating the level of free sterols (Shimada et al. 2019). The abnormal enrichment of sterol esters in li-1 fibers may be a reason for its elongation suppression.
Lipid droplets (LDs), also known as oil bodies or lipid bodies are the “youngest” cellular organelle and are composed of a neutral lipid core surrounded by a phospholipid monolayer draped with hundreds of different proteins (Krahmer et al. 2013, Deevska and Nikolova-Karakashian 2017, Guzha et al. 2023). Since the hydrophobic core of LDs is mainly composed of TG and steryl esters (Chapman et al. 2012, Olzmann and Carvalho 2019, Ischebeck et al. 2020), we further investigated the LDs in leaf and fiber cell. The number and size of oil bodies in li-1 mutant obviously differ from that of TM-1. More and bigger oil bodies both in leaf and fiber cell. LD biogenesis and degradation, as well as their interactions with other organelles, are tightly coupled to cellular metabolism and are critical to buffer the levels of toxic lipid species. Thus, LDs facilitate the coordination and communication between different organelles and act as vital hubs of cellular metabolism (Chapman et al. 2012, Olzmann and Carvalho 2019, Qin et al. 2023). The change on the LDs further confirmed the disruption of lipid metabolism in fiber cell of li-1. This provided a novel clue to reveal the regulatory mechanism of fiber growth and development in the future.
4. Materials and Methods
4.1. Plant Materials and Growth Conditions
Gosspium hirsutum ligon lintless-1(li-1) mutant and its wild type Texas Marker-1(TM-1) were kindly provided by the institute of Cotton Research, Chinese Academy of Agricultural Science, and were cultivated in a field with regular management. Flowers were tagged on the day of anthesis (0 DPA, days post anthesis).
4.2. RNA Extraction and qRT-PCR Assay
The total RNA of 10-DPA and 20-DPA fiber cells from TM-1 and li-1 mutant plants were extracted by using a Plant Total RNA Extraction kit (Tiangen, Beijing, China). 1.0 μg total RNA was used to synthesize cDNA using a Reverse Transcription Kit with Genomic DNA Remover (Takara, Kusatu, Japan). Quantitative real time Reverse-transcription PCR (RT-qPCR) was performed on a CFX96 Optical Reaction Module (Bio-Rad, Hercules, CA, USA) using Novostar-SYBR Supermix (Novoprotein, China) according to the manufacturer’s instructions. The primers for each gene were indicated in Supplementary Table 1. Cotton GhHISTONE3 was used as an internal control. Each analysis was repeated with three biological replicates.
4.3. Lipid Extraction and Lipidomics
The 10-DPA and 20-DPA fibers of TM-1 (wild type) and the 10-DPA fibers of li-1 mutant were isolated from ovules and frozen in liquid N2. Lipids were extracted according to MTBE (methyl tert-butyl ether) method (Welti et al. 2002). Lipid analysis was performed using a UHPLC-MS/MS system consisting of a Shimadzu Nexera UHPLC system (Shimadzu, Kyoto, Japan). Reverse phase chromatography using a CSHC18 column (1.7 μm, 2.1 mm × 100 mm, Waters) was chosen for LC separation (Wang et al. 2020). Lipid Search is a search engine for identifying lipid species using MS/MS math (Markham and Jaworski 2007).
4.4. The Nile Red Stain
Fresh fibers and leaves were placed in 2 mL EP tubes, fixed with paraformaldehyde and placed at 4°C for at least 4 h, overnight: washed twice with PBS (phosphate), dyed with 2 mL Nile red for about 1 h (tinfoil shielded from light), washed twice with PBS, and stored in PBS at 4℃ for later use.
4.5. Statistical Analysis
All investigations were done using three or six separate biological replicates. The results were presented as mean ± standard error (SE). A one-way analysis of variance was performed using SPSS 22 (IBM, New York, NY, USA) to determine significant differences. Statistical discrepancies with p-values
4.6. Bioinformatic Analysis
Refer to the RNA-seq analysis method (Zhang et al. 2015). Total RNA was extracted from the 10-DPA fiber cells of the li-1 mutant and its wild-type TM-1. They were frozen in liquid nitrogen and sent to Shanghai Meiji Biological Company for Illumina Sequencing, meiji biological cloud web site (https://cloud.majorbio.com/) in the United States sequencing analysis results. Use the DEGseq difference Different analysis software, at significance level p-adjust difference multiple ≥2, multiple test correction method BH (FDR) with Correction with Benjamini/Hochberg, Differential Expression was obtained Genes), and then functional annotation analysis and functional enrichment analysis were performed on the obtained differentially expressed genes (Xu et al. 2022).
5. Conclusions
5.1. The Role of Lipids in Fiber Elongation and SCW Deposition
During the fast elongation period, the cell size and membrane area expand rapidly, and various metabolic activities need to be increased accordingly. This process requires a lot of lipids (Qin et al. 2007, Qin and Zhu 2011, Xu et al. 2020). At the stage of SCW deposition, cell expansion stopped and cellulose synthesis, transportation and deposition proceeded steadily. The cellulose synthase complex is located in the plasma membrane. The lipid composition and membrane features at this stage are conducive to the synthesis and organization of cellulose (Haigler et al. 2012). In this study, we analyzed the difference of lipid groups between the fast elongation stage and the SCW formation stage of fibers. Most of the lipid components (16/23 lipid sub-classes and 56/82 lipid molecular species) were higher in elongating fibers, and only a few lipid components (7/23 lipid sub-classes and 26/82 lipid molecular species) were higher in SCW formation stage. Among them, glycerophospholipids (GP), sphingolipids (SP) and glycerolipids (GL) were enriched in elongated fibers, which was similar to previous studies. It was reported that the content of polar lipid such as PC, PE, PI, PA, PG was the highest lipids in elongating fibers (7-10 DPA) (Wanjie et al. 2005). These results suggested that the accumulation of these lipids may be necessary for fiber elongating. The lipids of 10-DPA fiber and ovule of wild-type, and 10-DPA ovule of fuzzless-lintless mutant were detected by targeted lipidomics. The result showed that phosphatidylinositol (PI) was enriched in fiber cells and PI (34:3) was the highest lipid molecule species (Liu et al. 2015). Consistently, in our study, the lipid intensity of PI and molecular species PI (18:3/18:3), PI (16:0/18:3) molecules was significantly higher in 10-DPA fiber cells than in 20-DPA fiber cells of TM-1. The PI intensity of 10-DPA fiber from li-1 mutant was also significantly higher than that of 10-DPA fiber from wild-type. However, the increased PI molecules were PI (16:0/18:1), PI (16:0/18:2), PI (18:2/18:2), which indicated that the PI molecules enriched in mutant 10-DPA fibers was different from that enriched in wild-type 10-DPA fibers. Phospholipase D (PLD) can hydrolyze phospholipid to phospholipid acid (PA). GhPLDα1 highly expressed in 20-DPA fiber, which may lead to the decrease of phospholipid content and the increase of PA in 20-DPA fiber (Tang and Liu 2017). Consistently, most PA enriched in 20-DPA fiber. On the other hand, phospholipid acid can promote the production of hydrogen peroxide and induce the synthesis of SCW (Tang and Liu 2017). These results indicate that phospholipids play some roles in the regulation of fiber elongation and SCW synthesis. The intensity of saccharlipid (SL), sterol ester (ST) and wax ester (WE) enriched at the stage of SCW deposition, which indicated that the enrichment of these lipid components may promote cellulose synthesis and SCW formation.
Phytosterols play important roles in the development of fiber cells (Deng et al. 2016, Zhang et al. 2017, Niu et al. 2019, Liu et al. 2023). Sterols are comprised of free sterols and conjugated sterols such as sitosterol ester (SiE), campesterol ester, stigmasterol (StE) ester, sterol glycosides (SGS) and acetyl sterol glycosides (ASGS). Conjugated sterols play a role in the dynamic balance of sterols and in the synthesis of WEs (Ferrer et al. 2017). Three lipid classes of steryl esters: SiE, AGlcSiE, and StE were detected in the study. Among which, the AGlcSiE intensity is the highest in the rapid elongating fibers, and the intensity of SiE significantly increased in the stage of SCW synthesis. It was suggested that SiE might be associated with cellulose synthesis and SCW formation. Sterol glycosides and acetylsterol glycosides are enriched in elongating fibers. They may play roles in maintaining the balance between sterols and sphingolipids in fiber cell elongation (Valitova et al. 2010, Ferrer et al. 2017). Sterols and sphingolipids are two key components of lipid rafts, which are functional regions of membrane (Mongrand et al. 2004, Borner et al. 2005, Lefebvre et al. 2007).
Sphingolipids is necessary for plant growth and development, which response to biotic stress or abiotic stress (Hannun and Luberto 2000, Zäuner et al. 2010, Ali et al. 2018, Scheller et al. 2018). Sphingolipids also played a role in cotton fiber elongation. FB1 (Fumonisin B1), an inhibitor of sphingolipid synthesis, significantly inhibited fiber elongation and altered the activity of lipid raft activity in fiber cell(Wang et al. 2020, Xu et al. 2020). In this study, CerG1, CerG2, CerG1 (d18:2/18:0), CerG1 (d18:2/18:1), CerG1 (d36:2), and CerG2 (d34:4) are enriched in the elongating fiber cells. Moreover, these molecules are closely associated to AGlcSiE lipid molecule (figure S3), which indicated that these molecules play a role in the regulation of fiber cell elongation. On the other hand, VLCFA is a component of sphingolipid molecule and plays an important role in fiber cell elongation. Application of ACE inhibited the fiber elongation while VLCFA promoted cell elongation by promoting ethylene synthesis (Gou et al. 2007, Qin et al. 2007, Liang et al. 2015). These results indicated that there is a close relationship between sphingolipids, sterol, and membrane lipid rafts during the process of fiber elongation. The future study on these relationships may be an important aspect to reveal the regulatory mechanism in the growth and development of fibers.
5.2. The Lipid Metabolism Disruption in the li-1 Mutant Fibers
Ligon lintless-1 (li-1) is a dominant mutant of Gossypium hirsutum, which has the phenotype of damaged vegetative growth and short fiber. Although the gene identification and gene expression profile of the fiber of li-1 mutant have been studied for many years, the regulatory mechanism on the fiber growth deficiency is still unclear [49,50,51]. Compared with wild type, unexpectedly, most lipid classes and lipid molecule species have higher rather than lower intensity in mutant fibers (20/25 lipid species, 60/68 lipid molecular species), and only 5 lipid species and 8 lipid molecule species are lower in mutant fibers. In the fibers of li-1 mutant, the lipid classes and lipid molecule species of TG and SL were enriched. Consistently, GL and SL were enriched in the stage of SCW synthesis in wild-type fiber. The high intensity of GL and SL in li-1 fiber may promote the SCW synthesis and inhibit the fiber elongation. Sphingolipids and GPs were the major lipids in li-1 cells. LPC and PLE were enriched in 10-DPA fibers during fiber development in wild type, but decreased in li-1 fiber cells. These two GPs may play key role in fiber elongation.
FB1 is an inhibitor of ceramide synthase that is the center of sphingolipid metabolism and biology [52,53]. The exogenous application of FB1 strongly inhibited the fiber cell growth and its fiber phenotype is similar to that of the li-1 fiber [26]. FB1 treatment resulted in a decrease in total GIPC and all GIPC molecular species [26]. Consistent with FB1 treatment, the total GIPC and all molecular species were reduced in the li-1 mutant fibers (Figure 5F). Furthermore, the expression levels of two genes encoding ceramide synthases Gh_D12G0217 and Gh_A07G0513 were significantly reduced (Figure 8). These results revealed that GIPC synthesis was inhibited in li-1 fibers and GIPC might play an important role in fiber cell elongation. There are 10 homologous genes encoding ceramide synthase in the upland cotton genome. In our previous studies, overexpression of GhCS1 (Gh_D07G0583) promoted the synthesis of ceramide molecules containing dihydroxy LCB and VLCFA, and inhibited the initiation and elongation of fiber cells [29]. Consistently, the most ceramide molecules containing dihydroxy LCB and VLCFA significantly increased in the li-1 mutant fibers (Figure 5D). Taken together, given sphingolipids are regarded as major regulators of lipid metabolism [54], sphingolipid balance might be an important factor for the normal growth of fiber cells.
During the fiber development, SiE was enriched in 20-DPA fiber while acetylglycosyl sterol ester and StE were enriched in 10-DPA fiber. However, the lipid intensity of three sterol esters in mutant fiber was higher than that in wild-type fiber, and the intensity of SiE molecule (SiE (18:3)) was 59.56 times of that in wild-type 10-DPA fiber. This change was further confirmed by the targeted lipidomics of phytosterols. Compared with TM-1, the content of campesteryl ester, sitosteryl ester, and total steryl ester were strikingly increased in li-1 fibers by 21.8, 48.7, and 45.5 fold, respectively (Fig6B). In plant cell, too high or too low levels of sterols will inhibit plant growth, and sterol esters play a role in regulating the level of free sterols [55]. The abnormal enrichment of sterol esters in li-1 fibers may be a reason for its elongation suppression.
Lipid droplets (LDs), also known as oil bodies or lipid bodies are the “youngest” cellular organelle and are composed of a neutral lipid core surrounded by a phospholipid monolayer draped with hundreds of different proteins [56,57,58]. Since the hydrophobic core of LDs is mainly composed of TG and steryl esters [33,34,59], we further investigated the LDs in leaf and fiber cell. The number and size of oil bodies in li-1 mutant obviously differ from that of TM-1. More and bigger oil bodies both in leaf and fiber cell. LD biogenesis and degradation, as well as their interactions with other organelles, are tightly coupled to cellular metabolism and are critical to buffer the levels of toxic lipid species. Thus, LDs facilitate the coordination and communication between different organelles and act as vital hubs of cellular metabolism [33,34,60]. The change on the LDs further confirmed the disruption of lipid metabolism in fiber cell of li-1. This provided a novel clue to reveal the regulatory mechanism of fiber growth and development in the future.
Supplementary Materials
The following supporting information can be downloaded at the website of this paper posted on Preprints.org.
Author Contributions
Huidan Tian: Visualization, Writing-Original Draft Preparation. Qiaoling Wang: Validation, Investigation, Software. Xingying Yan: Methodology, Investigation, Writing-Review and Editing. Hongju Zhang: Conceptualization, Validation, Writing-Review and Editing. Zheng Chen: Software, Validation. Caixia Ma: Investigation. Qian Meng: Data Curation Visualization, Resources. Fan Xu: Data Curation Visualization, Software. Ming Luo: Validation, Supervision, Formal Analysis, Conceptualization, Project Administration. All authors have read and agreed to the published version of the manuscript.
Funding
This research was funded by the National Natural Science Foundation of China (32372114 and 31971984), and the Genetically Modified Organisms Breeding Major Project of China (No.2018ZX0800921B). The funding bodies did not play any role in the design of the study and collection, analysis, and interpretation of data and in writing the manuscript.
Institutional Review Board Statement
Not applicable.
Informed Consent Statement
Not applicable.
Data Availability Statement
Not applicable.
Conflicts of Interest
The authors declare no conflicts of interest.
References
- Kim HJ, Triplett BA: Cotton fiber growth in planta and in vitro. Models for plant cell elongation and cell wall biogenesis. Plant physiology 2001, 127(4):1361-1366. [CrossRef]
- Qin YM, Zhu YX: How cotton fibers elongate: a tale of linear cell-growth mode. Current opinion in plant biology 2011, 14(1):106-111. [CrossRef]
- Haigler CH, Betancur L, Stiff MR, Tuttle JR: Cotton fiber: a powerful single-cell model for cell wall and cellulose research. Frontiers in plant science 2012, 3. [CrossRef]
- Stiff MR, Haigler CH: Cotton fiber tips have diverse morphologies and show evidence of apical cell wall synthesis. Scientific reports 2016, 6. [CrossRef]
- Yang Z, Zhang C, Yang X, Liu K, Wu Z, Zhang X, Zheng W, Xun Q, Liu C, Lu L: PAG1, a cotton brassinosteroid catabolism gene, modulates fiber elongation. New Phytologist 2014, 203(2):437-448. [CrossRef]
- Kohel RJ, Quisenberry JE, Benedict CR: Fiber Elongation and Dry Weight Changes in Mutant Lines of Cotton1. Crop Sci 1974, 14(3):cropsci1974.0011183X001400030040x. [CrossRef]
- Karaca M, Saha S, Jenkins JN, Zipf A, Kohel R, Stelly DM: Simple sequence repeat (SSR) markers linked to the Ligon lintless (Li(1)) mutant in cotton. The Journal of heredity 2002, 93(3):221-224. [CrossRef]
- Kohel RJ, Benedict CR, Jividen GM: Incorporation of [14C]Glucose into Crystalline Cellulose in Aberrant Fibers of a Cotton Mutant. Crop Sci 1993, 33(5):cropsci1993.0011183X003300050032x. [CrossRef]
- Ohlrogge J, Browse J: Lipid biosynthesis. The Plant Cell 1995, 7(7):957-970. [CrossRef]
- Sanjaya, Miller R, Durrett TP, Kosma DK, Lydic TA, Muthan B, Koo AJK, Bukhman YV, Reid GE, Howe GA et al.: Altered Lipid Composition and Enhanced Nutritional Value of Arabidopsis Leaves following Introduction of an Algal Diacylglycerol Acyltransferase 2. Plant Cell 2013, 25(2):677-693. [CrossRef]
- Farmer EE, Weber H, Vollenweider S: Fatty acid signaling in Arabidopsis. Planta 1998, 206(2):167-174. [CrossRef]
- Liu G-J, Xiao G-H, Liu N-J, Liu D, Chen P-S, Qin Y-M, Zhu Y-X: Targeted Lipidomics Studies Reveal that Linolenic Acid Promotes Cotton Fiber Elongation by Activating Phosphatidylinositol and Phosphatidylinositol Monophosphate Biosynthesis. Mol Plant 2015, 8(6):911-921. [CrossRef]
- Ji SJ, Lu YC, Feng JX, Wei G, Li J, Shi YH, Fu Q, Liu D, Luo JC, Zhu YX: Isolation and analyses of genes preferentially expressed during early cotton fiber development by subtractive PCR and cDNA array. Nucleic acids research 2003, 31(10):2534-2543. [CrossRef]
- Shi YH, Zhu SW, Mao XZ, Feng JX, Qin YM, Zhang L, Cheng J, Wei LP, Wang ZY, Zhu YX: Transcriptome profiling, molecular biological, and physiological studies reveal a major role for ethylene in cotton fiber cell elongation. Plant Cell 2006, 18(3):651-664. [CrossRef]
- Yang SS, Cheung F, Lee JJ, Ha M, Wei NE, Sze SH, Stelly DM, Thaxton P, Triplett B, Town CD et al.: Accumulation of genome-specific transcripts, transcription factors and phytohormonal regulators during early stages of fiber cell development in allotetraploid cotton. Plant Journal 2006, 47(5):761-775. [CrossRef]
- Gou JY, Wang LJ, Chen SP, Hu WL, Chen XY: Gene expression and metabolite profiles of cotton fiber during cell elongation and secondary cell wall synthesis. Cell Res 2007, 17(5):422-434. [CrossRef]
- Qin YM, Hu CY, Pang Y, Kastaniotis AJ, Hiltunen JK, Zhu YX: Saturated very-long-chain fatty acids promote cotton fiber and Arabidopsis cell elongation by activating ethylene biosynthesis. Plant Cell 2007, 19(11):3692-3704. [CrossRef]
- Qin YM, Pujol FM, Hu CY, Feng JX, Kastaniotis AJ, Hiltunen JK, Zhu YX: Genetic and biochemical studies in yeast reveal that the cotton fibre-specific GhCER6 gene functions in fatty acid elongation. Journal of Experimental Botany 2007, 58(3):473-481. [CrossRef]
- Zhu L, Dou L, Shang H, Li H, Yu J, Xiao G: GhPIPLC2D promotes cotton fiber elongation by enhancing ethylene biosynthesis. iScience 2021, 24(3):102199. [CrossRef]
- Wanjie SW, Welti R, Moreau RA, Chapman KD: Identification and quantification of glycerolipids in cotton fibers: Reconciliation with metabolic pathway predictions from DNA databases. Lipids 2005, 40(8):773-785. [CrossRef]
- Chen M, Cahoon EB, Saucedo-García M, Plasencia J, Gavilanes-Ruíz M: Plant Sphingolipids: Structure, Synthesis and Function. In: Lipids in Photosynthesis: Essential and Regulatory Functions. Edited by Wada H, Murata N. Dordrecht: Springer Netherlands; 2009: 77-115.
- Lynch DV, Dunn TM: An introduction to plant sphingolipids and a review of recent advances in understanding their metabolism and function. New Phytol 2004, 161(3):677-702. [CrossRef]
- Markham JE, Jaworski JG: Rapid measurement of sphingolipids from Arabidopsis thaliana by reversed-phase high-performance liquid chromatography coupled to electrospray ionization tandem mass spectrometry. Rapid Commun Mass Sp 2007, 21(7):1304-1314. [CrossRef]
- Xu F, Suo X, Li F, Bao C, He S, Huang L, Luo M: Membrane lipid raft organization during cotton fiber development. Journal of Cotton Research 2020, 3(1):13. [CrossRef]
- Xu F, Chen Q, Huang L, Luo M: Advances about the Roles of Membranes in Cotton Fiber Development. 2021. [CrossRef]
- Wang L, Liu C, Liu Y, Luo M: Fumonisin B1-Induced Changes in Cotton Fiber Elongation Revealed by Sphingolipidomics and Proteomics. Biomolecules 2020, 10(9). [CrossRef]
- Chen Q, Xu F, Wang L, Suo XD, Wang QL, Meng Q, Huang L, Ma CX, Li GM, Luo M: Sphingolipid Profile during Cotton Fiber Growth Revealed That a Phytoceramide Containing Hydroxylated and Saturated VLCFA Is Important for Fiber Cell Elongation. Biomolecules 2021, 11(9). [CrossRef]
- Wang Q, Meng Q, Xu F, Chen Q, Ma C, Huang L, Li G, Luo M: Comparative Metabolomics Analysis Reveals Sterols and Sphingolipids Play a Role in Cotton Fiber Cell Initiation. Int J Mol Sci 2021, 22(21). [CrossRef]
- Li G, Wang Q, Meng Q, Wang G, Xu F, Chen Q, Liu F, Hu Y, Luo M: Overexpression of a ceramide synthase gene,GhCS1, inhibits fiber cell initiation and elongation by promoting the synthesis of ceramides containing dihydroxy LCB and VLCFA. Front Plant Sci 2022, 13. [CrossRef]
- Meng Q, Wang Q, Xu F, Chen Q, Ma C, Huang L, Li G, Liu F, Luo M: Down-regulating a fiber-specific KCR like gene GhKCRL1 suppressed fiber elongation through blocking the synthesis of sphingolipids in fiber cell. Industrial Crops and Products 2022, 186:115290. [CrossRef]
- Zhang J, Meng Q, Wang Q, Zhang H, Tian H, Wang T, Xu F, Yan X, Luo M: Cotton sphingosine kinase GhLCBK1 participates in fiber cell elongation by affecting sphingosine-1-phophate and auxin synthesis. 2024(1879-0003 (Electronic)). [CrossRef]
- Tartaglio V, Rennie EA, Cahoon R, Wang G, Baidoo E, Mortimer JC, Cahoon EB, Scheller HV: Glycosylation of inositol phosphorylceramide sphingolipids is required for normal growth and reproduction in Arabidopsis. The Plant Journal 2017, 89(2):278-290. [CrossRef]
- Olzmann JA, Carvalho P: Dynamics and functions of lipid droplets. Nat Rev Mol Cell Bio 2019, 20(3):137-155. [CrossRef]
- Chapman KD, Dyer JM, Mullen RT: Biogenesis and functions of lipid droplets in plants: Thematic Review Series: Lipid Droplet Synthesis and Metabolism: from Yeast to Man. J Lipid Res 2012, 53(2):215-226. [CrossRef]
- Tang K, Liu JY: Molecular characterization of GhPLD alpha 1 and its relationship with se(c)ondary cell wall thickening in cotton fibers. Acta Bioch Bioph Sin 2017, 49(1):33-43. [CrossRef]
- Deng S, Wei T, Tan K, Hu M, Li F, Zhai Y, Ye S, Xiao Y, Hou L, Pei Y et al.: Phytosterol content and the campesterol:sitosterol ratio influence cotton fiber development: role of phytosterols in cell elongation. Sci China Life Sci 2016, 59(2):183-193. [CrossRef]
- Niu Q, Tan KL, Zang ZL, Xiao ZY, Chen KJ, Hu MY, Luo M: Modification of phytosterol composition influences cotton fiber cell elongation and secondary cell wall deposition. Bmc Plant Biology 2019, 19. [CrossRef]
- Zhang Z, Ruan Y-L, Zhou N, Wang F, Guan X, Fang L, Shang X, Guo W, Zhu S, Zhang T: Suppressing a Putative Sterol Carrier Gene Reduces Plasmodesmal Permeability and Activates Sucrose Transporter Genes during Cotton Fiber Elongation. The Plant Cell 2017, 29(8):2027-2046. [CrossRef]
- Liu F, Wei T, Wang Q, Li G, Meng Q, Huang L, Cheng X, Yan X, Hu Y, Xu F et al.: GhSMO2-2 is regulated by brassinosteroid signal and involved in cotton fiber elongation via influencing phytosterol and sphingolipid biosynthesis. Industrial Crops and Products 2023, 205:117527. [CrossRef]
- Ferrer A, Altabella T, Arro M, Boronat A: Emerging roles for conjugated sterols in plants. Progress in lipid research 2017, 67:27-37. [CrossRef]
- Valitova YN, Kotlova ER, Novikov AV, Shavarda AL, Artemenko KA, Zubarev RA, Minibayeva FV: Binding of sterols affects membrane functioning and sphingolipid composition in wheat roots. Biochemistry (Moscow) 2010, 75(5):554-561. [CrossRef]
- Mongrand S, Morel J, Laroche J, Claverol S, Carde JP, Hartmann MA, Bonneu M, Simon-Plas F, Lessire R, Bessoule JJ: Lipid rafts in higher plant cells - Purification and characterization of triton X-100-insoluble microdomains from tobacco plasma membrane. J Biol Chem 2004, 279(35):36277-36286. [CrossRef]
- Lefebvre B, Furt F, Hartmann MA, Michaelson LV, Carde JP, Sargueil-Boiron F, Rossignol M, Napier JA, Cullimore J, Bessoule JJ et al.: Characterization of lipid rafts from Medicago truncatula root plasma membranes: A proteomic study reveals the presence of a raft-associated redox system. Plant Physiol 2007, 144(1):402-418. [CrossRef]
- Borner GHH, Sherrier DJ, Weimar T, Michaelson LV, Hawkins ND, MacAskill A, Napier JA, Beale MH, Lilley KS, Dupree P: Analysis of detergent-resistant membranes in Arabidopsis. Evidence for plasma membrane lipid rafts. Plant Physiol 2005, 137(1):104-116. [CrossRef]
- Zäuner S, Ternes P, Warnecke D: Biosynthesis of sphingolipids in plants (and some of their functions). Adv Exp Med Biol 2010, 688:249-263. [CrossRef]
- Ali U, Li H, Wang X, Guo L: Emerging Roles of Sphingolipid Signaling in Plant Response to Biotic and Abiotic Stresses. Mol Plant 2018, 11(11):1328-1343. [CrossRef]
- Hannun YA, Luberto C: Ceramide in the eukaryotic stress response. Trends Cell Biol 2000, 10(2):73-80. [CrossRef]
- Scheller HV, Moore WM, Fang L, Chan C, Ishikawa T, Ebert B, Rautengarten C, Kawai-Yamada M, Heazlewood JL, Mortimer JC: Sphingolipid glycosylation and its role in membrane organization and plant-microbe interactions. Glycobiology 2018, 28(12):1020-1020.
- Liang WH, Fang L, Xiang D, Hu Y, Feng H, Chang LJ, Zhang TZ: Transcriptome Analysis of Short Fiber Mutant Ligon lintless-1 (Li-1) Reveals Critical Genes and Key Pathways in Cotton Fiber Elongation and Leaf Development. PloS one 2015, 10(11). [CrossRef]
- Bolton JJ, Soliman KM, Wilkins TA, Jenkins JN: Aberrant Expression of Critical Genes during Secondary Cell Wall Biogenesis in a Cotton Mutant, Ligon Lintless-1 (Li-1). Comparative and functional genomics 2009, 2009:659301. [CrossRef]
- Gilbert MK, Turley RB, Kim HJ, Li P, Thyssen G, Tang YH, Delhom CD, Naoumkina M, Fang DD: Transcript profiling by microarray and marker analysis of the short cotton (Gossypium hirsutum L.) fiber mutant Ligon lintless-1 (Li-1). BMC genomics 2013, 14. [CrossRef]
- Mullen TD, Hannun YA, Obeid LM: Ceramide synthases at the centre of sphingolipid metabolism and biology. The Biochemical journal 2012, 441(3):789-802. [CrossRef]
- Ternes P, Feussner K, Werner S, Lerche J, Iven T, Heilmann I, Riezman H, Feussner I: Disruption of the ceramide synthase LOH1 causes spontaneous cell death in Arabidopsis thaliana. New Phytol 2011, 192(4):841-854. [CrossRef]
- Worgall TS: Sphingolipids: major regulators of lipid metabolism. Curr Opin Clin Nutr Metab Care 2007, 10(2):149-155. [CrossRef]
- Shimada TL, Shimada T, Okazaki Y, Higashi Y, Saito K, Kuwata K, Oyama K, Kato M, Ueda H, Nakano A et al.: HIGH STEROL ESTER 1 is a key factor in plant sterol homeostasis. Nat Plants 2019, 5(11):1154-1166. [CrossRef]
- Deevska GM, Nikolova-Karakashian MN: The expanding role of sphingolipids in lipid droplet biogenesis. Biochimica et Biophysica Acta (BBA) - Molecular and Cell Biology of Lipids 2017, 1862(10, Part B):1155-1165. [CrossRef]
- Guzha A, Whitehead P, Ischebeck T, Chapman KD: Lipid Droplets: Packing Hydrophobic Molecules Within the Aqueous Cytoplasm. Annual Review of Plant Biology 2023, 74(Volume 74, 2023):195-223. [CrossRef]
- Krahmer N, Hilger M, Kory N, Wilfling F, Stoehr G, Mann M, Farese RV, Jr., Walther TC: Protein correlation profiles identify lipid droplet proteins with high confidence. Mol Cell Proteomics 2013, 12(5):1115-1126. [CrossRef]
- Ischebeck T, Krawczyk HE, Mullen RT, Dyer JM, Chapman KD: Lipid droplets in plants and algae: Distribution, formation, turnover and function. Semin Cell Dev Biol 2020, 108:82-93. [CrossRef]
- Qin Z, Wang T, Zhao Y, Ma C, Shao Q: Molecular Machinery of Lipid Droplet Degradation and Turnover in Plants. Int J Mol Sci 2023, 24(22):16039. [CrossRef]
Figure 1.
OPLS-DA score plot and the number of lipid species in each detected lipid class.A:The OPLS-DA score plot between the 10-DPA fiber group and 20-DPA fiber group. B: The OPLS-DA score plot between the 10-DPA fiber group of wild type (TM-1) and the 10-DPA fiber group of li-1 mutant. C: 33 lipid classes detected in three samples and the number of lipid molecule species in each detected lipid class. 10 D: 10-DPA fibers of TM-1 (wild type); 20 D: 20-DPA fibers of TM-1 (wild type); 10 D-li: 10-DPA fibers of li-1 mutant.
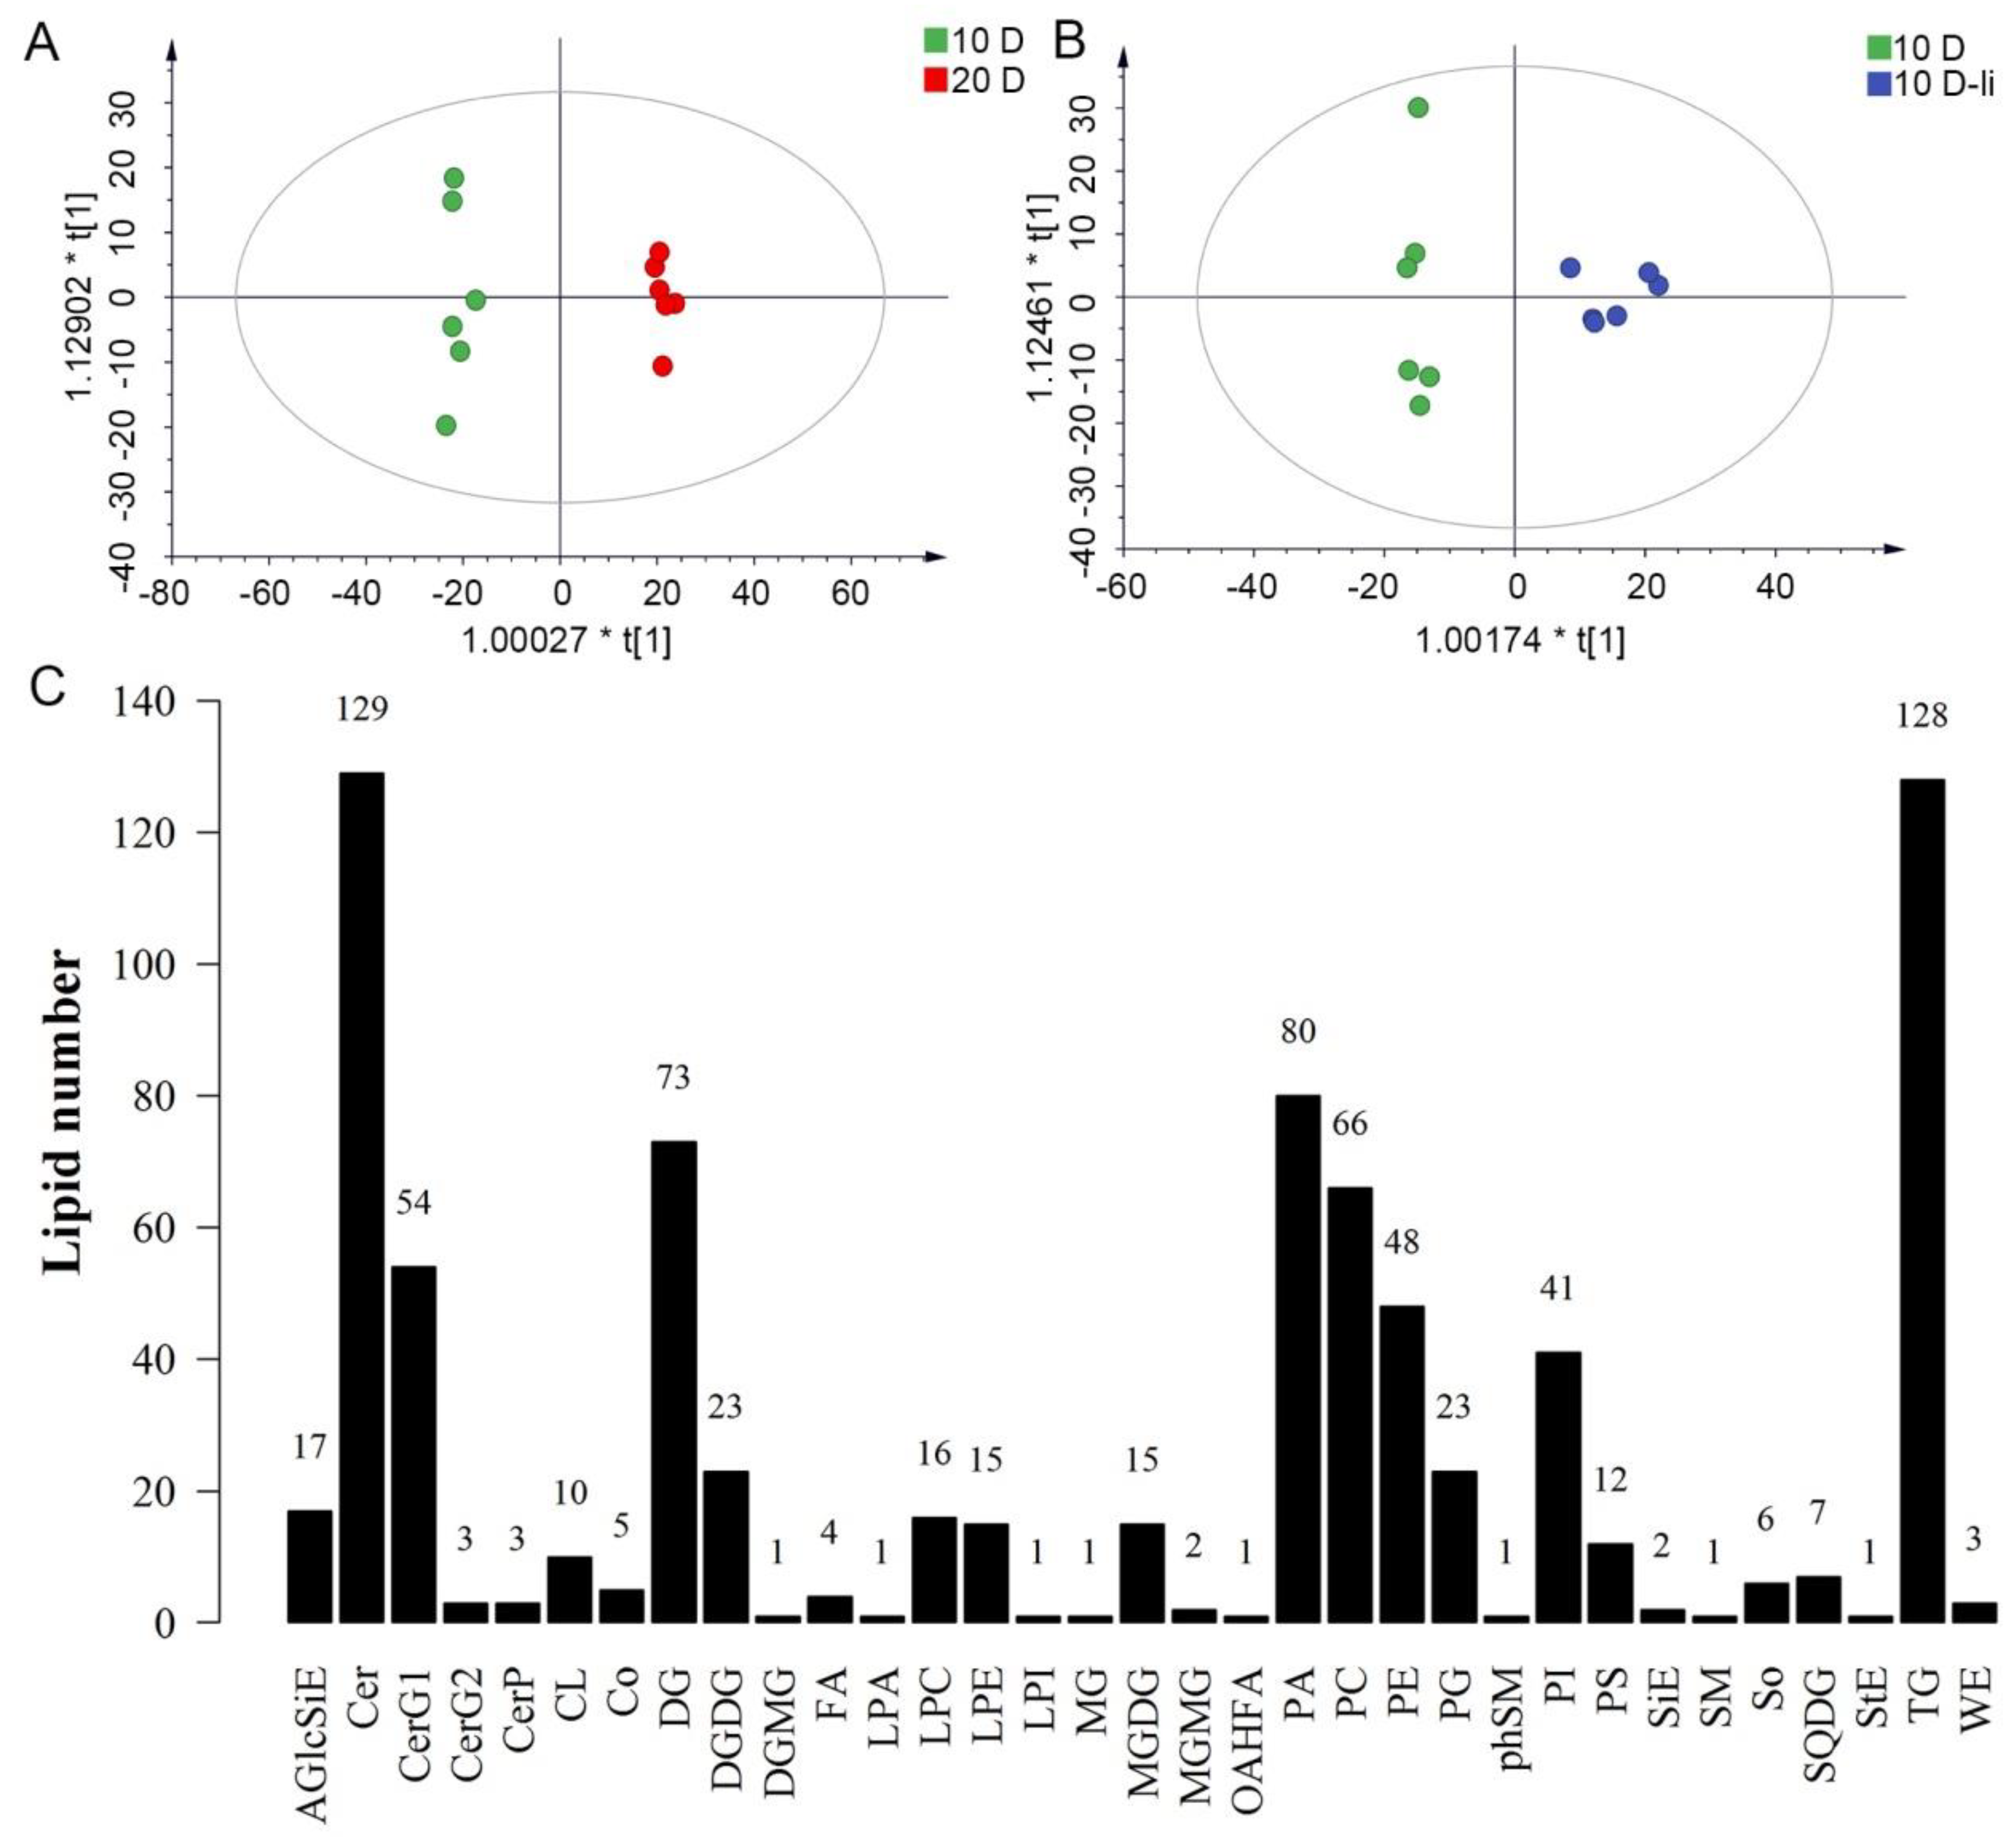
Figure 2.
The lipids intensity of various lipid classes.
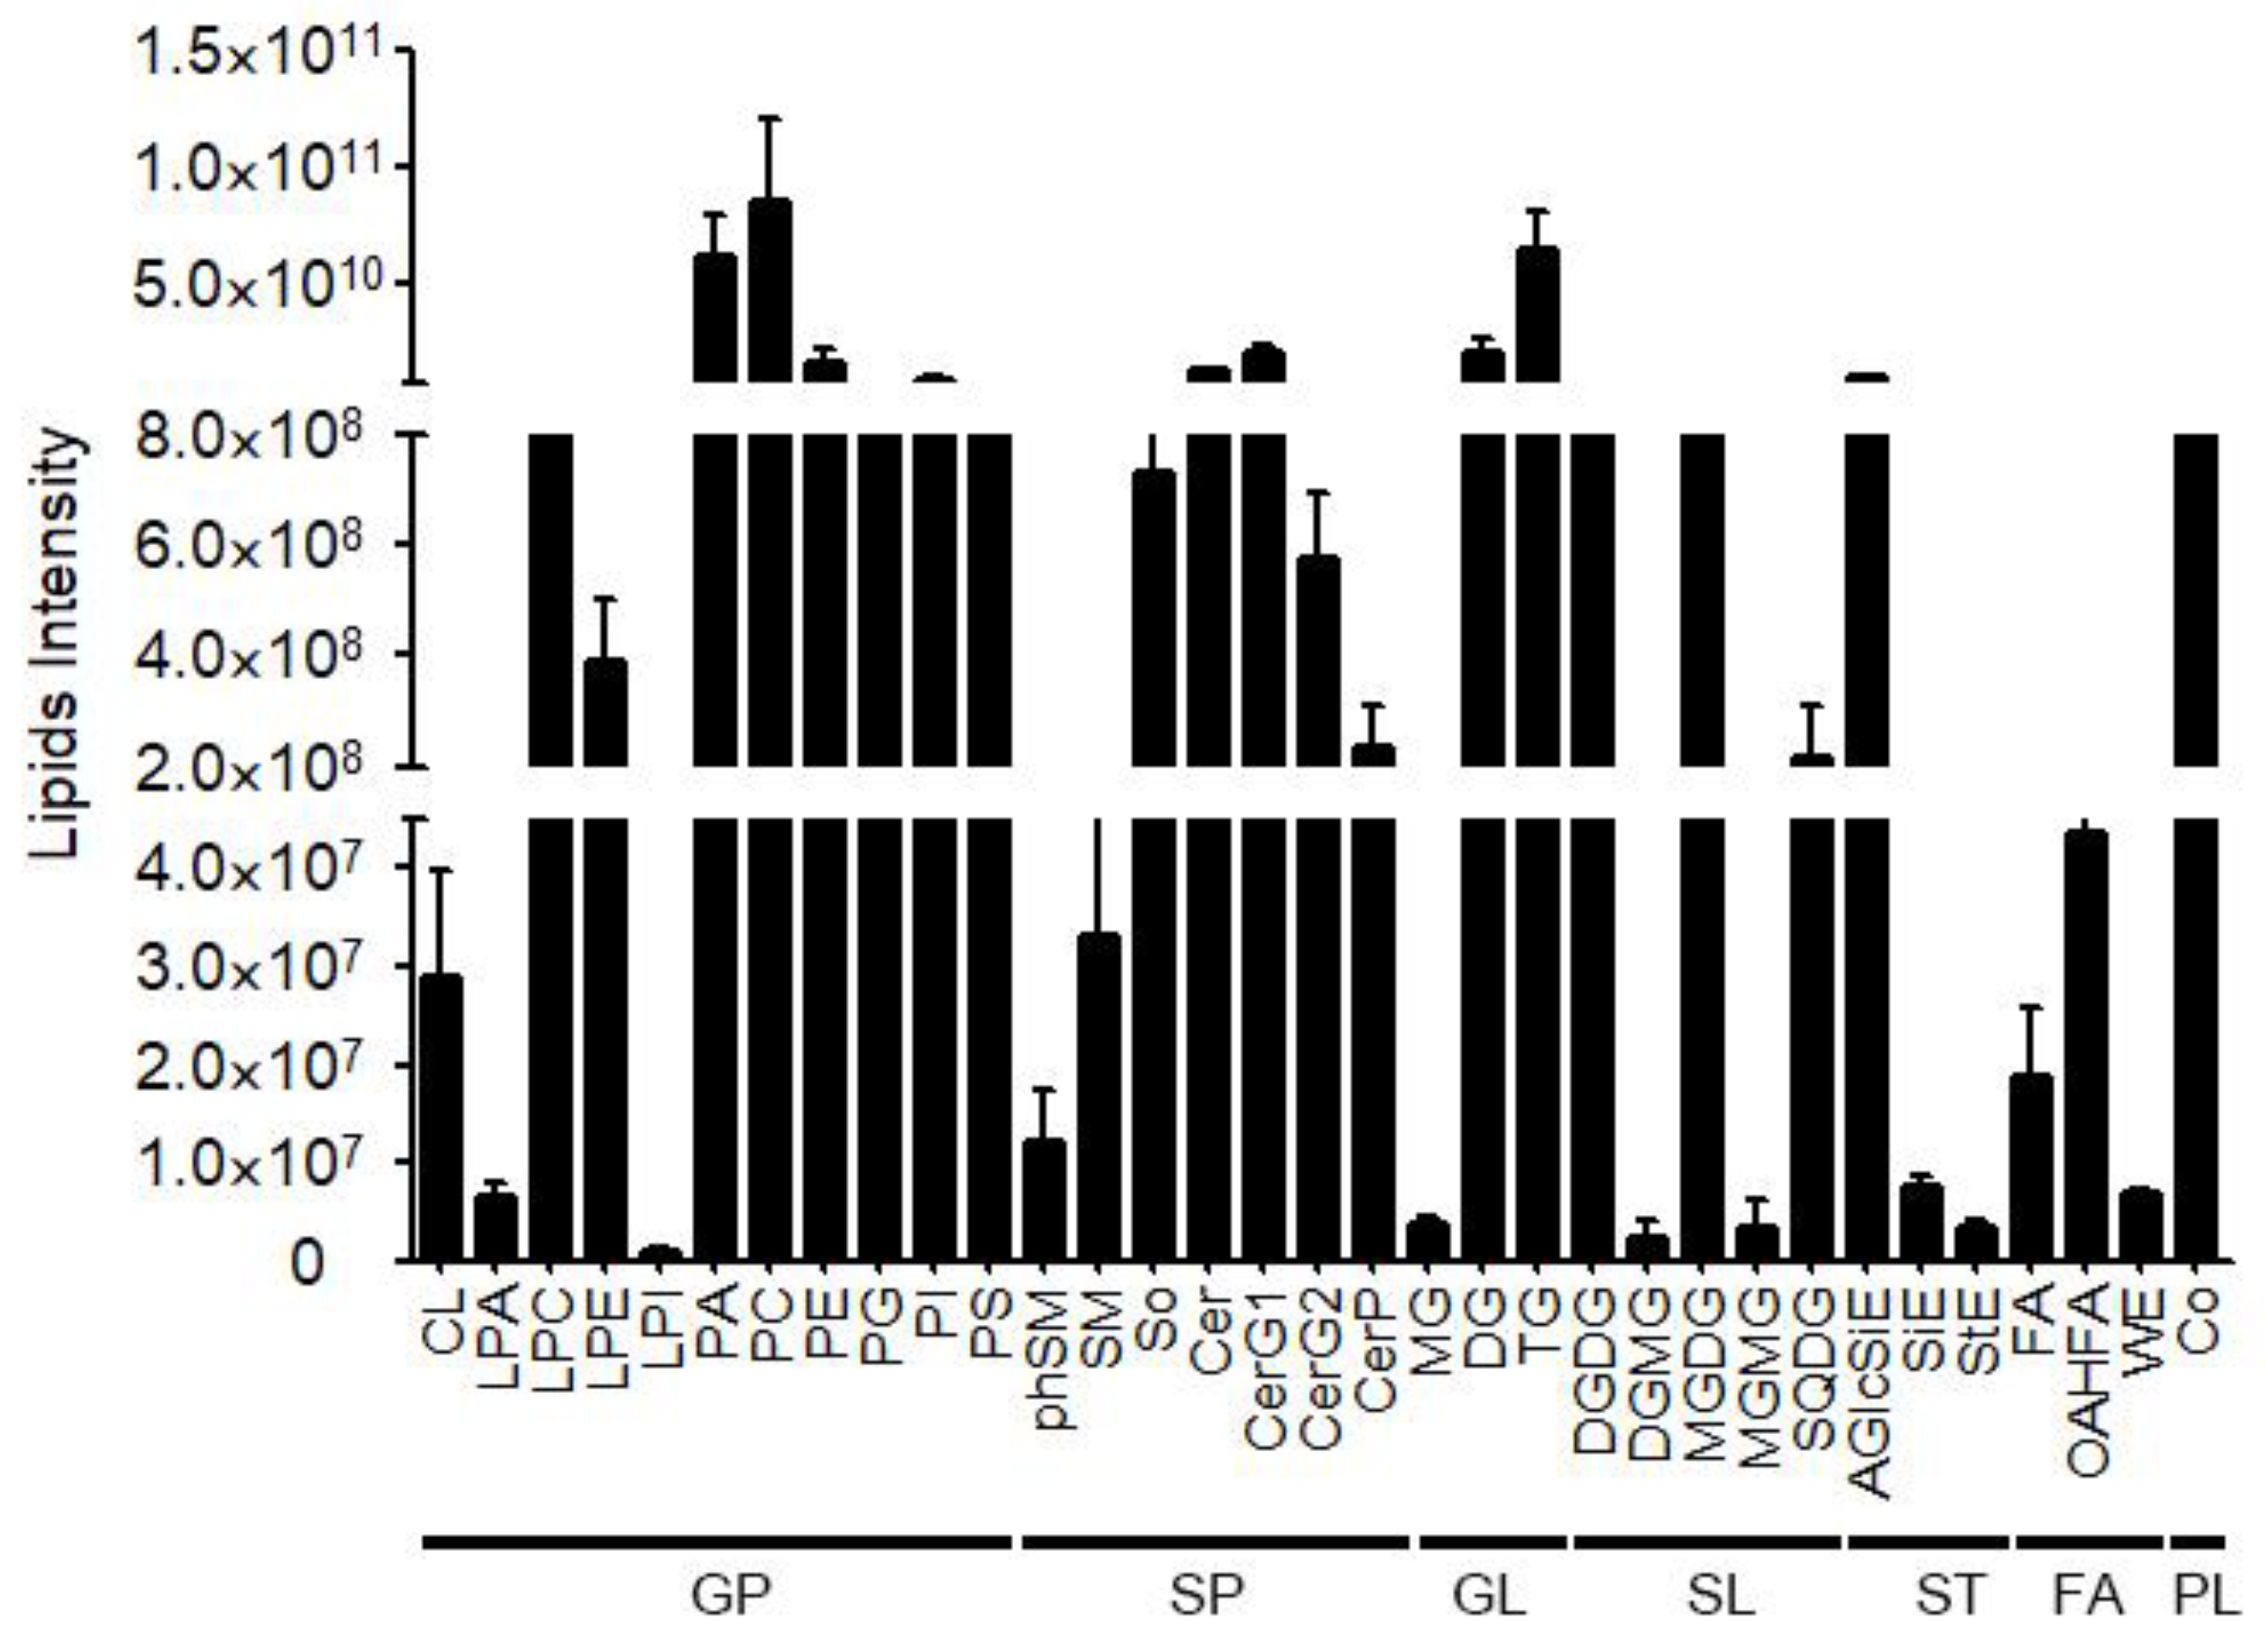
Figure 3.
The intensity difference of lipid class and lipid molecule species between 10-DPA fiber cells and 20-DPA fiber cells.A: The fold changes of various lipid classes between 10-DPA fiber cells and 20-DPA fiber cells; B: The fold changes of various lipid molecule species between 10-DPA fiber cells and 20-DPA fiber cells; C: The proportion of various lipid compounds in the total significantly changed lipids; D: The proportion of various lipid molecule species in the total significantly changed lipids. 10 D: 10-DPA fibers of TM-1 (wild type); 20 D: 20-DPA fibers of TM-1 (wild type).
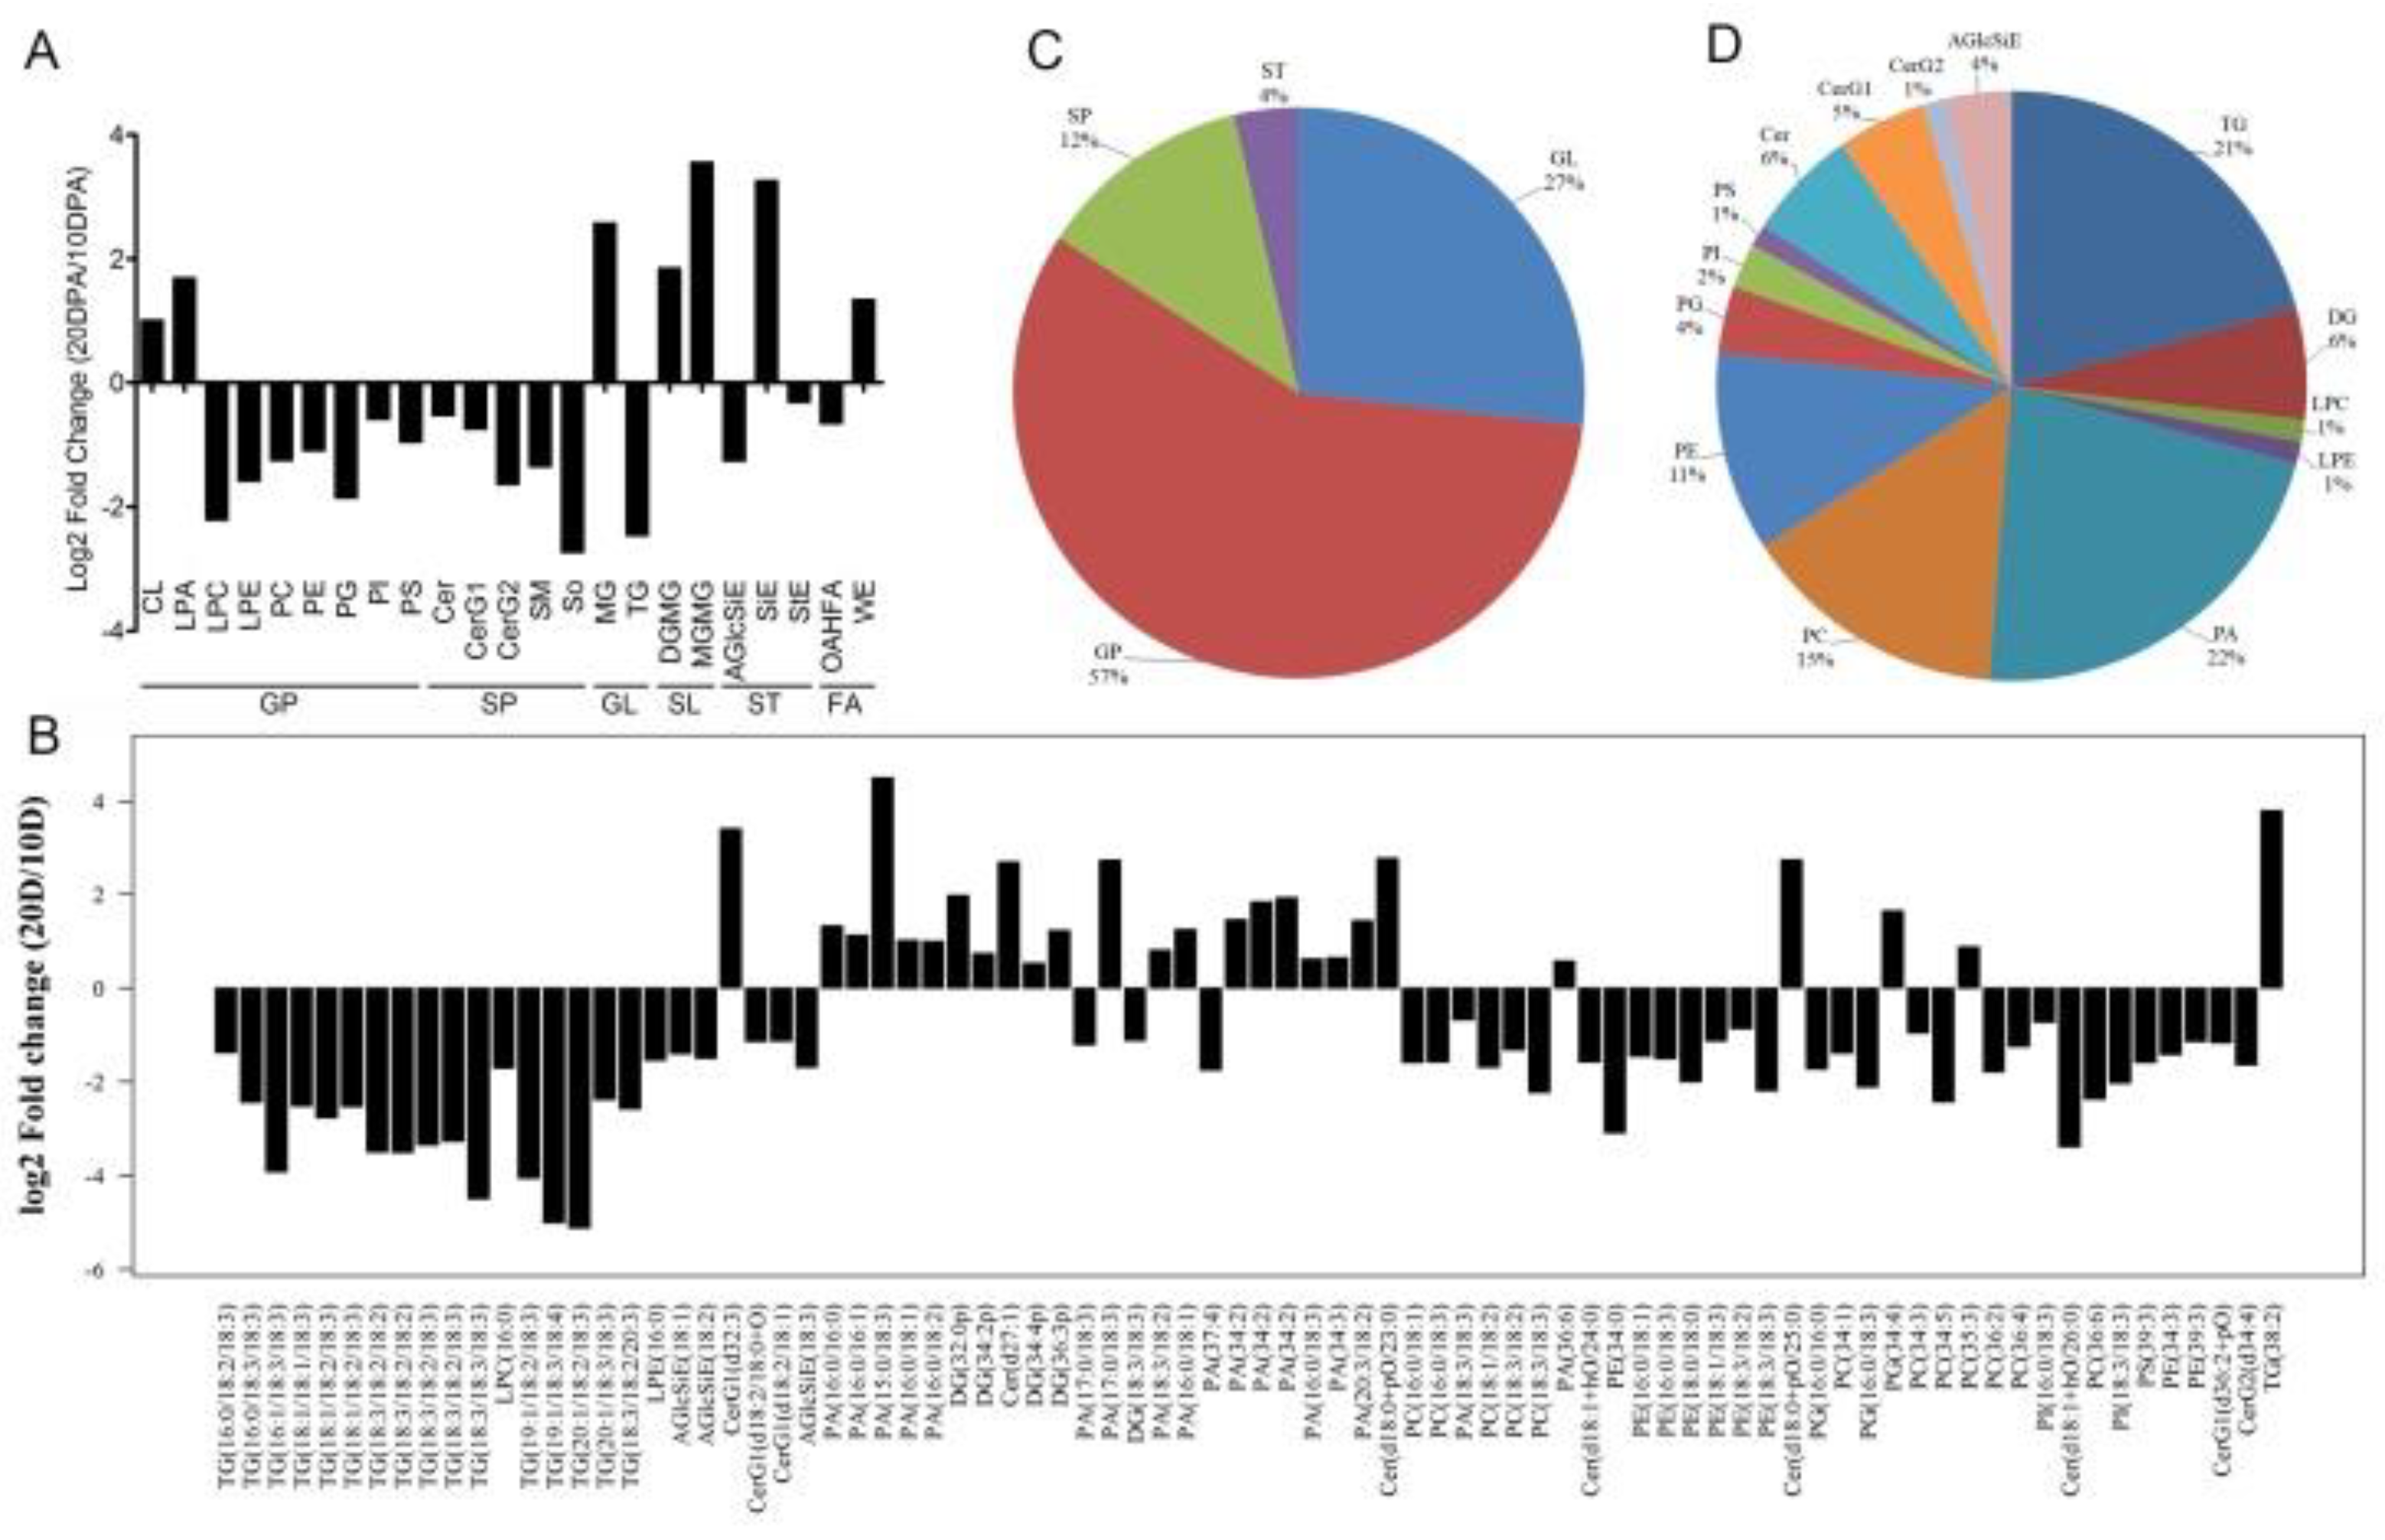
Figure 4.
The intensity difference of lipid class and lipid molecule species between 10-DPA fiber cells of TM-1(wild type) and 10-DPA fiber cells of li-1 mutant.A: The fold changes of various lipid classes between 10-DPA fiber cells of TM-1 and 10-DPA fiber cells of li-1 mutant; B: The fold changes of various lipid molecule species between 10-DPA fiber cells of TM-1and 10-DPA fiber cells of li-1 mutant; C: The proportion of various lipid compounds in the total significantly changed lipids; D: The proportion of various lipid molecule species in the total significantly changed lipids. 10 D: 10-DPA fibers of TM-1 (wild type); 10 D-li: 10-DPA fibers of li-1 mutant.
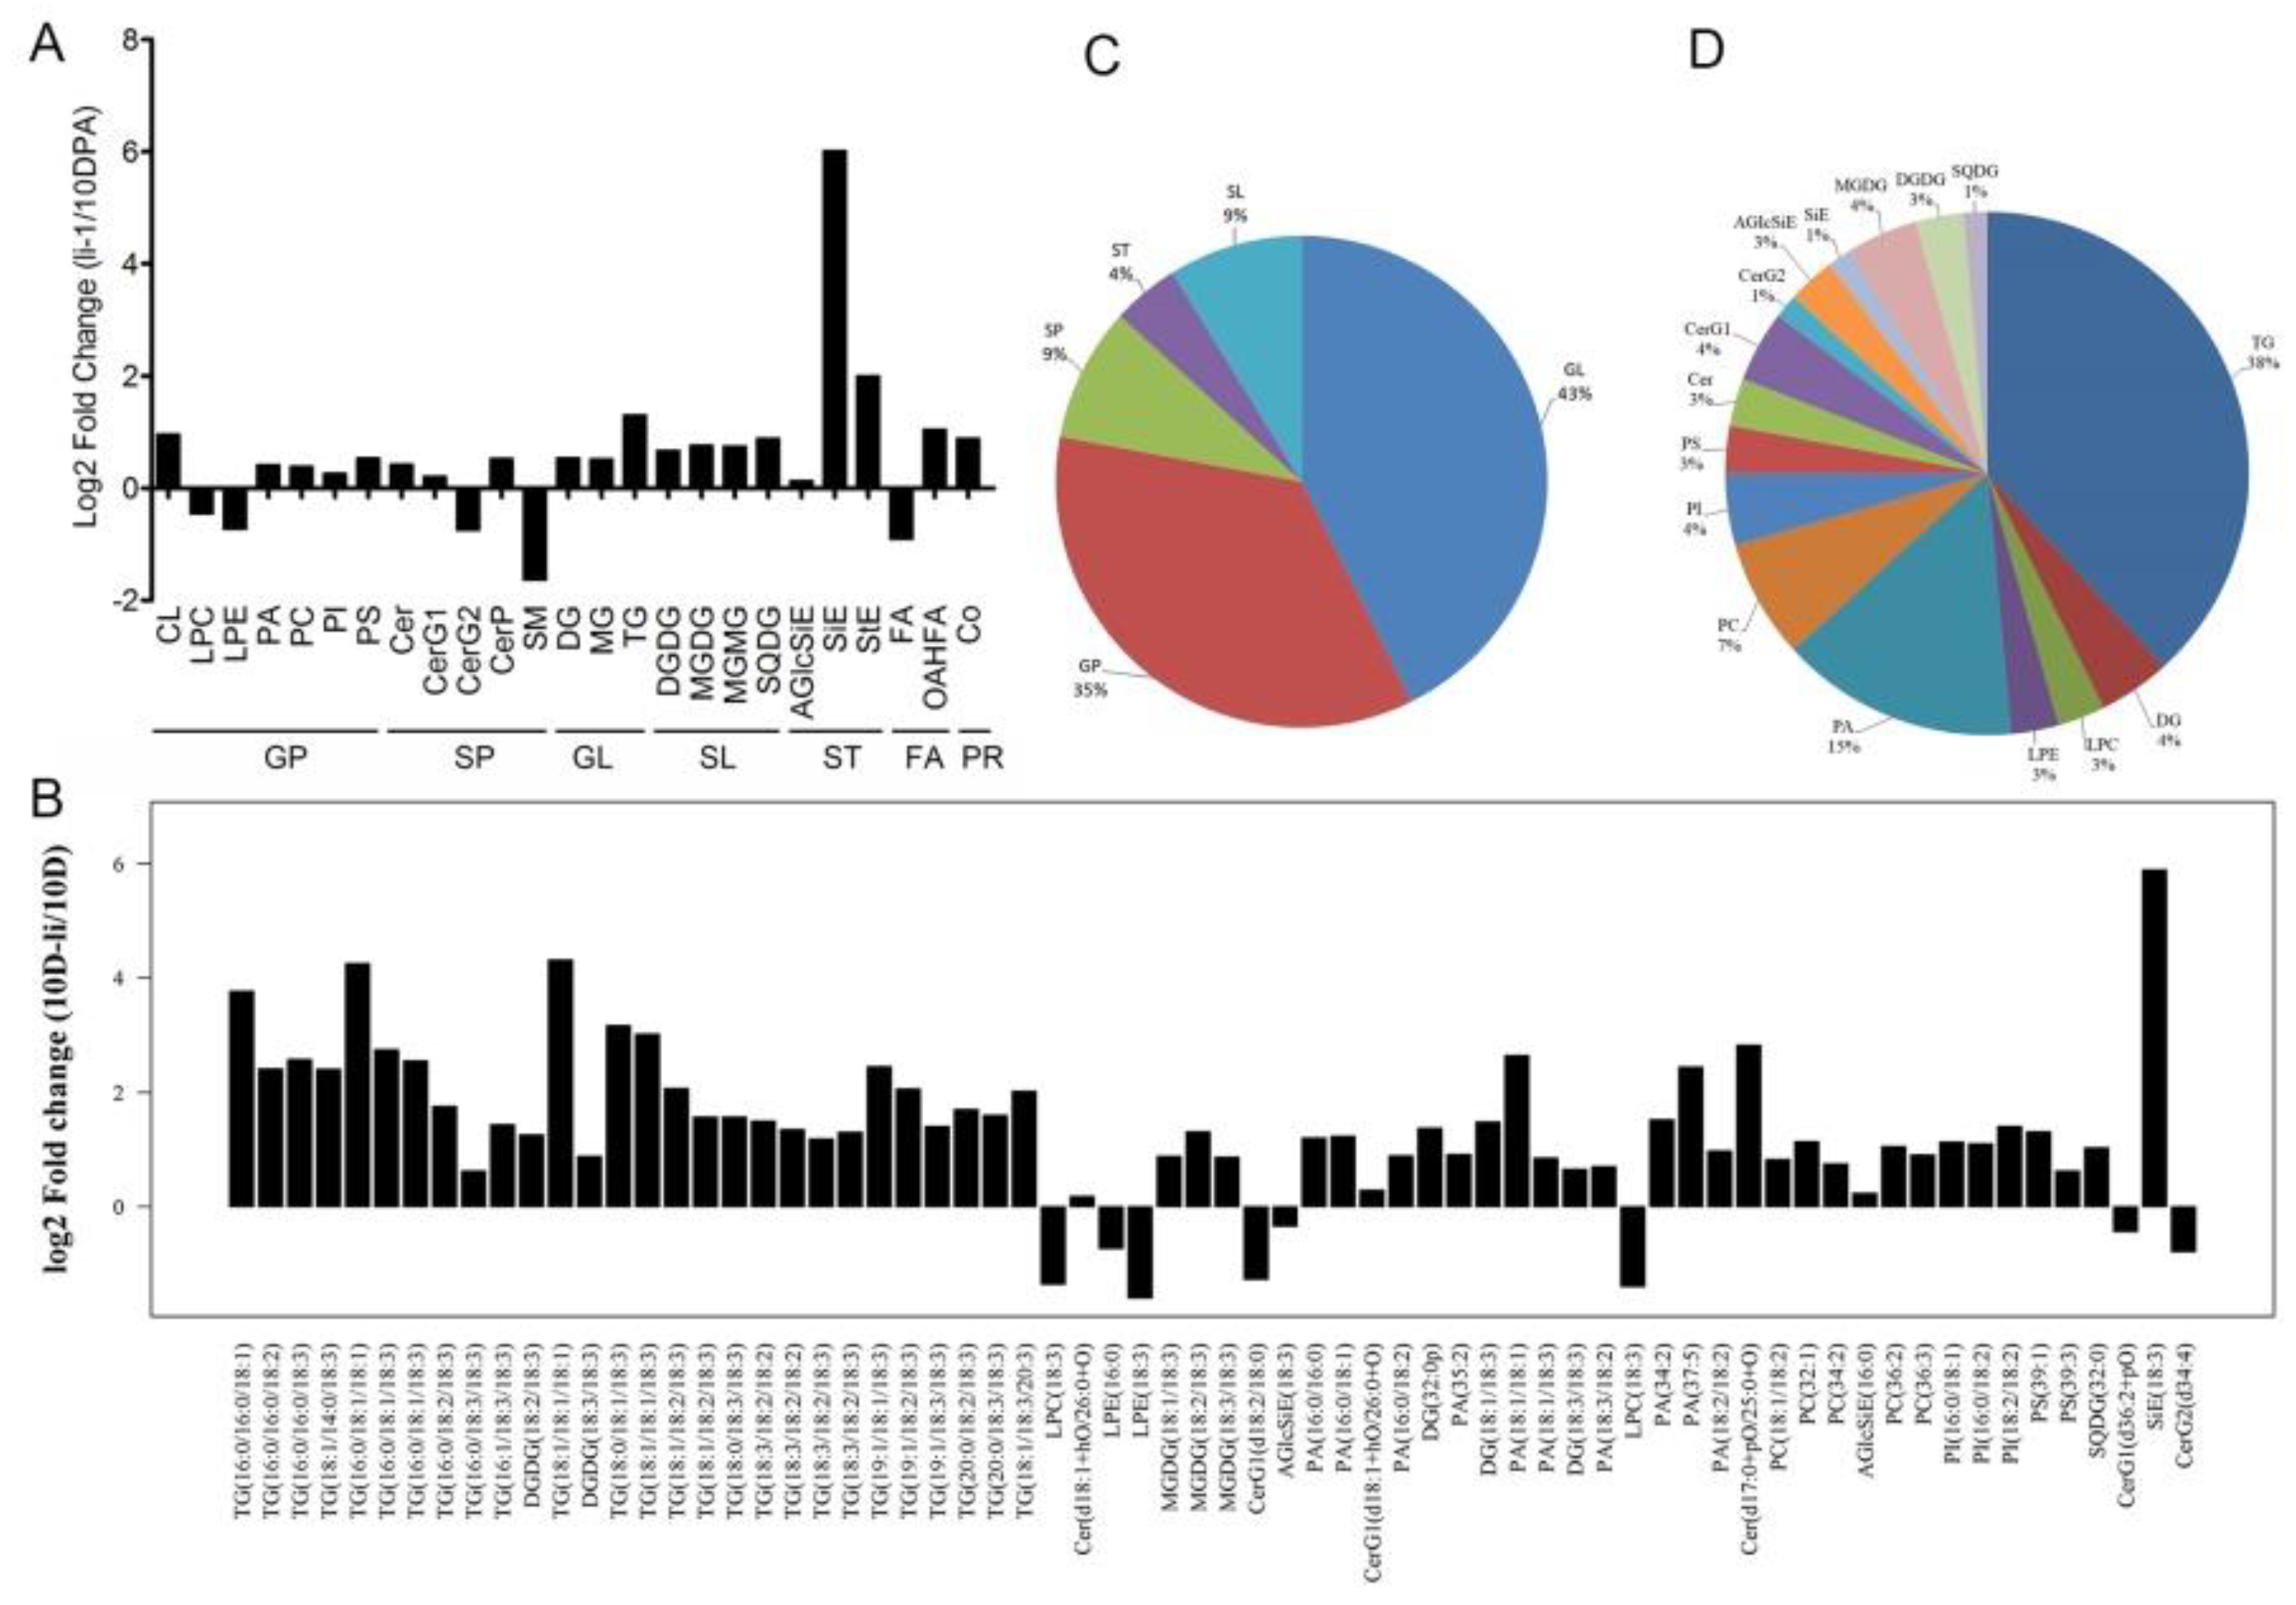
Figure 5.
Sphingolipid classes in cotton fiber cells and their alteration in li-1 mutant fiber cells compared with its wild type TM-1. (A) The number of classes and molecular species of sphingolipids detected in fiber cells of li-1 and TM-1. (B) The change percentage of sphingolipid content in li-1 fiber cells. (C) The change percentage of molecular species of t-S1P and Sph. (D) The change percentage of molecular species of Cer. (E) The change percentage of molecular species of Phyto-Cer. (F) The change percentage of molecular species of GIPC. (G) The change percentage of molecular species of PhytoCer-OHFA. (H) The change percentage of molecular species of GluCer. Cer, ceramides; PhytoCer, phytoceramides; PhytoCer-OHFA, phytoceramides with hydroxylated fatty acyls; S1P, sphingosine-1-phosphate; t-S1P, phytosphingosine-1-phosphate; Sph, sphingosines; PhytoSph, phytosphingosines; GluCer, glucosylceramides; Phyto-GluCer, phyto-glucosylceramides; GIPC, glycosyl-inositol-phospho-ceramides.
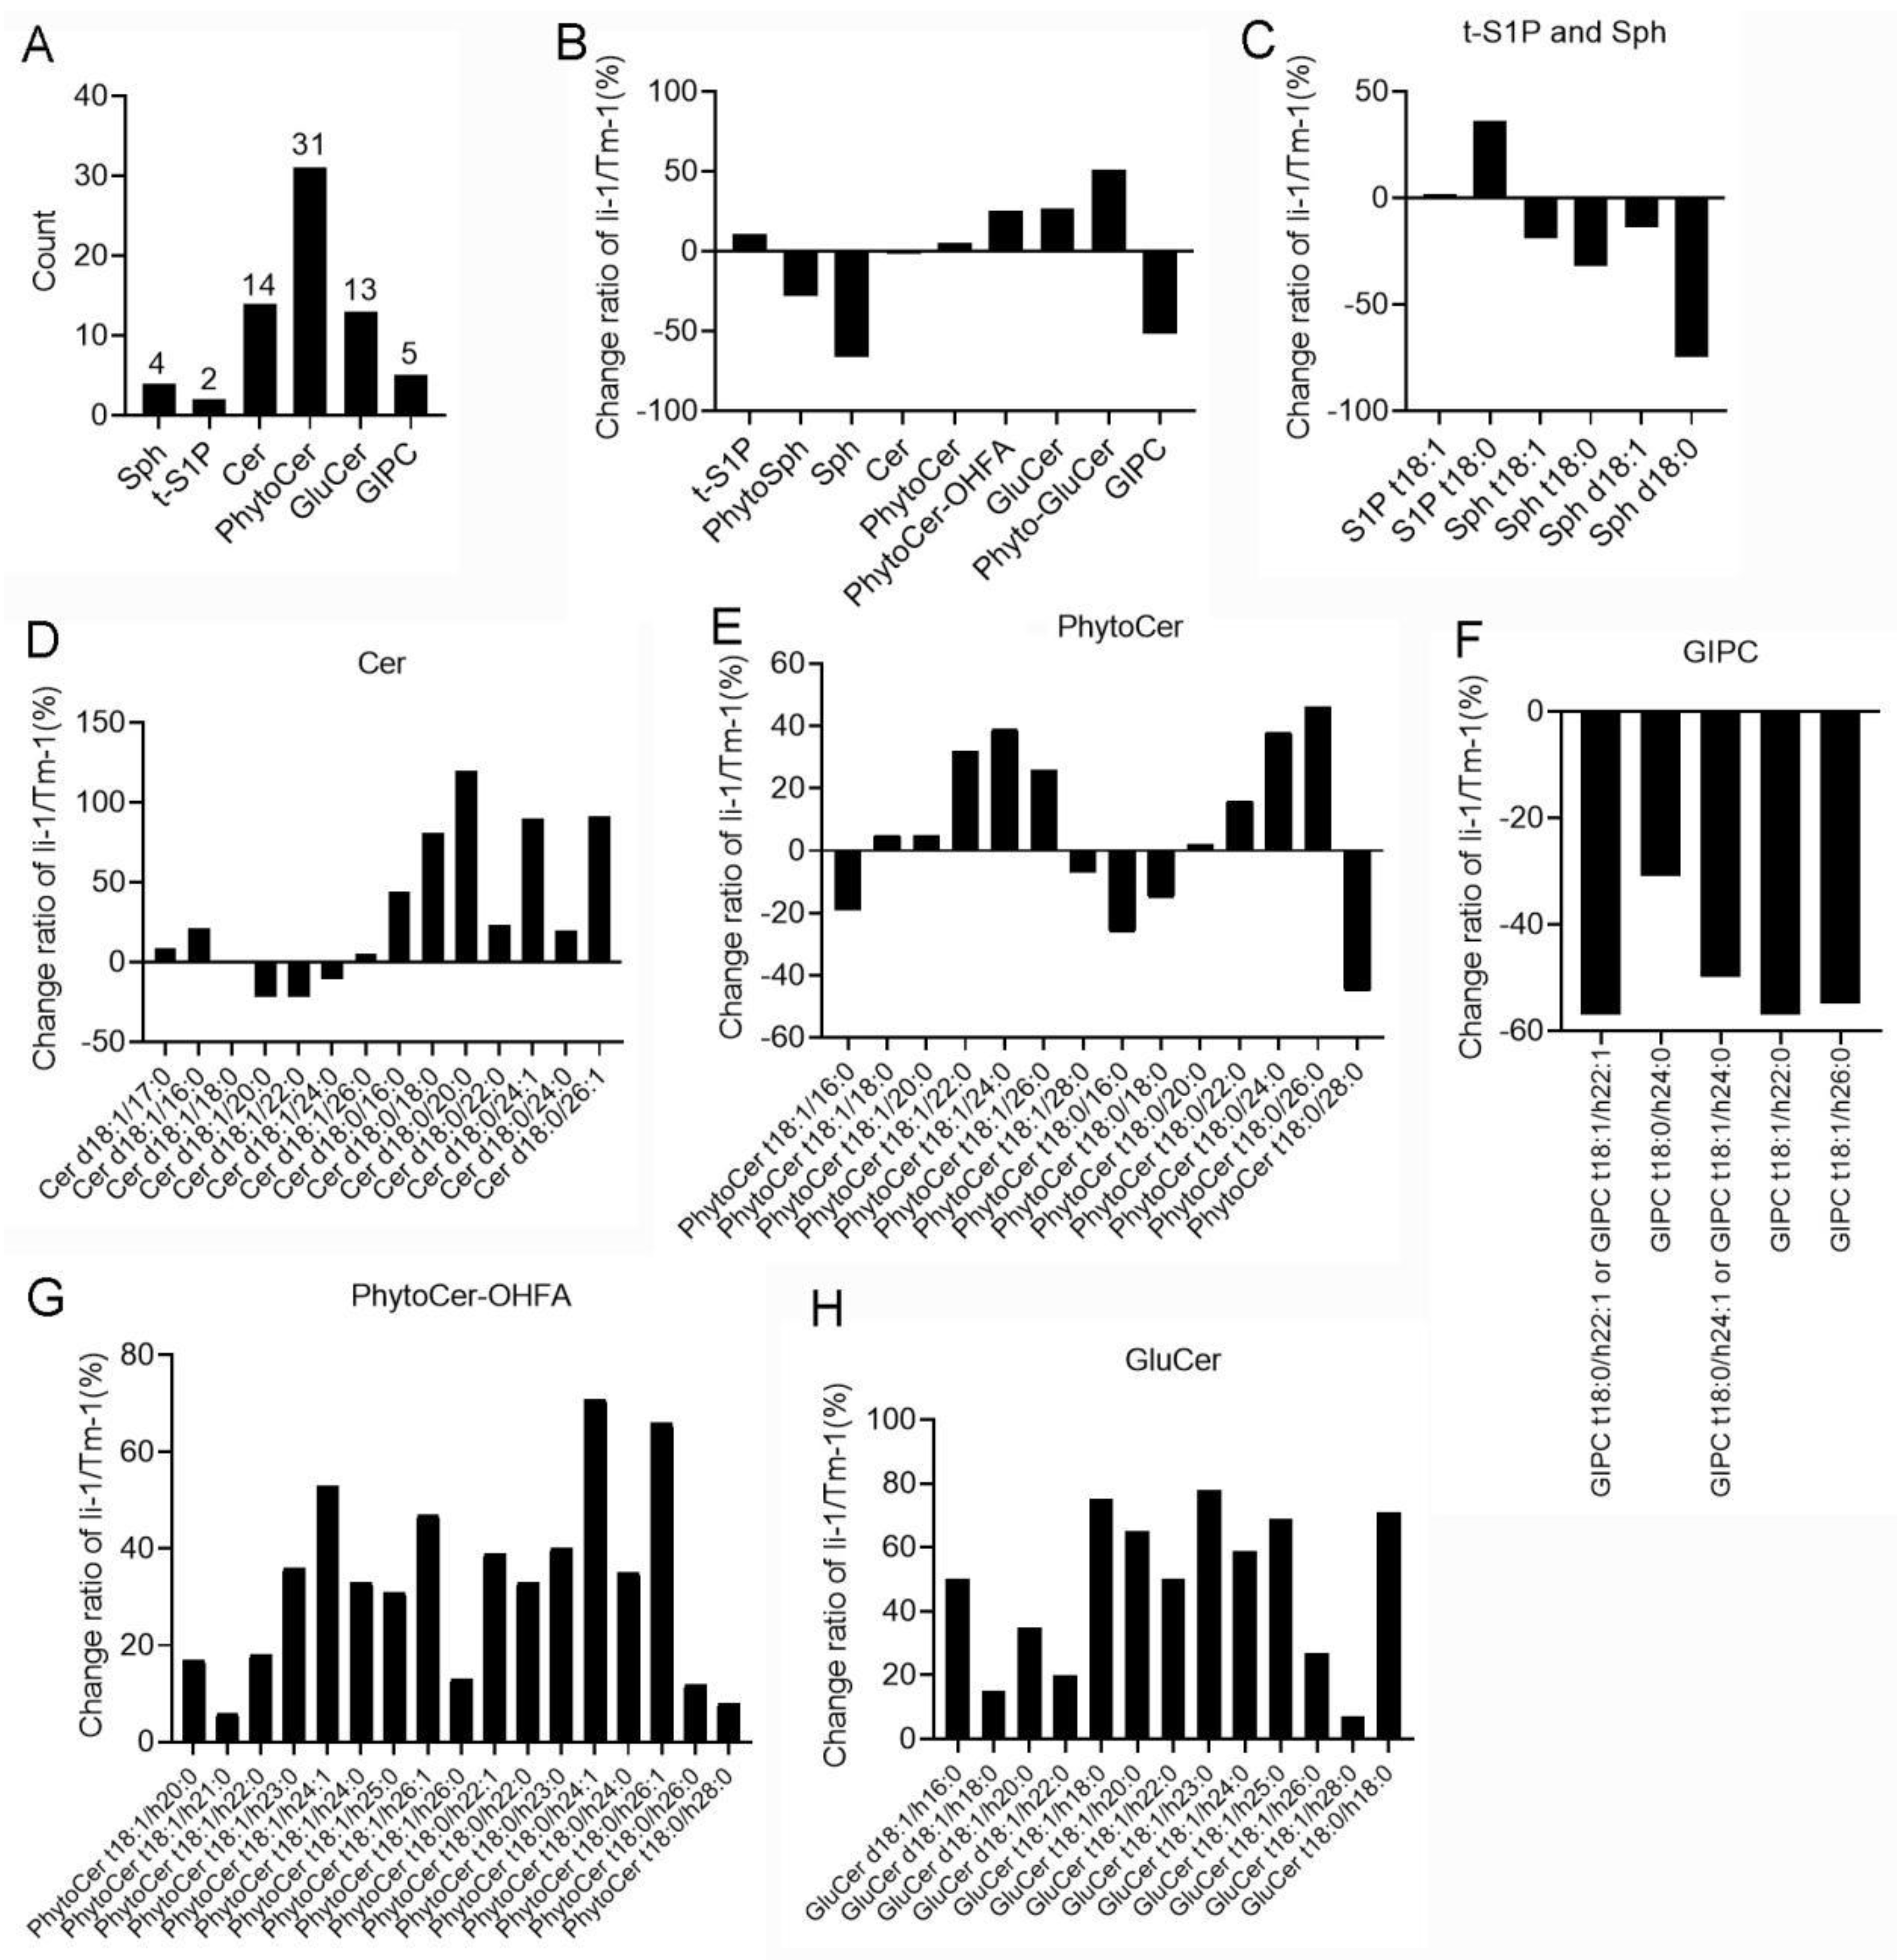
Figure 6.
The content changes of sterol and steryl ester in li-1 fiber cells.(A) The content changes of total sterol and various sterol classes in li-1 fiber cells. (B) The content changes of total steryl ester and two steryl esters in li-1 fiber cells. (C) The ratio of stigmasterol to sitosterol (St/Si) and campesterol to sitosterol (C/S) in 10-DPA fibers of mutant and wild type.
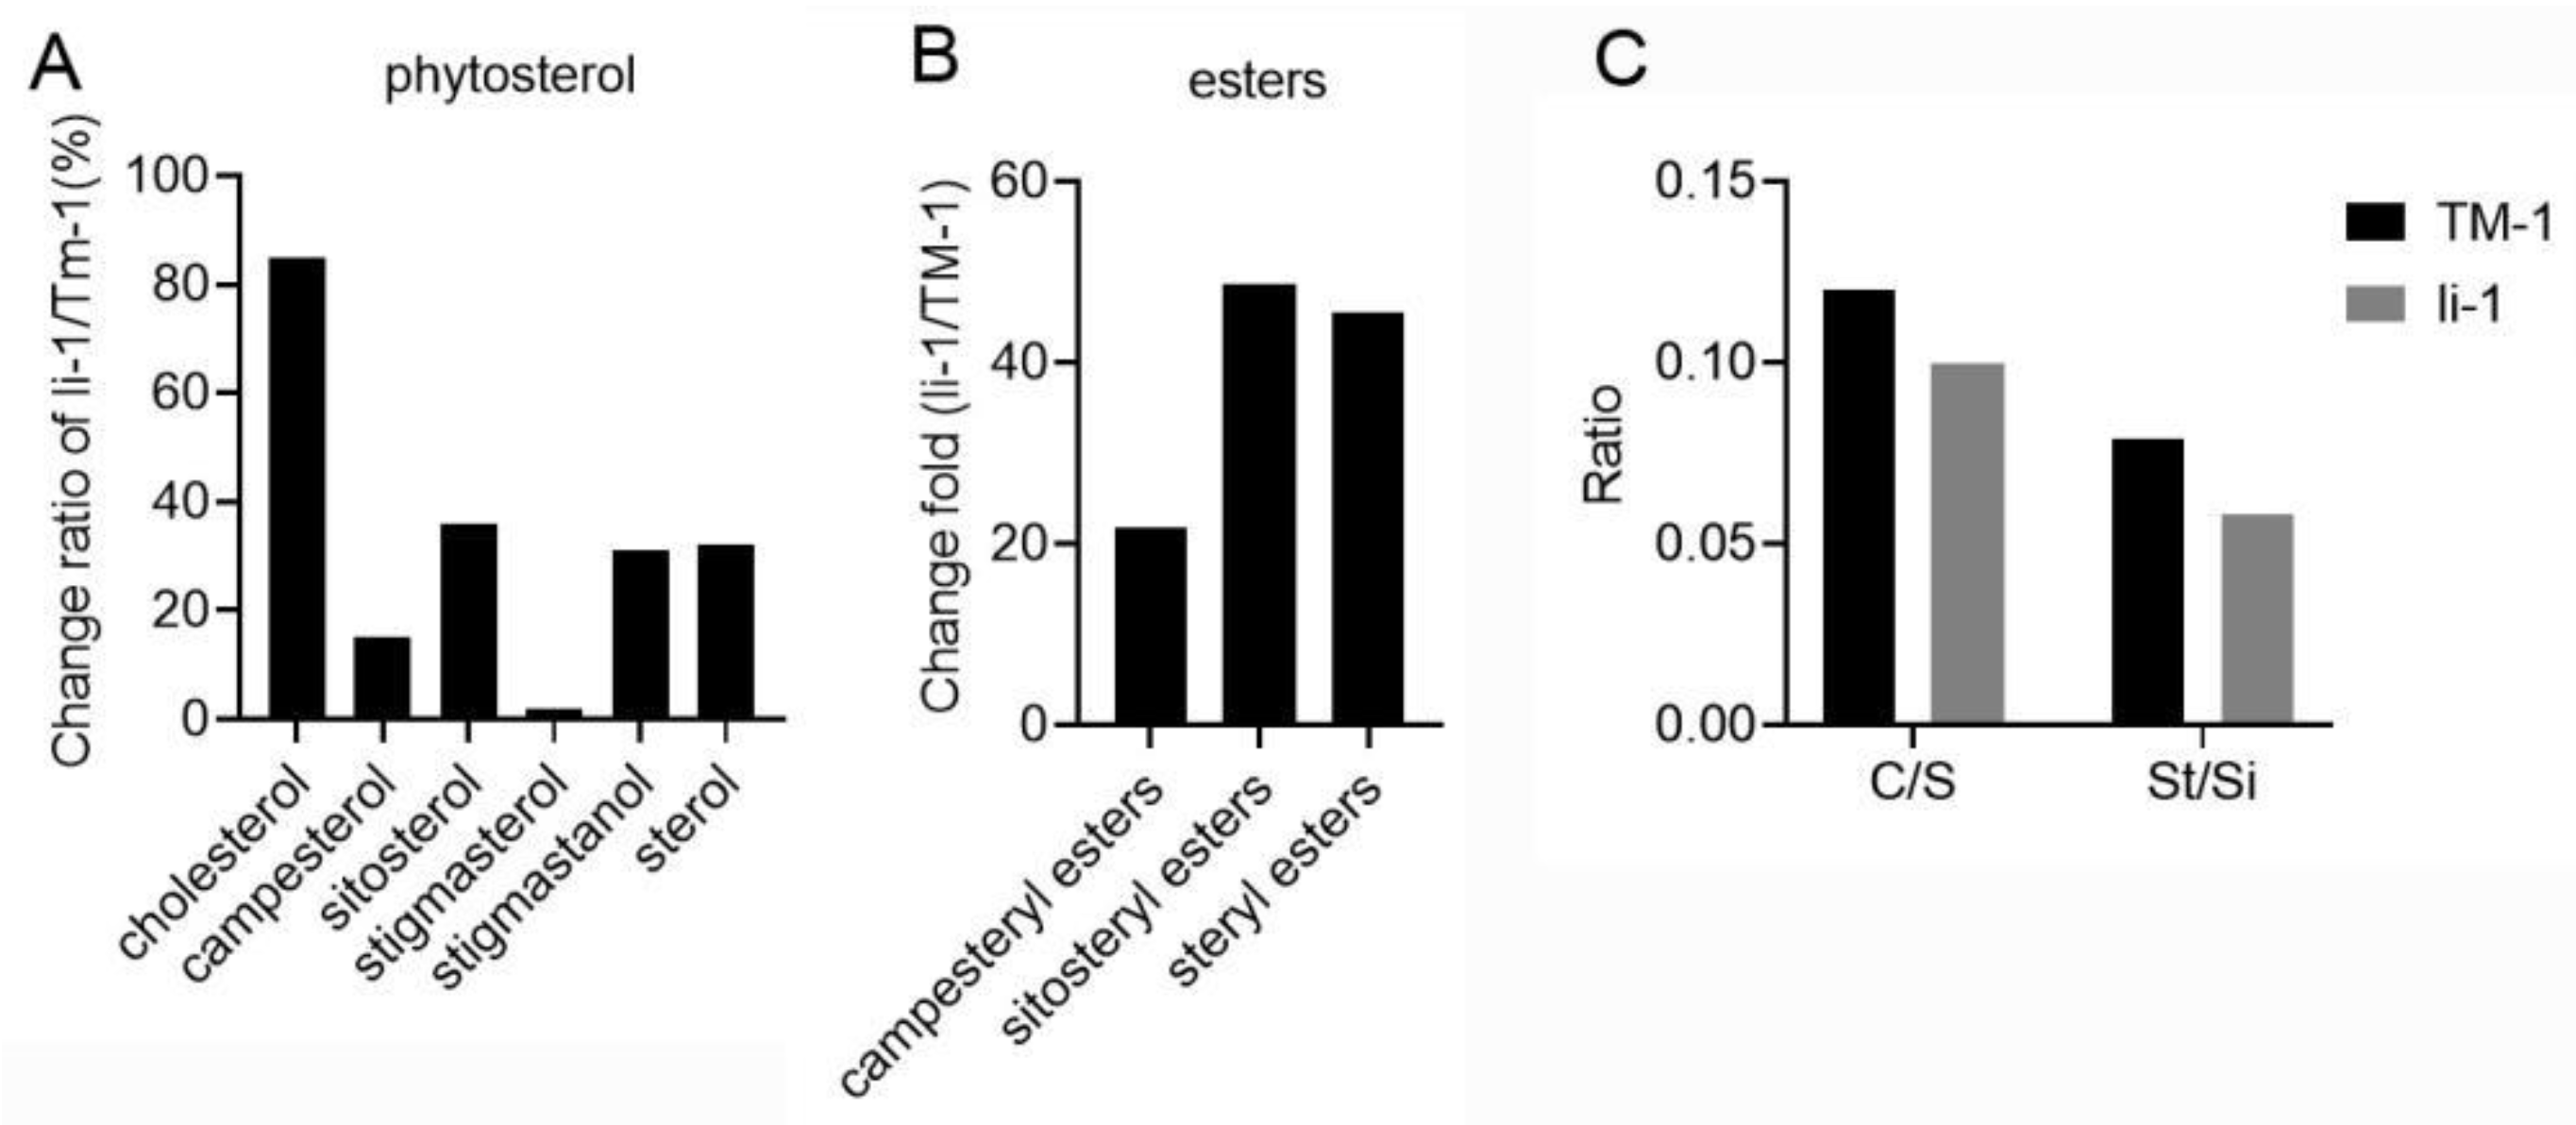
Figure 7.
GO annotations and KEGG enrichment analysis for the differentially expressed genes in 10-DPA fiber cell between li-1 mutant and TM-1 wild type.Red arrows indicated the pathway involved in lipid metabolism.
Figure 7.
GO annotations and KEGG enrichment analysis for the differentially expressed genes in 10-DPA fiber cell between li-1 mutant and TM-1 wild type.Red arrows indicated the pathway involved in lipid metabolism.
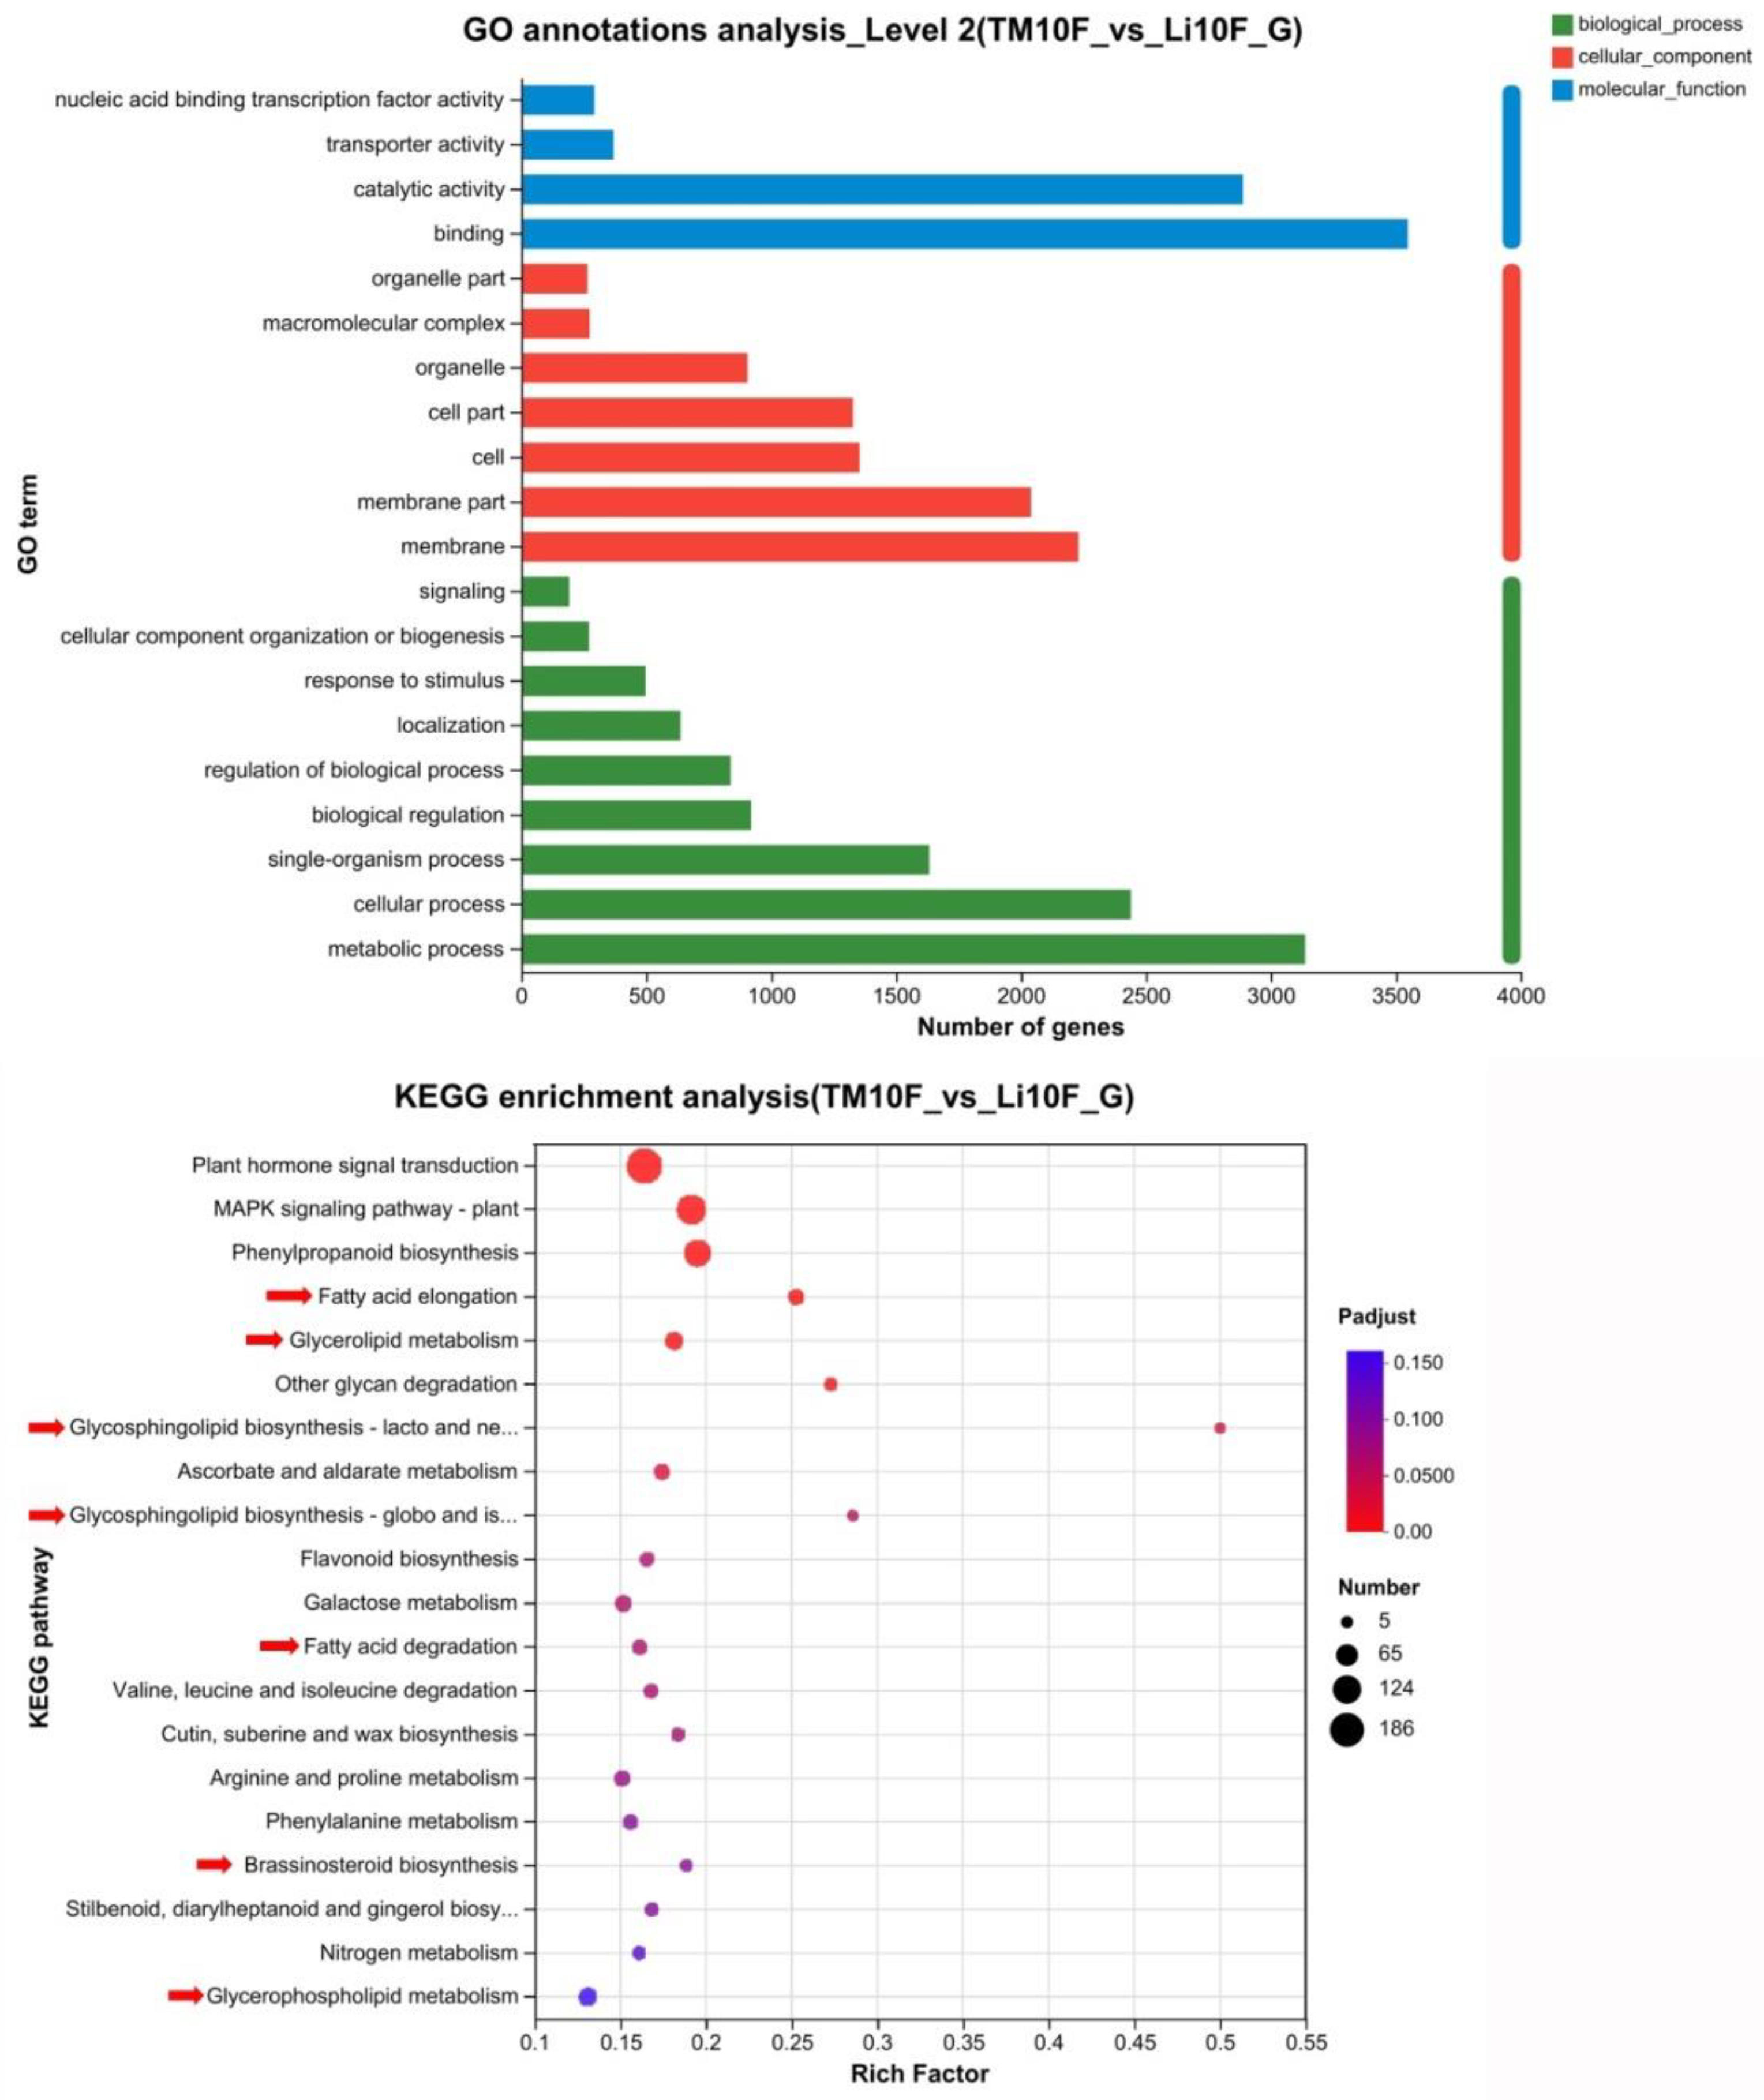
Figure 8.
The expression changes of selected genes in li-1 mutant fiber cells.Gh_D12G0217, LAG1 homologue 2; Gh_A07G0513, LAG1 longevity assurance homolog 3; Gh_D10G0211, Lactosylceramide 4-alpha-galactosyltransferase; Gh_A06G0144, phospholipase A 2A; Gh_A02G0884, GDSL-like Lipase/Acylhydrolase superfamily protein; Gh_D03G1074 and Gh_A05G3810, HXXXD-type acyl-transferase family protein; Gh_A08G1600, phospholipase D beta 1; Gh_A01G1605, alcohol dehydrogenase 1; Gh_D06G2376, 3-ketoacyl-CoA synthase 19. Error bars represent the SD for three independent experiments and asterisks indicate statistically significant differences between li-1 and TM-1 fiber cells, as determined by Student’s t-test (**, ρ < 0.01).
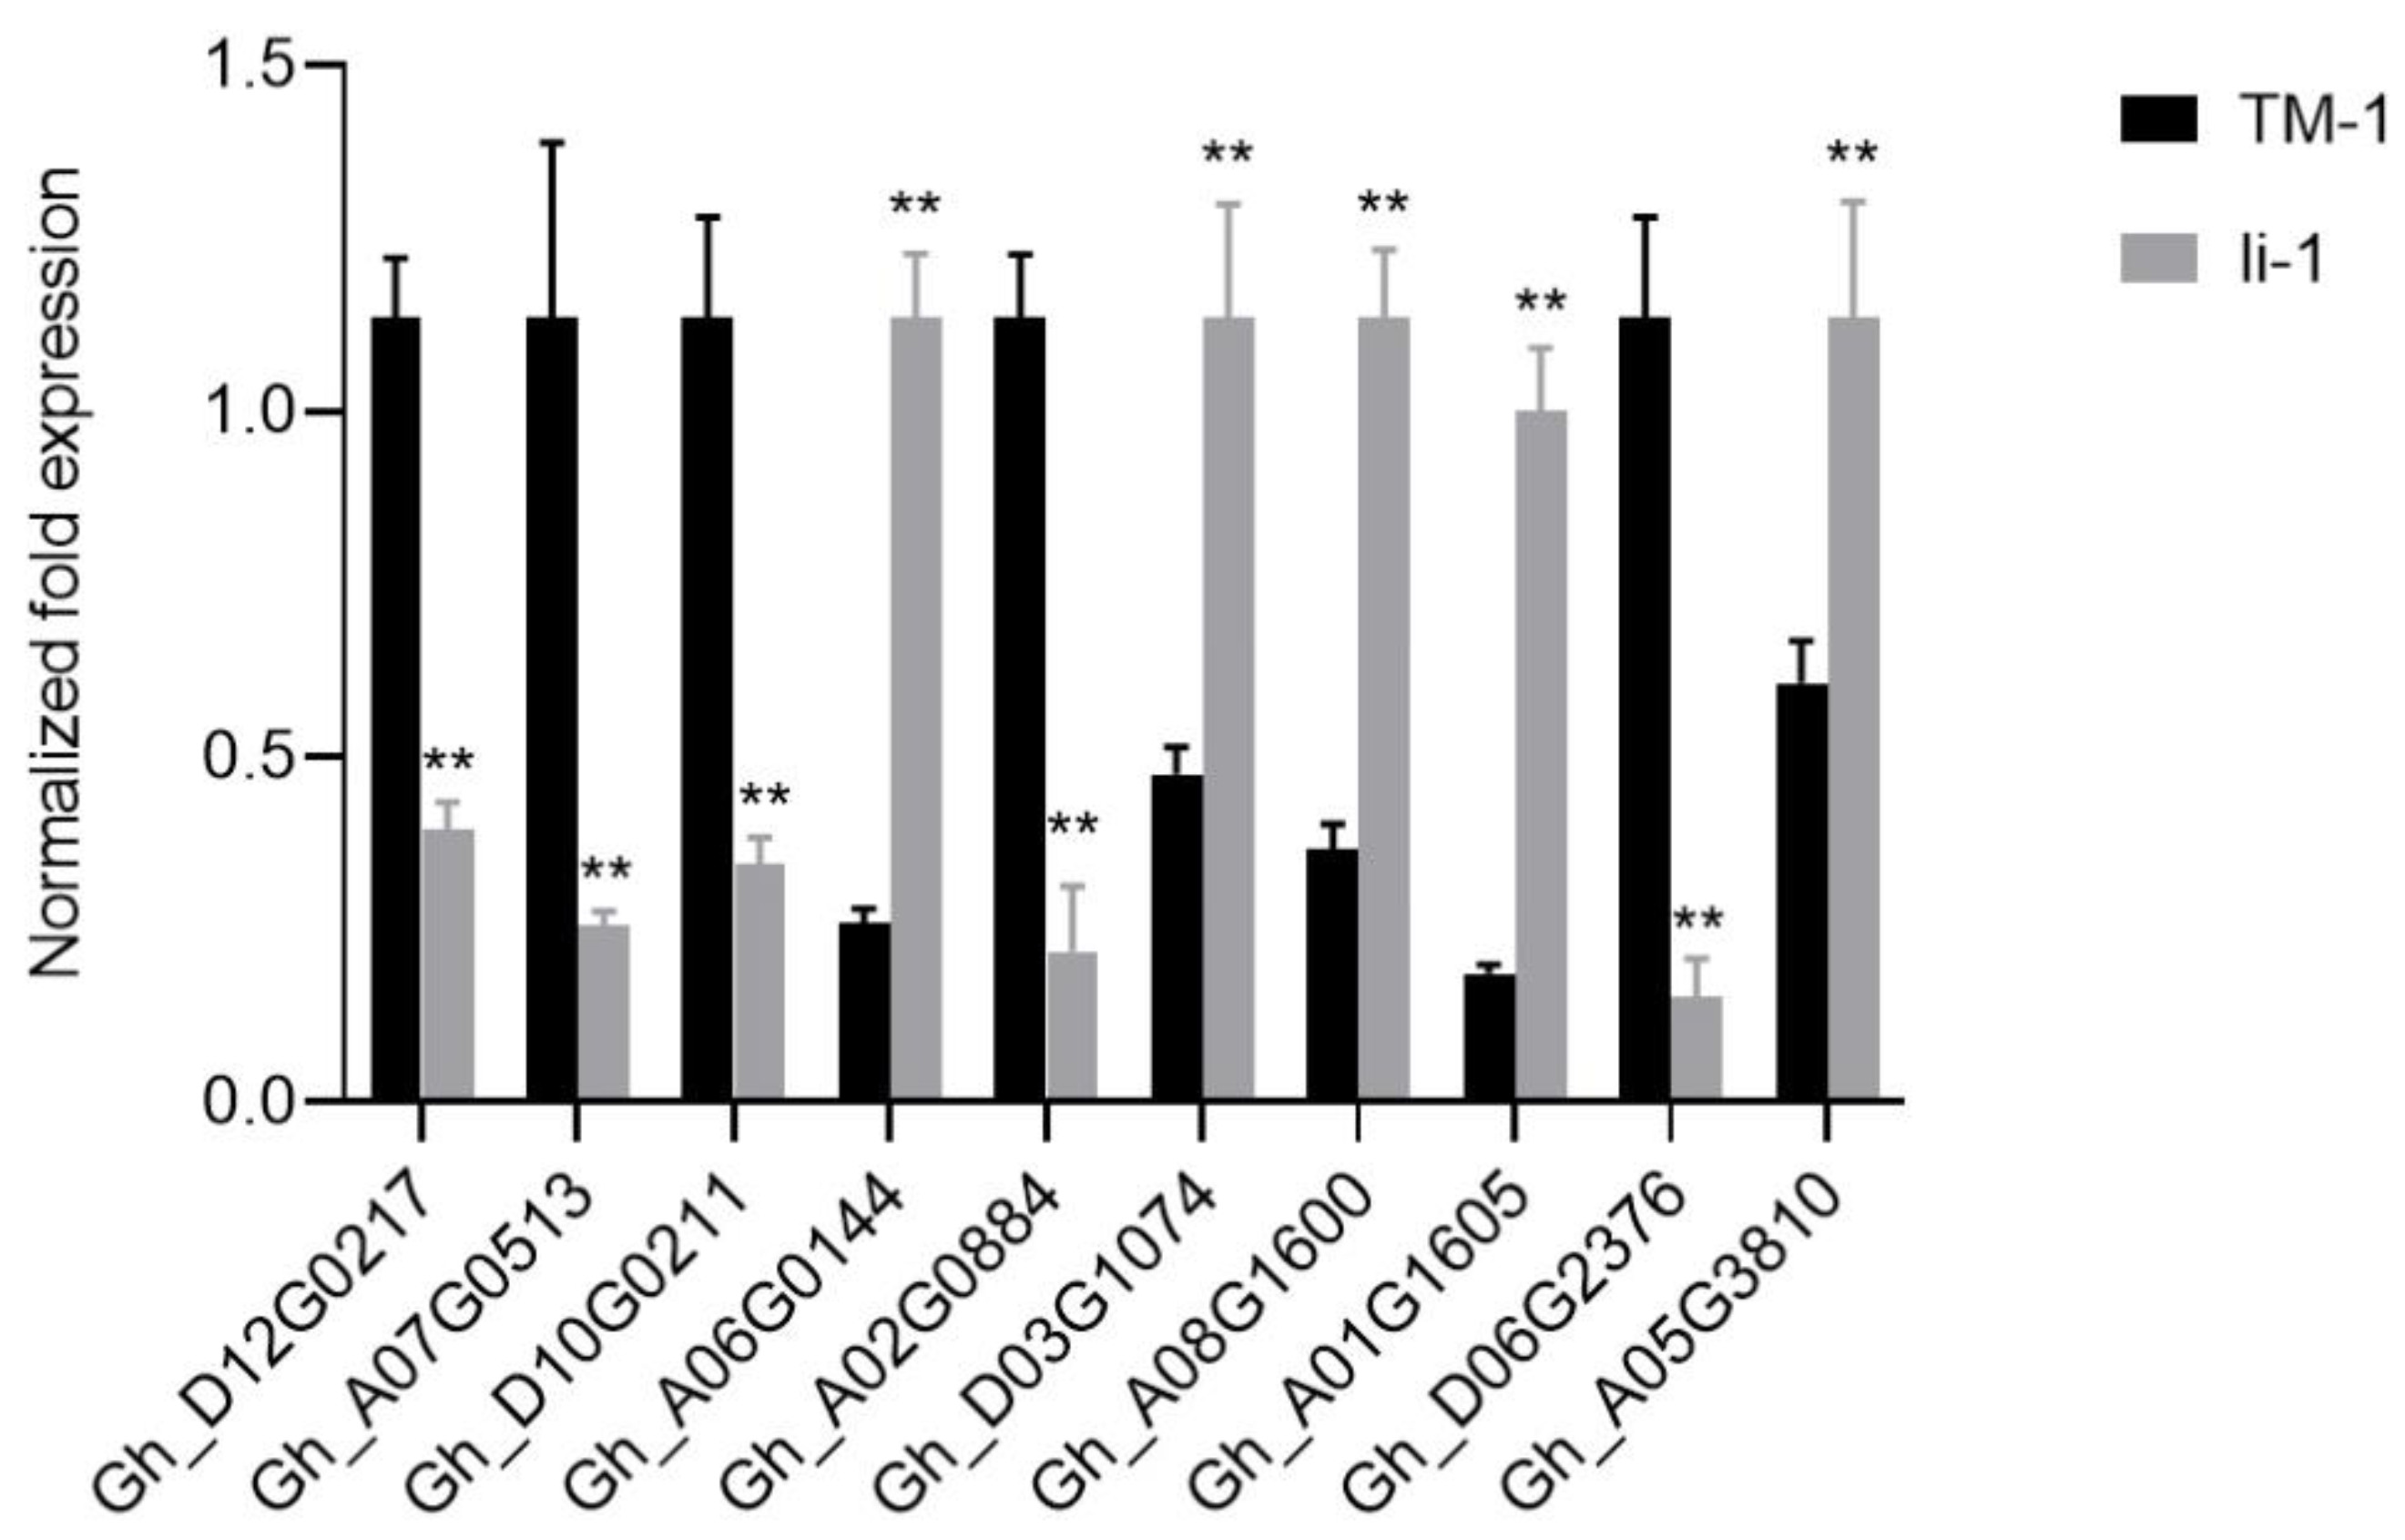
Figure 9.
Oil bodies in the leaf and fiber cell of TM-1 and li-1 mutantA.Oil bodies in the leaf of TM-1 and li-1 mutant; B, Oil bodies in the fiber cell of TM-1 and li-1 mutant. Li-1, li-1 mutant; TM-1, wild type; UV, ultraviolet light; BF, bright light.
Figure 9.
Oil bodies in the leaf and fiber cell of TM-1 and li-1 mutantA.Oil bodies in the leaf of TM-1 and li-1 mutant; B, Oil bodies in the fiber cell of TM-1 and li-1 mutant. Li-1, li-1 mutant; TM-1, wild type; UV, ultraviolet light; BF, bright light.
Disclaimer/Publisher’s Note: The statements, opinions and data contained in all publications are solely those of the individual author(s) and contributor(s) and not of MDPI and/or the editor(s). MDPI and/or the editor(s) disclaim responsibility for any injury to people or property resulting from any ideas, methods, instructions or products referred to in the content. |
© 2025 by the authors. Licensee MDPI, Basel, Switzerland. This article is an open access article distributed under the terms and conditions of the Creative Commons Attribution (CC BY) license (http://creativecommons.org/licenses/by/4.0/).
Copyright: This open access article is published under a Creative Commons CC BY 4.0 license, which permit the free download, distribution, and reuse, provided that the author and preprint are cited in any reuse.


