
Submitted:
12 December 2023
Posted:
12 December 2023
You are already at the latest version
Abstract
Sphingolipids are ubiquitous in eukaryotes and certain prokaryotes, where they serve as vital components of biological membranes and as bioactive molecules. Chloroplasts have complex membrane structures that play crucial roles in photosynthesis, but their specific sphingolipidome remains unreported. In this study, we used high-performance liquid chromatography-mass spectrometry (HPLC-MS/MS) to analyze the sphingolipidome of purified Arabidopsis thaliana chloroplasts. We detected 92 chloroplast sphingolipids. The chloroplast sphingolipidome differed from total leaf (TL) samples, having a higher content of free long-chain bases and hydroxyceramides, and a greater proportion of complex sphingolipids with 16C fatty acid (FA) forms. Notably, chloroplast glucosylceramides were predominantly the d18:1 h16:0 and t18:1 h16:0 forms, rather than the 24C FA form found in TL and other cellular structures. Comparing the sphingolipidomes of different cellular structures underscores the inhomogeneity of intracellular distribution of sphingolipids. This provides a robust reference for further elucidating the function of sphingolipids in plant cells.
Keywords:
Arabidopsis thaliana
; chloroplast
; sphingolipidome
; HPLC-MS/MS
1. Introduction
Sphingolipids are ubiquitous in eukaryotes and certain prokaryotes and are composed of long-chain base (LCB) and fatty acid (FA) chains [1,2]. They are essential constituents of biological membranes, where they maintain membrane structural integrity and biophysical properties [3,4]. Moreover, they serve as bioactive molecules, playing pivotal roles in plant growth, development, and responses to biotic and abiotic stresses. These functions include the regulation of cell death, organ development, resistance to abiotic stresses (salt, drought, and cold), defense against pathogens, and promotion of rhizobial symbiosis [5,6,7,8,9,10].
The structural diversity of sphingolipids results from variation in LCB species, FA chain lengths, hydroxylation, unsaturation, and modifications of the head group [11]. The LCB can be conjugated with FA chains and polar head groups to form complex sphingolipids. The common complex sphingolipids in plant cells include ceramide (Cer), hydroxyceramide (hCer), glucosylceramide (GlcCer), and glycosylinositolphosphoceramide (GIPC), with GIPC being the most abundant sphingolipid in plant cells [12].
The majority of enzymes involved in sphingolipid biosynthesis and metabolism localize in the endoplasmic reticulum (ER) and Golgi apparatus, and their products are subsequently transferred and transported to other cellular locations [13,14]. The advent of high-performance liquid chromatography-mass spectrometry (HPLC-MS/MS) technology has facilitated the high-resolution identification of plant sphingolipids [15]. Studies have provided detailed descriptions of the sphingolipidome at the level of the plant strain and organ, as well as the dynamic changes under varying conditions [16,17].
Sphingolipids are not uniformly distributed in cellular membrane systems [13]. However, our understanding of the sphingolipidome in various membrane-containing organelles of plants remains incomplete. Previous studies have reported that GlcCer and GIPC constitute 40% of the plasma membrane (PM) lipids [18,19], and sphingolipids account for approximately 20% of the lipids in ER and Golgi membranes, playing a crucial role in maintaining their morphology and function [20,21,22,23]. A recent study determined that the sphingolipid composition of vacuolar membranes (VM) differs from that of the PM, detergent-resistant membrane (DRM) and microsomal membrane (MIC), with a higher proportion of GlcCer rather than GIPC [24]. Additionally, the sphingolipid composition of plant mitochondria (Mito) has recently been reported to differ from that of other organelles and membrane systems [25]. These findings suggest that plant organelles have distinct sphingolipidomes.
Chloroplasts and their thylakoids constitute the most expansive membrane system in leaf mesophyll cell [26] and are abundant in lipids. Additionally, a rigorously regulated mechanism traffics lipids between the outer membrane of the chloroplast and the ER, underscoring the complexity and significance of lipid dynamics within plant cells [27]. However, the sphingolipidome of chloroplasts has yet to be reported. In this study, we delineate the sphingolipidome of chloroplasts in Arabidopsis using HPLC-MS/MS. We illuminate the unique characteristics of the sphingolipid composition within the chloroplast, and show that it can be distinguished from that of the total leaf or other organelles.
2. Results
2.1. Purification of chloroplast fractions
In this study, we characterized the sphingolipid composition of total leaf (TL) and chloroplast samples. The procedure for chloroplast isolation, which has been simplified for the purposes of this experiment, is depicted in Figure 1A. To assess the purity of the isolated chloroplast fraction, we employed immunoblotting assays using several marker proteins. These were: BRASSINOSTEROID INSENSITIVE 1-ASSOCIATED RECEPTOR KINASE 1 (BAK1) for the plasma membrane, luminal BINDING PROTEIN 2 (BIP2) for the endoplasmic reticulum (ER), Rubisco large subunit (RbcL) for the chloroplast, H(+)-ATPASE for the vacuole (V-ATPase), VOLTAGE-DEPENDENT ANION CHANNEL 1 (VDAC1) for the mitochondrion, and histone H3 for the nucleus. All these marker proteins were detectable in the TL samples. However, in the chloroplast samples, only RbcL was detected, and it was found to be enriched (Figure 1B). These findings suggest that the chloroplast samples used in this study were of high purity.
2.2. Overall assessment of sphingolipid profiles
The sphingolipid profiles, encompassing LCBs and complex sphingolipids (Cers, hCers, GlcCers, and GIPCs), were comprehensively analyzed using HPLC-MS/MS. To ensure the reliability of the results, components exhibiting irregular peak shapes or low peak values were deemed not detected. We identified 121 and 96 sphingolipid species in the TL and chloroplast samples, respectively (Figure 2C, Supplementary Table). Specifically, four LCB species (d18:0, d18:1, t18:0, and t18:1) were universally detected across all samples. In the chloroplast samples, 24 Cers, 28 hCers, 21 GlcCers, and 19 GIPC species were detected, and in the TL samples, 31 Cers, 35 hCers, 32 GlcCers, and 19 GIPC species were detected. Partial least squares-discriminant analysis (PLS-DA) indicated differences in the sphingolipidome in the two different sample types (Figure 2A).
2.3. Distribution of sphingolipid classes
The amounts of five sphingolipid classes (LCBs, Cers, hCers, GlcCers, and GIPCs) were expressed in terms of absolute content (per mg protein of chloroplasts and per g dry weight (DW) of leaves) and relative content (molecular percentage, mol %). In terms of absolute sphingolipid content, LCBs, Cers, hCers, and GlcCers in chloroplasts were present in similar amounts, ranging from 1.5 to 10 nmol/mg protein, while GIPCs were present in significantly higher amounts, of approximately 30 nmol/mg protein (Figure 3A). In total leaves, LCBs were the least abundant component (3 to 10 nmol/g DW), Cers and hCers ranged from 10 to 80 nmol/g DW, GlcCers were present at 40 to 50 nmol/g DW, and GIPCs were the most abundant at 230 to 330 nmol/g DW (Supplementary Table).
To assess the contribution of each sphingolipid class to the total content, we also calculated the relative content of each sphingolipid class. This revealed notable differences between chloroplast and TL samples (Figure 3B). GIPCs were overwhelmingly predominant in both chloroplast and TL samples, constituting about 60% to 80% of the total sphingolipid content. GlcCers were equally present in all samples at 10% to 14%. In TL samples, LCBs constituted only about 1% of the total content, while in chloroplast samples, they accounted for a larger proportion of about 10%. Similarly, the proportion of Cers and hCers in TL samples was low (3% to 5%), while in chloroplast samples, the proportion of hCers was about 11%. These findings suggest a different distribution of sphingolipid classes between chloroplasts and total leaf samples.
2.4. LCB and FA profiling of sphingolipids
In the case of free LCBs, all samples were predominantly composed of trihydroxylated forms (t18:0 and t18:1) as opposed to dihydroxylated forms (d18:0 and d18:1). The unsaturated LCBs (t18:1 and d18:1), which were desaturated at the C-8 position, were more abundant than their saturated counterparts. In chloroplast samples, t18:1 was overwhelmingly dominant, accounting for 70% to 90% of the total content in mol %. However, in TL samples, the proportion of t18:1 was approximately 40%, similar to that of t18:0 (Figure 2C and Supplementary Table).
To assess the specific composition of sphingolipids in complex sphingolipids (Cers, hCers, GlcCers, GIPCs), we considered four LCBs (t18:0, t18:1, d18:0, d18:1) and ten FAs with lengths ranging from 16-26C (16:0, 18:0, 20:0, 20:1, 22:0, 22:1, 24:0, 24:1, 26:0, 26:1) that differ in length, degree of unsaturation, and C2-hydroxylation. For the LCB composition of complex sphingolipids, the predominant form was trihydroxylated (t18) and unsaturated forms in both chloroplast and TL samples (Figure 4). However, when considering the proportion, chloroplast samples differed substantially from the TL samples. Specifically, the proportion of t18 forms was higher in chloroplast samples than in TL for Cer, hCer, and GIPC classes, but lower for the GlcCer class (Figure 4B). Concurrently, unsaturated forms were higher in chloroplast samples than in TL, especially in the GlcCer class (Figure 4C).
In terms of FA composition, all classes, with the exception of GlcCer in chloroplast samples, were predominantly composed of very long-chain fatty acids (VLCFAs) (20C, 22C, 24C, 26C) as opposed to long-chain fatty acids (LCFAs) (16C and 18C) (Figure 5B). Notably, Cer, hCer, and GlcCer in chloroplast samples were composed of a higher proportion of the 16C form than in TL, particularly GlcCer, which contained more than 50% of the 16C form and was the only sphingolipid class with a LCFA/VLCFA ratio greater than 1 (Figure 5B). Conversely, GIPC in chloroplasts contained a lower proportion of the 16C form, accompanied by a higher proportion of 24C and 26C forms than TL (Figure 5A and B). Calculating the ratio of unsaturated to saturated FA showed that all sphingolipid classes were dominated by unsaturated FA forms, but the proportion of saturated forms in GlcCer was significantly higher in chloroplast samples compared with TL (Figure 5C).
Collectively, LCB and FA compositions exhibited notable differences between chloroplast and TL samples, indicating that chloroplasts have a unique sphingolipid composition.
2.5. Predominant sphingolipid species
We detected a considerable number of sphingolipid species, but many of them were present in low abundance (Supplementary Table). To further scrutinize the potentially significant sphingolipid species, we classified those with a relative content exceeding 1% as abundant species. This classified a total of 49 species, including 16 species of Cers, 14 species of hCers, 9 species of GlcCers, and 14 species of GIPCs as abundant species (Figure 6).
Among the abundant Cer species, t18:1 c24:0 and t18:1 c26:0 were the most abundant in both chloroplast and TL samples, accounting for 40%~50% of the total (Figure 6A). For the hCer class, both sample types were overwhelmingly dominated by t18:1 h24:0 and t18:1 h24:1, constituting approximately 50% of the total, and a greater proportion of t18:1 h16:0 and d18:1 h16:0 were involved in chloroplast sphingolipid assembly (Figure 6B). GIPC was also dominated by t18:1 h24:0 and t18:1 h24:1 forms, with the proportion of t18:1 h24:0 form in chloroplasts being about 10% higher than that in TL (Figure 6D). Although the predominant species of the above three sphingolipid classes were consistent in chloroplasts and TL, the most abundant species of GlcCer showed a clear difference between chloroplast and TL samples. In TL, t18:1 h24:1 form was the predominant species, while in chloroplast samples, t18:0 h16:0 and d18:1 h16:0 forms were the predominant species (Figure 6C). This further underscores the specificity of chloroplast sphingolipid composition.
3. Discussion
This study presents the first detailed identification of the sphingolipid composition of Arabidopsis chloroplasts. Despite previous reports suggesting that sphingolipids in chloroplasts and mitochondria were undetectable or present at low levels, these components were successfully resolved through the use of high-purity chloroplast isolation and HPLC-MS. The sphingolipidome of total leaves (TL) identified in our study aligns with those reported in previous studies [15,28]. When compared with other reported sphingolipidome in plant tissues and cellular structures, the chloroplast exhibited commonalities and unique characteristics.
In terms of sphingolipid class distribution, GIPCs constituted the primary sphingolipid class in chloroplasts, accounting for approximately 60% of the total [23,24,25]. This is similar to observations for the plasma membrane (PM), detergent-resistant membrane (DRM), microsomal membrane (MIC), endoplasmic reticulum (ER), nuclei, and mitochondria (Mito). GIPCs have been previously reported to serve as crucial membrane anchors in plants for pathogen recognition [29], as well as in response to environmental stresses such as elevated levels under cold stress and assisting in Ca2+ influx under salt stress [30,31]. The structural complexity and predominance of GIPCs could align with the wide variety of membrane functions, although the exact functional role and mechanism of GIPCs in chloroplasts remain unknown. Moreover, the proportion of GIPCs in chloroplasts was lower than that in TL and similar to that reported in the PM, while there was a more pronounced presence of free LCB and hCer in chloroplast.
The precursor of LCB, acetyl coenzyme A (acyl-CoA), is synthesized in the chloroplast and subsequently moved to the ER to form LCB [32,33,34]. Robust lipid trafficking between the chloroplast and ER occurs within the endomembrane system [35], suggesting that the accumulation of free LCB in the chloroplast could function as a reservoir for sphingolipid biosynthesis. Notably, LCB has been reported to be a potent signaling molecule that influences phytohormone levels and plays pivotal roles in programmed cell death [36,37], hinting at a potential relationship between the accumulation of LCB in chloroplasts and the execution of these functions. As for hCer, their abundant presence in chloroplast could be attributed to their hydrophobic properties. It has been reported that the stratum corneum necessitates hCers to regulate water flow [38], and this property has been utilized in previous research to elucidate the accumulation of hCers in the vacuolar membranes (VM) [24], suggesting that the accumulation of hCers in chloroplasts may be driven by a similar mechanism.
For specific sphingolipid composition, the individual characteristics among TL and other cellular structures warrant further attention. To achieve this purpose, we have compared the results from previous studies [23,24,25] with our results for a comprehensive discussion (Table 1 and Table 2). It is noteworthy that all reported sphingolipid data are derived from HPLC-MS technology. To ensure consistency in comparison, the original data have been converted to relative content.
For Cer, the primary components remained consistent across the reported cellular structures, with t18:1 c24:0 and t18:1 c26:0 predominating, except for Mito where d18:1 c24:1 was the most abundant component (Table 2). Additionally, a higher presence of 16C forms (primarily d18:1 c16:0) was observed in MIC, VM, chloroplast, and PM compared to other sample types (Table 1).
For hCer, t18:1 h24:0/1 were the predominant forms across each cellular structure and in the TL, with Mito also exhibiting a higher presence of d18:1 h24:0 (Table 2). Interestingly, d18:1 h24:0 also appeared as an abundant fraction in the TL (Figure 6A), suggesting that this species could be significantly contributed by Mito. Additionally, the nuclei was characterized by a substantial accumulation of sphingolipid with t18:0 form and 26C form, distinguishing it from other structures (Table 1).
GlcCer and GIPC, the major intracellular sphingolipid classes, play a crucial role in maintaining membrane morphology and function, as reported in several studies [39,40]. For GlcCer, all cellular structures and TL were dominated by unsaturated LCB forms, accounting for up to 98% (Table 1). Concurrently, chloroplast, DRM, PM and VM exhibited a significant presence of C16 form GlcCer, as evidenced by the predominance of d18:1 h16:0 and t18:1 h16:0 (Table 2). Additionally, Mito was absolutely dominated by d18:1 h24:1 with percentage of 66% (Supplemental data), and GlcCer with 24C and 26C forms account for more than 85% in Mito and nuclei . For GIPC, all cellular structures were dominated by the t18:1 24:0/1 forms of GIPC, and Mito contained almost exclusively 24C and 26C forms (Table 1).
Previous reports have indicated that very long-chain fatty acids (VLCFA) (including 24C and 26C) are the primary sphingolipid components and play a crucial role in plant growth and development [41,42]. However, the results presented above suggest that internal cellular structures such as the PM, chloroplast, and VM exhibit a significant propensity to accumulate sphingolipids with 16C forms. Previous in vitro studies have discovered that the connections between VLCFA ceramides exhibit stronger interactions, facilitating the establishment of stable and complex biological systems. In contrast, the shorter 16C fatty acids are mostly phase-separated [43]. Therefore, the accumulation of the 16C form in the PM, chloroplasts chloroplast, and VM could potentially be associated with the motility of the endomembrane system and the intricate metabolic processes. Interestingly, the sphingolipid composition of Mito appears to be unusual in that it contains a large number of complex sphingolipids in the form of d18:1 and 24C, and sphingolipid with d18:2 form and 28C form were identified in Mito, but not detected in chloroplast or in other reported cellular structures. Historically, d18:2 has only been found in the pollen and flowers of Arabidopsis [44]. It remains unclear whether these components are related to the specific function of Mito. These findings further suggest that the distribution of sphingolipids is asymmetrical and uneven in plant cell, and whether this distinction in sphingolipid class and species correlates with organelle-specific functions warrants further exploration.
Furthermore, it should be noted that in this study, the entire chloroplast was extracted without distinguishing specific structures such as the inner membrane, outer membrane, thylakoids, and stroma. Therefore, the distribution of sphingolipids within each part of the chloroplast remains unknown.
In conclusion, our study pioneers the examination of the sphingolipidome of plant chloroplasts, thereby enhancing the sphingolipid profile of plant organelles and providing a robust reference for comprehending the spatial distribution and functional roles of sphingolipids across different cellular structures. Simultaneously, gaining insights into the sphingolipid composition of chloroplasts, which constitute a significant pool of organic carbon sources in plants, is of paramount importance for a profound understanding of chloroplast functions.
4. Materials and Methods
4.1. Plants and growth conditions
Arabidopsis thaliana wild-type (Columbia, Col-0) seeds were sterilized with chlorine for 1h and then spread on ½ MS medium. After 3 d of stratification at 4℃, the seeds were grown at 22℃ under a 16 h light/ 8 h dark cycle with 4800 to 6000 lux light intensity for 1 week before planting in soil mixture (Mix peat soil and vermiculite in 3:1, v:v). All the leaves were harvested at 4-week-old. Some leaves were used for chloroplast isolation immediately, and others were lyophilized and then stored at -80℃ as total leaf samples for sphingolipid extraction. In our experiment, three independent biological replicates were collected.
4.2. Chloroplast isolation
In order to isolate chloroplasts, the protoplasts were prepared firstly. 4-week-old Arabidopsis leaves were harvested and chopped into 20 mL enzyme solution [1.5% cellulase “Onozuka” R-10 (210824-01, Yakult, Japan), 0.4% macerozyme R-10 (110830-01, Yakult, Japan), 0.4 M mannitol, 20 mM KCl, 10 mM CaCl2, 0.1% BSA and 20 mM MES, pH 5.7]. The leaves were gently shaken in dark for 3 to 4 h until the protoplasts were released into the solution. The protoplasts were collected through 40 μm filter and centrifugated at 800 rpm for 3 min.
The protoplasts were resuspended with chloroplasts isolation buffer (CIB, 1×) [0.3 M sorbitol, 5 mM MgCl2, 5 mM EGTA, 5 mM EDTA, 10 mM NaHCO3, 20 Mm HEPES, pH 8.0] and chloroplasts were isolated by Percoll gradient as described previously, with minor modifications [45]. Briefly, two rounds of homogenization were completed by washing the precipitation on ice with 1× CIB solution. The protoplasts were broken and chloroplasts released during the homogenization. Transfer the homogenate onto the top of the premade continuous Percoll gradient. To separate intact chloroplasts from broken chloroplasts and other debris, the homogenate loaded Percoll gradient was centrifuged in a swinging-bucket rotor at 7800 ×g for 10 min with the brake off at 4°C. Two green bands were visible in the gradient: the lower green band contains intact chloroplasts, whereas the upper band contains broken chloroplasts. The lower green band was collected and washed by HMS buffer (50 mM HEPES, 3 mM MgSO4, 0.3 M sorbitol, pH 8.0), then stored at -80℃ till further analysis. All experimental operations were performed on ice, using cut 1 mL pipette tips. The resulting chloroplasts of each biological replicate was equally divided into three parts, one for protein quantification, one for sphingolipid (LCBs, Cers, hCers and GlcCers) analysis, and one for GIPCs analysis.
4.3. Protein quantification and immunoblotting assays
Total protein of chloroplast sample was determined by Coomassie Protein Assay Regent (WJ337105, Thermo Fisher Scientific, USA). BSA was employed as a standard. The purity of the isolated chloroplasts were detected by immunoblotting using organelle-specific marker antibodies as follows: BAK1 (plasma marker, AS12 1858, Agrisera AB, Sweden); BIP2 (ER marker, AS09 481, Agrisera AB, Sweden); RbcL (chloroplast marker, AS08 325, Agrisera AB, Sweden); V-ATPase (vacuole marker, AS07 213, Agrisera AB, Sweden); VADC1 (mitochondrionl marker, AS07 212, Agrisera AB, Sweden); Histone H3 (nuclear marker, AS10 710, Agrisera AB, Sweden).
4.4. Sphingolipid analysis
Samples for sphingolipid analysis were prepared and the components of sphingolipids were determined by HPLC-MS/MS as described previously [46,47]. Briefly, chloroplast samples or 300 mg of lyophilized leaves samples was homogenized. The internal standards (C17 base d-erythro-sphingosine and C12-Ceramide) were added and extracted with the isopropanol/hexane/water (55:20:25, v/v/v). After incubation at 60°C for 10 min, the supernatants were dried by nitrogen. For GIPCs detection, the dried extract was de-esterified by dissolving in 2 mL of 33% methylamine solution in ethanol/water (7:3, v/v) and incubated at 50°C for 1 h. After being dried with nitrogen, the samples were dissolved in 200 μL of methanol.
For LCBs, Cers, hCers and GlcCers, sphingolipid detection was performed using a high-performance liquid chromatography (AB SCIEX ExionLC AD, USA) coupled with a triple quadrupole mass spectrometer (AB SCIEX 4500, USA). For GIPCs, detection was performed using a high-performance liquid chromatography (Agilent 1200SL, USA) coupled to a triple quadrupole mass spectrometer (Agilent 6410, USA). Samples were analyzed using a 2.0 mm × 150 mm Luna 3 µm column (Phenomenex, USA) for C8 separation. Notably, Each biological replicate was injected for three times as three technical replicates. The raw data were collected and processed using the SCIEX OS and Agilent Masshunter quantitative analysis software.
4.5. Data analysis
Partial Least Squares Discriminant Analysis (PLS-DA) was constructed by Wekemo Bioincloud (https://www.bioincloud.tech/). Heatmaps and bubble plots of sphingolipid components were performed by R package “pheatmap” and “gglot2”. Two-tailed Student’s t tests were used to evaluate statistically significant differences between two groups (*P<0.05, **P<0.01, ***P<0.001).
Supplementary Materials
The following supporting information can be downloaded at the website of this paper posted on Preprints.org. Supplementary Table: Sphingolipid profile of 160 sphingolipid species identified in TL and Chl samples.
Author Contributions
Conceptualization, N.Y., C.Y. and L.-Y.W.; methodology, L.-Y.W. and C.Y.; experiment, C.Y., L.-Y.W. and J.-T.L.; data analysis, C.Y., Y.-K.L. and D.-K.C.; writing, C.Y. and N.Y. All authors have read and agreed to the published version of the manuscript.
Funding
This work was supported by the National Natural Science Foundation of China (32070196), and the Natural Science Foundation of Guangdong Province (2023A1515012051).
Data Availability Statement
All the pertinent data can be located in the article or Supplementary Table. All other data in support of the results of this study are available at reasonable request from the corresponding author.
Conflicts of Interest
The authors declare no conflict of interest.
References
- Heaver, S.L.; Johnson, E.L.; Ley, R.E. Sphingolipids in host-microbial interactions. Curr. Opin. Microbiol, 2018, 43, 92-99. [CrossRef]
- Sperling, P.; Heinz, E. Plant sphingolipids: structural diversity, biosynthesis, first genes and functions. Biochim Biophys Acta, 2003, 1632, 1-15. [CrossRef]
- Grison, M.S.; Brocard, L.; Fouillen, L.; Nicolas, W.; Wewer, V.; Dörmann, P.; Nacir, H.; Benitez-Alfonso, Y.; Claverol, S.; Germain, V.; et al. Specific membrane lipid composition is important for plasmodesmata function in Arabidopsis. Plant Cell, 2015, 27, 1228-1250. [CrossRef]
- Simons, K.; van Meer, G. Lipid sorting in epithelial cells. Biochemistry, 1988, 27, 6197-6202. [CrossRef]
- Abbas, H.K.; Tanaka, T.; Duke, S.O.; Porter, J.K.; Wray, E.M.; Hodges, L.; Sessions, A.E.; Wang, E.; Merrill, A.H.; Jr; et al. Fumonisin-and AAL-toxin-induced disruption of sphingolipid metabolism with accumulation of free sphingoid bases. Plant Physiology (Rockville) , 1994, 106, 1085-1093. [CrossRef]
- Ng, C.K.; Carr, K.; Mcainsh, M.R.; Powell, B.; Hetherington, A.M. Drought-induced guard cell signal transduction involves sphingosine-1-phosphate. Nature, 2001, 410, 596-599. [CrossRef]
- Msanne, J.; Chen, M.; Luttgeharm, K.D.; Bradley, A.M.; Mays, E.S.; Paper, J.M.; Boyle, D.L.; Cahoon, R.E.; Schrick, K.; Cahoon, E.B. Glucosylceramides are critical for cell-type differentiation and organogenesis, but not for cell viability in Arabidopsis. Plant J., 2015, 84, 188-201. [CrossRef]
- Liao, P.; Huang, J.; Tong, P.; Nie, W.; Yan, X.; Feng, Y.; Peng, H.; Peng, X.; Li, S. Characterization and expression analysis of inositolphosphorylceramide synthase family genes in rice (Oryza sativa L.). Genes Genom. 2017, 39, 485-492. [CrossRef]
- Liu, N.J.; Zhang, T.; Liu, Z.H.; Chen, X.; Guo, H.S.; Ju, B.H.; Zhang, Y.Y.; Li, G.Z.; Zhou, Q.H.; Qin, Y.M.; et al. Phytosphinganine Affects Plasmodesmata Permeability via Facilitating PDLP5-Stimulated Callose Accumulation in Arabidopsis. Mol. Plant., 2020, 13, 128-143. [CrossRef]
- Moore, W.M.; Chan, C.; Ishikawa, T.; Rennie, E.A.; Wipf, H.M.; Benites, V.; Kawai-Yamada, M.; Mortimer, J.C.; Scheller, H.V. Reprogramming sphingolipid glycosylation is required for endosymbiont persistence in Medicago truncatula. Curr. Biol., 2021, 31, 2374-2385. [CrossRef]
- Sperling, P.; Heinz, E. Plant sphingolipids: structural diversity, biosynthesis, first genes and functions. Biochim. Biophys. Acta Mol. Cell Biol. Lipids, 2003, 1632, 1-15. [CrossRef]
- Markham, J.E.; Li, J.; Cahoon, E.B.; Jaworski, J.G. Separation and identification of major plant sphingolipid classes from leaves. J. Biol. Chem., 2006, 281, 22684-22694. [CrossRef]
- Liu, N.J.; Hou, L.P.; Bao, J.J.; Wang, L.J.; Chen, X.Y. Sphingolipid metabolism, transport, and functions in plants: Recent progress and future perspectives. Plant Commun., 2021, 2, 100214. [CrossRef]
- Luttgeharm, K.D.; Kimberlin, A.N.; Cahoon, E.B. Plant Sphingolipid Metabolism and Function; Nakamura, Y., Libeisson, Y., Eds., 2016; Volume 86, 249-286. ISBN 0306-0225(print). [CrossRef]
- Markham, J.E.; Jaworski, J.G. Rapid measurement of sphingolipids from Arabidopsis thaliana by reversed-phase high-performance liquid chromatography coupled to electrospray ionization tandem mass spectrometry. Rapid Commun. Mass Spectrom., 2007, 21, 1304-1314. [CrossRef]
- Huby, E.; Napier, J.A.; Baillieul, F.; Michaelson, L.V.; Dhondt-Cordelier, S. Sphingolipids: towards an integrated view of metabolism during the plant stress response. New Phytol., 2020, 225, 659-670. [CrossRef]
- Zeng, H.; Yao, N. Sphingolipids in plant immunity. Phytopathol. Res., 2022, 4,. [CrossRef]
- Sperling, P.; Franke, S.; Lüthje, S.; Heinz, E. Are glucocerebrosides the predominant sphingolipids in plant plasma membranes? Plant Physiol. Biochem., 2005, 43, 1031-1038. [CrossRef]
- Tarazona, P.; Feussner, K.; Feussner, I. An enhanced plant lipidomics method based on multiplexed liquid chromatography-mass spectrometry reveals additional insights into cold- and drought-induced membrane remodeling. Plant J., 2015, 84, 621-633. [CrossRef]
- Melser, S.; Batailler, B.; Peypelut, M.; Poujol, C.; Bellec, Y.; Wattelet-Boyer, V.; Maneta-Peyret, L.; Faure, J.D.; Moreau, P. Glucosylceramide biosynthesis is involved in Golgi morphology and protein secretion in plant cells. Traffic, 2010, 11, 479-490. [CrossRef]
- Fouillen, L.; Maneta-Peyret, L.; Moreau, P. ER Membrane Lipid Composition and Metabolism: Lipidomic Analysis. Methods Mol Biol, 2018, 1691, 125-137. [CrossRef]
- Warnecke, D.; Heinz, E. Recently discovered functions of glucosylceramides in plants and fungi. Cell. Mol. Life Sci., 2003, 60, 919-941. [CrossRef]
- Wang, L.Y.; Li, J.; Gong, B.; Wang, R.H.; Chen, Y.L.; Yin, J.; Yang, C.; Lin, J.T.; Liu, H.Z.; Yang, Y.; et al. Orosomucoid proteins limit endoplasmic reticulum stress in plants. The New phytologist, 2023, 240, 1134-1148. [CrossRef]
- Carmona-Salazar, L.; Cahoon, R.E.; Gasca-Pineda, J.; Gonzalez-Solis, A.; Vera-Estrella, R.; Trevino, V.; Cahoon, E.B.; Gavilanes-Ruiz, M. Plasma and vacuolar membrane sphingolipidomes: composition and insights on the role of main molecular species. Plant Physiol., 2021, 186, 624-639. [CrossRef]
- Liu, Y.; Senkler, J.; Herrfurth, C.; Braun, H.; Feussner, I. Defining the lipidome of Arabidopsis leaf mitochondria: Specific lipid complement and biosynthesis capacity. Plant Physiol., 2023. [CrossRef]
- Hölzl, G.; Dörmann, P. Chloroplast Lipids and Their Biosynthesis. Annu. Rev. Plant Biol., 2019, 70, 51-81. [CrossRef]
- Wang, Z.; Benning, C. Chloroplast lipid synthesis and lipid trafficking through ER-plastid membrane contact sites. Biochem. Soc. Trans., 2012, 40, 457-463. [CrossRef]
- Chen, M.; Markham, J.E.; Cahoon, E.B. Sphingolipid Δ8 unsaturation is important for glucosylceramide biosynthesis and low-temperature performance in Arabidopsis. The Plant Journal, 2012, 69, 769-781. [CrossRef]
- Lenarčič, T.; Albert, I.; Böhm, H.; Hodnik, V.; Pirc, K.; Zavec, A.B.; Podobnik, M.; Pahovnik, D.; ~agar, E.; Pruitt, R.; et al. Eudicot plant-specific sphingolipids determine host selectivity of microbial NLP cytolysins. Science, 2017, 358, 1431-1434. [CrossRef]
- Jiang, Z.; Zhou, X.; Tao, M.; Yuan, F.; Liu, L.; Wu, F.; Wu, X.; Xiang, Y.; Niu, Y.; Liu, F.; et al. Plant cell-surface GIPC sphingolipids sense salt to trigger Ca(2+) influx. Nature, 2019, 572, 341-346. [CrossRef]
- Nagano, M.; Ishikawa, T.; Ogawa, Y.; Iwabuchi, M.; Nakasone, A.; Shimamoto, K.; Uchimiya, H.; Kawai-Yamada, M. Arabidopsis Bax inhibitor-1 promotes sphingolipid synthesis during cold stress by interacting with ceramide-modifying enzymes. Planta, 2014, 240, 77-89. [CrossRef]
- Ohlrogge, J.; Pollard, M.; Bao, X.; Focke, M.; Girke, T.; Ruuska, S.; Mekhedov, S.; Benning, C. Fatty acid synthesis: from CO2 to functional genomics. Biochem. Soc. Trans., 2000, 28, 567-573. [CrossRef]
- Rawsthorne, S. Carbon flux and fatty acid synthesis in plants. Prog. Lipid Res., 2002, 41, 182-196. [CrossRef]
- Luttgeharm, K.D.; Kimberlin, A.N.; Cahoon, E.B. Plant Sphingolipid Metabolism and Function. Subcell Biochem, 2016, 86, 249-286. [CrossRef]
- Wang, Z.; Benning, C. Chloroplast lipid synthesis and lipid trafficking through ER-plastid membrane contact sites. Biochem. Soc. Trans., 2012, 40, 457-463. [CrossRef]
- Berkey, R.; Bendigeri, D.; Xiao, S. Sphingolipids and plant defense/disease: the "death" connection and beyond. Front. Plant Sci., 2012, 3, 68. [CrossRef]
- Haslam, T.M.; Feussner, I. Diversity in sphingolipid metabolism across land plants. J. Exp. Bot., 2022, 73, 2785-2798. [CrossRef]
- Cha, H.J.; He, C.; Zhao, H.; Dong, Y.; An, I.S.; An, S. Intercellular and intracellular functions of ceramides and their metabolites in skin (Review). Int. J. Mol. Med., 2016, 38, 16-22. [CrossRef]
- Melser, S.; Molino, D.; Batailler, B.; Peypelut, M.; Laloi, M.; Wattelet-Boyer, V.; Bellec, Y.; Faure, J.D.; Moreau, P. Links between lipid homeostasis, organelle morphodynamics and protein trafficking in eukaryotic and plant secretory pathways. Plant Cell Reports, 2011, 30, 177-193. [CrossRef]
- Gronnier, J.; Germain, V.; Gouguet, P.; Cacas, J.L.; Mongrand, S. GIPC: Glycosyl Inositol Phospho Ceramides, the major sphingolipids on earth. Plant Signal. Behav., 2016, 11. [CrossRef]
- Wattelet-Boyer, V.; Brocard, L.; Jonsson, K.; Esnay, N.; Joubès, J.; Domergue, F.; Mongrand, S.; Raikhel, N.; Bhalerao, R.P.; Moreau, P.; et al. Enrichment of hydroxylated C24- and C26-acyl-chain sphingolipids mediates PIN2 apical sorting at trans-Golgi network subdomains. Nat. Commun., 2016, 7. [CrossRef]
- Lv, B.; Wei, K.; Hu, K.; Tian, T.; Zhang, F.; Yu, Z.; Zhang, D.; Su, Y.; Sang, Y.; Zhang, X.; et al. MPK14-mediated auxin signaling controls lateral root development via ERF13-regulated very-long-chain fatty acid biosynthesis. Mol. Plant., 2021, 14, 285-297. [CrossRef]
- Akolová, B.; Hudská, K.; Pullmannová, P.; Kováčik, A.; Palát, K.; Roh, J.; Fleddermann, J.; Estrela-Lopis, I.; Vávrová, K. Different phase behavior and packing of ceramides with long (C16) and very long (C24) acyls in model membranes: infrared spectroscopy using deuterated lipids. J. Phys. Chem. B, 2014, 118, 10460-10470. [CrossRef]
- Ternes, P.; Franke, S.; Zähringer, U.; Sperling, P.; Heinz, E. Identification and characterization of a sphingolipid delta 4-desaturase family. J. Biol. Chem., 2002, 277, 25512-25518. [CrossRef]
- Flores-Pérez, Ú.; Jarvis, P. Isolation and Suborganellar Fractionation of Arabidopsis Chloroplasts. Methods Mol Biol, 2017, 1511, 45-60. [CrossRef]
- Markham, J.E.; Jaworski, J.G. Rapid measurement of sphingolipids from Arabidopsis thaliana by reversed-phase high-performance liquid chromatography coupled to electrospray ionization tandem mass spectrometry. Rapid Commun. Mass Spectrom., 2007, 21, 1304-1314. [CrossRef]
- Zeng, H.Y.; Liu, Y.; Chen, D.K.; Bao, H.N.; Huang, L.Q.; Yin, J.; Chen, Y.L.; Xiao, S.; Yao, N. The immune components ENHANCED DISEASE SUSCEPTIBILITY 1 and PHYTOALEXIN DEFICIENT 4 are required for cell death caused by overaccumulation of ceramides in Arabidopsis. Plant J., 2021, 107, 1447-1465. [CrossRef]
Figure 1.
Experimental procedure for the sphingolipid analysis and purity assessment. (a) Experimental approach to obtain total leaf (TL) and chloroplast samples from Arabidopsis plants for sphingolipid analysis. Yellow asterisks indicated a target precipitation containing chloroplasts. (b) Immunodetection of BAK1 from the plasma membrane, BIP2 from endoplasmic reticulum, RbcL from chloroplasts, V-ATPase from vacuoles, VDAC1 from mitochondria, and histone H3 from nuclei. Proteins were separated by SDS-PAGE and detected by immunoblot.
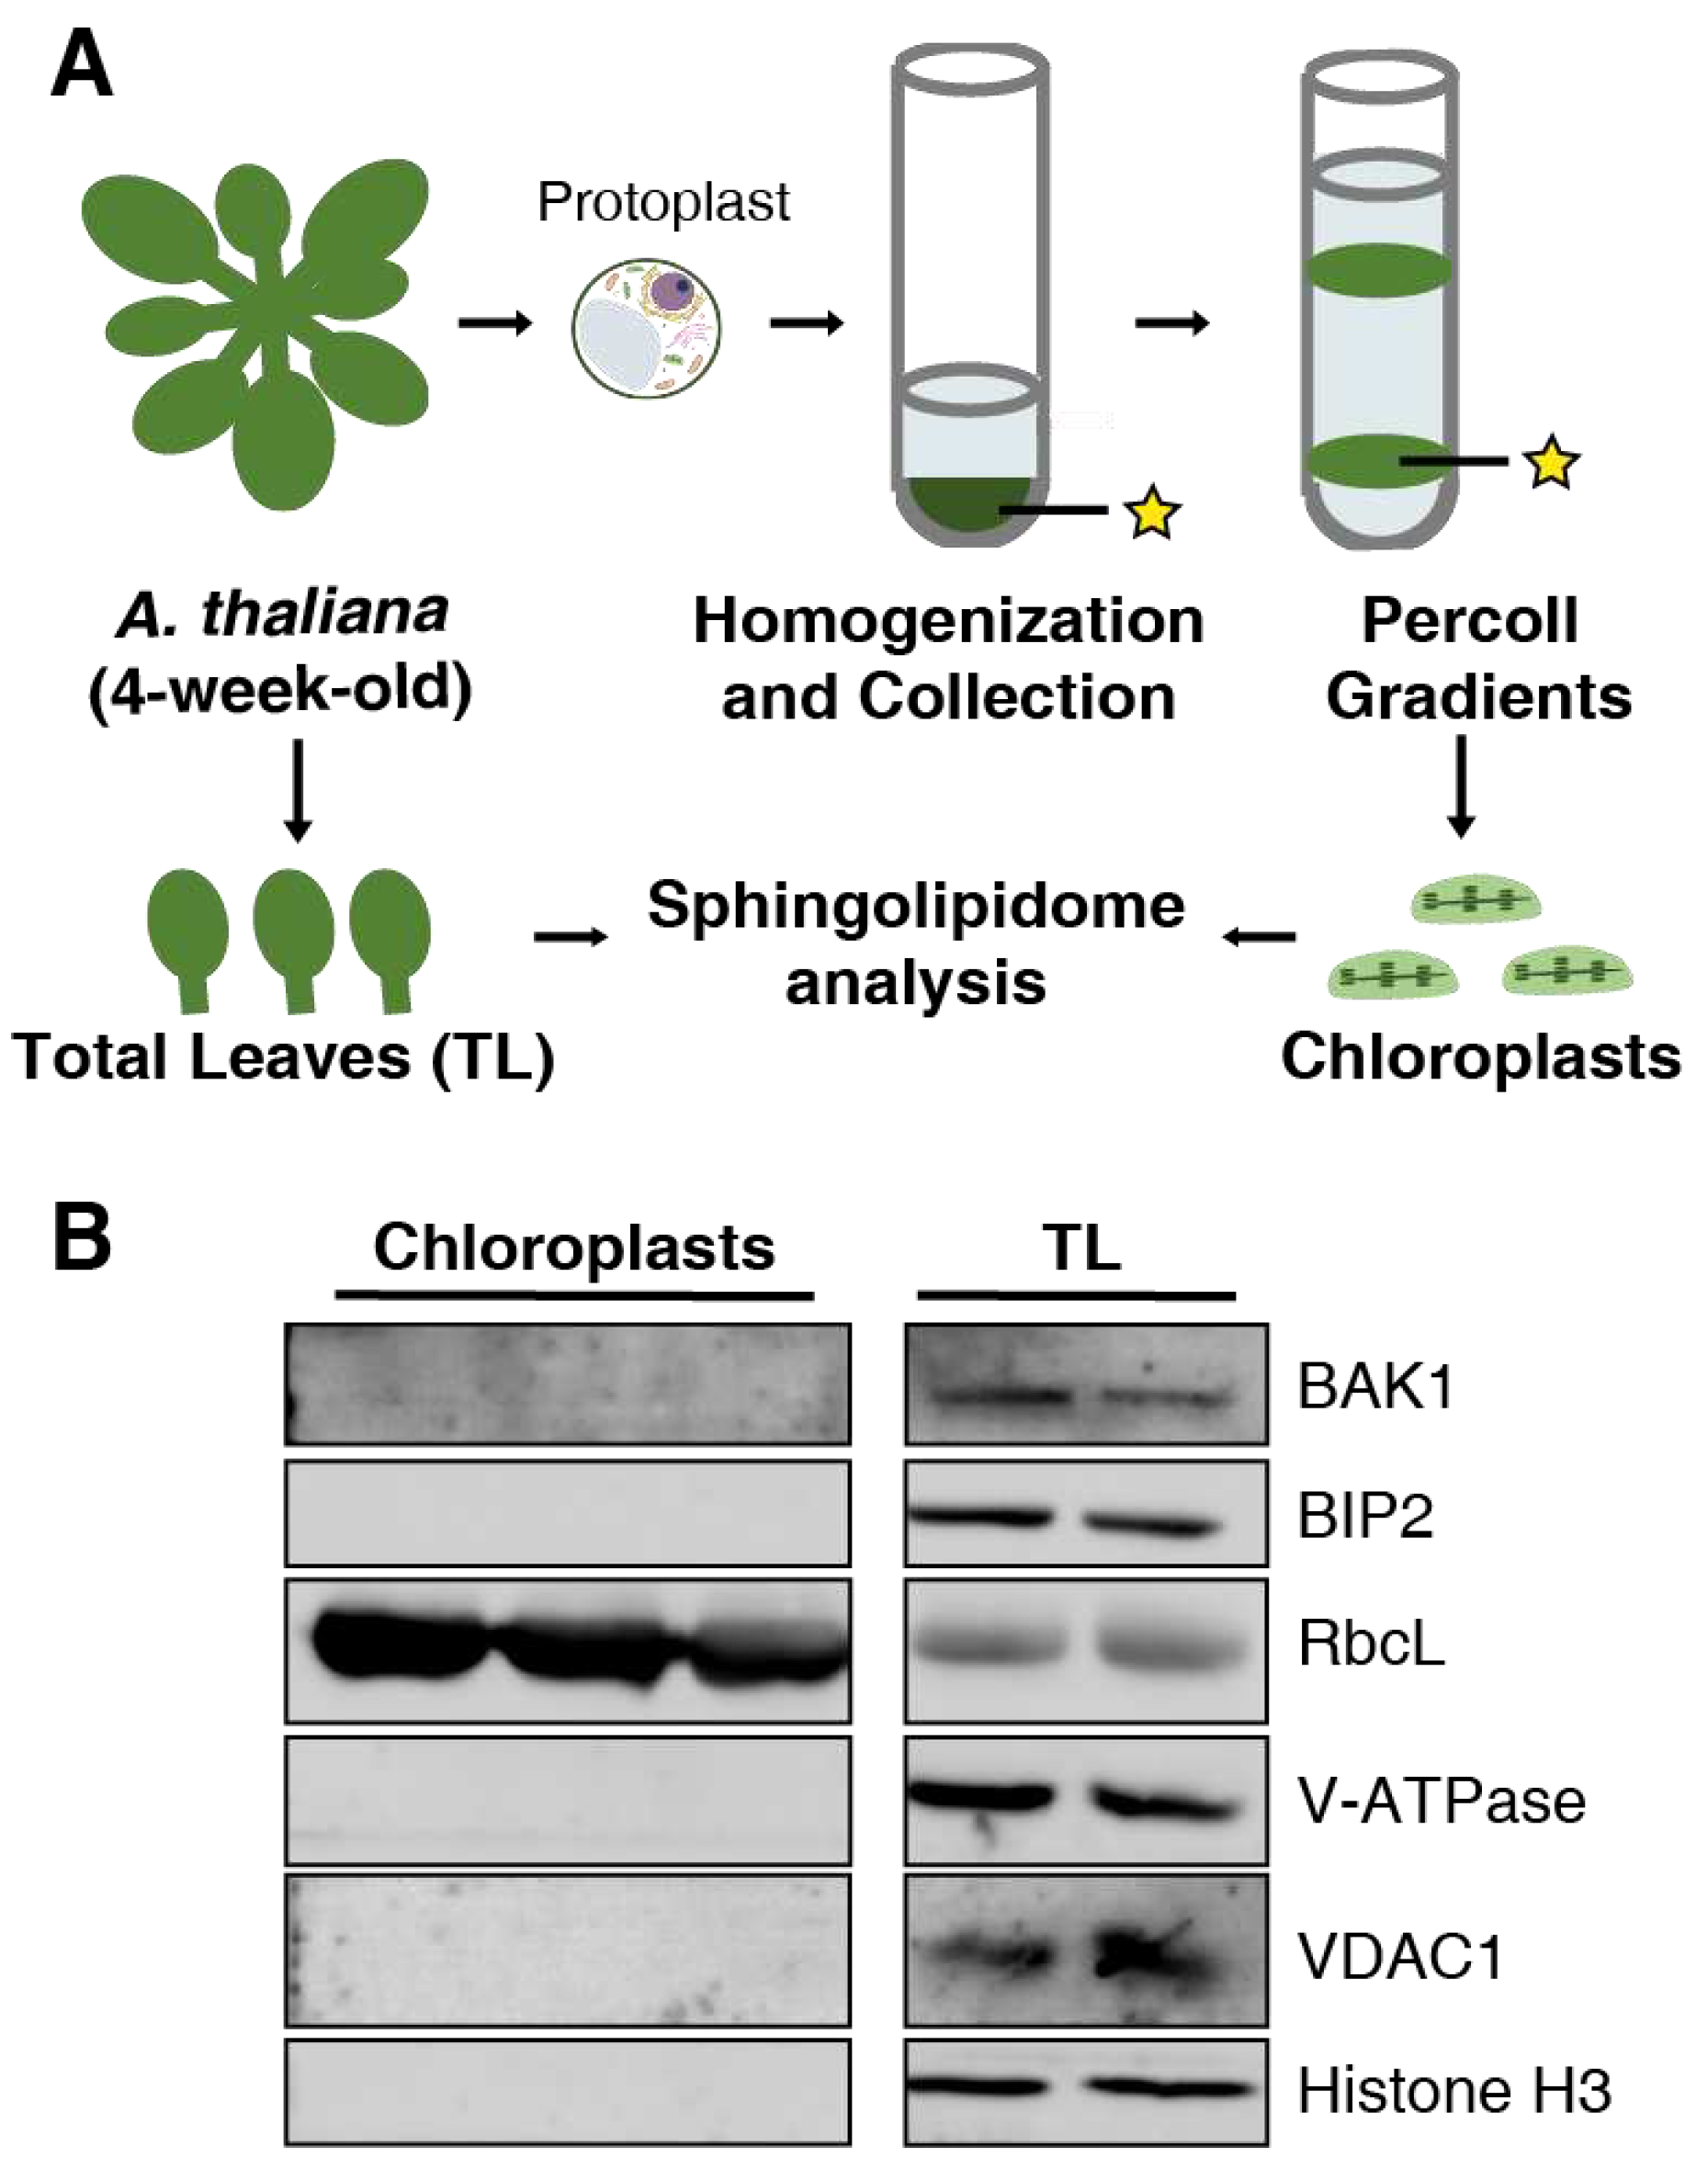
Figure 2.
Multivariate analysis and heatmap plots of sphingolipid profiles. (a) Partial least squares-discriminant analysis (PLS-DA) of sphingolipid profiles of the chloroplast and total leaf samples. The analysis is based on relative content (mol %) of all detected sphingolipid species. In this study, nine replicates (three biological replicates times three technical replicates) were set for each sample type. (b) Representation of the structure of main complex sphingolipid classes. (c) Heatmap plots of the abundance of LCBs, Cers, hCers, GlcCers and GIPCs. The Z-score represents the standardized contents of individual sphingolipid species in mol %. The scale from left value to right value represents the number of standard deviations from the average of each row (i.e. sample types), with red indicating higher contents than average and blue color indicating lower contents than average. An “O” in the heatmap means that sphingolipid species was not detected in this sample group. The sphingolipid species that were not detected in any of the samples are not shown.
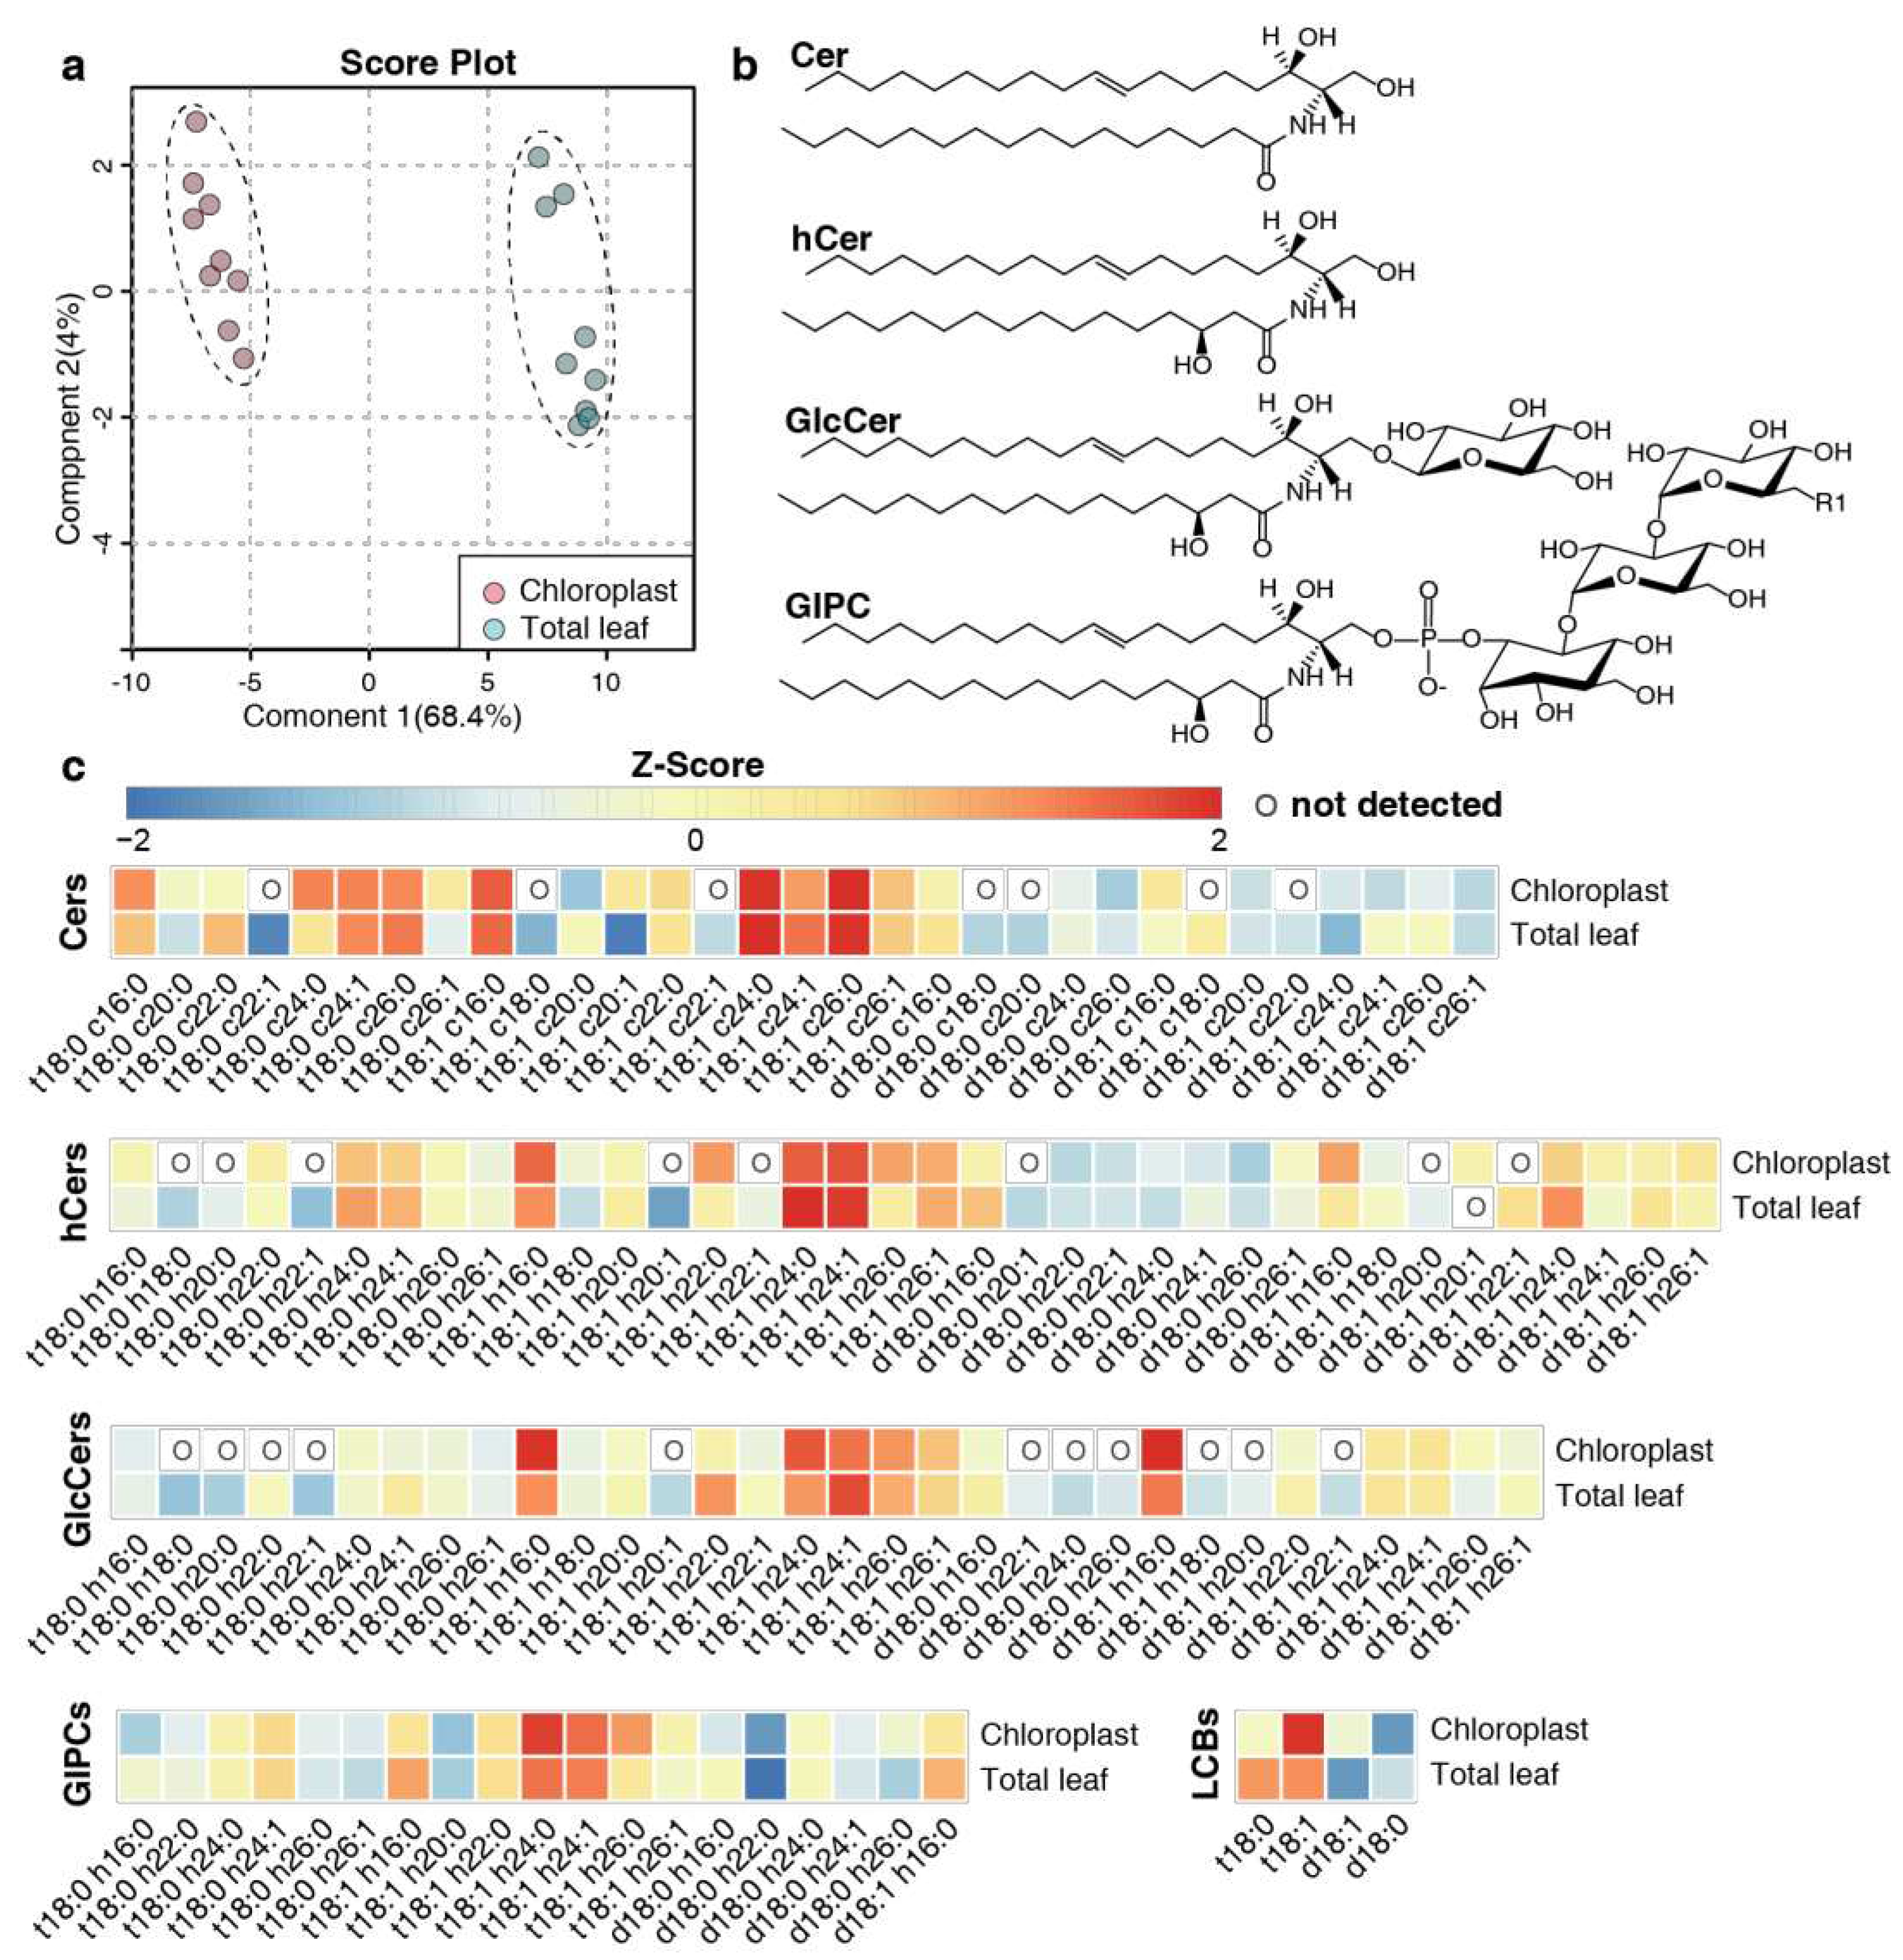
Figure 3.
Content and distribution of sphingolipid classes. (a) Absolute contents of five sphingolipid classes (LCBs, Cers, hCers, GlcCers and GIPCs). The sphingolipid contents were expressed per mg of protein in chloroplasts. Error bars represent the means ± SE from three biological replicates and three technical replicates. (b) Distribution of sphingolipid classes. Percentage values in pie charts represent average relative content of each sphingolipid class in chloroplast and total leaf samples.
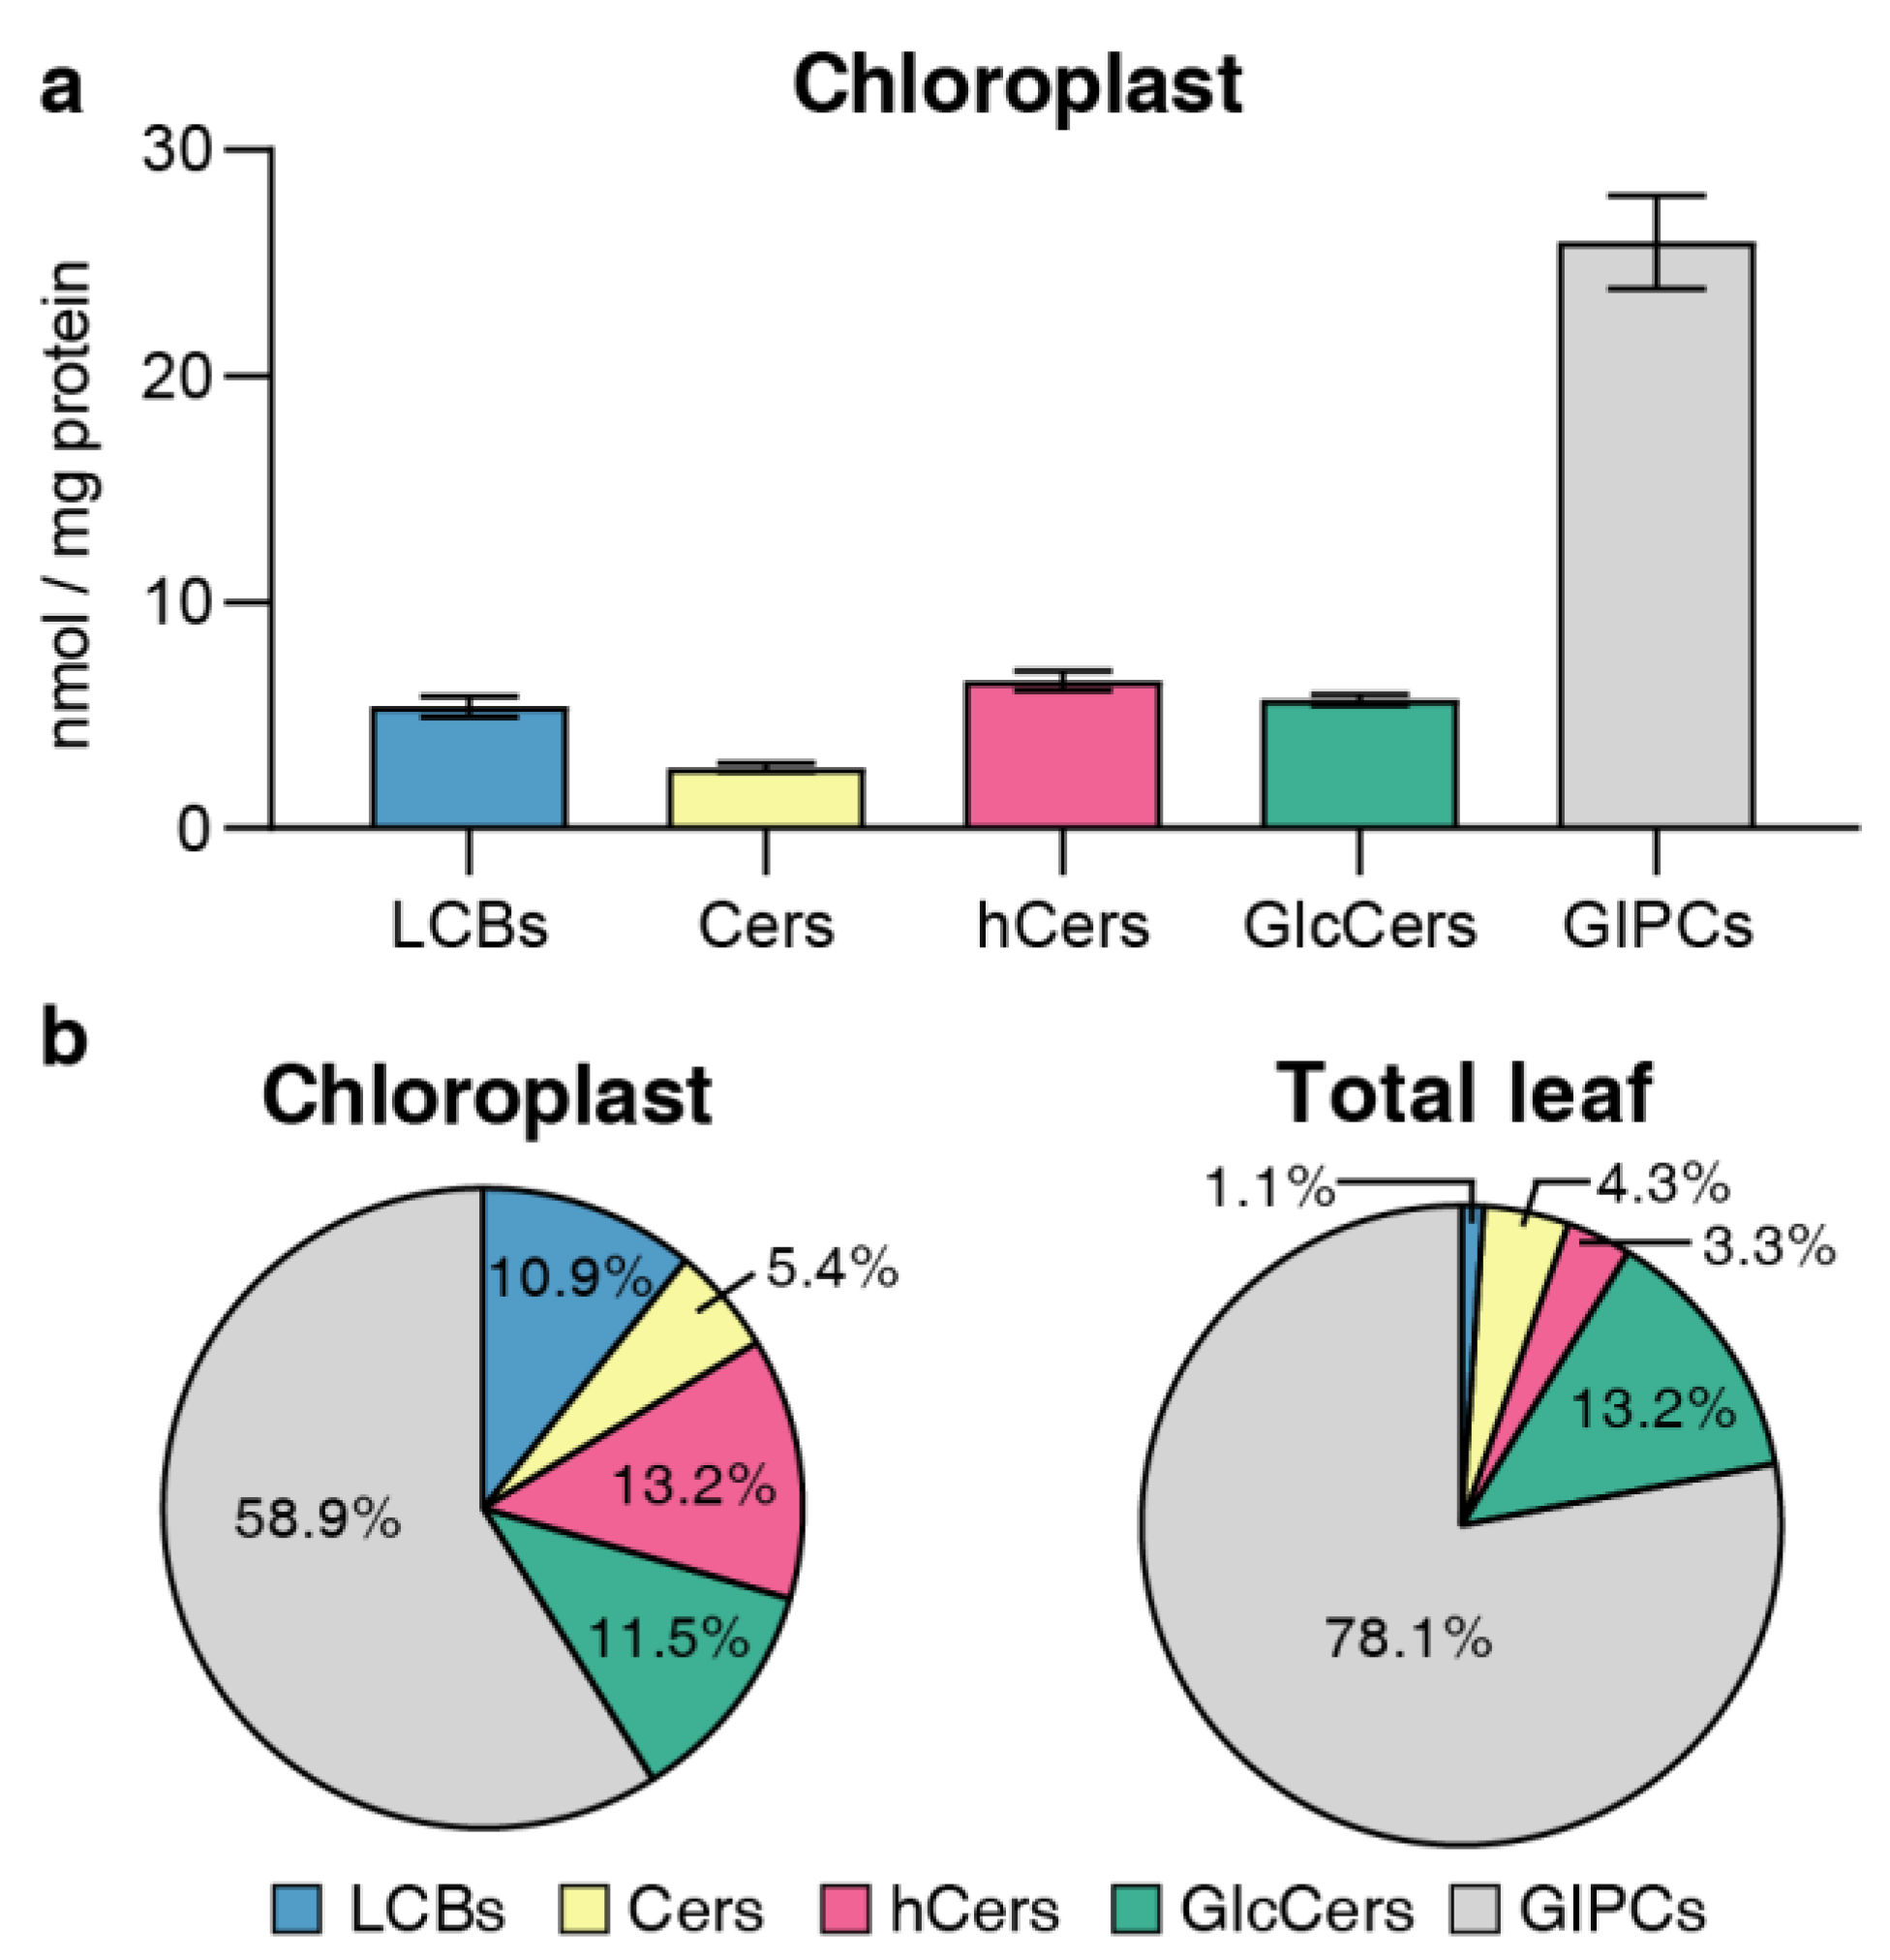
Figure 4.
LCB composition in different sphingolipid classes. (a) LCB composition of four sphingolipid classes in chloroplasts and total leaves (TL). Bars of different colors represent four LCB species (t18:0, t18:1, d18:0, d18:1). Length of bars represents the average relative content (mol %) from nine replicates of each LCB species. (b) LCBt18/LCBd18 ratio of each sphingolipid class, the ratio is calculated by trihydroxylated forms (t18:0 and t18:1) versus dihydroxylated forms (d18:0 and d18:1). (c) LCBUNS/LCBSAT ratio of each sphingolipid class, the ratio is calculated by unsaturated LCB (t18:1 and d18:1) versus saturated LCB (t18:0 and d18:0). Error bars represent the means ± SE from from three biological replicates and three technical replicates. Different letters labeled on the top of bars indicate statistical differences using two-tailed Student’s t tests (ns: P>0.05, *: P<0.05, **: P<0.01, ***: P<0.001).
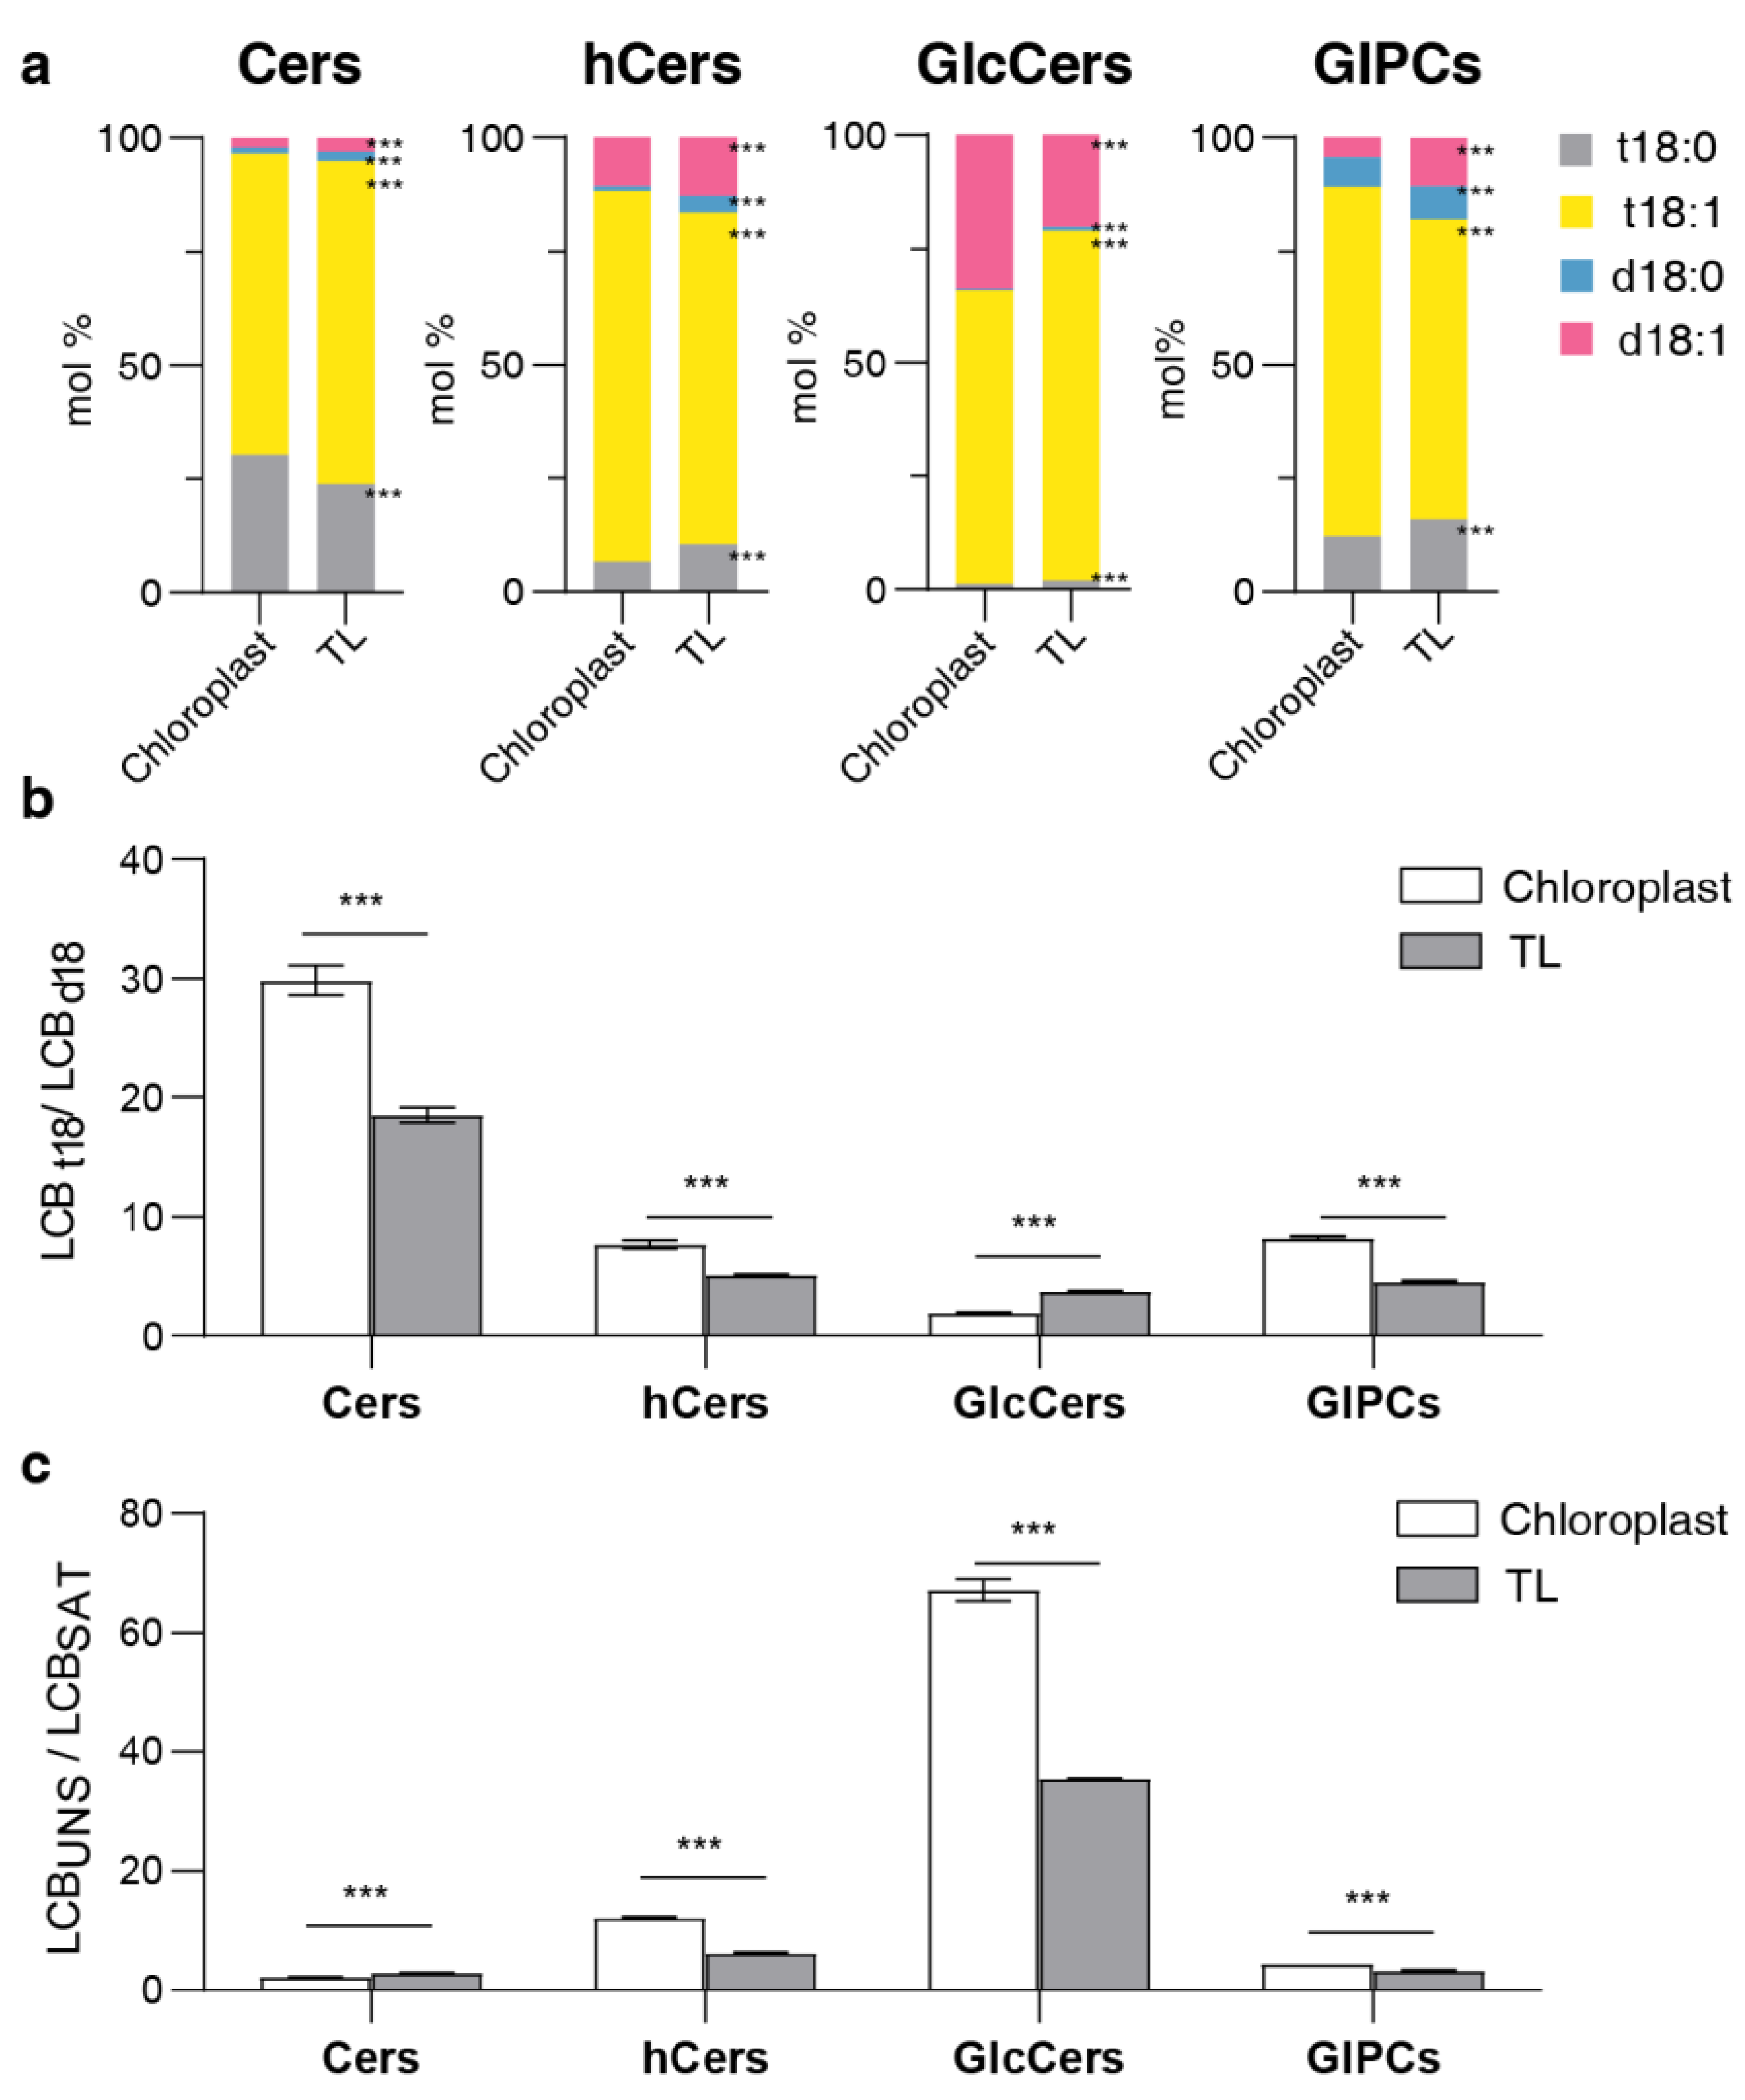
Figure 5.
Fatty acid composition in sphingolipid classes. (a) Fatty acid (FA) composition of four sphingolipid classes, bars of different colors represent six FA species with 16–26C lengths (16C, 18C, 20C, 22C, 24C, 26C). Length of bars represents the average relative content (mol %) from three biological replicates and three technical replicates of each FA species. (b) LCFA/VLCFA ratio of each sphingolipid class, the ratio is calculated by long chain fatty acids (LCFA, 16C and 18C) versus very long chain fatty acids (VLCFA, 20C, 22C, 24C and 26C). (c) SFA/UFA ratio of each sphingolipid class, the ratio is calculated by saturated fatty acids (SFA, 16:0, 18:0, 20:0, 22:0, 24:0, 26:0) versus unsaturated fatty acids (UFA, 20:1, 22:1, 24:1, 26:1). Error bars represent the means ± SE from three biological replicates and three technical replicates. Different letters labeled on the top of bars indicate statistical differences using two-tailed Student’s t-tests (ns: P>0.05, *: P<0.05, **: P<0.01, ***: P<0.001).
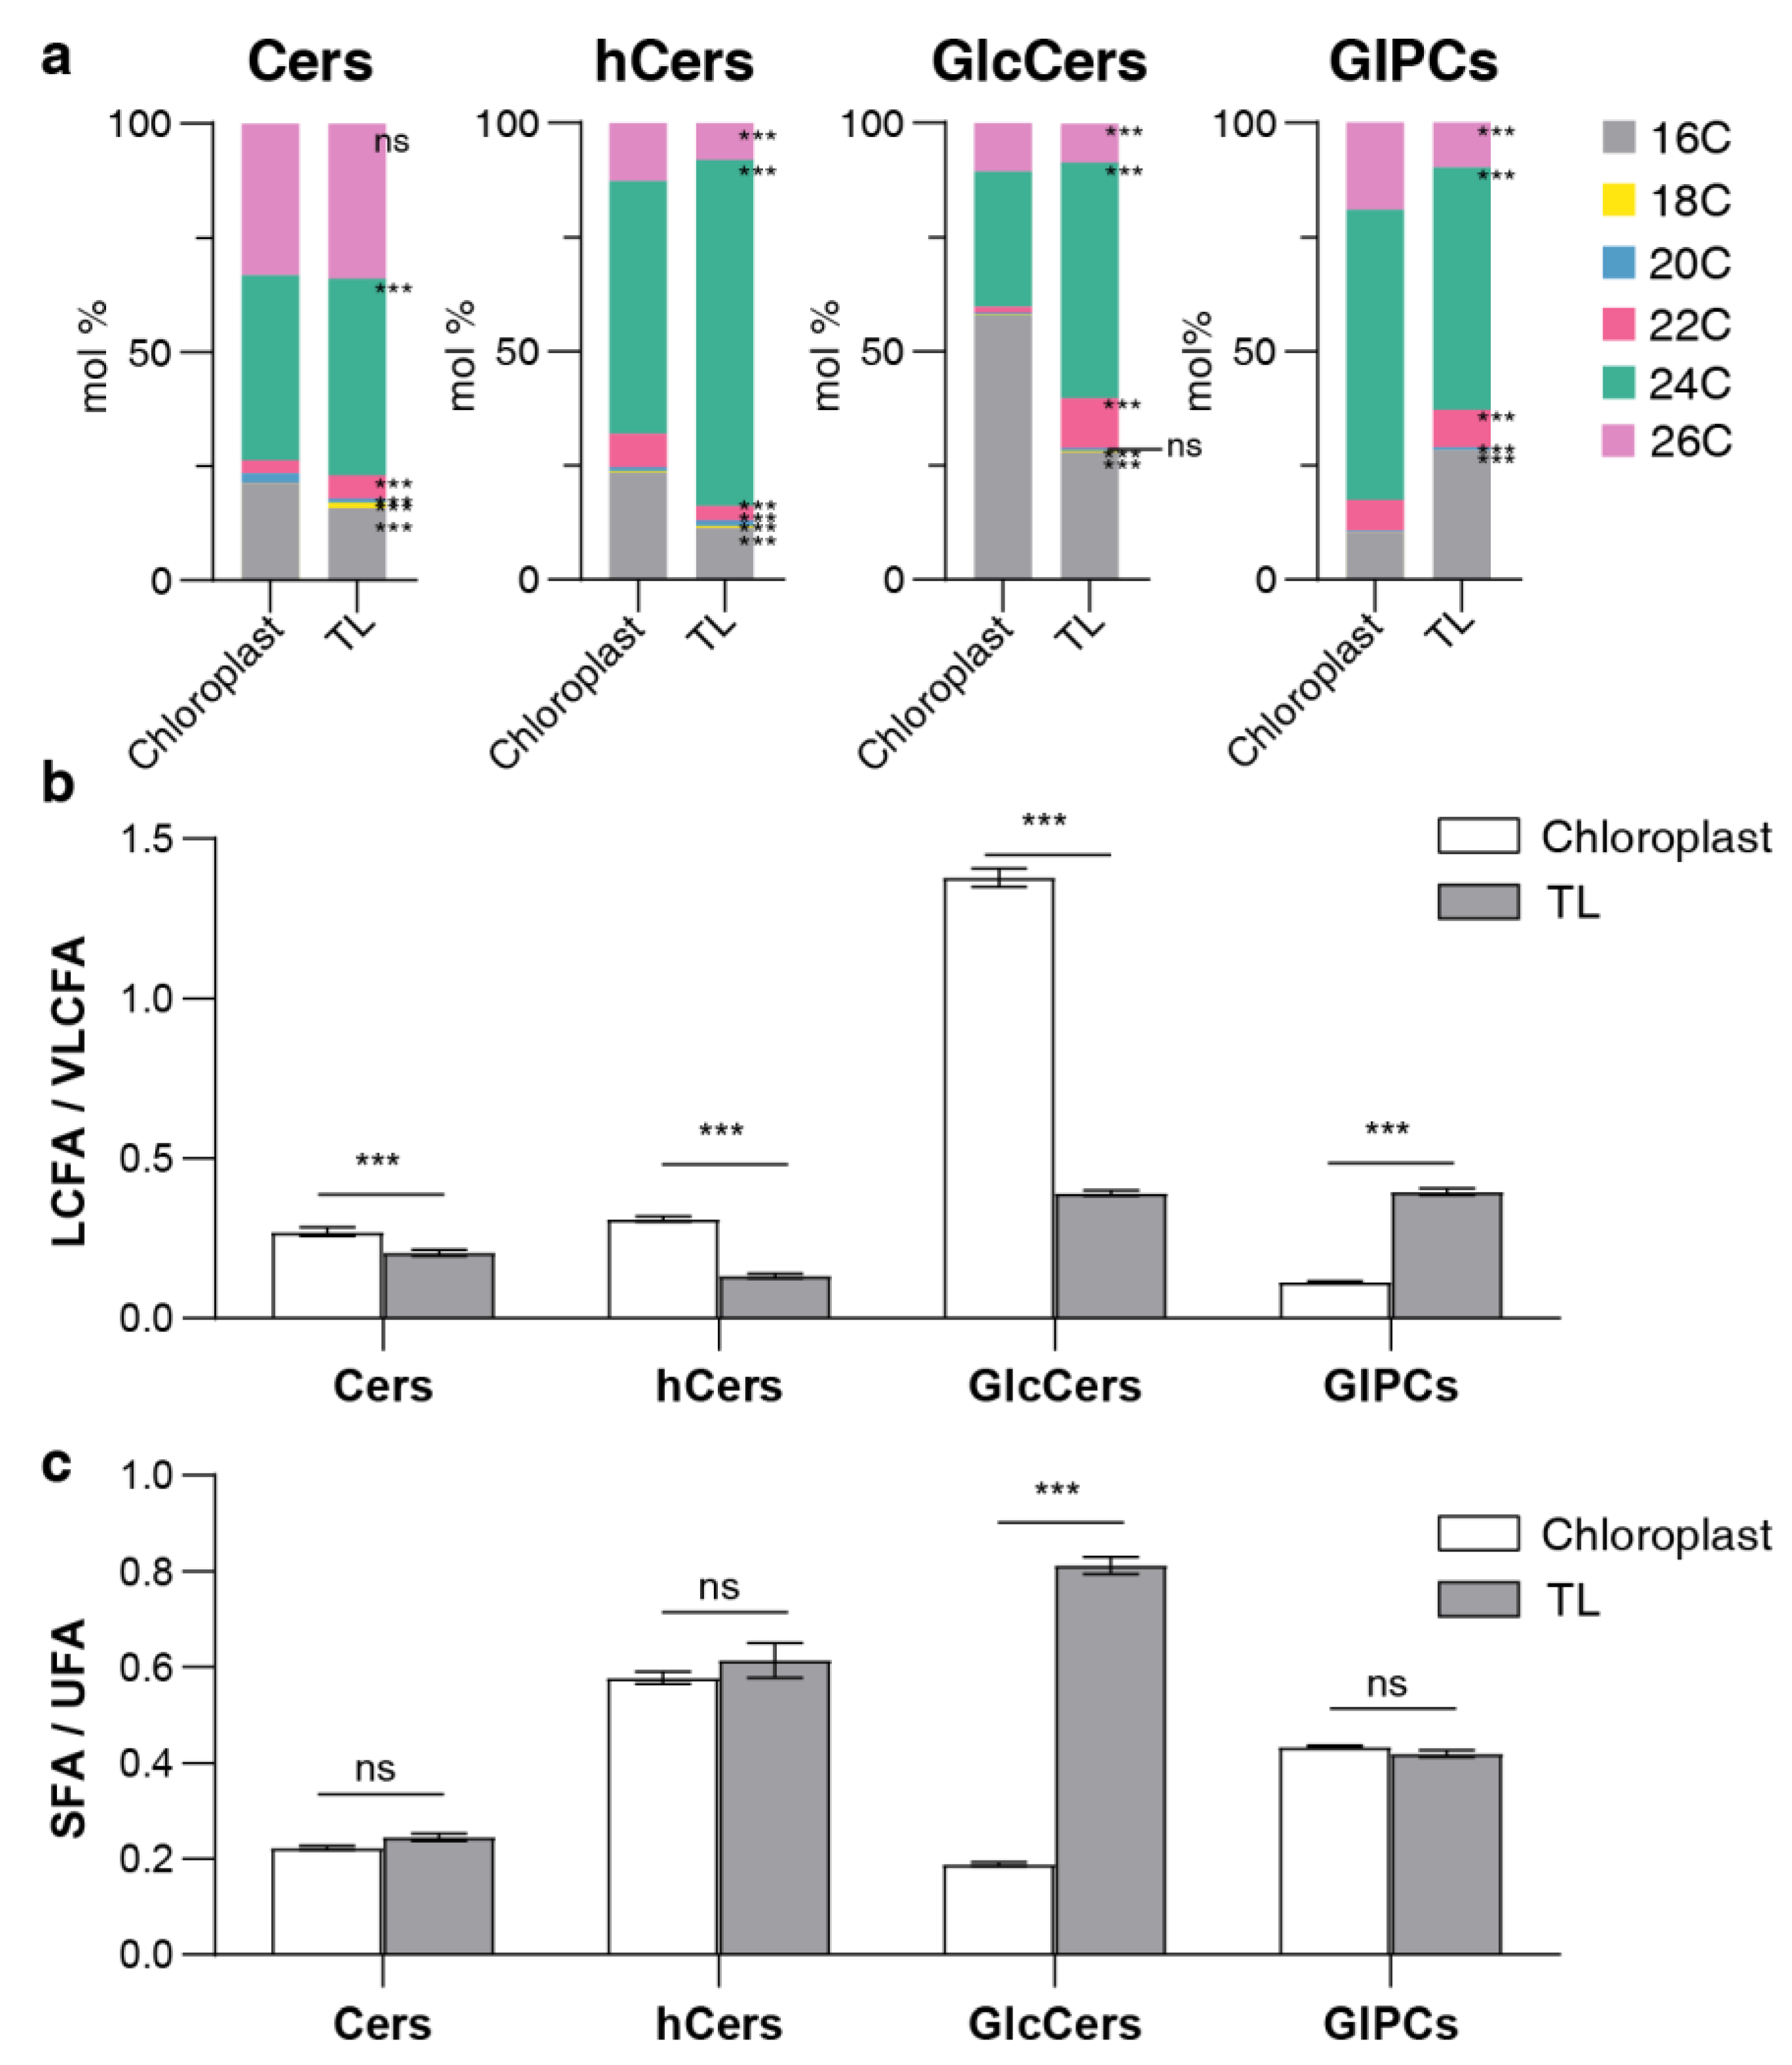
Figure 6.
Distribution of abundant species from four sphingolipid classes. (a) Cers, (b) hCers, (c) GlcCers, and (d) GIPCs. The size of each bubble is related to average relative content from three biological replicates and three technical replicates for each individual species. Only sphingolipid species with abundance more than 1% of each sphingolipid class (16 species of Cers, 14 species of hCers, 9 species of GlcCers, and 14 species of GIPCs) are shown. Different letters labeled on the top of bars indicate statistical differences using two-tailed Student’s t tests (ns: P>0.05, *: P<0.05, **: P<0.01, ***: P<0.001).
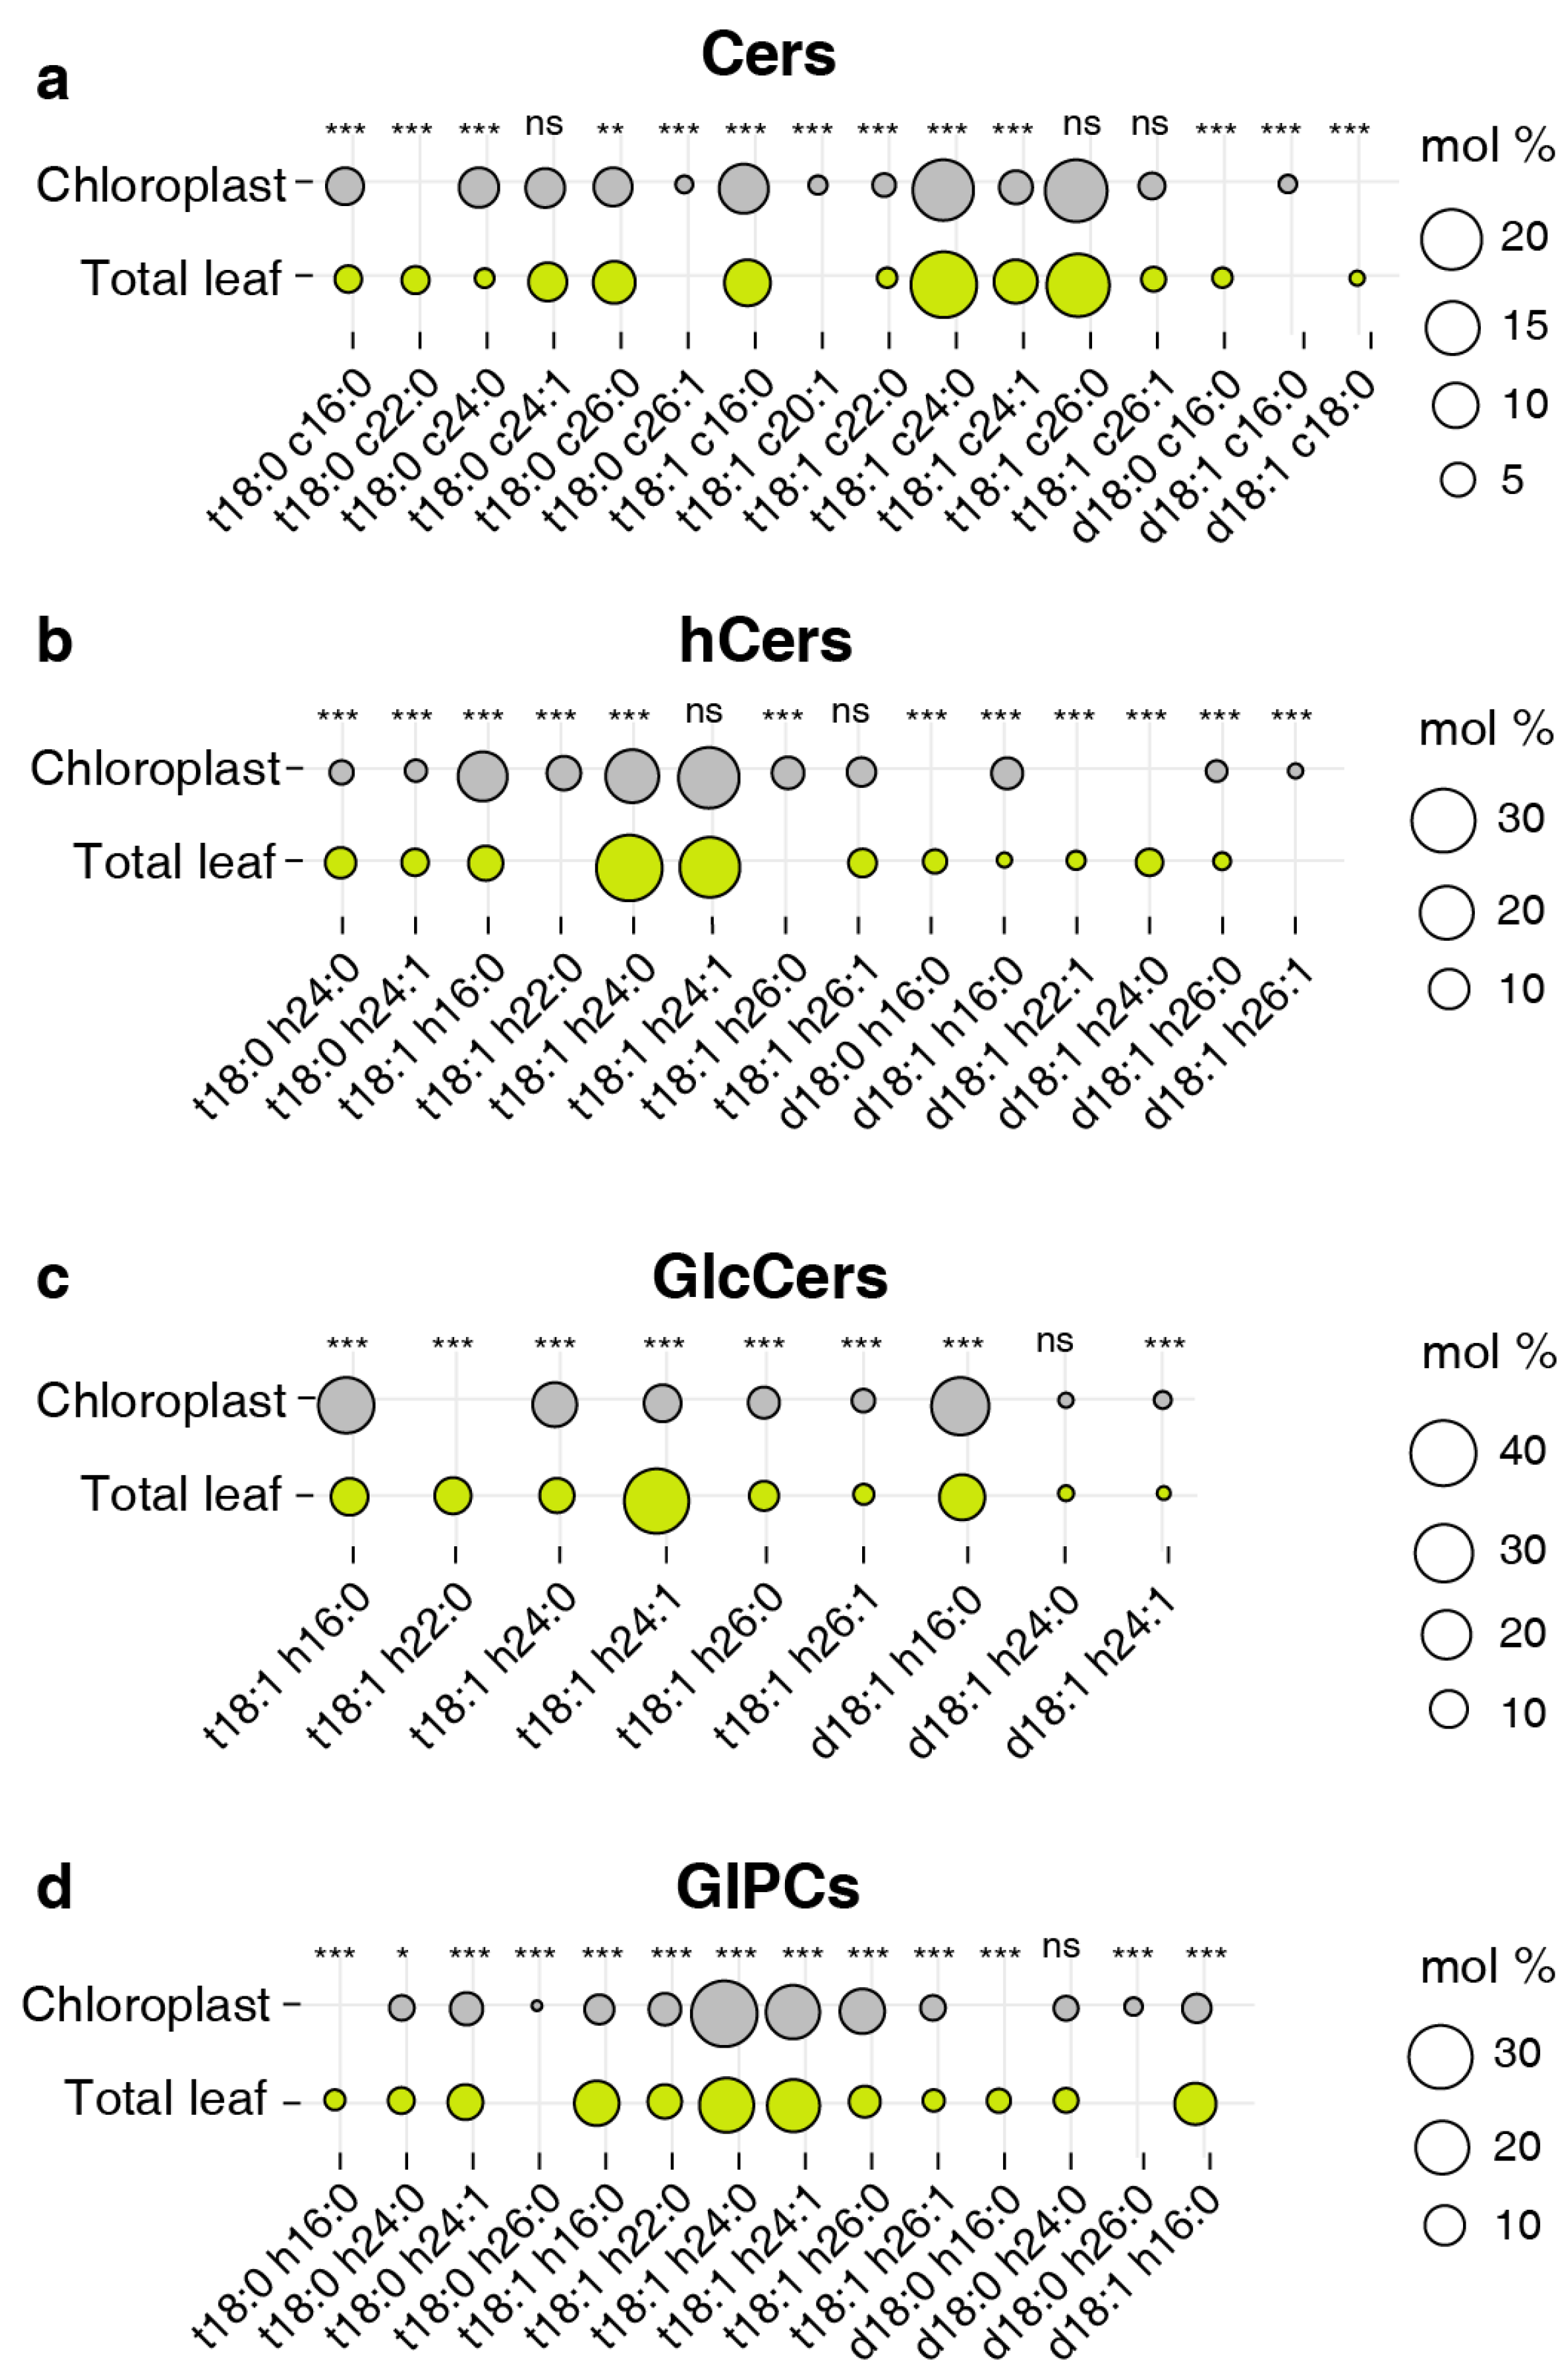

Table 1.
Sphingolipid composition of cellular structures in Arabidopsis thaliana.
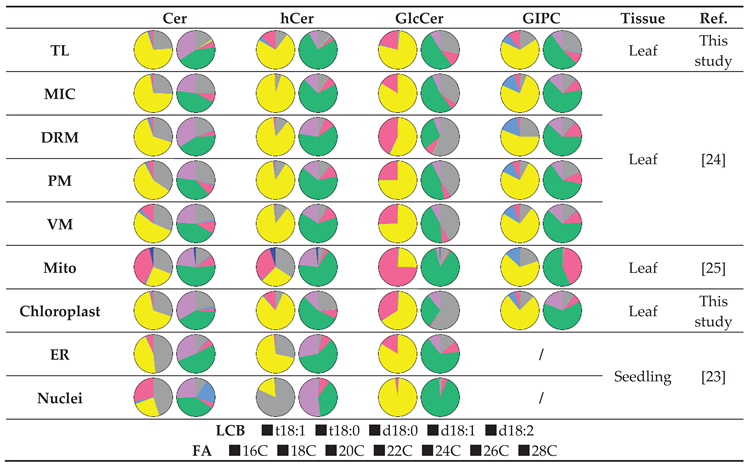 |
TL: Total leaf, MIC: microsomal membrane, DRM: detergent-resistant membrane, PM: plasma membrane, VM: vacuolar membranes, Mito: mitochondria, ER: endoplasmic reticulum.
Table 2.
Predominant sphingolipid species of cellular structures in Arabidopsis thaliana.
| Cer | hCer | GlcCer | GIPC | Tissue | Ref. | |
| TL | t18:1 c24:0 t18:1 c26:0 |
t18:1 h24:0 t18:1 h24:1 |
t18:1 h24:1 | t18:1 h24:0 t18:1 h24:1 |
Leaf | This study |
| MIC | t18:1 c24:0 t18:1 c26:0 t18:1 c16:0 t18:1 c24:1 |
t18:1 h24:1 t18:1 h24:0 |
t18:1 h24:1 | t18:1 h24:0 t18:1 h24:1 |
Leaf | [24] |
| DRM | t18:1 c24:0 t18:1 c26:0 |
t18:1 h24:0 t18:1 h26:0 t18:1 h24:1 |
d18:1 h16:0 |
t18:1 h24:0 t18:0 h24:0 |
||
| PM | t18:1 c24:0 t18:1 c26:0 t18:0 c16:0 |
t18:1 h24:1 t18:1 h24:0 |
t18:1 h24:1 d18:1 h16:0 t18:1 h16:0 |
t18:1 h24:1 t18:1 h24:0 |
||
| VM | t18:1 c24:0 t18:1 c26:0 t18:0 c24:0 |
t18:1 h24:1 t18:1 h24:0 |
t18:1 h24:1 d18:1 h16:0 t18:1 h16:0 |
t18:1 h24:1 t18:1 h24:0 |
||
| Mito | d18:1 c24:0 t18:1 c26:0 |
t18:0 h24:0 d18:1 h24:0 |
d18:1 h24:1 | t18:1 h24:1 t18:1 h24:0 |
Leaf | [25] |
| Chloroplast | t18:1 c24:0 t18:1 c26:0 |
t18:1 h24:1 t18:1 h24:0 t18:1 h16:0 |
d18:1 h16:0 t18:1 h16:0 |
t18:1 h24:0 t18:1 h24:1 |
Leaf | This study |
| ER | t18:0 c24:0 t18:1 c24:0 t18:1 c26:0 |
t18:0 h24:0 t18:1 h24:0 t18:0 h26:1 |
t18:1 h24:0 t18:1 h24:1 |
/ | Seedling | [23] |
| Nuclei | t18:0 c24:0 d18:1 c20:0 |
t18:0 h26:1 t18:0 h24:0 |
t18:1 h24:1 | / |
TL: Total leaf, MIC: microsomal membrane, DRM: detergent-resistant membrane, PM: plasma membrane, VM: vacuolar membranes, Mito: mitochondria, ER: endoplasmic reticulum.
Disclaimer/Publisher’s Note: The statements, opinions and data contained in all publications are solely those of the individual author(s) and contributor(s) and not of MDPI and/or the editor(s). MDPI and/or the editor(s) disclaim responsibility for any injury to people or property resulting from any ideas, methods, instructions or products referred to in the content. |
© 2023 by the authors. Licensee MDPI, Basel, Switzerland. This article is an open access article distributed under the terms and conditions of the Creative Commons Attribution (CC BY) license (http://creativecommons.org/licenses/by/4.0/).
Copyright: This open access article is published under a Creative Commons CC BY 4.0 license, which permit the free download, distribution, and reuse, provided that the author and preprint are cited in any reuse.


