
Submitted:
11 December 2024
Posted:
12 December 2024
You are already at the latest version
Abstract
Among abiotic stresses to agricultural crops, drought stress is the most prolific and has worldwide detrimental impacts. The soybean (Glycine max) is one of the most important sources of nutrition to both livestock and humans. Different plant introductions (PI) of soybeans have been identified to have different drought tolerance levels. Here, two soybean lines, Pana (drought sensitive) and PI 567731 (drought tolerant) were selected to identify chemical compounds and pathways which could be targets for metabolomic analysis induced by abiotic stress. Extracts from the two lines are analyzed by direct infusion electrospray ionization Fourier transform ion cyclotron resonance mass spectrometry. The high mass resolution and accuracy of the method allows for identification of ions from hundreds of different compounds in each cultivar. The exact m/z of these species were filtered through SoyCyc and the Human Metabolome Database to identify possible molecular formulas of the ions. Next, the exact m/z values are converted into Kendrick masses and their Kendrick mass defects (KMD) computed, which are then sorted from high to low KMD. This latter process assists in identifying many additional molecular formulas, and is noted to be particularly useful in identifying formulas whose mass difference corresponds to two hydrogen atoms. In this study, more than 460 ionic formulas are identified in Pana, and more than 340 ionic formulas are identified in PI 567731, with many of these formulas reported from soybean for the first time. Using the SoyCyc matches, the metabolic pathways from each cultivar are compared, providing for lists of molecular targets available to profile effects of abiotic stress on these soybean cultivars. Key metabolites include chlorophylls, pheophytins, mono- and diacylglycerols, cycloeucalenone, squalene, and plastoquinones and involve pathways which include the anabolism and catabolism of chlorophyll, glycolipid desaturation, and biosynthesis of phytosterols, plant sterols, and carotenoids.
Keywords:
Kendrick mass defect
; metabolomics
; soybean
; electrospray ionization
; drought
; FT-ICR
; chemical informatics
1. Introduction
Abiotic stresses to agricultural crops can have a significant impact on crop yields, with drought being one of the most prolific [1]. Legumes such as soybean (Glycine max) are particularly susceptible to drought stress during growth stages, which has dramatic impacts on crop yield [2]. Reduced yields due to drought are the result of alterations in homeostasis, impacting composition of plant tissues at the molecular level [3]. Recent advances in agronomy have led to the identification of slow canopy wilting (SW) phenotypes in soybean which exhibits a tolerance to drought stress [4]. The plant introduction (PI) PI 567731, an exotic soybean germplasm, has been shown to consistently possess the SW phenotype and utilizes less water (and has less yield reduction) under drought conditions [4,5]. Unfortunately, many of the underlying metabolomic mechanisms for the drought tolerance of the PI 567731 are not clear [6]. Increased knowledge of the molecular composition of components of soybean plants would enhance present understanding of the mechanisms by which certain cultivars might have enhanced resistance to abiotic stress.
Mass spectrometry is a rapidly growing technique for fingerprinting in soybean metabolomics [7,8]. A report which examined metabolic profiles of soybean leaves using gas chromatography-mass spectrometry (GC-MS) and liquid chromatography-mass spectrometry (LC-MS) found that several important pathways related to nitrogen and sugar metabolism were impacted by drought and heat stresses [3]. Another study used GC-MS and ultrahigh performance liquid chromatography (UPLC) to identify more than 160 metabolites from seeds of different soybean cultivars [9]. The impact of flooding stress on soybean plants was investigated by capillary electrophoresis coupled to MS, revealing numerous metabolites sensitive to flooding, including increased levels of gamma-aminobutyric acid, glycine, NADH2, and phosphoenol pyruvate [10]. A recent paper used UPLC and tandem mass spectrometry to investigate soybean metabolomics under drought stress, and revealed that amino acid metabolism and lipid metabolism both play a key role in drought resistance with the tricarboxylic acid (TCA) cycle being one of the core pathways either enabling drought resistance or being a consequence of drought tolerance [11]. Molecular tomography has been used as a metabolomics approach to probe the symbiotic interaction between soybeans and their root nodules using mass spectrometry imaging, information which could be used to help improve crop yields [12]. Our group has promoted the utility of high resolution mass spectrometry, independent of chromatographic methods, for metabolomic analysis of soybeans, showing clear distinction of soybean leaves due to senescence [13] and for drought-stressed soybean leaves, particularly with respect to chlorophyll and its related metabolites [14]. Indeed, the utility of mass spectrometry in soybean metabolomics includes application to underused parts of the soybean plant [15].
Chromatographic methods in combination with mass spectrometry (e.g. GC-MS and LC-MS) are used widely in metabolomics. However, it is also important to recognize that high mass resolving power and high mass accuracy measurements make it possible to assign molecular formulas to components in very complex mixtures, even when chromatography is not used. Kendrick recognized that by rescaling a mass spectrum from the IUPAC mass scale (12C is exactly 12 Da) to a mass scale based on methylene units enables ready identification of a homologous series of compounds of the same class and type, but with different extents of alkylation [16]. Effectively, the IUPAC mass is converted into a Kendrick mass:
Kendrick mass = IUPAC mass × (14/14.01565)
By rescaling the mass spectrum, compounds with identical numbers of heteroatoms and ring double bond equivalents (RDBE) possess identical Kendrick mass defects (KMD):
KMD = (nominal Kendrick mass – exact Kendrick mass)
Obtaining KMD has shown great utility in identification of molecular formulas from highly complex mixtures of hydrocarbons [17,18,19,20,21], synthetic polymers [22,23,24,25,26,27,28,29,30], and specimens of biologic origin for metabolomics [31,32,33,34,35,36,37,38]. A lipidomic analysis used KMD in combination with liquid chromatography and high-resolution mass analysis to annotate numerous classes of polar lipids from glioblastoma cell cultures; this report also identified short-chain sulfatides as being the most highly modulated class of polar lipids [31]. A method to rapidly determine lipid classes used referenced Kendrick mass defect (RKMD) by converting lipid masses to the Kendrick mass scale, followed by referencing each converted mass to each lipid class; this method was applied to identification of components within a lipid extract of bovine milk [32]. KMD [37] and the related multidimensional stoichiometric compound classification (MSCC) method [39] have been employed for phytochemical assessment within plants.
Expanding upon an earlier study using direct infusion electrospray ionization (ESI) Fourier transform ion cyclotron resonance (FT-ICR) mass spectrometry to examine phytochemical composition of different soybean cultivars [14], here we filter measured m/z values through the SoyCyc database (https://soycyc.soybase.org/), populated with data from SoyBase (https://soybase.org) [40], and the Human Metabolome Database (HMDB) (https://hmdb.ca/) [41] for initial assignments of molecular formulas. Subsequent KMD analysis is conducted to assign additional molecular formulas. Matches from the SoyCyc database are used for metabolic pathway mapping analysis, providing for lists of molecular targets available to profile effects of abiotic stress.
2. Materials and Methods
2.1. Materials
HPLC grade methanol was from Sigma-Aldrich (St. Louis, MO; Cat. no.: 439193). For vacuum filtration of particulate matter, Cytiva Whatman filtration papers with 11 micron pore size (Little Chalfont, Buckinghamshire, UK, Cat. 1001-055) were used.
Two cultivars of soybean (Glycine max) were grown in the field at the University of Missouri: the drought-sensitive cultivar Pana and the drought-tolerant cultivar PI 567731. Here, plants were grown for seven weeks in the field under normal irrigation conditions, with watering two days prior to tissue collection, when plants reached to the R2 growth stage.
2.2. Extraction and Sample Preparation
Leaves from the two cultivars were collected from 20 plants/cultivar and flash frozen immediately following tissue collection and transported to the University of Missouri. Afterward, they were placed on dry ice and shipped to the University at Buffalo. There, the specimens were stored in polycarbonate petri-dishes at -20°C until extractions were performed. Flash frozen leaves from multiple plants of each cultivar were pooled. Next, each group was individually macerated manually for five minutes in methanol using mortar and pestle. To remove particulates, vacuum filtration was performed. The samples were subsequently dried in a vacuum oven, and then the dried residue was reconstituted into 2 mL of HPLC grade methanol. These samples were diluted by 50x prior to ESI FT-ICR analysis.
2.3. ESI FT-ICR Mass Spectrometry
Direct infusion ESI FT-ICR mass spectrometry was conducted using three replicates from each cultivar, the details of which are described previously [14]. Once the mass spectra were collected, the data sets were processed as follows using Bruker Daltonics (Bremen, Germany) Data Analysis 4.0 software. Software was instructed to find all peaks with a signal-to-noise ratio > 3 to produce a peak list. Next, the peak list was subjected to the deconvolution process such that isotopic envelopes were determined, and each individual ionic species was then grouped as part of the given isotopic cluster. A threshold of 0.1% peak area relative to the most intense peak (m/z 1073.506 in each cultivar list, corresponding to ion C67H94NaN4O6) was used. The peak list was reduced to the monoisotopic isotope of each isotopic cluster, and this was the m/z value used in compiling lists for each cultivar.
2.4. Data Processing and Analysis
After compilation of the m/z list for each cultivar, it was first passed through the SoyCyc database of metabolites (https://soycyc.soybase.org/); matches of either protonated, sodiated, or potassiated ions to the known metabolites within 3 ppm mass error was considered a confirmation of the ionic formula. Each list was then filtered through HMDB to discover matches to either protonated, sodiated, or potassiated ions in the database. For endogenous compounds, the 3 ppm mass error was again used to constitute a match. For non-natural compounds, however, a stricter limit of 1 ppm was used to constitute a match between the database and the m/z list. To further annotate the m/z with ionic formulas, each list was converted to the corresponding Kendrick mass and KMD calculated for each ion; ions were then sorted by KMD and plotted as nominal Kendrick mass vs. KMD to assist in identification of ionic formulas to those m/z which did not yet have one. Final lists of ionic formulas from each cultivar were then recorded and compared.
For those m/z values which matched entries in the SoyCyc database, an examination of the metabolic pathways involved was also performed to obtain context on how the cultivars might respond to drought at a molecular level. Note: the absence of an annotated peak in the list does not mean that metabolite is not present; rather, the metabolite is not detected with an abundance greater than 0.1% within the restrictive mass accuracy window employed. Metabolites from each cultivar identified in SoyCyc were the inputs into the Pathway Covering tool (https://pmn.plantcyc.org/cmpd-pwy-coverage.shtml) using a constant cost function; the tool then computed a minimal-cost set of metabolic pathways for Glycine max from each cultivar’s data set. For this analysis, Pathway Tools version 26.0 [42] was used employing data identified within the SoyCyc 10.0.2 database.
3. Results and Discussion
3.1. ESI-FTICR of Soybean Leaf Extracts
Representative direct infusion ESI FT-ICR mass spectra of methanolic leaf extracts are shown for the Pana cultivar (Figure 1a) and the PI 567731 cultivar (Figure 1b). The major components are highly similar for both cultivars, and the same base peak is observed for each at m/z 1073.706; our previous study indicates this molecule is derived from the sodiated ionic species of pheophytin a possessing an additional C12H20O moiety [14]. All of the detected ions are singly-charged. After deconvolution of each mass spectrum in Data Analysis 4.0, a total of 612 distinct isotopic clusters (Supplementary Table S1) were identified for the Pana methanolic extract, while 528 distinct isotopic clusters (Supplementary Table S2) were identified for the PI 567731 methanolic extract. Lists of m/z values using the monoisotopic peak for each cluster were compiled for each cultivar for subsequent comparison with databases and KMD analysis.
3.2. Data Processing to Identify Matches in SoyCyc
The m/z peak list from each cultivar was initially passed through the SoyCyc database to find potential matches to known constituents within 3 ppm mass error. With the Pana cultivar, m/z values were matched to protonated, sodiated, or potassiated ions from known soybean metabolite components in SoyCyc; ionic formulas were assigned based on the matches, and a mass error calculated. For the PI 567731 cultivar, m/z values matched protonated, sodiated, or potassiated ions of known soybean metabolites in SoyCyc. Ionic forms of metabolites detected exclusively in methanol extracts of Pana leaves are listed in Table 1, while ionic forms of the metabolites detected exclusively in methanol extracts of PI 567731 leaves are listed in Table 2.
Leaf extracts from the two cultivars share many ionic formulas that were matched. Prominent amongst these are mono- and diacylglycerols, pheophytin a, chlorophyll a, monosaccharides, disaccharides, xanthins, and vicenin-2 (a flavonoid diglucosylation product). Notable also is the simultaneous presence of plastoquinone, detected with products echinone and plastoquinol, essential components of photosynthetic electron transfer. Likewise, ubiquinol-8 and -9 are detected along with 3-demethylubiquinol-9 and demethylmenaquinol-8, key components of aerobic respiration and photosynthetic electron transfer. The metabolite cycloeucalenone is involved in phytosterol biosynthesis. Glutathione disulfide, the oxidized form of glutathione monomer, is also detected in both cultivar leaf extracts.
Pana is a drought-sensitive soybean cultivar. Using the known soybean metabolites identified in Table 1, there are several molecules from the class of carboxylic acids present in Pana that are not detected in PI 567731; these are essential precursors to lipids. Carlactone is an oxidation product of cartenal, possibly indicating oxidative stress in Pana, even in the control which has not experienced drought. This is further supported by the presence of glutathione disulfide (although this metabolite is also detected in the PI 567731 extracts). Galactopinitols are required substrates and products of galactosylcyclitol biosynthesis. The compound 15-cis-phytoene is needed for production of plastoquinol and carotenes. Likewise, menoquinol-8 is a polyprenyl quinone required for electron transport. A more diverse complement of pheophytins and chlorophylls are detected in Pana in comparison to PI 567731 (e.g., chlorophyll b was only detected in Pana). However, our earlier work showed that PI 567731 maintains greater levels of pheophytins and chlorophylls during drought [14].
In contrast, PI 567731 is a drought-tolerant soybean cultivar. As shown in Table 2, five such metabolites are detected in the methanolic extract of PI 567731 leaves. The galactosyl glycerol compound is 3-β-D-galactosyl-sn-glycerol, formed from the degradation of diacyl glycerols. Soyasapogenol B is a key precursor in the formation of its glucuronide. There are many possible structures for the trisaccharides, so anabolism of more complex saccharides from mono- and disaccharides might explain the appearance of trisaccharides here. Plastoquinones are electron carriers that are necessary building blocks for plastoquinol, and are found in chloroplasts, thus playing a central role in the photosynthetic electron transport chain.
3.3. Kendrick Mass Defect (KMD) Analysis
Although soybean metabolites are not human metabolites, it is recognized that they may share molecular formulas with common human metabolites. It is commonly recognized that plant metabolomes possess far greater molecular diversity than most organisms [43]. Indeed, collectively plants produce an estimate of 100,000 to 1 million metabolites, many of which play roles in resistance or tolerance to stressors, both biotic and abiotic in nature [43]. Here, the peak list for each soybean leaf cultivar was imported into HMDB and searched against possible matches to protonated, sodiated, or potassiated molecular formulas with known components of the human metabolome and exposome. In each case ionic formulas were matched within 3 ppm; in a few cases where a metabolite was not natural in humans, and is instead due to contact with a component in the environment, and therefore part of the human exposome, a stricter setting of 1 ppm mass error was tolerated to be a match; it should be noted that the vast majority of matches indicated less than 1 ppm error. This analysis yielded more than 300 matches between m/z and ionic formula for each cultivar.
Once these lists had been compiled after HMDB import, KMD were computed for each individual m/z value in each cultivar, then sorted according to their calculated KMD in Excel. This step, coupled with plotting KMD vs. nominal Kendrick mass for each cultivar, was essential for the annotation of several additional ionic formulas. The utility of Kendrick plots is highlighted by Figure 2, which is a Kendrick plot for the Pana leaf methanolic extract over the Kendrick nominal mass range of 550-750. Several features become apparent when displayed in this way that are valuable for annotation of complex mixtures. First, as shown by the solid lines, species which differ by two hydrogen atoms form diagonals with parallel slopes, enabling determination of many ionic formulas graphically when one member of the class is known. Second, horizontal lines represent chemical classes that differ only in the number of alkyl units. In metabolomics, this is often represented by ethylene (C2H4) differences common to fatty acids and acylglycerols; one example is shown in Figure 2 as a dashed line.
The net result after orthogonal KMD analysis yields assignment of more than 400 ionic formulas to the metabolites in the Pana leaf extracts (Supplementary Table 1), and more than 300 in the PI 567731 leaf extracts (Supplementary Table 2). Most of these formulas do not correlate with any compounds currently catalogued in SoyCyc. To date, application of KMD for the analysis of plant metabolites is sparse [37]; clearly, application of KMD after filtering m/z lists through databases considerably expands the total number of ionic formulas identified. Because many of these are identified for the first time, the results indicate that this process of filtering high mass accuracy spectra through databases for initial formula identification followed by KMD analysis generates an expanded inventory of leaf metabolites from different soybean cultivars.
3.4. Metabolic Pathways Analysis of Cultivars
Having matched molecular formulas to compounds in the SoyCyc and Human Metabolome Database, a list of the compounds which matched entries in SoyCyc was created for each cultivar. Each list (Pana, Supplementary Table 3; PI 567731, Supplementary Table 4) was an input which was then subjected to metabolic pathways analysis using the Pathway Covering tool as described in the Materials and Methods section.
Metabolic pathways analysis of the drought-susceptible Pana cultivar using a constant cost function and a minimal-cost set of metabolic pathways for Glycine max resulted in the calculated pathways indicated in Table 3. Eight distinct metabolic pathways are identified from the methanolic leaf extracts of the Pana cultivar: chlorophyll a degradation II, chlorophyll cycle, glycolipid desaturation, medicarpin conjugates interconversion, phytosterol biosynthesis, plant sterol biosynthesis II, superpathway of carotenoid biosynethesis, and violdelphin biosynthesis. Under the growing conditions used here, the leaves from the Pana cultivar were not under water-stress conditions, rather they were under conventional irrigation conditions. Of particular interest, metabolites from the chlorophyll a degradation II and chlorophyll cycles were identified in a metabolomics study, of the Pana cultivar, although neither leaf age nor stress caused by drought treatment were found to vary in any statistically significant way for Pana cultivar leaf metabolites from these two pathways [14]. Nonetheless, the identification of additional pathways and compounds from them provide potential targets to examine the impact of drought on the Pana cultivar.
The metabolic pathways analysis for the drought-tolerant PI 567731 cultivar is shown in Table 4. Note that the pathways found in Pana are also identified in PI 567731 except for two: the medicaripin conjugates interconversion and violdelphin biosynthesis pathways. The chemical compounds from these common pathways are identical. Here, the growing conditions used do not induce water-stress. However, our previous study found that levels of metabolites from the chlorophyll a degradation II cycle and the chlorophyll cycle detected in PI 567731 methanolic leaf extracts were quantitatively less-impacted by drought-stress than the corresponding metabolites detected from the Pana methanolic leaf extracts [14]. This may be related the water preservation strategy employed by PI 567731, which exhibits the SW phenotype. In addition, quantitative examination of compounds involved in the photosynthetic pathways are clearly warranted, as they provide potential targets for metabolomic profiling in different Glycine max cultivars.
4. Conclusions
In this study, high resolution mass spectrometry was used to identify hundreds of different molecular formulas as being present or absent from leaves of two soybean cultivars with different levels of tolerance to drought under well-watered conditions. Upon KMD analysis of the data, coupled with graphical display of Kendrick mass plots, additional ionized molecular formulas were identified. One particular utility of the Kendrick mass plots was in identification of formulas differing in mass by only two hydrogen atoms, which are readily visualized; this indicates species which likely differ by one degree of unsaturation. Clearly, the use of KMD analysis to expand plant metabolite annotation is a methodology that should be more thoroughly considered. Finally, the m/z data, when filtered through SoyCyc, identified compounds that are key parts of metabolic pathways common to both the Pana and PI 567731 cultivars. These pathways include photosystem pathways involving chlorophyll, glycolipid desaturation, and biosynthetic pathways to generate sterols, phytosterols, and carotenoids. Pathway analysis provides additional viable targets for future study of impacts of abiotic stressors and drought tolerance to soybean plant metabolite expression. Several metabolites including chlorophylls, pheophytins, mono- and diacylglycerols, cycloeucalenone, squalene, and plastoquinones are interesting molecular targets, and identified pathways include those for anabolism and catabolism of chlorophyll, glycolipid desaturation, and biosynthesis of phytosterols, plant sterols, and carotenoids. Such insights may generate focus upon the molecular mechanisms by which certain cultivars adapt to stressors in comparison to other cultivars, and ultimately the utility for metabolomic analysis of plant stress to guide phenotypic expression of plant traits for adaptation.
Supplementary Materials
The following supporting information can be downloaded at the website of this paper posted on Preprints.org, Table S1: Ionic Formulas and KMD Analysis for Species in Pana Leaf Extracts; Table S2: Ionic Formulas and KMD Analysis for Species in PI 567731 Leaf Extracts; Table S3: List of Compounds from Pana Leaf Extracts for Pathways Analysis; Table S4: List of Compounds from PI 567731 Leaf Extracts for Pathways Analysis.
Author Contributions
Conceptualization, T.D.W., K.J.Z., H.Y., and H.T.N.; methodology, T.D.W., E.R.T., A.M.I., K.J.Z., H.Y., and H.T.N.; software, T.D.W. and K.J.Z.; validation, T.D.W., E.R.T., A.M.I., K.J.Z., H.Y., and H.T.N.; formal analysis, T.D.W., E.R.T., A.M.I., K.J.Z., and H.Y.; investigation, T.D.W., E.R.T., A.M.I., K.J.Z., H.Y., and H.T.N.; resources, T.D.W. and H.T.N.; data curation, E.R.T., A.M.I., and K.J.Z.; writing—original draft preparation, T.D.W.; writing—review and editing, T.D.W., E.R.T., A.M.I., K.J.Z., H.Y., and H.T.N; visualization, T.D.W., E.R.T., A.M.I., and K.J.Z.; supervision, T.D.W. and H.T.N.; project administration, T.D.W. and H.T.N.; funding acquisition, T.D.W. and H.T.N. All authors have read and agreed to the published version of the manuscript.
Funding
This research was funded by the New York Corn & Soybean Growers Association (Grants SYBN 21-008, SYBN 22-008, and SYBN 23-010 to T.D.W.), the United Soybean Board (Project #1820-172-0130 to H.T.N.), and the National Center for Research Resources (S10-RR029517 to T.D.W.).
Data Availability Statement
Processed data files are provided as Supplementary Table S1 and S2; original mass spectrometry data will be provided upon request in writing to the corresponding author.
Conflicts of Interest
The authors declare no conflicts of interest.
References
- Lesk, C.; Rowhani, P.; Ramankutty, N. Nature 2016, 529, 84–87. [CrossRef]
- Frederick, J.R.; Camp, C.R.; Bauer, P.J. Crop Sci 2001, 41, 759–763. [CrossRef]
- Das, A.; Rushton, P.J.; Rohila, J.S. Plants-Basel 2017, 6, 21. [CrossRef]
- Ye, H.; Song, L.; Schapaugh, W.T.; Ali, L.; Sinclair, T.R.; Riar, M.K.; Raymond, R.N.; Li, Y.; Vuong, T.; Valliyodan, B.; Neto, A.P.; Klepadlo, M.; Song, Q.J.; Shannon, J.G.; Chen, P.Y.; Nguyen, H.T. J Exp Bot 2020, 71, 642–652. [CrossRef]
- Pathan, S.M.; Lee, J.D.; Sleper, D.A.; Fritschi, F.B.; Sharp, R.E.; Carter, T.E.; Nelson, R.L.; King, C.A.; Schapaugh, W.T.; Ellersieck, M.R.; Nguyen, H.T.; Shannon, J.G. J Agron Crop Sci 2014, 200, 231–236. [CrossRef]
- Du, Y.L.; Zhao, Q.; Chen, L.R.; Yao, X.D.; Zhang, H.J.; Wu, J.J.; Xie, F.T. Int J Mol Sci 2020, 21. [CrossRef]
- Ncube, E.; Mohale, K.; Nogemane, N. Curr Issues Mol Biol 2022, 44, 4181–4196. [CrossRef]
- Silva, E.; Belinato, J.R.; Porto, C.; Nunes, E.; Guimaraes, F.; Meyer, M.C.; Pilau, E.J. J Agr Food Chem 2021, 69, 7257–7267. [CrossRef]
- Jervis, J.; Kastl, C.; Hildreth, S.B.; Biyashev, R.; Grabau, E.A.; Saghai-Maroof, M.A.; Helm, R.F. J Agr Food Chem 2015, 63, 9879–9887. [CrossRef]
- Komatsu, S.; Nakamura, T.; Sugimoto, Y.; Sakamoto, K. Protein Peptide Lett 2014, 21, 865–884. [CrossRef]
- Wang, X.Y.; Li, Y.P.; Wang, X.J.; Li, X.M.; Dong, S.K. Bot Stud 2022, 63, 8. [CrossRef]
- Velickovic, D.; Agtuca, B.J.; Stopka, S.A.; Vertes, A.; Koppenaal, D.W.; Pasa-Tolic, L.; Stacey, G.; Anderton, C.R. Isme J 2018, 12, 2335–2338. [CrossRef]
- Yilmaz, A.; Rudolph, H.L.; Hurst, J.J.; Wood, T.D. Anal Chem 2016, 88, 1188–-1194. [CrossRef]
- Zemaitis, K.J.; Ye, H.; Nguyen, H.T.; Wood, T.D. Metabolites 2021, 11. [CrossRef]
- Bragagnolo, F.S.; Funari, C.S.; Ibanez, E.; Cifuentes, A. Foods 2021, 10, 1308. [CrossRef]
- Kendrick, E. Anal Chem 1963, 35, 2146–2154. [CrossRef]
- Hughey, C.A.; Hendrickson, C.L.; Rodgers, R.P.; Marshall, A.G. Energ Fuel 2001, 15, 1186–-1193. [CrossRef]
- Hughey, C.A.; Hendrickson, C.L.; Rodgers, R.P.; Marshall, A.G.; Qian, K. Anal Chem 2001, 73, 4676–4681. [CrossRef]
- Chainet, F.; Ponthus, J.; Lienemann, C.P.; Courtiade, M.; Donard, O.F. Anal Chem 2012, 84, 3998–4005. [CrossRef]
- Cody, R.B.; Fouquet, T. J Am Soc Mass Spectrom 2018, 29, 2110–2113. [CrossRef]
- Spiegel, M.T.; Anthony, I.G.M.; Brantley, M.R.; Hassell, A.; Farmer, P.J.; Solouki, T. Energ Fuel 2018, 32, 10549–10555. [CrossRef]
- Sato, H.; Nakamura, S.; Teramoto, K.; Sato, T. J Am Soc Mass Spectrom 2014, 25, 1346–1355. [CrossRef]
- Fouquet, T.; Sato, H. Rapid Commun Mass Spectrom 2016, 30, 1361–1364. [CrossRef]
- Cody, R.B.; Fouquet, T. Anal Chim Acta 2017, 989, 38–44. [CrossRef]
- Fouquet, T.; Sato, H. Mass Spectrom (Tokyo) 2017, 6, A0055. [CrossRef]
- Fouquet, T.; Sato, H. Anal Chem 2017, 89, 2682–2686. [CrossRef]
- Fouquet, T.; Shimada, H.; Maeno, K.; Ito, K.; Ozeki, Y.; Kitagawa, S.; Ohtani, H.; Sato, H. J Oleo Sci 2017, 66, 1061–1072. [CrossRef]
- Cody, R.B.; Fouquet, T. Anal Chem 2018, 90, 12854–12860. [CrossRef]
- Fouquet, T.N.J.; Cody, R.B.; Ozeki, Y.; Kitagawa, S.; Ohtani, H.; Sato, H. J Am Soc Mass Spectrom 2018, 29, 1611–1626. [CrossRef]
- Korf, A.; Fouquet, T.; Schmid, R.; Hayen, H.; Hagenhoff, S. Anal Chem 2020, 92, 628–633. [CrossRef]
- He, H.; Conrad, C.A.; Nilsson, C.L.; Ji, Y.J.; Schaub, T.M.; Marshall, A.G.; Emmett, M.R. Anal Chem 2007, 79, 8423–8430. [CrossRef]
- Lerno, L.A., Jr.; German, J.B.; Lebrilla, C.B. Anal Chem 2010, 82, 4236–4245. [CrossRef]
- Korf, A.; Vosse, C.; Schmid, R.; Helmer, P.O.; Jeck, V.; Hayen, H. Rapid Commun Mass Spectrom 2018, 32, 981–991. [CrossRef]
- Chevalier, M.; Ricart, E.; Hanozin, E.; Pupin, M.; Jacques, P.; Smargiasso, N.; De Pauw, E.; Lisacek, F.; Leclere, V.; Flahaut, C. J Am Soc Mass Spectrom 2019, 30, 2608–2616. [CrossRef]
- Blanc, L.; Ferraro, G.B.; Tuck, M.; Prideaux, B.; Dartois, V.; Jain, R.K.; Desbenoit, N. Anal Chem 2021, 93, 16314–16319. [CrossRef]
- Muller, W.H.; Verdin, A.; Kune, C.; Far, J.; De Pauw, E.; Malherbe, C.; Eppe, G. Anal Bioanal Chem 2021, 413, 2821–2830. [CrossRef]
- Zarev, Y.; Popova, P.; Foubert, K.; Ionkova, I.; Pieters, L. Phytochem Anal 2021, 32, 446–456. [CrossRef]
- Richardson, L.T.; Neumann, E.K.; Caprioli, R.M.; Spraggins, J.M.; Solouki, T. Anal Chem 2022, 94, 5504–5513. [CrossRef]
- Rivas-Ubach, A.; Liu, Y.; Bianchi, T.S.; Tolic, N.; Jansson, C.; Pasa-Tolic, L. Anal Chem 2018, 90, 6152–6160. [CrossRef]
- Brown, A.V.; Conners, S.I.; Huang, W.; Wilkey, A.P.; Grant, D.; Weeks, N.T.; Cannon, S.B.; Graham, M.A.; Nelson, R.T. Nucleic Acids Res 2021, 49, D1496–D1501. [CrossRef]
- Wishart, D.S.; Tzur, D.; Knox, C.; Eisner, R.; Guo, A.C.; Young, N.; Cheng, D.; Jewell, K.; Arndt, D.; Sawhney, S.; Fung, C.; Nikolai, L.; Lewis, M.; Coutouly, M.A.; Forsythe, I.; Tang, P.; Shrivastava, S.; Jeroncic, K.; Stothard, P.; Amegbey, G.; Block, D.; Hau, D.D.; Wagner, J.; Miniaci, J.; Clements, M.; Gebremedhin, M.; Guo, N.; Zhang, Y.; Duggan, G.E.; MacInnis, G.D.; Weljie, A.M.; Dowlatabadi, R.; Bamforth, F.; Clive, D.; Greiner, R.; Li, L.; Marrie, T.; Sykes, B.D.; Vogel, H.J.; Querengesser, L. Nucleic Acids Res 2007, 35, D521–D526. [CrossRef]
- Karp, P.D.; Midford, P.E.; Billington, R.; Kothari, A.; Krummenacker, M.; Latendresse, M.; Ong, W.K.; Subhraveti, P.; Caspi, R.; Fulcher, C.; Kesseler, I.M.; Paley, S.M. Brief Bioinform 2021, 22, 109–126. [CrossRef]
- Fang, C.; Fernie, A.R.; Luo, J. Trends Plant Sci 2019, 24, 83–98. [CrossRef]
Figure 1.
Direct infusion ESI FT-ICR mass spectra of methanolic soybean leaf extracts of the cultivars a) Pana and b) PI 567731.
Figure 1.
Direct infusion ESI FT-ICR mass spectra of methanolic soybean leaf extracts of the cultivars a) Pana and b) PI 567731.
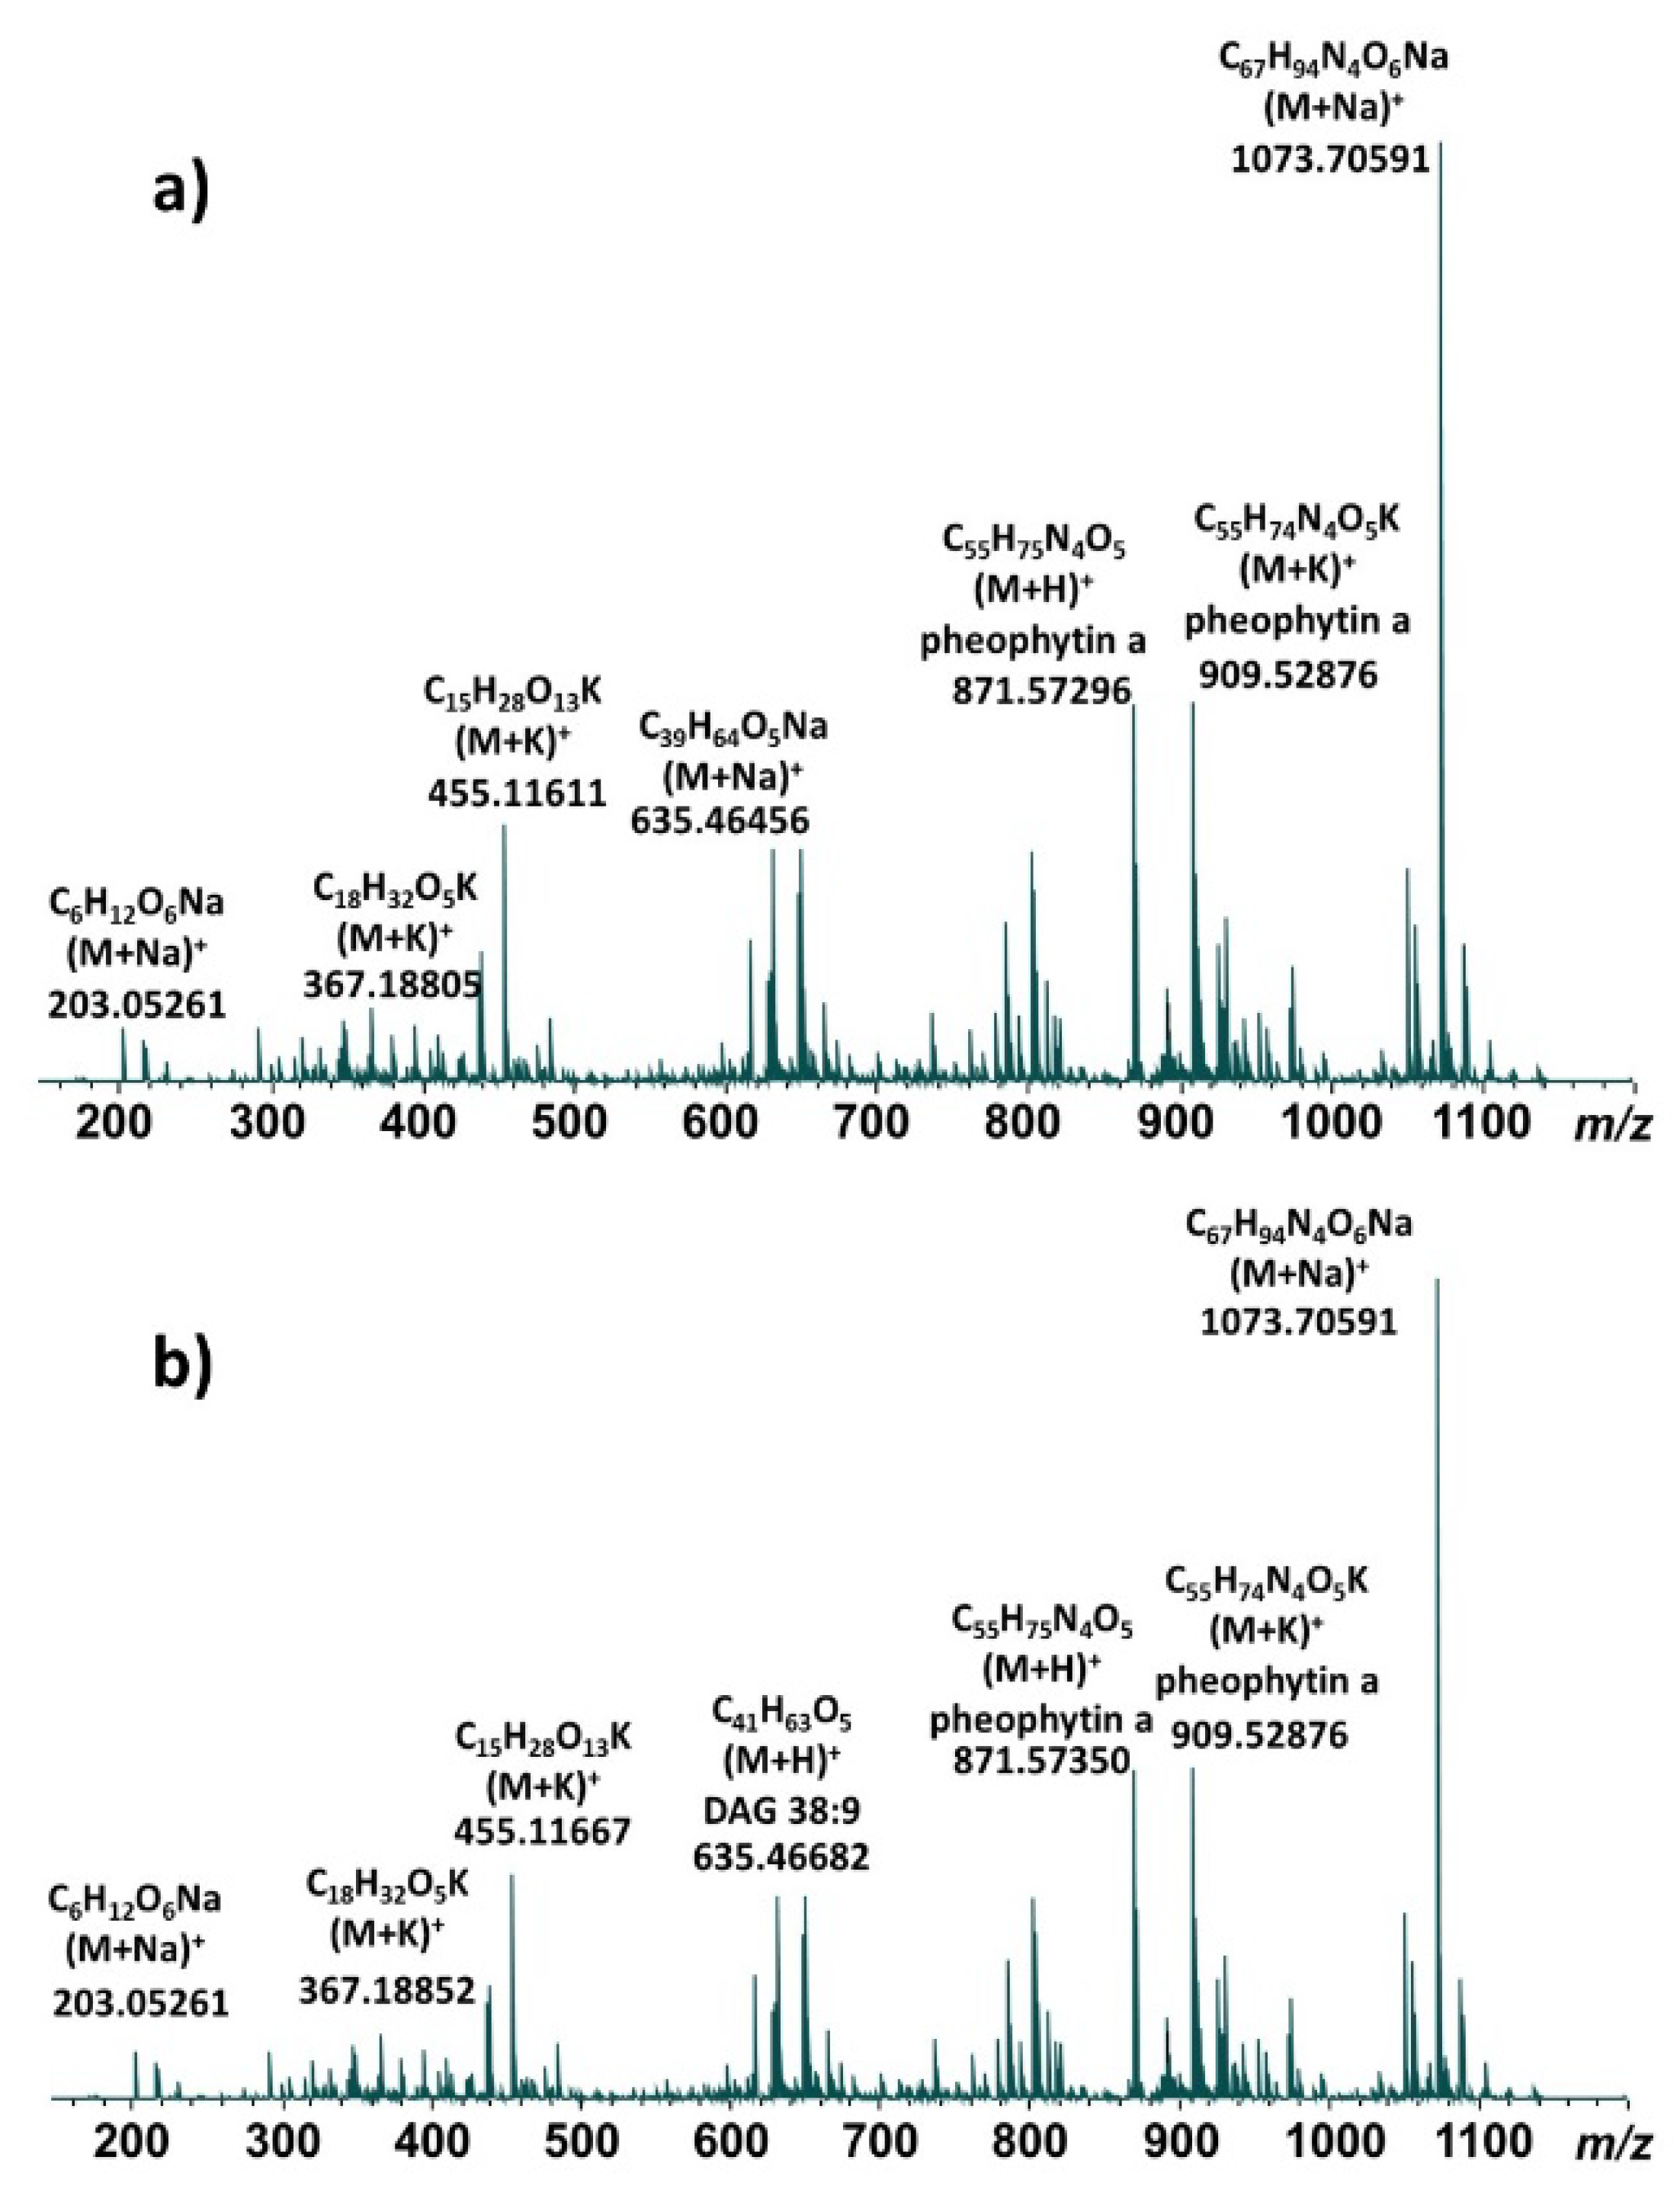
Figure 2.
Kendrick nominal mass plot from 550-750 indicating the metabolites from the Pana extracts. The solid lines represent a series of molecular species differing by only two hydrogen atoms and thus degrees of unsaturation. The dashed line represents metabolites with identical KMD, and in this case differing in composition by C2H4 units.
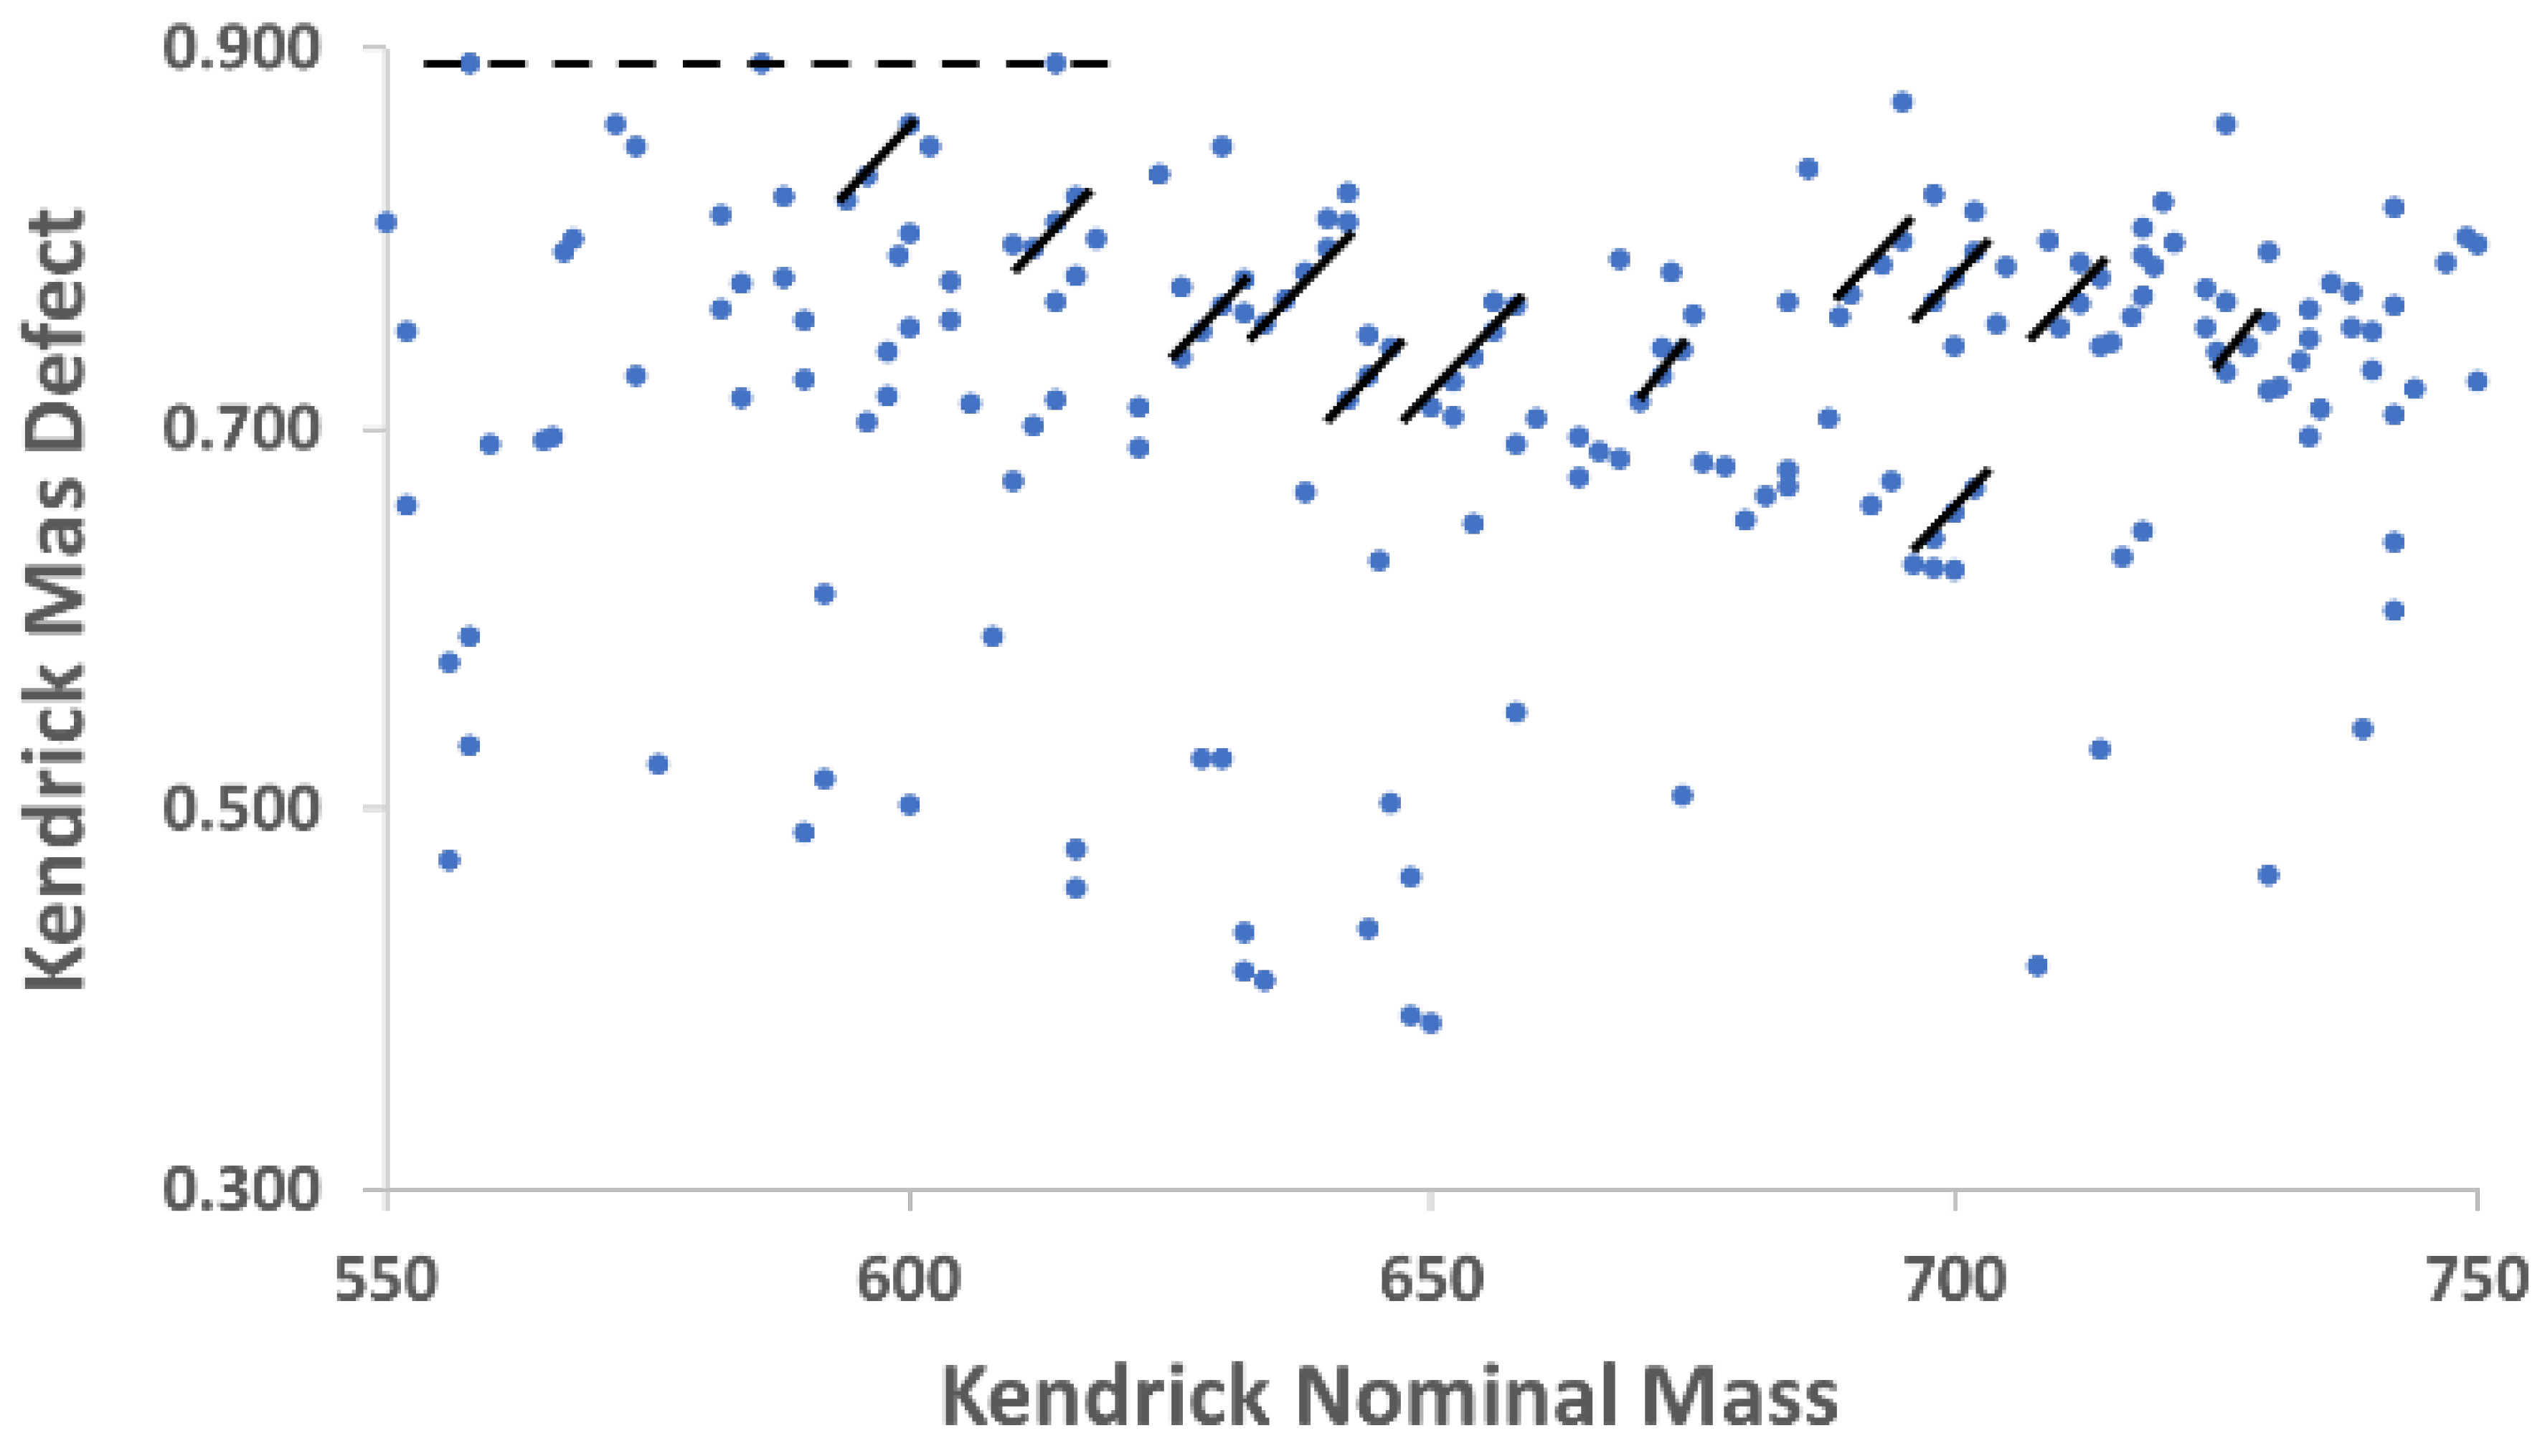

Table 1.
Measured m/z for Ionic Forms of Metabolites Uniquely Detected in Pana Leaf Methanolic Extracts.
Table 1.
Measured m/z for Ionic Forms of Metabolites Uniquely Detected in Pana Leaf Methanolic Extracts.
| Measured m/z | Ion Formula | Mass Error (ppm) | Possible Identification |
| 309.20358 | C16H30NaO4 | -0.16 | Hexdecanedioic acid |
| 325.17755 | C19H26NaO3 | 0.14 | Carlactone |
| 351.17563 | C18H32KO2S | 0.49 | Carboxylic acid class |
| 353.22983 | C18H34NaO5 | -0.04 | Stearic acid isomers |
| 359.01734 | C15H12KO8 | -2.59 | Carboxylic acid class |
| 365.06327 | C15H18KO8 | -0.15 | Carboxylic acid class |
| 367.10843 | C10H23O14 | 0.54 | Carboxylic acid class |
| 395.17342 | C21H28KN2O3 | 0.68 | Galatopinitol |
| 435.25066 | C23H40KO5 | -0.17 | 5-isomers |
| 471.25074 | C26H40KO5 | 0.02 | Glucoside class |
| 497.18664 | C20H33O14 | -0.32 | 3 isomers |
| 585.37007 | C40H50NaO2 | -0.40 | 15-cis-phytoene |
| 609.27067 | C29H46NaO10S | 0.46 | 3 isomers |
| 647.46492 | C46H66NaO2 | -0.40 | epoxypheophorbide a |
| 649.18953 | C29H38KO14 | 0.33 | Glucoside class |
| 675.49608 | C51H96KO6 | 0.05 | 2 isomers |
| 741.57946 | C17H25NaNO6 | 0.10 | Menaquinol-8 |
| 771.60506 | C56H96KO3 | 0.01 | 34:5-monoglactosyldiacylglycerol |
| 893.55467 | C55H74NaN4O5 | -0.53 | Pheophytin a |
| 907.52140 | C55H71MgN4O6 | -0.50 | Chlorophyll b |
| 923.50859 | C55H72KN4O6 | 0.27 | Pheophytin b |
| 945.47643 | C55H70KMgN4O6 | -1.38 | Chlorophyll b |
Table 2.
Measured m/z for Ionic Forms of Metabolites Uniquely Detected in PI 567731 Leaf Methanolic Extracts.
Table 2.
Measured m/z for Ionic Forms of Metabolites Uniquely Detected in PI 567731 Leaf Methanolic Extracts.
| Measured m/z | Ion Formula | Mass Error (ppm) | Possible Identification |
| 277.08988 | C9H18NaO8 | 1.77 | 3-β-D-galactosyl-sn-glycerol |
| 481.36516 | C30H50NaO3 | -0.12 | Soyasapogenol B |
| 527.15854 | C18H92NaO16 | 0.54 | Trisaccharide class |
| 543.13251 | C18H92KO16 | 0.74 | Trisaccharide class |
| 771.60547 | C50H84KO3 | 0.34 | Plastoquinone |
Table 3.
Metabolic Pathways Analysis for Metabolites Detected in Pana Cultivar Methanolic Leaf Extracts.
Table 3.
Metabolic Pathways Analysis for Metabolites Detected in Pana Cultivar Methanolic Leaf Extracts.
| Pathway | Covered Compounds |
| Chlorophyll a degradation II | Pheophytin a Chlorophyll a |
| Chlorophyll cycle | Chlorophyll a Chlorophyll b |
| Glycolipid desaturation | 1-18:2-2-18:2-monogalactosyldiacylglycerol 1-18:3-2-18:3-monogalactosyldiacylglycerol 1-18:3-2-18:3-digalactosyldiacylglycerol |
| Medicarpin conjugates interconversion | Medicarpin-3-O-glucoside |
| Phytosterol biosynthesis | Cycloeucalenone |
| Plant sterol biosynthesis II | Squalene |
| Super pathway of carotenoid biosynthesis | Antheraxanthin Plastoquinone 15-cis-phytoene |
| Violdelphin biosynthesis | Delphinidin-3-O-rutioside-7-O-glucoside |
Table 4.
Metabolic Pathways Analysis for Metabolites Detected in PI 567731 Cultivar Methanolic Leaf Extracts.
Table 4.
Metabolic Pathways Analysis for Metabolites Detected in PI 567731 Cultivar Methanolic Leaf Extracts.
| Pathway | Covered Compounds |
| Chlorophyll a degradation II | Pheophytin a Chlorophyll a |
| Chlorophyll cycle | Chlorophyll a Chlorophyll b |
| Glycolipid desaturation | 1-18:2-2-18:2-monogalactosyldiacylglycerol 1-18:3-2-18:3-monogalactosyldiacylglycerol 1-18:3-2-18:3-digalactosyldiacylglycerol |
| Phytosterol biosynthesis | Cycloeucalenone |
| Plant sterol biosynthesis II | Squalene |
| Super pathway of carotenoid biosynthesis | Antheraxanthin Plastoquinone 15-cis-phytoene |
Disclaimer/Publisher’s Note: The statements, opinions and data contained in all publications are solely those of the individual author(s) and contributor(s) and not of MDPI and/or the editor(s). MDPI and/or the editor(s) disclaim responsibility for any injury to people or property resulting from any ideas, methods, instructions or products referred to in the content. |
© 2024 by the authors. Licensee MDPI, Basel, Switzerland. This article is an open access article distributed under the terms and conditions of the Creative Commons Attribution (CC BY) license (http://creativecommons.org/licenses/by/4.0/).
Copyright: This open access article is published under a Creative Commons CC BY 4.0 license, which permit the free download, distribution, and reuse, provided that the author and preprint are cited in any reuse.


