
Submitted:
28 December 2024
Posted:
30 December 2024
You are already at the latest version
Abstract
Lanthanide molybdates, with the general formula Ln5.4MoO11.1-δ, are materials known for their mixed proton-ionic conductivity. This study investigated the effects of Pr content and Nb-doping on the crystal structure and electrical properties of the La5.4-xPrxMo1-yNbyO12-δ (x= 0, 1.35, 2.7, 4.05, 5.4; y= 0, 0.1) series. The research focuses on two primary objectives: (i) enhancing the electronic conductivity through the use of Pr4+/Pr3+ redox pairs, and (ii) increasing the ionic conductivity through Nb5+ aliovalent doping. The materials were thoroughly characterized by X-ray powder diffraction (XRD), X-ray photoelectron spectroscopy (XPS), transmission and scanning electron microscopy (TEM and SEM), and complex impedance spectroscopy. The average crystal structure of the materials depends significantly on the Pr content. In general, compositions with higher Pr content crystallize in a cubic fluorite-type structure, whereas lower Pr content stabilizes a rhombohedral polymorph. However, detailed TEM studies reveal a more complex local crystal structure characterized by nanodomains and incommensurate modulations. The highest conductivity values are observed in a N2 atmosphere for compositions with elevated Pr content, attributed to electronic conduction mediated by the Pr4+/Pr3+ redox pair, as confirmed by XPS. These findings highlight the potential of tailored doping strategies to optimize the conducting properties of lanthanide molybdates for specific high-temperatures electrochemical applications.
Keywords:
La5.4MoO12-
; polymorphism
; mixed ionic-electronic conductivity
1. Introduction
High temperature proton conducting ceramics have a wide range of industrial applications due to their exceptional thermal stability, chemical resistance, and mechanical strength. They are commonly used as gas sensor, electrolytes in solid oxide fuel cell and electrolyzers, as well as membranes for hydrogen separation and purification [1,2,3,4,5].
BaCeO3 and BaZrO3 perovskites are among the most commonly studied materials membranes for hydrogen separation due to their high proton conductivity [6,7,8]. However, BaCeO3 suffers for low chemical stability in H2O and CO2 environments, while BaZrO3 despite its improved stability, requires very high sintering temperatures to achieve the desired level of densification. To combine the properties of both materials, BaCe1-xZrxO3 compositions have been investigated. These materials have been optimized through appropriate doping with Yb and Y, with the composition BaZr0.2Ce0.6Y0.1Yb0.1O3 showing the highest proton conductivity values for fuel cell application [9]. However. the high basicity of Ba remains a drawback for application of these materials in CO2 rick environments [10]. For this reason, alternative proton conductors without alkaline earth elements, such as La2Ce2O7 and LaNbO4 have been investigated [11,12,13].
Lanthanum tungstates, La6-xWO12-δ, have emerged as promising proton-conducting materials with tunable properties for both fuel cell electrolytes and ceramic hydrogen separation membranes due to their chemical stability, as well as their resistance to gases such as H2S, CO and CO2 [14,15,16,17]. A strategy for enhancing the electronic conductivity of these materials consists of partially or completely substituting tungsten with molybdenum, resulting in La6-xMoO12-δ compounds, which exhibit higher electronic conductivity due to the easier reducibility of Mo6+ compared to W6+ [18,19,20].
In recent years, our research group has investigated the relationship between composition and synthesis-sintering conditions in lanthanum molybdates, leading to tunable structural and electrical properties [21,22]. The La6-xMoO12-δ series (0 ≤ x ≤ 3) was synthesized using the freeze-drying method, where the precursors were heated to 1500 ºC and subsequently cooled at different rates. Samples that were rapidly cooled from 1500 ºC exhibited a disordered cubic fluorite symmetry. However, at lower cooling rates and for high lanthanum contents (x ≤ 1), two different ordered rhombohedral polymorphs were observed: one with a 7×7×1 superstructure relative to a disordered cubic fluorite denoted as R1; and another with a 5×5×1 superstructure denoted as R2. The crystal structures were satisfactorily determined using a combination of HRTEM images and SAED patterns, employing the De Wolff’s theory and the Rietveld method with neutron powder diffraction data. For lower lanthanum contents, 1.5 ≤ x ≤ 3, the cubic symmetry was favored at high sintering temperatures (1400-1500 ºC) and rapid cooling (5 ºC min-1), while a monoclinic polymorph [23] was obtained at lower sintering temperatures (1100-1300 ºC) and very slow cooling (0.5 ºC min-1).
The preparation conditions and composition significantly influence the electrical properties of lanthanum molybdates. A decrease in ionic conductivity was observed as the La/Mo ratio decreased; however, this was accompanied by an increase in electronic conductivity, significantly enhanced under reducing conditions (5% H2-Ar) [24]. Furthermore, the symmetry and electrical properties of the samples can be tailored through aliovalent substitution of Mo6+ by Nb5+, resulting in the stabilization of the R1 polymorph and an improved ionic conductivity due the generation of additional oxide ion vacancies [24].
On the other hand, Shlyakhtina et al. [25,26] have also studied the structural and electrical properties of molybdates with lanthanides smaller than lanthanum, Ln5.5MoO12−δ, which exhibit different symmetries depending on the ionic radius of the lanthanide. They observed a fluorite-type cubic structure for Ln = Sm3+, Gd3+, and Dy3+ (s.g. ); and a cubic bixbiite type for Ln = Ho3+, Er3+, Tm3+, Yb3+, and Lu3+ (s.g. ), noting a decrease in total conductivity as the size of the lanthanide decreases. In our research group we also have conducted a comprehensive investigation into the relationship between structural and electrical properties and synthesis-sintering conditions for middle-size lanthanides, Ln5.4MoO11.1 (Ln = Nd3+, Sm3+and Gd3+) [27]. As the lanthanide size decreases, the cubic symmetry is favored even at very low cooling rates, likely due to a smaller size mismatch between the lanthanide and molybdenum. Electrical property analysis also revealed lower ionic conductivity for smaller lanthanides, but a significant enhancement in the electronic conductivity in reducing conditions.
Continuing the research on this family of proton conductors, the primary aim of this study is to investigate the influence of Pr-doping in La5.4MoO11.1 to enhance the electronic conductivity. This is motivated by the known effect of the Pr4+/Pr3+ pair in conferring a significant electronic conductivity in energy-applied materials [28,29]. Additionally, it has been reported that Nb5+-doping at the W6+/ Mo6+ site in lanthanum tungstates/molybdates creates oxide vacancies, thereby enhancing ionic conductivity [24,30]. The materials were thoroughly characterized using X-ray powder diffraction, X-ray photoelectron spectroscopy, transmission and scanning electron microscopy and impedance spectroscopy under different gas-flowing atmospheres to evaluate their potential as ceramic membranes for hydrogen separation.
2. Materials and Methods
2.1. Synthesis
La5.4-xPrxMo1-yNbyO12-δ samples (x = 1.35, 2.7. 4.05, 5.4; y = 0, 0.1) were synthesized using a freeze-drying precursor method, following the synthetic procedure described in a previous study for related compositions [21]. The starting reagents used were La2O3 (99.99%, Merck), Pr6O11 (99.9%, Merck), MoO3 (99.5%, Merck) and Nb(HC2O4)5·H2C2O4 (97%, ABCR). Precursor solutions were prepared by dissolving stoichiometric amounts of La2O3 and Pr6O11 in diluted nitric acid, MoO3 in diluted ammonia and Nb(HC2O4)5·H2C2O4 in water. Ethylenediaminetetraacetic acid (EDTA 99.99%, Merck) was added as a chelating agent in a 1:1 metal-to-EDTA ratio. The different cation solutions were mixed under stirring to obtain transparent solutions with a concentration of approximately 0.1 mol L-1 and a pH of 7. The solutions were frozen in liquid nitrogen and dehydrated by vacuum sublimation in a Scanvac-Coolsafe freeze-dryer for 2 days. The dried precursor powders were calcined at 300 ºC for 1 h to partially decompose the solid precursors, followed by calcination at 800 ºC for 1 h to completely remove the carbonaceous species. The resulting powders were pressed into pellets with a diameter of 10 mm and a thickness of 1 mm, then sintered at 1500 ºC for 1 h with a heating rate of 10 ºC min-1, followed by cooling at three different rates: quenching (Q), 5 and 0.5 ºC min-1. The choice of cooling rate is critical as it can tailor the final crystal symmetry and electrical properties of the samples. Some of the obtained pellets were ground into powder for structural studies. Hereafter, all samples are labelled as La5.4-xPrxNby_C, where x and y represent the Pr and Nb content, respectively, and C denotes the cooling rate employed.
2.2. Structural and Microstructural Characterization
The purity and structure of the samples were analysed using laboratory X-ray powder diffraction with a PANalytical Empyrean diffractometer equipped with CuKα1,2 radiation, and a X’Pert Pro MPD (PANalytical) with CuKα1 radiation. The measurements were collected over a 2θ angular range of 10-80º with an acquisition time of 1 h. Phase identification was performed using the X'Pert HighScore Plus software [31], and structural analysis was carried out with the GSAS software [32].
X-ray photoelectron spectroscopy measurements were recorded using a Scienta ESCA 200 spectrometer with a monochromatic X-ray Al(Kα) source (1486.6 eV), operating under an ultra-high vacuum of 10-10 mbar. The experimental methodology for XPS included a full width at half maximum of 0.65 eV for the Au 4f7/2 line. Data analysis was carried out using the Multipak-V9.3 software package [33]. A Shirley-type background was subtracted from the signals, and the recorded spectra were fitted using Gaussian−Lorentzian curves to more accurately determine the binding energy of the different element core levels.
Selected area electron diffraction (SAED) and high-resolution transmission electron microscopy (HRTEM) were employed to study the crystal structure of the materials. TEM specimens were prepared by suspending finely ground powders in acetone and depositing a drop of the mixture onto a holey-carbon Cu grid (EMS). The analysis was performed using a Jeol JEM 2100 electron microscope operating at 200 kV, equipped with a ±25º double-tilt sample holder. Images were analysed using the Digital Micrograph™ software from Gatan [34].
The morphology and cation composition of the ceramic pellets were examined using field emission scanning electron microscopy (FEI-SEM, Helios Nanolab 650), coupled with energy dispersive spectroscopy (EDS, Oxford Instruments). The grain size was determined from the SEM micrographs using the linear intercept method [35].
2.3. Electrical Characterization
The electrical conductivity was determined using impedance spectroscopy with a frequency response analyser (Solartron 1260 FRA) under dry and wet N2 (2% vol. H2O) and wet 5% H2-Ar atmospheres. Measurements were conducted within the frequency range of 0.01 Hz to 1 MHz, applying an AC perturbation of 50 mV while cooling from 750 to 100 °C, with a dwell time of 30 min at each measurement temperature. Pt current collectors were formed by coating the pellet surfaces with Pt-ink (METALOR® 6082) and firing at 800 ºC for 1 h in air. The data were analysed using the ZView program [36].
3. Results
3.1. Phase Formation
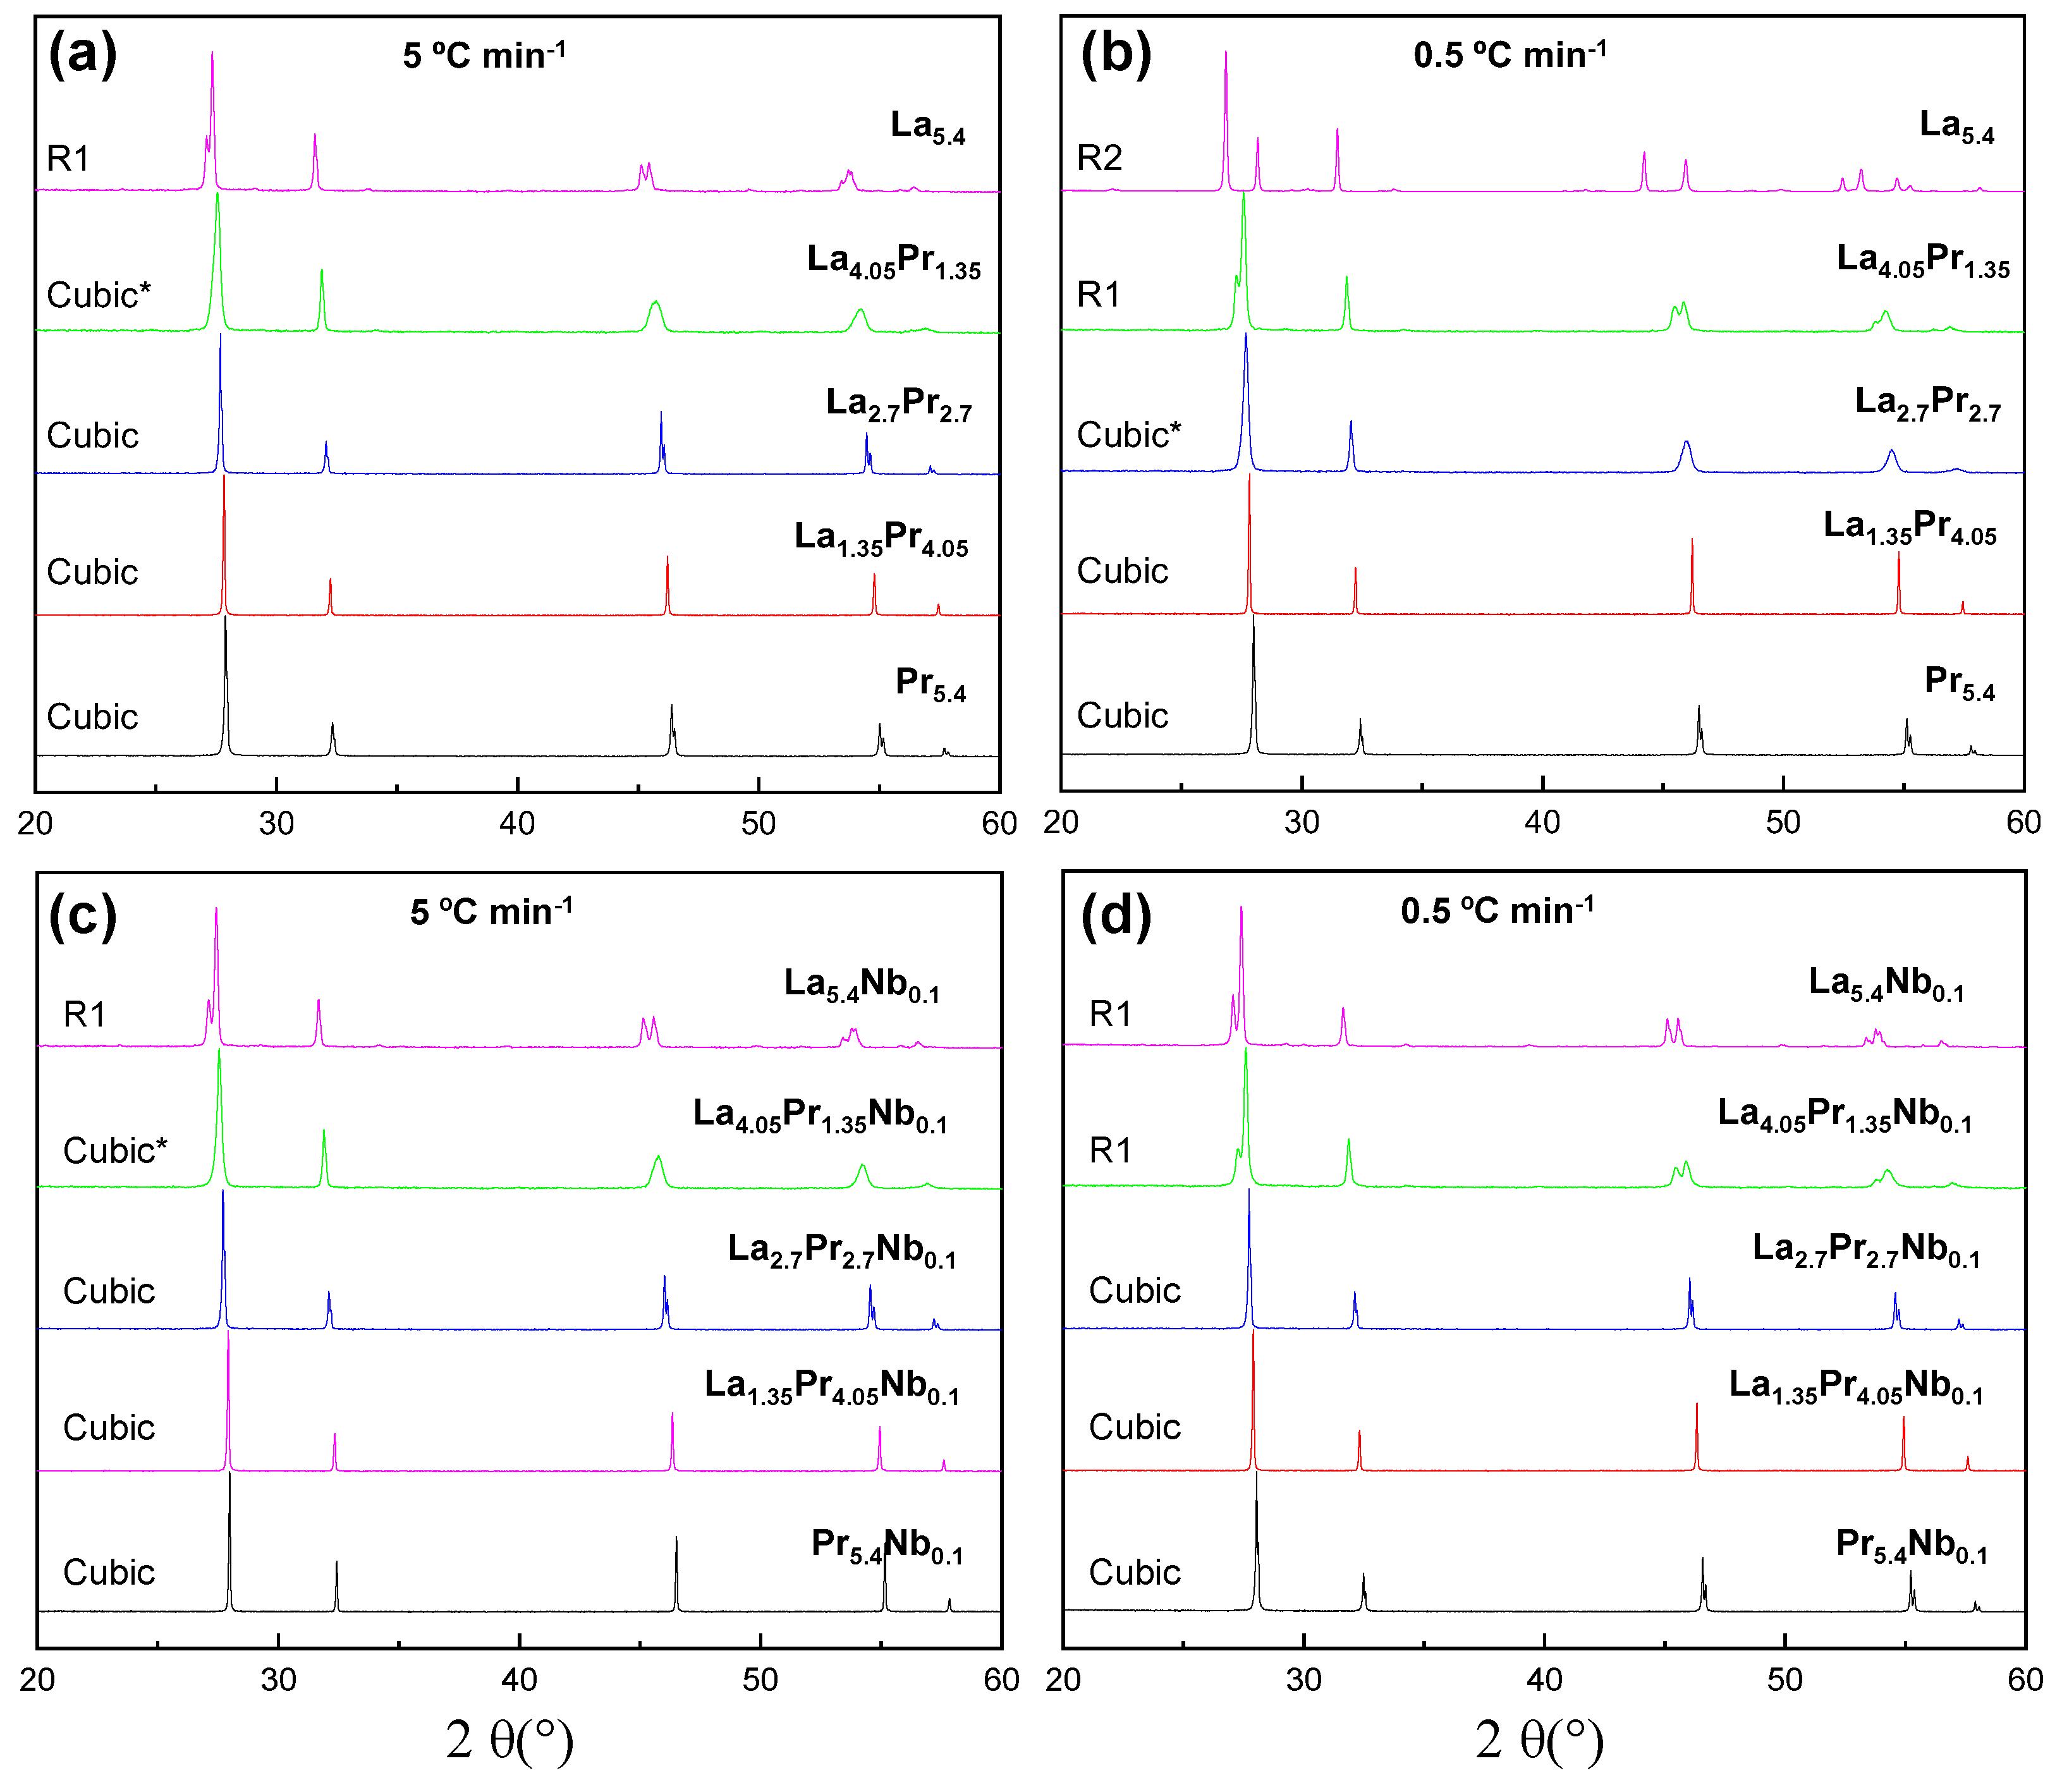
X-ray diffraction patterns of the La5.4-xPrxMo1-yNbyO12-δ series, heated at 1500 ºC for 1 h and subsequently cooled at different rates, are shown in Figures S1 (quenched samples, Q) and Figure 1 (5 and 0.5 ºC min-1 cooling rates). All the samples are single-phase compounds; however, the crystal symmetry is dependent on both the composition and cooling rate employed. Mo volatilization is considered negligible in these compounds, as reported previously for related compositions, based on EDS and Inductively Coupled Plasma measurements [37].
All quenched samples (Q), regardless of the composition, crystallize in a disordered cubic fluorite, similar to La6-xMo1-yNbyO12-δ (x = 0.6 – 3; y = 0 - 0.2) [21,22,24] and Ln5.4MoO11.1 (Ln = Nd, Sm and Gd) series [27], which were also rapidly cooled from 1500 ºC. This behaviour can be attributed to the high thermal vibration of the atoms at 1500 ºC, causing them to occupy the same atomic positions: (0, 0, 0) for the cations (La, Pr, Mo and Nb) and (¼, ¼, ¼) for the oxide anions, all within the space group. Consequently, the quenching process preserves these atomic positions at room temperature, resulting in a high-symmetry cubic fluorite structure.
At lower cooling rates, such as 5 and 0.5 ºC min-1, thermodynamic factors become predominant, favouring the stabilization of the R1 rhombohedral polymorphs. This behaviour can be attributed to the varying ionic radii of the cations: 1.16, 1.02, 1.13, 0.96 and 0.74 Å for La3+, Mo6+, Pr3+, Pr4+ and Nb5+, respectively, all in an 8-fold coordination. This size mismatch, along with the lower cooling rates, allows the cations to settle into thermodynamically stable positions, leading to a greater distortion of the coordination spheres and, consequently, a decrease in symmetry. Under these cooling conditions, the cubic symmetry is stabilized as the praseodymium content increases (Figure 1), due to the smaller size of Pr4+ and Pr3+ compared to La3+, which reduces distortions in the molybdenum coordination sphere. The transition from the rhombohedral to the cubic polymorph is gradual with increasing Pr-content. However, La4.05Pr1.35_5, despite having an average cubic structure, shows broad diffraction peaks, suggesting some rhombohedral distortion. In contrast, La2.7Pr2.7_5 exhibits a cubic structure with narrow diffraction peaks. For the samples cooled down at 0.5 ºC min-1, where thermodynamics effects are more pronounced, a higher Pr content is required for stabilizing the cubic phase. La4.05Pr1.35_0.5 can still be considered R1, and La2.7Pr2.70.5 also shows a significant rhombohedral distortion. Complete conversion to the cubic phase is only achieved for La1.35Pr4.05_0.5.
Nb-doping also plays an important role in determining the final symmetry of the samples (Figure 1c,d). For instance, as mentioned earlier, La2.7Pr2.7_0.5 exhibits a rhombohedral distortion, whereas La2.7Pr2.7Nb0.1_0.5, cooled at the same rate, crystallizes into a simple cubic fluorite structure with narrow diffraction peaks. A similar behaviour was observed in a previous work for La5.4MoO11.1 [24], where the undoped sample, cooled down at 0.5 ºC min-1, exhibited an R2 symmetry, while a 10% Nb-doping at the molybdenum site stabilized the R1 structure. This effect is likely due to the generation of oxide vacancies induced by the aliovalent doping, which influences the structural stability and symmetry of the materials.
Figure 1.
XRD patterns for La5.4-xPrxMo1-yNbyO12-δ samples (x = 1.35, 2.7. 4.05, 5.4; y = 0, 0.1) heated at 1500 °C and cooled down at (a,c) 5 °C min−1 and (b,d) 0.5 °C min−1. Symmetry of the samples is display within the figure. Several samples (*) exhibit broad diffraction peaks, suggesting a deviation from cubic symmetry.
3.2. Structural Analysis
The structural characterization of all samples was conducted using the Rietveld method. For the cubic compositions, a simple fluorite structural model was employed, where all cations (La, Mo, Pr and Nb) share the same crystallographic position. Occupancy factors were adjusted to match the theoretical compositions, and isotropic atomic displacement factors were constrained to a single value for consistency. The refinement process included fitting the unit cell, scale factor, background, peak shape coefficients and isotropic displacement parameters.
For the rhombohedral samples, which exhibit more complex crystal structures, a Le Bail analysis was performed using a space group. The structural models previously reported based on neutron powder diffraction [22] could not be used for X-ray diffraction studies, as X-ray radiation is less sensitive to oxygen ordering, which is critical for stabilizing the different polymorphs observed in these samples.
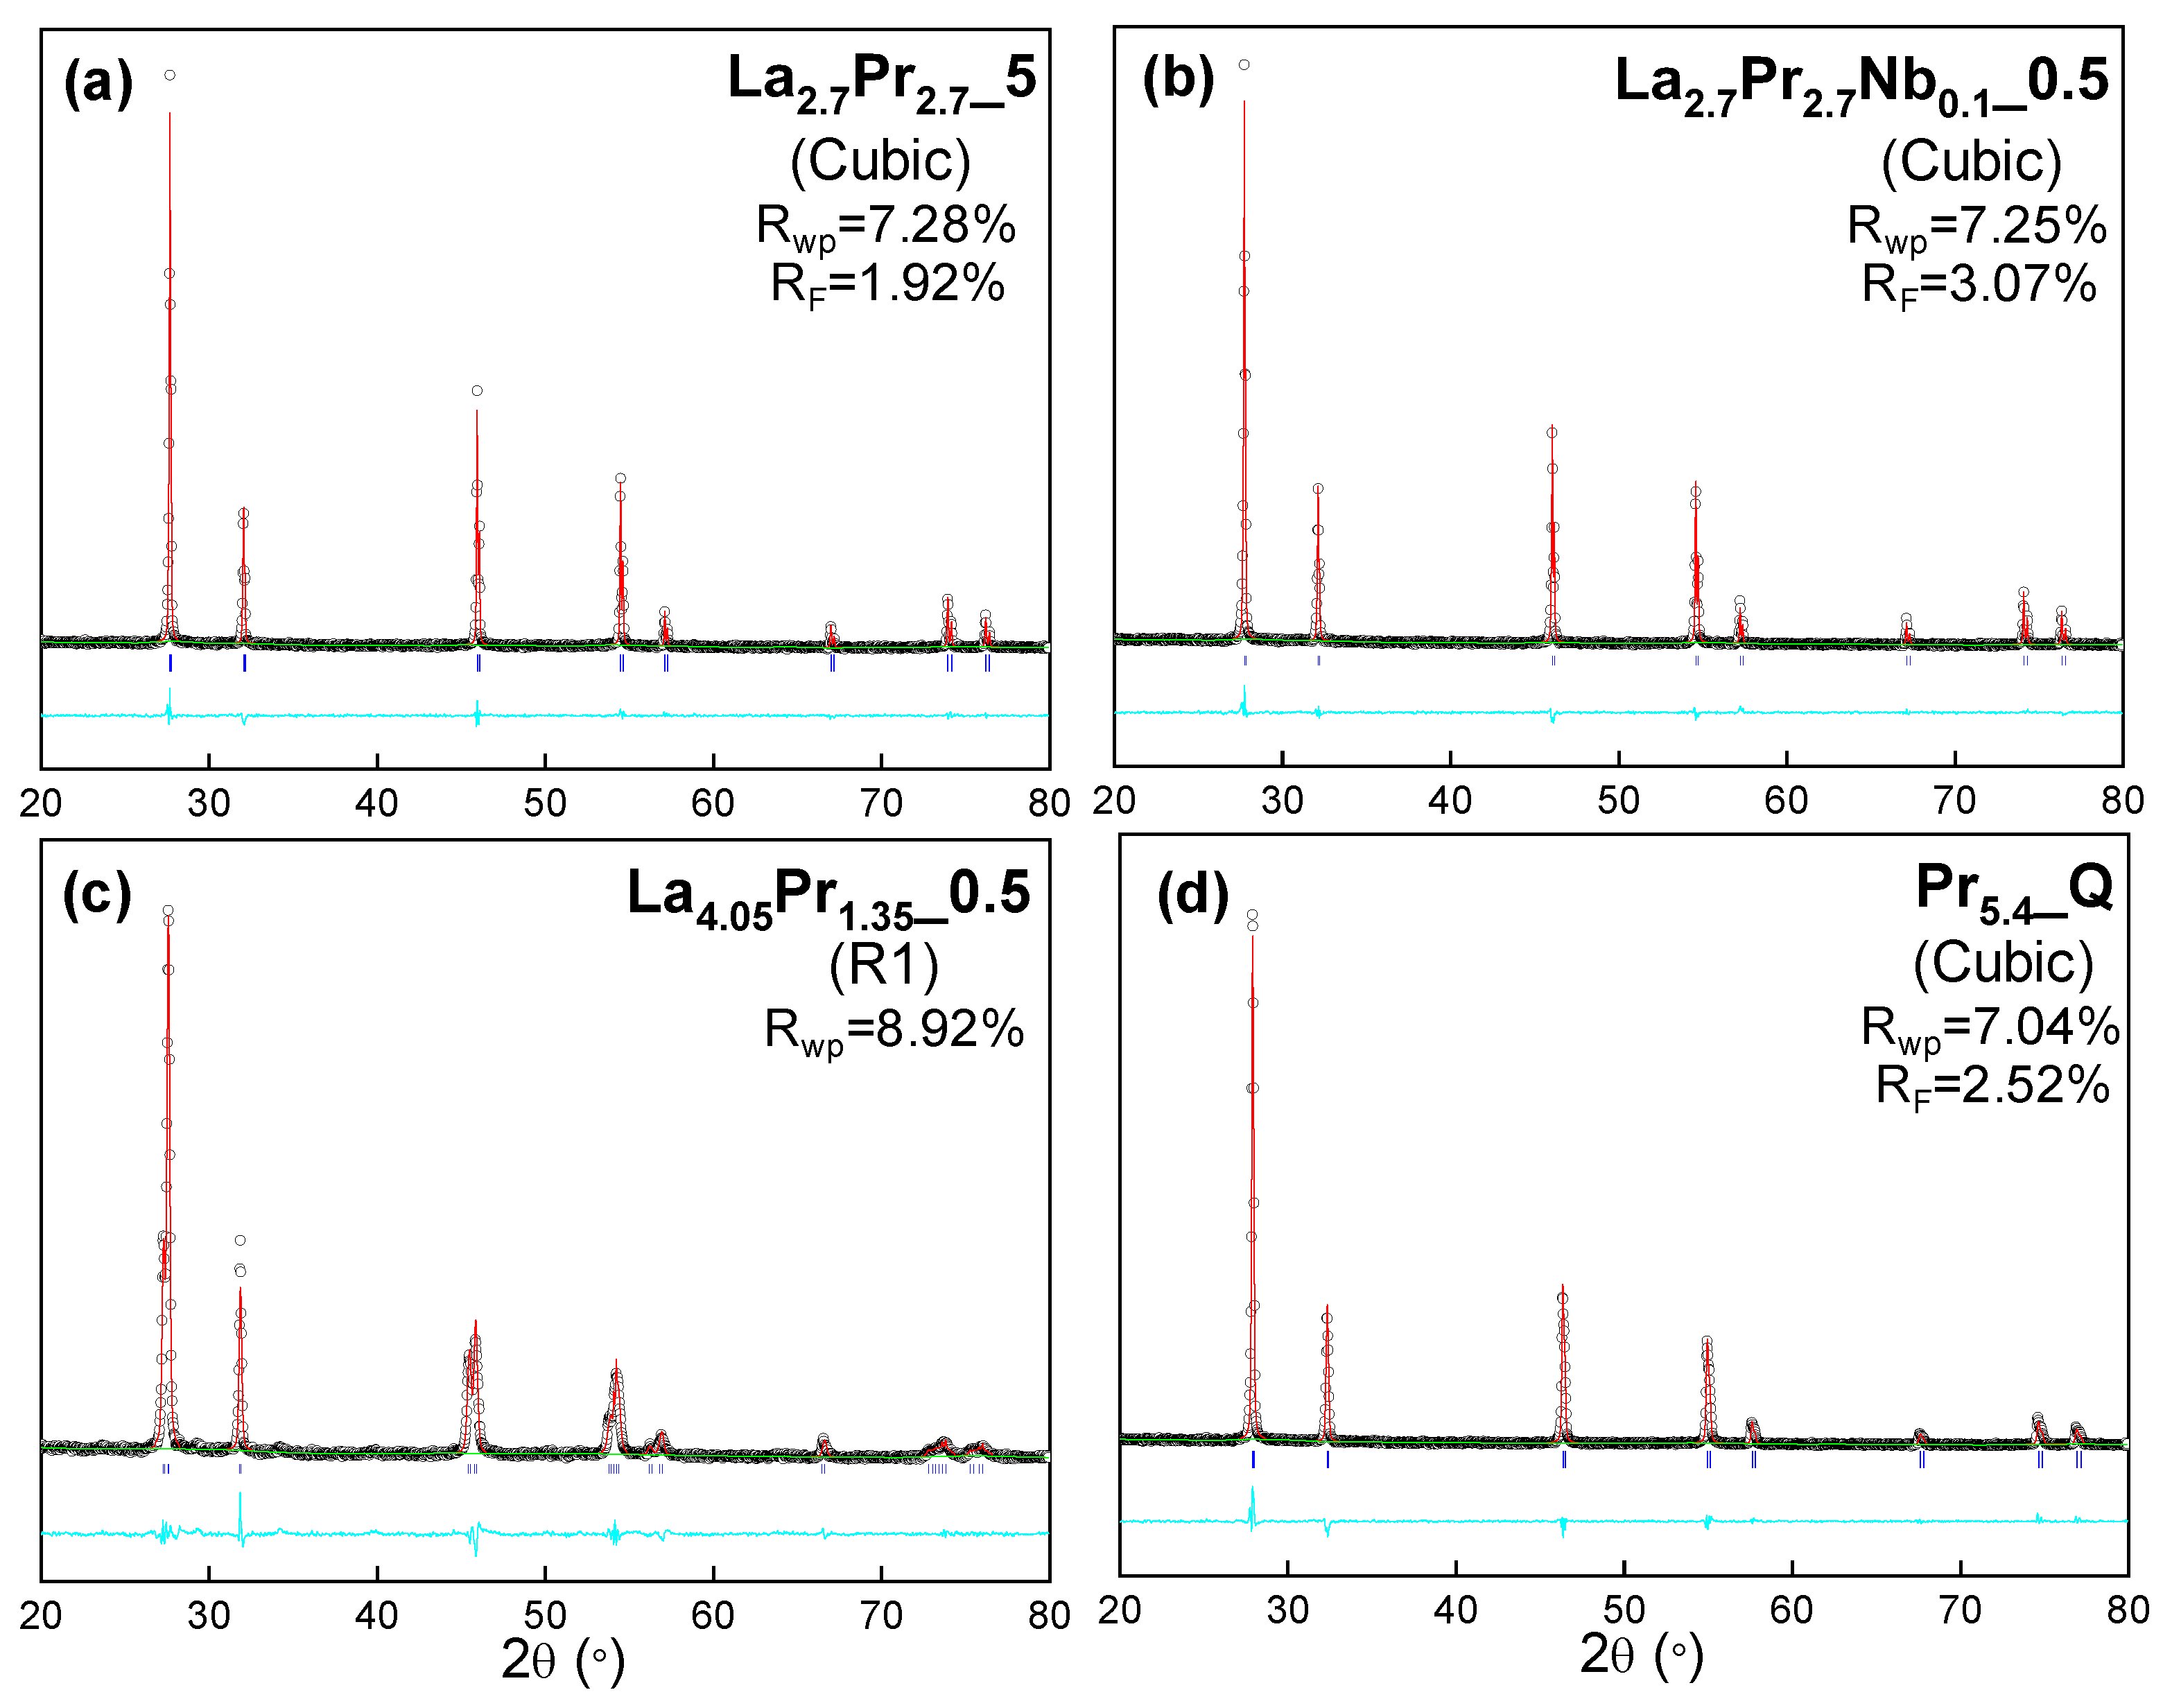
In general, the refinements exhibit very low disagreement factors, typically in the range of 5-12% for Rap and 1-5% for RF (Figure 2 and Table S1). Regardless of the cooling rate, the cell parameters decrease as the Pr content increases, with cell volume values of 45.51(1), 43.87(1) and 42.20(1) Å3 for La5.4_Q, La2.7Pr2.7_Q and Pr5.4_Q, respectively. This reduction in cell volume is attributed to the smaller size of Pr3+/Pr4+ (1.13 and 0.96 Å) compared to La3+ (1.16 Å). Additionally, Nb-doping results in decreased cell volumes for all cooling rates, due to the smaller size of Nb5+ (0.74 Å) compared to Mo6+ (1.02 Å). For instance, La2.7Pr2.7_Q and La2.7Pr2.7Nb0.1_Q exhibit cell volumes of 43.87(1) and 43.67(1) Å3, respectively. Finally, for a given composition, the highest cell volume is consistently observed for the quenched samples, with values of 43.87, 43.57 and 43.58 Å3 for La2.7Pr2.7_Q, La2.7Pr2.7_5 and La2.7Pr2.7_0.5, respectively. This behaviour is possibly caused by the higher reducibility of Pr4+ at elevated temperatures, leading to a higher amount of Pr3+ and thus an increase in the cell volumes. Conversely, at lower cooling rates, the formation of Pr4+ is favoured, resulting in decreased cell parameters.
Figure 2.
XRD Rietveld plots for (a) La2.7Pr2.75, (b) La2.7Pr2.7Nb0.15, (c) La4.05Pr1.350.5 and (d) Pr5.4Q. Crystal system and agreement factors are displayed within the figure. [Observed data (crosses), calculated pattern (red continuous line), difference curve (cyan line) and reflection marks (blue short lines)].
After reduction of the samples in a 5% H2-Ar flowing atmosphere at 800 ºC for 24 h, most of the Pr4+ is potentially reduced to Pr3+, resulting in an increase in cell volume that shows minimal variation regardless the cooling rate. For instance, Pr5.4_Q, Pr5.4_5 and Pr5.4_0.5 exhibit values after reduction of 42.91(1), 42.92(1) and 42.94(1) Å3, respectively, higher than those for the as-prepared simples, 42.34(1), 42.03(1) and 41.99 (1) Å3.
The local crystal structure was further examined using both electron diffraction (SAED) and HRTEM techniques. Figure 3a-c provides a comparative analysis of the SAED patterns obtained for selected compositions along the zone axis. Samples with a high Pr-content (Pr5.4_5) exclusively present reflections corresponding to the cubic fluorite structure (Figure 3a). This identical SAED pattern persists in samples with lower Pr-content, such as La2.7Pr2.7_0.5 (Figure 3b), despite the broad diffraction peaks observed by XRD (Figure 1).
Conversely, a completely different atomic arrangement is observed for La2.7Pr2.7Nb0.1_0.5 after Nb-doping (Figure 3c). The SAED patterns for these samples reveal additional diffraction reflections along specific crystallographic directions, notably [200] and [022]. This observation is consistent with an incommensurate modulation, as evidenced in previous studies using neutron diffraction data for related compositions [24]. Such an incommensurate structure is typically attributed to the local ordering of oxygen vacancies, likely induced by the aliovalent Nb-doping.
zone axis. HRTEM images of (d) Pr5.40.5, (e) La2.7Pr2.70.5, (f) La2.7Pr2.7Nb0.10.5 and (g) La4.05Pr1.355 in the zone axis.
Figure 3.
SAED patterns of (a) Pr5.45, (b) La2.7Pr2.70.5 and (c) La2.7Pr2.7Nb0.10.5 in the
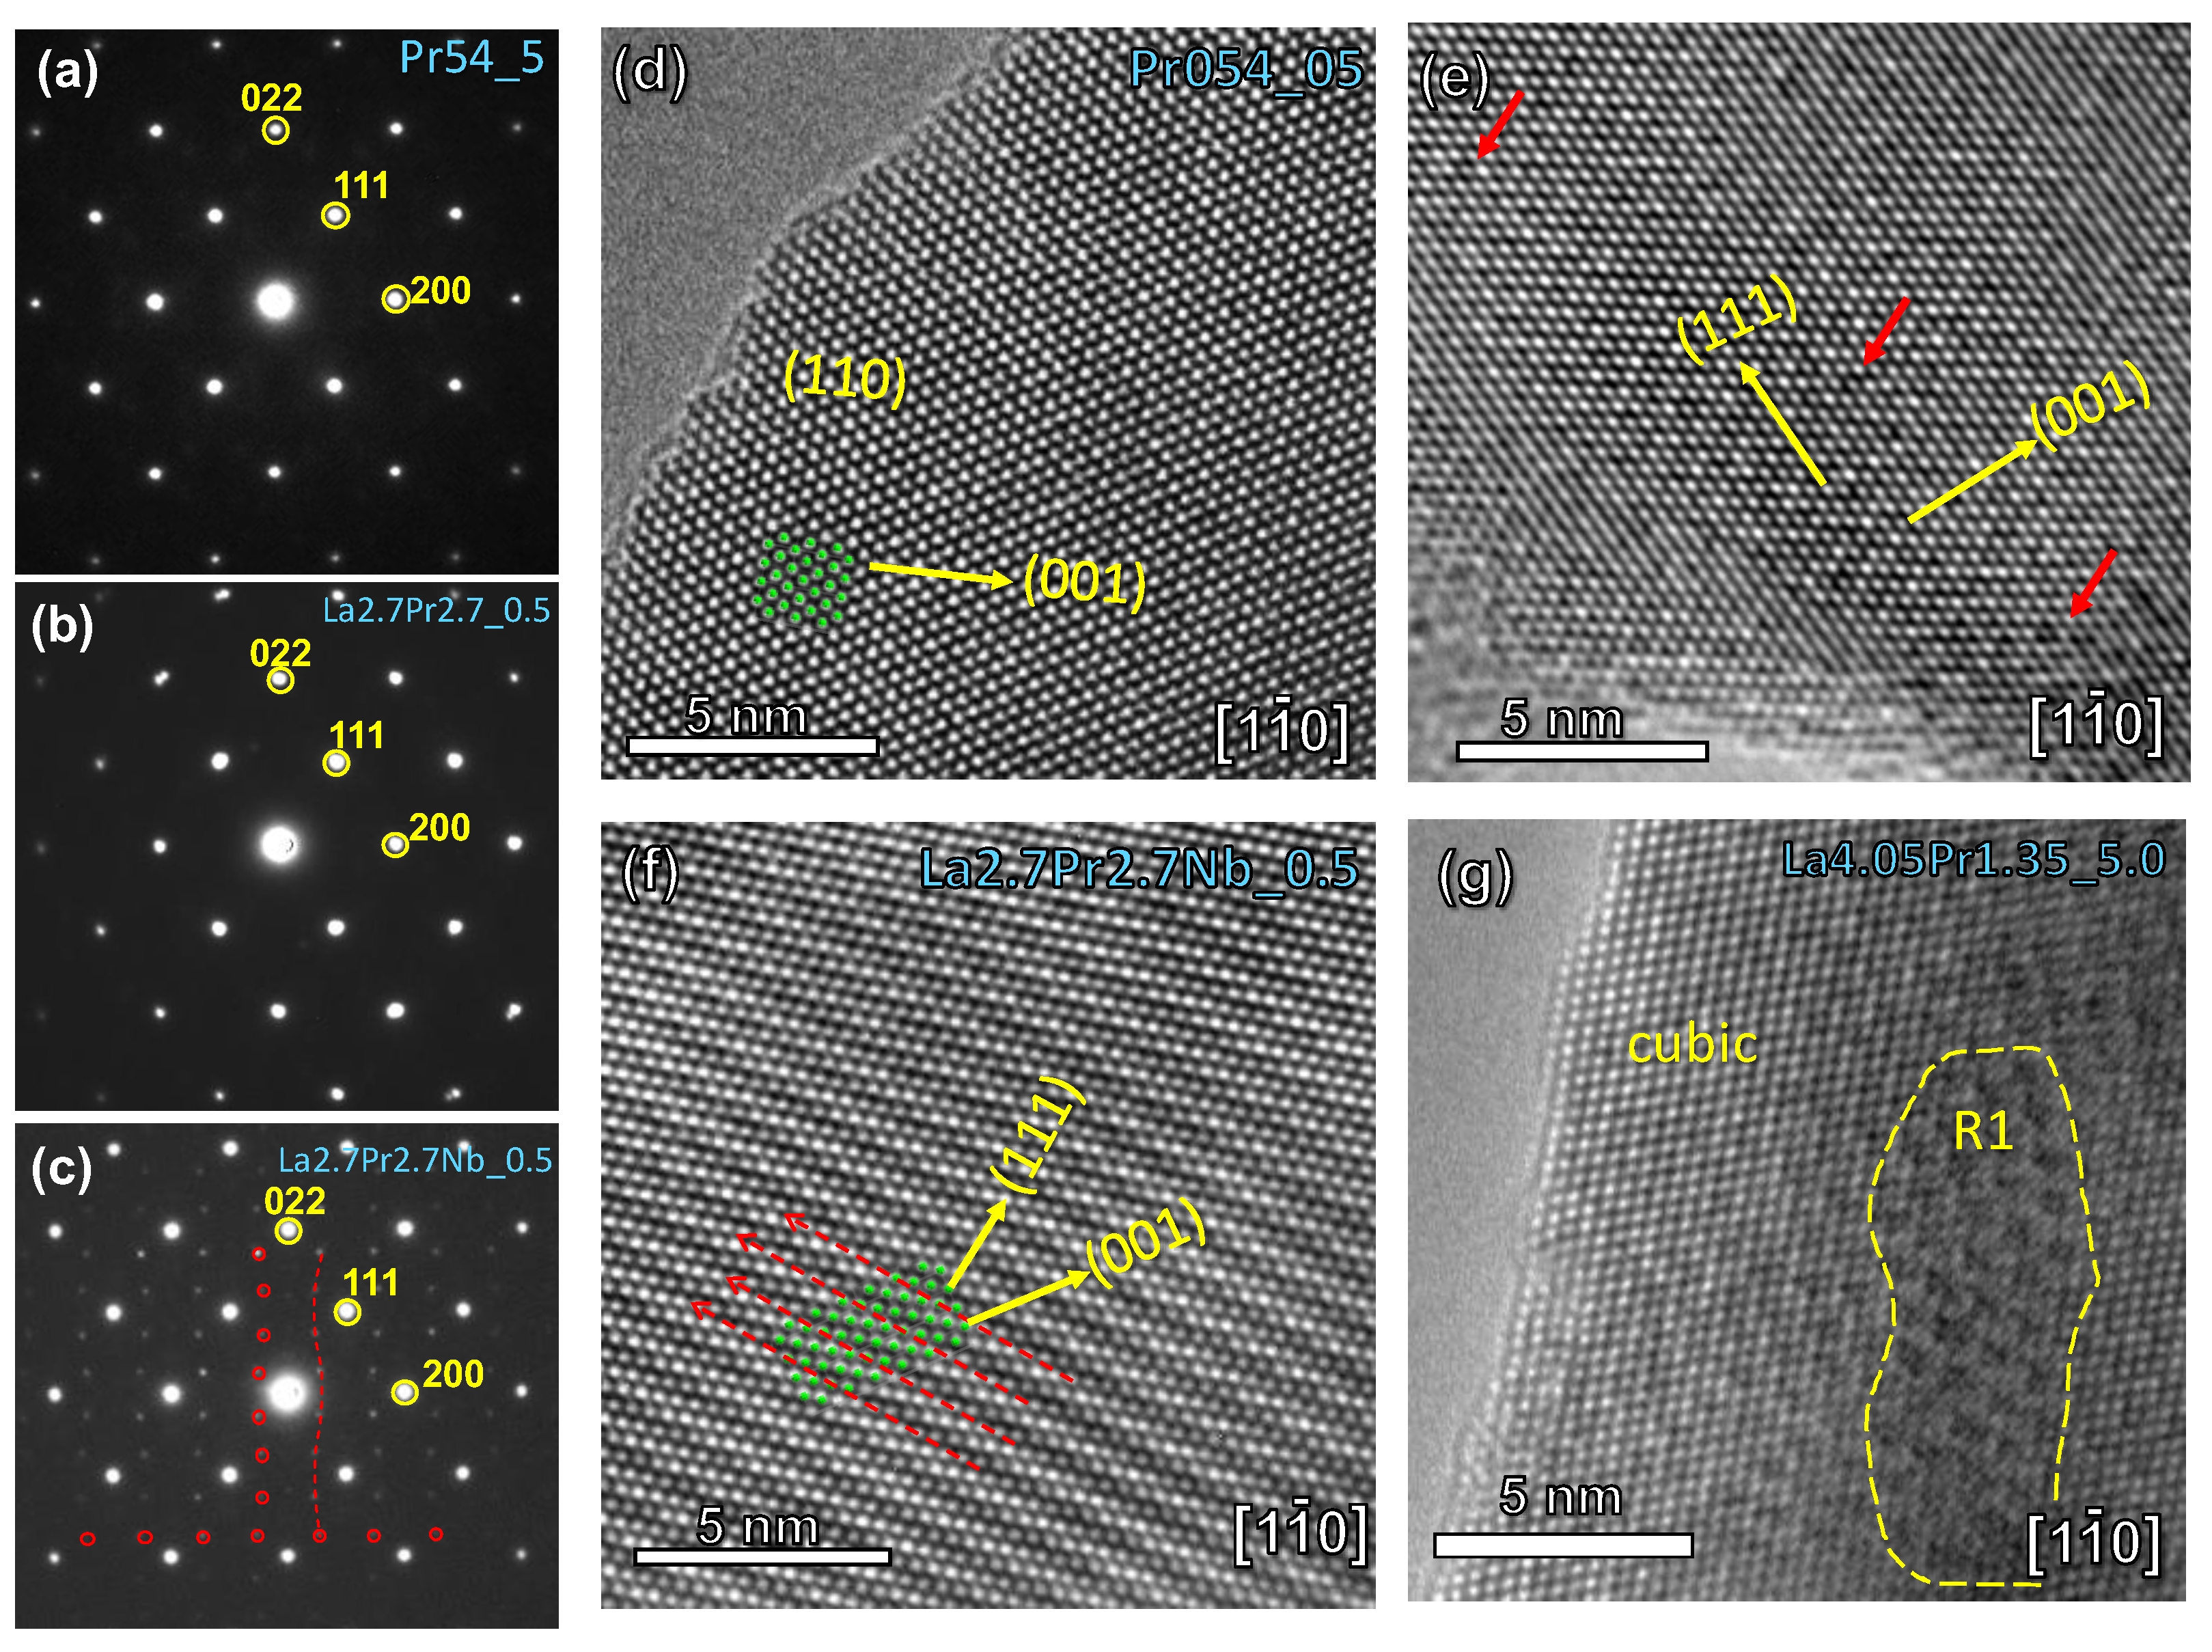
The HRTEM images corroborate the findings derived from the SAED analysis (Figure 3d-g). Pr5.40.5 exhibits an atomic arrangement consistent with a defect-free cubic fluorite structure (Figure 3d). However, as the Pr-content decreases, numerous local defects (marked by red arrows) become apparent, as observed in La2.7Pr2.7_0.5 (Figure 3e). This defect-rich structure transforms into a modulated arrangement with Nb-doping due to the higher concentration of oxygen vacancies (Figure 3f). Finally, in the sample with the lowest Pr-content, La4.05Pr1.35_5, a predominantly cubic fluorite structure is observed, interspersed with embedded microdomains of the R1 polymorph (Figure 3g). These microdomains explain the broad diffraction peaks observed in XRD patterns and the gradual symmetry transition observed as the Pr content increases (Figure 1).
3.3. XPS Analysis
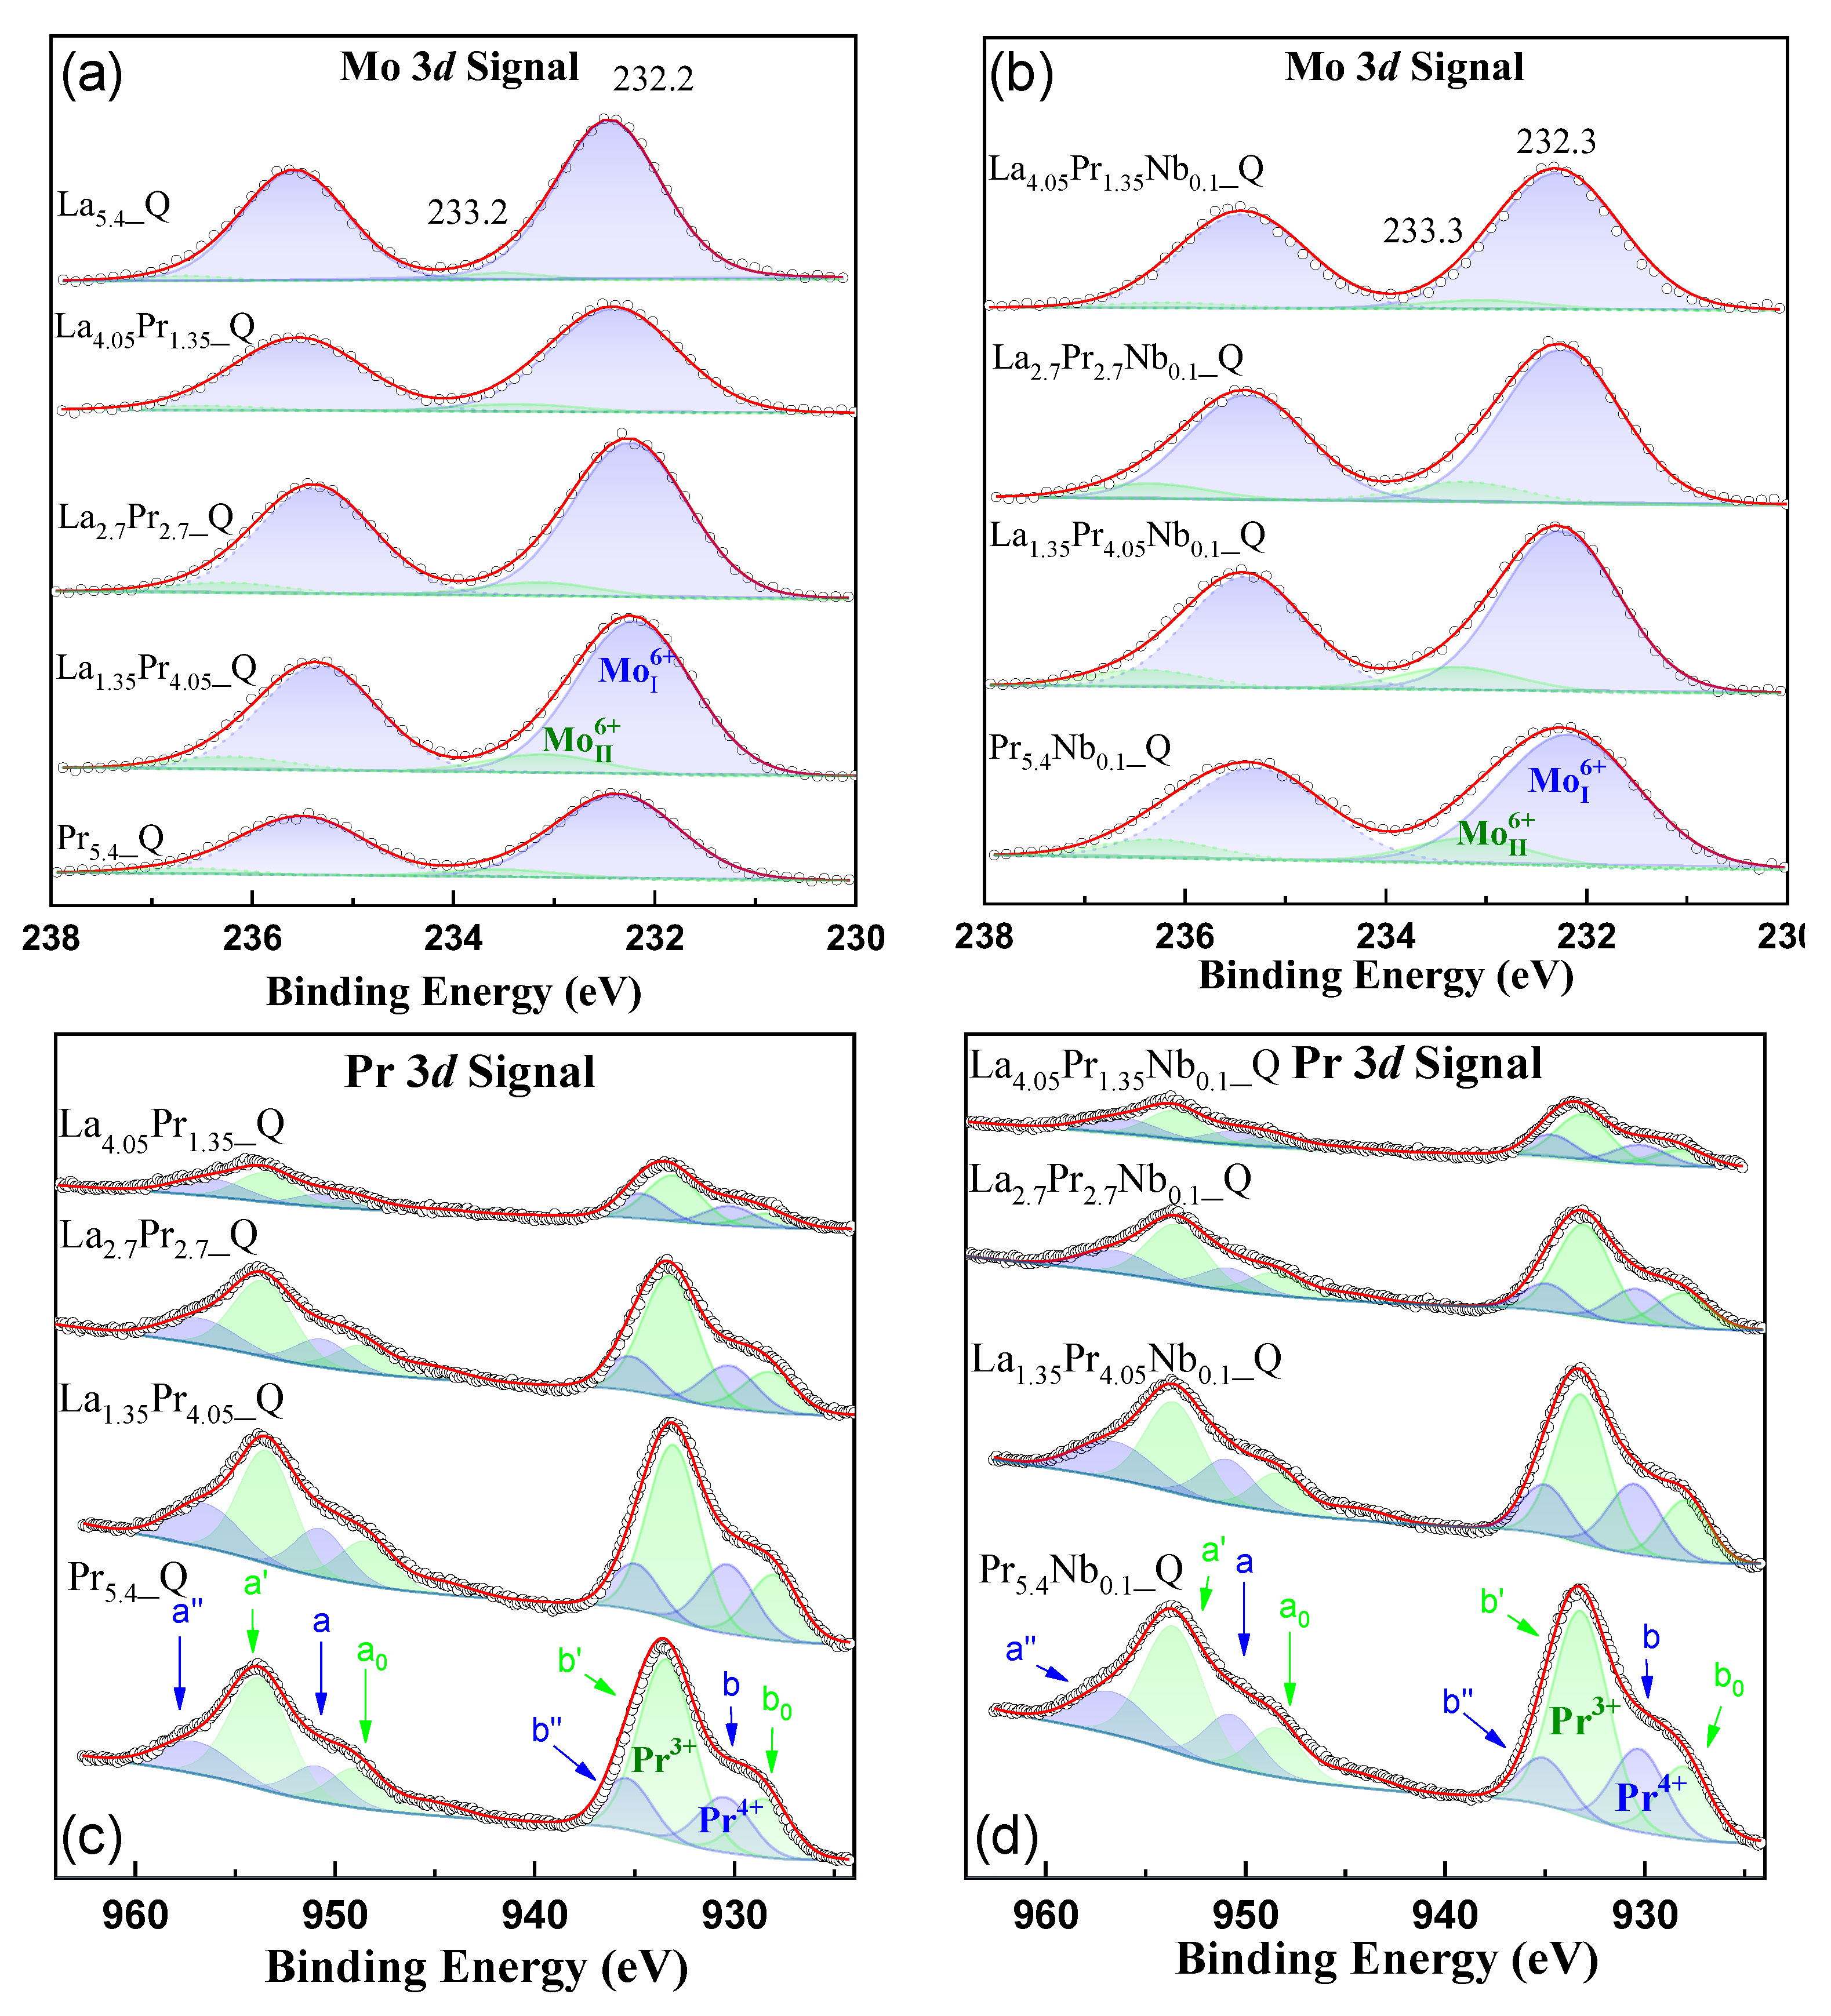
Surface chemical state and atomic concentration information of the quenched samples in air were obtained from X-ray photoelectron spectroscopy. The Mo 3d core level spectra (Figure 4ab) consist of two doublets, Mo 3d5/2 and Mo 3d3/2. The predominant component, Mo 3d5/2, is located at 232.2 eV, characteristic of the Mo6+ species, as reported previously [21]. Additionally, a minor contribution at a higher binding energy (BE) of 233.3 eV is detected, also attributed to the Mo6+ species but in different chemical environments. After Nb doping, the same contributions are observed in the Mo3d core level spectra, with the higher BE component at 233.3 eV becoming more prominent, especially in samples with higher Pr content. This indicates that in these samples, the crystal symmetry is more susceptible to alteration due to Nb incorporation.
The Pr 3d spectra provides information about the Pr4+/Pr3+ ratio present in the samples (Figure 4cd). The deconvolution of the spectra, as is common for many lanthanides, reveals several electron satellite structures for the 3d and 4d ionizations. According to Poggio-Fraccari et al. [38], three doublets (blue lines) are assigned to Pr4+ (called a”-b”, a-b), and two doublets (green lines) are assigned to Pr3+ (called a’-b’, ao-bo). Therefore, in all cases, both Pr4+ and Pr3+ species are present. The corresponding atomic ratios are included in Table S2, which shows that the Pr4+/Pr3+ ratio becomes smaller as the Pr content increases and remains practically stable after Nb incorporation.
Figure 4.
XPS spectra of (a,b) Mo 3d and (c,d) Pr 3d core levels for the La5.4-xPrxMo1-yNbyO12-δ (x = 1.35, 2.7. 4.05, 5.4; y = 0, 0.1) series.
Figure 4.
XPS spectra of (a,b) Mo 3d and (c,d) Pr 3d core levels for the La5.4-xPrxMo1-yNbyO12-δ (x = 1.35, 2.7. 4.05, 5.4; y = 0, 0.1) series.
Similar to Pr, the lanthanum spectra are also complex. Figure S2ab shows the La 3d5/2 component for the different samples with and without Nb-doping. In all cases, four contributions are clearly distinguishable. The main peak, centred at 834.7 eV, is assigned to La3+ related to La−Mo−O mixed oxides [39]. The grey dashed lines correspond to satellite peaks. A second much less intense contribution is located at approximately 833.0 eV, observed in all cases. Its intensity is directly related to La and Pr content as well as the presence of Nb. As previously reported, this is assigned to a new chemical environment for La3+, similar to what was observed in the Mo 3d signal. Therefore, the proportion of these species increases with both Pr content and after Nb addition.
Finally, the O 1s signal, which is much more complex, is also included in Figure S2cd where four contributions are noticeable. For samples without Nb-doping, the Pr5.4_Q sample shows contributions at 528.5, 530.2, 531.5, and 532.6 eV (Figure S2c), which are associated with a rhombohedral polymorph containing domains of different symmetry as confirmed by TEM studies and previously observed in the Mo and La signals [27]. Specifically, these contributions correspond to the O-lattice related to MoO3 (∼530.9 eV), Pr3+ (∼531.9 eV) [40], defect oxygen close to oxygen vacancies (531.1–531.4 eV) [41], and surface hydroxyl oxygen species and adsorb oxygen, respectively.
After Pr substitution with La, the contributions at approximately 528.5 and 530.2 eV become more significant due to a partial loss of symmetry (Figure S2d). This change is also observed in the Mo and La signals, as well as the presence of La oxide, which has a BE of 530.5 eV. At higher La contents, the contribution at 528.5 eV becomes almost negligible as the cubic symmetry is again recovered. Therefore, the La5.4Q sample mainly shows two contributions: one at 530.7 eV, associated with the presence of molybdenum, and another at 532.0 eV, corresponding to OH groups and adsorbed oxygen.
On the other hand, the incorporation of Nb into the structure results in a loss of symmetry, regardless of the sample composition, as observed from the Mo and La signals. This is evident from the increase in the O1s signal at 528.5 eV, which is particularly pronounced at higher Pr content.
3.4. Microstructural and Electrical Characterization
SEM images reveal that all ceramic materials are nearly fully dense (Figure 5), with a relative density close to 100%. No detectable fractures, secondary phases, or visible segregations at the grain boundaries are observed for the different materials These findings are further confirmed by EDS analysis, which shows homogenous cation distribution for La2.7Pr2.7_Q as a representative sample (Figure S3). Similar elemental mappings are observed for the remaining samples, regardless of the composition or cooling rate.
The analysis of the average particle size reveals that, in general, higher Pr contents lead to a decrease in grain size, with values of 23.6, 20.7 and 14.2 μm for La4.05Pr1.35_5, La2.7Pr2.7_5 and Pr5.4_5, respectively. A similar trend was observed in a previous work, where molybdates containing smaller lanthanides exhibited reduced average grain sizes [27]. On the other hand, Nb-doping does not appear to have a significant effect on the particle size. Additionally, the average grain size increases as the cooling rate decreases, with values of 11.8, 14.2 and 21.5 μm for Pr5.4_Q, Pr5.4_5 and Pr5.4_0.5, respectively. This increase is attributed to the longer dwelling time at 1500 ºC for the lower cooling rates, which allows for more extensive grain growth.
Figure 6 shows the impedance spectra for La2.7Pr2.7_Q and Pr5.4_Q as representative examples of the series, both quenched and measured under dry/wet N2 and wet 5% H2−Ar (similar plots are obtained for the other compositions). The plots reveals the presence of two different contributions: one corresponding to bulk conduction within the grain interior, characterized by capacitances on the order of 10-12 F cm-1, and the other associated with electrode processes, characterized by capacitances on the order of 10-2 F cm-1 [21]. These plots can be accurately fitted using an (RbQb)(ReQe) equivalent circuit model, where the subscripts b and e denote the bulk and electrode processes, respectively (inset Figure 6). It is important to note that no grain boundary contribution to the overall conductivity was observed, likely due to the large average grain size and the absence of secondary phases, as confirmed by SEM images.
Notably, under wet N2 conditions, the bulk resistance increases compared to a dry N2, which contrasts with findings in other studies of La, Sm and Gd-based molybdates [21,22,27], where water incorporation into the oxide vacancies enhanced proton conductivity. However, this behaviour is similar to that observed in Nd5.4MoO11.1 [27] and in other Nd-containing proton conductors, such as Nd-doped La2Ce2O7 [42], where an increase in p-type conductivity was observed with increasing Nd content. This phenomenon was attributed to Nd3+ being less prone to be oxidation to Nd4+, similar to the Pr3+/Pr4+ pairs observed here. Therefore, the presence of a significant p-type electronic contribution to the overall conductivity in Pr-containing molybdates suggests a competition between O2 and H2O for absorption into the oxide vacancies, which reduces the proton conductivity.
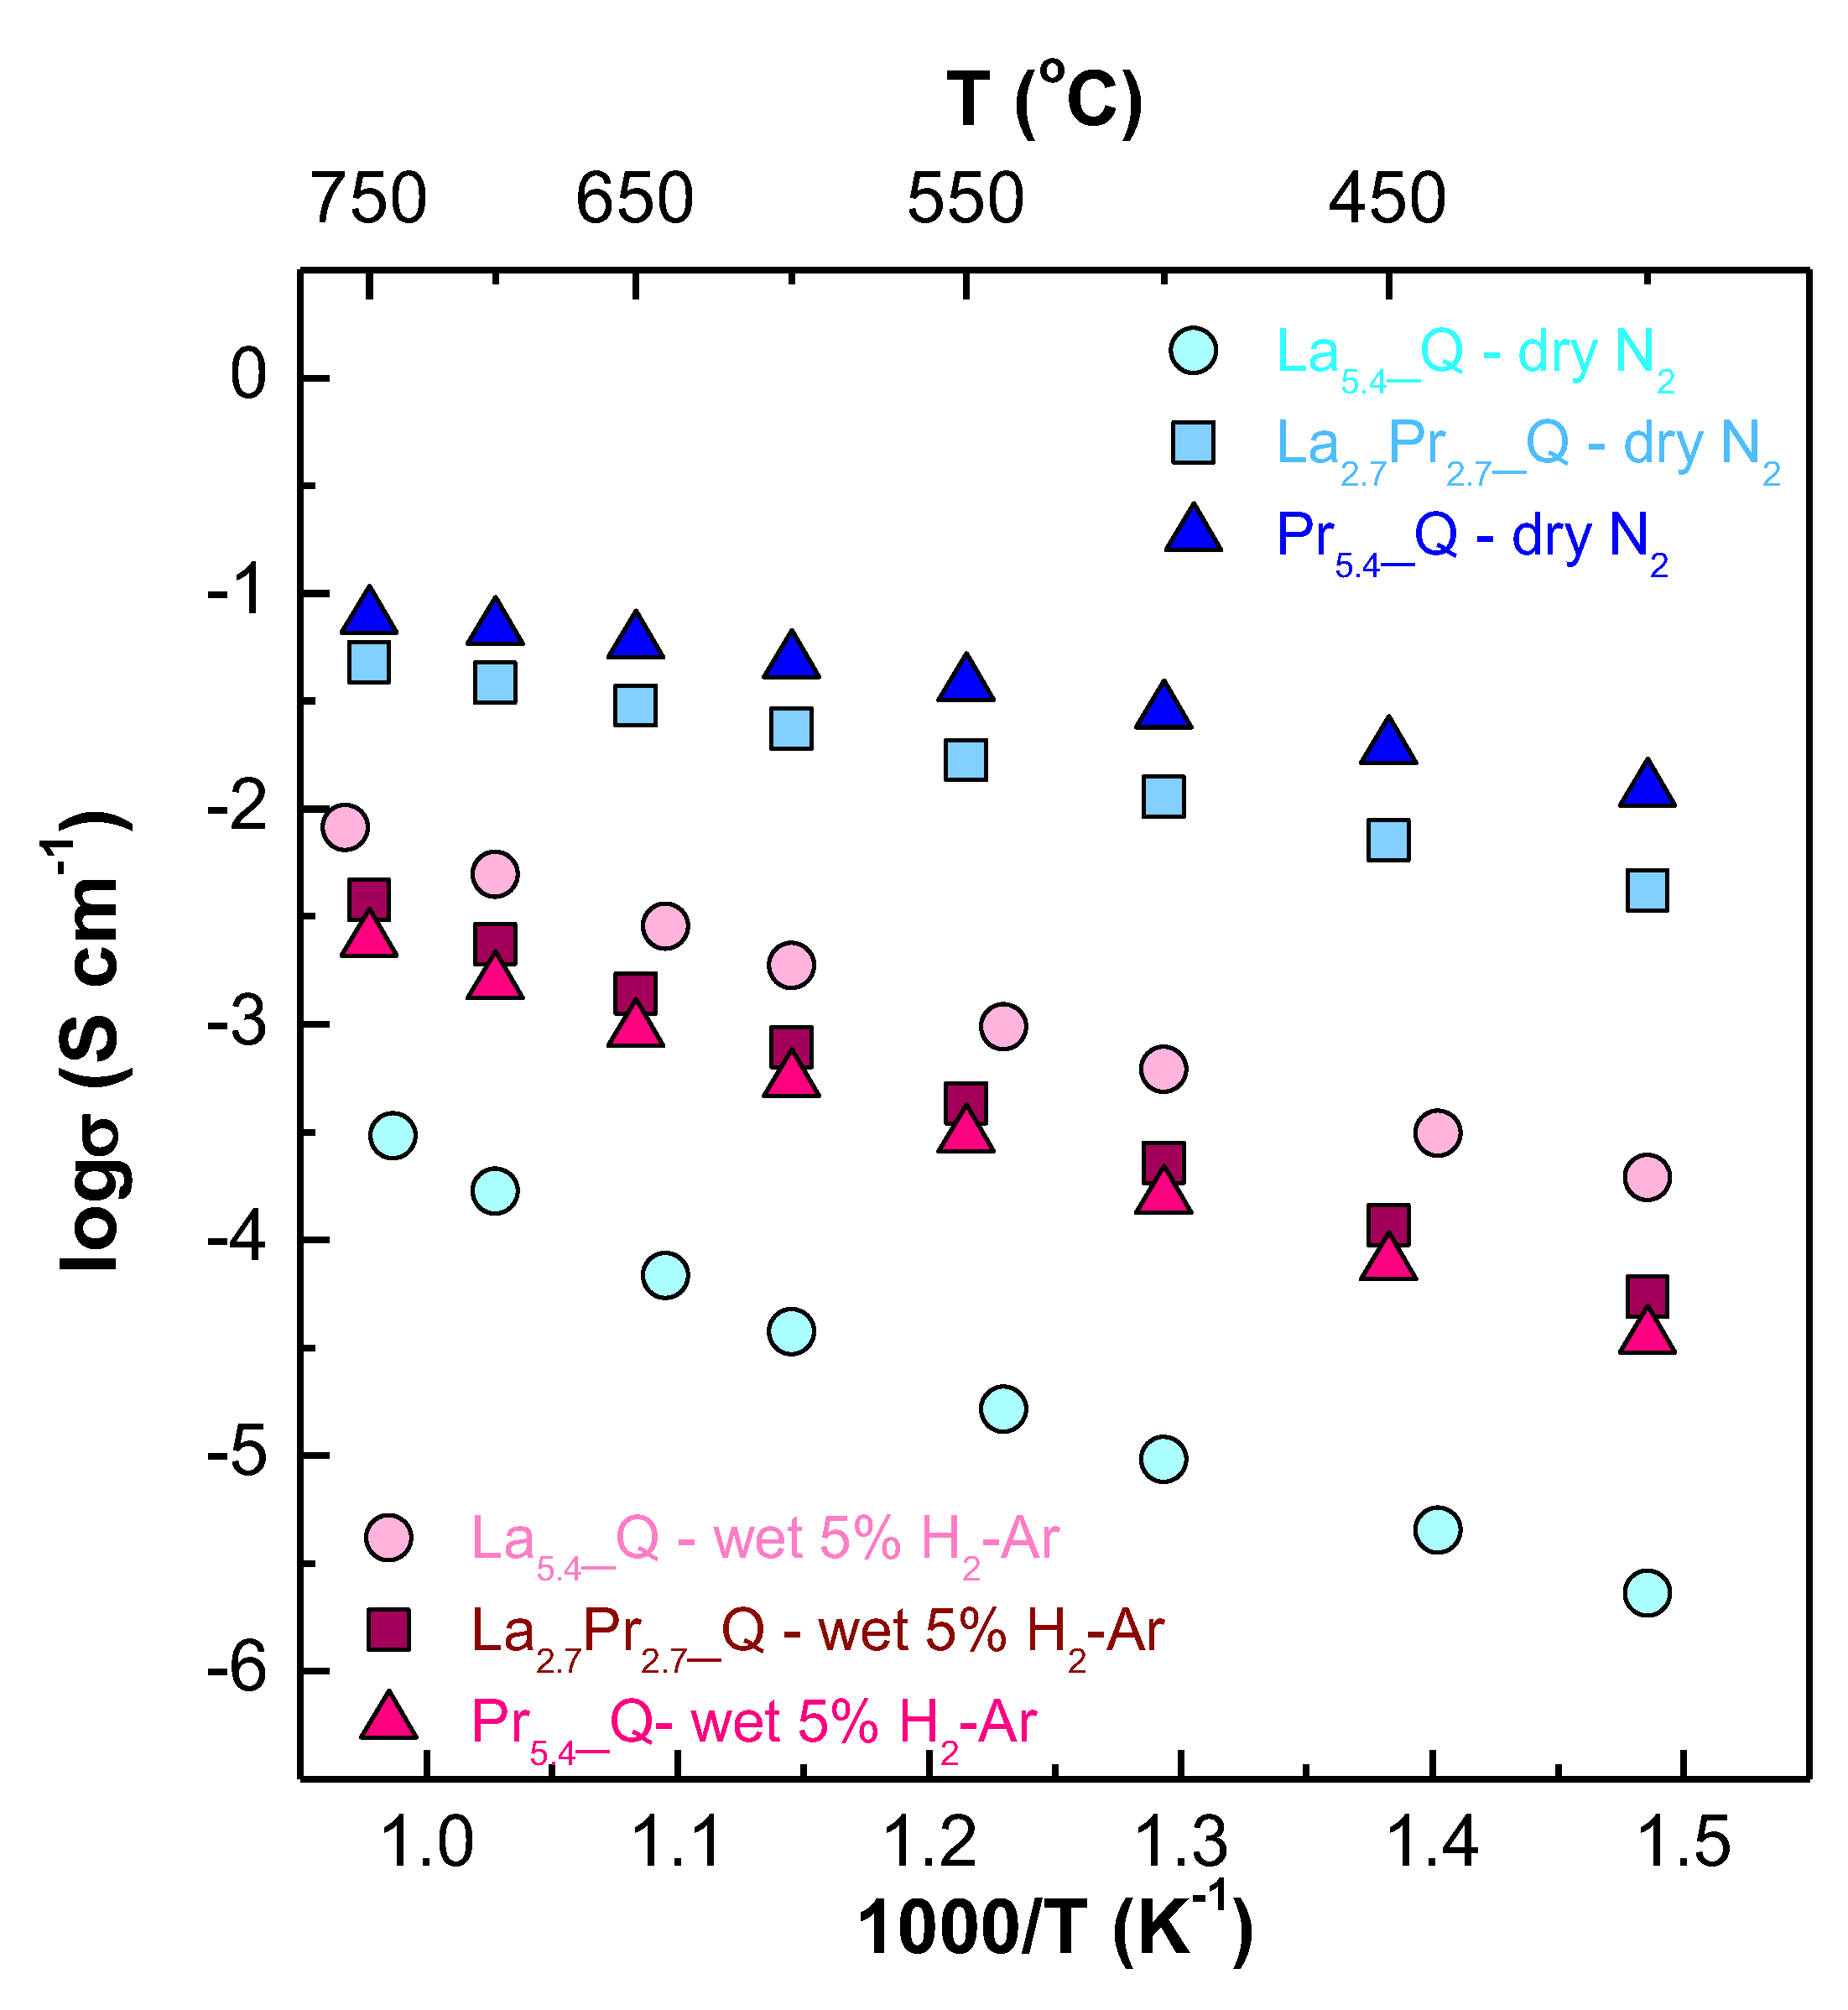
The Arrhenius plots (Figure 7) and Table S3 clearly demonstrate that in a N2 atmosphere, the conductivity increases significantly with higher Pr contents, ranging from 0.17 to 204.4 mS cm-1 for La5.4_Q and Pr5.4_Q, respectively, at 700 ºC. This increase is attributed to the presence of the Pr4+/Pr3+ pair, which enhances the electronic contribution to the overall conductivity. Furthermore, the activation energies decrease significantly as the Pr content increases, with values of 1.04(1), 0.37(1) and 0.26(1) eV for La5.4_Q, La2.7Pr2.7_Q and Pr5.4_Q, respectively, in the 750-550 ºC temperature range under dry N2. This behaviour suggests a transition in the transport properties, from predominantly ionic conduction for samples with low Pr-content to predominantly electronic conduction in those with high Pr-content. Therefore, the mixed ionic/electronic conductivity of these materials can be tailored through appropriate Pr-substitution.
Interestingly, Nb-doped samples generally exhibit increased conductivity, which is attributed to the generation of additional oxide vacancies resulting from this aliovalent substitution (Figure S4 and Table S3). This effect is more pronounced at lower temperatures and in wet atmospheres, where the ionic conductivity (oxide and proton) dominates due to the enhanced ability of the increased number of oxide vacancies to incorporate water. For example, in the case of La2.7Pr2.7_Q and Pr5.4_Q, the conductivity values in wet N2 at 400 ºC increase from 3.0 and 15.3 mS cm-1, respectively, to 3.6 and 16.3 mS cm-1 for the corresponding Nb-doped samples under the same conditions, further demonstrating the beneficial effect of Nb-doping.
Under reducing conditions, a different behaviour is observed, with a significant drop in conductivity for the praseodymium containing samples. This is attributed to the nearly complete reduction of Pr4+ to Pr3+, resulting in a significant decrease of the electronic conductivity. Additionally, the conductivity decreases with increasing Pr content, with values of 5.0, 2.3 and 1.6 mS cm-1 for La5.4_Q, La2.7Pr2.7_Q and Pr5.4_Q, respectively. This decrease is primarily attributed to the shrinkage of the unit cell volume caused by the size difference between La3+ (1.16 Å) and Pr3+ (1.13 Å), which hinders the ionic conduction pathways. This volume shrinkage effect is also reflected in the slightly higher activation energies. In particular, La5.4_Q has an activation energy of 0.70(1) eV, while La2.7Pr2.7_Q and Pr5.4_Q exhibit values of 0.79(1) and 0.76(1) eV, respectively. Furthermore, Nb-doping enhances the electrical properties under reducing conditions, particularly at high temperatures. For instance, conductivity values for Pr5.4_Q and Pr5.4Nb0.1_Q are 1.6 and 3.5 mS cm-1, respectively, at 700 ºC (Table S3). It is also worth noting that a significant drop in electronic conductivity for samples with high Pr-content may be less relevant in fuel cell and electrolyzer operational conditions, where the membranes typically operate under an oxygen concentration gradient.
4. Conclusions
For the first time, lanthanum and praseodymium molybdates with the general formula La5.4-xPrxMo1-yNbyO12-δ (x= 1.35, 2.7, 4.05, 5.4; y= 0, 0.1) have been successfully synthesized using the freeze-drying precursor method. The compounds were sintered at 1500 ºC and subsequently cooled at different rates. The quenched samples exhibited cubic symmetry due to the inherent disorder in the crystal lattice at high temperatures. Slower cooling rates, combined with high Pr content, resulted in cubic symmetry due to the minor distortion induced by the smaller ionic radius of Pr compared to La. In contrast, compositions with lower Pr content stabilized the R1 rhombohedral polymorph. However, TEM studies indicates a more complex local structure depending on Pr content, with a gradual transformation from defect-free cubic fluorite structure at high Pr-content to one with numerous local defects, and finally a modulated arrangement or domains embedded in the cubic phase at low Pr content.
Scanning electron microscopy (SEM) and energy-dispersive X-ray spectroscopy (EDS) analyses revealed that the synthesized samples are dense and exhibit a homogeneous cation distribution, regardless of the preparation conditions or the crystal structure adopted.
The highest conductivity values were observed in a N2 atmosphere, which can be attributed to the presence of mixed Pr4+/Pr3+ cations. However, the proton conductivity deceased due to an increase in p-type electronic contribution. Furthermore, in a reducing atmosphere (5% H2-Ar), the conductivity of Pr-substituted samples drastically decreased due to the reduction of Pr4+ to Pr3, highlighting the importance of the material composition and operating atmospheres on the conducting properties of these materials for different electrochemical applications.
Supplementary Materials
The following supporting information can be downloaded at: www.mdpi.com/xxx/s1, Figure S1: XRD patterns for La5.4-xPrxMo1-yNbyO12-δ samples (x = 0, 1.35, 2.7. 4.05, 5.4; y = 0, 0.1) heated at 1500 °C and cooled down by quenching. Symmetry of the samples is labelled is displayed within the figure; Figure S2: XPS spectra of (a,b) O 1s and (c,d) La 3d5/2 core levels for the La5.4-xPrxMo1-yNbyO12-δ (x = 0, 1.35, 2.7. 4.05, 5.4; y = 0, 0.1) series; Figure S3: SEM micrograph and EDS mappings for La, Pr and Mo for the La2.7Pr2.7MoO12-δQ sample; Figure S4: Arrhenius plots of La5.4-xPrxMo0.9Nb0.1O12-δ samples (x = 0, 2.7. 5.4) sintered at 1500 ºC for 1 h and cooled down by quenching under dry N2 and wet 5% H2-Ar atmospheres.
Author Contributions
Conceptualization: J.M.P-V. and E.R.L; methodology: J.M.P-V., D.M-L. and E.R.L.; investigation: A. S-C., J.M.P-V., L.d.S.-G., J.Z.-G., A.I-M., and J.C-V.; formal analysis: J.M.P.-V., A.I-M., J.C-V, and D.M.-L.; validation: J.M.P.-V, D.M.-L. and E.R.L.; visualization: A. S-C., J.M.P-V. and D.M.-L.; project administration: J.M.P-V., D.M-L. and E.R.L.; writing—original draft: A. S-C. and J.M.P-V.; writing—review and editing: J.M.P.-V., E.R.L. and D.M.-L.
Funding
The authors acknowledge the research projects PID2021–126009OB-I00, PID2019-110249RB-I00 and TED2021-129836B-I00 funded by Ministerio de Ciencia e Innovación (Spain) and “ERDF A way of making Europe”, by the European Union. JZG thanks Technical University of Denmark for his Postdoctoral contract.
Conflicts of Interest
The authors declare no conflicts of interest.
References
- Kim, D.; Lee, T. K.; Han, S.; Jung, Y.; Lee, D. G.; Choi, M.; Lee, W. Advances and challenges in developing protonic ceramic cells. Mater. Today Energy 2023, 36, 101365. [CrossRef]
- Cheng, S.; Li, X.; Huang, X.; Ling, Y.; Liu, S.; Li, T. Hydrogen separation via proton conducting ceramic membranes: A review. Int. J. Hydrogen Energy 2024, 70, 654−665. [CrossRef]
- Dou, J.; Wang, S.; Yao, Z. Mixed protonic–electronic conducting ceramic membranes for hydrogen separation: A review on recent advances in structure optimization and preparation. Sep. Purif. Technol. 2025, 355, 129582. [CrossRef]
- Zhang, W.; Liu, M.; Gu, X.; Shi, Y.; Deng, Z.; Cai, N. Water electrolysis toward elevated temperature: advances, challenges and frontiers. Chem. Rev. 2023, 123, 7119–7192. [CrossRef]
- Vignesh, D.; Rout, E. Technological challenges and advancement in proton conductors: a review. Energy Fuels 2023, 37, 5, 3428–3469. [CrossRef]
- Matkin, D. E.; Starostina, I. A.; Hanif, M. B.; Medvedev, D. A. Revisiting the ionic conductivity of solid oxide electrolytes: A technical review. J. Mater. Chem. A 2024, 12, 25696-25714. [CrossRef]
- Hossain, M. K.; Biswas, M. C.; Chanda, R. K.; Rubel, M. H. K.; Khan, M. I.; Hashizume, K. A review on experimental and theoretical studies of perovskite barium zirconate proton conductors. Emergent Mater. 2021, 4, 999–1027. [CrossRef]
- Mohd Rashid, N. L.; Abdul Samat, A.; Jais, A. A.; Somalu, M. R.; Muchtar, A.; Baharuddin, N. A.; Wan Isahak, W. N. R. Review on zirconate-cerate-based electrolytes for proton-conducting solid oxide fuel cell. Ceramics International 2019, 45, 6605–6615. [CrossRef]
- Danilov, N. A.; Starostina, I. A.; Starostin, G. N.; Kasyanova, A. V.; Medvedev, D. A.; Shao, Z. Fundamental understanding and applications of protonic Y- and Yb-Coped Ba(Ce,Zr)O3 perovskites: state-of-the-art and perspectives. Adv. Energy Mater. 2023, 13, 2302175. [CrossRef]
- Fang, S.; Brinkman, K. S.; Chen, F. Hydrogen permeability and chemical stability of Ni–BaZr0.1Ce0.7Y0.1Yb0.1O3−δ membrane in concentrated H2O and CO2. J. Membr. Sci. 2014, 467, 85–92. [CrossRef]
- Yang, C.; Cao, W.; Shen, Q.; Li, J.; Wang, L.; Yao, W.; Liang, Y.; Wang, K. Electrochemical properties of Sr-doped La2-xSrxCe2O7-δ hydrogen separation membrane. Int. J. Hydrogen Energy 2024, 63, 720–730. [CrossRef]
- Zamudio-García, J.; Porras-Vázquez, J. M.; Canales-Vázquez, J.; Cabeza, A.; Losilla, E. R.; Marrero-López, D. Relationship between the structure and transport properties in the Ce1–xLaxO2–x/2 system. Inorg. Chem. 2019, 58, 9368–9377. [CrossRef]
- Norby, T.; Magrasó, A. On the development of proton ceramic fuel cells based on Ca-doped LaNbO4 as electrolyte. J. Power Sources 2015, 282, 28–33. [CrossRef]
- Zayas-Rey, M. J.; dos Santos-Gómez, L.; Porras-Vázquez, J. M.; Losilla, E. R.; Marrero-López, D. Evaluation of Lanthanum Tungstates as Electrolytes for Proton Conductors Solid Oxide Fuel Cells. J. Power Sources 2015, 294, 483–493. [CrossRef]
- Gil, V.; Gurauskis, J.; Kjølseth, C.; Wiik, K.; Einarsrud, M.-A. Hydrogen permeation in asymmetric La28-xW4+xO54+3x/2 membranes. Int. J. Hydrogen Energy 2013, 38, 3087−3091. [CrossRef]
- Escolástico, S.; Solís, C.; Scherb, T.; Schumacher, G.; Serra, J.M. Hydrogen separation in La5.5WO11.25−δ membranes, J. Membr. Sci. 2013, 444, 276−284. [CrossRef]
- Gil, V.; Gurauskis, J.; Einarsrud, M.-A. Asymmetric supported dense lanthanum tungstate membranes. J. Eur. Ceram. Soc. 2014, 34, 3783−3790. [CrossRef]
- Vøllestad, E.; Vigen, C.K.; Magrasó, A.; Haugsrud, R. Hydrogen permeation characteristics of La27Mo1.5W3.5O55.5. J. Membr. Sci. 2014, 461, 81−88. [CrossRef]
- Chen, Y.; Liao, Q.; Li, Z.; Wang, H.; Wei, Y.; Feldhoff, A.; Caro, J. A CO2-stable hollow-fiber membrane with high hydrogen permeation flux. AIChE J. 2015, 61, 1997−2007. [CrossRef]
- Polfus, J.M.; Xing, W.; Fontaine, M.L.; Denonville, C.; Henriksen, P.P.; Bredesen, R. Hydrogen separation membranes based on dense ceramic composites in the La27W5O55.5−LaCrO3 system. J. Membr. Sci. 2015, 479, 39−45. [CrossRef]
- López-Vergara, A.; Porras-Vázquez, J.M.; Infantes-Molina, A.; Canales-Vázquez, J.; Cabeza, A.; Losilla, E.R.; Marrero-López, D. Effect of preparation conditions on the polymorphism and transport properties of La6-xMoO12-δ (0 ≤ x ≤ 0.8). Chem. Mater. 2017, 29, 6966–6975. [CrossRef]
- López-Vergara, A.; Vizcaíno-Anaya, L.; Porras-Vázquez, J.M.; Baldinozzi, G.; dos Santos-Gómez, L.; Canales-Vazquez, J.; Marrero-López, D.; Losilla, E.R. Unravelling crystal superstructures and transformations in the La6-xMoO12-δ (0.6 ≤ x ≤ 3.0) series: a system with tailored ionic/electronic conductivity. Chem. Mater. 2020, 32, 7052–7062. [CrossRef]
- Dan Vu, T.; Krichen, F.; Barré, M.; Coste, S.; Jouanneaux, A.; Suard, E.; Fitch, A.; Goutenoire, F. Ab-initio structure determination of La34Mo8O75 using powder X-ray and neutron diffraction data. Cryst. Growth Des. 2019, 19, 6074–6081. [CrossRef]
- López-Vergara, A.; Porras-Vázquez, J.M.; Vøllestad, E.; Canales-Vázquez, J.; Losilla, E.R.; Marrero-López, D. Metal-Doping of La5.4MoO11.1 Proton Conductors: Impact on the Structure and Electrical Properties, Inorg. Chem. 2018, 57, 12811−12819. [CrossRef]
- Savvin, S.N.; Shlyakhtina, A.V.; Kolbanev, I.V.; Knotko, A.V.; Belov, D.A.; Shcherbakova, L.G.; Nuñez, P. Zr-doped samarium molybdates — potential mixed electron–proton conductors. Solid State Ionics 2014, 262, 713−718. [CrossRef]
- Shlyakhtina, A.V.; Savvin, S.N.; Lyskov N.V.; Kolbanev, I.V.; Karyagina, O.K.; Chernyak, S.A.; Shcherbakova, L.G.; Nuñez, P. Polymorphism in the family of Ln6-xMoO12-δ (Ln = La, Gd–Lu; x = 0, 0.5) oxygen ion- and proton-conducting materials. J. Mater. Chem. A 2017, 5, 7618−7630. [CrossRef]
- Rubio-Vives, R.; Porras-Vázquez, J.M.; dos Santos-Gómez, L.; Zamudio-García, J.; Infantes-Molina, A.; Canales-Vazquez, J.; Marrero-López, D.; Losilla, E.R. Impact of the lanthanide size on the polymorphism and electrical properties of Ln5.4MoO11.1 (Ln = Nd, Sm and Gd). Ceramics International 2023, 49, 12805–12813. [CrossRef]
- Chen, D.J.; Ran, R.; Zhang, K.; Wang, J.; Shao, Z.P. Intermediate-temperature electrochemical performance of a polycrystalline PrBaCo2O5+δ cathode on samarium-doped ceria electrolyte. J. Power Sources 2009, 188, 96. [CrossRef]
- Jin, F.J.; Shen, Y.; Wang, R.; He, T.M. Double-perovskite PrBaCo2/3Fe2/3Cu2/3O5+δ as cathode material for intermediate-temperature solid-oxide fuel cells. J. Power Sources 2013, 234, 244. [CrossRef]
- Zayas-Rey, M.J.; dos Santos-Gómez, L.; Marrero-López, D.; León-Reina, L.; Canales-Vázquez, J.; Aranda, M.A.G.; Losilla, E.R. Structural and Conducting Features of Niobium-Doped Lanthanum Tungstate, La27(W1-xNbx)5O55.55-δ. Chem. Mater. 2013, 25, 448−456. [CrossRef]
- X’Pert High Score Plus Program, version 3.0e, PANalytical B.V.: Amelo, The Netherlands, 2012.
- Larson, A.C.; von Dreele, R.B. GSAS Program; Report LA-UR-86748, Los Alamos National Lab, 1994.
- Multipak v9.3 Software. Data Reduction Software for AES & XPS; Physical Electronics, 2010.
- Digital Micrograph, Version 3.22.1461.0; Gatan: Pleasanton, CA.
- Abrantes, J.C.C. U.I.D.M. Estereología, ESTG, Polytechnic Institute of Viana do Castelo: Viana do Castelo, Portugal, 1998.
- Johnson, D. ZView: A Software Program for IES Analysis, Version 2.9c, Scribner Associates, Inc.: Southern Pines, NC, 2005.
- Amsif, M.; Magrasó, A.; Marrero-López, D.; Ruiz-Morales, J.C.; Canales-Vázquez, J.; Núñez, P. Mo-substituted lanthanum tungstate La28−yW4+yO54+δ: a competitive mixed electron−proton conductor for gas separation membrane applications. Chem. Mater. 2012, 24, 3868−3877. [CrossRef]
- Poggio-Fraccari, E.; Baronetti, G.; Mariño, F. Pr3+ surface fraction in CePr mixed oxides determined by XPS analysis. J. Electron Spectrosc. 2018, 222, 1−4. [CrossRef]
- Escolástico, S.; Somacescu, S.; Serra, J.M. Tailoring mixed ionic−electronic conduction in H2 permeable membranes based on the system Nd5.5W1-xMoxO11.25-δ. J. Mater. Chem. A 2015, 3, 719−731. [CrossRef]
- Oni, B.A.; Tomomewo, O.S.; Sanni, S.E.; Ibegbu, A.J.; Joseph, R. Ni catalysts modified with mesoporous silica support: The role of Pr2O3 and MgO on the methanation of CO2. Molecular Catalysis 2024, 553, 113774. [CrossRef]
- Kim, J.-H.; Kim, J.-E.; Kim, H.-M.; Jeong, D.-W. Characteristics and performance of the Co-CeO2 catalyst as a function of the promoter (La, Pr, and Zr) used in high temperature water gas shift reaction. Int. J. Hydrogen Energy 2021, 46, 12981−12991. [CrossRef]
- Kalland, L.-E.; Løken, A.; Bjørheim, T.S.; Haugsrud, R.; Norby, T. Structure, hydration, and proton conductivity in 50% La and Nd doped CeO2 – La2Ce2O7 and Nd2Ce2O7 – and their solid solutions. Solid State Ionics 2020, 354, 1154. Author 1, A.B.; Author 2, C. Title of Unpublished Work. Abbreviated Journal Name year, phrase indicating stage of publication (submitted; accepted; in press). [CrossRef]
Figure 5.
SEM micrographs of the La5.4-xPrxMo1-yNbyO12-δ samples (x = 1.35, 2.7. 4.05, 5.4; y = 0, 0.1) sintered at 1500 ºC for 1 h and cooled down at different rates. Average grain size is denoted at the top right of the images.
Figure 5.
SEM micrographs of the La5.4-xPrxMo1-yNbyO12-δ samples (x = 1.35, 2.7. 4.05, 5.4; y = 0, 0.1) sintered at 1500 ºC for 1 h and cooled down at different rates. Average grain size is denoted at the top right of the images.
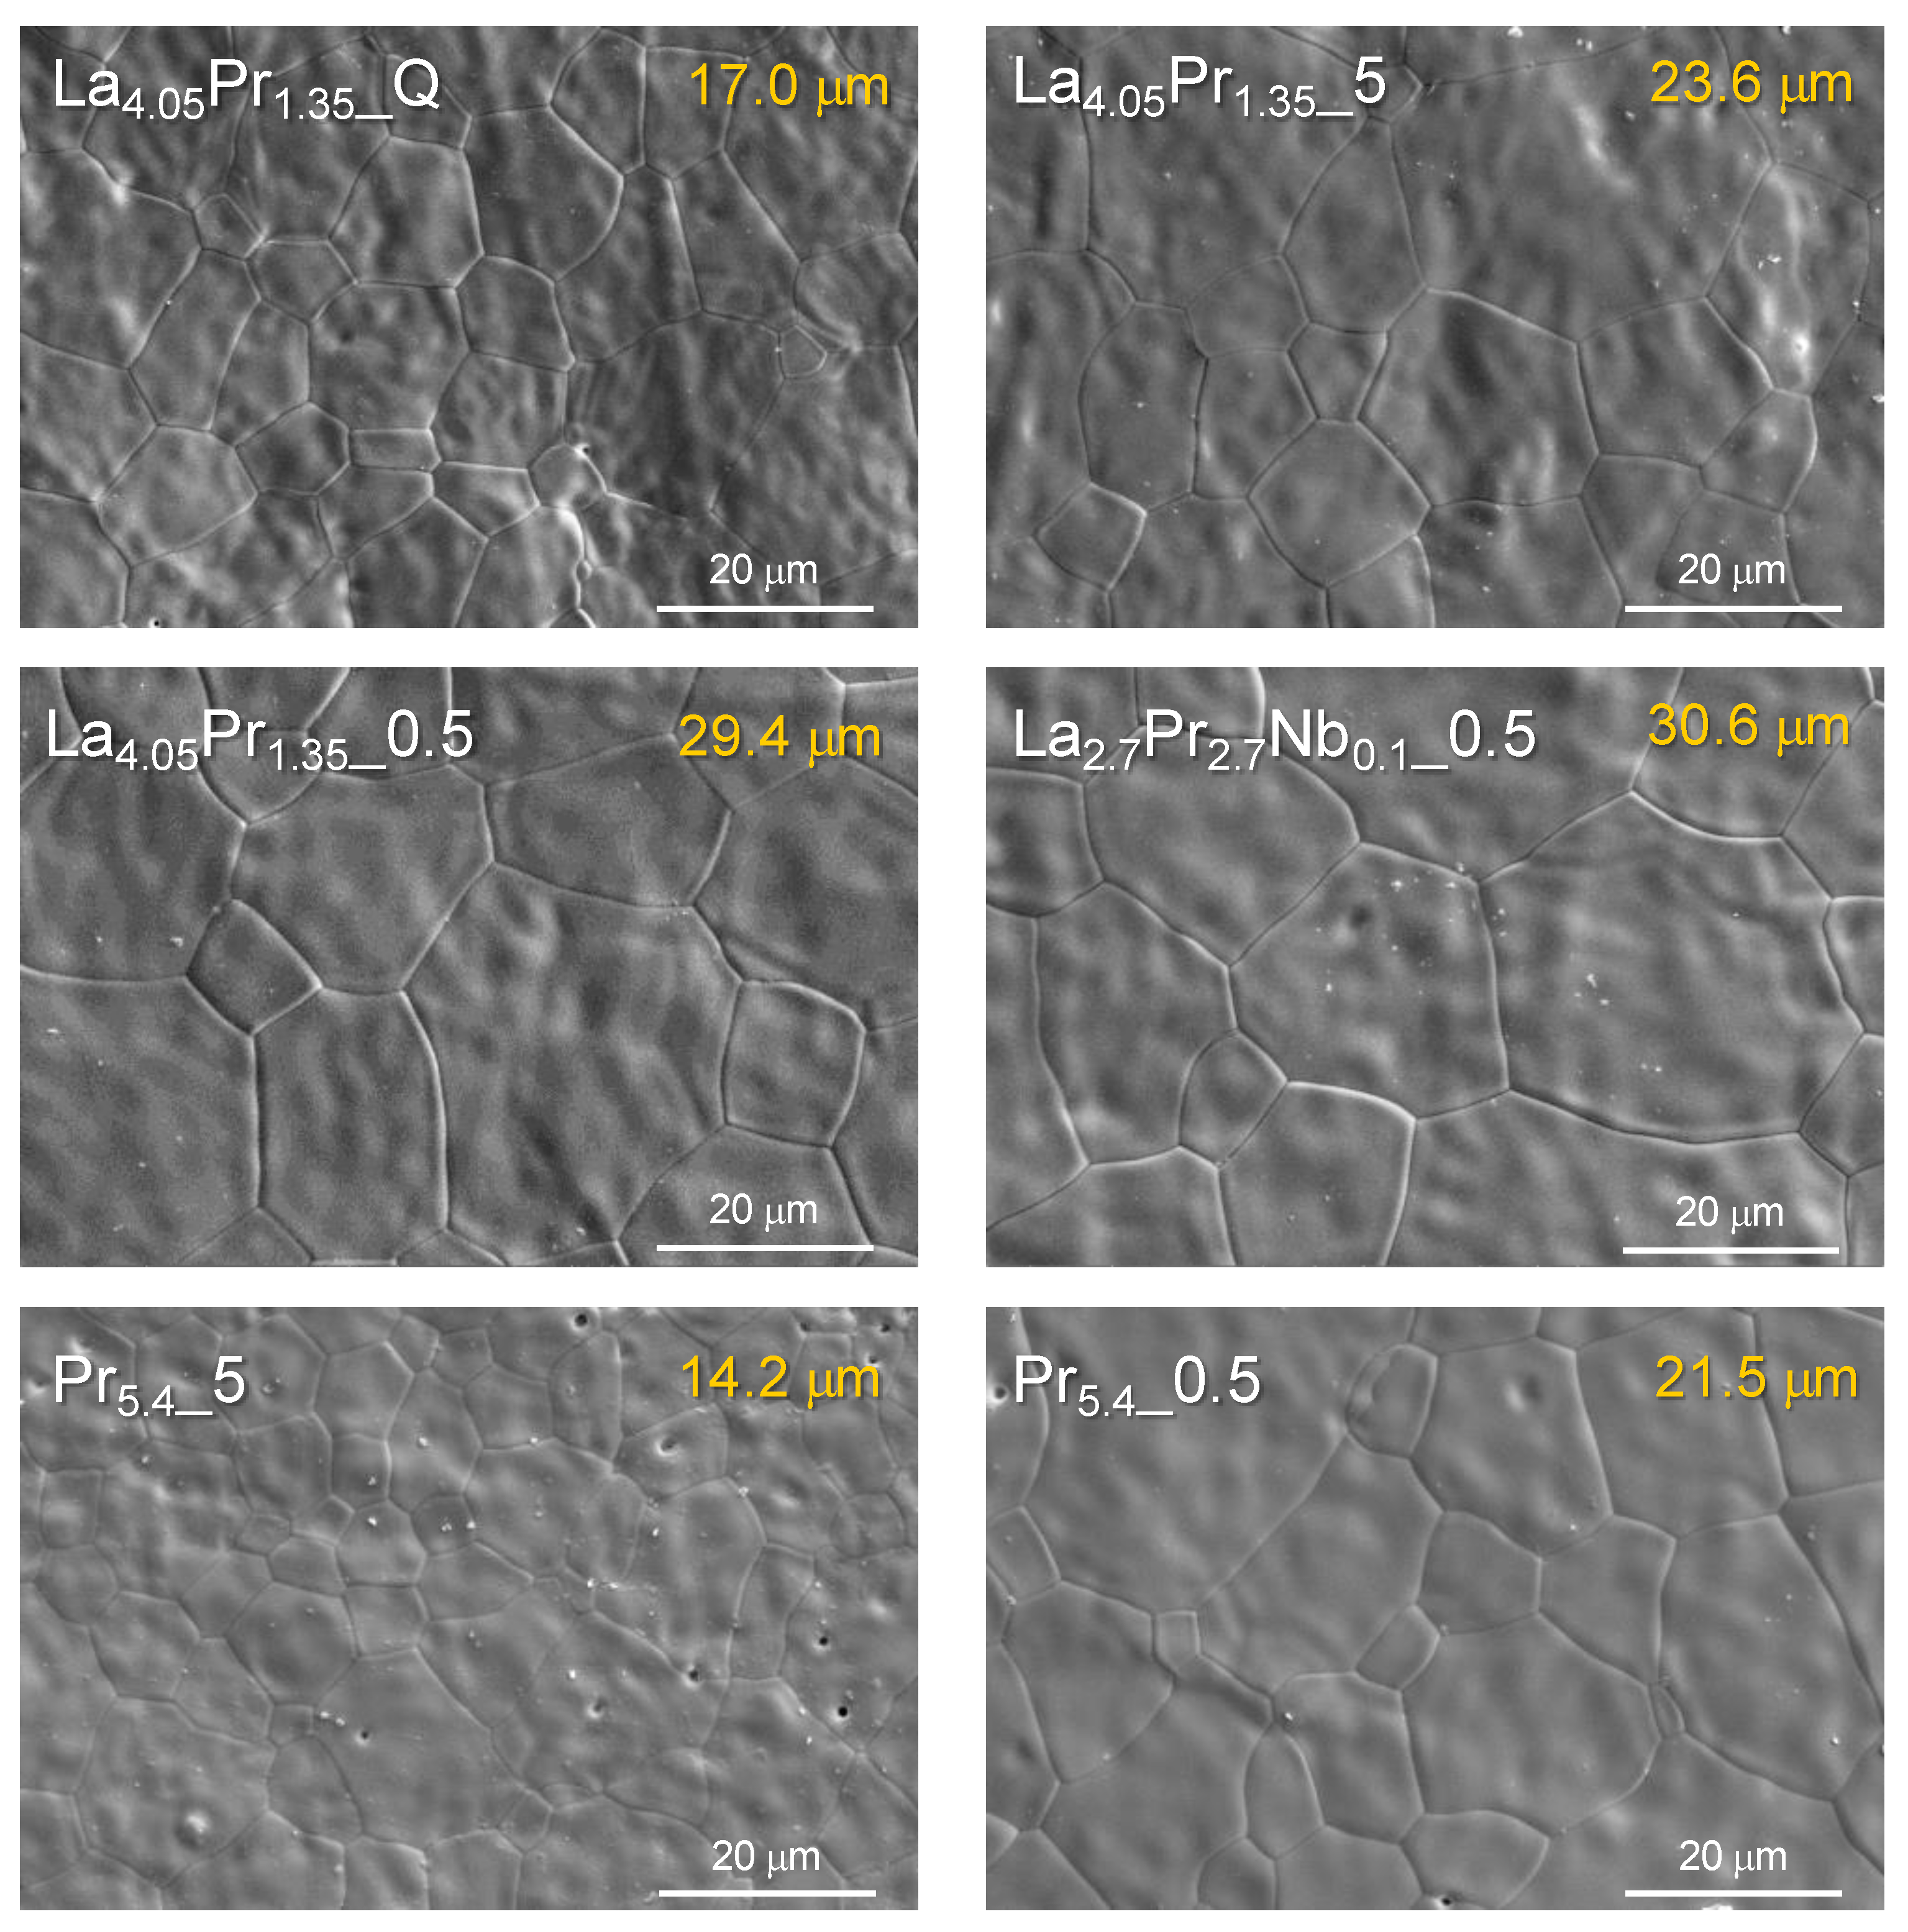
Figure 6.
Representative impedance spectra of La2.7Pr2.70.5 and Pr5.4Q under (top) dry/wet N2 at 300 °C and (bottom) 5% H2−Ar gases at 500 °C. The equivalent circuit used to fit the spectra are show in the insets.
Figure 6.
Representative impedance spectra of La2.7Pr2.70.5 and Pr5.4Q under (top) dry/wet N2 at 300 °C and (bottom) 5% H2−Ar gases at 500 °C. The equivalent circuit used to fit the spectra are show in the insets.
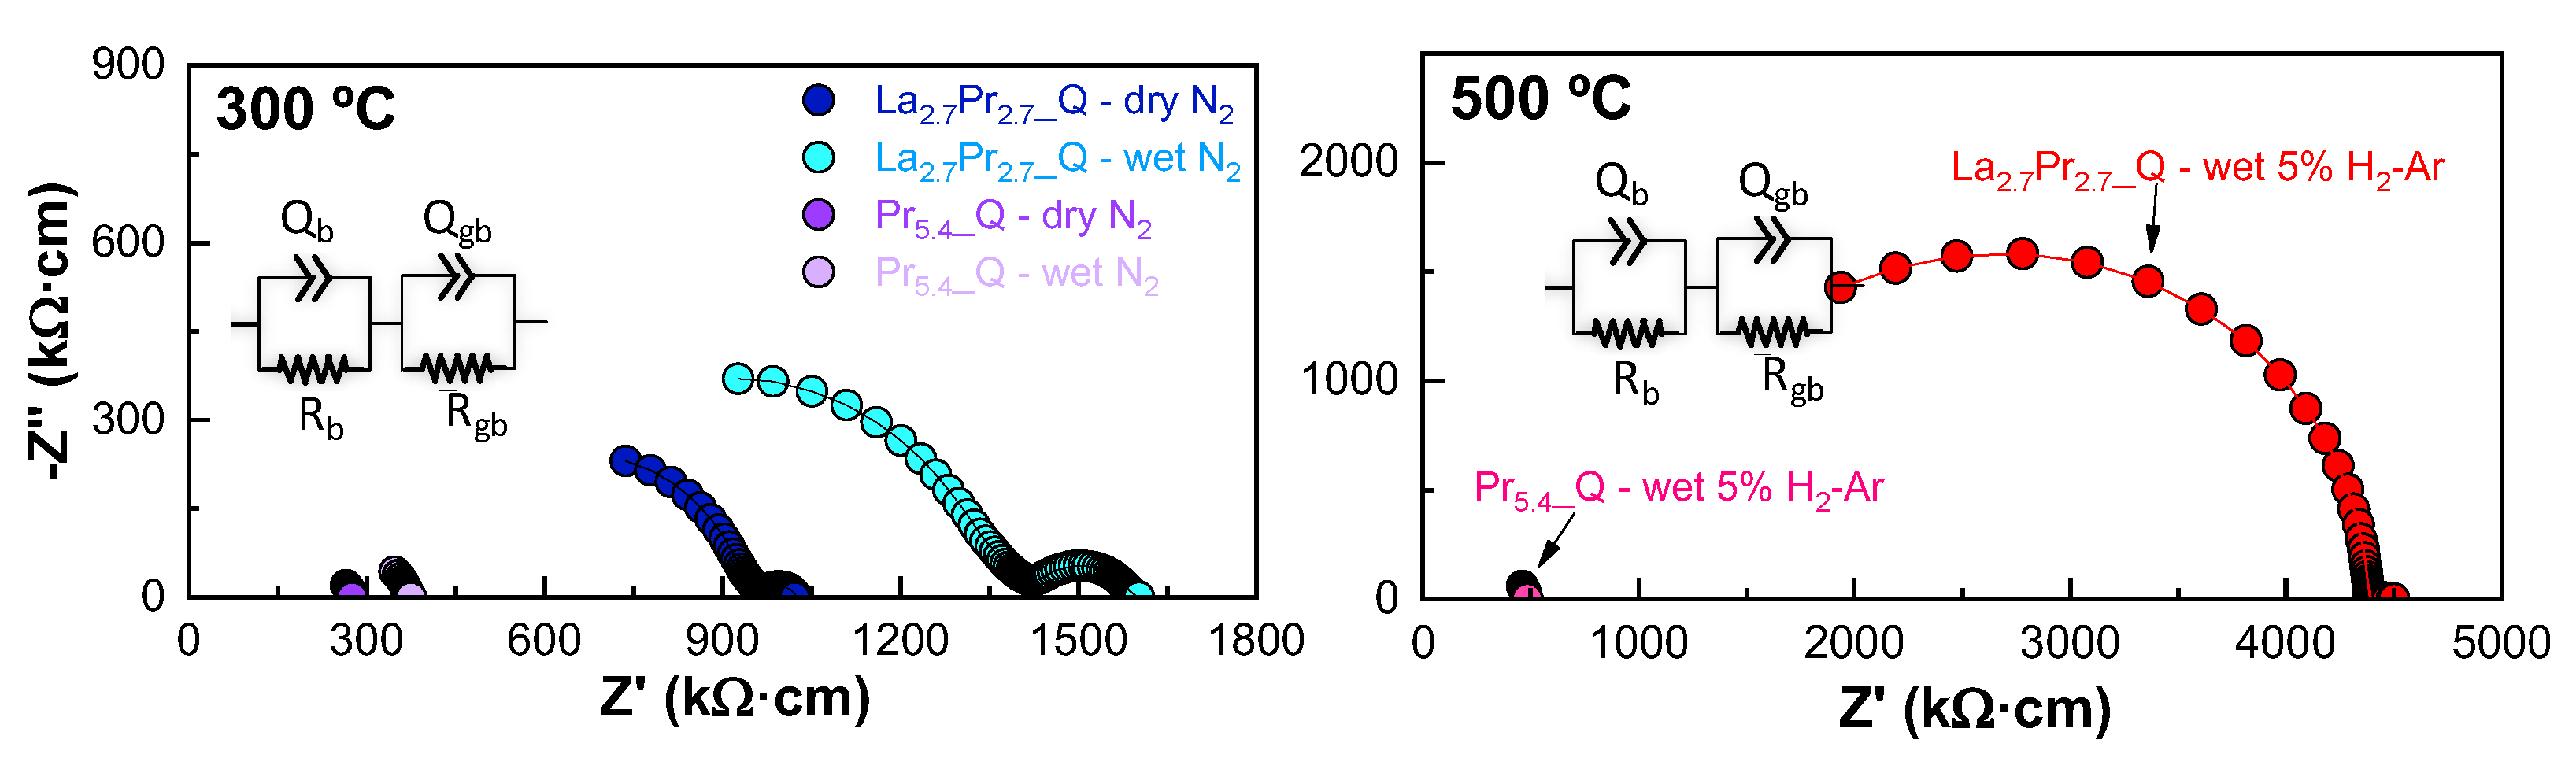
Figure 7.
Arrhenius plots of La5.4Q, La2.7Pr2.7Q and Pr5.4Q sintered at 1500 ºC for 1 h and cooled down by quenching under dry N2 and wet 5% H2-Ar atmospheres.
Figure 7.
Arrhenius plots of La5.4Q, La2.7Pr2.7Q and Pr5.4Q sintered at 1500 ºC for 1 h and cooled down by quenching under dry N2 and wet 5% H2-Ar atmospheres.
Disclaimer/Publisher’s Note: The statements, opinions and data contained in all publications are solely those of the individual author(s) and contributor(s) and not of MDPI and/or the editor(s). MDPI and/or the editor(s) disclaim responsibility for any injury to people or property resulting from any ideas, methods, instructions or products referred to in the content. |
© 2024 by the authors. Licensee MDPI, Basel, Switzerland. This article is an open access article distributed under the terms and conditions of the Creative Commons Attribution (CC BY) license (http://creativecommons.org/licenses/by/4.0/).
Copyright: This open access article is published under a Creative Commons CC BY 4.0 license, which permit the free download, distribution, and reuse, provided that the author and preprint are cited in any reuse.


