
Submitted:
24 December 2024
Posted:
24 December 2024
You are already at the latest version
Abstract
We report on a series of SrMo1-xMnxO3-δ perovskite oxides designed as potential anode materials for solid oxide fuel cells (SOFCs). These materials were synthesized using a citrate method, yielding scheelite-type precursors with nominal SrMo1-xMnxO4 compositions, which were further reduced to obtain the active perovskite oxides. Their structural evolution was examined through X-ray diffraction (XRD) and neutron powder diffraction (NPD). These techniques provided insights into the crystallographic changes upon Mn doping, revealing key factors influencing ionic conductivity. Whereas the oxidized scheelite precursors are tetragonal, space group I41/a, the reduced perovskite specimens are cubic, space group Pm-3m, and show the conspicuous absence of oxygen vacancies, even at the highest temperature of 800ºC. The transport properties were analyzed through electrical conductivity measurements, exhibiting a metallic-like behavior. Thermogravimetric analysis (TGA) and dilatometry give insights into the thermal stability and expansion behavior, essential for SOFC operation. Test single SOFC were built in an electrolyte-supported configuration, on LSGM pellets of 300m thickness, assessing the performance of the title materials as anodes. This work emphasizes the critical relationship between the crystal structure and its electrochemical behavior, providing a deeper understanding of how doping strategies can optimize fuel cell performance.
Keywords:
IT-SOFCs
; anode
; SrMoO3
; perovskite
; NPD
; oxygen vacancies
; MIEC behavior
1. Introduction
Over the past few decades, rapid technological and industrial advancements have driven global energy consumption to unprecedented levels. This surge in demand has fueled the urgent search for clean, secure, affordable, and sustainable energy resources. Scientists from various disciplines are collaborating worldwide to address this critical challenge. Traditionally, fossil fuels have been the dominant energy source to meet global needs[1,2]. Unfortunately, the environmental consequences of fossil fuel use, particularly their contribution to climate change, have highlighted the need to explore alternative energy solutions[3,4,5]. Researchers have focused on developing energy resources that are not only clean, efficient, and sustainable but also economically viable and secure, including hydrogen as an energy vector[6,7,8]. Among the promising alternatives, fuel cells meet these criteria and have been commercially available since the mid-1960s.
Fuel cells are static energy conversion devices that generate electricity through an electrochemical reaction between a fuel and an oxidizing agent[9,10,11]. Unlike combustion engines, fuel cells directly convert chemical energy into electrical energy, eliminating the need for a combustion process. While fuel cells are highly efficient, they still produce waste heat and exhaust gases as byproducts of redox reactions. However, through cogeneration, this waste heat can be utilized to generate additional electricity, further improving overall efficiency[12]. Among them, Solid oxide fuel cells (SOFCs) are advanced energy conversion devices capable of achieving efficiencies greater than 70% with cogeneration, making them promising candidates for clean energy applications[13,14]. The critical components of SOFCs include the anode, electrolyte, and cathode, while interconnects and sealants become equally significant when constructing SOFC stacks. In SOFCs, all the components are oxides, and the performance of such fuel cells rely on the ionic conductivity of oxide ions across the electrolyte, which requires elevated temperatures, in the 800-1000ºC range[15,16,17,18,19].
Several key challenges impacting SOFC operation are the following[20]: i) Anode Challenges: Performance is hindered by sulfur poisoning, coke formation, adsorbate surface diffusion, and charge transfer limitations at the triple-phase boundary (TPB); ii) Electrolyte Issues: Efficient oxygen ion (O₂⁻) migration is critical for energy conversion but can be restricted by factors such as ion channel design, dopant-induced vacancy behavior, lattice strain, and phase distribution. Optimizing grain and grain boundary conductivity is essential for developing effective electrolytes; iii) Cathode Limitations: Cathodes face multiple rate-limiting factors, including active surface geometry and overpotential. Comprehensive electrochemical impedance spectroscopy (EIS) is required to evaluate and improve cathode performance; iv) Interconnect Constraints: Interconnects must maintain chemical stability in oxidizing and reducing environments while matching the coefficient of thermal expansion (CTE) of surrounding components. These properties are critical for withstanding repeated thermal cycling during SOFC operation; v) Sealant Requirements: Sealants must effectively isolate fuel and oxidizing gases while maintaining CTE compatibility with neighboring components. Additionally, the glass transition temperature of the sealant dictates the upper operating limit of the SOFC system.
Traditional anode materials are constituted by a biphasic product consisting of a mixture of the electrolyte (ceramic) and Ni metal; this material is denominated cermet[21,22]. While cermets perform well with pure H2 as a fuel, the presence of traces of SH2 or other impurities tend to deactivate them rapidly[23]. Alternative anode materials have been explored to prevent these poisoning problems[24]. An appealing solution is the use of monophasic oxide materials that combine the mixed ionic and electronic properties of cermets; for this reason, they are denominated MIEC oxides [25,26]. Oxides with ABO3 perovskite structure are well known to exhibit the required properties when correctly choosing A and B metals [27,28]. In particular, derivatives from SrMoO3 have been shown to exhibit adequate properties and stability to work as anode materials in SOFC [29,30,31,32,33]. SrMoO3 itself is an excellent metallic band conductor [34], containing Mo4+ ions, which are stable under the reducing conditions created by the presence of the fuel at elevated temperatures. This ion is well-known to catalyze the oxidation reaction of the fuel, thus accomplishing its role as anode material. To enhance the ionic conductivity of this perovskite, which occurs by hoping of oxide ions by an oxygen vacancy mechanism, it is pertinent to increase the number of oxygen vacancies by suitably doping the Mo sites with aliovalent elements, in materials of SrMo1-xBxO3-δ composition [28,29,30,31,32].
In this paper we describe the series of SrMo1-xMnxO3-δ oxides, Mn being a suitable element to replace Mo, stable in reducing conditions in the perovskite structure. For these materials we report on the synthesis of porous specimens by wet-chemistry techniques, their characterization involving X-ray diffraction and neutron diffraction, to evaluate the structural evolution upon doping, the identification of the transport properties, pertinent for their behavior as electrodes, as well as the magnetic behavior derived from magnetic Mn ions, an finally the performance in test cells supported on LSGM electrolyte and fed by H2 as a fuel.
2. Experimental
2.1. Synthesis
The oxides of the family SrMo1-xMnxO3-δ (x= 0.05, 0.10, 0.15, 0.20) were synthetised via citrate method. Sr(NO3)2, MnCO3, and (NH4)6Mo7O24·4H2O were weighed in the appropriate amounts and dissolved in a 10% citric acid solution. This mixture was heated at 300°C and stirred at 375 rpm until a gel was formed. This gel was dried at 100°C and calcined and decomposed in an oven at 600°C for 12 h to form the scheelite precursors (SrMo1-xMnxO4-δ). Subsequently, the obtained powder is reduced at 1050 °C with forming gas (5% H2/95% N2) in a tubular furnace for 13 h in a reducing enviroment, to form the perovskite oxide SrMo1-xMnxO3-δ in its active phase.
2.2. Structural Characterization
Both scheelite and perovskite phases were characterized using a Bruker D8 Advance diffractometer (40 kV, 30 mA), operated with DIFFRACPLUS software in Bragg-Brentano reflection geometry. Cu Kα radiation (λ = 1.540 Å) and a position-sensitive detector (PSD) were used, with a nickel filter to completely eliminate Cu Kβ radiation. XRD patterns were recorded over a 2θ range of 10 to 64°.
The thermal behavior of the crystallographic structure was investigated via Neutron Powder Diffraction (NPD) at temperatures of 25 °C, 100 °C, 200 °C, 300 °C, 400 °C, 500 °C 600 °C, and 800 °C. NPD measurements were performed at the D1B diffractometer at the Institut Laue–Langevin in Grenoble, using a wavelength of λ = 1.280 Å and a 2θ range from 10 to 130°. Approximately 2 g of the sample was placed in a vanadium sample holder, and for the high-temperature measurements, it was placed in an oven working under vacuum. Each measurement took about 2.5 hours. The diffractograms were analyzed via Rietveld refinement[35] using the FullProf suite software version 5.20. A pseudo-Voigt function was applied to model the diffraction peak shapes. Refinements included parameters such as scale factor, background points, zero shift, half-width, asymmetry-corrected pseudo-Voigt parameters, unit-cell dimensions, positional coordinates, and isotropic displacement factors for Sr, Mo and Mn atoms, as well as anisotropic factors for all oxygen atoms. The coherent scattering lengths were 7.02, 6.715, -3.73 and 5.803 fm for Sr, Mo, Mn and O, respectively.
2.3. Microstructural Characterization
For the single-cell evaluation, microstructural characterization was performed by capturing scanning electron microscopy (SEM) images using a FEINova NanoSEM 230 field-effect microscope, in addition to a Hitachi TM-1000 table-top microscope.
2.4. Thermogravimetric Analysis (TGA)
TGA was performed using a Mettler TA-3000 system with a TC10 processor unit, and the thermogravimetric curves were collected in an O₂ flow. The analysis began with the reduced perovskite phases, using around 40 mg of sample. The samples were heated at a rate of 10 °C/min from room temperature to 900 °C, with the thermogravimetric data recorded by a TG50 microbalance.
2.5. Thermal Expansion Coefficients
Dilatometry experiments were carried out to measure the thermal expansion coefficient (TEC) of both perovskite and scheelite phases. Sintered pellets of the perovskite phases, approximately 7 mm in diameter and 1.5 mm in thickness, were prepared by uniaxial pressing of the powders and annealed at 1050 °C for 12 hours in a H₂/N₂ (5%/95%) flow to prevent oxidation. For the scheelite phases, pellets of similar size were sintered at 1050 °C for 12 hours in air. The thermal expansion of these sintered samples was measured using a Linseis L75HX1000 dilatometer over a temperature range from 25 to 900 °C, with the perovskite samples analyzed under a forming gas (N₂/H₂ 95/5%) flow and the scheelite samples measured in an air atmosphere. The heating rate for all measurements was 10 °C min−1.
2.5. DC-Conductivity
Electrical conductivity was measured on sintered rectangular bar-shaped samples (approximately 2 × 3 × 9 mm) in the temperature range from 25 to 850 °C, using the four-point DC method with currents between 0.01 and 0.5 A. The pellets were prepared by pressing the powder in a Retsch PP25 Hydraulic Press and sintering at 1050 °C for 12 hours in a H₂/N₂ (5%/95%) atmosphere. Four platinum wires were attached to the samples in a four-point configuration using platinum paste, followed by calcination at 850 °C for 1 hour under a H₂/N₂ flow. Electrical measurements were taken using a Potentiostat-Galvanostat AUTOLAB PGSTAT 302 from EcoChemie, with data collected every 50 °C. For both dilatometry and conductivity measurements, the perovskite oxide pellets were sintered in a reducing atmosphere, while the scheelite oxide pellets were sintered in air.
2.6. Single-Cell Performance
The power density was evaluated in electrolyte-supported single cells consisting of an anode layer (SrMo1-xMnxO3−δ) (SMMO), a La0.4Ce0.6O2−δ (LDC) buffer layer, a La0.8Sr0.2Ga0.83Mg0.17O3−δ (LSGM) electrolyte, and a SrCo0.8Fe0.2O3−δ (SCFO) cathode. Test single cells were built with the configuration SMMO|LDC|LSGM|SCFO. LSGM was synthesized by heating La2O3, SrCO3, Ga2O3, and MgO powders at 1000 °C and 1200 °C for 20 hours each, with intermediate grinding. The final LSGM pellets were obtained by pressing the powders to pellets with a uniaxial dam and sintering at 1450 °C for 20 hours in air. After grinding, the pellets had a thickness of about 0.3 mm. Inks of LDC, SMMO, and SCFO were deposited on the electrokyte surface. LDC was first printed onto one side of the LSGM disk and fired at 1300 °C for 1 hour. SMMO was then printed onto the LDC layer and fired at 1100 °C, followed by SCFO printing and sintering at 1100 °C for 1 hour. The resulting electrodes had a thickness of 5 μm, and the effective electrode area was 0.25 cm². Platinum gauze was applied to both the anode and cathode as current collectors. The single cell was tested in a vertical tubular furnace at 850 °C, with the anode exposed to a flow of H2 (20 mL min−1) and the cathode exposed to air. Electrochemical characterization was performed using an AUTOLAB 302N Potentiostat/Galvanostat, with voltage scans from 1.3 V to 0.1 V, with 0.010 V steps, and holding 10 seconds at each step. Current density was calculated from the recorded current through the effective area of the cell (0.25 cm²). Each voltage-current scan was considered one cycle, with cell activation monitored over subsequent cycles until maximum power output was achieved.
2.7. Magnetic Measurements
The magnetic properties were analyzed using a SQUID magnetometer (MPMS-3) from Quantum Design (San Diego, USA), across a temperature range of 1.8 to 370 K, with applied magnetic fields up to 7 T.
3. Result and Discussion
3.1. Crystallographic Characterization
Both the scheelite and perovskite phases are characterised by XRD. Figure 1 shows the diffractograms of the different samples of the SrMo1-xMnxO3-δ family and SrMo1-xMnxO4-δ as-obtained precursors. As can be seen, the phases obtained are very crystalline and pure.
3.2. Neutron Powder Diffraction (NPD)
Neutrons are an effective probe to identify oxygen vacancies in oxides, due to the suitable scattering factor for O atoms in the perovskite structure. We performed a NPD study at RT of both perovskite (reduced) and scheelite (oxidized) phases for a selected member of the series with a manganese doping level x= 0.1. Figure 2a,b shows the good agreement between the observed and calculated NPD patterns at room temperature for the SrMo0.9Mn0.1O3-δ perovskite and SrMo0.9Mn0.1O4 scheelite crystal structures. The cubic perovskite structure was refined by the Rietveld method in the Pm-3m space group (No. 221), Z = 1, with Sr atoms located at 1b (½, ½, ½) sites, Mo and Mn atoms distributed at random at 1a (0, 0, 0) sites, and the O oxygen atoms located at 3d (½, 0, 0) positions. The determined unit-cell parameter is a= 3.9491(1) Å. This is smaller compared with the unit-cell magnitude of pristine SrMoO3, of 3.97629(3) Å [36], due to the smaller size of Mn3+ ions (0.58 Å) compared to Mo4+ (0.65 Å) in octahedral coordination. Remarkably, the contraction of the unit-cell upon Mn doping excludes the possibility that the introduced ions are Mn2+, which are too big (0.67 Å) and point to the mentioned low-spin Mn3+ ions. The Mo/Mn and O occupancies were refined; interestingly, Mo and Mn scattering factors are strongly contrasting, and the determination yields a stoichiometry close to the nominal one. A full oxygen stoichiometry is observed at RT. The crystallographic formula is SrMo0.907(5)Mn0.093(5)O3.003(1). The anisotropic displacement factors of O were also refined and are included in Table 1. They are also shown in Figure 3a, presenting flattened ellipsoids (oblate type) that correspond to the highly covalent (Mo,Mn)-O bonds.
It is remarkable that the oxygen stoichiometry of the perovskite phase is close to the expected value of 3.00, despite the introduction of a lower-valence element, such as Mn, in trivalent state according to the structural and magnetic data, into the Mo4+ positions. The reason behind this finding is probably the valence variability of Mo, being able to adopt a mixed Mo4+-Mo5+ valence to accommodate the introduction of Mn (hole doping effect). For instance, a mixed valence of Mo4.10+, implying 10%Mo5+ + 90%Mo4+ would correspond to the mentioned crystallographic stoichiometry SrMo0.907(5)Mn0.093(5)O3.003(1) for the nominal x = 0.1 compound, at room temperature.
Regarding the crystal structure of precursor scheelite phase, with nominal composition SrMo0.9Mn0.1O4, it was also refined from NPD data at RT. The structure is tetragonal, with I41/a symmetry (No. 88, origin at -1). In this setting, Sr is located at 4b (0, 1/4, 5/8) sites, Mo is partially substituted by Mn, statistically distributed in the Wyckoff position 4a (0, 1/4, 1/8), and the oxygen is placed at 16f (x, y, z) positions. In the crystal, Sr is coordinated to 8 oxygen atoms (four short and four long) whereas Mo (Mn) are coordinated to 4 oxygen atoms in a regular tetrahedral arrangement. The quality of the Rietveld fit is displayed in Figure 2b, showing an excellent agreement between observed and calculated profiles. Supplementary Table S1 contains the atomic parameters after the Rietveld refinement of the scheelite phase for x= 0.1. Figure 3b shows a view of the scheelite structure, highlighting the anisotropic displacement factors of oxygen atoms.
3.3. High Temperature NPD
It is interesting to evaluate the thermal evolution of the crystal structure in order to assess the presence of oxygen vacancies at the working temperature of these anode materials within a SOFC. For this purpose, a temperature-dependent NPD study was performed for the x = 0.1 compound, collecting additional NPD patterns at 100, 200, 300, 400, 500, 600, and 800 °C within a vanadium furnace working under vacuum, coupled to the neutron diffractometer. The crystal structure remains cubic in the entire temperature interval, and it could be refined with the same crystallographic model, in the Pm-3m space group. Figure 4a displays the thermal evolution of the unit-cell parameter for the perovskite phase, which regularly increase with temperature, as expected. A thermal expansion coefficient (TEC) of 12.02 × 10⁻⁶ K−1 is estimated between 25 and 800 °C for the perovskite oxide, in reasonable agreement with the value determined from dilatometry measurements for the SrMoO3 family, described below. Figure 4b shows the equivalent isotropic displacement (Beq) factors for O atoms that increase progressively with temperature, from 1.20 Å2 at 100 °C to 2.62 Å2 at 800 °C. Figure 4c illustrates the goodness of the fit at 800ºC, showing an excellent agreement between observed and calculated profiles. The occupancy factor of oxygen positions (right axis of Fig. 4a) seems to be invariant with temperature, within the standard deviations. Even at 800 °C, no oxygen vacancies are determined, assessing the non-defective nature of the oxygen sublattice of this perovskite at the working conditions of a SOFC. This is an unexpected behaviour, since the doping of the Mo sites of SrMoO3 with low valence elements such as Mn was intended to create a substantial number of oxygen vacancies, thus promoting the mobility of O2- ions across the electrode. This result, determined by neutron diffraction, is invaluable to account for the properties of this family of materials as plausible electrodes in SOFC. Although the trend of many transition metal oxides when heated in reducing conditions (or vacuum), is to release oxygen atoms by progressive reduction of the mentioned metals, in this case this trend is overcome by internal disproportionation reactions where the variability of the valences of both Mn and Mo ions play a role, always keeping the oxygen sublattice unchanged. In very similar examples, where SrMoO3 perovskite has been doped with fixed-valence elements (like Mg2+, Al3+, Ga3+…) [31,32] the neutron diffraction technique indeed showed a progressive increment of the oxygen vacancies, thus favouring the oxygen mobility and their MIEC behavior. This structural result accounts for the relatively poor performance of the SrMo1-xMnxO3-δ materials as anodes in SOFC.
3.4. Electrical Conductivity
Figure 5 illustrates the temperature-dependent electrical conductivity of SrMo0.9Mn0.1O3−δ. Under reducing conditions, metallic-like conductivity across the entire temperature range measured can be observed. A value of 209 S/cm has been measured at 850°C, which surpasses other values obtained in the literature for metallic-like behavior of anodes materials.[31,32,37]
3.5. Thermal Expanison Behaviour
To assess the mechanical compatibility of the components in the single cell, thermal expansion measurements were performed. The pellets, prepared as described in the experimental section, were subjected to temperature cycles ranging from 25 to 900°C, and the changes in their thickness during heating were recorded. Using these data, the coefficient of thermal expansion (TEC) was determined for each sample. The results showed a steady, monotonic thermal expansion, with no sudden changes or discontinuities that could compromise the mechanical integrity of the cell. Values for TEC can be seen in Figure 6. These magnitudes are similar to the TEC of the SrCo0.8Fe0.2O3-δ cathode (13.4 K-1)[38], the La0.4Ce0.6O2-δ buffer layer (12.0 K-1)[39], or the LGSM electrolyte (12.4 K-1)[40]. Therefore, we can anticipate good mechanical compatibility between the various components of the SOFC at the operating temperature.
3.6. Thermogravimetric Analysis
The oxygen content variations of perovskites of the SrMo1-xMnxO3-δ were studied using thermogravimetric analysis (TGA) under an oxygen flow between 35 and 900°C. Figure 7 shows a mass increase of between 6.3 and 4.3%, which translates into a gain of between 0.91 and 0.60 oxygen atoms per unit formula. As the proportion of dopant in the structure increases, the resulting scheelite phase has a lower proportion of oxygen, with x=0.2 having the lowest number of oxygen atoms per unit formula. A similar behaviour is obtained for all samples. From RT up to 300°C a slight decrease in weight is experienced, probably due to the desorption of oxygen on the surface of the powdered samples. Between 300 and 550ºC a considerable increase in mass is observed, corresponding to the oxidation of the sample and its change from tye reduced cubic phase to the oxidized tetragonal scheelite. After oxidation, the material stabilized up to 800°C before showing a slight mass decrease. The oxidation and reduction cycles of the material were found to be fully reversible with minimal volume changes, as both the perovskite (with Mo4+-Mo5+ oxidation states) and scheelite phases (with Mo6+ oxidation state) exhibited similar thermal expansion properties, preventing issues like cracking or delamination during cycling.
3.7. Single-Cell Power Tests
An electrolyte-supported solid oxide fuel cell (SOFC) was assembled for each sample. LSGM electrolyte pellets, prepared using the ceramic method and sintered at 1450 °C, were polished to a thickness of approximately 300 μm. A buffer layer (LDC) and the corresponding anode were deposited on one side of the pellet, while a reference cathode (SCFO) was applied to the opposite side. Platinum grids were sticked to both sides using platinum ink as current collectors, with platinum wires attached to each grid and connected to an external circuit to measure power output. The results of these tests are shown in Figure 8. The product of the cell voltage and current density gave a maximum power density 255 mW/cm² for x = 0.1 and 382 mW/cm² for x=0.2 as depicted on the right axis of Figure 8.
3.8. Chemical Compatibility
Equimolar amounts of electrolyte and anode are mixed and heated at 1050°C for 10h in forming gas. The result can be seen in the diffraction pattern of Figure 9. As shown, no additional peaks are observed, other than those from the initial compounds, both of them being cubic perovskites. This implies that, after the thermal treatment, there are no symptoms of chemical reaction between the initial phases.
3.9. Magnetic Measurements
For the study the magnetic properties of both oxidized and reduced oxides, we recorded the temperature-dependent magnetic susceptibility χ(T) and isotherm magnetization M(H) curves. Figure 10a exhibits the χ(T) curves from 1.8 up to 300 K at FC protocol for the SrMo1-xMnxO4 and SrMo1-xMnxO3 (x = 0.1 and 0.2) samples under an external magnetic field of 100 Oe. For the oxidized SrMo1-xMnxO4 samples, the FC susceptibility curves behave almost constant with temperature presenting a χ ≈ 0.6×10⁻⁶ emu/mol value at room temperature, which slowly increases to lower temperatures to a maximum of ~0.28×10⁻⁴ emu/mol at 1.8 K (for x = 0.1), matching the onset of short-range spin–spin correlations between Mn–Mn interactions distributed at random.
For the reduced SrMo1-xMnxO3 samples, the χ(T) curves maintains a similar paramagnetism-like behaviour, however, with a significant magnitude increase mainly at lower temperature, presenting a magnetic susceptibility value of ~2.2×10⁻⁴ emu/mol (x = 0.1) at 1.8 K. In this case, we fitted the inverse of susceptibility χ-1(T) curves in the 20-300 K range for the SrMo1-xMnxO3 (x = 0.1 and 0.2) samples according to modified Curie-Weiss (C-W) law χ(T) = χ0 + C/(T–Θ), where χ0 is a temperature independent susceptibility, C is the Curie constant, and Θ is the Weiss temperature[41] , as shown in inset of Figure 10a. The fitting yields χ0 ≈ 9.3×10⁻⁴ and 7.5×10⁻⁴ emu/mol as well as Θ ≈ -19 and -25 K for x = 0.1 and 0.2, respectively. The obtained χ0 values are consistent with those reported for other similar materials[41,42] . The negative Weiss temperature indicates a predominance of antiferromagnetic (AFM) interactions for both samples.
According to Zhang et al.[42] , the electrons of Mo ions in SrMo1−xMnxO3 are itinerant and only Mn3+ magnetic ions are expected to be localized within the sample. We get effective paramagnetic moments of μeff ≈ 0.26 μB (x = 0.1) and 0.29 μB (x = 0.2) by μeff = , which are smaller than those theoretically expected. We hypothesize that the reduced samples present Mn3+ in a low spin state with S =1[43] , resulting in μtheo ≈ 0.89 and 1.27 μB for x = 0.1 and 0.2, respectively (from μtheo ), which are bigger than the μeff values. In this case, the Mn doping in SrMoO3 where Mo4+ electrons are delocalized (and are responsible for the χ0 temperature-independent susceptibility term) induce a weakening of the local Mn3+ magnetic moments by partial electron delocalization into the Mo-4d orbitals. Consequently, the possible presence of competitions between AFM and ferromagnetic (FM) interactions of these local moments lead to the smaller μeff compared with μtheo. This feature can be visualized through the M(H) curves exhibited in Figure 10b, where the non-saturated hysteresis behaviour al low temperature (1.8 K) suggests the coexistence of AFM and FM-like short-range interactions. Furthermore, the increased magnetization and small hysteresis (inset of Figure 10b) observed for the reduced samples, which is similar to other molybdates such as SrMo1-xRxO3 (R = Cr, Ni, Fe) [41,44,45], corroborate with enhanced magnetic susceptibility at low temperatures by the combination of the Mo reduction and Mn-doping in SrMoO4.
3.10. SEM Post Mortem
The tested single cells were examined by scanning electron microscopy (SEM). Figure 11 shows a cross-sectional image of one of them. As can be seen, no cracks or delaminations are visible in any of the components, which is consistent with the tests carried out previously. It can also be seen that the different layers of the single cell do not mix with each other, and both the anode and reference cathode and the buffer layer have a certain porosity, which is a fundamental requirement for the operation of the single cell.
4. Conclusions
In this study, a series of perovskite-based materials with nominal SrMo1-xMnxO3-δ stoichiometry were successfully synthesized and evaluated as anode materials for solid oxide fuel cells (SOFCs). The materials, synthesized through sol-gel synthesis, demonstrated a poor performance in SOFC tests, with power densities reaching 232 and 382 mW/cm² at 850°C for the x= 0.1 and 0.2 Mn doping levels, respectively. This behavior was attributed to the lack of oxygen vacancies generated by Mn doping, as demonstrated in a temperature-dependent neutron diffraction study. The valence variability of Mn and Mo ions suggests internal disproportionation processes, resulting in a full oxygen sublattice O3 of the perovskite specimens at temperatures as high as 800ºC.
Otherwise, the magnetic measurements indicate a strong electron delocalization, thus weakening the magnetic moments associated with Mn3+ ions, which do not behave as isolated moments in a diamagnetic matrix. Although the thermal expansion coefficients, transport properties, chemical compatibility and post-mortem studies are suitable, the structural results suggest that Mn-doped SrMoO3 perovskites cannot be considered as MIEC oxides, lacking the adequate ionic conductivity.
Supplementary Materials
Table S1, structural parameters of the scheelite SrMo0.9Mn0.1O4 structure at RT, from NPD data.
Author Contributions
Data curation, L.S.B., R.S., M.T.F.D.; Formal analysis, L.S.B., R.S.S., A.A., J.L.M. and J.A.A.; Funding acquisition, J.A.A and J.L.M.; Investigation, A.A. and M.T.F.D. ; Project administration, J.A.A., J.L.M.; Resources, J.A.A.; Supervision, J.A.A.; Writing—original draft, L.S.B., J.A.A.; Writing—review & editing, J.A.A, A.A. and M.T.F.-D. All authors have read and agreed to the published version of the manuscript.
Acknowledgments
We would like to acknowledge the Spanish Ministry for Science and Innovation (MCIN/AEI/10.13039/501100011033) for their financial support of the following projects: PID2021-122477OB-I00, TED2021-129254B-C21, and TED2021-129254B−C22. L.S.B. also expresses gratitude to MCIN for providing the contract PRE2022-103236. We thank the Institut Laue-Langevin (ILL) for making all facilities available.
Conflicts of Interest
“The authors declare no conflict of interest.”
References
- A. Koyamparambath, J. Santillán-Saldivar, B. McLellan, G. Sonnemann, Supply risk evolution of raw materials for batteries and fossil fuels for selected OECD countries (2000–2018), Resources Policy 75 (2022). [CrossRef]
- D. Rutz, I. Ball, B. Di Costanzo, R. Janssen, H. Tretter, K. Knaus, S. Drexlmeier, C. Baumann, F. Puente, V. Šegon, D. Balić, F. Silajdzic, S. Arnaut, A. Nikolaev, S. Jerotić, G. Stegnar, N. Markovska, N. Duic, Ø. Skreiberg, A. Mišech, G. Arrowsmith, An urgent call for the phase-out of fossil space heating systems and for the support of renewables in the heating sector European Technology and Innovation Platform on Renewable Heating and Cooling (RHC-ETIP) and its Bioenergy Technology Panel, n.d.
- N.S. Lewis, D.G. Nocera, Powering the planet: Chemical challenges in solar energy utilization, 2006. www.pnas.orgcgidoi10.1073pnas.0603395103.
- O. Ellabban, H. Abu-Rub, F. Blaabjerg, Renewable energy resources: Current status, future prospects and their enabling technology, Renewable and Sustainable Energy Reviews 39 (2014) 748–764. [CrossRef]
- H. Ishaq, I. Dincer, C. Crawford, A review on hydrogen production and utilization: Challenges and opportunities, Int J Hydrogen Energy 47 (2022) 26238–26264. [CrossRef]
- Z. Abdin, A. Zafaranloo, A. Rafiee, W. Mérida, W. Lipiński, K.R. Khalilpour, Hydrogen as an energy vector, Renewable and Sustainable Energy Reviews 120 (2020). [CrossRef]
- G. Gahleitner, Hydrogen from renewable electricity: An international review of power-to-gas pilot plants for stationary applications, Int J Hydrogen Energy 38 (2013) 2039–2061. [CrossRef]
- H. Balat, E. Kirtay, Hydrogen from biomass - Present scenario and future prospects, Int J Hydrogen Energy 35 (2010) 7416–7426. [CrossRef]
- M. Winter, R.J. Brodd, What are batteries, fuel cells, and supercapacitors?, Chem Rev 104 (2004) 4245–4269. [CrossRef]
- Z.P. Cano, D. Banham, S. Ye, A. Hintennach, J. Lu, M. Fowler, Z. Chen, Batteries and fuel cells for emerging electric vehicle markets, Nat Energy 3 (2018) 279–289. [CrossRef]
- A.B. Stambouli, E. Traversa, A. Stambouli, Solid oxide fuel cells (SOFCs): a review of an environmentally clean and efficient source of energy, 2002. www.elsevier.com/locate/rser.
- H.I. Onovwiona, V.I. Ugursal, Residential cogeneration systems: Review of the current technology, Renewable and Sustainable Energy Reviews 10 (2006) 389–431. [CrossRef]
- M. Singh, D. Zappa, E. Comini, Solid oxide fuel cell: Decade of progress, future perspectives and challenges, Int J Hydrogen Energy 46 (2021) 27643–27674. [CrossRef]
- Q. Xu, Z. Guo, L. Xia, Q. He, Z. Li, I. Temitope Bello, K. Zheng, M. Ni, A comprehensive review of solid oxide fuel cells operating on various promising alternative fuels, Energy Convers Manag 253 (2022). [CrossRef]
- P.I. Cowin, C.T.G. Petit, R. Lan, J.T.S. Irvine, S. Tao, Recent progress in the development of anode materials for solid oxide fuel cells, Adv Energy Mater 1 (2011) 314–332. [CrossRef]
- N. Mahato, A. Banerjee, A. Gupta, S. Omar, K. Balani, Progress in material selection for solid oxide fuel cell technology: A review, Prog Mater Sci 72 (2015) 141–337. [CrossRef]
- A.J. Jacobson, Materials for solid oxide fuel cells, Chemistry of Materials 22 (2010) 660–674. [CrossRef]
- E. V. Tsipis, V. V. Kharton, Electrode materials and reaction mechanisms in solid oxide fuel cells: A brief review : I Electrochemical behavior vs. materials science aspects, Journal of Solid State Electrochemistry 12 (2008) 1367–1391. [CrossRef]
- F.S. da Silva, T.M. de Souza, Novel materials for solid oxide fuel cell technologies: A literature review, Int J Hydrogen Energy 42 (2017) 26020–26036. [CrossRef]
- S.J. Litzelman, J.L. Hertz, W. Jung, H.L. Tuller, Opportunities and challenges in materials development for thin film solid oxide fuel cells, Fuel Cells 8 (2008) 294–302. [CrossRef]
- B. Shri Prakash, S. Senthil Kumar, S.T. Aruna, Properties and development of Ni/YSZ as an anode material in solid oxide fuel cell: A review, Renewable and Sustainable Energy Reviews 36 (2014) 149–179. [CrossRef]
- W.Z. Zhu, S.C. Deevi, A review on the status of anode materials for solid oxide fuel cells, Materials Science and Engineering: A 362 (2003) 228–239. [CrossRef]
- Y. Matsuzaki, I. Yasuda, The poisoning effect of sulfur-containing impurity gas on a SOFC anode: Part I. Dependence on temperature, time, and impurity concentration, 2000. www.elsevier.com/locate/ssi.
- S.P.S. Shaikh, A. Muchtar, M.R. Somalu, A review on the selection of anode materials for solid-oxide fuel cells, Renewable and Sustainable Energy Reviews 51 (2015) 1–8. [CrossRef]
- C. Xia, Z. Li, S. Wang, B.A. Beshiwork, B. Lin, Recent progress on efficient perovskite ceramic anodes for high-performing solid oxide fuel cells, Int J Hydrogen Energy 62 (2024) 331–344. [CrossRef]
- J.W. Fergus, Oxide anode materials for solid oxide fuel cells, Solid State Ion 177 (2006) 1529–1541. [CrossRef]
- J. Sunarso, S.S. Hashim, N. Zhu, W. Zhou, Perovskite oxides applications in high temperature oxygen separation, solid oxide fuel cell and membrane reactor: A review, Prog Energy Combust Sci 61 (2017) 57–77. [CrossRef]
- O. Chun, F. Jamshaid, M.Z. Khan, O. Gohar, I. Hussain, Y. Zhang, K. Zheng, M. Saleem, M. Motola, M.B. Hanif, Advances in low-temperature solid oxide fuel cells: An explanatory review, J Power Sources 610 (2024). [CrossRef]
- R. Martínez-Coronado, J.A. Alonso, A. Aguadero, M.T. Fernández-Díaz, Optimized energy conversion efficiency in solid-oxide fuel cells implementing SrMo 1-xFe xO 3-δ perovskites as anodes, J Power Sources 208 (2012) 153–158. [CrossRef]
- R. Martínez-Coronado, J.A. Alonso, A. Aguadero, M.T. Fernández-Díaz, New SrMo1−xCrxO3−δ perovskites as anodes in solid-oxide fuel cells, Int J Hydrogen Energy 39 (2014) 4067–4073. [CrossRef]
- V. Cascos, J.A. Alonso, M.T. Fernández-Díaz, Novel Mg-doped SrMoO3 Perovskites designed as anode materials for solid oxide fuel cells, Materials 9 (2016) 588. [CrossRef]
- V. Cascos, L. Troncoso, J.A. Alonso, M.T. Fernández-Díaz, Design of new Ga-doped SrMoO3 perovskites performing as anode materials in SOFC, Renew Energy 111 (2017) 476–483. [CrossRef]
- R. Martínez-Coronado, J.A. Alonso, M.T. Fernández-Díaz, SrMo0.9Co0.1O3-δ: A potential anode for intermediate-temperature solid-oxide fuel cells (IT-SOFC), J Power Sources 258 (2014) 76–82. [CrossRef]
- X. Jia, Y. Chen, C.W. Nan, J. Ma, C. Chen, High UV Transparent Conductivity of SrMoO3 Thin Films, Cryst Growth Des 24 (2024) 5402–5410. [CrossRef]
- H.M. Rietveld, A profile refinement method for nuclear and magnetic structures, Applied Crystallography 2 (1969) 65–71.
- R.B. Macquart, B.J. Kennedy, M. Avdeev, Neutron diffraction study of phase transitions in perovskite-type strontium molybdate SrMoO3, J Solid State Chem 183 (2010) 250–255. [CrossRef]
- V. Cascos, M. Chivite Lacaba, N. Biskup, M.T. Fernández-Díaz, J.A. Alonso, SrMo0.9O3−δ Perovskite with Segregated Ru Nanoparticles Performing as Anode in Solid Oxide Fuel Cells, ACS Appl Mater Interfaces 16 (2024) 17474–17482. [CrossRef]
- A.A. Yaremchenko, V. V Kharton, M. Avdeev, A.L. Shaula, F.M.B. Marques, Oxygen permeability, thermal expansion and stability of SrCo0.8Fe0.2O3−δ–SrAl2O4 composites, Solid State Ion 178 (2007) 1205–1217. [CrossRef]
- X. Zhu, S. Le, X. Chen, K. Sun, Y. Yuan, N. Zhang, Chemical compatibility, thermal expansion matches and electrochemical performance of SrCo0.8Fe0.2O3−δ–La0.45Ce0.55O2−δ composite cathodes for intermediate-temperature solid oxide fuel cells, Int J Hydrogen Energy 36 (2011) 12549–12554. [CrossRef]
- J.W. Stevenson, K. Hasinska, N.L. Canfield, T.R. Armstrong, Influence of Cobalt and Iron Additions on the Electrical and Thermal Properties of ( La , Sr ) ( Ga , Mg ) O 3 − δ, J Electrochem Soc 147 (2000) 3213. [CrossRef]
- B.C. Zhao, Y.P. Sun, S.B. Zhang, W.H. Song, J.M. Dai, Ferromagnetism in Cr substituted SrMoO3 system, J Appl Phys 102 (2007) 113903–5. [CrossRef]
- S.B. Zhang, Y.P. Sun, B.C. Zhao, X. Luo, C.Y. Hao, X.B. Zhu, W.H. Song, Mn doping-induced semiconducting behavior in the perovskite molybdates SrMo1-x Mnx O3 (0≤x≤0.20), J Appl Phys 102 (2007). [CrossRef]
- S. Mugiraneza, A.M. Hallas, Tutorial: a beginner’s guide to interpreting magnetic susceptibility data with the Curie-Weiss law, Commun Phys 5 (2022). [CrossRef]
- S.B. Zhang, Y.P. Sun, B.C. Zhao, X.B. Zhu, W.H. Song, Influence of Ni doping on the properties of perovskite molybdates SrMo1-xNixO3 (0.02≤x≤0.08), Solid State Commun 142 (2007) 671–675. [CrossRef]
- R. Martínez-Coronado, A. Aguadero, J.A. Alonso, M.T. Fernández-Díaz, Neutron diffraction and magnetic study of the low-temperature transitions in SrMo1-xFexO3-δ, Mater Res Bull 47 (2012) 2148–2153. [CrossRef]
Figure 1.
X-ray diffractograms of the perovskite (a) and scheelite (b) phases for the members of the SrMo1-xMnxO3-δ and SrMo1-xMnxO4-δ families of compounds, respectively.
Figure 1.
X-ray diffractograms of the perovskite (a) and scheelite (b) phases for the members of the SrMo1-xMnxO3-δ and SrMo1-xMnxO4-δ families of compounds, respectively.
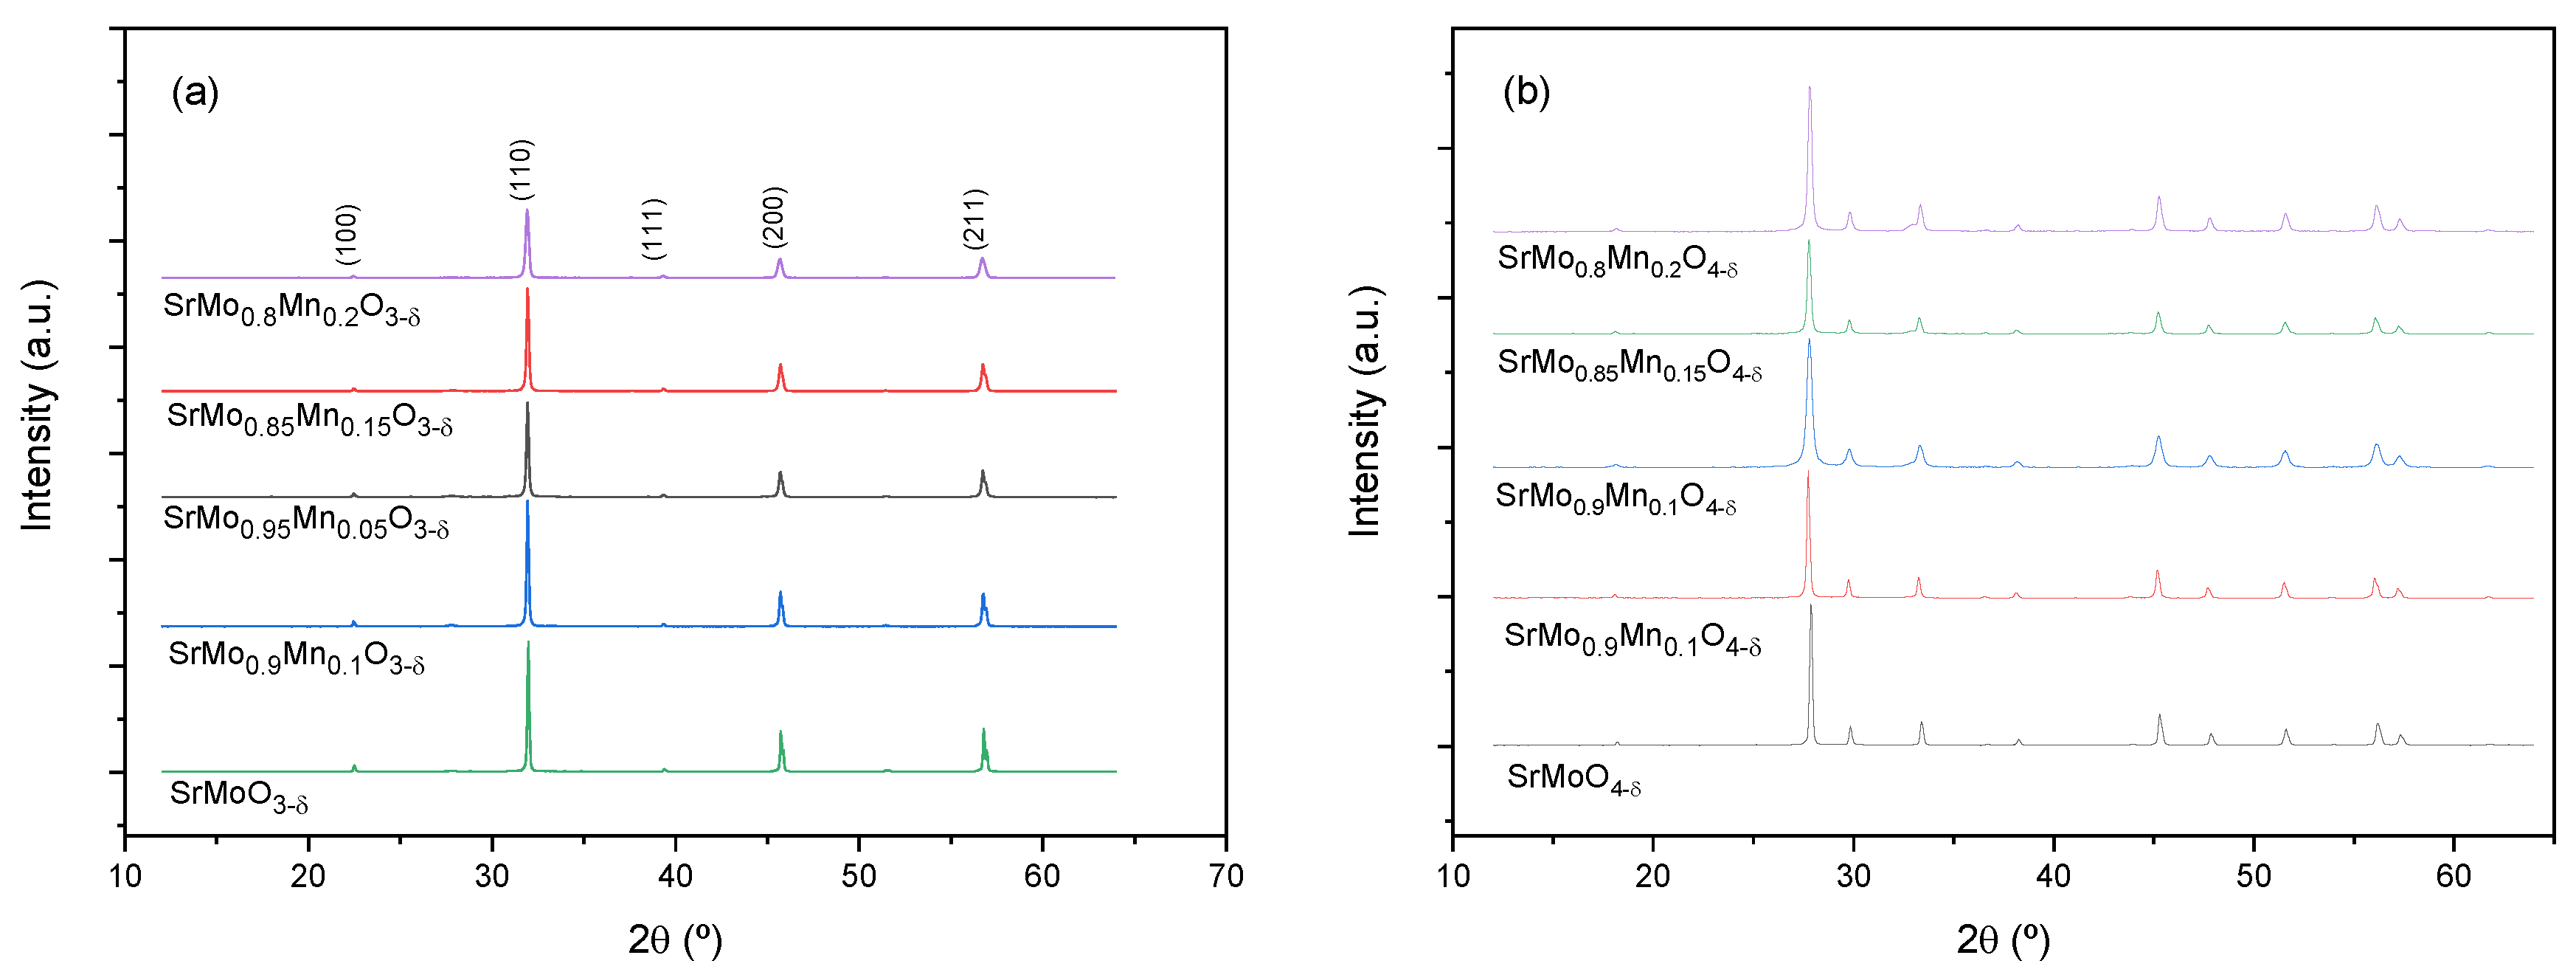
Figure 2.
Observed (crosses), calculated (full line), and difference (at the bottom) NPD profiles for (a) reduced SrMo0.9Mn0.1O3-δ perovskite and (b) oxidized SrMo0.9Mn0.1O4-δ scheelite at 25 °C, refined in the cubic Pm-3m and tetragonal I41/a space groups, respectively. The vertical markers indicate the allowed Bragg reflections.
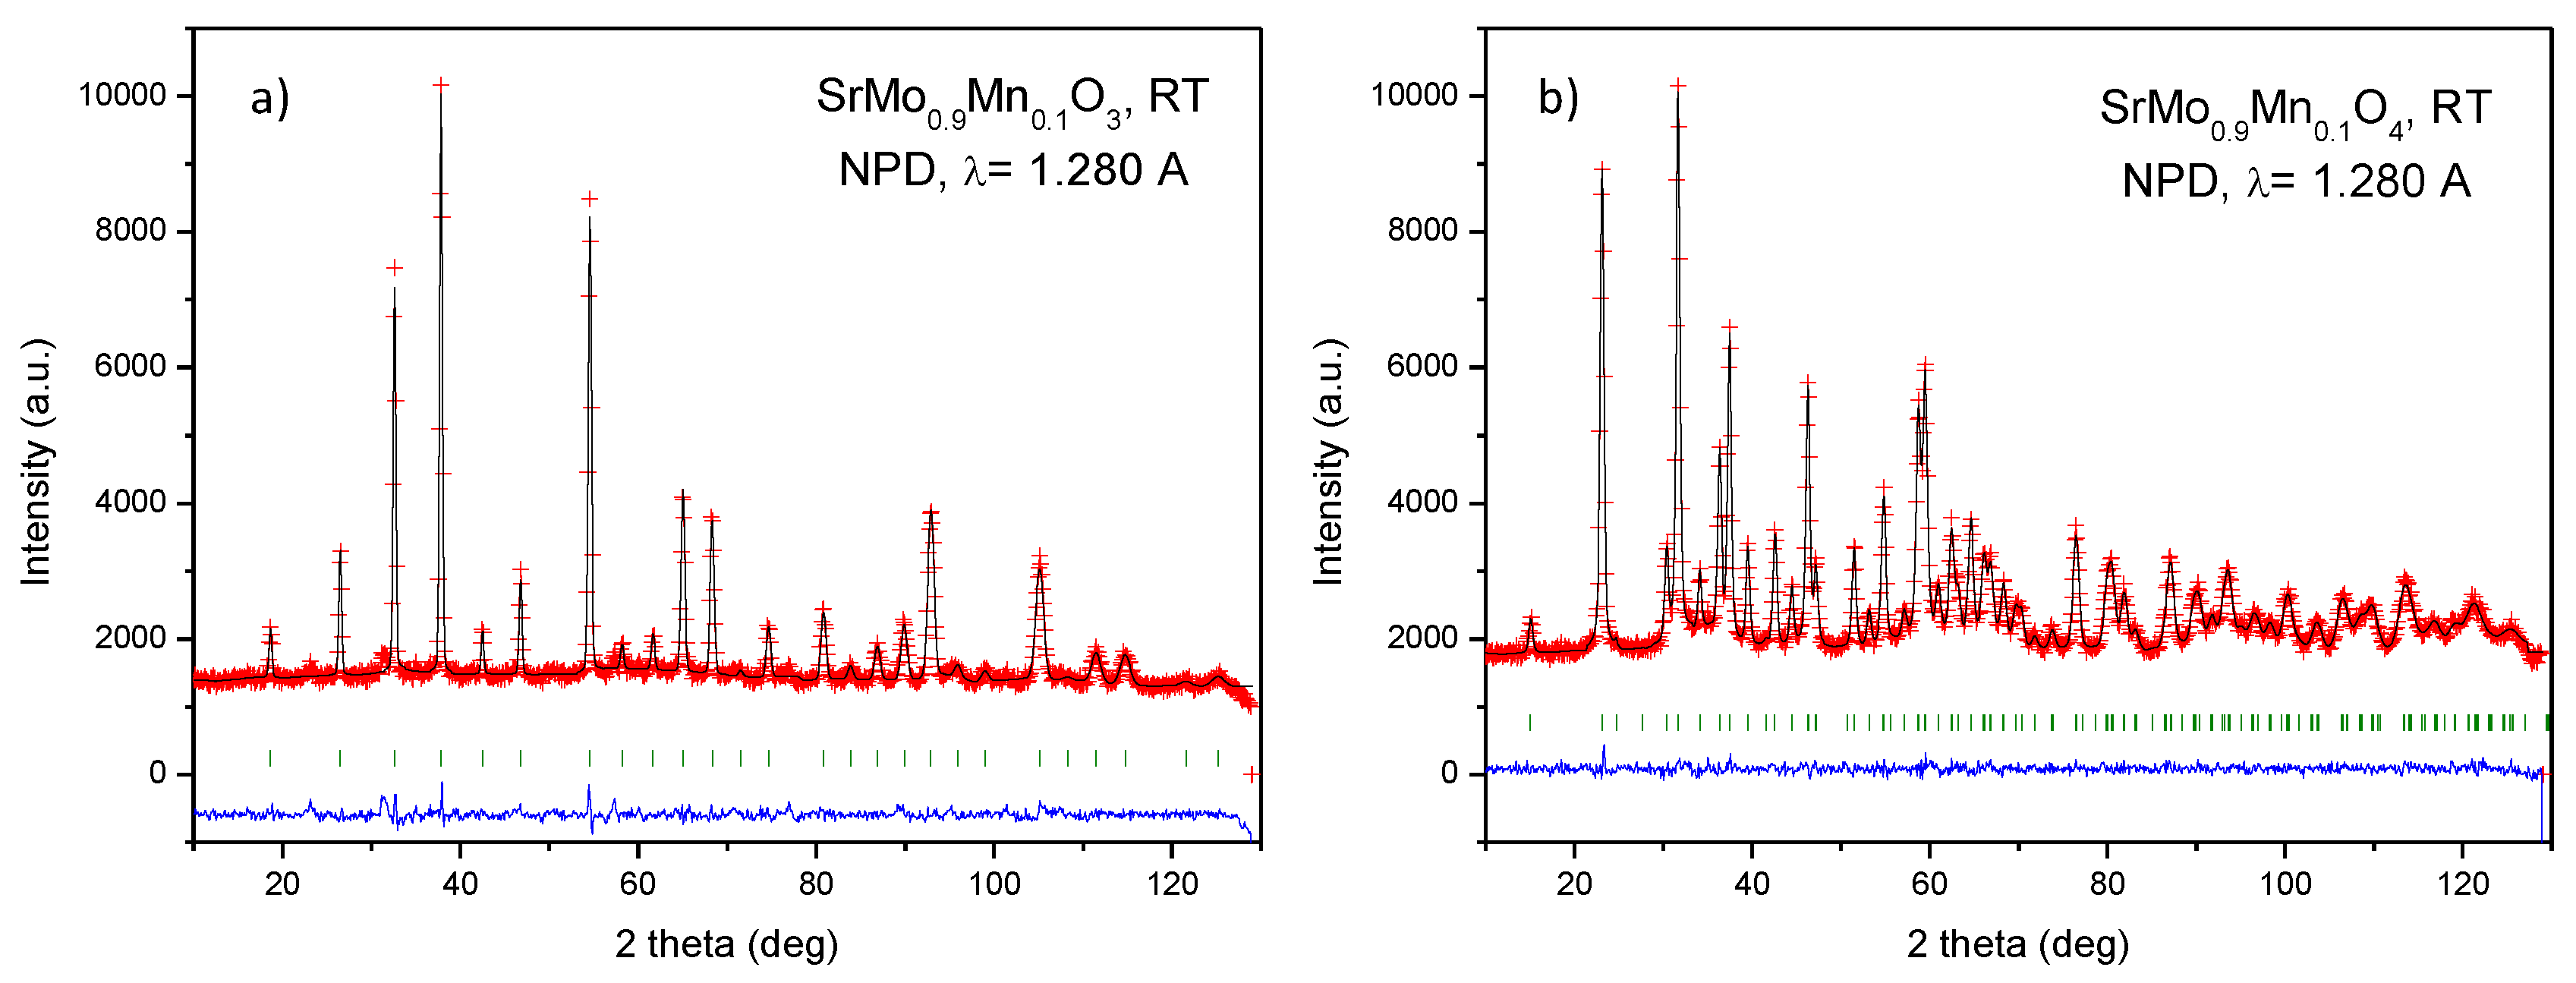
Figure 3.
View of a) cubic perovskite crystal structure, where the green sphere is the Sr atom, the red flattened spheres are the anisotropic (oblate) oxygen ellipsoids and the grey spheres are the Mo, Mn atoms, and b) precursor scheelite structure (oxidized specimen), with the same color code.
Figure 3.
View of a) cubic perovskite crystal structure, where the green sphere is the Sr atom, the red flattened spheres are the anisotropic (oblate) oxygen ellipsoids and the grey spheres are the Mo, Mn atoms, and b) precursor scheelite structure (oxidized specimen), with the same color code.
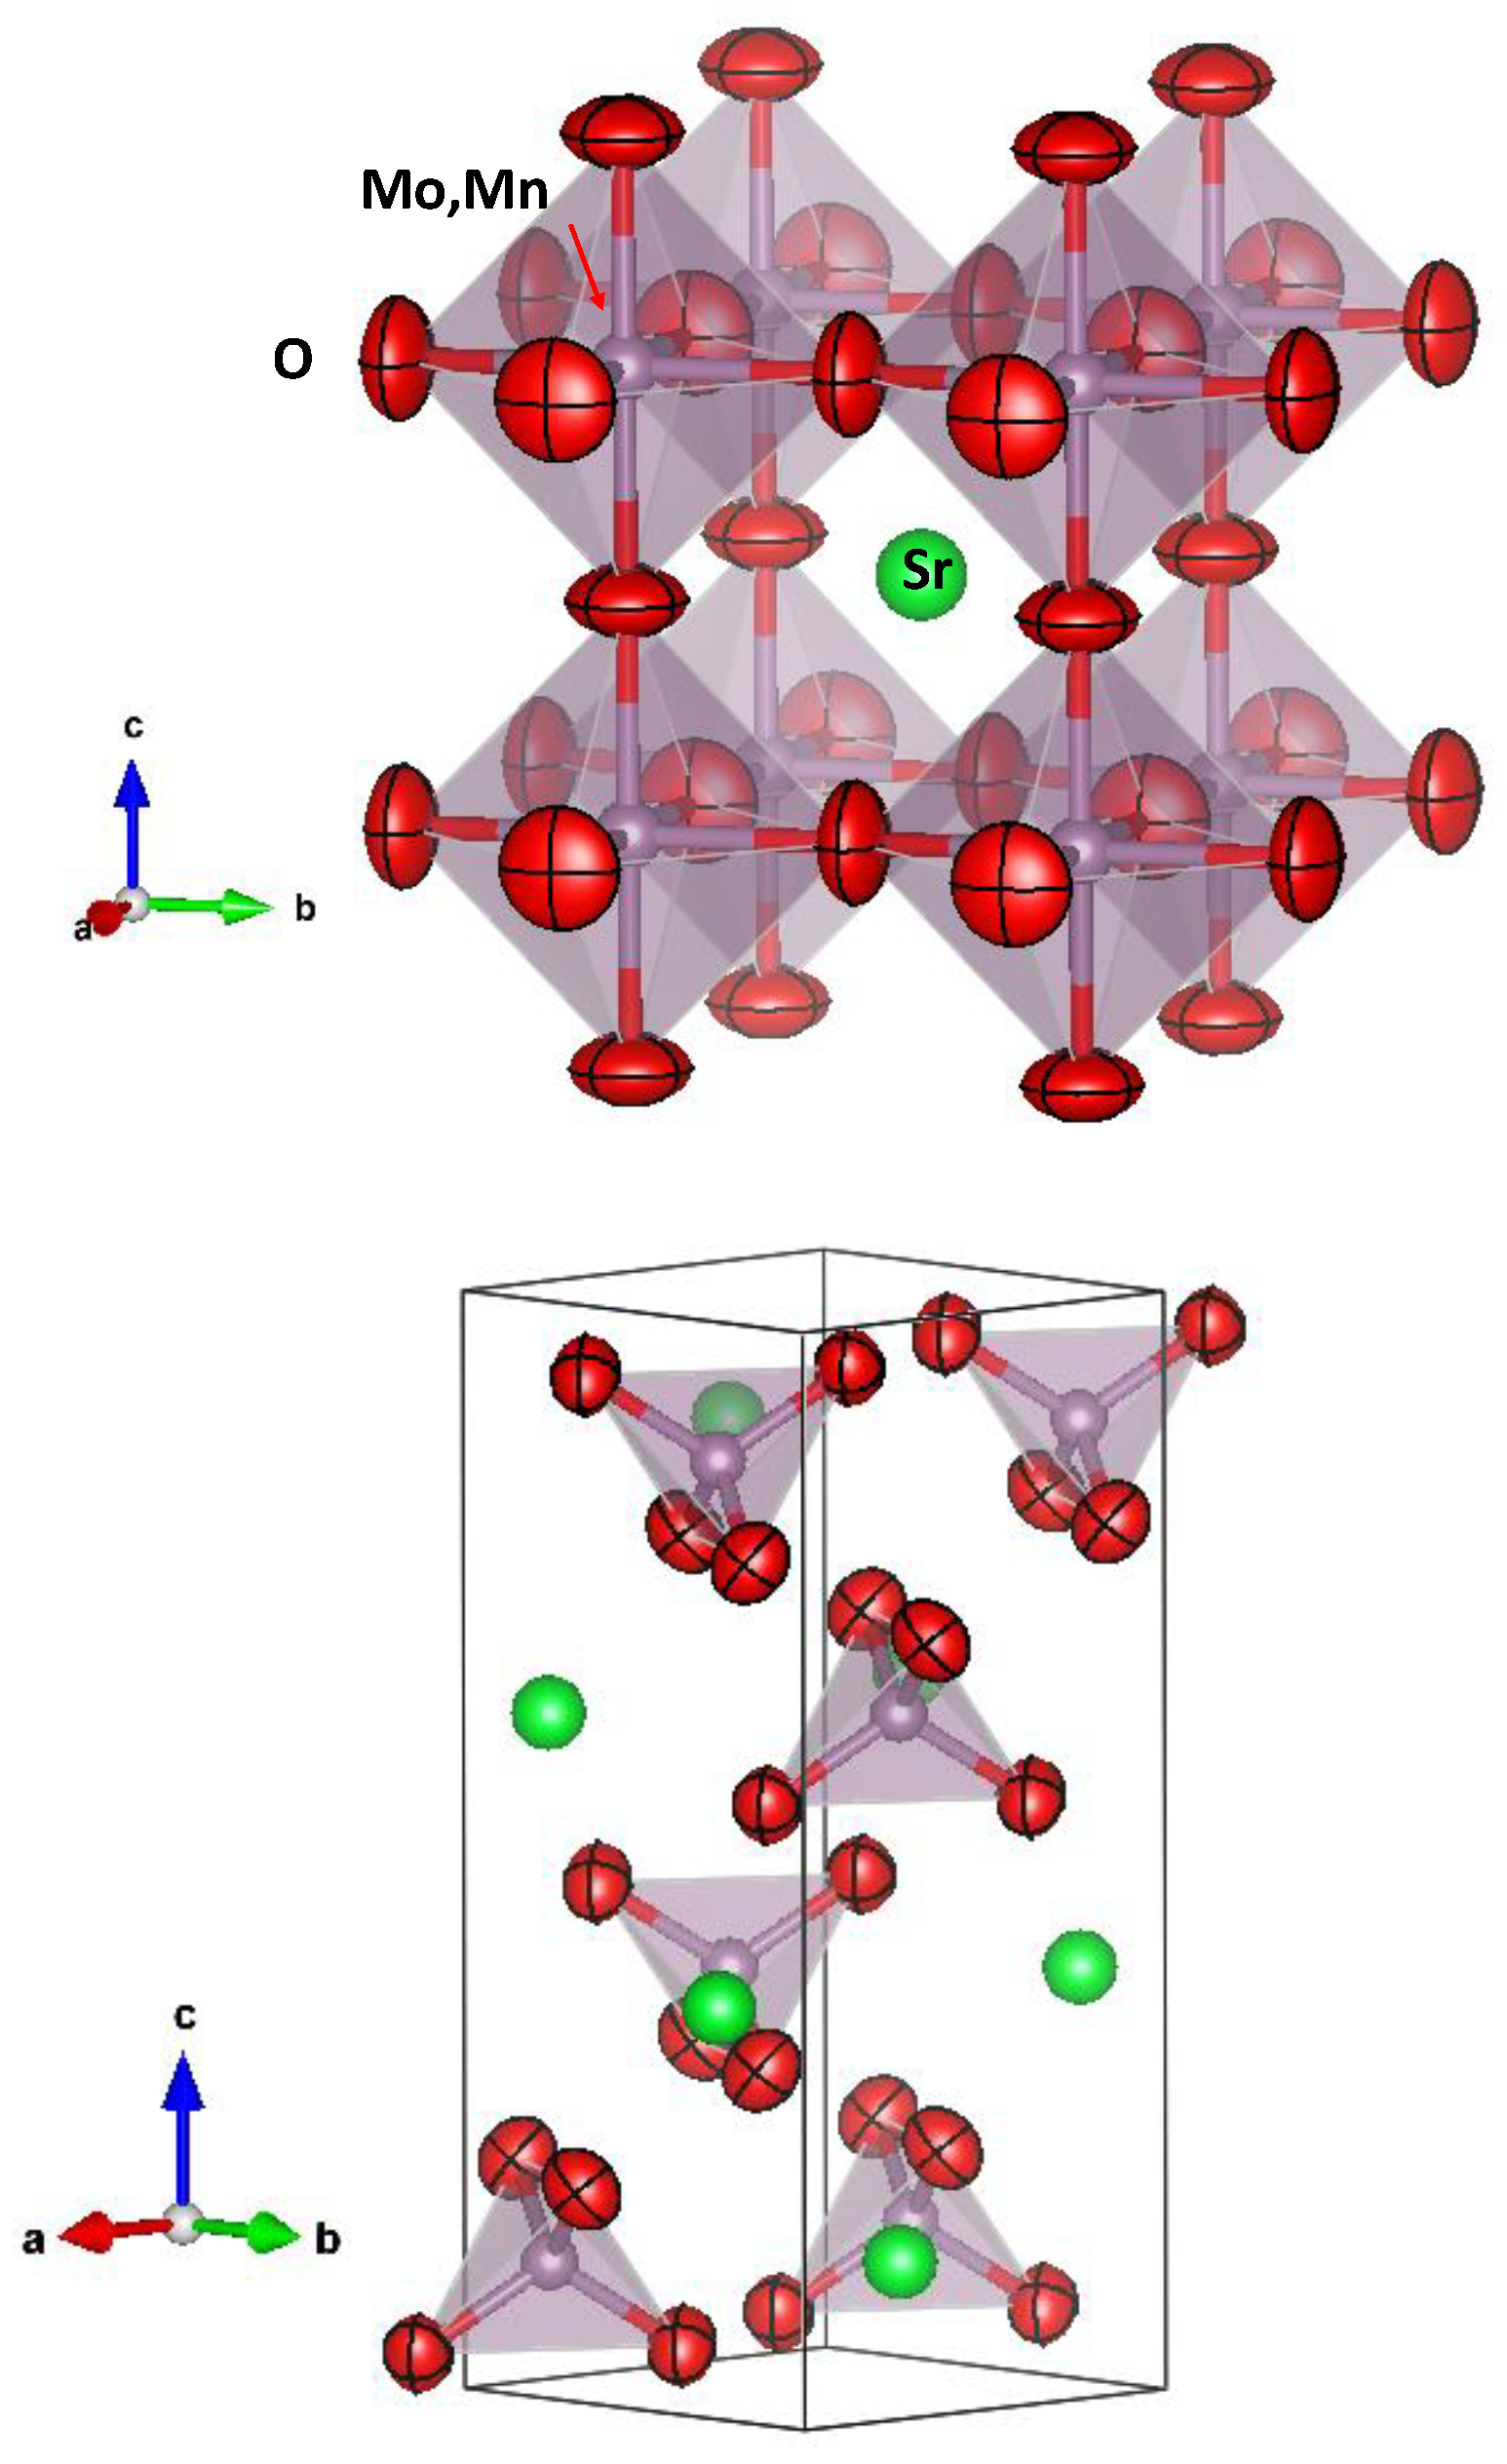
Figure 4.
Evolution of different atomic parameters with temperature. The error bars are smaller than the size of the symbols. a) left axis: unit cell parameters; right axis: oxygen content of the perovskite unit cell; b) equivalent isotropic displaceent factor for O atoms; c) Rietveld plot at 800ºC.
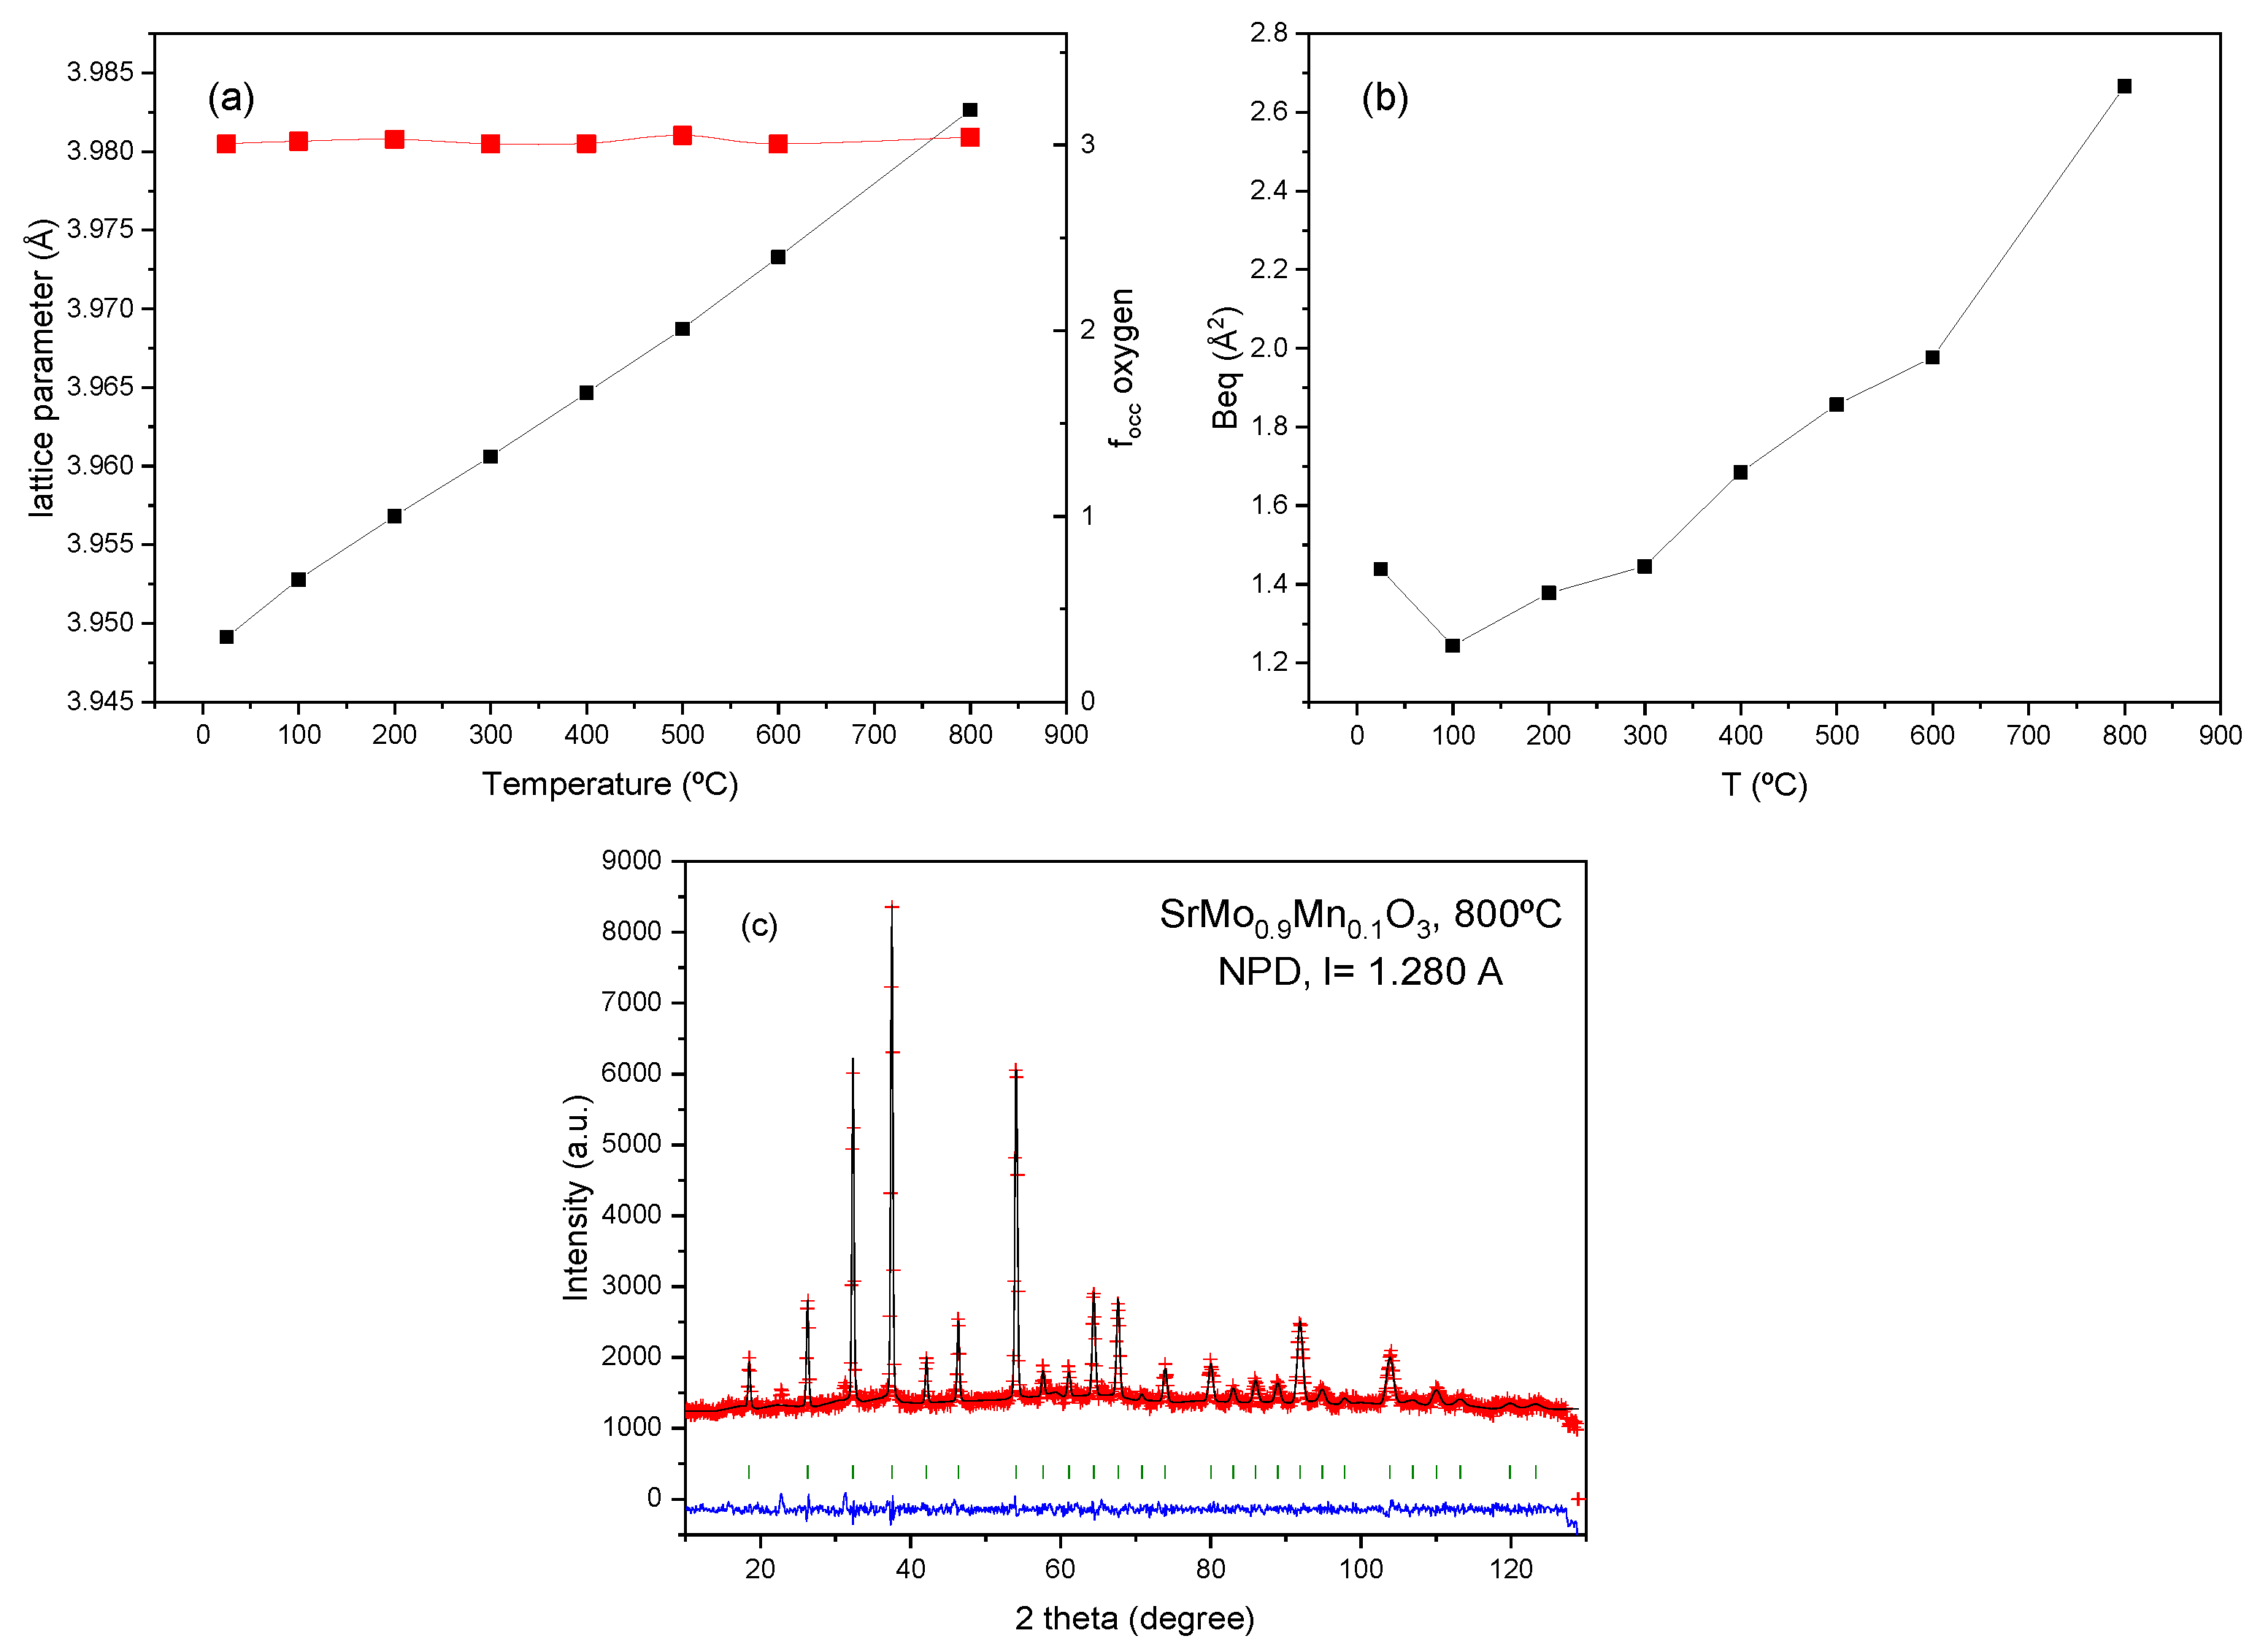
Figure 5.
Electrical conductivity of SrMo0.9Mn0.1O3-δ as a function of temperature measured in a forming gas flow (H2/N2 5%/95%).
Figure 5.
Electrical conductivity of SrMo0.9Mn0.1O3-δ as a function of temperature measured in a forming gas flow (H2/N2 5%/95%).
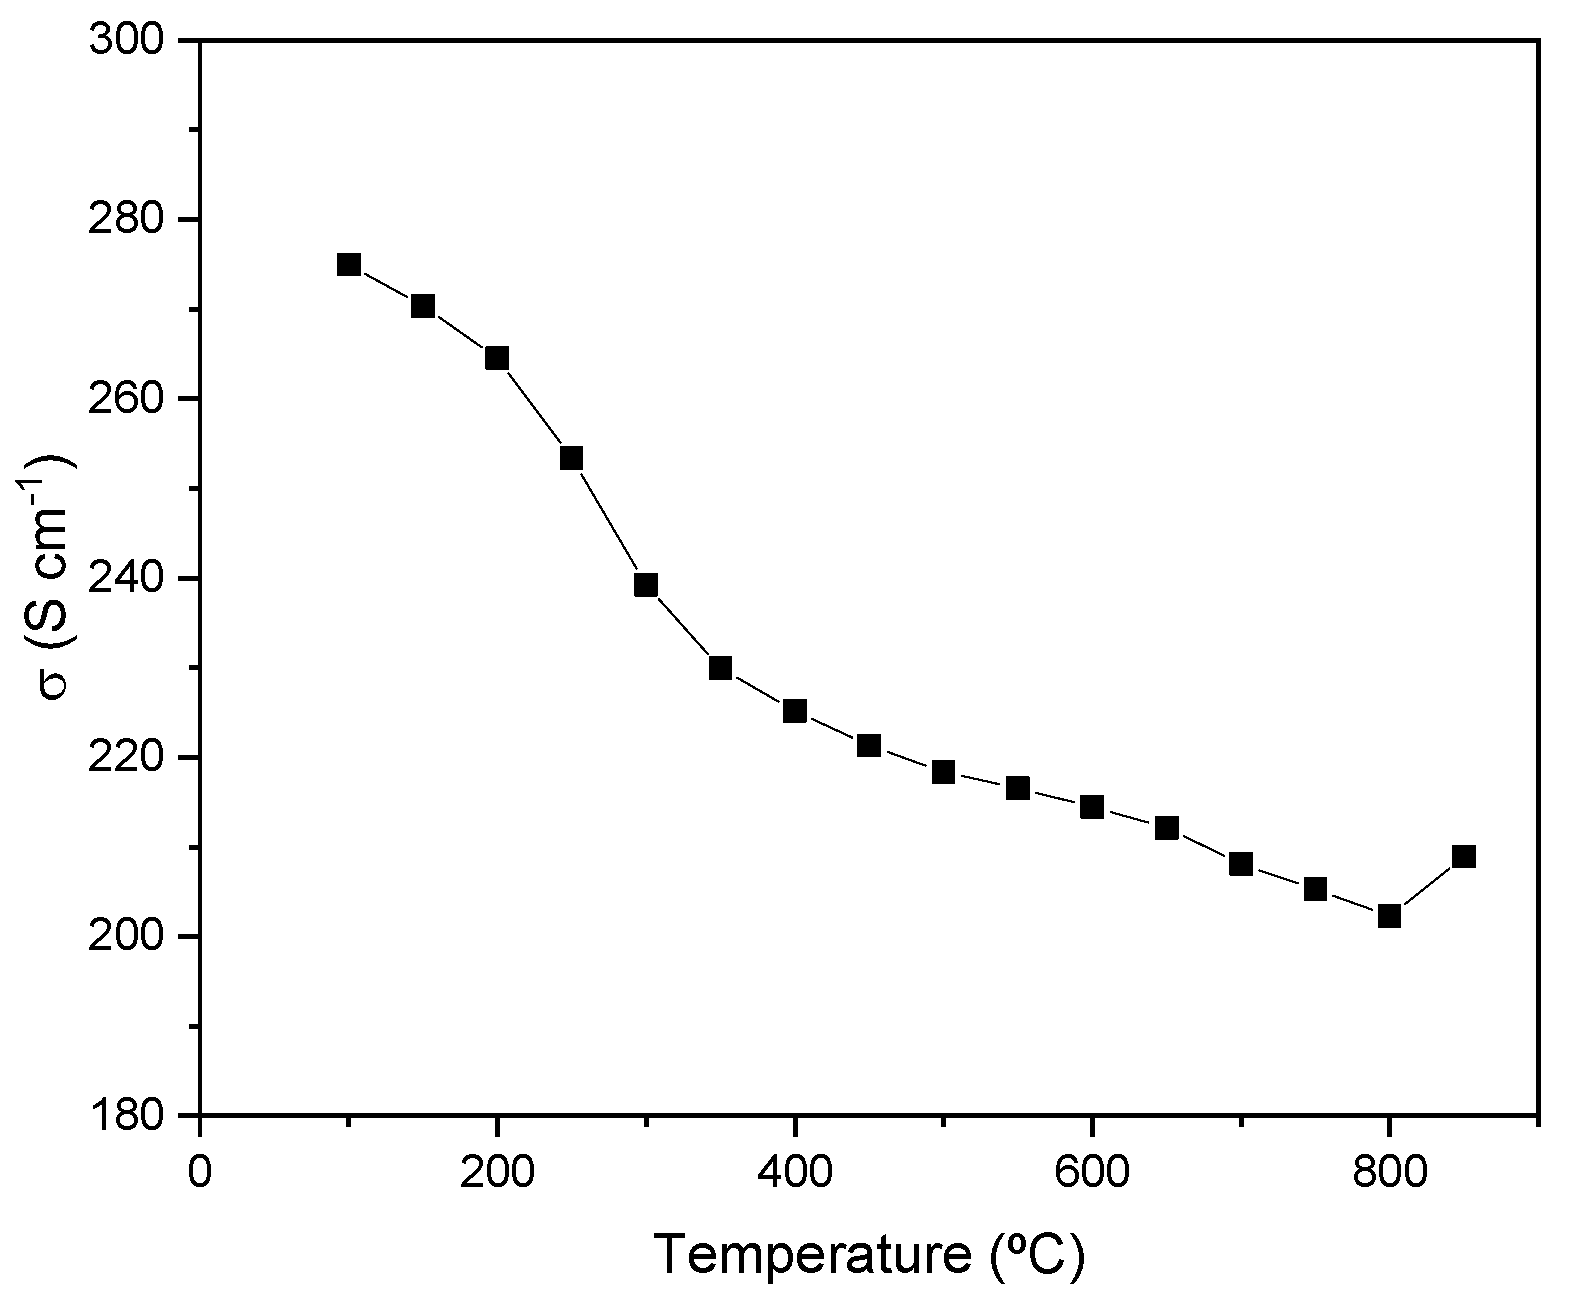
Figure 6.
Thermal expansion measured by dilatometry for SrMo0.95Mn0.05O3-δ perovskutes, compared to the non-doped sample, and the SrMo1-xMnxO4-δ scheelite family compared to the non-doped sample.
Figure 6.
Thermal expansion measured by dilatometry for SrMo0.95Mn0.05O3-δ perovskutes, compared to the non-doped sample, and the SrMo1-xMnxO4-δ scheelite family compared to the non-doped sample.
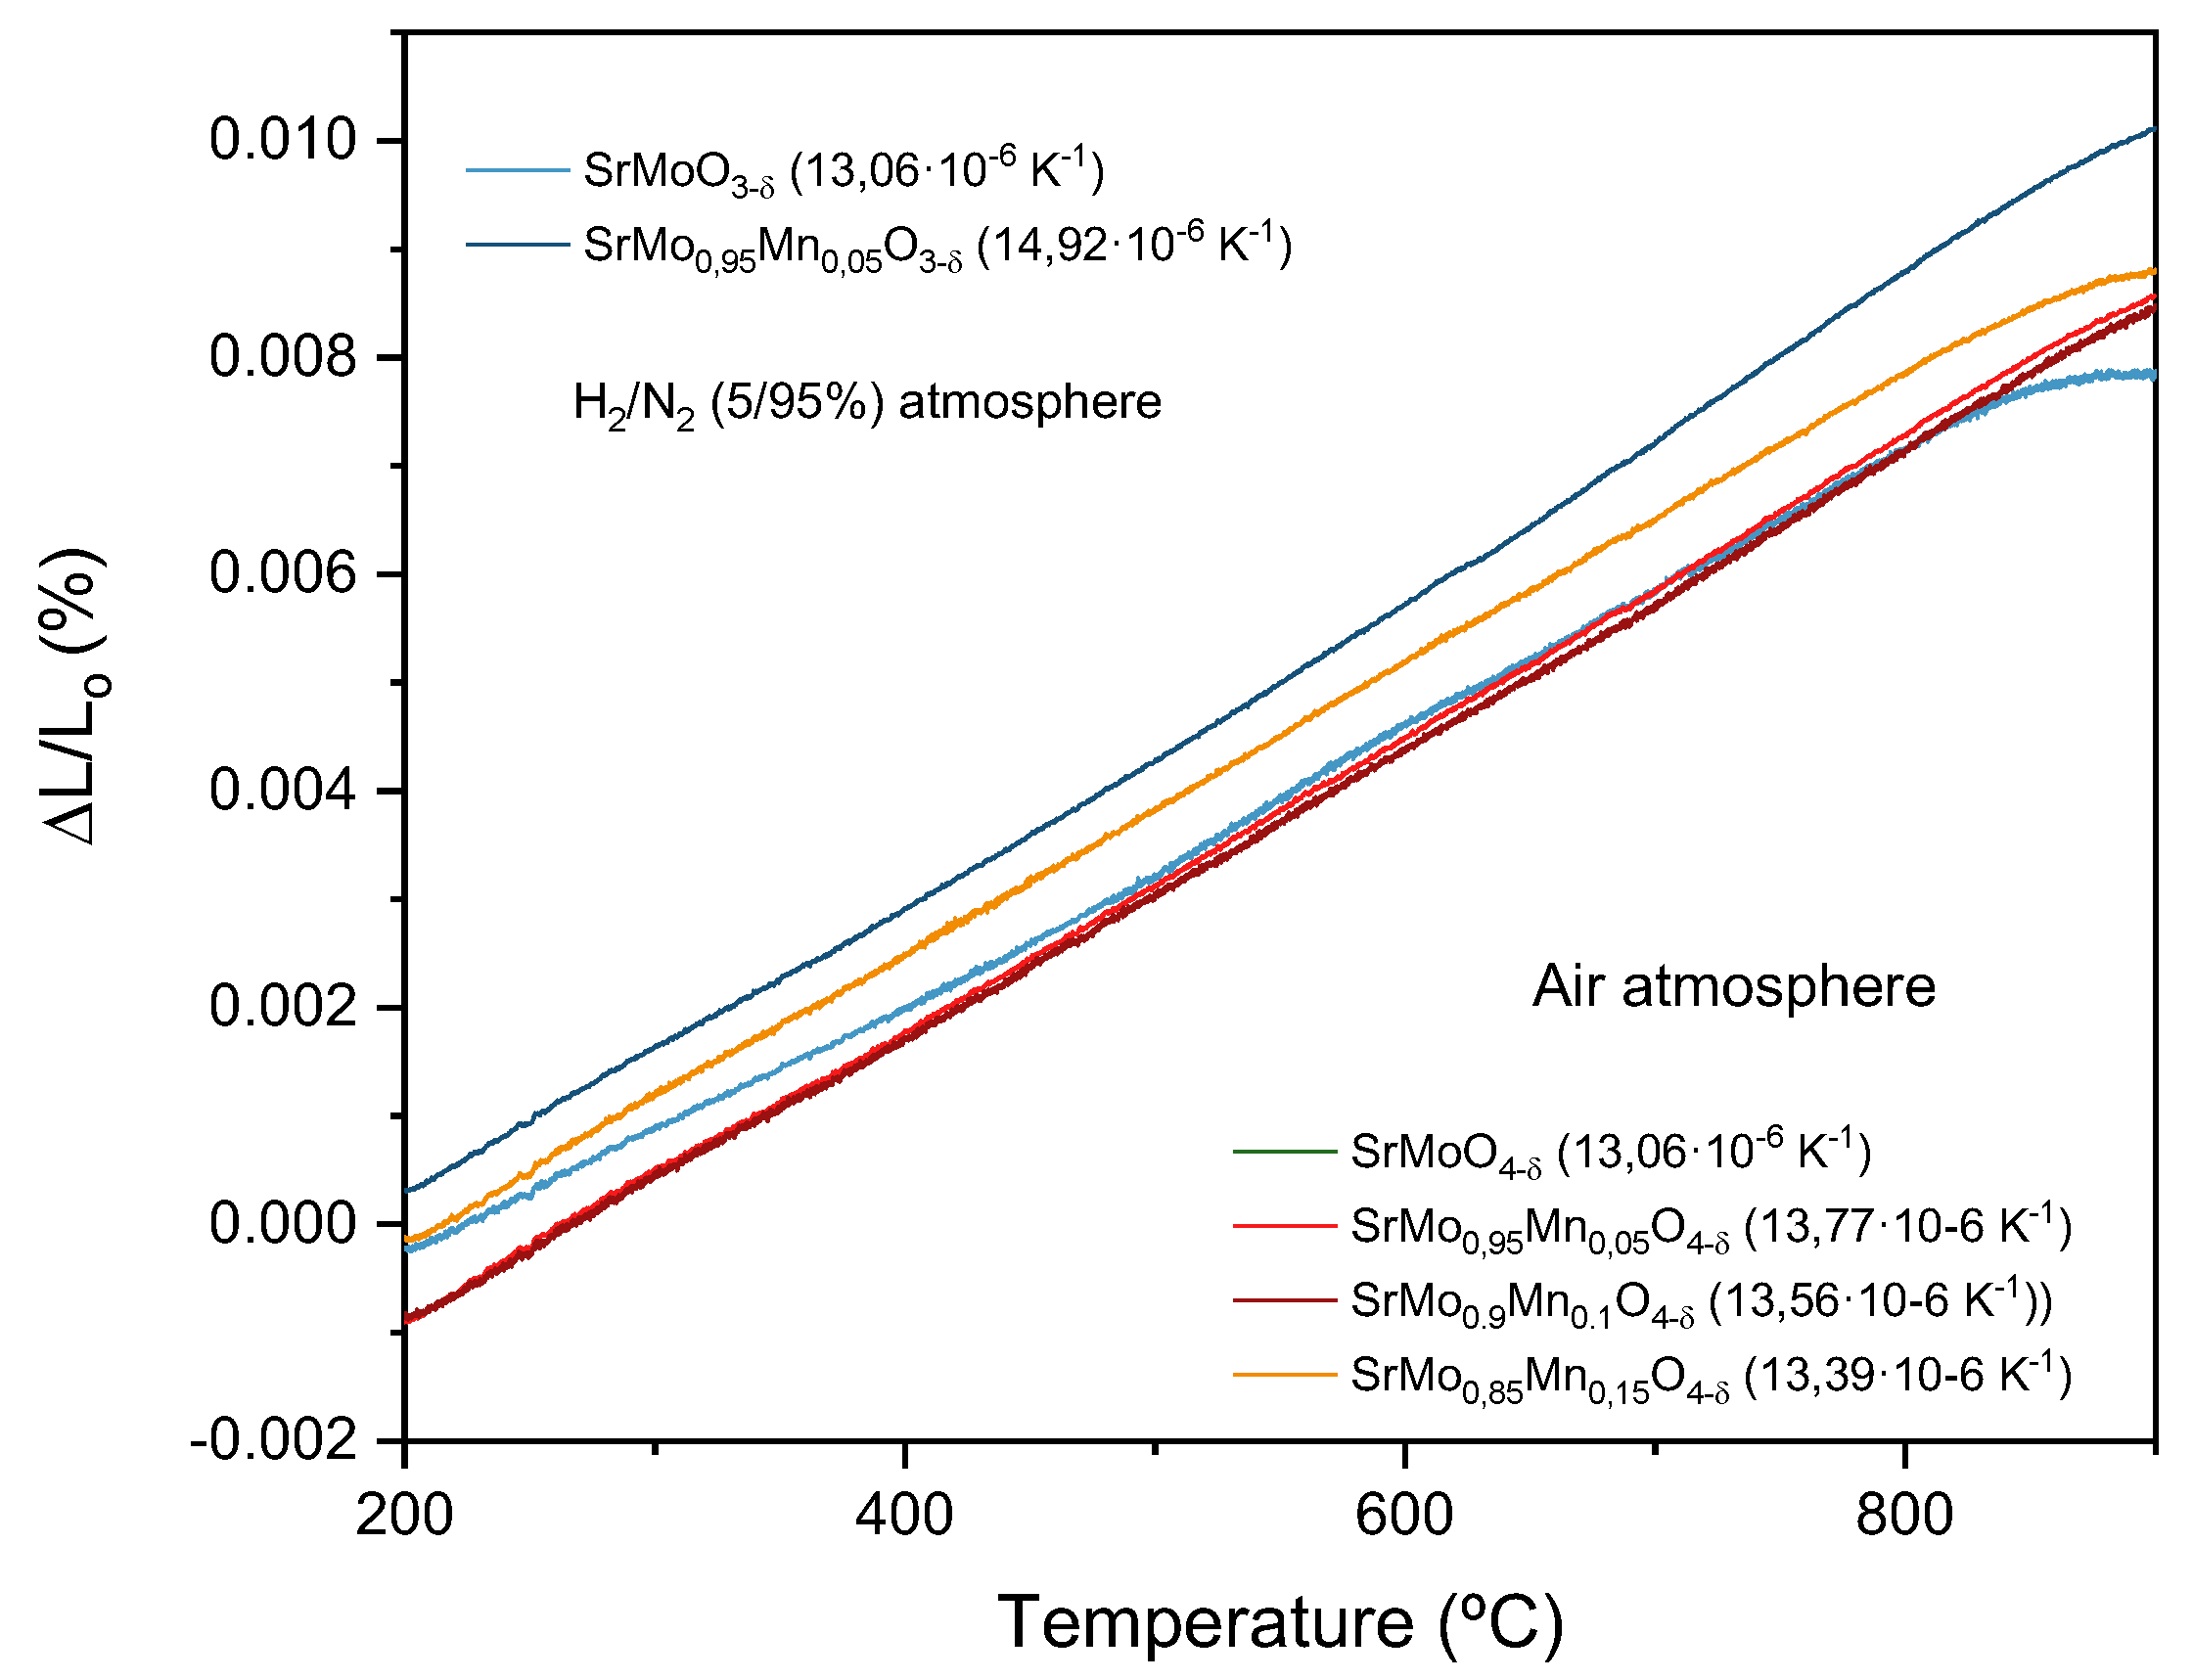
Figure 7.
Thermogravimetric study for all SrMo1-xMnxO3-δ family compounds in air atmosphere.
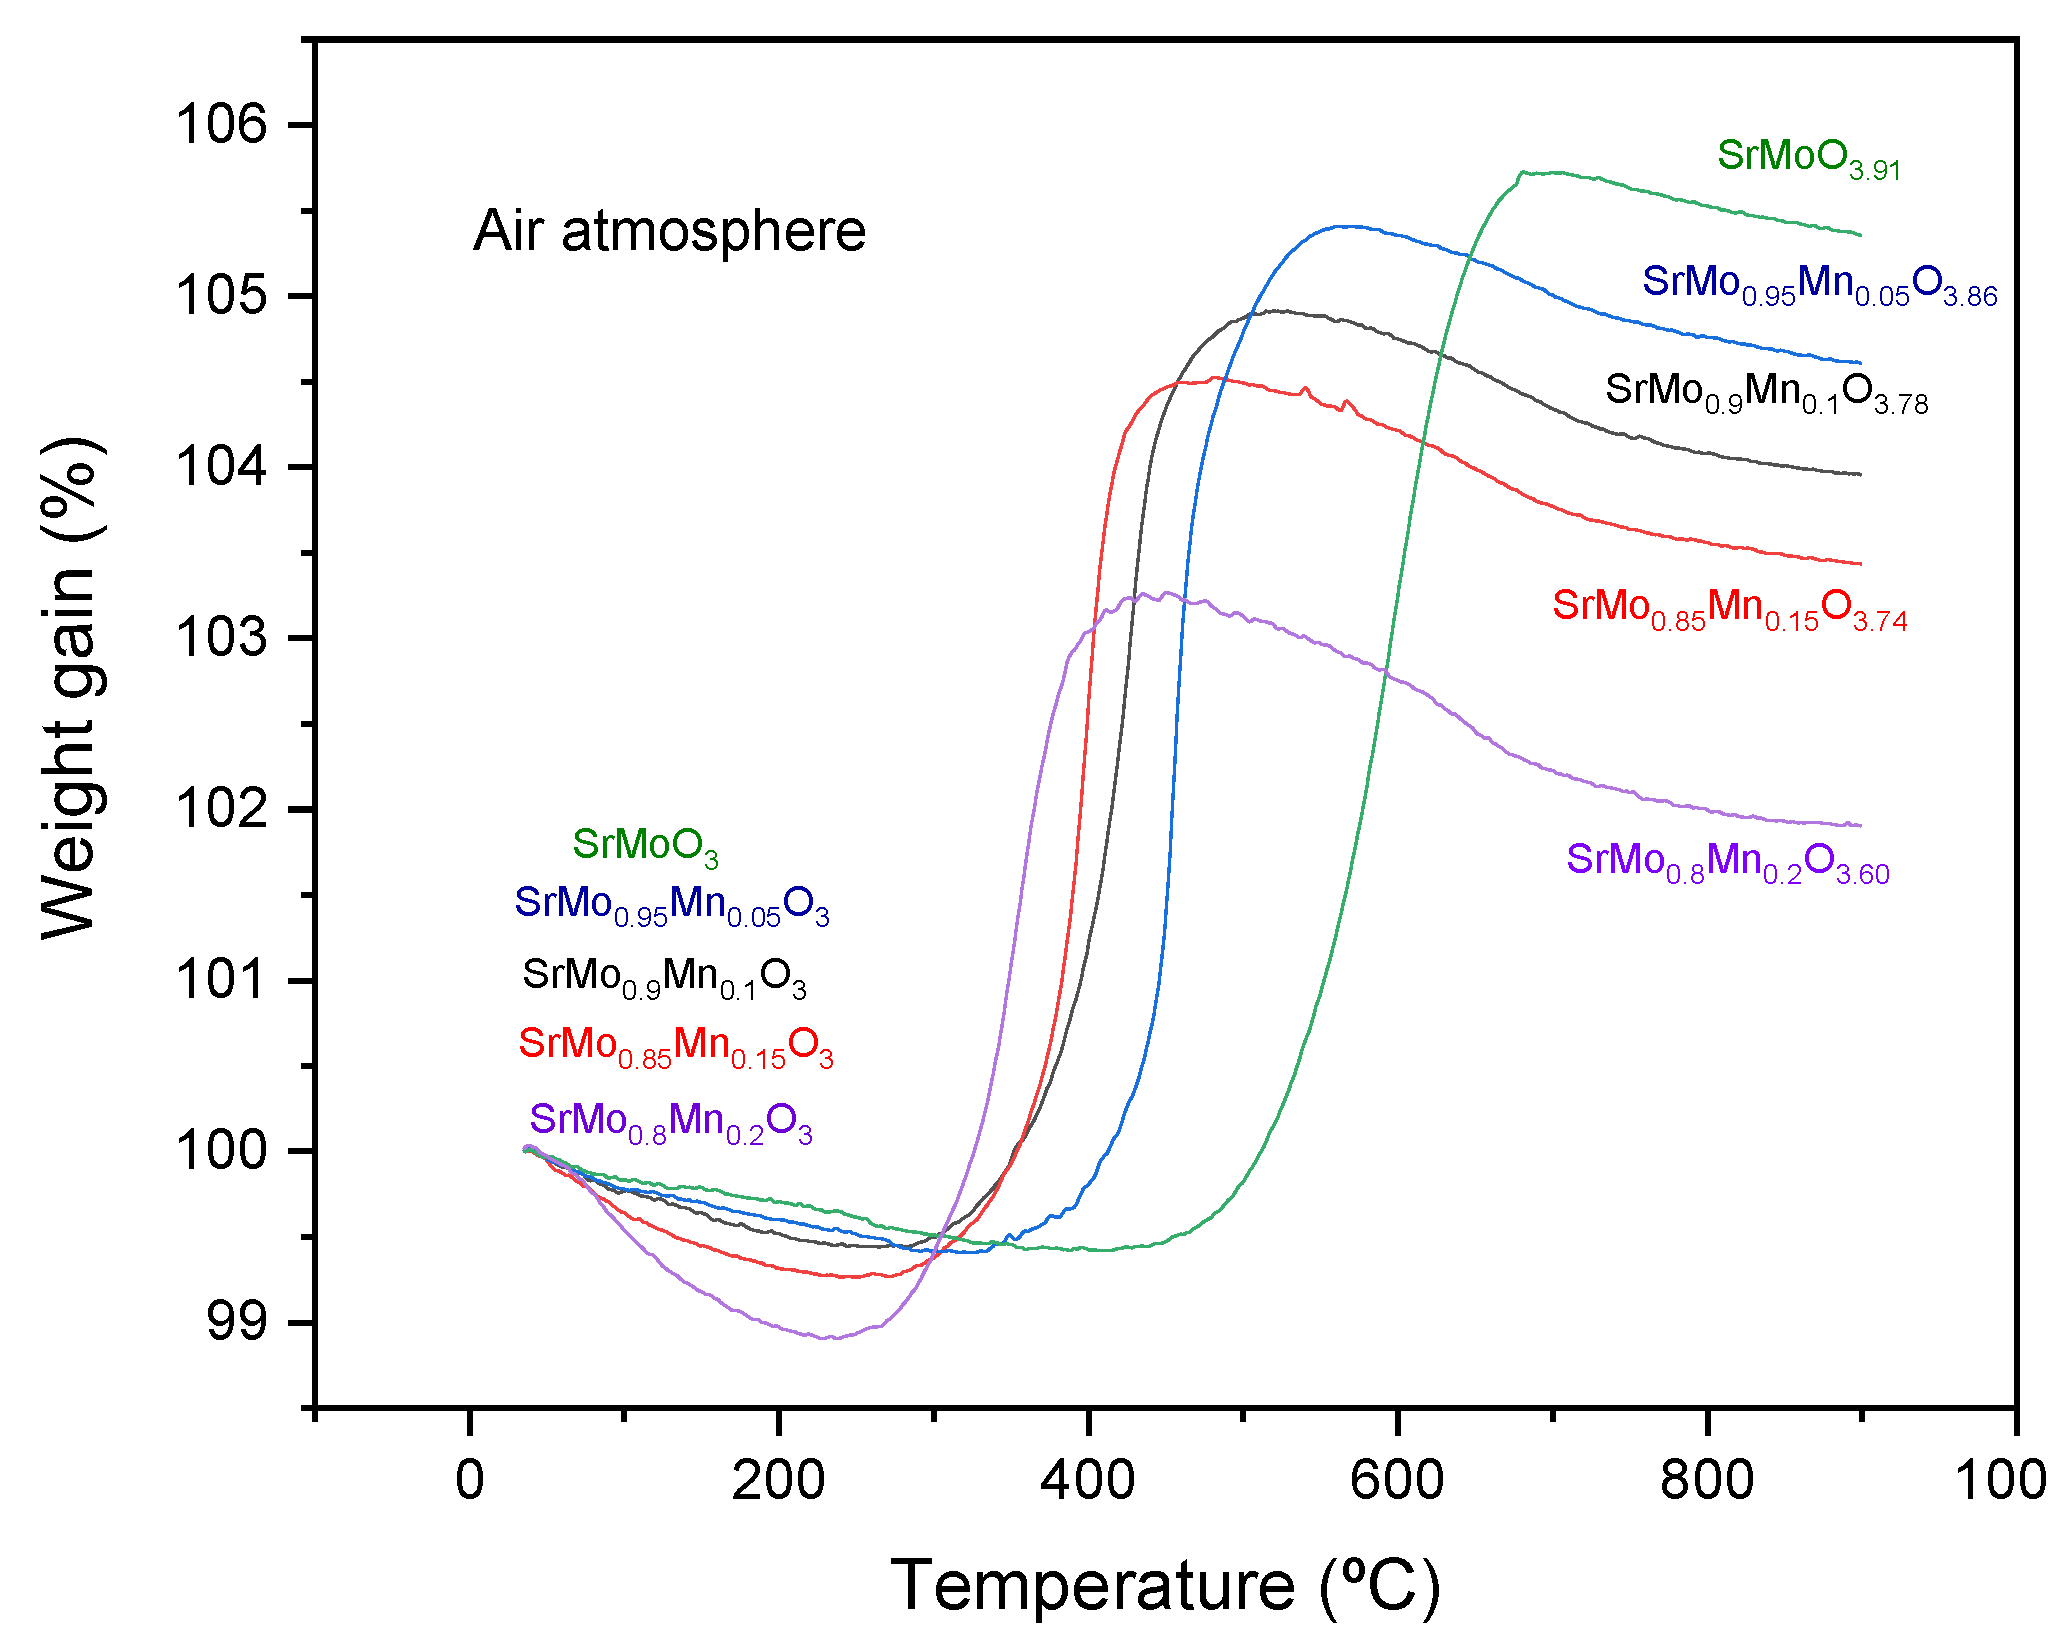
Figure 8.
Cell voltage (on the left axis) and power density (on the right axis) as a function of current density for SrMo0.9Mn0.1O3-δ and SrMo0.8Mn0.2O3-δ anodes in a single cell featuring the anode/LDC/LSGM/SCFO configuration, measured in pure H2 at 850 °C.
Figure 8.
Cell voltage (on the left axis) and power density (on the right axis) as a function of current density for SrMo0.9Mn0.1O3-δ and SrMo0.8Mn0.2O3-δ anodes in a single cell featuring the anode/LDC/LSGM/SCFO configuration, measured in pure H2 at 850 °C.
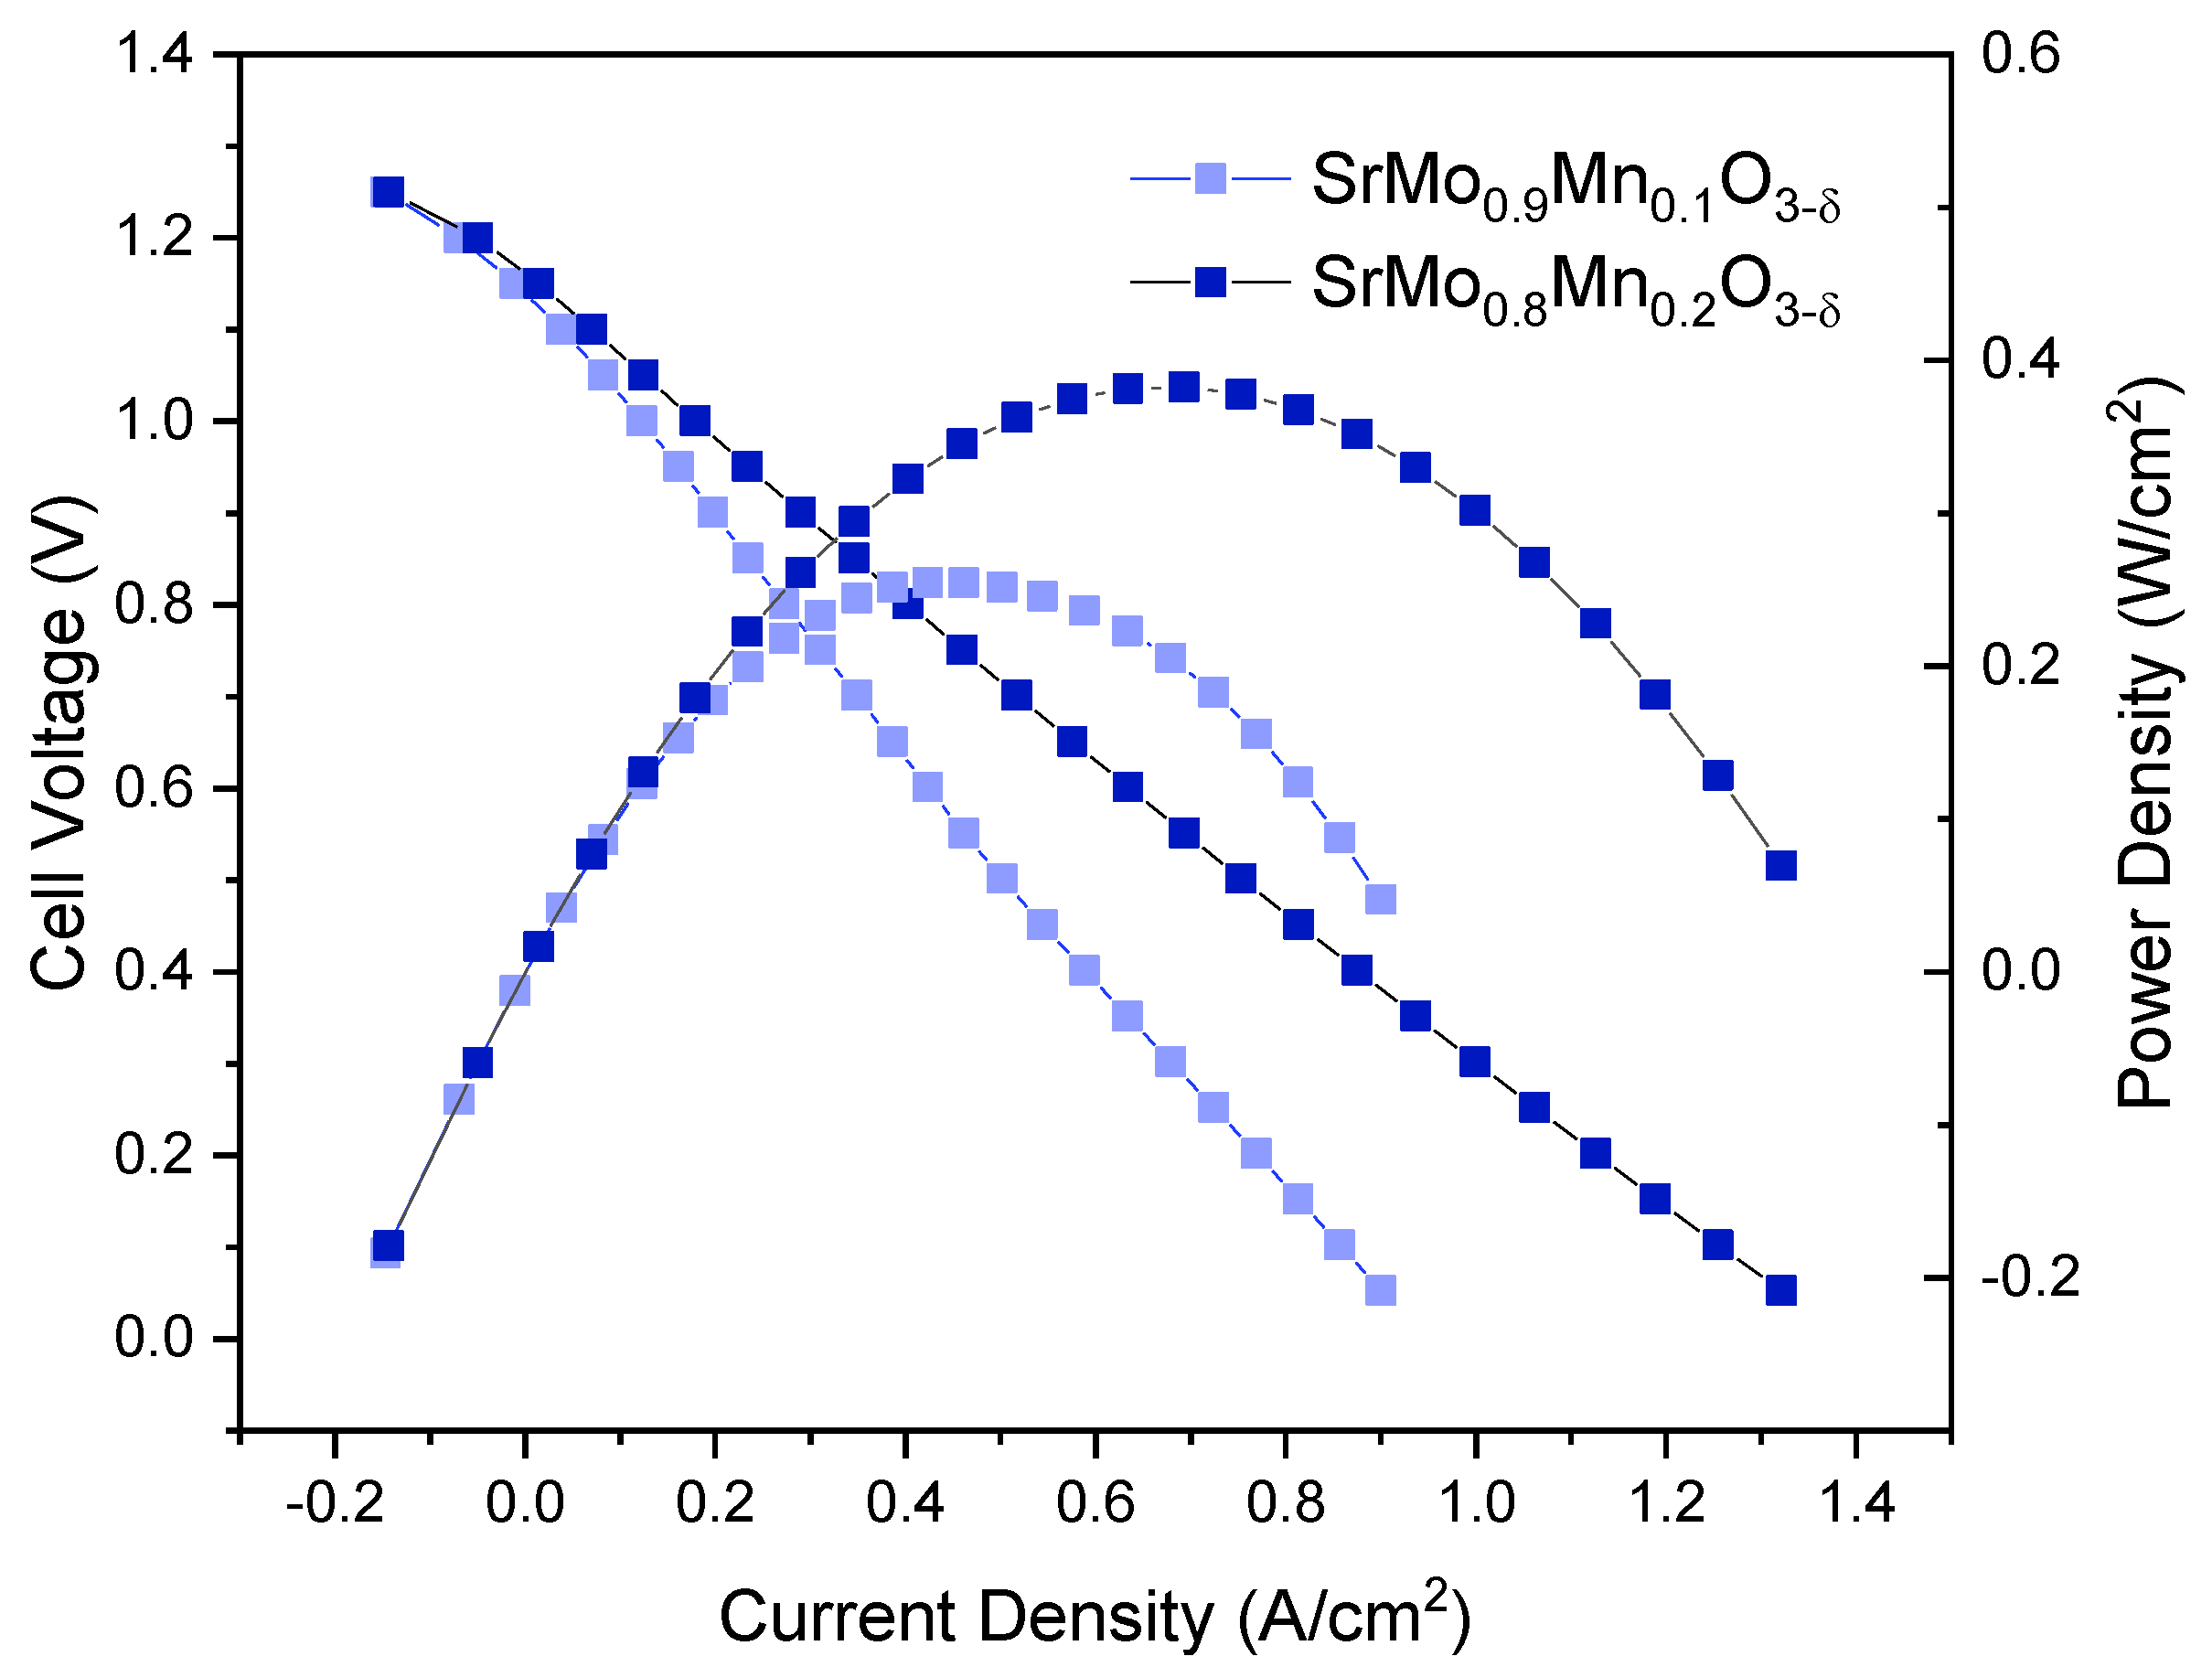
Figure 9.
Rietveld-refined X-ray diffraction (XRD) difractograms obtained for mixtures of SrMo0.9Mn0.1O3-δ and LSGM after a thermal treatment at 1050 °C in a H2(5%)/N2 atmosphere during 10 h. The analysis revealed no reaction products between the phases, since the diffraction peaks correspond solely to the original reactants. The diffraction patterns showed two distinct sets of Bragg peaks corresponding to the anode (SrMo0.9Mn0.1O3-δ) and LSGM phases, with no evidence of any novel phase. The unit-cell parameters of both phases remained unchanged.
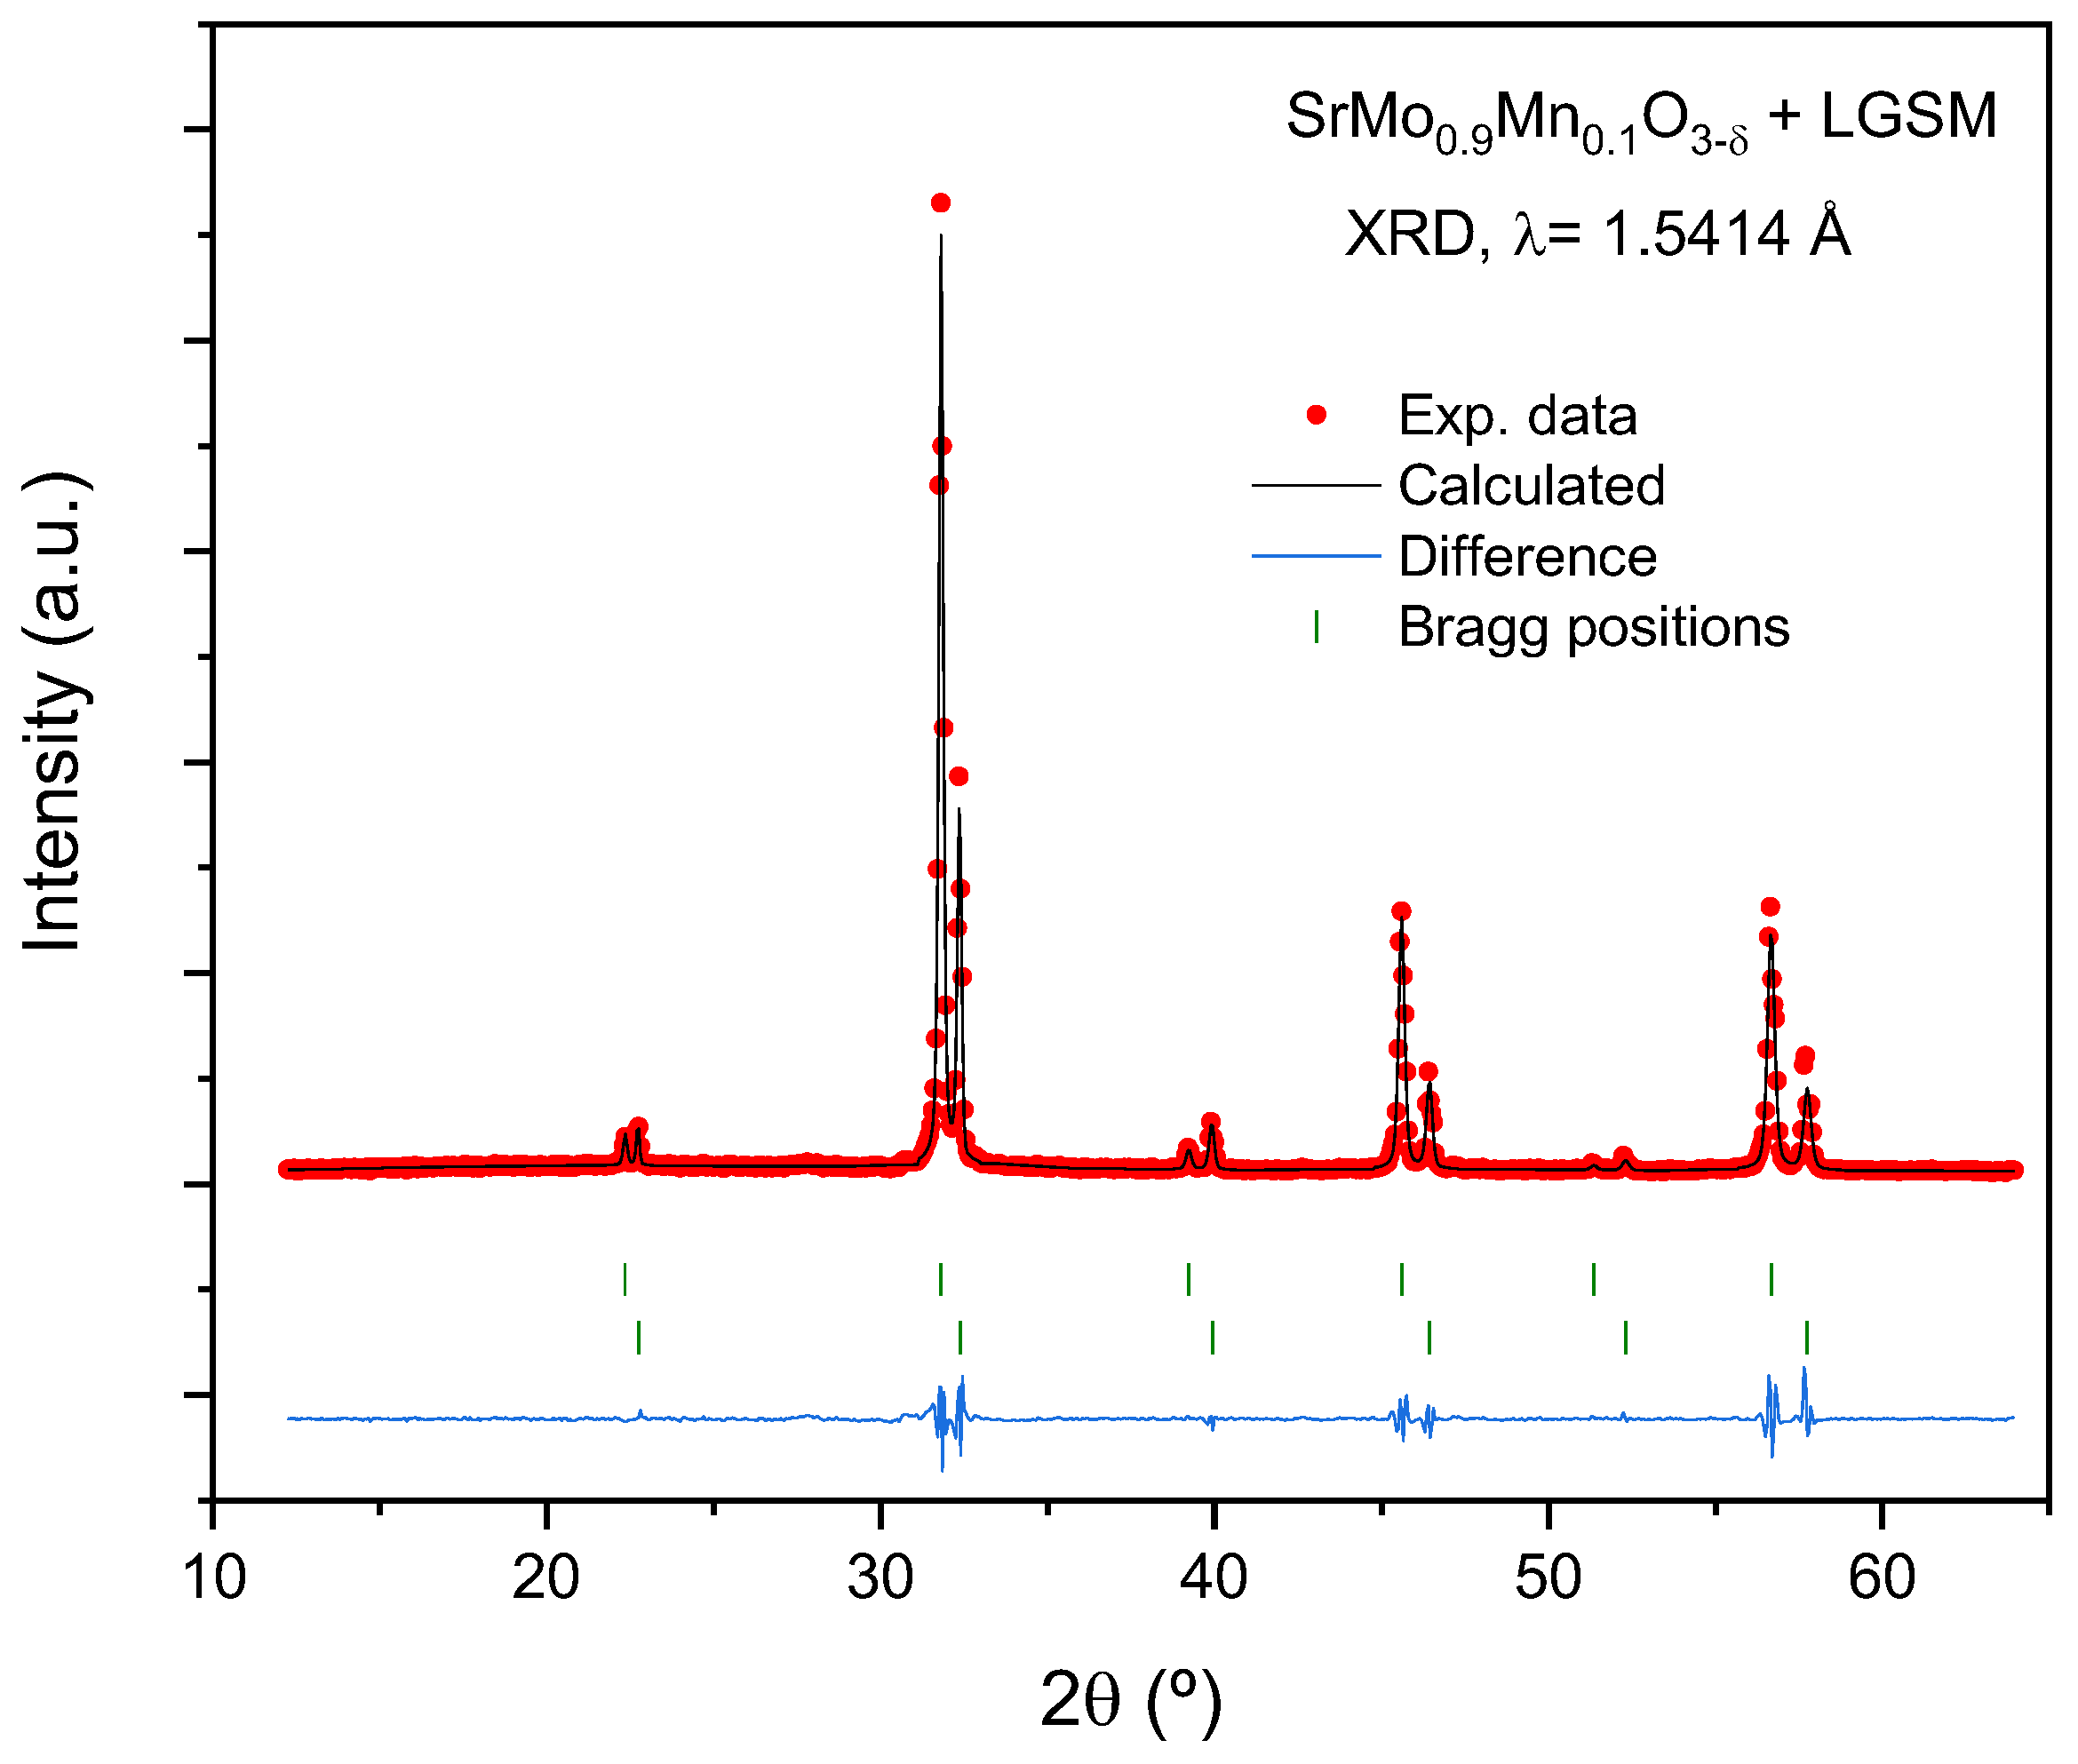
Figure 10.
(a) Temperature-dependence magnetic susceptibility χ(T) at FC protocol for the SrMo1-xMnxO4 and SrMo1-xMnxO3 (x = 0.1 and 0.2) samples under an external magnetic field of 100 Oe. Insert shows the χ-1(T) curves zoom and their fitting (black line) by the modified Curie-Weiss law χ(T) = χ0 + C/(T–Θ) for the SrMo1-xMnxO3 (x = 0.1 and 0.2) samples. (b) Isotherms M(H) curves recorded at 1.8 K for both samples, respectively.
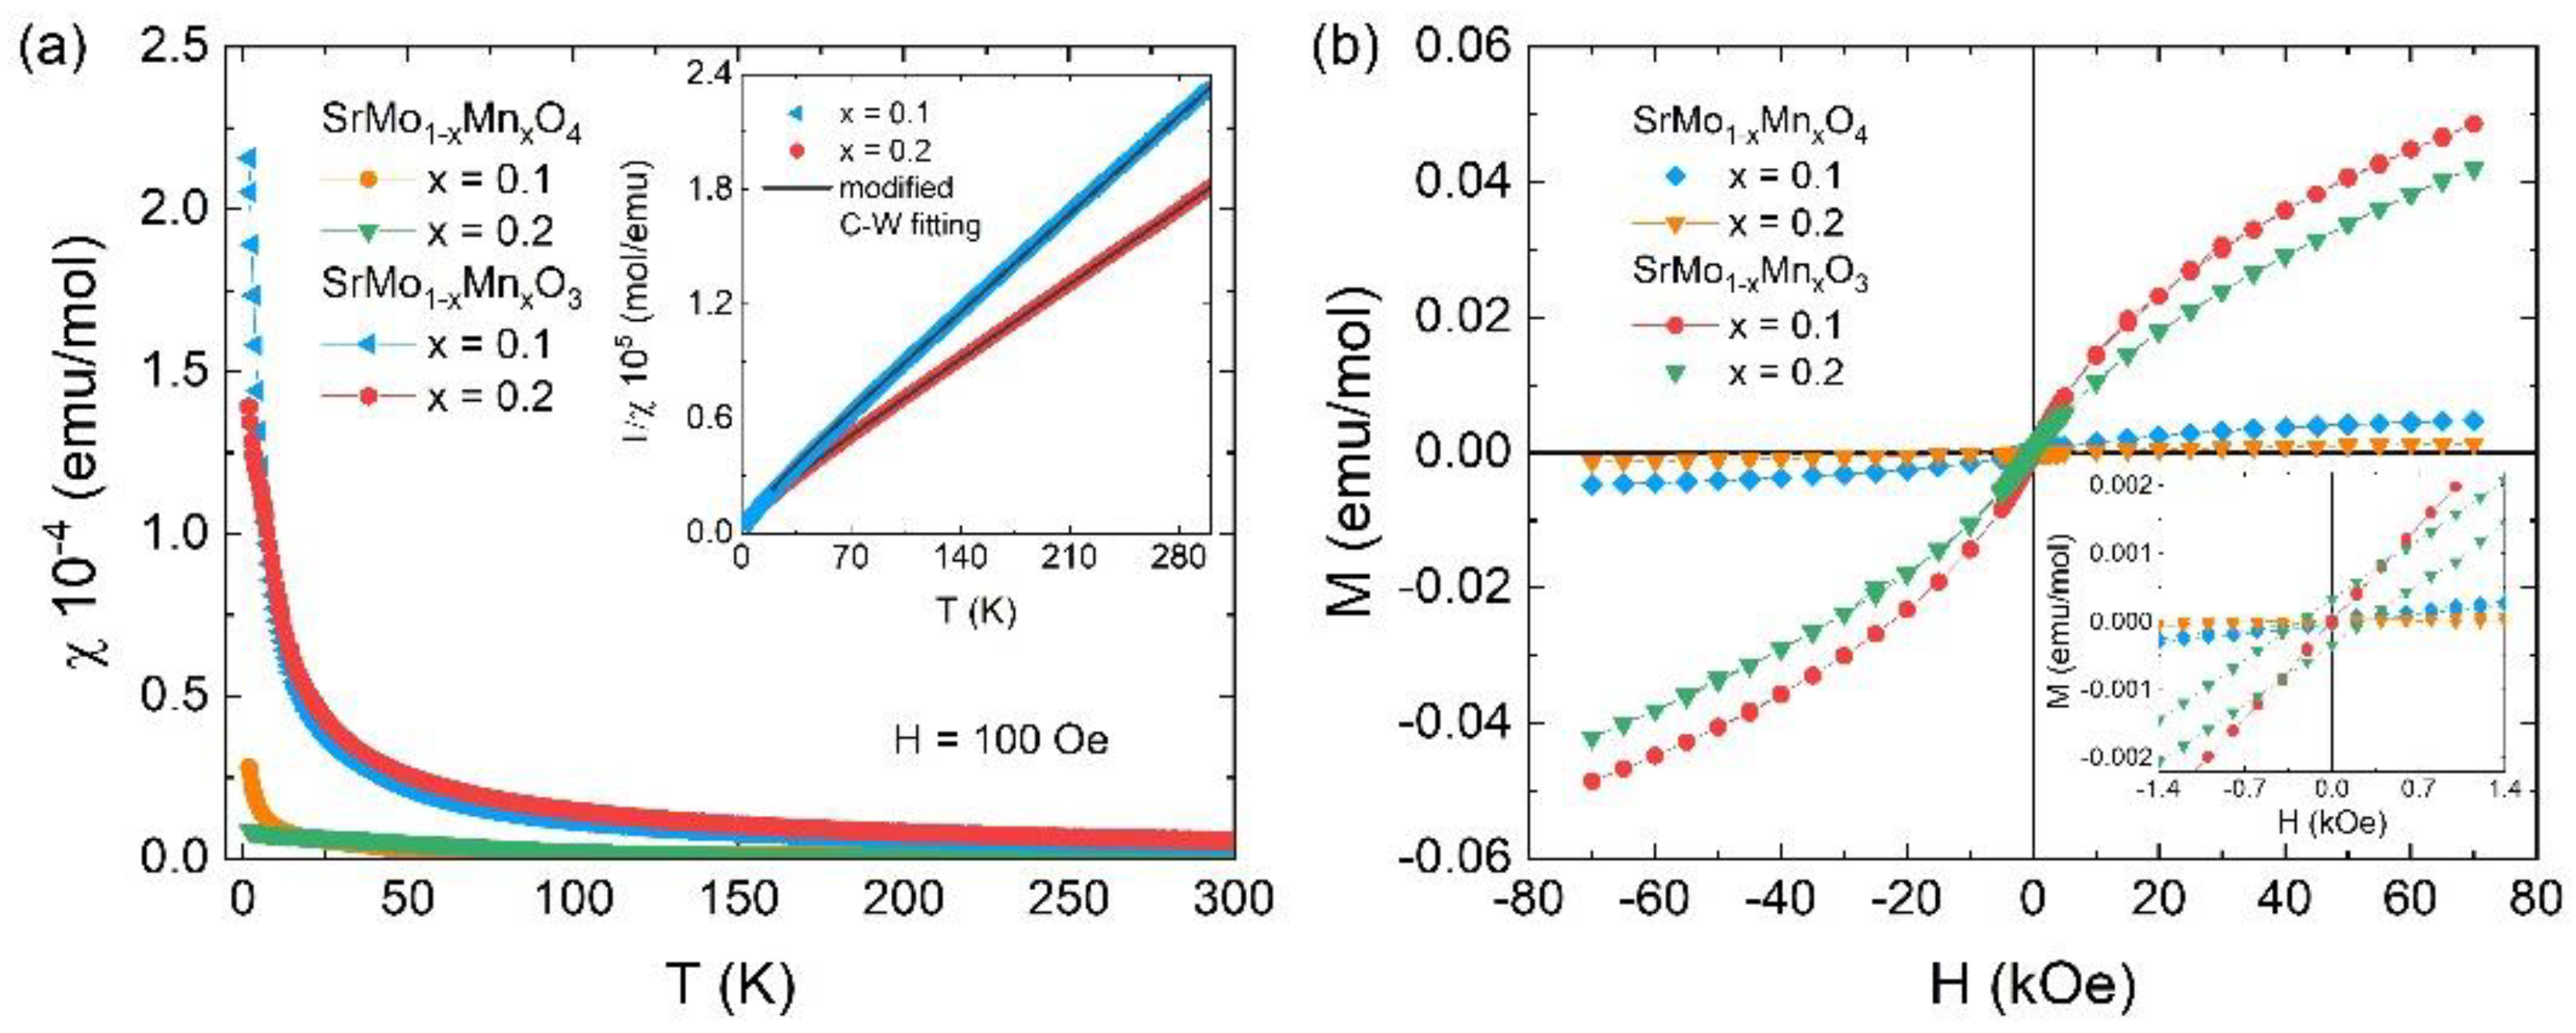
Figure 11.
SEM images of the SrMo0.9Mn0.1O3-δ test cell after testing, where the anode and cathode layers is well-defined and securely attached, with noticeable porosity that is crucial for the cell’s function. It can be distinguished the cathode layer and electrolyte, as well as the anode and the buffer layer.
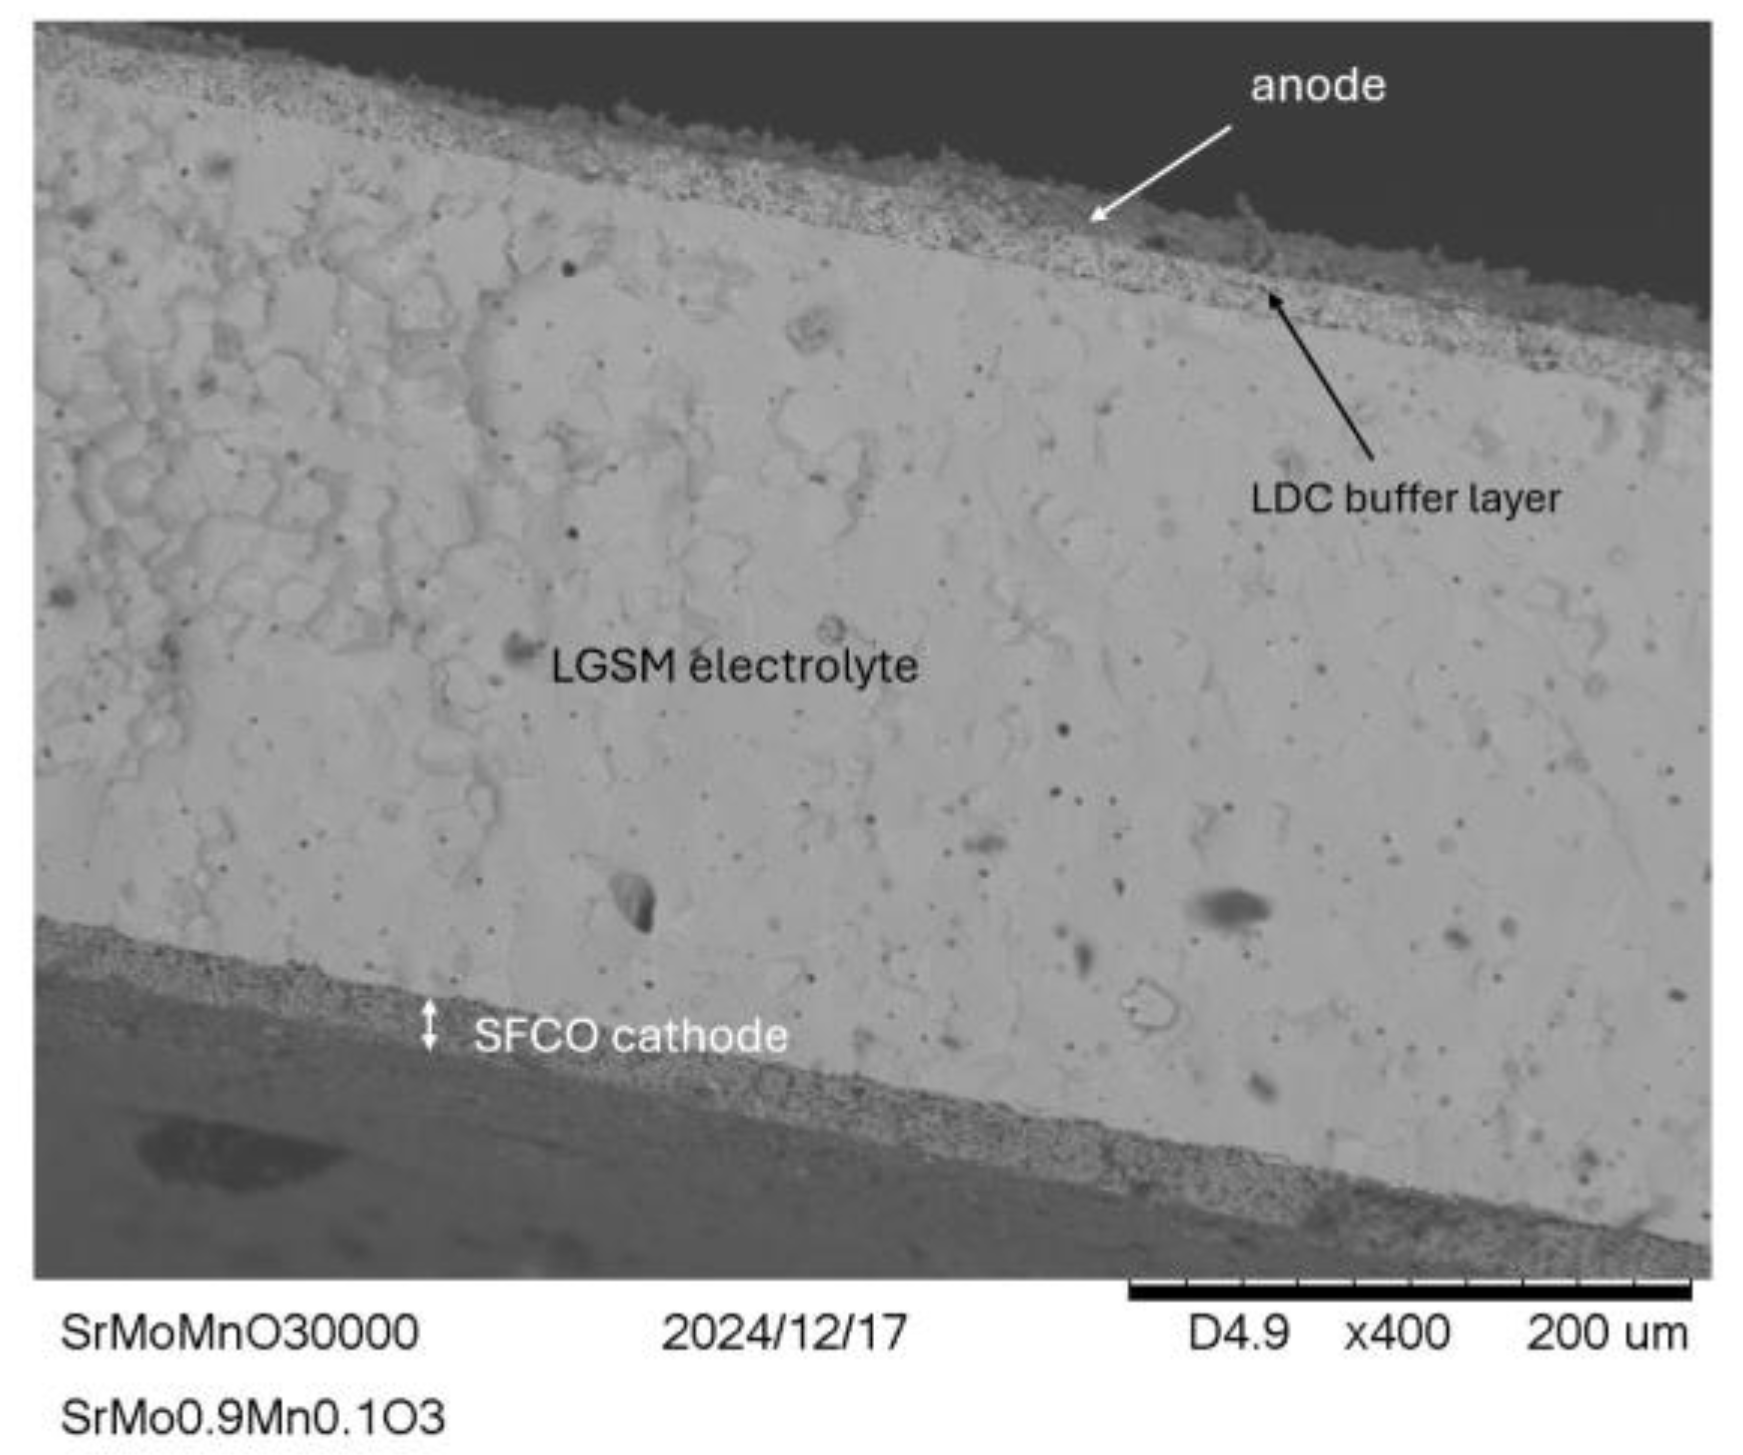

Table 1.
Unit-cell, atomic coordinates and displacement parameters for SrMo0.9Mn0.1O3−δ refined in the cubic Pm-3m (no. 221) space group from NPD at RT.
Table 1.
Unit-cell, atomic coordinates and displacement parameters for SrMo0.9Mn0.1O3−δ refined in the cubic Pm-3m (no. 221) space group from NPD at RT.
| x | y | z | Uiso*/Ueq (Å2) | Occ. (<1) | |
| Sr | 0.50000 | 0.50000 | 0.50000 | 0.0129(10)* | |
| Mo | 0.00000 | 0.00000 | 0.00000 | 0.0075(11)* | 0.907(5) |
| Mn | 0.00000 | 0.00000 | 0.00000 | 0.0075(11)* | 0.093(5) |
| O | 0.50000 | 0.00000 | 0.00000 | 0.0180(13) | 1.003(6) |
| Atomic displacement parameters (Å2) | |||||
| U11 | U22 | U33 | U12 | U13 | |
| O | 0.0077 (15) | 0.0232 (11) | 0.0232 (11) | 0.00000 | 0.00000 |
Disclaimer/Publisher’s Note: The statements, opinions and data contained in all publications are solely those of the individual author(s) and contributor(s) and not of MDPI and/or the editor(s). MDPI and/or the editor(s) disclaim responsibility for any injury to people or property resulting from any ideas, methods, instructions or products referred to in the content. |
© 2024 by the authors. Licensee MDPI, Basel, Switzerland. This article is an open access article distributed under the terms and conditions of the Creative Commons Attribution (CC BY) license (http://creativecommons.org/licenses/by/4.0/).
Copyright: This open access article is published under a Creative Commons CC BY 4.0 license, which permit the free download, distribution, and reuse, provided that the author and preprint are cited in any reuse.


