Submitted:
09 December 2024
Posted:
10 December 2024
You are already at the latest version
Abstract
This work explores the synthesis, structural characterization and properties measurements of La₁₋ₓSrₓGa₁₋ᵧMgᵧO₃₋δ (0.1 ≤x, y ≤ 0.3) compounds obtained with the aid of the wet chemical synthesis route (Pechini Method) and which were calcined for 10 hours at 1300 °C. La0.9Sr0.1Ga0.8Mg0.2O3-δ was successfully prepared as a single phase compound while La₀.₈Sr₀.₂Ga₀.₈Mg₀.₂O₃₋δ, La₀.₉Sr₀.₁Ga₀.₉Mg₀.₁O₃₋δ, and La₀.₉Sr₀.₁Ga₀.₇Mg₀.₃O₃₋δ exhibited high perovskite phase purity as secondary phases (SrLaGa₃O₇, SrLaGaO₄) were found to be less than 10%. However, La₀.₇Sr₀.₃Ga₀.₈Mg₀.₂O₃₋δ was obtained with significantly low perovskite content (57%) implying that the applied doping content lies outside the single-phase region for the La₂O₃ - Ga₂O₃ - SrO - MgO phase diagram. Rietveld refinement in combination with X-ray diffraction (XRD) analysis established the predominance of cubic structure (Pm3m) of La₁₋ₓSrₓGa₁₋ᵧMgᵧO₃₋δ compounds when doping with Sr2+ and Mg2+. An exception was the La0.9Sr0.1Ga0.8Mg0.2O3-δ that crystallizes in a combination of monoclinic (I12/A1, 80%) and cubic (Pm3m, 20%) perovskite phases. All compounds obtained crystallites at the nano scale (<100 nm) and open lattice pathways for ionic conduction. SEM analysis identified polygonal and spherical grains in Sr and Mg-substituted compounds, respectively while Mg-doped samples exhibited improved sintering and homogeneity. A 23 % increase in thermal expansion coefficient was observed when Mg doping increased from 0.1 to 0.2. However, Sr substitution decreased thermal expansion coefficients by 13 %. Increase Sr and Mg doping levels enhances the conductivity of the compounds (e.g. 0.12 S/cm at 800oC for La₀.₈Sr₀.₂Ga₀.₈Mg₀.₂O₃₋δ), yet the presence of secondary phases and crystal lattice distortion affects conductivity. Nevertheless, the presence of impurities and crystal lattice distortion can negatively affect ion conduction.
Keywords:
Perovskites
; LSGM
; Oxygen ion electrolytes
; Solid oxide fuel cells
; SOFCs
; Structural determination
; Rietveld analysis
; Conductivity
; Thermal expansion
1. Introduction
A commonly recognized technology for converting the chemical energy of fuels directly into electrical energy is the fuel cell [1,2,3,4]. When the electrolyte in such a cell is a ceramic material capable of allowing oxygen ions to pass through, it is classified as a solid oxide fuel cell (SOFC) [5,6,7,8,9].
SOFCs have frequently been cited to offer notable advantages such as the exclusion of noble metals from their designs and compatibility with various fuel types [8,10,11]. However, challenges for these devices arise due to their high operating temperature. This heating up may occasionally cause chemical reactions between the various components of the cells [6,12,13], leading to their degradation [14,15,16]. Indeed, the high Temperature operating requirements for SOFCs along with the use of conventional yttria-stabilized zirconia (YSZ) electrolytes contribute to issues concerning the creation of metastable phases, sealing difficulties, and thermal and chemical mismatch with electrode materials [17,18], and therefore continue to be an impediment to the further development of this technology.
Reducing the operating temperature is one of the main strategies to minimize the problems associated with SOFCs, leading to the development of medium- [19,20] and low-temperature variants [21,22]. This has led to research into novel electrolytes [23,24,25] and the incorporation of nanostructured materials [26]. Nanotechnology enhances energy devices with benefits such as durability, sustainability, long life, and low cost [27]. Among alternative electrolytes, ABO3-type perovskites, particularly Sr, Mg-doped LaGaO3 with high oxide ionic conductivity (first identified by Ishihara et al. in 1994 [28] and applied by Feng and Goodenough in 1996 [29]), show great promise for low- and intermediate-temperature SOFCs [30,31,32].
Lanthanum gallate doped with strontium and magnesium, La1-xSrxGa1-yMgyO3-δ (otherwise known as LSGM) is one of the extensively explored solid electrolytes that could provide feasible applications in SOFCs due to its high oxygen-ion conductivity in the medium temperature range of 600 to 800°C [33,34,35]. Recently, new developments have raised the bar for LSGM research, especially in the design of symmetrical solid oxide fuel cells (S-SOFCs), which use LSGM as a supporting layer [35,36,37]. A distinctive feature of S-SOFCs is their symmetrical electrodes, with power outputs averaging around 0.5 W cm−2 at 800°C [18,35,38]. However, the performance of these systems is largely constrained by the resistance of the supporting LSGM electrolyte and its compatibility with the other electrodes. Improving the properties of LSGM such as the oxygen-ion conductivity and thermal expansion characteristics is therefore critical to improving the efficiency of S-SOFCs.
Enhancing the electrical and thermal properties of LSGM (La₁₋ₓSrₓGa₁₋ᵧMgᵧO₃₋δ) electrolytes is achieved through various approaches, including adjustments to synthesis procedures [39,40,41,42,43], doping with isovalent and heterovalent cations [44,45], introducing cation deficiencies [46,47], applying sintering aids [48,49], and creating composite materials [50]. The crystal structure, which is crucial in determining the material's ionic conductivity and overall performance, is directly impacted by the aforementioned modifications. Therefore, it is essential to comprehend and precisely describe the crystal structure of LSGM compounds in order to optimize their properties.
At ambient temperature, LaGaO₃ has an orthorhombic (Pnma space group) structure [51]; however, doping with Sr and Mg drastically changes its symmetry [52]. For example, substituting La³⁺ with Sr²⁺ increases the tolerance factor t, while substituting Ga³⁺ with Mg²⁺ decreases t [review]. Notably, La₀.₈Sr₀.₂Ga₀.₈Mg₀.₂O₃₋δ, with t factor equal to 1, adopts an ideal cubic structure (Pm-3m space group), whereas variations in dopant concentrations lead to orthorhombic (Imma space group) or monoclinic (I2/a space group) phases. Additional changes are revealed by high-temperature investigations, such as the shifting of LaGaO₃ to a rhombohedral (R-3c space group) structure and the transition of doped compositions to cubic symmetry, which improves ionic transport [53,54].
The aforementioned highlight the great importance of crystal structure analysis in optimizing the performance of SOFCs electrolyte materials. XRD Rietveld refinement is such an analysis technique that enables precise determination of phase composition, symmetry, and unit cell parameters, providing a comprehensive understanding of how synthesis conditions influence crystal structures and, consequently, material properties [55,56,57,58]. According to the literature [43,59,60], samples sintered below 1400°C frequently contain impurity phases such LaSrGaO₇ and/or SrLaGaO₄, demonstrating that sintering temperature has an impact on phase purity. XRD Rietveld analysis helps to define the single-phase region of LSGM compounds depending the synthesis conditions and leads to the development of solid electrolytes with the required structural characteristics for optimal performance.
In this study, XRD Rietveld Analysis serves as indispensable tool in advancing the development of La₁₋ₓSrₓGa₁₋ᵧMgᵧO₃₋δ (0.1≤x,y≤0.3) electrolytes by correlating synthesis conditions, structural characteristics and functional properties (thermal expansion and conductivity). This detailed structural insight is essential for tailoring materials to meet the demands of high-performance energy applications, such as solid oxide fuel cells.
2. Materials and Methods
2.1. Synthesis procedure
Within this investigation, five different La1-xSrxGa1-yMgyO3-δ (LSGM) compounds were prepared through wet chemical synthesis (Pechini Method) [42,60] to examine how the metal cation (Me) substitution at La-site by Sr (0.1≤x≤0.3) and at Ga-site by Mg (0.1≤y≤0.3) influences the properties of the compounds formed. As cation sources, La2O3 (99.99%, CAS No 1312-81-8), SrCO3 (99.9+%, CAS No 1633-05-2), Ga2O3 (99.99+%, CAS No 12024-21-4) and Mg(NO3)2 (3M, CAS No 10377-60-3) were used. More specifically, the source of Ga was obtained by dissolution of Ga2O3 in HNO3 (65%, CAS No 7697-37-2) and deionized H2O (with a ratio of HNO3:H2O = 1:1) while the source of Mg was obtained after dissolving the original solution to a 0.3M concentration.
Initially, citric acid monohydrate (CA, CAS No 5949-29-1) was dissolved in a beaker (1 L) with the required amount of deionized water (H2O) at 65 °C. The appropriate quantities of the cation reagents were then added. The solution was stirred with a magnetic stirrer while maintaining the temperature at 65 °C for 1 h to form stable Me-CA complexes. Then, the appropriate amount of ethylene glycol (EG) was added and the temperature of the solution was adjusted at 80 °C for 30 min to obtain a clear solution. By the addition of EG, the polyesterification reaction of the polyhydroxyl alcohol with the citrate complexes was initiated. The molar ratios of citric acid to metal cations (CA/Me) and ethylene glycol to citric acid (EG/CA) were adjusted at 2 and 3, respectively. These specific values ensure the complete esterification of the citrate ions according to precious studies [42,56,61].
The aforementioned solution was then placed in a microwave oven (600 W) for about 30 min in order to evaporate the excess solvent and accelerate the polyesterification reaction. At the end of the polyesterification reaction, a polymer resin was obtained in the form of a solid material with a different morphology (Figure 1) depending on the percentage of cation substitution (x and y).
The polymer resins of all formulations were placed in a furnace at 150 - 200 °C for at least 24 h to dry and pick up the precursors. Subsequently, the precursors were milled on a mechanical agate to obtain powdered materials. The resulting samples were treated at temperatures of 600, 1000, 1200 and 1300°C to obtain the intermediate and final products. Figure 2 depicts the flowchart of the LSGM synthesis procedure.
The chemical reagents’ quantities used for the preparation of the LSGM compounds are summarized in Table 1. The proportions of the reactant components employed in the five compounds were determined by the stoichiometry of the final products. The samples were coded as follows:
where L: La, S: Sr, G: Ga, M: Mg, with x and y representing the substitution percentages (x10) at the La and Ga sites, respectively.
LSGM(1-x)x(1-y)y
2.2. Characterization Methods
Thermogravimetric Analysis (TGA) was employed to record the behavior of the precursor materials during their thermal treatment. This technique captures the decomposition reactions of the polymeric network, as well as any other reactions accompanied by mass changes. The TGA of the samples was performed using a Mettler Toledo 851 instrument. The analysis involved the thermal treatment of the samples from 20 to 1200 °C, at a heating rate of 10 °C/min, under an air atmosphere with a flow rate of 50 l/min.
The X-ray Diffraction (XRD) measurements were performed using a Siemens D5000 instrument equipped with a CuKα1 tube (λ = 1.5405 Å) and a graphite monochromator. The measurement conditions were as follows: continuous scan over a 2θ angular range of 10–100°, with a scan step size of 0.045°/s and a step time of 1 s. In order to study the role of the Sr (x) and Mg (y) substitution contents of LSGM compounds in the presence of secondary phases in the final products (calcination at 1300 °C for 10 h), an estimation of the relative amounts of SrLaGa3O7 and SrLaGaO4 compounds was made, by measuring the ratio As/Ap+As, where As is the sum of the intensities of the main peak of all secondary phases and Ap is the intensity of the main perovskite peak [42].
For the analysis of the crystal structure using the Rietveld method, highly precise diffraction patterns were required. The conditions for acquiring these diffraction patterns were: step scan mode, scan step size = 0.020°/s, step time = 10 s. The data were analyzed by the Rietveld method using the FULLPROF program [55,56]. The bond distances and angles were calculated using the BondSTR program of the Fullprof Suite. The perovskite structure was visualized with the help of an appropriate software using Rietveld refined crystallographic parameters.
The precursor, intermediate, and final products were studied using Fourier Transform Infrared Spectroscopy (FTIR) on a Perkin Elmer 880 instrument. The spectra were obtained in the range of 370 to 4000 cm⁻¹ using the KBr pellet technique, where a mixture of KBr and the sample (sample ratio of approximately 1:200) was pressed into pellets under 13 tons/cm². For certain samples, primarily intermediate or precursor materials, measurements were conducted using the ATR accessory, where the samples were analyzed in powder form in the range of 600 to 4000 cm⁻¹.
The morphology of selected samples was studied using Scanning Electron Microscopy (SEM) on a JEOL 6380LV microscope, equipped with an Energy Dispersive X-ray Spectrometer (EDS). Sample preparation involved coating with graphite.
2.3. Thermal Expansion Coefficient Measurements (TEC)
The measurement of the thermal expansion coefficient was conducted using the horizontal dilatometer, BAHR DIL801L. Samples were subjected to a controlled heating process from 20°C to 1000°C, with a heating rate of 20°C/min in an air atmosphere. The dilatometer recorded the changes in the length of the samples as a function of temperature.
From the recorded data, ΔL/L versus temperature graphs were generated. The average coefficient of thermal expansion (α) between two temperatures was calculated using the equation 1:
where L is the initial length of the sample at the starting temperature, ΔL is the change in length between the two measured temperatures, and Δt is the temperature difference.
2.4. DC four-point Measurements
For the measurement of the total conductivity, the DC four-point method was employed at temperatures ranging from 25 to 800°C in an air atmosphere. Four platinum electrodes were used on the sample: two at the ends and two towards the center. The sample was then placed in a horizontal tube furnace with controlled temperature. The voltage (V) across the two inner electrodes and the current (I) were recorded while varying the applied voltage across the two outer electrodes. LSGM compounds are predominantly oxide ion conductors with minimal electronic contribution obtaining transference numbers very close to 1 [62,63]. Therefore, it was assumed that the results of total conductivity through DC four-point measurements represent the ion conductivity of the compounds following equation 2:
where σion is the ion conductivity (mS/cm), tion is the transference number of the LSGM ion conductor equal to 1 and σtotal is total conductivity (mS/cm)
For TEC and conductivity measurements, high-density samples are required. Therefore, powdered precursor samples were formed into discs with a diameter of 2.9 cm using a Graseby Specac 25011 press under vacuum at a pressure of 210 MPa. Subsequently, the discs formed underwent sintering in an air atmosphere at a temperature of 1450°C for 20 hours. The heating rate was set to 2°C/min. After sintering, the samples were cut into rectangular prisms for the measurements of electrical conductivity and thermal expansion coefficient.
3. Results and Discussion
3.1. Thermogravimetric Analysis (TGA)
TGA was used to record the decomposition reactions of the polymer network, as well as any other reactions accompanied by mass change in the LSGM compounds. In Figure 3, the DTG curves of the LSGM precursor materials with varying stoichiometry (0.1 ≤ x ≤ 0.3 and 0.1 ≤ y ≤ 0.3) are presented.
The first weight loss is observed up to around 190°C, attributed to the removal of physically absorbed moisture by the precursor materials after drying. The most significant weight loss occurs between 200°C and 560°C. This weight loss is attributed to the decomposition of the polymeric network, the further decomposition of the organic material and the combustion of residual carbon. Between 560°C and 690°C, a small weight loss is observed, which may be related to the combustion of organic matter and the decomposition of intermediate products (oxocarbonates) resulting from the polymer network degradation. This finding is confirmed by the XRD patterns of the LSGM compounds at intermediate temperatures. The total weight loss and ceramic residue for each sample are presented in Table 2.
For the materials LSGM9191 and LSGM9173, a shift in the polymer decomposition phenomenon to lower temperatures was observed. Specifically, the first stage occurs between 180°C and 290°C. This can be attributed to the lower drying temperature (150°C) used for these materials, indicating the decomposition of ester groups that were not removed during the drying process which was also confirmed by the infrared spectra. The total weight loss for materials with varying y value did not exhibit any major differences (Table 2).
For the series of precursor materials with varying stoichiometry in La site (0.1 ≤ x ≤ 0.3) and constant stoichiometry at Ga site (y = 0.2), significant differences in weight loss were observed (68.9%, 74.0%, and 77.2% for x = 0.1, 0.2, and 0.3, respectively). This might be a result of the different concentrations of reagents introduced in the primary solutions such as SrCO₃. In fact, high Sr (x) incorporation levels led to the release of higher carbonate amounts during the calcination of the precursors. Another factor affecting weight loss concerns the degree of oxygen removal from the perovskite lattice during a thermal treatment to form the final LSGM products. It seems that the variation of Sr content caused different oxygen stoichiometry in the crystal lattice of the perovskites by removing higher oxygen amounts. Accordingly, lower ceramic yields were found for Sr addition to the LSGM structure with respect to Mg substitution in La site.
3.2. XRD Analysis
XRD Analysis was applied to explore the mineralogical content of LSGM precursors, intermediate and final products. Figure 4 shows the calcination products of LSGM9182 at various temperatures (150-1300oC). Similar diagrams were obtained for the whole series of LSGM compounds and are presented in Figures s.4.1, s.4.2, s.4.3 and s.4.4. Table 3 lists the identified phases for all the prepared compounds. To study the role of Sr (x) and Mg (y) content on the presence of secondary phases in the final LSGM products (sintered at 1300 °C for 10h), an estimation of the relative amounts of SrLaGa₃O₇ and SrLaGaO₄ phases was made by measuring the ratio Aₛ / (Aₚ + Aₛ) (Table 3). Furthermore, Figure 5 presents the XRD patterns of LSGM final products at 1300oC.
All precursors were amorphous indicating that no crystalline phases were precipitated from the starting solutions. At 600 °C, all materials were amorphous with a broad peak around 30°, indicating the formation of La2O2CO3 [42,56,62,64], consistent with FTIR results showing CO32- group absorption. At 1000°C, carbonates disappear, and perovskite phase emerges, however, accompanied by secondary phases such as SrLaGa3O7, SrLaGaO4, La4Ga2O9. At 1200 °C, the perovskite formation is enhanced since La4Ga2O9 breaks down, but SrLaGa3O7 and SrLaGaO4 still remain even in lower contents. At this temperature, LSGM9182 shows only traces of SrLaGaO4 as a secondary phase. At 1300°C, LSGM9182 became a single-phase material revealing its successful production, while LSGM9191 (containing 6.7% SrLaGa₃O₇) and LSGM8282 (containing 4.6% SrLaGa₃O₇) exhibited minimal secondary phase content. In contrast, LSGM9173 (with 9.7% SrLaGaO₄) and LSGM7382 (containing 42.9% SrLaGa₃O₇ and SrLaGaO₄) displayed higher amounts of secondary phases. It is important to highlight that the secondary phases formed in the materials are undesirable, as they usually exhibit poor ionic conductivity, thus degrading the overall properties of the final product [43].
As indicated by the results, substitution at the Ga site leads to materials with lower amounts of secondary phases, whereas substitution at the La site results in the formation of secondary phases in higher proportions. Only in the case of the composition with x=0.1 and y=0.2 can a single-phase material be produced. This suggests that the solubility limits of these metals in the quasi-quaternary system are quite narrow [59]. Specifically, it is concluded that the composition with x = 0.3 and y = 0.2 (LSGM7382) likely lies outside the single-phase region of the equilibrium diagram for the compounds La₁₋ₓSrₓGa₁₋ᵧMgᵧO₃+δ. As a result, it is inferred that the Sr doping level cannot exceed 20% for the "quaternary" oxide system La₂O₃ – SrO – Ga₂O₃ – MgO.
3.3. Crystal Structure Analysis using the Rietveld Method
LSGM compounds, in addition to their cubic structure, can also crystallize in distorted structures such as monoclinic, orthorhombic, or rhombohedral. The diffraction patterns of these structures do not differ significantly, making it challenging to determine the precise crystal system. For this reason, the diffraction patterns were analyzed for all possible structures, and the structure that provided the best agreement between the experimental and calculated diffraction patterns was selected. In some cases, a mixture of two crystalline structures yielded better agreement in the XRD Retvield analysis
In the samples where more than one crystalline phase was detected, these phases were included in the Rietveld analysis to estimate their proportions through quantitative analysis. Indicatively, Figure 6 presents the Rietveld analysis results for the LSGM9182 sample, showing the experimental, calculated, and difference diffraction patterns. The difference pattern indicates a satisfactory agreement between the experimental and calculated data that is reflected in the values of reliability factors (Table 4). Similar diagrams have been exported for all the other LSGM samples and are presented in Figures s.6.1, s.6.2 and s.6.3. It must be noted that, LSGM8273 sample was not included in the Rietveld analysis, as it was considered an unsuccessful synthesis due to its significantly high content of secondary phases.
Table 4 presents unit cell parameters, atomic positions and reliability factors after performing Rietveld analysis. Additionally, Table 5 shows selected bond lengths and angles between atoms, computed by Bondstr program included in Fullprof software package. The numbers in parentheses denote standard deviations for each exported value. The average crystallite size estimated using the Scherrer equation (DScherrer) is also included in Table 5.
In the LSGM9191 sample, the perovskite phase appeared to crystallize in the cubic system with a space group (SG) of Pm3m. A secondary phase, SrLaGa₃O₇, was also detected at 6.8%. In the LSGM9182 diffraction pattern, no secondary phases were detected. In this case, the best agreement between the experimental and calculated diffraction patterns was achieved by introducing two perovskite phases. The results indicated that the sample mainly consists of a monoclinic distorted phase (SG I12/A1) at 80%, and a cubic phase (SG: Pm3m) at 20%. For the LSGM9173 sample, the primary phase was the cubic perovskite structure (SG: Pm3m) at 90.2%, while a secondary phase, SrLaGaO₄, was detected at 9.8%. In the LSGM8282 sample, the primary phase was again the cubic perovskite structure (SG: Pm3m) at 95.7%, with a secondary SrLaGa₃O₇ phase at 4.3%.
The percentages of secondary phases calculated through Rietveld analysis for the LSGM9191, LSGM9182, LSGM9173, and LSGM8282 samples are in good agreement with the results obtained using the Aₛ / (Aₚ + Aₛ) ratio (deviation less than 7%). In conclusion, the Aₛ / (Aₚ + Aₛ) ratio can be reliably used to estimate the amount of interference from secondary phases, providing accurate results.
The crystal structure parameters obtained from the Rietveld analysis were used to visualize the unit cells using Diamond software. The unit cell of the LSGM9182 compound is presented in Figure 7. Similar images were generated for all the other samples and presented in Figures s.7.1, s.7.2 and s.7.3.
In the cubic structure of the LSGM compounds, all distances between atoms are equal, and the GaO₆ octahedra do not exhibit any distortion. In the monoclinic cell, the GaO₆ octahedra show rotational distortion around the c-axis [001] and the a-axis [001]. For an oxygen ion to move to a neighboring vacant site, it must "pass through" a triangle formed by one Ga³⁺ ion and two La³⁺ ions. In the monoclinic structure, six different La-Ga-La triangles are formed, while in the cubic structure, all La-Ga-La triangles are equivalent.
The possible vacant oxygen sites are located at the vertices and/or peripheral positions of the octahedra. The potential movements of the O²⁻ ions are illustrated in Figure 8 and Figure 9 for the cubic and monoclinic unit cells, respectively.
When the vacancy sites are located at the periphery of the octahedra (Figure 8 and Figure 9 a), there are two possible movements: either from a neighboring peripheral site or from a vertex to the vacant site. When the vacancy sites are located at the faces (Figure 8 and Figure 9 b), the only possible movement is from a peripheral site to the vacant site. In each case, the movement of an O2- ion to the vacancy occurs through the corresponding La-Ga-La triangles.
Considering the atoms as spheres, the triangle and the critical radius of the sphere that can fit within this triangle are illustrated in Figure 10 [65]. The critical radius rc is calculated using equation 3:
where rA and rB are the ionic radii of cations A and B, respectively, and a0 is the distance between the two A ions.
The ionic radii of the ions La³⁺, Sr²⁺, Ga³⁺, and Mg²⁺ are 1.36 Å, 1.44 Å, 0.62 Å, and 0.72 Å, respectively. The average ionic radius rA for site A and rB for site B was calculated taking into account the stoichiometry, using equations 4 and 5, respectively.
From equation 3, it is evident that the critical radius depends on the La-La distance (a0). In the cubic structure, all La-La distances are equal. In the monoclinic structure of LSGM, there are three different La-La distances, as shown in Table 5, resulting in three different values for rc. The ratio of this critical radius to the ionic radius of O²⁻ (rc/r0, where r0=1.4 Å) was calculated and is provided in Table 5. The resulting values are greater than one, indicating that the pathway for O²⁻ ions between the cation triangles is open. According to the literature [35,57,66], the increasing substitution of trivalent metal cations (La3+ and Ga3+) by divalent ones (Sr2+and Mg2+) in the LaGaO3 perovskite lattice results in enhanced formation of oxygen vacancies, which are beneficial for the ionic conductivity of the compounds. Furthermore, the structural analysis indicated that the aforementioned substitution facilitates the oxygen ion mobility as the rc/r0 gradually increases with the substitution of La by Sr and Ga by Mg.
3.4. FTIR Analysis
The FTIR spectra of the precursor materials for the LSGM compounds are presented in Figure 11. The peaks at 1740, 1180, and 1090 cm-1 are attributed to ester groups due to the esterification reaction of CA with EG. Specifically, the peaks at 1740 cm-1 and 1090 cm-1 are due to the vibrations of the -C=O and -C-O groups, respectively. The absorptions at 1660 and 1450 cm-1 arise from the asymmetric (νas) and symmetric (νs) vibrations of the –COO- groups in the citrate complexes. The positions and the difference Δν > 165 cm-1 of the aforementioned absorptions indicate that the metal cations form unidentate type of complexes with the carboxylate groups [60,67]. Additionally, absorptions at 1320 cm-1 are observed, which are attributed to the presence of C-H bonds indicating intermediate products of polymer network decomposition [60]. Finally, the absorption at 820 cm-1 may be attributed to nitrate ions (NO3-). The remaining absorptions below 1000 cm-1 could be assigned to Me-O bonds in the complexes.
It is observed that all precursor materials with varied Sr(x) value exhibit weak absorptions for the ester groups, indicating that the polymer degradation begins with the aforementioned groups. This conclusion is in good agreement with the thermograms of the precursor materials and the hypothesis that more intense drying conditions accelerate the degradation of the polymer. Specifically, for LSGM9182, the absorption at 1740 cm-1, attributed to the vibrations of the -C=O groups, appears as a broad and weak absorption around 1750 cm-1, while the peak at 1180 cm-1 is not observed. In the case of LSGM8282 and LSGM7382 this phenomenon is less pronounced.
It is observed that the precursor materials with varied Mg(y) value (LSGM9191 and LSGM9173), which were dried under milder conditions (150 °C), show stronger ester group absorptions compared to precursors dried at 200oC. Furthermore, the characteristic C-H bond absorptions (1320 cm-1) are eliminated in the extreme precursor materials with y = 0.1 and 0.3, shifting the polymer degradation to lower temperatures, a phenomenon also observed during the thermal analysis of the samples (Figure 3).
Figure 12, indicatively, presents the FTIR spectra of the LSGM9182 precursor after calcination at temperatures of 150 - 1300 °C. The results showed that all samples exhibit similar behavior and are presented in Figures s.12.1, s.12.2, s12.3 and s.12.4. At 600 °C, the absorptions of the organic groups from the polymer network are eliminated, while absorptions at 1690–1270 cm-1 and 880 cm-1 are observed, attributed to the presence of CO32- groups in the sample, confirming the formation of carbonate salts as intermediate products. It follows that the extended absorption at 1450 cm-1 is indicative of the amorphous oxocarbonate products that may be formed, such as La2O2CO3 [60,68]. This is further supported by the XRD patterns recorded at 600 °C for the LSGM compounds, which reflects the presence of La2O2CO3. In addition, the thermogravimetric analysis of the compounds, in the corresponding temperature interval of 600–750 °C, displays a weight loss assigned to the decomposition of the newly-formed oxycarbonate compounds. The carbonate absorptions disappear in the spectra of the products calcined at higher temperatures, and the formation of the final product is indicated by absorptions at 640 cm-1. This absorption is attributed to the stretching vibrations of the O-Ga-O bonds [69].
3.5. Microstructural Analysis
The final products of all compositions were studied using Scanning Electron Microscopy (SEM) in order to examine the morphology, grain size, and the degree of sintering the materials have undergone. In Figure 13, representative backscattered images are presented at different magnifications of the LSGM compounds at 1300 °C.
The materials examination showed that increasing the y (Mg) content while keeping x (Sr) constant (x = 0.1) results in the occurrence of sintering phenomenon where the grains of the materials are agglomerated. Extensive sintering makes it difficult to evaluate the morphology and size of the grains. Nevertheless, all materials exhibit structural homogeneity, high compactness with the grain shape appearing spherical. In contrast, increasing the x (Sr) content while keeping y (Mg) constant (y = 0.2) leads to materials with limited sintering and polygonal grain shapes. Specifically, LSGM7382 shows structural heterogeneity, as it exhibits various morphologies in different regions examined. This finding is consistent with the overall characterization of the material, where its unsuccessful preparation was reported.
The examination of LSGM compounds showed that an increase in the Sr (x) content leads to the formation of materials with more polygonal grains and less aggregation. In contrast, an increase in the y content promotes the formation of materials with spherical grains of smaller diameter. At a temperature of 1300 °C, the phenomenon of sintering becomes more pronounced for the compounds with x = 0.1, manifesting as connecting chains between neighboring grains of the material.
3.5. Thermal Expansion Coefficient Measurements
Sintered samples of the compounds LSGM9191, LSGM9182, and LSGM8282 were subjected to thermal treatment in the temperature range of 25 – 1100 °C to study the thermal expansion of these compounds. Figure 14 presents the thermal expansion curves of LSGM9191, LSGM9182, and LSGM8282.
All thermal expansion curves are almost linear above 300oC with positive slope values, indicating a corresponding enhancement in the thermal expansion coefficient values. Indeed, as the temperature rises, oxygen atoms are expelled, resulting in the creation of oxygen vacancies into the crystal lattice while La3+ and Ga3+ ions are reduced to compensate for the charge. Since La2+ and Ga2+ have larger ionic radii (1.32 and 0.76 Å) compared to La3+ and Ga3+ (1.06 and 0.62 Å), the aforementioned reductions are expected to cause an expansion of the crystal lattice. The thermal expansion coefficients (α) were calculated from the slope values of the lines in the ΔL/Lo = f(T) plots in the temperature ranges 300 – 600 °C, 300 – 700 °C, 300 – 800 °C, and 300 – 1000 °C. The results are given in Table 6.
From Figure 14, it is evident that an increase in the substitution level at the Ga-site by Mg (x=0.1 and y = 0.1 or 0.2) leads to an increase in the average values of the thermal expansion coefficients (α) of the LSGM compounds. As shown in the Table 6, increasing the substitution level y from 0.1 to 0.2 (with x = 0.1) results in an approximately 23% increase in the thermal expansion coefficient. Conversely, the substitution level at the A-site of the oxides appears to have the opposite effect. A change in x from 0.1 to 0.2 in compounds with y = 0.2 leads to a slight reduction in the α values by approximately 13%. From the aforementioned results, it can be concluded that the Mg substitution (y) plays a more significant role in the thermal expansion of the LSGM compounds. Similar findings were reported by Lan Nguyen T. and Dokiya M. [70]
3.5. Conductivity Measurements
The conductivity was measured at 800 °C since continuous measurements of conductivity vs. temperature could not be performed due to the significant polarization observed in the samples. The temperature of 800 °C was chosen based on the desired operating temperature range of SOFCs. The measured values were 0.02, 0.08, and 0.14 S/cm for the compounds LSGM9191, LSGM9182, and LSGM8282, respectively.
The increase in the Sr (x) and Mg(y) substitution levels leads to an elevation in the ionic conductivity values of the LSGM compounds. This observation aligns with the structural theories of the aforementioned compounds. Indeed, the substitution of the trivalent cations La³⁺ and Ga³⁺ with the divalent cations Sr²⁺ and Mg²⁺ in the lattice of LaGaO₃ results in the creation of oxygen vacancies to offer charge balance. The movement of the oxygen vacancies facilitates the diffusion of oxygen throughout the lattice volume, contributing to the ionic conductivity of the compounds. Furthermore, the aforementioned theory is enhanced by the results of Rietveld analysis where the oxygen ion pathways were found open (rc/r0 >1) for the examined samples. On the other hand, the presence of secondary phases in the structure of LSGM compounds can act as insulating barriers inhibiting the oxygen ion diffusion depending their nature and content. Specifically, the low ionic conductivity value (0.02 S/cm) of the LSGM9191 compound, in addition to the small Sr (x) and Mg(y) substitution levels, may also be attributed to the increased proportion (6.8 %) of the SrLaGa₃O₇ secondary phase, which likely acts as a barrier to the movement of oxygen ions within the lattice. In the case of LSGM9182 compound, the presence of the monoclinic structure in high percentage (80%) may have a detrimental effect on the ionic conductivity since monoclinic structure is distorted inhibiting the oxygen ion diffusion [advances in low temperature solid oxide fuel cells [6].
3. Conclusions
The wet chemical synthesis through the polymeric precursor route led to the preparation of single-phase La0.9Sr0.1Ga0.8Mg0.2O3-δ compound after calcination at 1300oC for 10h. The final products of La0.8Sr0.2Ga0.8Mg0.2O3-δ, La0.9Sr0.1Ga0.9Mg0.1O3-δ and La0.9Sr0.1Ga0.7Mg0.3O3-δ compounds exhibited a low percentage of secondary phases (SrLaGa3O7 and SrLaGaO4) below 10%. On the contrary, the synthesis of La0.7Sr0.3Ga0.8Mg0.2O3-δ yielded a final product with low perovskite phase content (57%), supporting the hypothesis that compounds of this stoichiometry (x=0.3, y=0.2) lie outside the single-phase region of the quaternary phase diagram for La2O3 – Ga2O3 – SrO – MgO system.
The processing of XRD data using the Rietveld method revealed that the formed perovskite structures were either cubic or monoclinic, with a free pathway for oxygen ion migration in all cases. As calculated from the Scherrer equation, the average crystallite size for all compounds is below 100 nm. La0.9Sr0.1Ga0.8Mg0.2O3-δ a appears to crystallize into two distinct crystalline phases; the main phase displays a monoclinic distortion (SG I12/A1) accounting for 80% of the sample, while the second phase is cubic (SG Pm3m) comprising 20% of the sample. In the monoclinic structure, the GaO6 octahedra exhibit rotational distortion around the a and c axes. All other La₁₋ₓSrₓGa₁₋ᵧMgᵧO₃₋δ (0.1 ≤x, y ≤ 0.3) compounds crystallize into cubic phases (Pm m)
The morphological analysis of the La₁₋ₓSrₓGa₁₋ᵧMgᵧO₃₋δ (0.1 ≤x, y ≤ 0.3) compounds showed that increased substitution by Sr(x) leads to polygonal grains with lower levels of sintering and heterogeneity issues, while increased substitution by Mg (y) favors smaller spherical grains, with extended sintering effect and homogenous structures.
TEC measurements highlighted the dominant role of Mg (y) substitution in driving thermal expansion and suggest that Sr (x) substitution can mitigate this effect slightly. Indeed, as Mg doping increases the thermal expansion coefficient (α) increases by about 23% while a corresponding increase in Sr doping results in a slight reduction by approximately 13%.
Increasing the substitution levels of Sr and Mg in La₁₋ₓSrₓGa₁₋ᵧMgᵧO₃₋δ (0.1 ≤x, y ≤ 0.3) compounds enhances ionic conductivity by creating oxygen vacancies that facilitate oxygen ion diffusion. However, the presence of secondary phases like SrLaGa₃O₇ or monoclinic structures can act as insulating barriers, reducing conductivity. Thus, factors such as the substitution level, the structure obtained as well as the presence of secondary phases play key role in determining the ionic conductivity of these materials.
Supplementary Materials
The following supporting information can be downloaded at the website of this paper posted on Preprints.org. Figure S.4.1: XRD patterns of LSGM9191 compound calcined at various temperatures.; Figure S.4.2: XRD patterns of LSGM9173 compound calcined at various temperatures.; Figure S.4.3: XRD patterns of LSGM8282 compound calcined at various temperatures.; Figure S.4.4: XRD patterns of LSGM7382 compound calcined at various temperatures.; Figure S.6.1: Results of the Rietveld analysis for LSGM9191 compound.; Figure S.6.2: Results of the Rietveld analysis for LSGM9173 compound.; Figure S.6.3: Results of the Rietveld analysis for LSGM8282 compound.; Figure S.7.1: Visualization of the unit cell for cubic structure of LSGM9191 compound.; Figure S.7.2: Visualization of the unit cell for cubic structure of LSGM9173 compound.; Figure S.7.3: Visualization of the unit cell for cubic structure of LSGM8282 compound.; Figure S.12.1: FTIR spectra of LSGM9191 compound calcined at various temperatures.; Figure S.12.2: FTIR spectra of LSGM9173 compound calcined at various temperatures.; Figure S.12.3: FTIR spectra of LSGM8282 compound calcined at various temperatures.; Figure S.12.4: FTIR spectra of LSGM7382 compound calcined at various temperatures.
Author Contributions
Conceptualization, D.K. and G.K.; methodology, G.K.; validation, D.K., A.G. and G.K.; formal analysis, D.K. and A.G.; investigation, D.K. and A.G.; resources, G.K.; data curation, D.K.; writing—original draft preparation, D.K. and A.G.; writing—review and editing, G.K.; visualization, D.K.; supervision, G.K.; project administration, G.K.; funding acquisition, G.K. All authors have read and agreed to the published version of the manuscript.
Funding
This research received no funding.
Institutional Review Board Statement
Not applicable.
Informed Consent Statement
Not applicable.
Data Availability Statement
The data presented in this study are available on request from the corresponding author.
Conflicts of Interest
The authors declare no conflicts of interest.
References
- Selvan, K.V.; Hasan, M.N.; Mohamed Ali, M.S. Methodological Reviews and Analyses on the Emerging Research Trends and Progresses of Thermoelectric Generators. Int J Energy Res 2019, 43, 113–140. [CrossRef]
- Cigolotti, V.; Genovese, M.; Fragiacomo, P. Comprehensive Review on Fuel Cell Technology for Stationary Applications as Sustainable and Efficient Poly-Generation Energy Systems. Energies (Basel) 2021, 14. [CrossRef]
- Itagaki, Y.; Kumamoto, Y.; Okayama, S.; Aono, H. Anodic Performance of Ni–BCZY and Ni–BCZY–GDC Films on BCZY Electrolytes. Ceramics 2023, 6, 1850–1860. [CrossRef]
- Minh, N.Q. Solid Oxide Fuel Cell Technology—Features and Applications. Solid State Ion 2004, 174, 271–277. [CrossRef]
- Bilal Hanif, M.; Motola, M.; qayyum, S.; Rauf, S.; khalid, A.; Li, C.J.; Li, C.X. Recent Advancements, Doping Strategies and the Future Perspective of Perovskite-Based Solid Oxide Fuel Cells for Energy Conversion. Chemical Engineering Journal 2022, 428, 132603. [CrossRef]
- Chun, O.; Jamshaid, F.; Khan, M.Z.; Gohar, O.; Hussain, I.; Zhang, Y.; Zheng, K.; Saleem, M.; Motola, M.; Hanif, M.B. Advances in Low-Temperature Solid Oxide Fuel Cells: An Explanatory Review. J Power Sources 2024, 610, 234719. [CrossRef]
- Peng, J.; Huang, J.; Wu, X. long; Xu, Y. wu; Chen, H.; Li, X. Solid Oxide Fuel Cell (SOFC) Performance Evaluation, Fault Diagnosis and Health Control: A Review. J Power Sources 2021, 505, 230058. [CrossRef]
- Zarabi Golkhatmi, S.; Asghar, M.I.; Lund, P.D. A Review on Solid Oxide Fuel Cell Durability: Latest Progress, Mechanisms, and Study Tools. Renewable and Sustainable Energy Reviews 2022, 161, 112339. [CrossRef]
- Minary-Jolandan, M. Formidable Challenges in Additive Manufacturing of Solid Oxide Electrolyzers (SOECs) and Solid Oxide Fuel Cells (SOFCs) for Electrolytic Hydrogen Economy toward Global Decarbonization. Ceramics 2022, 5, 761–779. [CrossRef]
- Saadabadi, S.A.; Thallam Thattai, A.; Fan, L.; Lindeboom, R.E.F.; Spanjers, H.; Aravind, P. V. Solid Oxide Fuel Cells Fuelled with Biogas: Potential and Constraints. Renew Energy 2019, 134, 194–214. [CrossRef]
- Yang, B.C.; Koo, J.; Shin, J.W.; Go, D.; Shim, J.H.; An, J. Direct Alcohol-Fueled Low-Temperature Solid Oxide Fuel Cells: A Review. Energy Technology 2019, 7, 5–19. [CrossRef]
- Zhang, L.; Chen, G.; Dai, R.; Lv, X.; Yang, D.; Geng, S. A Review of the Chemical Compatibility between Oxide Electrodes and Electrolytes in Solid Oxide Fuel Cells. J Power Sources 2021, 492, 229630. [CrossRef]
- Brandon, N.P.; Skinner, S.; Steele, B.C.H. Recent Advances in Materials for Fuel Cells. Annu Rev Mater Res 2003, 33, 183–213. [CrossRef]
- Zhou, Z.; Nadimpalli, V.K.; Pedersen, D.B.; Esposito, V. Degradation Mechanisms of Metal-Supported Solid Oxide Cells and Countermeasures: A Review. Materials 2021, 14. [CrossRef]
- Sreedhar, I.; Agarwal, B.; Goyal, P.; Agarwal, A. An Overview of Degradation in Solid Oxide Fuel Cells-Potential Clean Power Sources. Journal of Solid State Electrochemistry 2020, 24, 1239–1270. [CrossRef]
- Yang, Z.; Guo, M.; Wang, N.; Ma, C.; Wang, J.; Han, M. A Short Review of Cathode Poisoning and Corrosion in Solid Oxide Fuel Cell. Int J Hydrogen Energy 2017, 42, 24948–24959. [CrossRef]
- Zakaria, Z.; Abu Hassan, S.H.; Shaari, N.; Yahaya, A.Z.; Boon Kar, Y. A Review on Recent Status and Challenges of Yttria Stabilized Zirconia Modification to Lowering the Temperature of Solid Oxide Fuel Cells Operation. Int J Energy Res 2020, 44, 631–650. [CrossRef]
- Hanif, M.B.; Rauf, S.; Motola, M.; Babar, Z.U.D.; Li, C.J.; Li, C.X. Recent Progress of Perovskite-Based Electrolyte Materials for Solid Oxide Fuel Cells and Performance Optimizing Strategies for Energy Storage Applications. Mater Res Bull 2022, 146, 111612. [CrossRef]
- Tarancón, A. Strategies for Lowering Solid Oxide Fuel Cells Operating Temperature. Energies (Basel) 2009, 2, 1130–1150. [CrossRef]
- Brett, D.J.L.; Atkinson, A.; Brandon, N.P.; Skinner, S.J. Intermediate Temperature Solid Oxide Fuel Cells. Chem. Soc. Rev. 2008, 37, 1568–1578. [CrossRef]
- Yang, D.; Chen, G.; Zhang, L.; Chen, Z.; Zhang, R.; Asghar, M.I.; Geng, S.; Lund, P.D. Low Temperature Ceramic Fuel Cells Employing Lithium Compounds: A Review. J Power Sources 2021, 503, 230070. [CrossRef]
- Su, H.; Hu, Y.H. Progress in Low-Temperature Solid Oxide Fuel Cells with Hydrocarbon Fuels. Chemical Engineering Journal 2020, 402, 126235. [CrossRef]
- Kalinina, M. V; Dyuskina, D.A.; Mjakin, S. V; Kruchinina, I.Yu.; Shilova, O.A. Comparative Study of Physicochemical Properties of Finely Dispersed Powders and Ceramics in the Systems CeO2–Sm2O3 and CeO2–Nd2O3 as Electrolyte Materials for Medium Temperature Fuel Cells. Ceramics 2023, 6, 1210–1226. [CrossRef]
- Shi, H.; Su, C.; Ran, R.; Cao, J.; Shao, Z. Electrolyte Materials for Intermediate-Temperature Solid Oxide Fuel Cells. Progress in Natural Science: Materials International 2020, 30, 764–774. [CrossRef]
- Wang, F.; Lyu, Y.; Chu, D.; Jin, Z.; Zhang, G.; Wang, D. The Electrolyte Materials for SOFCs of Low-Intermediate Temperature: Review. Materials Science and Technology 2019, 35, 1551–1562. [CrossRef]
- Fan, L.; Zhu, B.; Su, P.C.; He, C. Nanomaterials and Technologies for Low Temperature Solid Oxide Fuel Cells: Recent Advances, Challenges and Opportunities. Nano Energy 2018, 45, 148–176. [CrossRef]
- Ellingsen, L.A.-W.; Hung, C.R.; Majeau-Bettez, G.; Singh, B.; Chen, Z.; Whittingham, M.S.; Strømman, A.H. Nanotechnology for Environmentally Sustainable Electromobility. Nat Nanotechnol 2016, 11, 1039–1051. [CrossRef]
- Ishihara, T.; Matsuda, H.; Takita, Y. Doped LaGaO3 Perovskite Type Oxide as a New Oxide Ionic Conductor. J Am Chem Soc 1994, 116, 3801–3803. [CrossRef]
- Feng, M.; Goodenough, J.B.; Huang, K.; Milliken, C. Fuel Cells with Doped Lanthanum Gallate Electrolyte. J Power Sources 1996, 63, 47–51. [CrossRef]
- Zhigachev, A.O.; Rodaev, V. V.; Zhigacheva, D. V.; Lyskov, N. V.; Shchukina, M.A. Doping of Scandia-Stabilized Zirconia Electrolytes for Intermediate-Temperature Solid Oxide Fuel Cell: A Review. Ceram Int 2021, 47, 32490–32504. [CrossRef]
- Kasyanova, A. V; Rudenko, A.O.; Lyagaeva, Yu.G.; Medvedev, D.A. Lanthanum-Containing Proton-Conducting Electrolytes with Perovskite Structures. Membranes and Membrane Technologies 2021, 3, 73–97. [CrossRef]
- Artini, C. Crystal Chemistry, Stability and Properties of Interlanthanide Perovskites: A Review. J Eur Ceram Soc 2017, 37, 427–440. [CrossRef]
- Morales, M.; Roa, J.J.; Tartaj, J.; Segarra, M. A Review of Doped Lanthanum Gallates as Electrolytes for Intermediate Temperature Solid Oxides Fuel Cells: From Materials Processing to Electrical and Thermo-Mechanical Properties. J Eur Ceram Soc 2016, 36, 1–16. [CrossRef]
- Gordeev, E. V; Porotnikova, N.M. Approaches for the Preparation of Dense Ceramics and Sintering Aids for Sr/Mg Doped Lanthanum Gallate: Focus Review. Electrochemical Materials and Technologies 2023, 2, 20232022. [CrossRef]
- Gordeev, E. V.; Osinkin, D.A. Step-by-Step Strategy to Improve the Performance of the (La,Sr)(Ga,Mg)O3-δ Electrolyte for Symmetrical Solid Oxide Fuel Cells. Ceram Int 2024, 50, 47395–47401. [CrossRef]
- Zamudio-García, J.; Caizán-Juanarena, L.; Porras-Vázquez, J.M.; Losilla, E.R.; Marrero-López, D. A Review on Recent Advances and Trends in Symmetrical Electrodes for Solid Oxide Cells. J Power Sources 2022, 520, 230852. [CrossRef]
- Zhu, K.; Luo, B.; Liu, Z.; Wen, X. Recent Advances and Prospects of Symmetrical Solid Oxide Fuel Cells. Ceram Int 2022, 48, 8972–8986. [CrossRef]
- Osinkin, D.A.; Antonova, E.P.; Shubin, K.S.; Bogdanovich, N.M. Influence of Nickel Exsolution on the Electrochemical Performance and Rate-Determining Stages of Hydrogen Oxidation on Sr1.95Fe1.4Ni0.1Mo0.5O6-δ Promising Electrode for Solid State Electrochemical Devices. Electrochim Acta 2021, 369, 137673. [CrossRef]
- Kaleva, G.M.; Politova, E.D.; Mosunov, A. V; Sadovskaya, N. V Modified Ion-Conducting Ceramics Based on Lanthanum Gallate: Synthesis, Structure, and Properties. Russian Journal of Physical Chemistry A 2018, 92, 1138–1144. [CrossRef]
- Moure, A.; Castro, A.; Tartaj, J.; Moure, C. Single-Phase Ceramics with La1−xSrxGa1−yMgyO3−δ Composition from Precursors Obtained by Mechanosynthesis. J Power Sources 2009, 188, 489–497. [CrossRef]
- Cho, P.S.; Park, S.Y.; Cho, Y.H.; Kim, S.J.; Kang, Y.C.; Mori, T.; Lee, J.H. Preparation of LSGM Powders for Low Temperature Sintering. Solid State Ion 2009, 180, 788–791. [CrossRef]
- Kioupis, D.; Argyridou, M.; Gaki, A.; Kakali, G. Wet Chemical Synthesis of La9.83−xSrxSi6O26+δ (0≤x≤0.50) Powders, Characterization of Intermediate and Final Products. Journal of Rare Earths 2015, 33, 320–326. [CrossRef]
- Yu, S.; Bi, H.; Sun, J.; Zhu, L.; Yu, H.; Lu, C.; Liu, X. Effect of Grain Size on the Electrical Properties of Strontium and Magnesium Doped Lanthanum Gallate Electrolytes. J Alloys Compd 2019, 777, 244–251. [CrossRef]
- Choi, J.-J.; Cho, K.-S.; Choi, J.-H.; Ryu, J.; Hahn, B.-D.; Yoon, W.-H.; Kim, J.-W.; Ahn, C.-W.; Park, D.-S.; Yun, J. Electrochemical Effects of Cobalt Doping on (La,Sr)(Ga,Mg)O3−δ Electrolyte Prepared by Aerosol Deposition. Int J Hydrogen Energy 2012, 37, 6830–6835. [CrossRef]
- Porotnikova, N.; Khodimchuk, A.; Gordeev, E.; Osinkin, D. Effect of Doping with Iron and Cations Deficiency in the High Conductive Electrolyte La0.8Sr0.2Ga0.8Mg0.2O3–δ on Oxygen Exchange Kinetics. Solid State Ion 2024, 417, 116704. [CrossRef]
- Wang, J.Q.; Zhou, D.F.; Gao, J.Q.; Sun, H.R.; Zhu, X.F.; Meng, J. Effect of A/B-Site Non-Stoichiometry on the Structure and Properties of La0.9Sr0.1Ga0.9Mg0.1O3− Solid Electrolyte in Intermediate-Temperature Solid Oxide Fuel Cells. ChemElectroChem 2018, 5, 665–673. [CrossRef]
- Suzuki, H.T.; Uchikoshi, T.; Matsunaga, C.; Furuya, K.; Munakata, F. Interaction between A-Site Deficient La0.8Sr0.2Ga0.8Mg0.2O3 − δ (LSGM8282) and Ce0.9Gd0.1O3 − δ (GDC) Electrolytes. Solid State Ion 2014, 258, 18–23. [CrossRef]
- Gorgeev, E.; Antonova, E.; Osinkin, D. Sintering Aids Strategies for Improving LSGM and LSF Materials for Symmetrical Solid Oxide Fuel Cell. Applied Sciences 2024, 14. [CrossRef]
- Larregle, S.C.; Baqué, L.; Mogni, L. Effect of Aid-Sintering Additives in Processing of Solid Oxide Fuel Cells Electrolytes by Tape Casting. Solid State Ion 2023, 394, 116210. [CrossRef]
- Nikonov, A. V; Pavzderin, N.B.; Shkerin, S.N.; Gyrdasova, O.I.; Lipilin, A.S. Fabrication of Multilayer Ceramic Structure for Fuel Cell Based on La(Sr)Ga(Mg)O3–La(Sr)Fe(Ga)O3 Cathode. Russian Journal of Applied Chemistry 2017, 90, 369–373. [CrossRef]
- Sammes, N.M.; Tompsett, G.A.; Phillips, R.J.; Cartner, A.M. Characterisation of Doped-Lanthanum Gallates by X-Ray Diffraction and Raman Spectroscopy. Solid State Ion 1998, 111, 1–7. [CrossRef]
- Chae, N.S.; Park, K.S.; Yoon, Y.S.; Yoo, I.S.; Kim, J.S.; Yoon, H.H. Sr- and Mg-Doped LaGaO3 Powder Synthesis by Carbonate Coprecipitation. Colloids Surf A Physicochem Eng Asp 2008, 313–314, 154–157. [CrossRef]
- Batista, R.M.; Reis, S.L.; Muccillo, R.; Muccillo, E.N.S. Sintering Evaluation of Doped Lanthanum Gallate Based on Thermodilatometry. Ceram Int 2019, 45, 5218–5222. [CrossRef]
- Lerch, M.; Boysen, H.; Hansen, T. High-Temperature Neutron Scattering Investigation of Pure and Doped Lanthanum Gallate. Journal of Physics and Chemistry of Solids 2001, 62, 445–455. [CrossRef]
- Rodríguez-Carvajal, J. Recent Advances in Magnetic Structure Determination by Neutron Powder Diffraction. Physica B Condens Matter 1993, 192, 55–69. [CrossRef]
- Kioupis, D.; Kakali, G. Structural and Electrical Characterization of Sr- and Al- Doped Apatite Type Lanthanum Silicates Prepared by the Pechini Method. Ceram Int 2016, 42, 9640–9647. [CrossRef]
- Biswal, R.C.; Biswas, K. Synthesis and Characterization of Sr2+ and Mg2+ Doped LaGaO3 by Co-Precipitation Method Followed by Hydrothermal Treatment for Solid Oxide Fuel Cell Applications. J Eur Ceram Soc 2013, 33, 3053–3058. [CrossRef]
- Ibrahim, A.H.; Abbas, Y.M.; Ayoub, H.A.; Ali, M.H.; Aldoori, M. Novel Synthesis of Stabilized Bi1–x–YGdxDyyO1.5 Solid Electrolytes with Enhanced Conductivity for Intermediate Temperature Solid Oxide Fuel Cells (SOFCs). Journal of Rare Earths 2024, 42, 1903–1911. [CrossRef]
- Huang, K.; Tichy, R.S.; Goodenough, J.B. Superior Perovskite Oxide-Ion Conductor; Strontium- and Magnesium-Doped LaGaO3: I, Phase Relationships and Electrical Properties. Journal of the American Ceramic Society 1998, 81, 2565–2575. [CrossRef]
- Kioupis, D.; Gaki, A.; Kakali, G. Wet Chemical Synthesis of La1-XSrxGa0.8Mg0.2O3-δ (X=0.1, 0.2, 0.3) Powders . In Proceedings of the Advanced Materials Forum V; Trans Tech Publications Ltd, December 2010; Vol. 636, pp. 908–913.
- Gaki, A.; Anagnostaki, O.; Kioupis, D.; Perraki, T.; Gakis, D.; Kakali, G. Optimization of LaMO3 (M: Mn, Co, Fe) Synthesis through the Polymeric Precursor Route. J Alloys Compd 2008, 451, 305–308. [CrossRef]
- Ishihara, T.; Furutani, H.; Honda, M.; Yamada, T.; Shibayama, T.; Akbay, T.; Sakai, N.; Yokokawa, H.; Takita, Y. Improved Oxide Ion Conductivity in La0.8Sr0.2Ga0.8Mg0.2O3 by Doping Co. Chemistry of Materials 1999, 11, 2081–2088. [CrossRef]
- Kharton, V. V.; Shaula, A.L.; Vyshatko, N.P.; Marques, F.M.B. Electron-Hole Transport in (La0.9Sr0.1)0.98Ga0.8Mg0.2O3−δ Electrolyte: Effects of Ceramic Microstructure. Electrochim Acta 2003, 48, 1817–1828. [CrossRef]
- Tsay, J.; Fang, T. Effects of Molar Ratio of Citric Acid to Cations and of PH Value on the Formation and Thermal-Decomposition Behavior of Barium Titanium Citrate. Journal of the American Ceramic Society 1999, 82, 1409–1415. [CrossRef]
- Sammells, A.F.; Cook, R.L.; White, J.H.; Osborne, J.J.; MacDuff, R.C. Rational Selection of Advanced Solid Electrolytes for Intermediate Temperature Fuel Cells. Solid State Ion 1992, 52, 111–123. [CrossRef]
- Li, S.; Bergman, B. Doping Effect on Secondary Phases, Microstructure and Electrical Conductivities of LaGaO3 Based Perovskites. J Eur Ceram Soc 2009, 29, 1139–1146. [CrossRef]
- Nakamoto, K. Applications in Inorganic Chemistry. In Infrared and Raman Spectra of Inorganic and Coordination Compounds; John Wiley & Sons, Ltd, 2008; pp. 149–354 ISBN 9780470405840.
- Todorovsky, D.S.; Getsova, M.M.; Vasileva, M.A. Thermal Decomposition of Lanthanum-Titanium Citric Complexes Prepared from Ethylene Glycol Medium. J Mater Sci 2002, 37, 4029–4039. [CrossRef]
- Sebastian, L.; Shukla, A.K.; Gopalakrishnan, J. La0.9Sr0.1Ga0.8M0.2O3-δ (M = Mn, Co, Ni, Cu or Zn): Transition Metal-Substituted Derivatives of Lanthanum-Strontium-Galliummagnesium (LSGM) Perovskite Oxide Ion Conductor. Bulletin of Materials Science 2000, 23, 169–173. [CrossRef]
- Lan Nguyen, T.; Dokiya, M. Electrical Conductivity, Thermal Expansion and Reaction of (La, Sr)(Ga, Mg)O3 and (La, Sr)AlO3 System. Solid State Ion 2000, 132, 217–226. [CrossRef]
- Filonova, E.A.; Medvedev, D. Recent Progress in the Design, Characterisation and Application of LaAlO3- and LaGaO3-Based Solid Oxide Fuel Cell Electrolytes. Nanomaterials 2022, 12. [CrossRef]
Figure 1.
La1-xSrxGa0.8Mg0.2O3-δ morphology depending Sr (x) substitution: (a) x = 0.1, (b) x = 0.2 and (c) x = 0.3.
Figure 1.
La1-xSrxGa0.8Mg0.2O3-δ morphology depending Sr (x) substitution: (a) x = 0.1, (b) x = 0.2 and (c) x = 0.3.
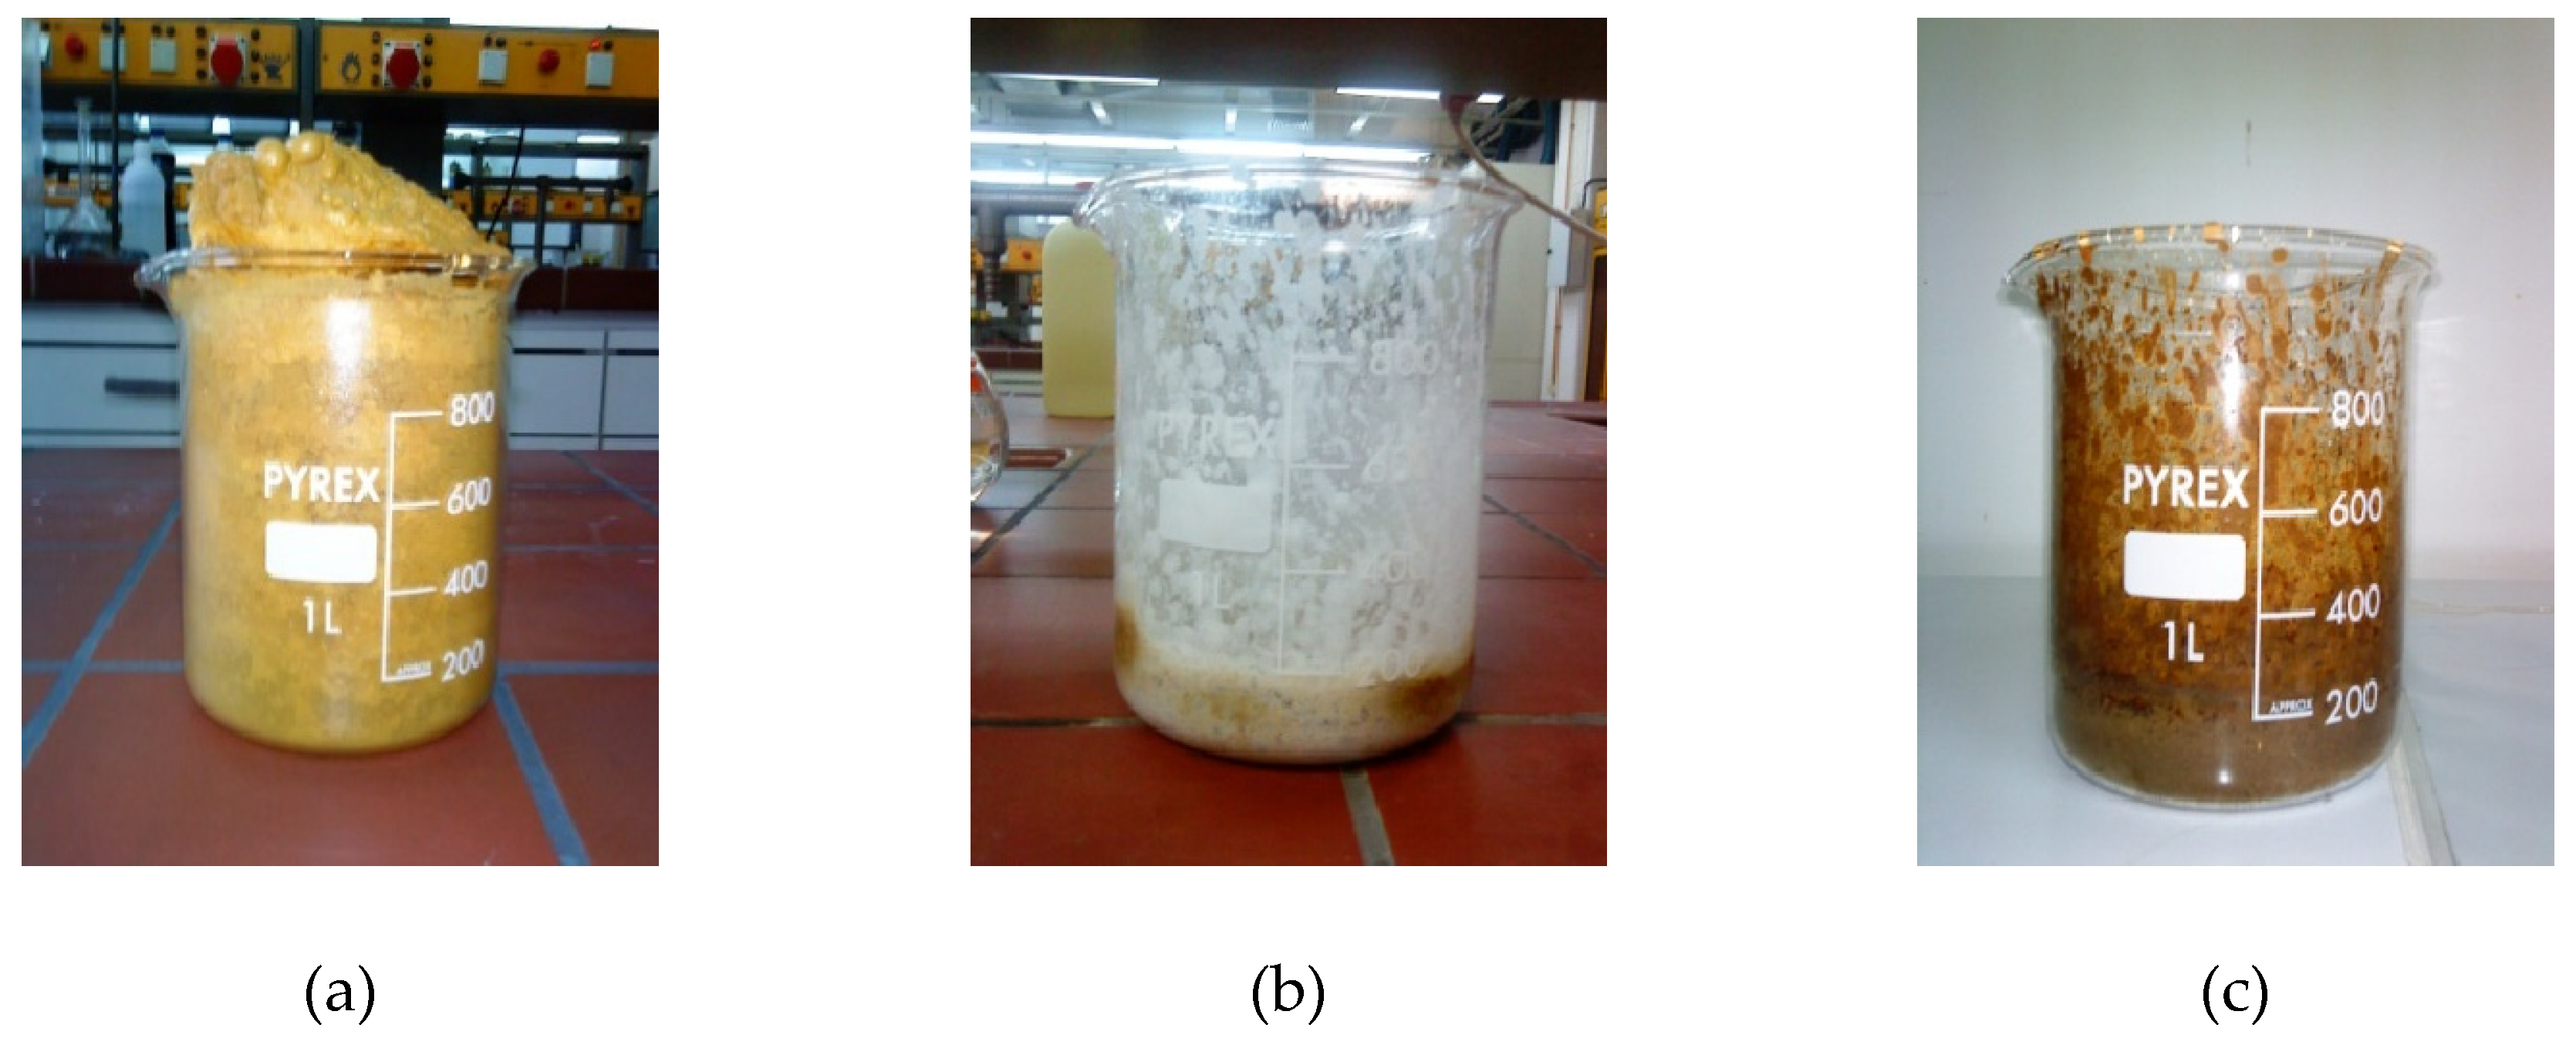
Figure 2.
Flowchart of the LSGM synthesis.
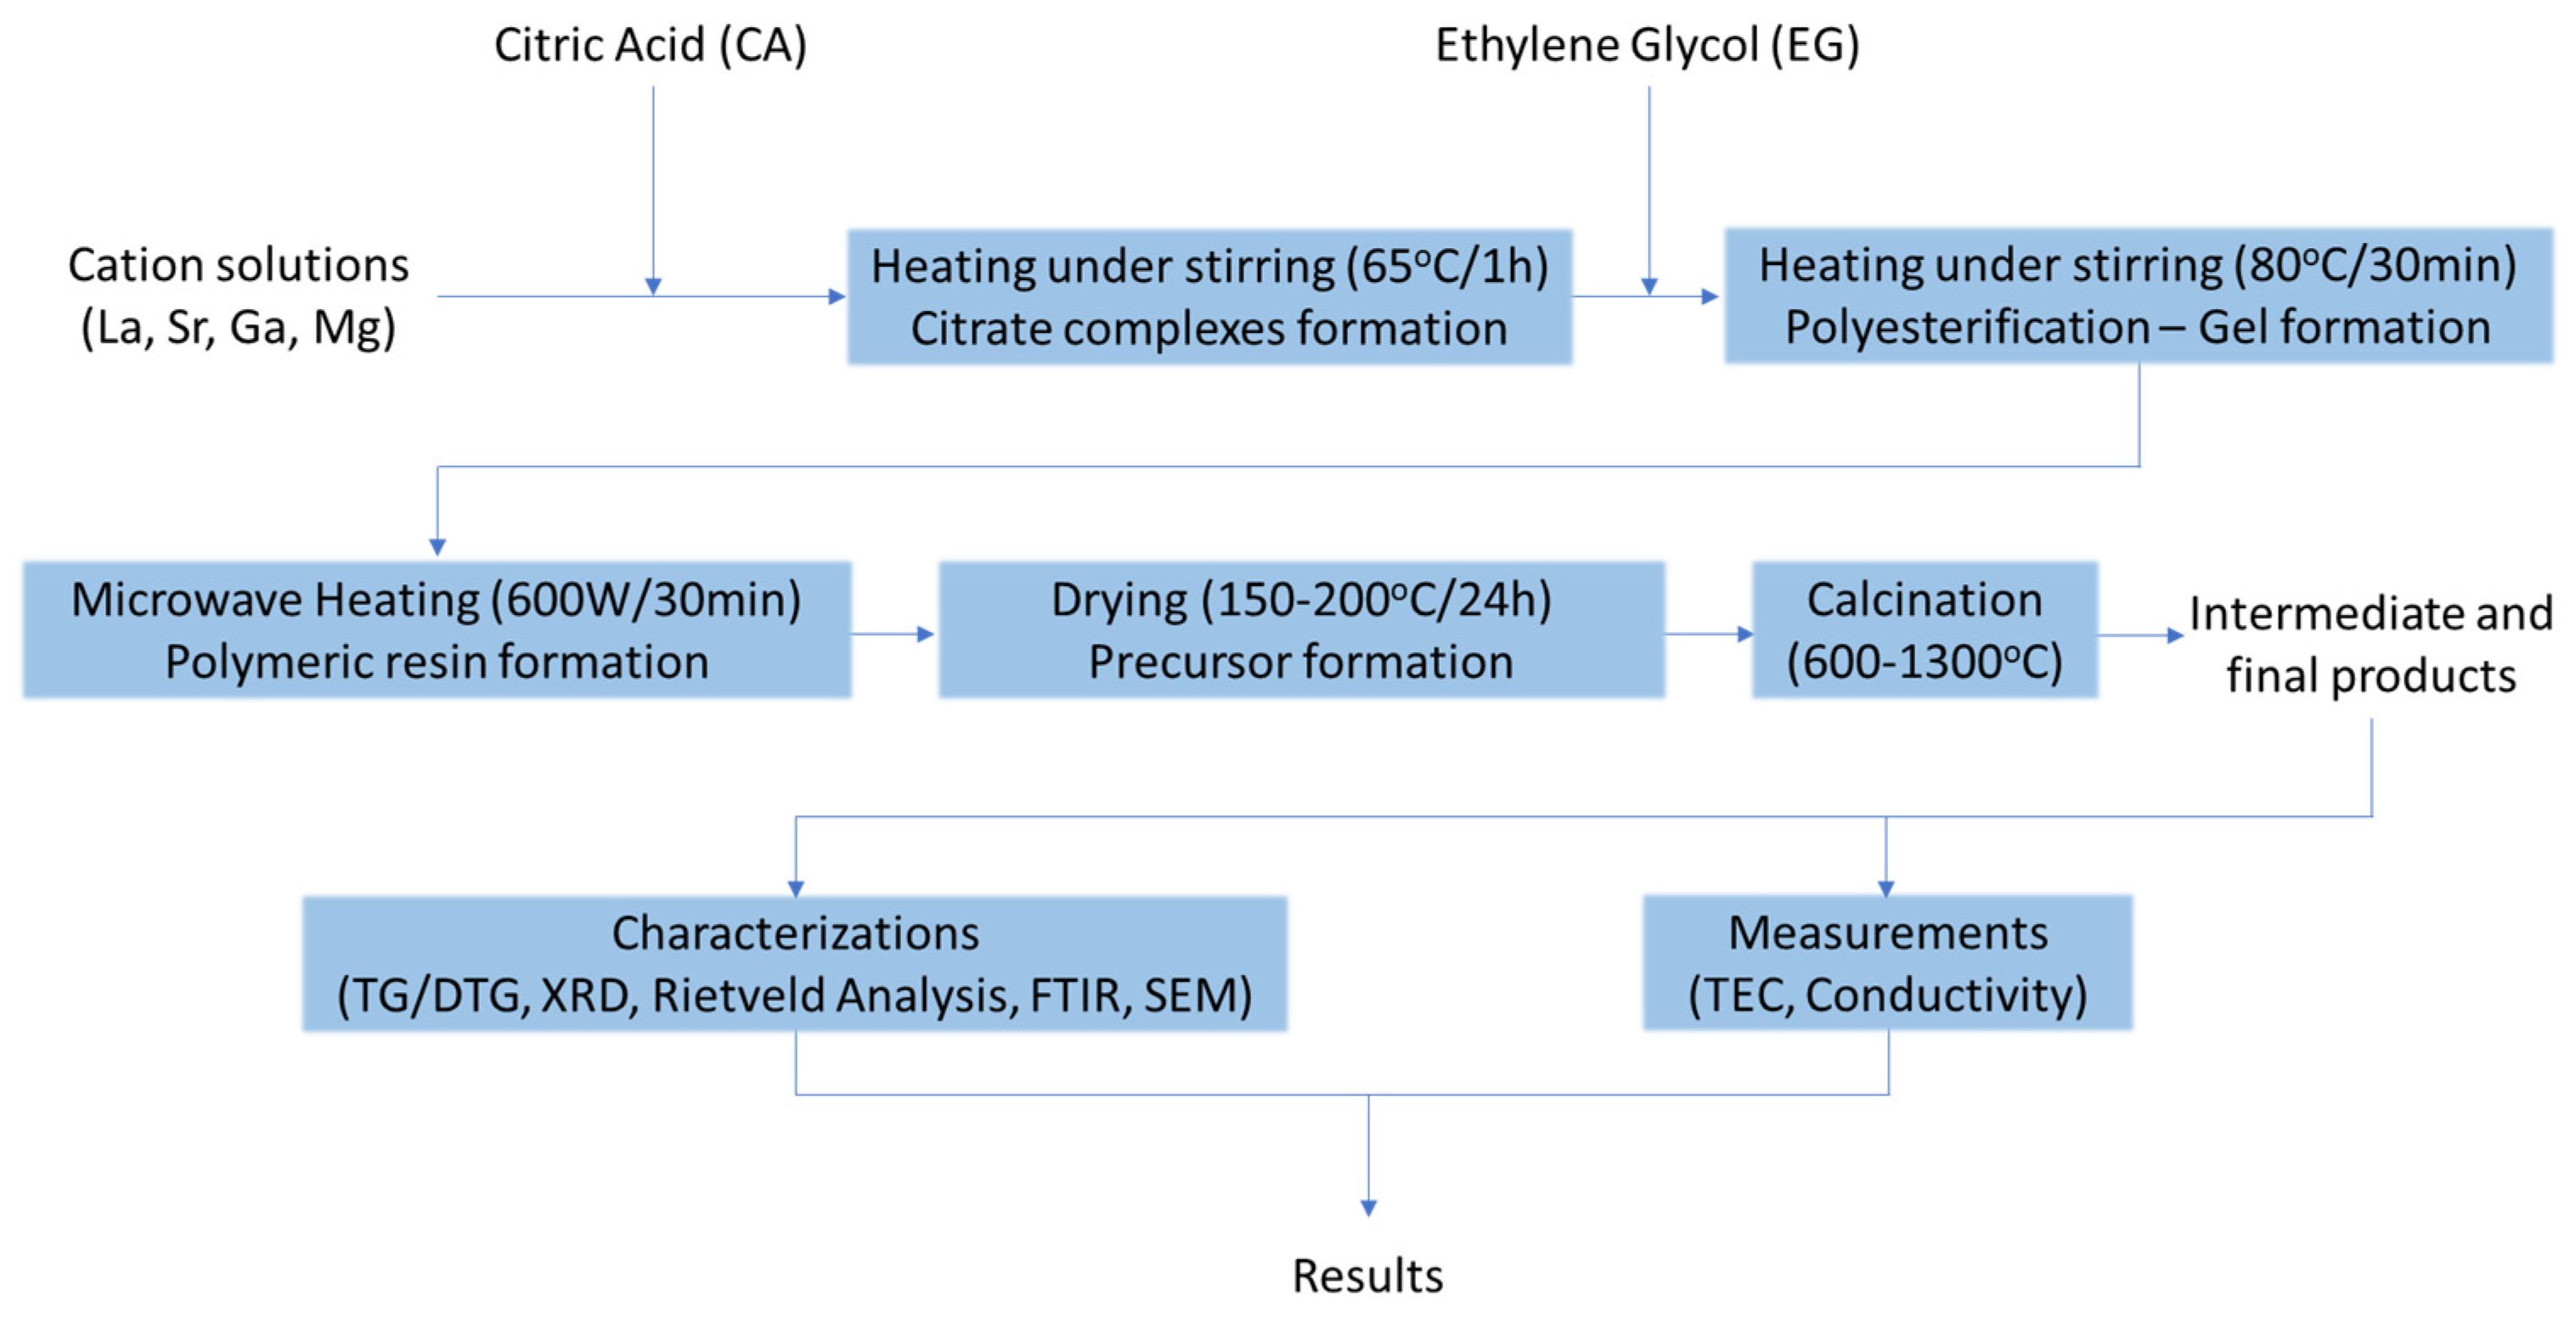
Figure 3.
DTG curves of LSGM compounds with varying x and y values.
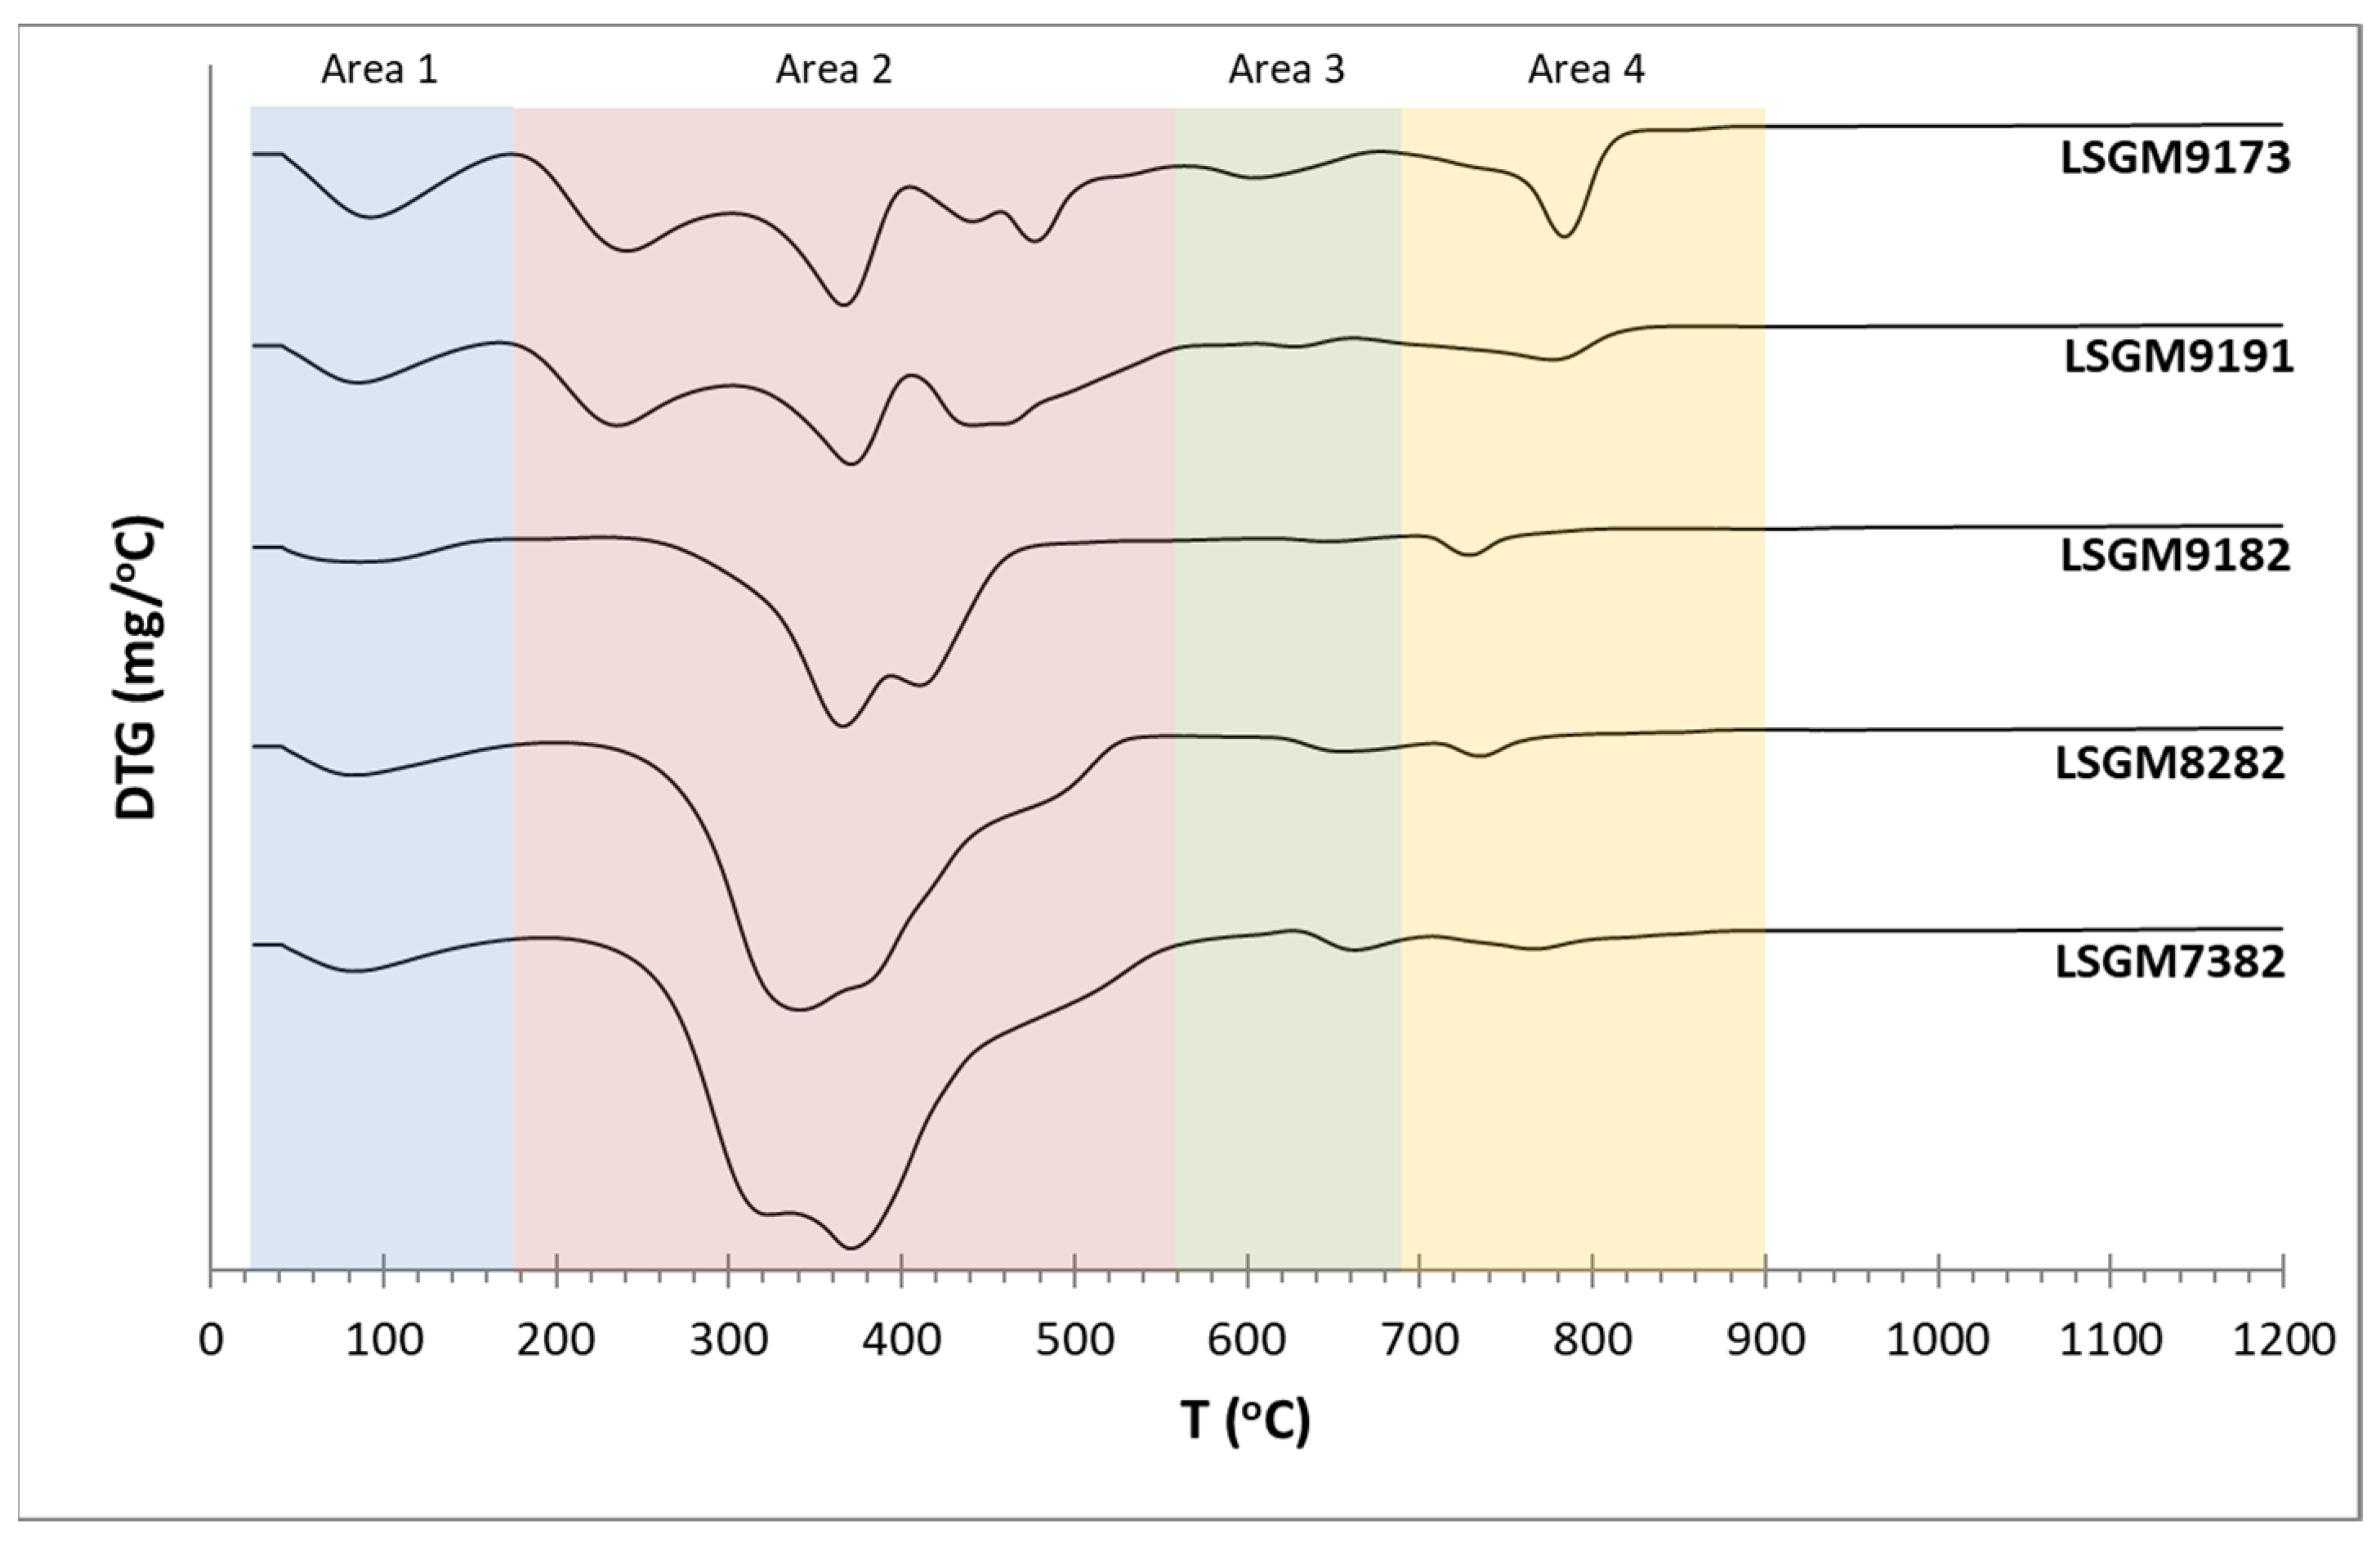
Figure 4.
XRD patterns of LSGM9182 compound calcined at various temperatures.
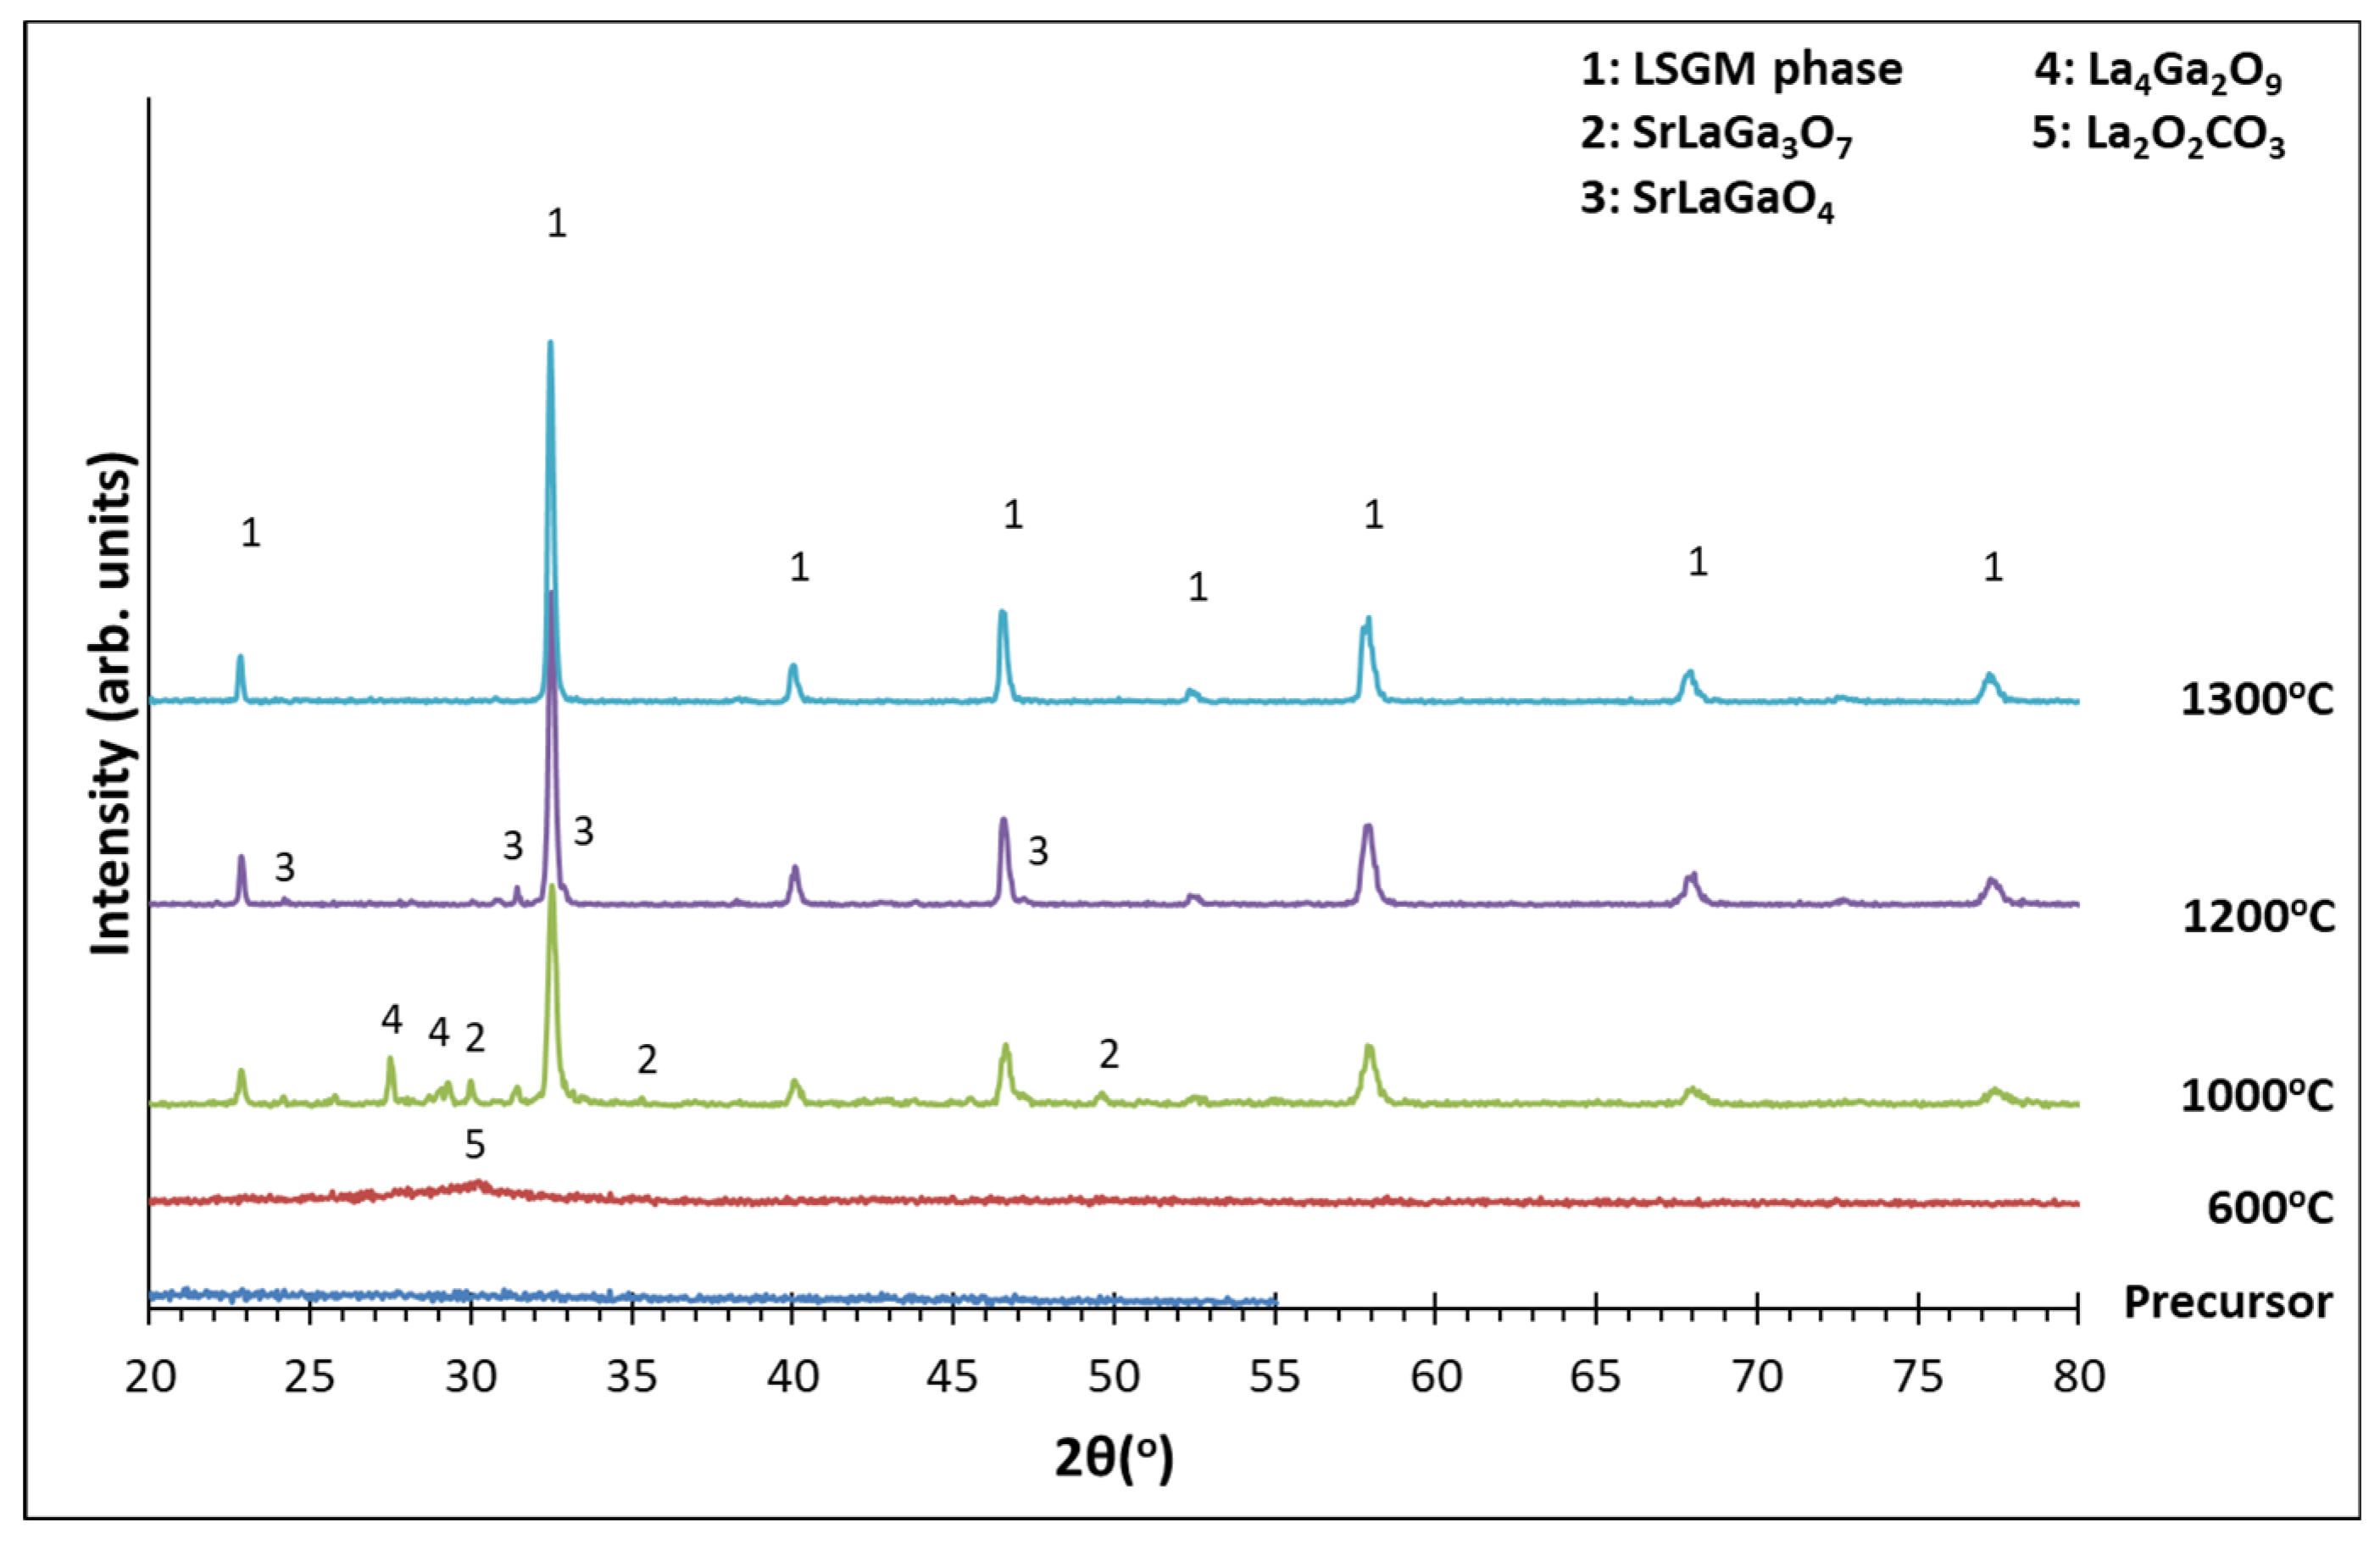
Figure 5.
XRD patterns of LSGM final products after calcination at 1300oC for 10h.
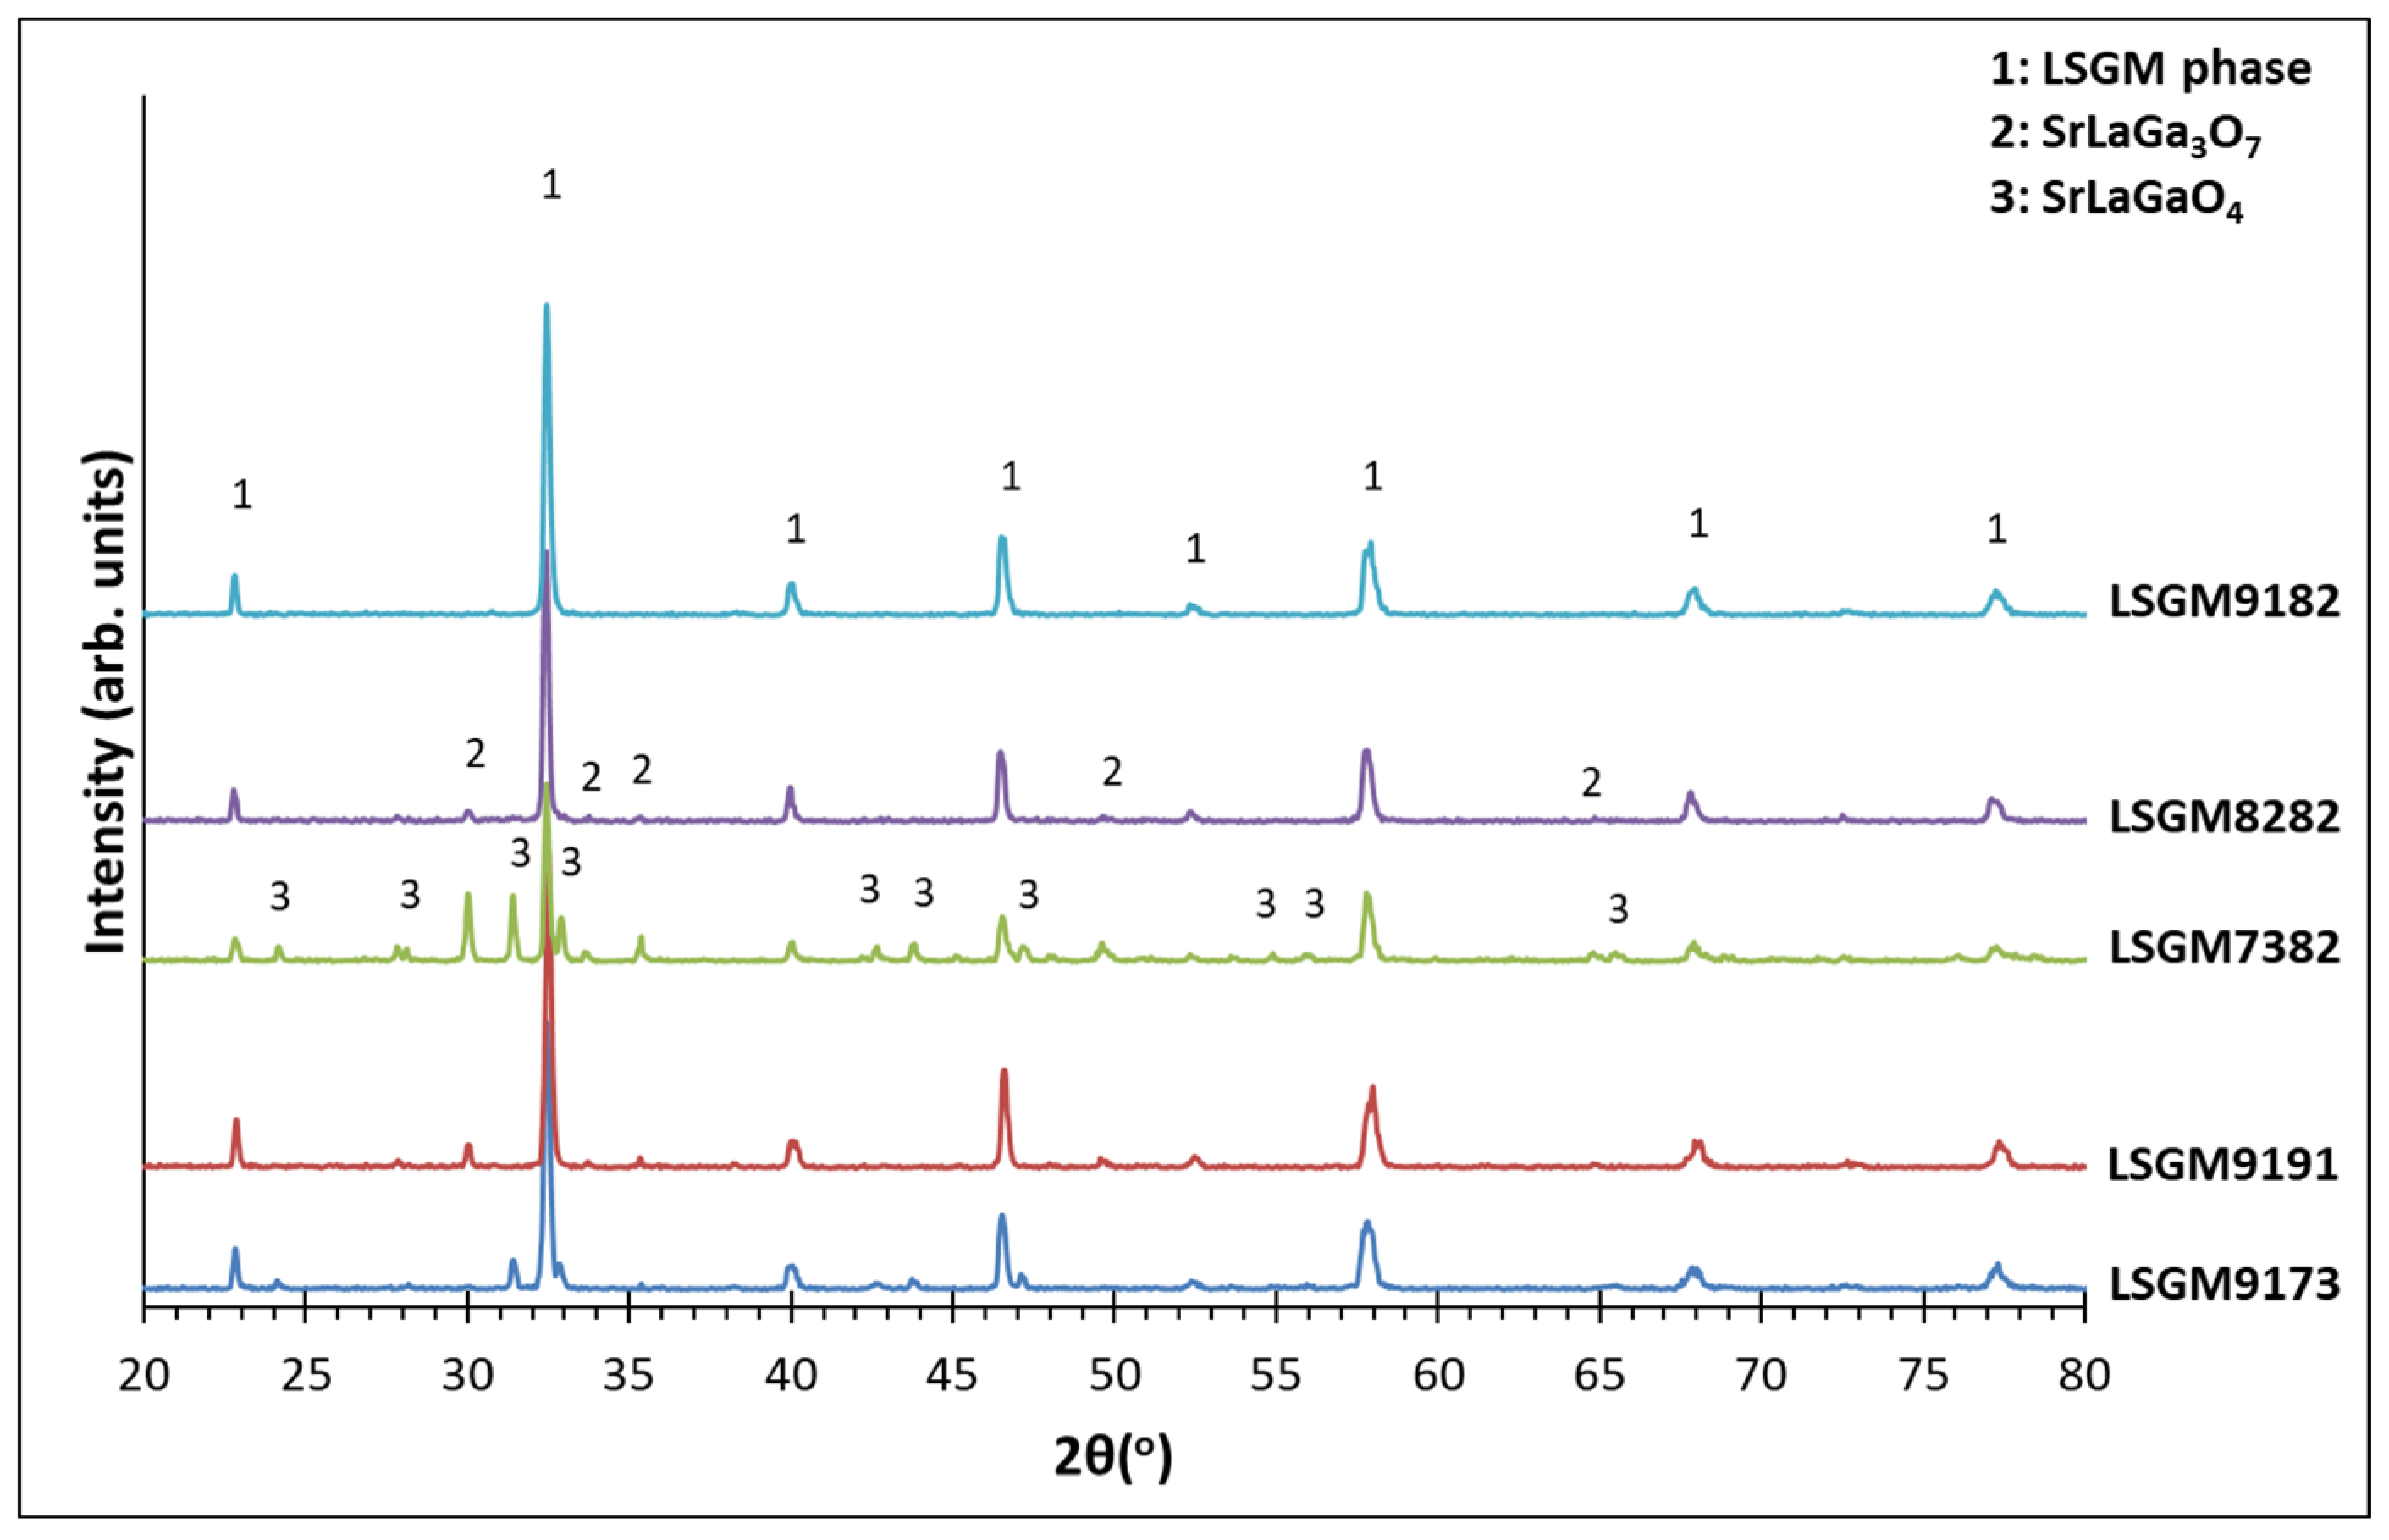
Figure 6.
Results of the Rietveld analysis for LSGM9182 compound.
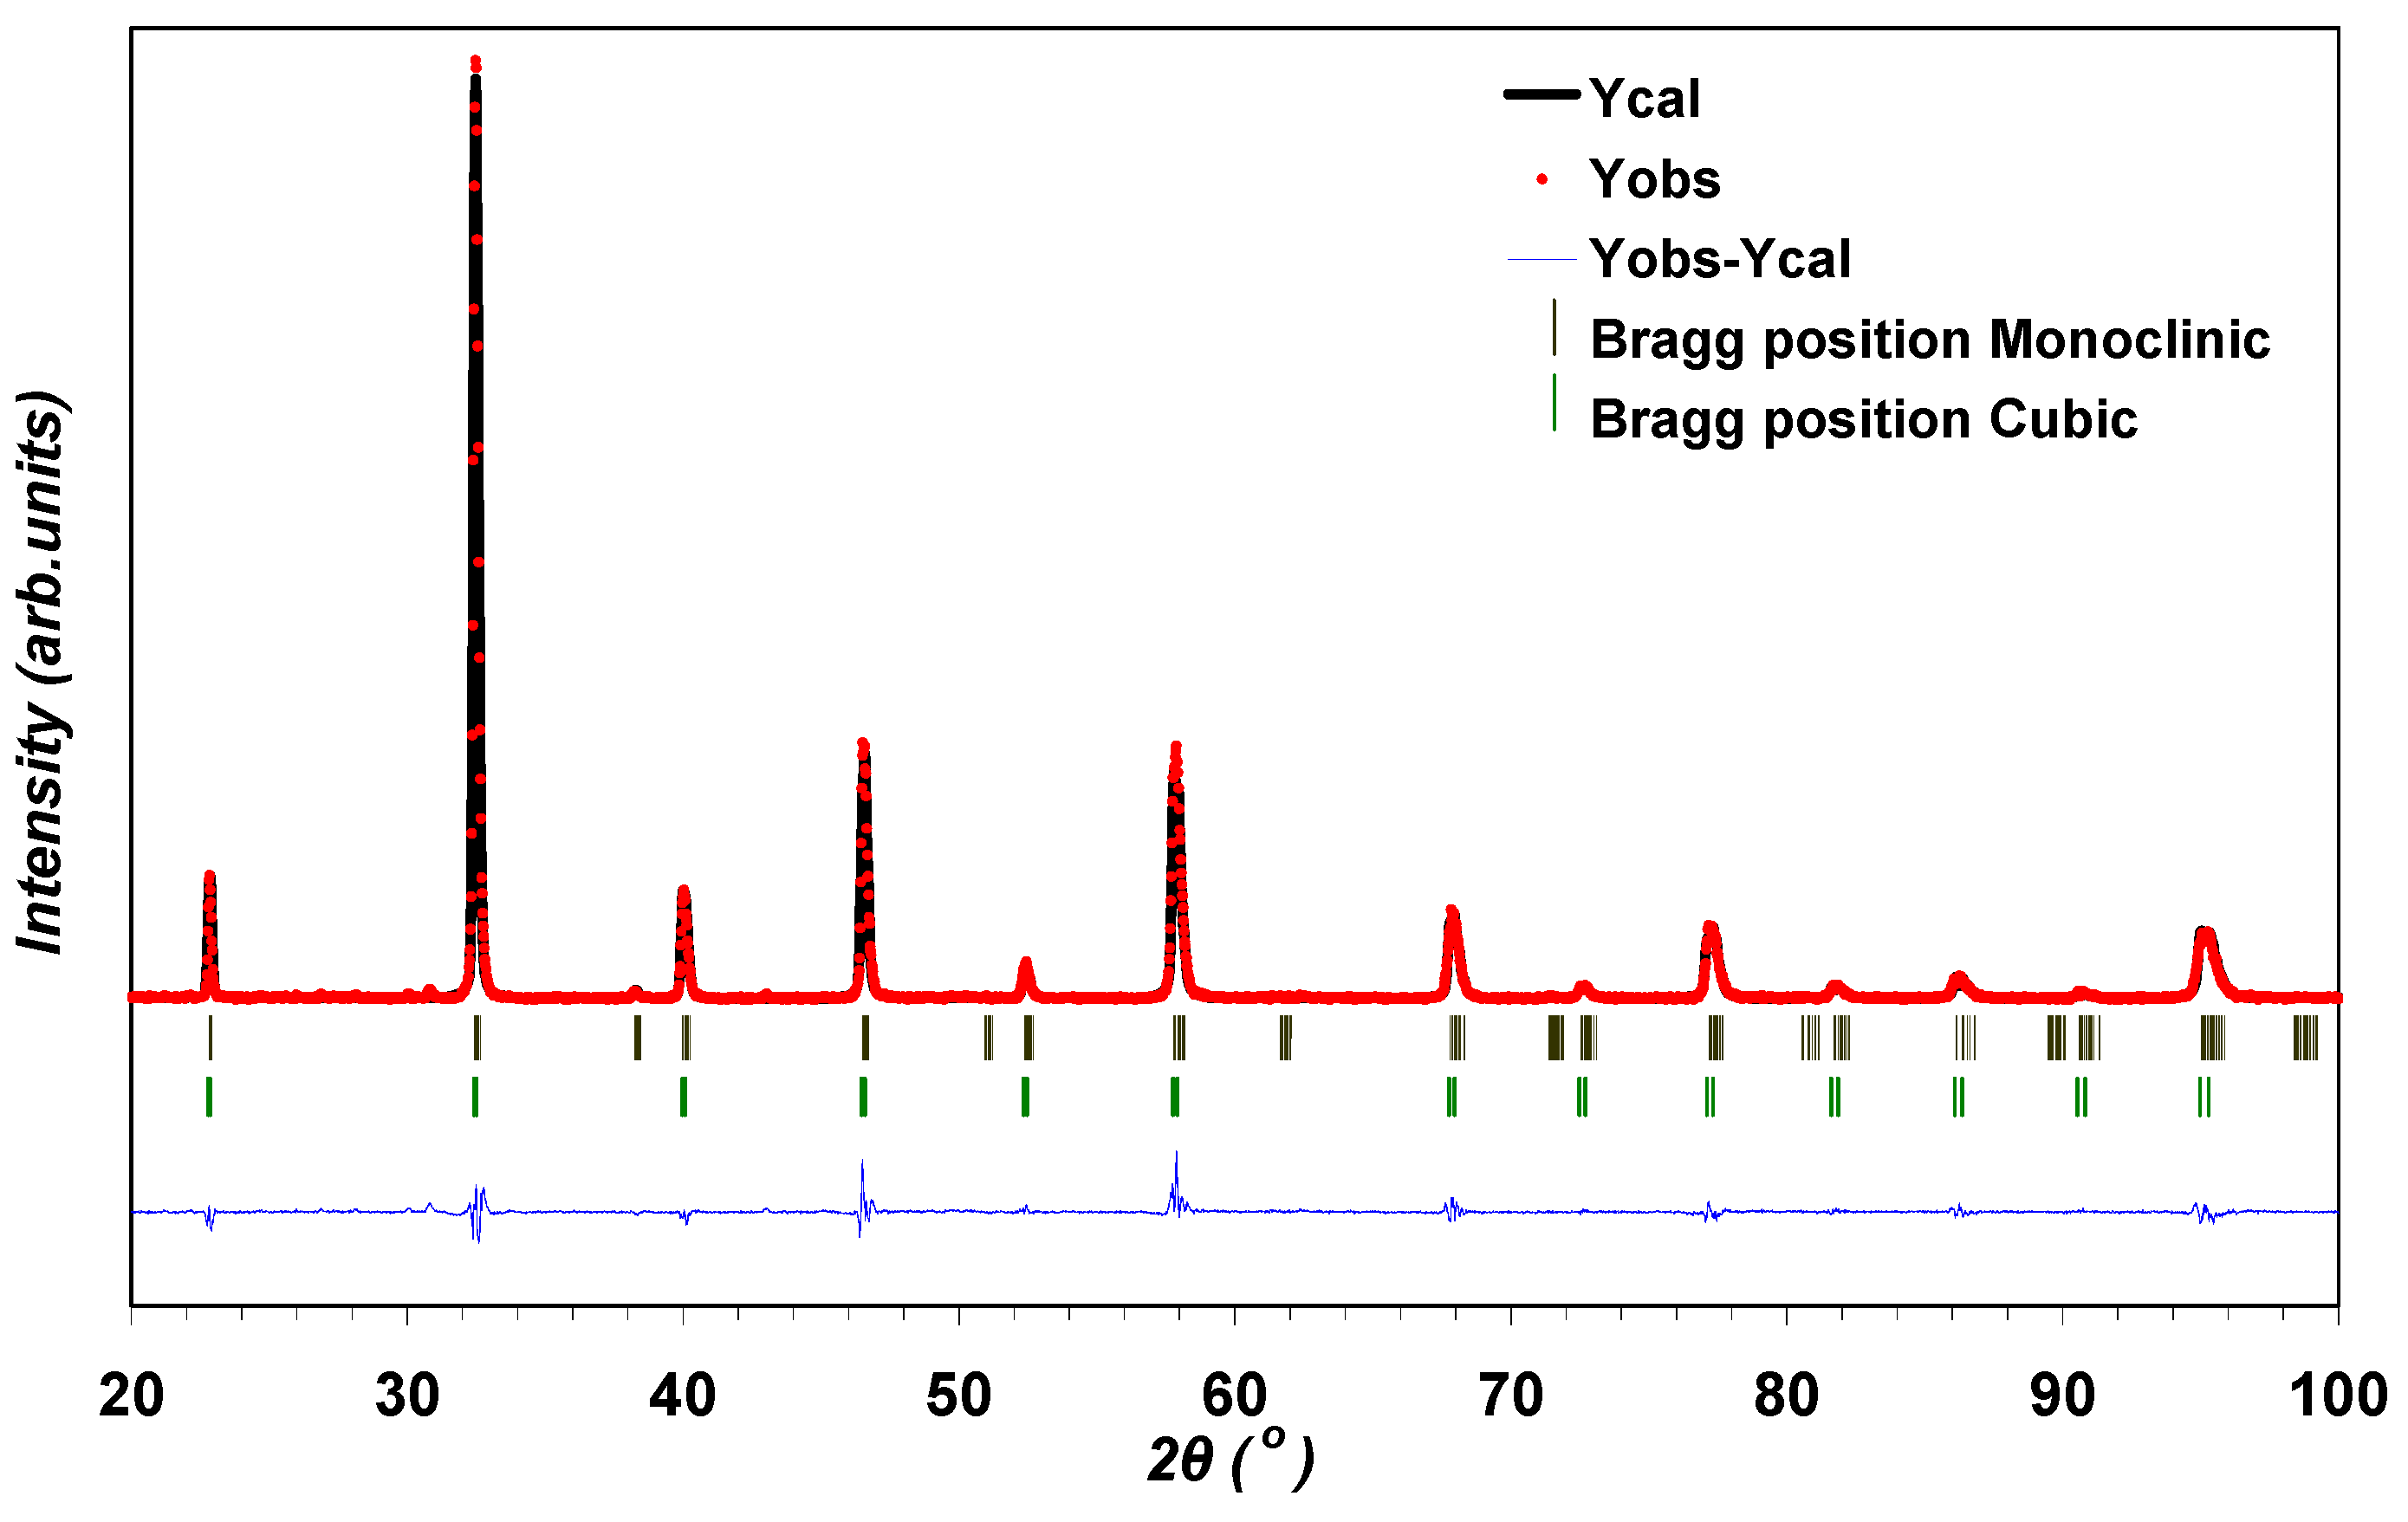
Figure 7.
Visualization of the unit cells for cubic (a) and monoclinic (b) structures of LSGM9182 compound.
Figure 7.
Visualization of the unit cells for cubic (a) and monoclinic (b) structures of LSGM9182 compound.
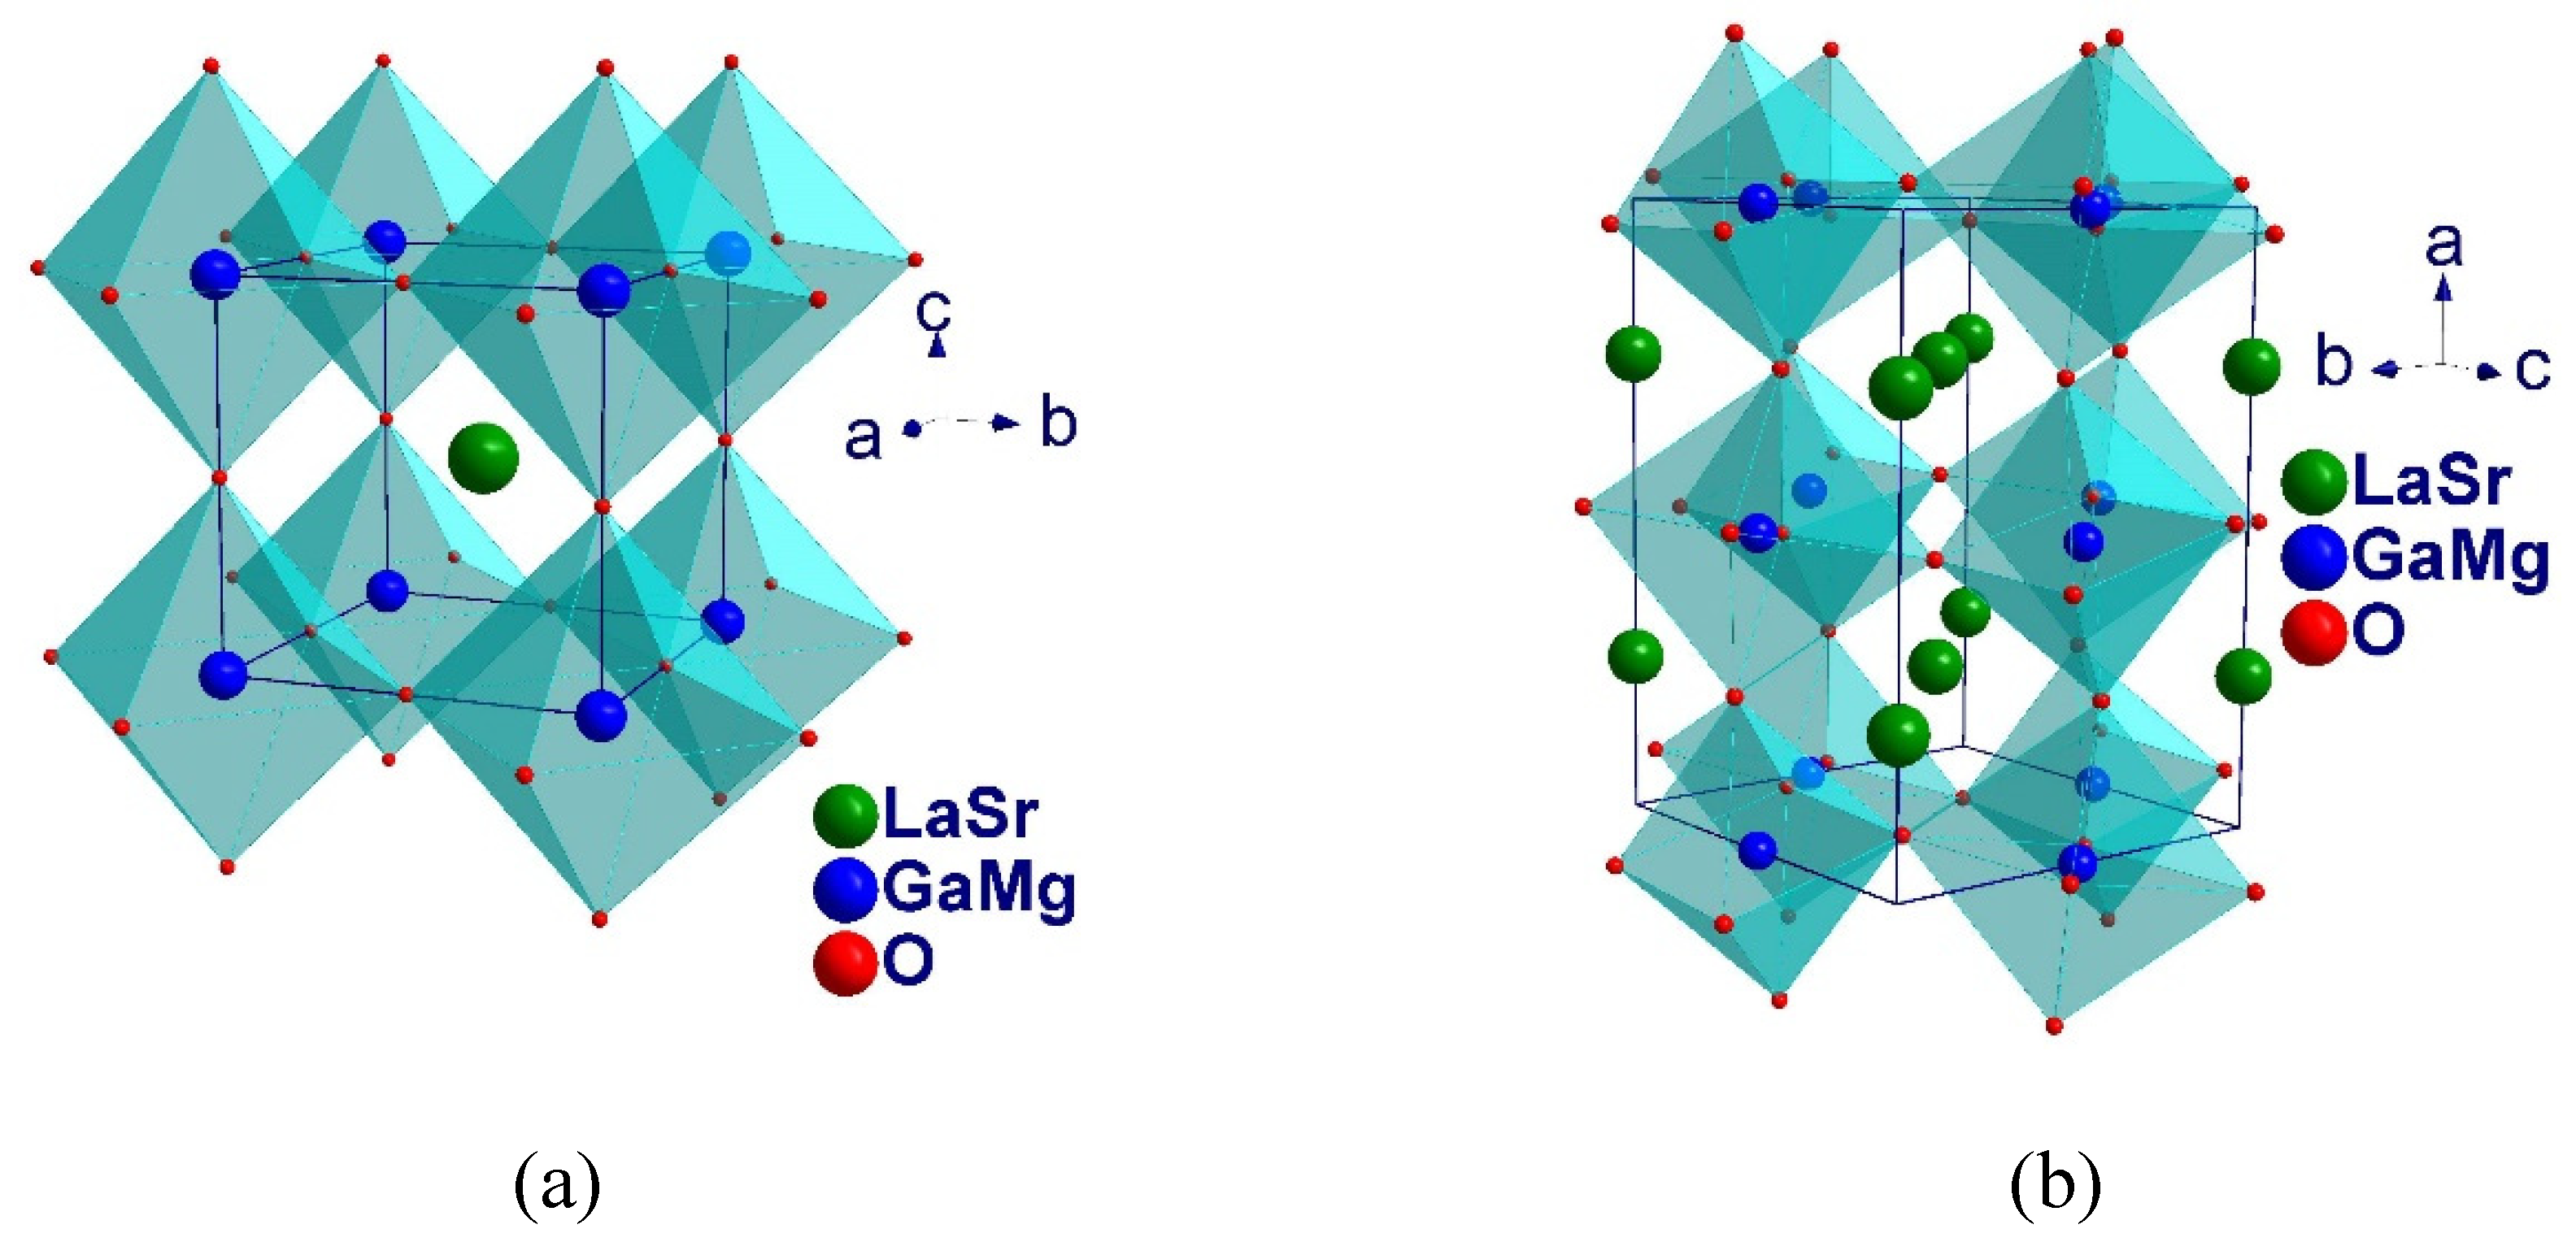
Figure 8.
Schematic representation of the oxygen vacancy sites at the periphery (a) and vertices (b) of the GaO₆ octahedra, along with the potential movements of oxygen ions in the cubic unit cell of LSGM.
Figure 8.
Schematic representation of the oxygen vacancy sites at the periphery (a) and vertices (b) of the GaO₆ octahedra, along with the potential movements of oxygen ions in the cubic unit cell of LSGM.
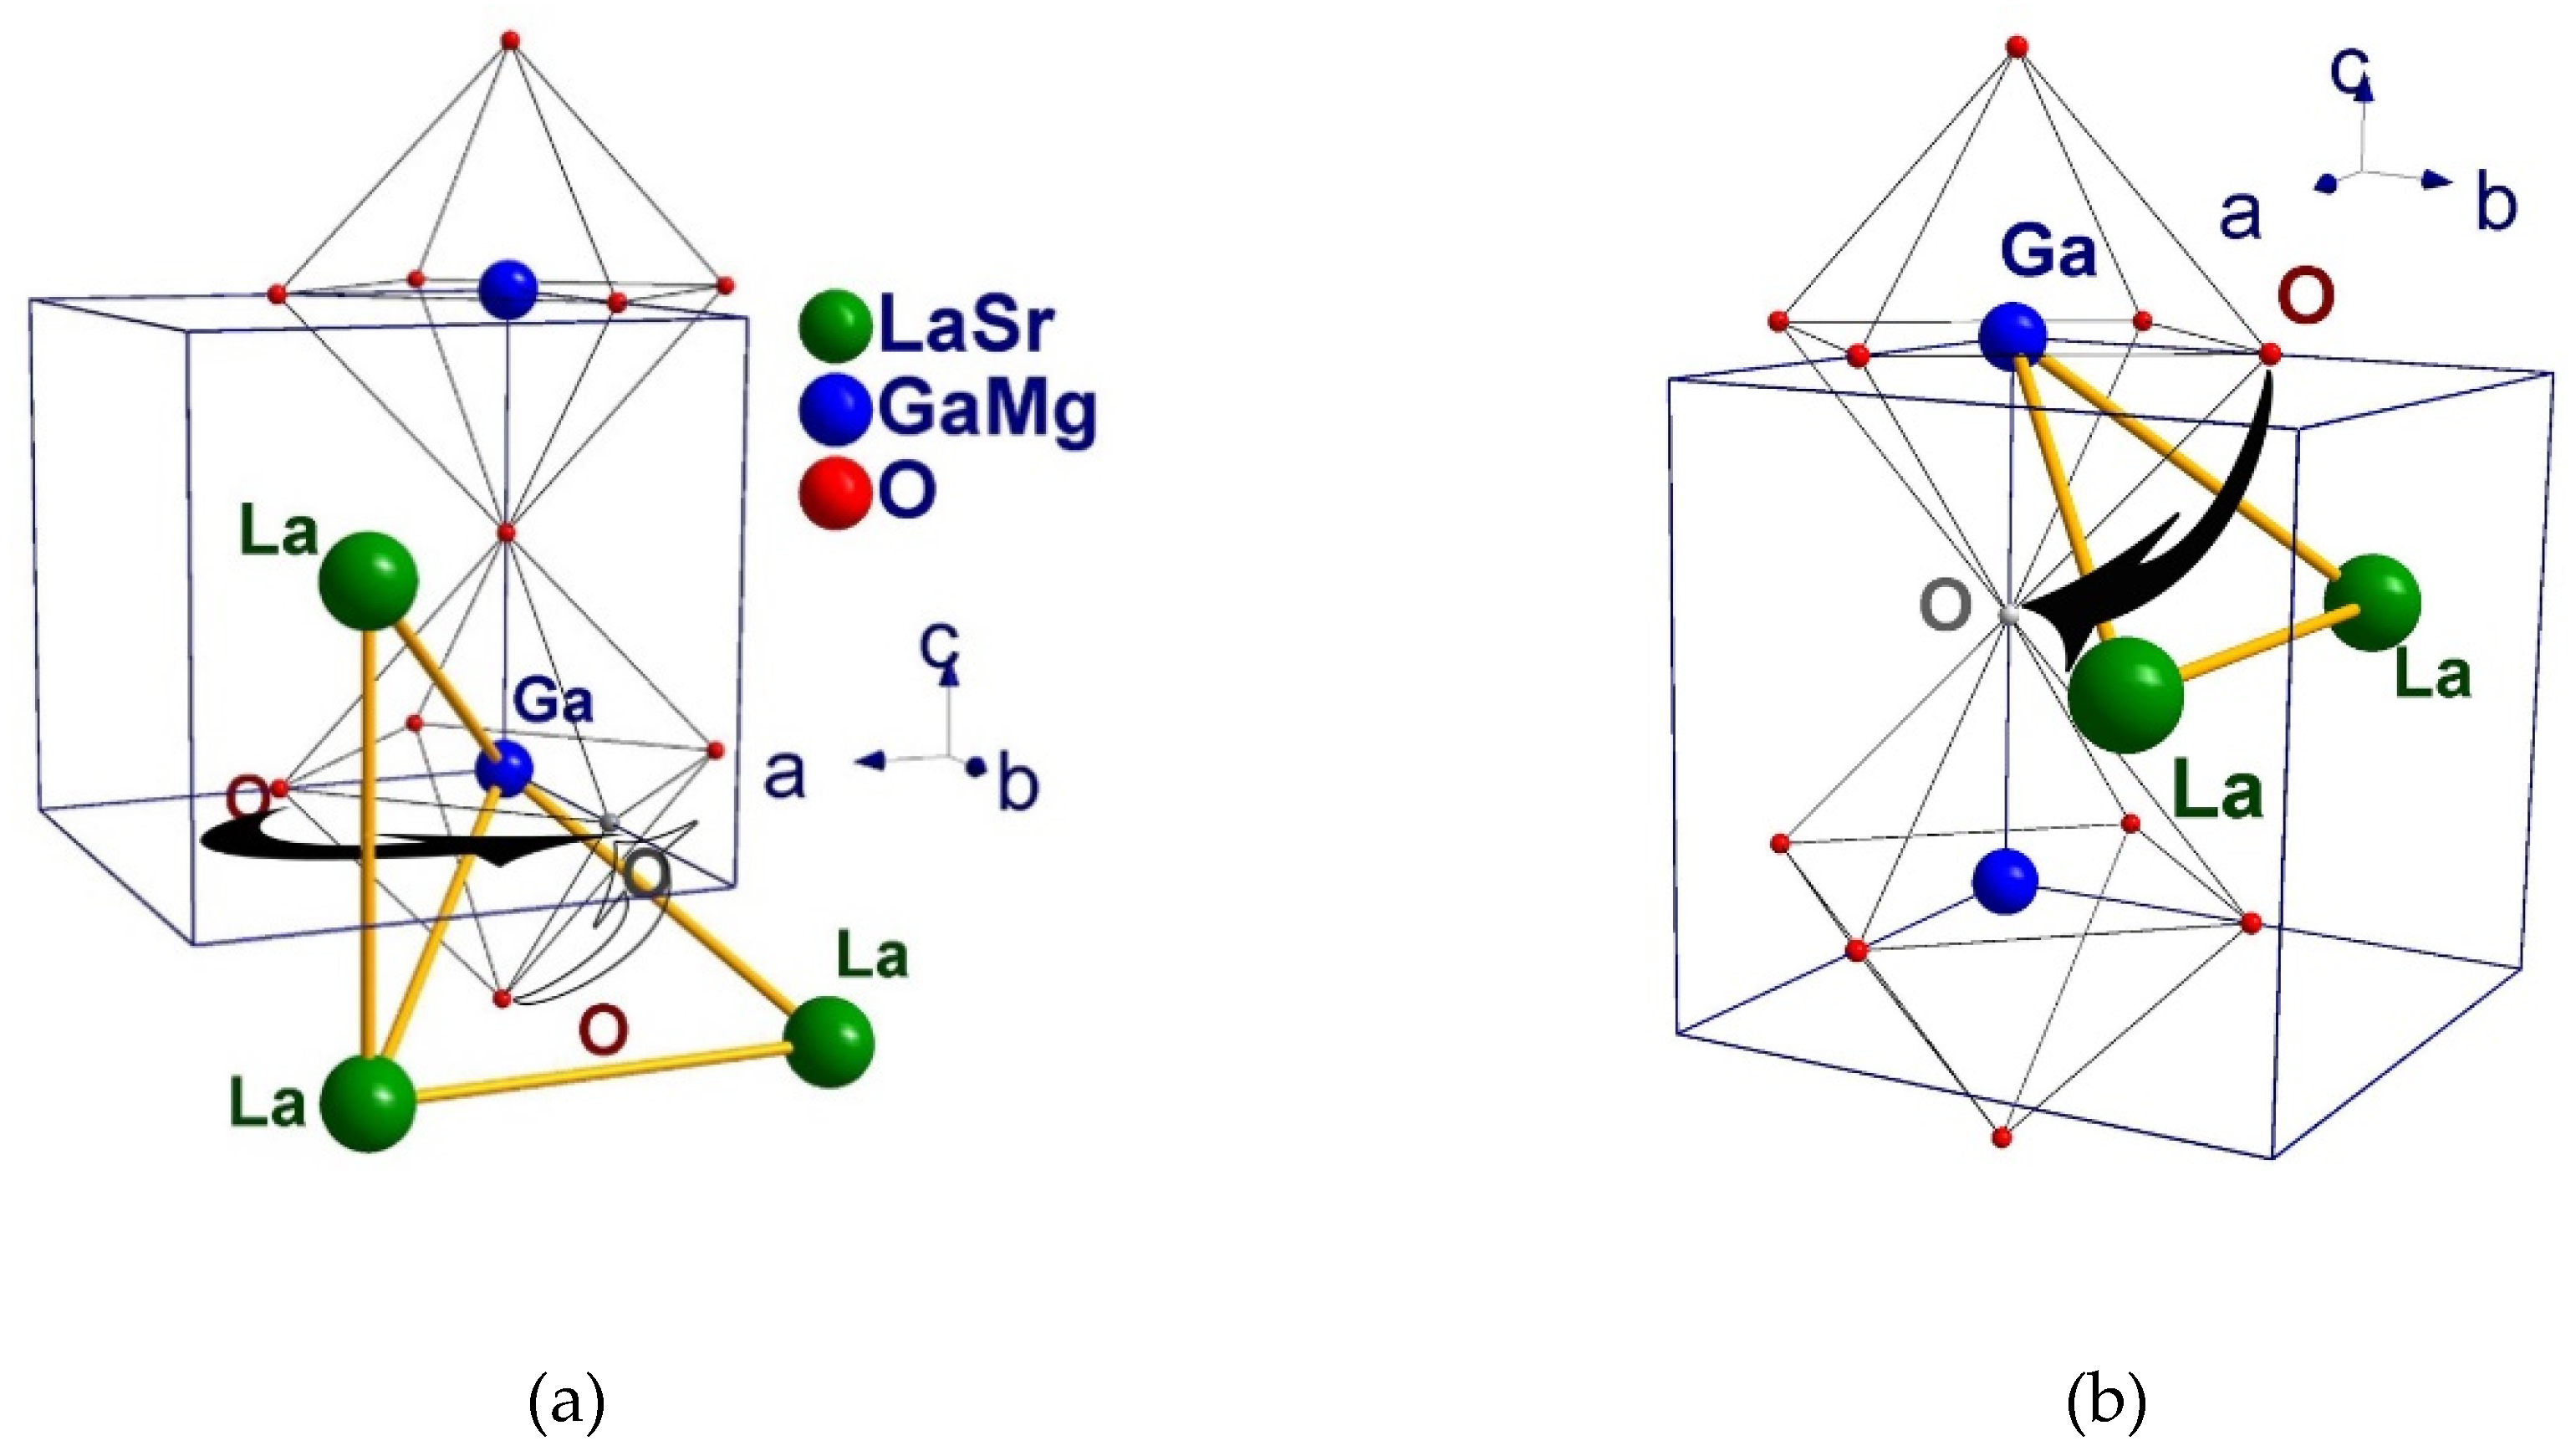
Figure 9.
Schematic representation of the oxygen vacancy sites at the periphery (a) and vertices (b) of the GaO₆ octahedra, along with the potential movements of oxygen ions in the monoclinic unit cell of LSGM.
Figure 9.
Schematic representation of the oxygen vacancy sites at the periphery (a) and vertices (b) of the GaO₆ octahedra, along with the potential movements of oxygen ions in the monoclinic unit cell of LSGM.
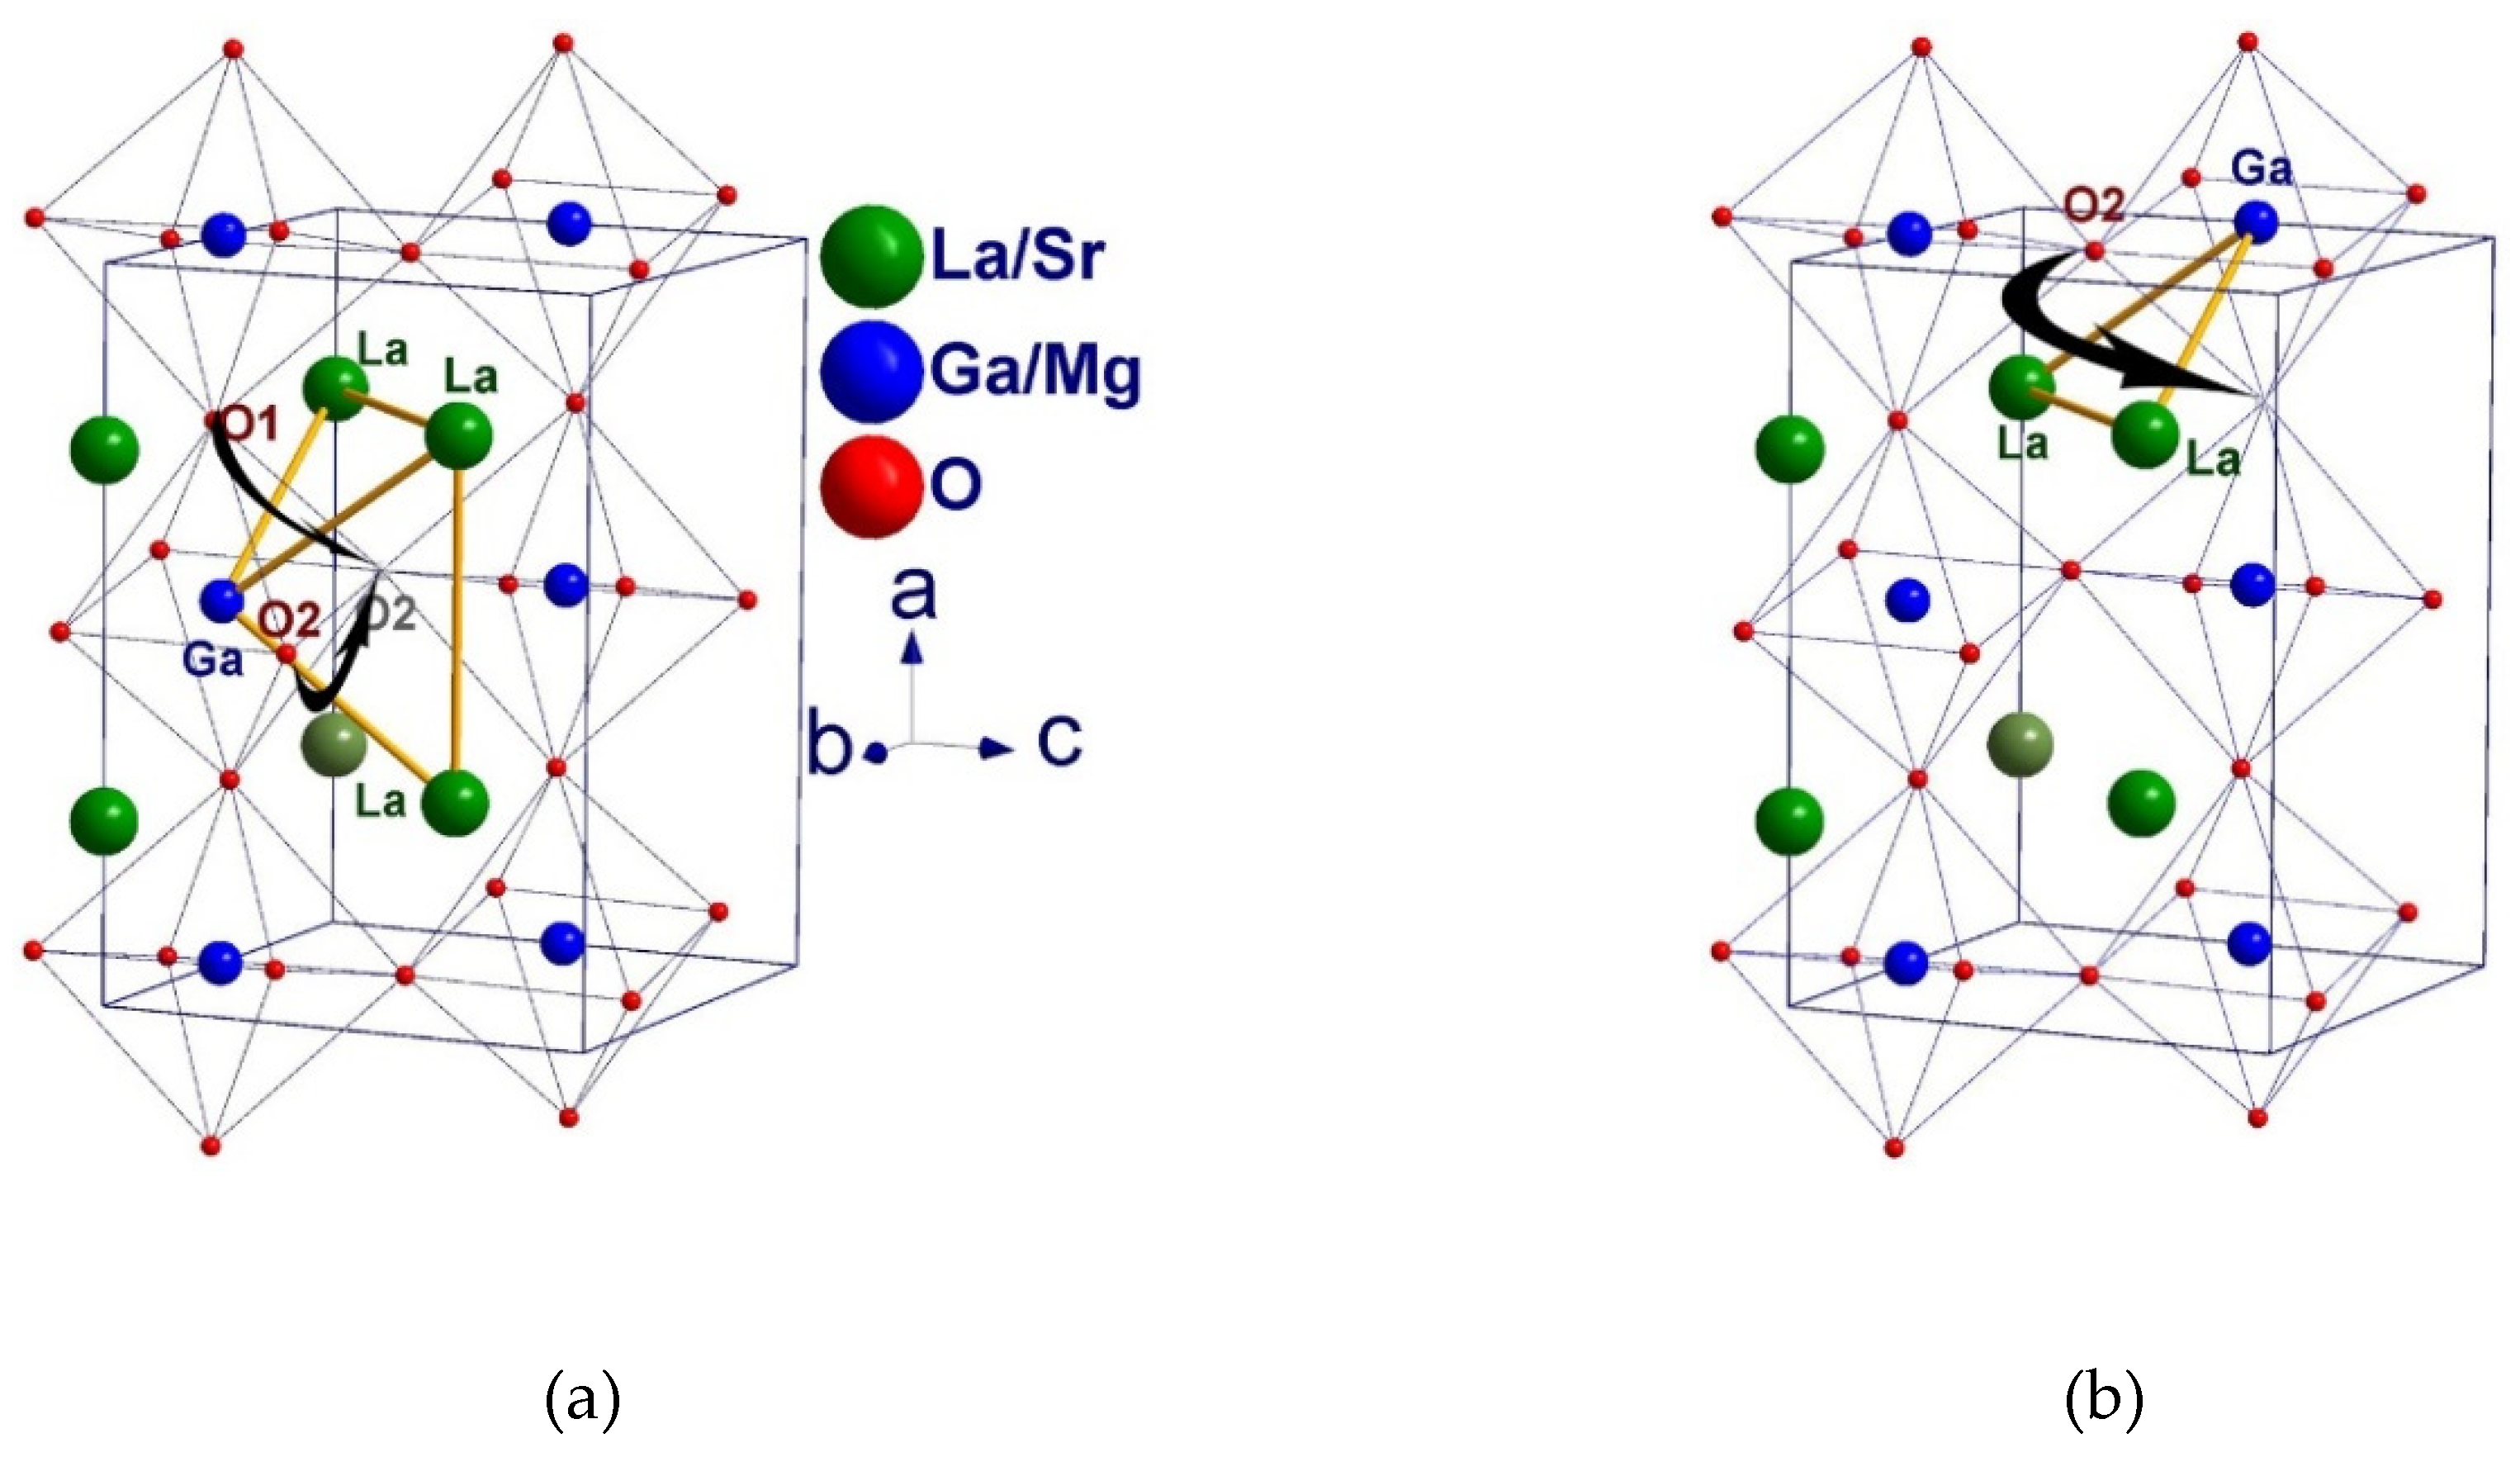
Figure 10.
Geometric calculation of the critical radius rc [65].
Figure 10.
Geometric calculation of the critical radius rc [65].
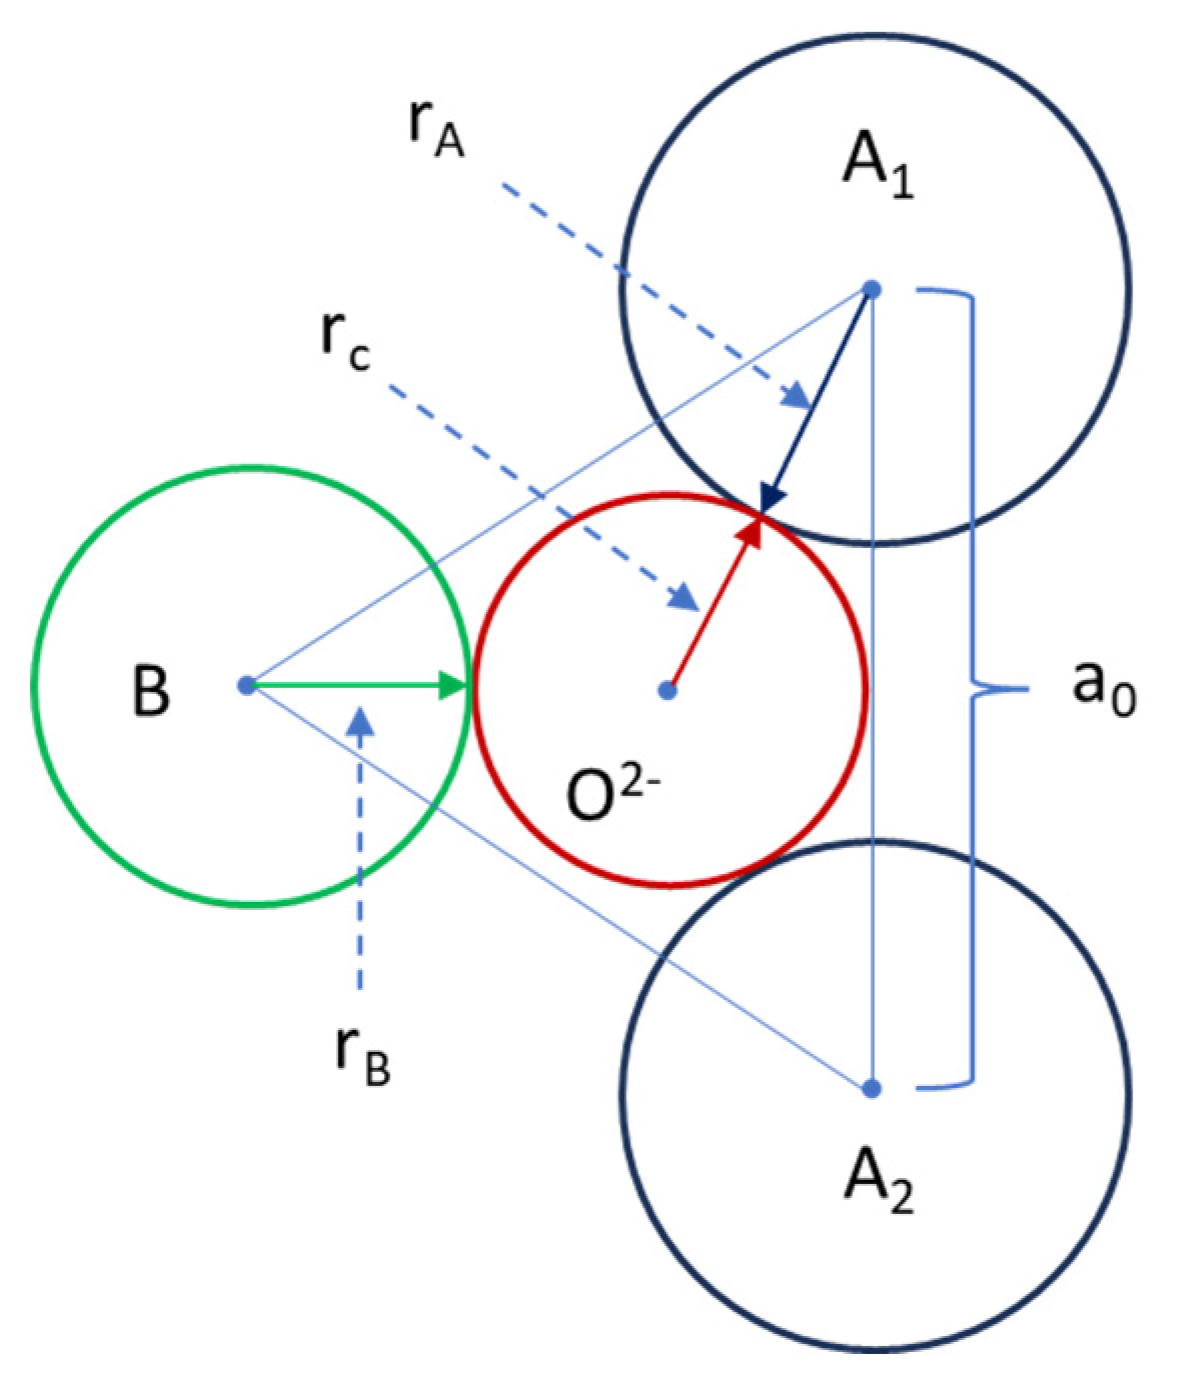
Figure 11.
FTIR spectra of LSGM precursors dried at 150 or 200oC.
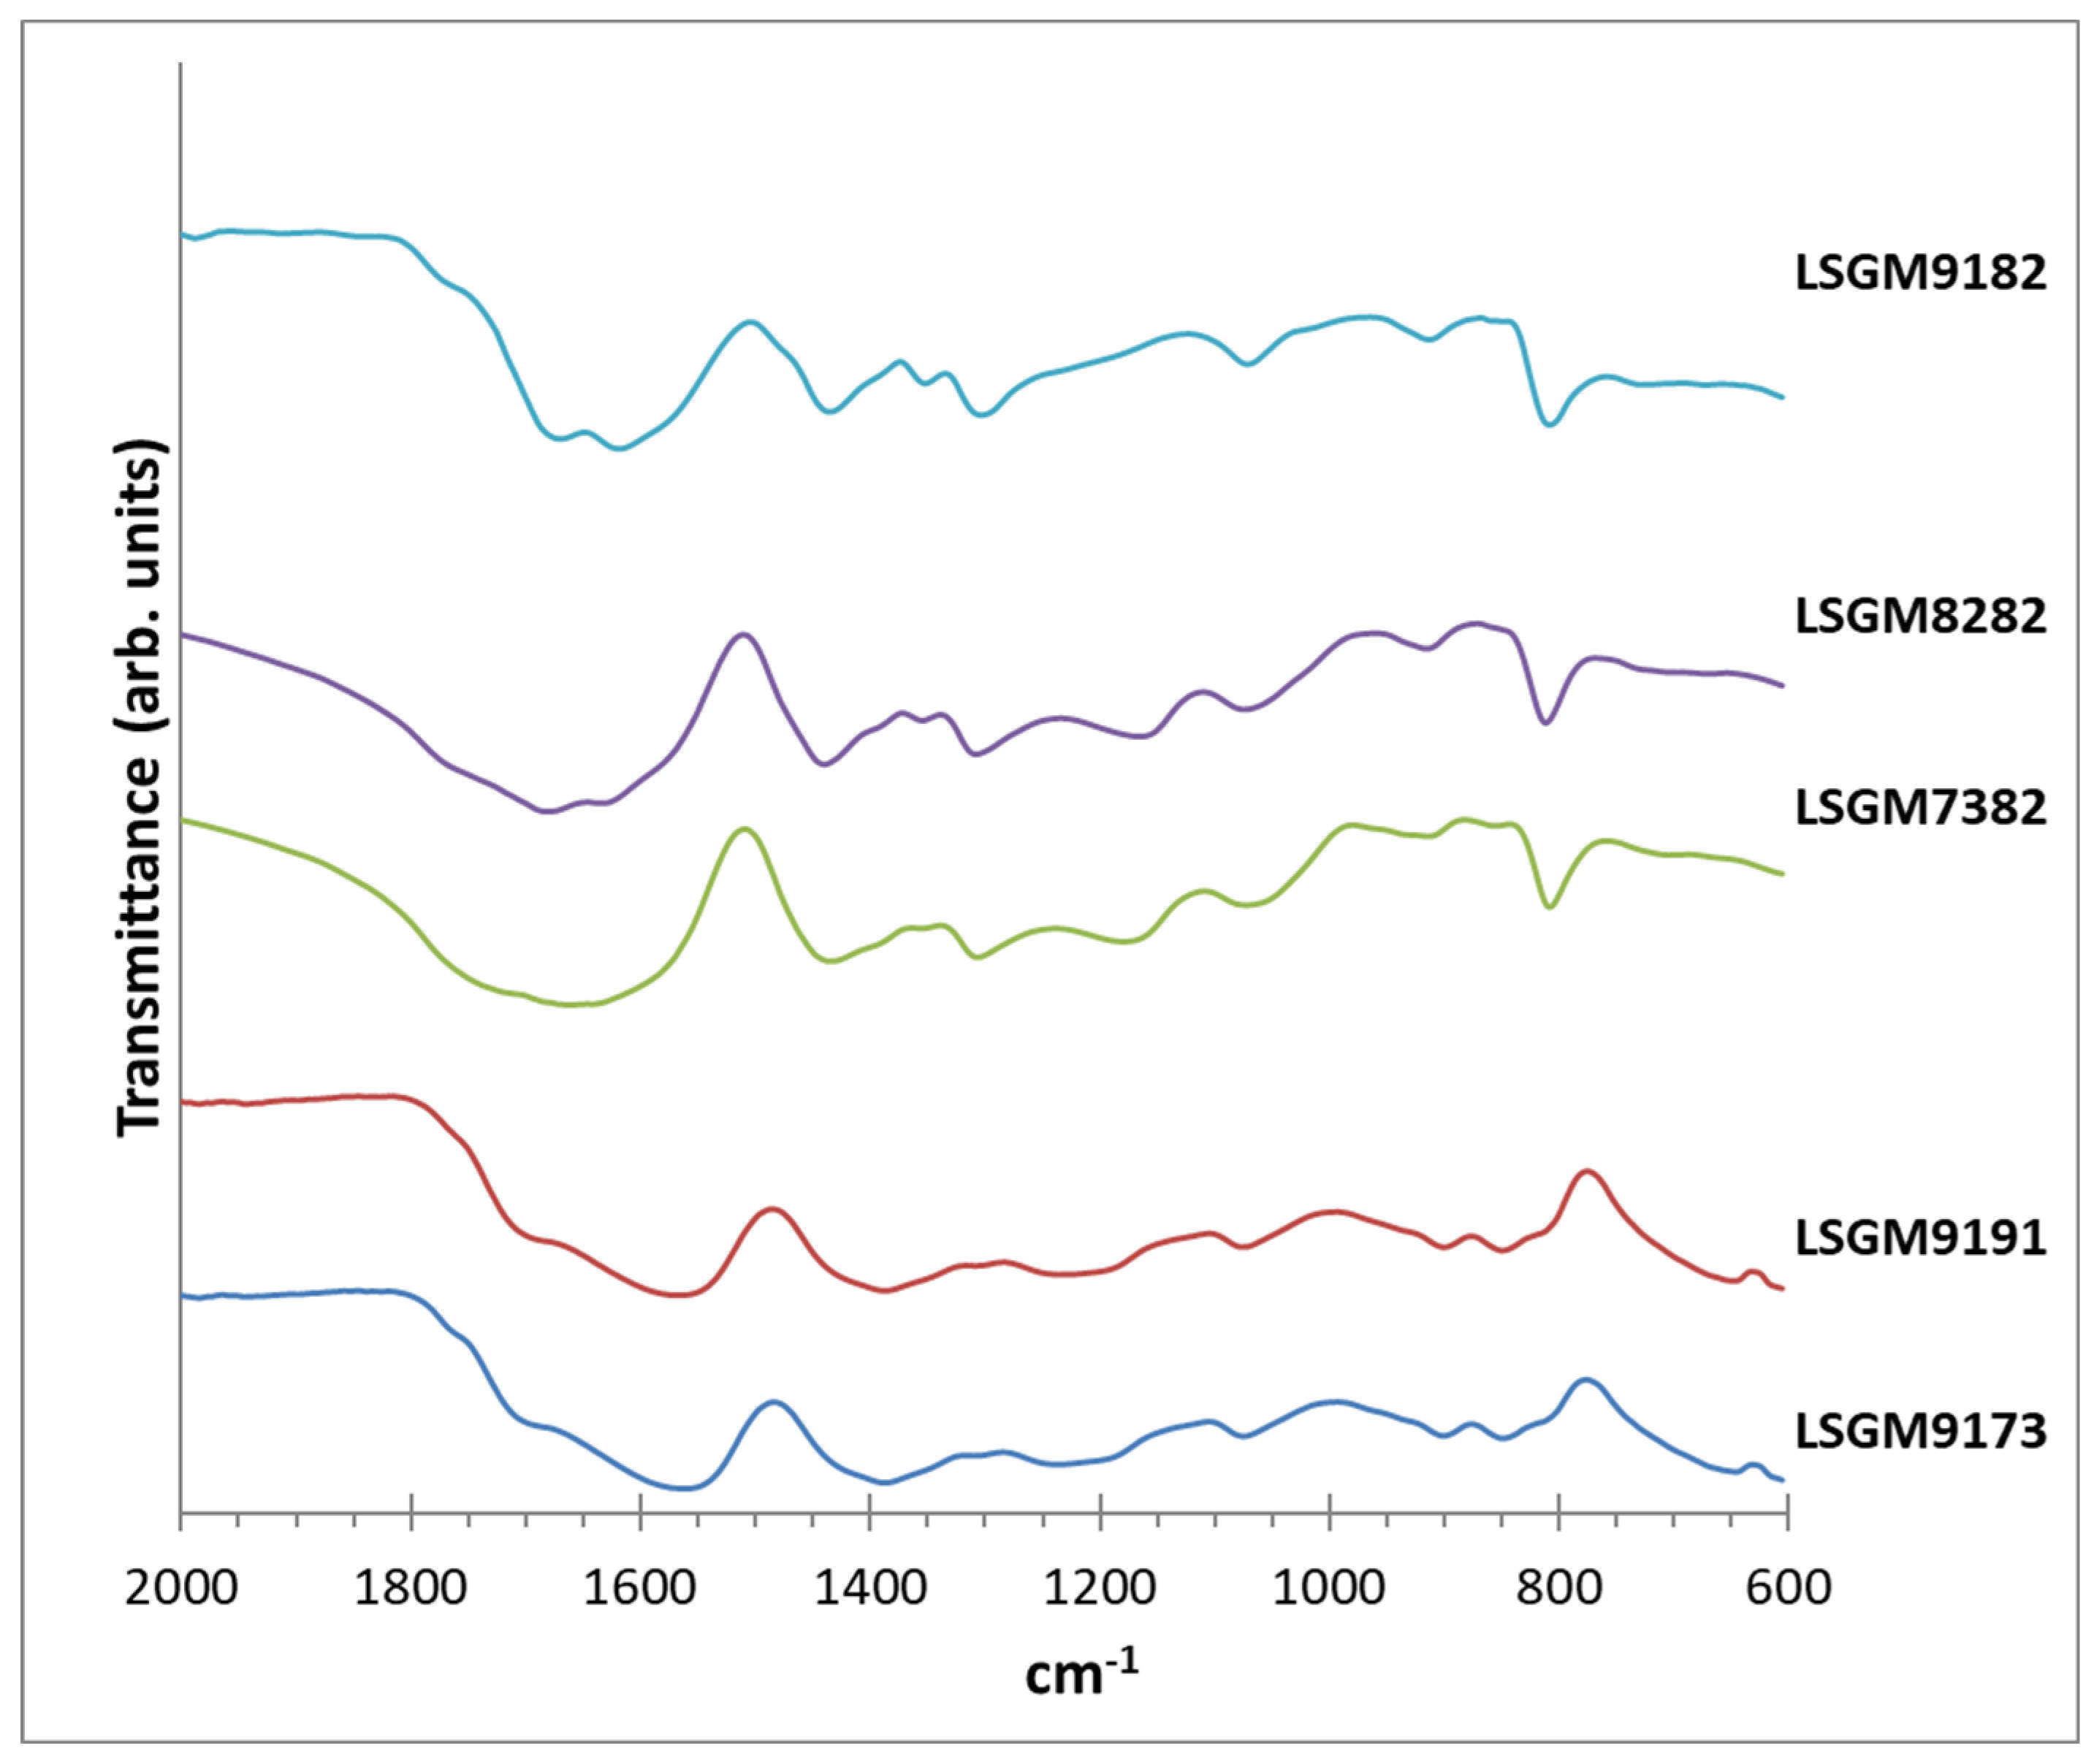
Figure 12.
FTIR spectra of LSGM9182 compound calcined at various temperatures.
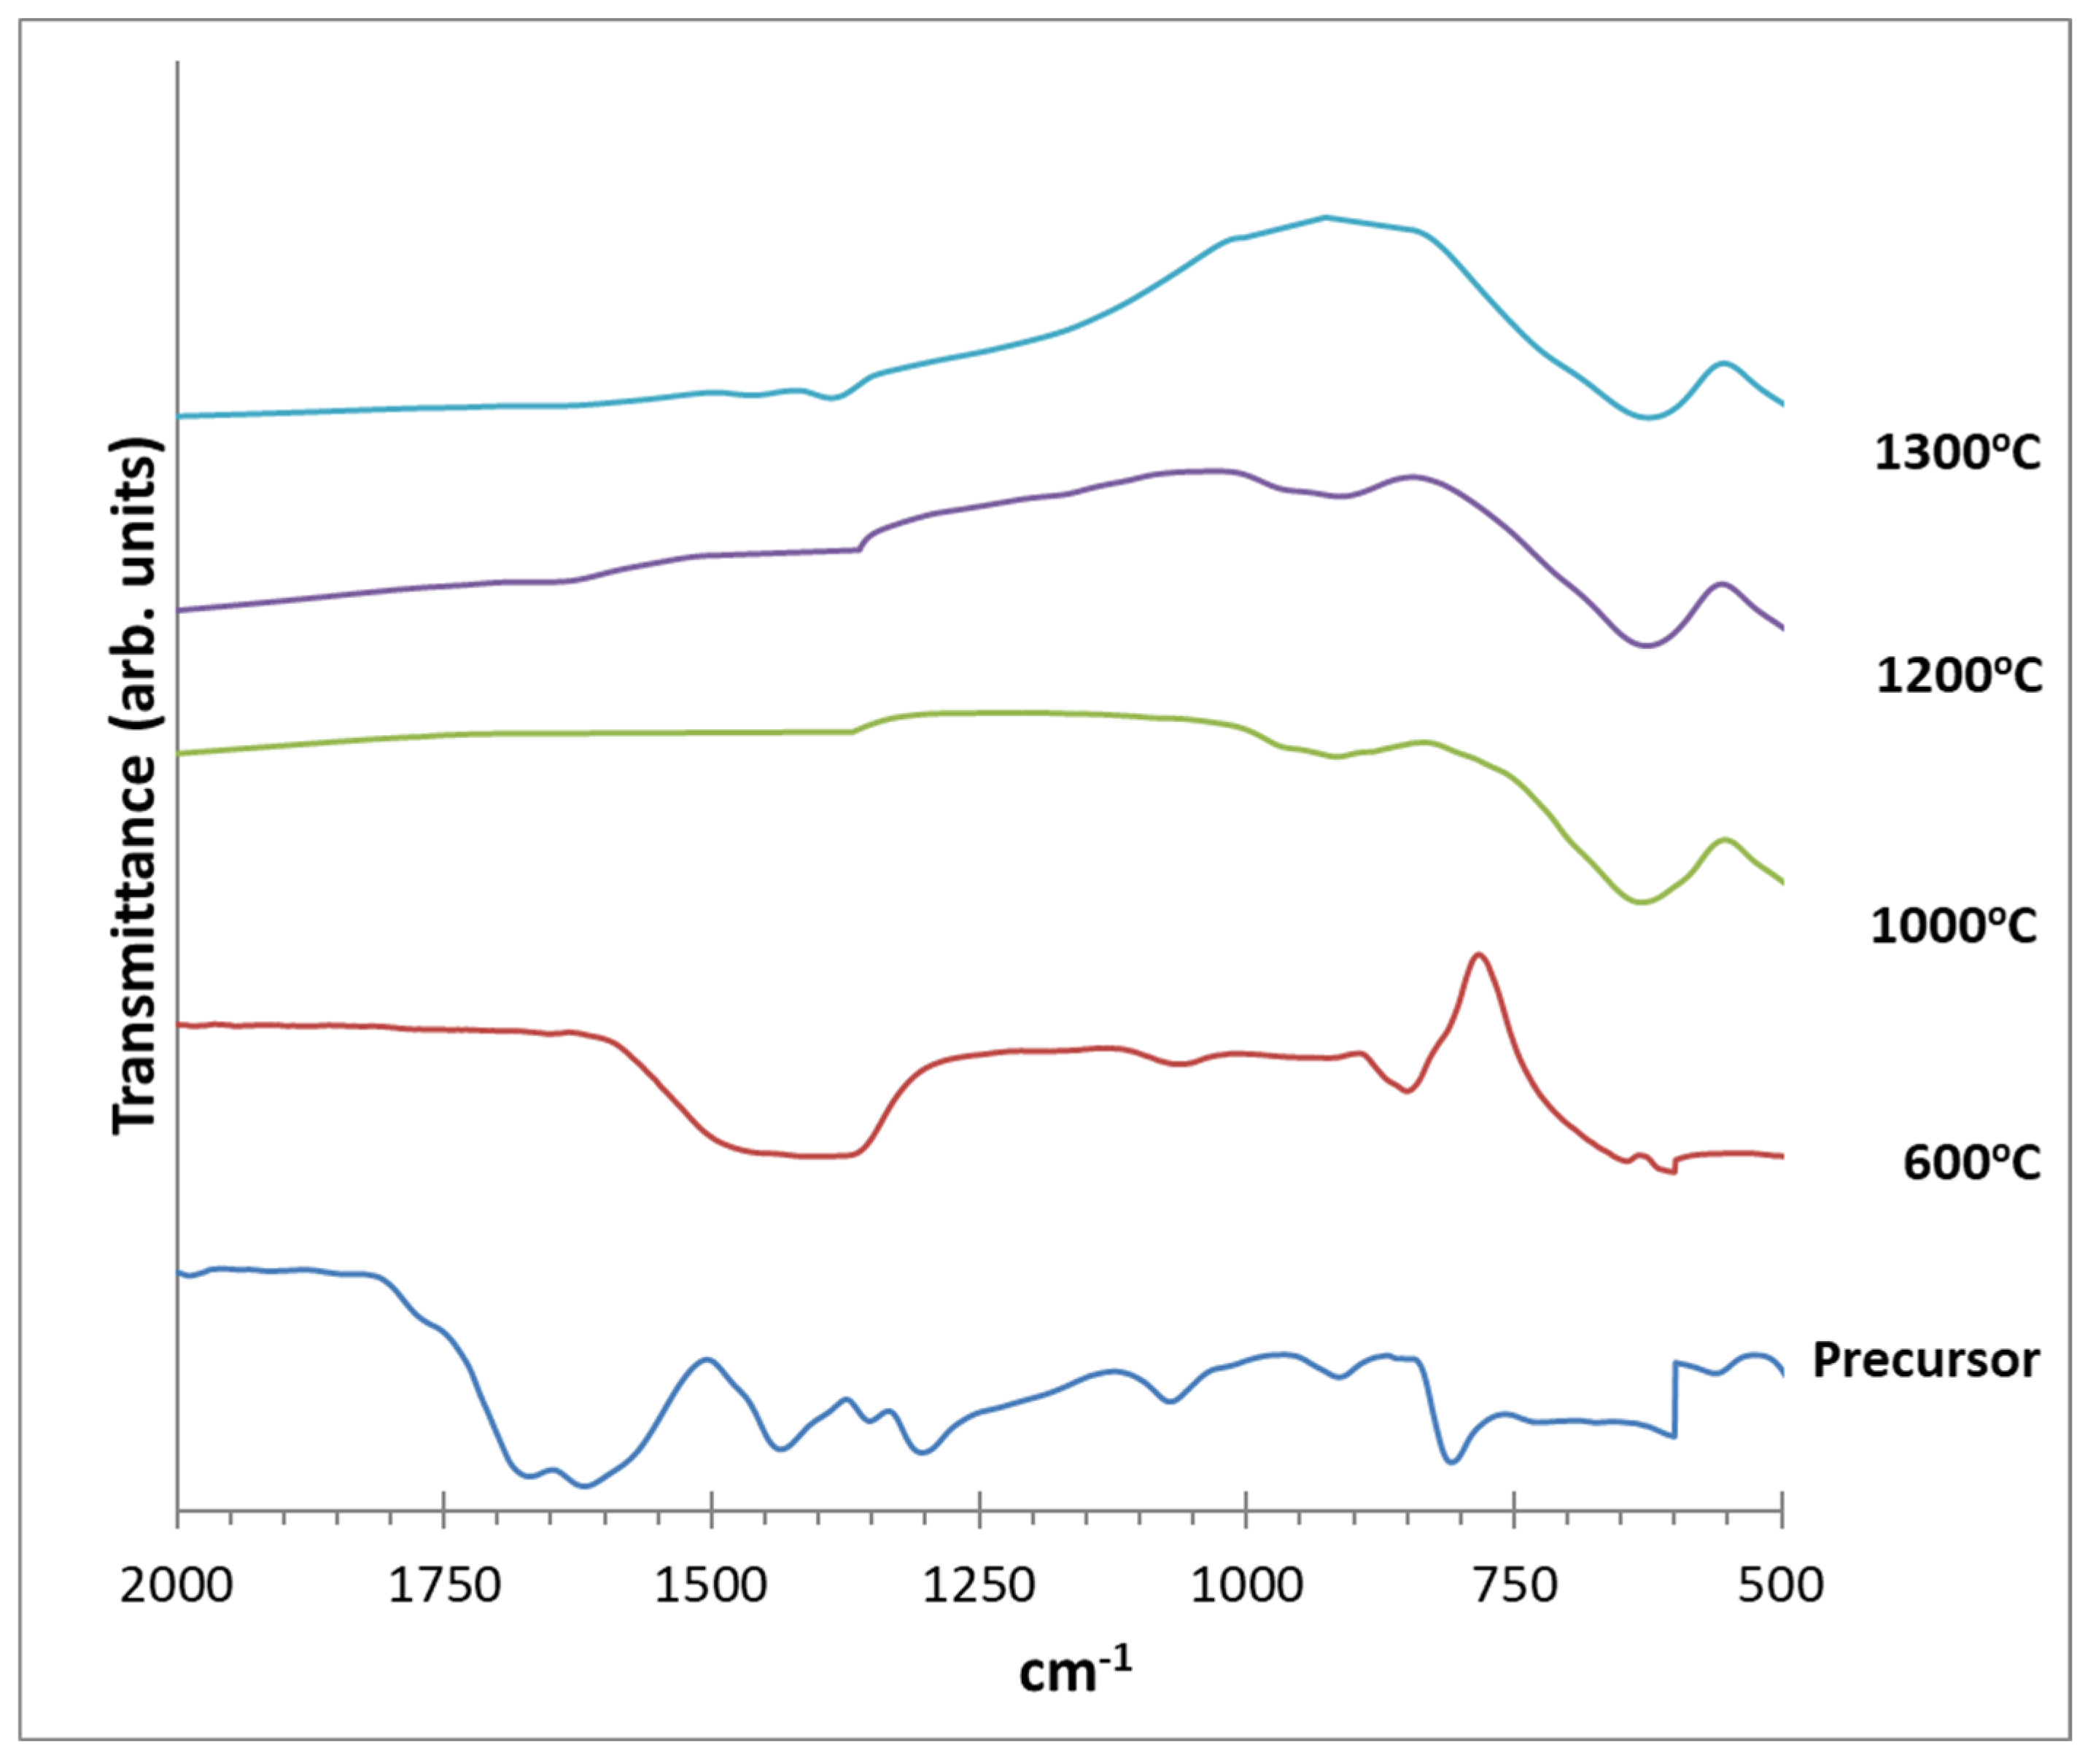
Figure 13.
SEM micrographs of the LSGM final products calcined at 1300oC.
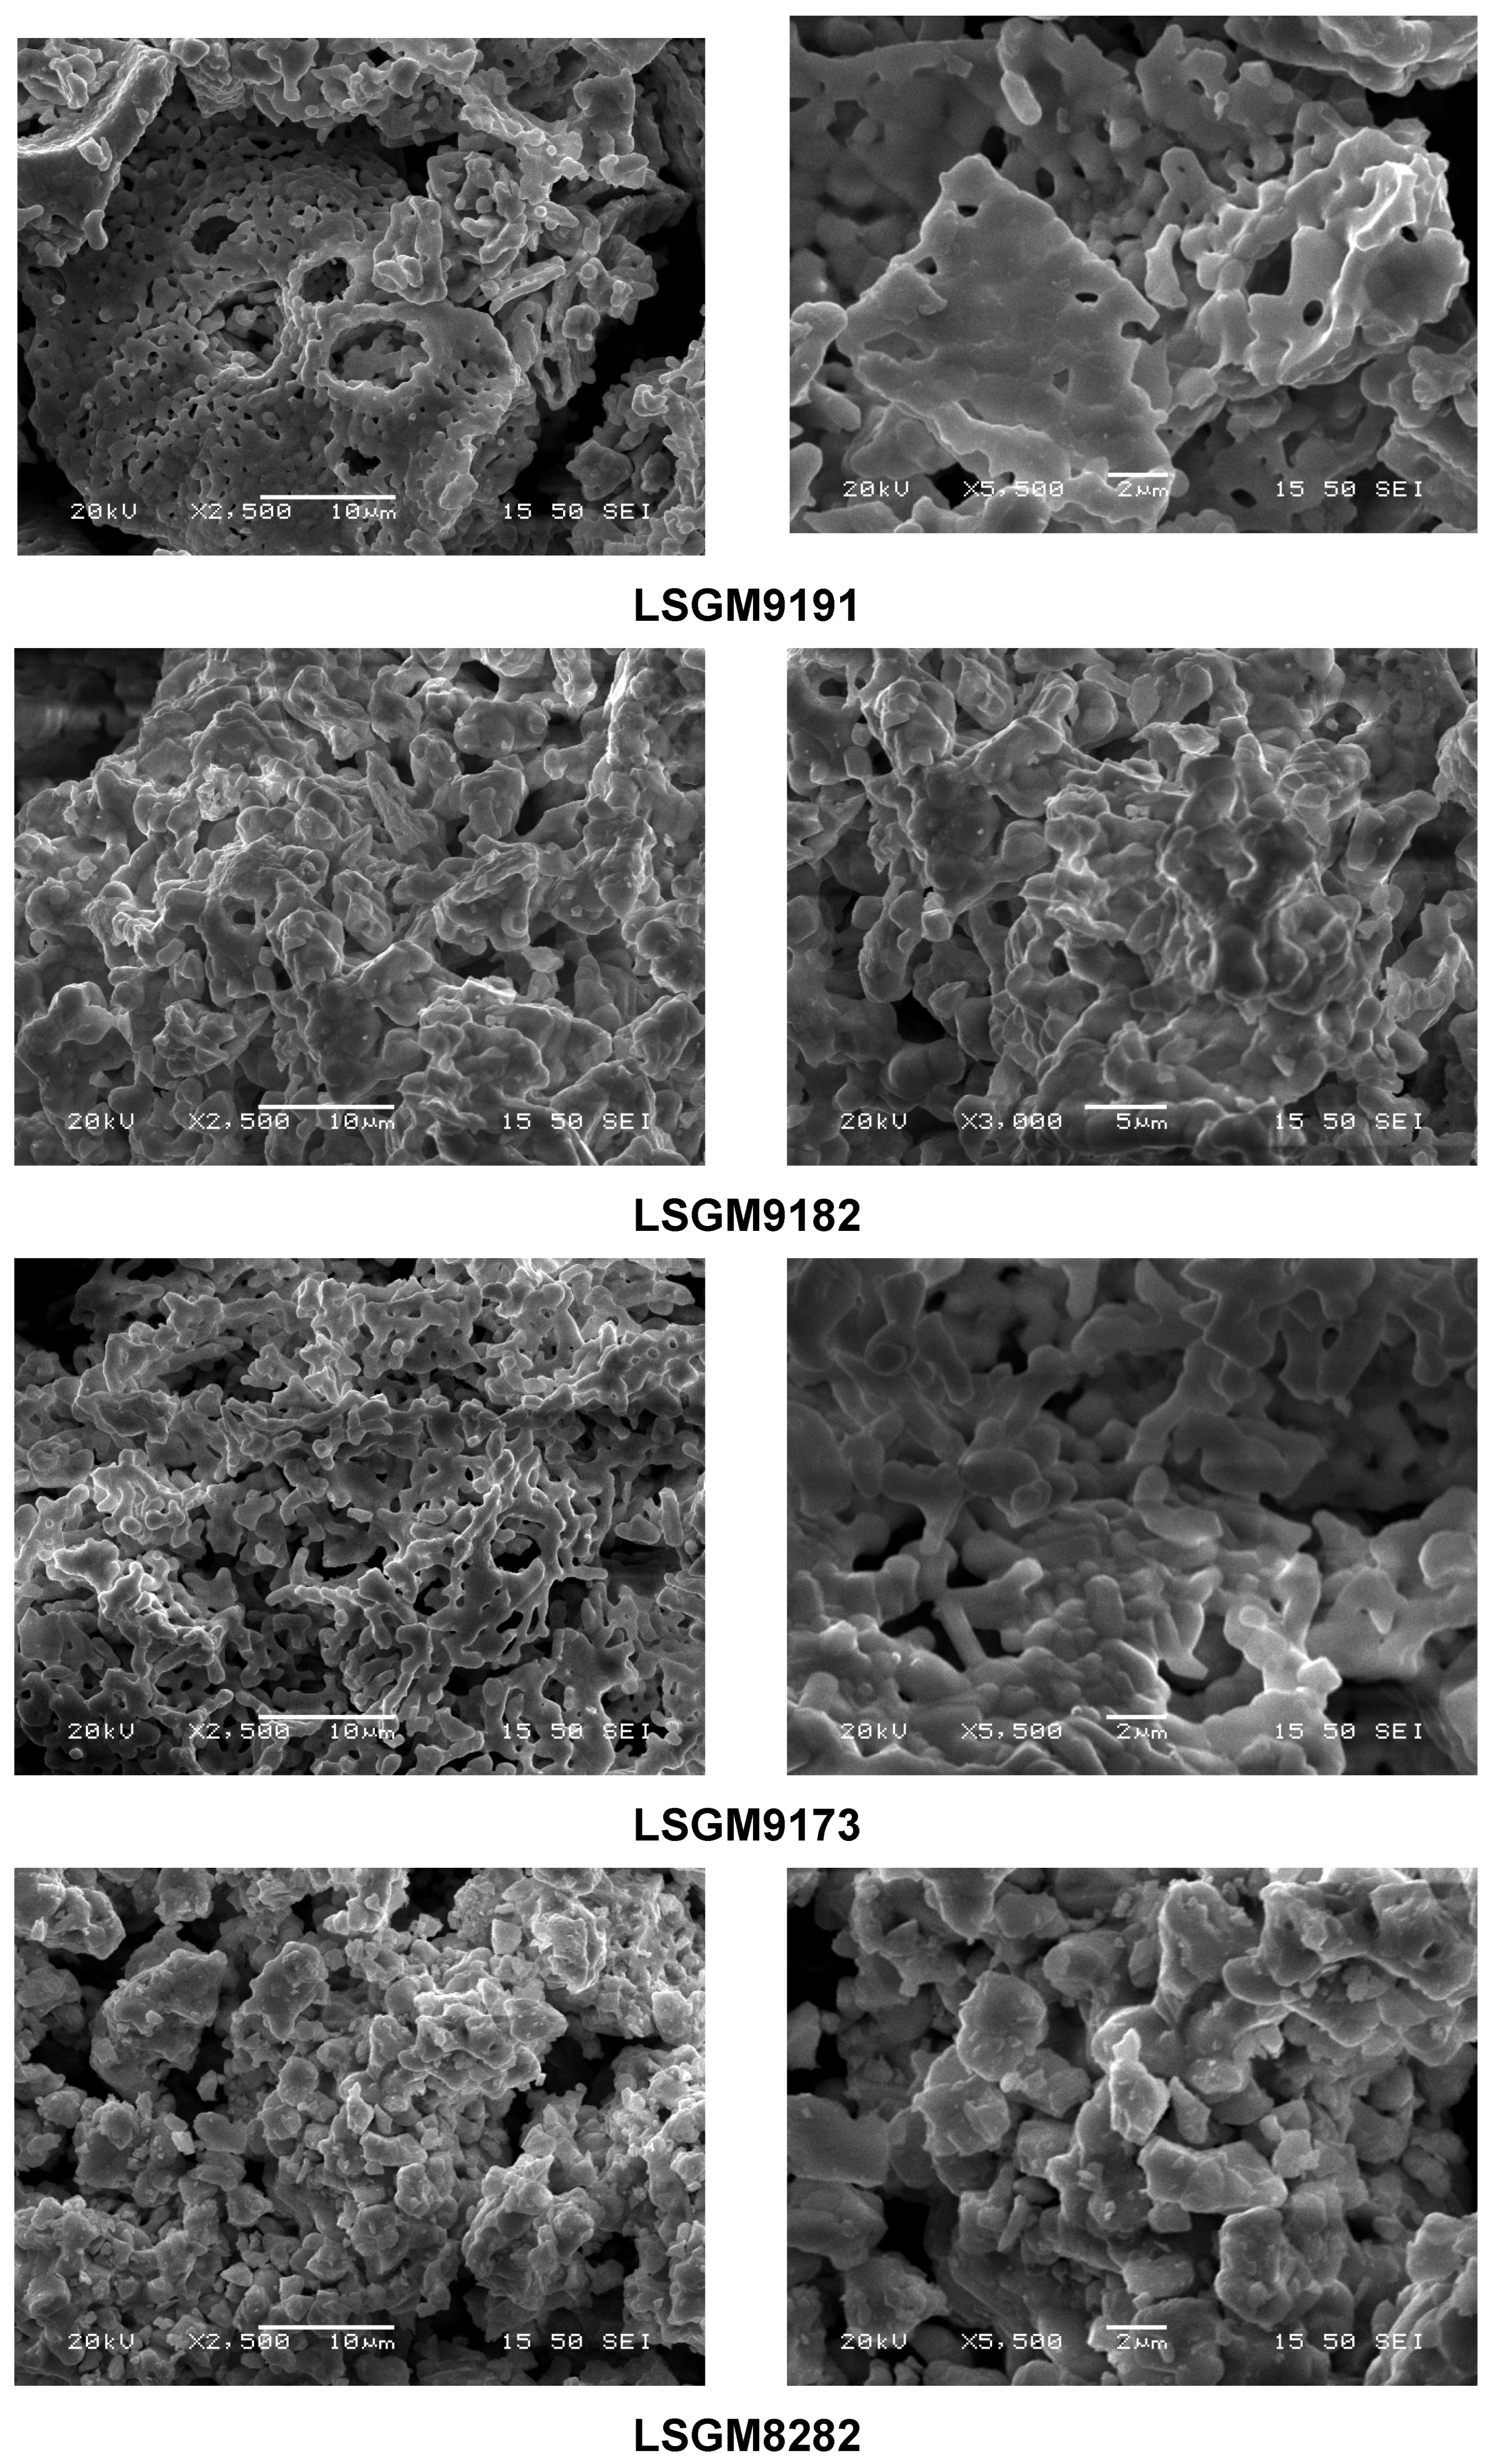
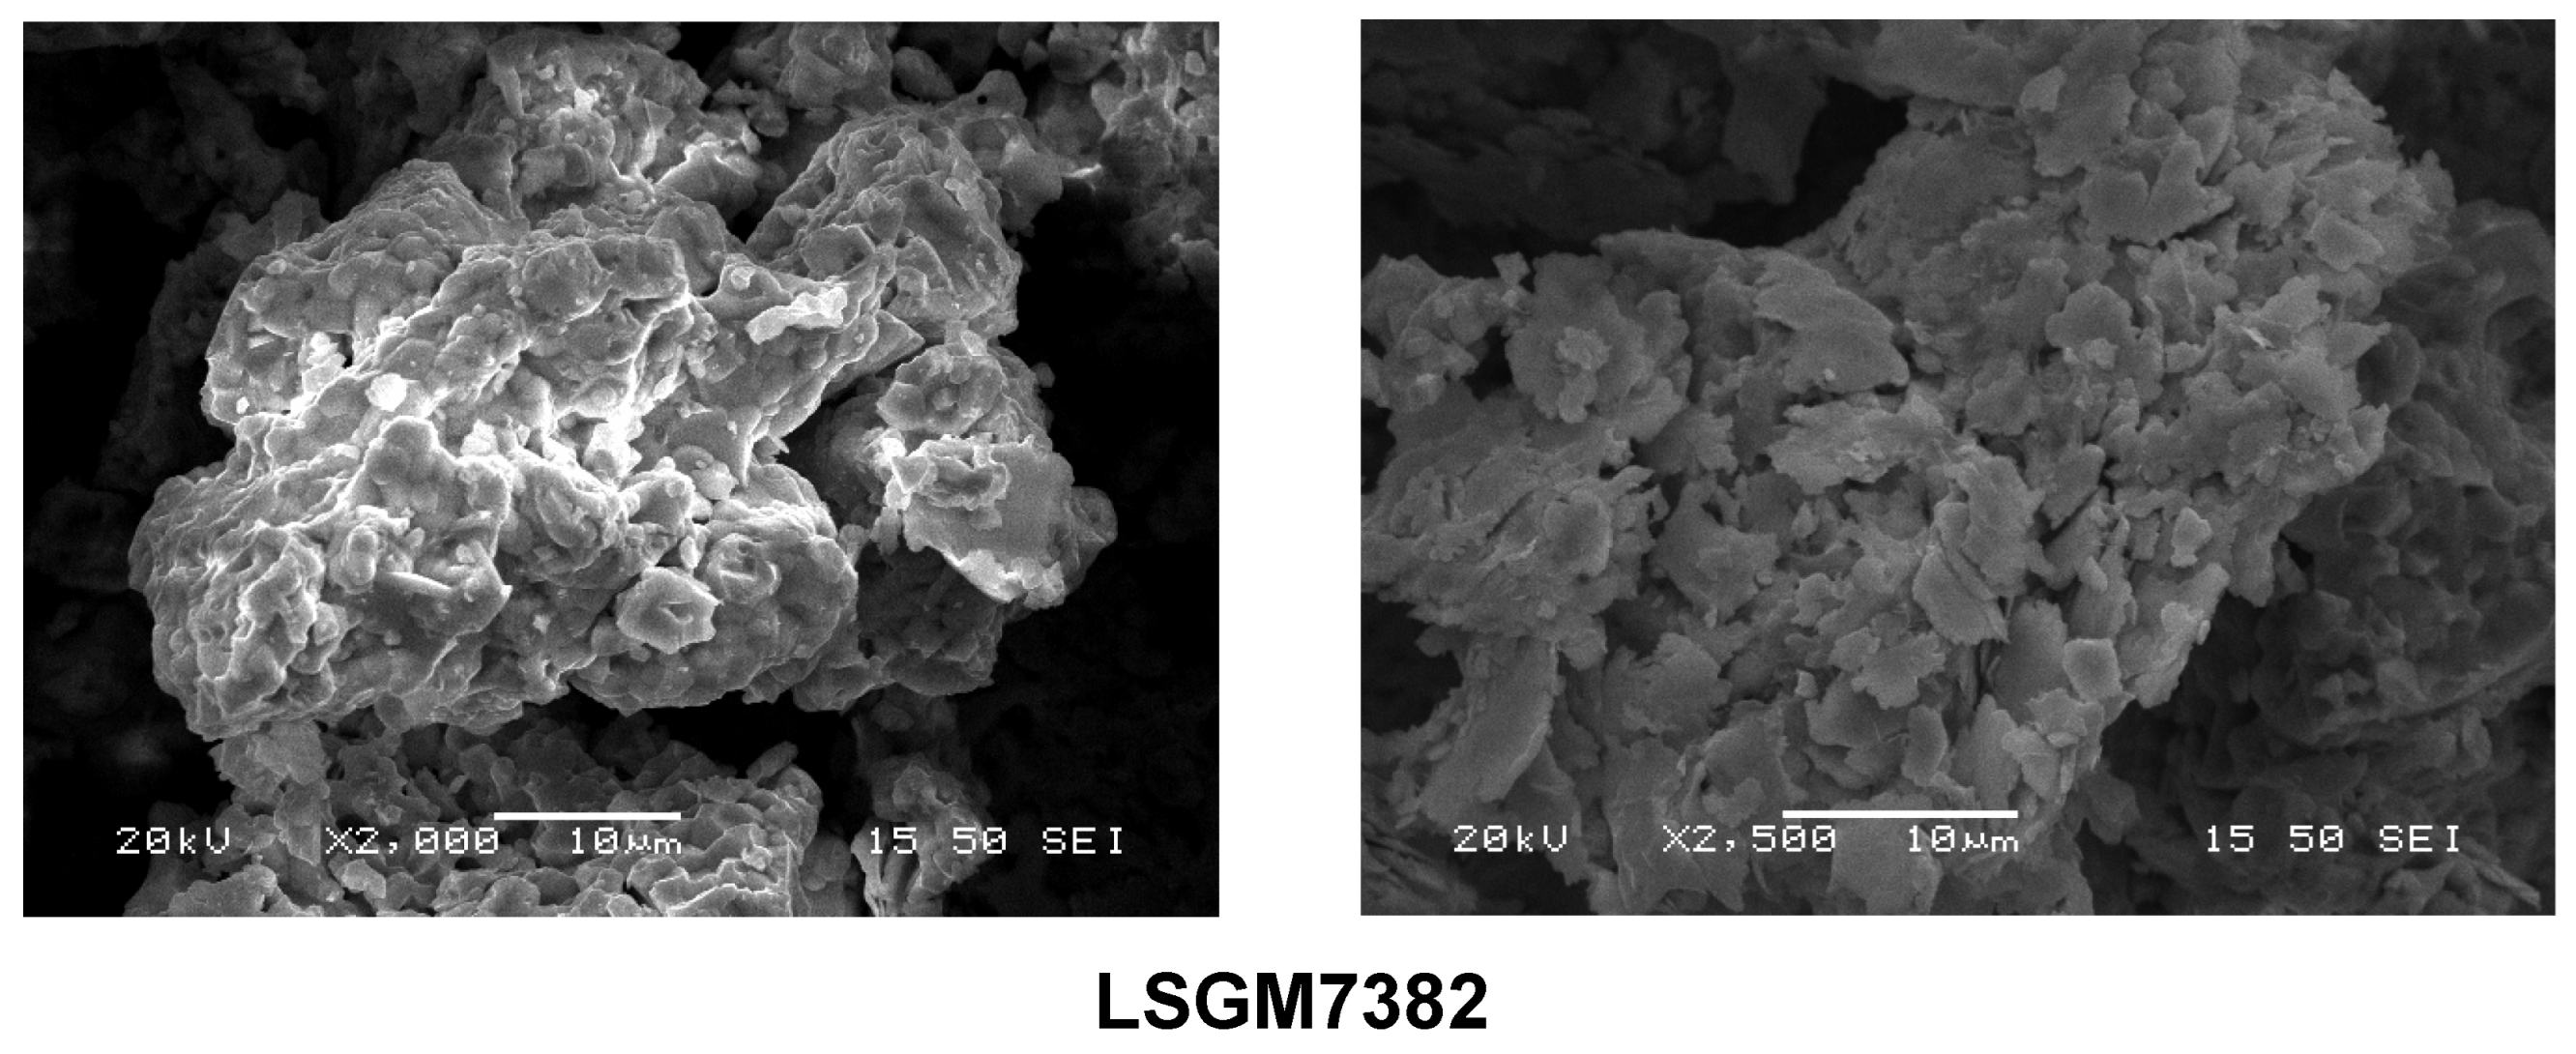
Figure 14.
Thermal expansion curves for the compounds LSGM9191, LSGM9182 and LSM8282.
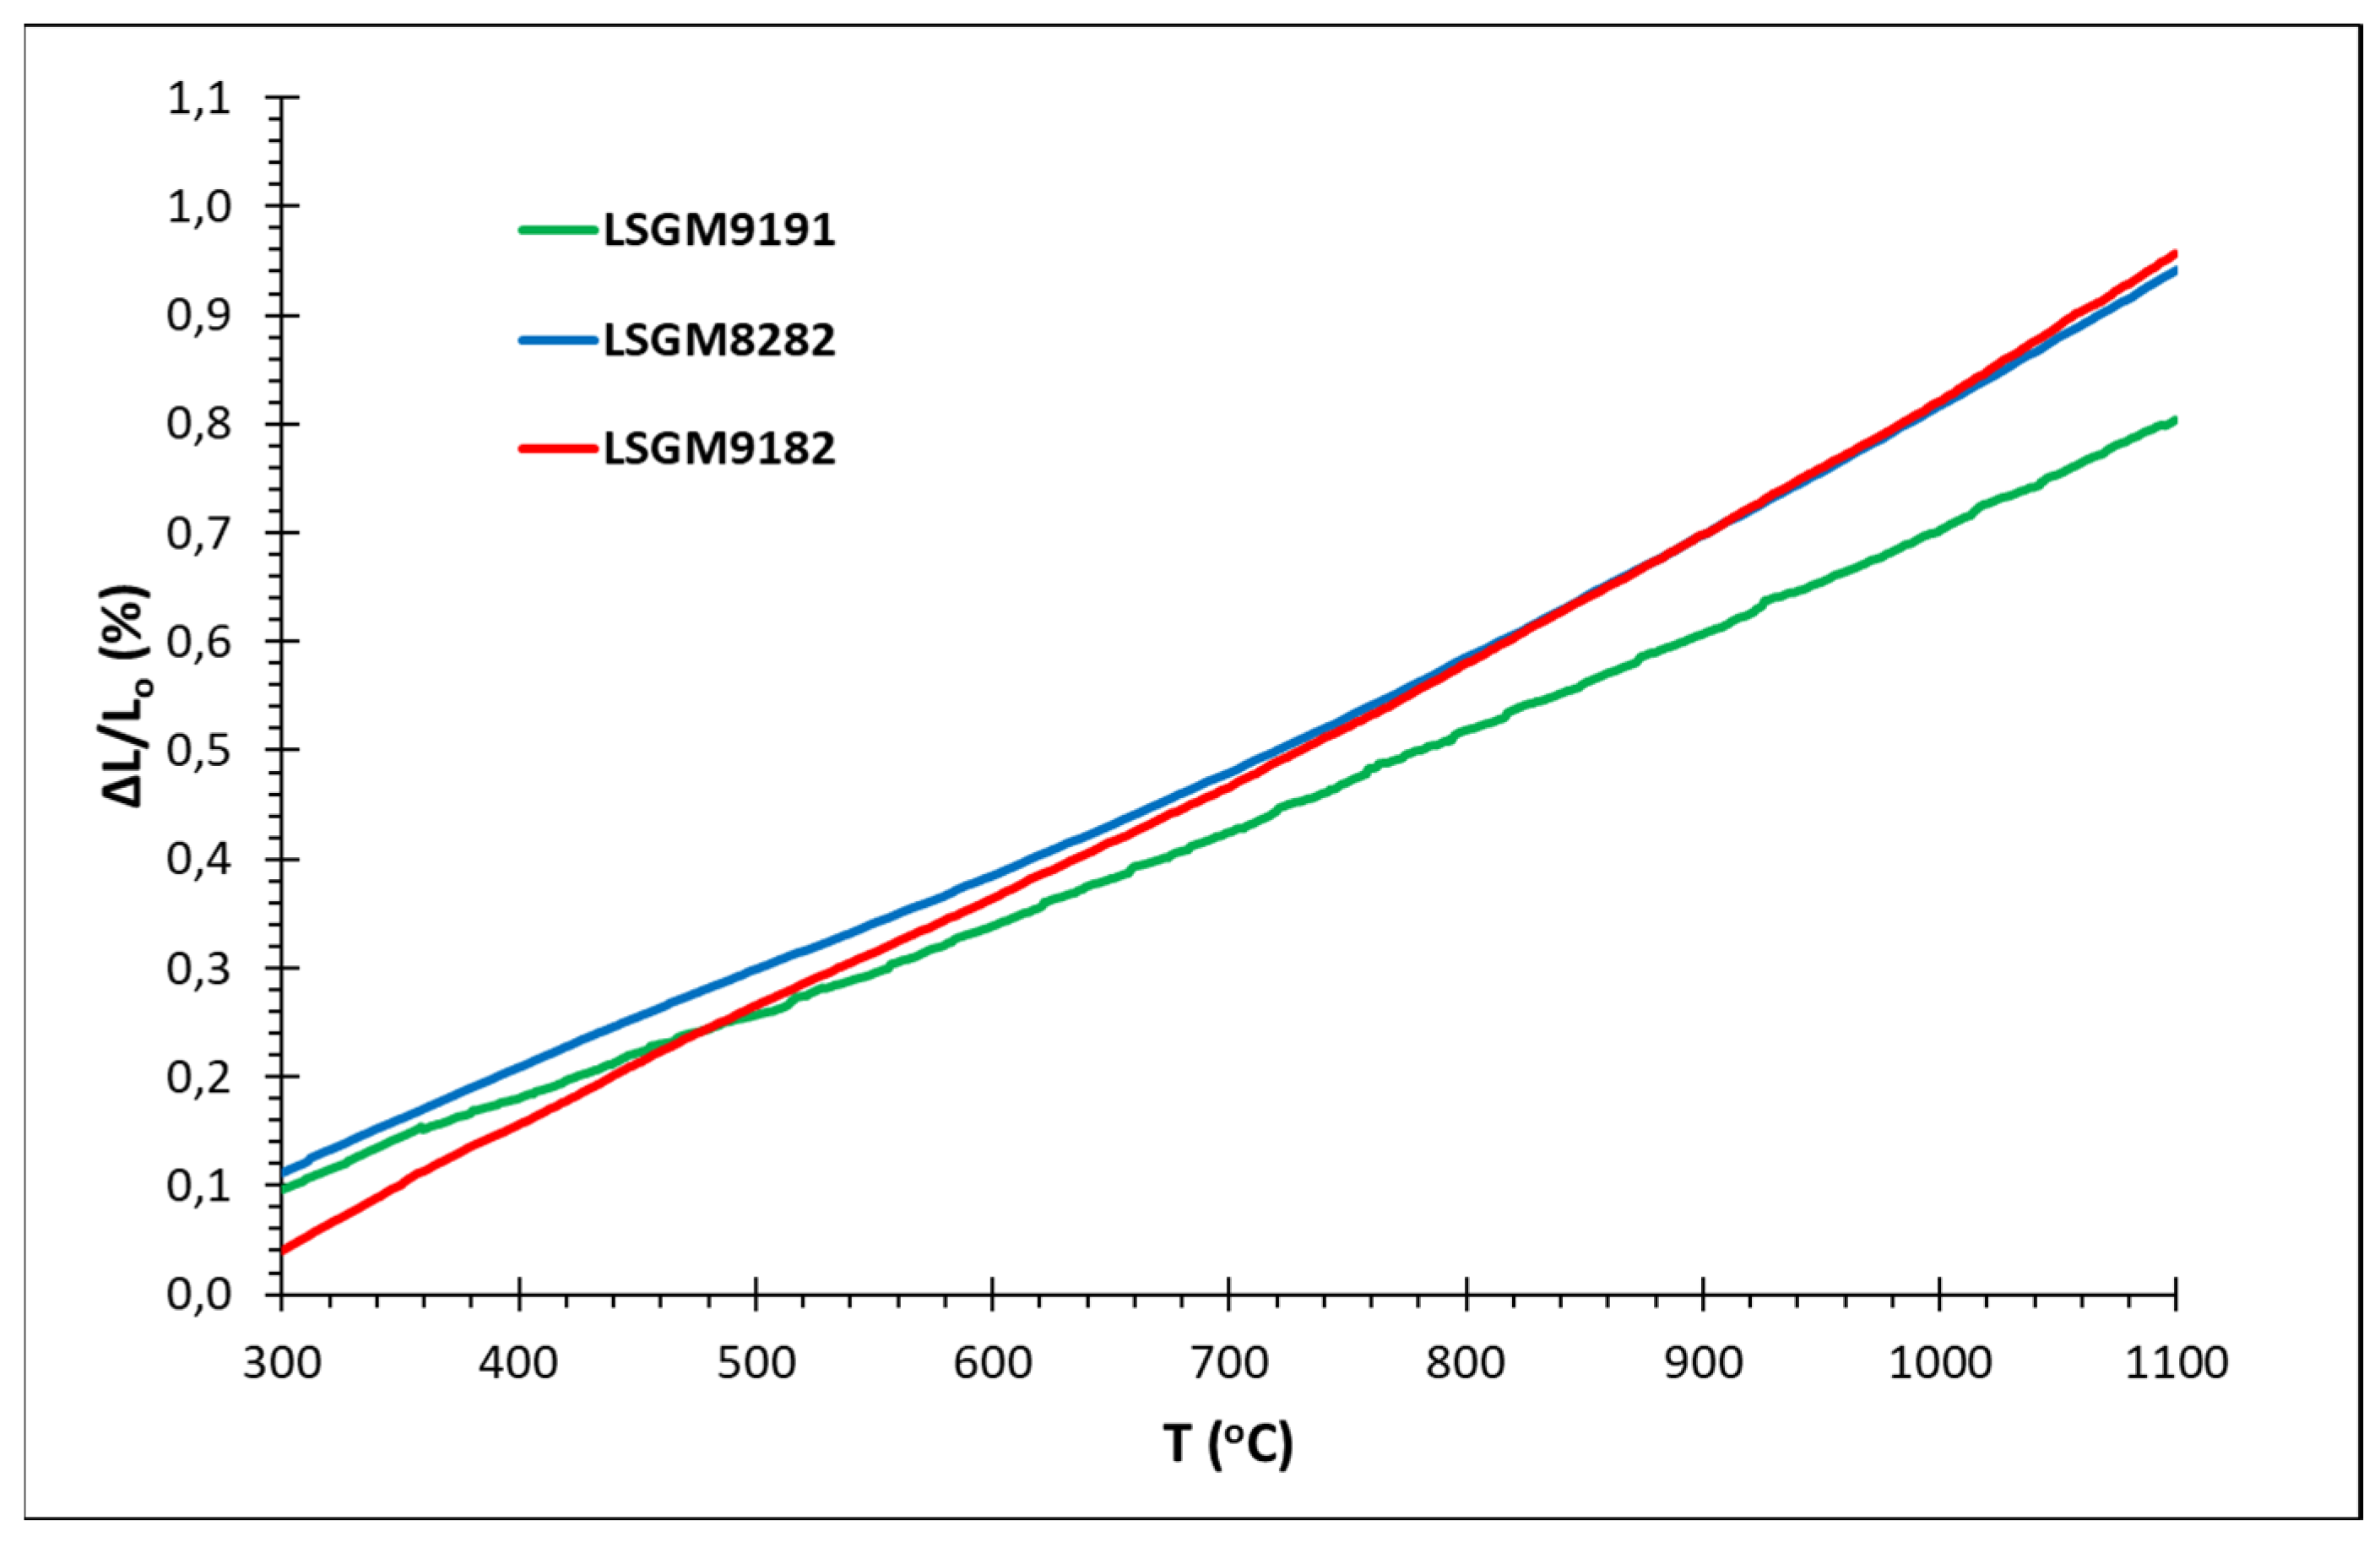

Table 1.
Quantities of chemical reagents used for the LSGM compounds preparation.
| Chemical reagents | LSGM9191 | LSGM9182 | LSGM9173 | LSGM8282 | LSGM7382 |
|---|---|---|---|---|---|
| La2O3 (g) | 5.4980 | 5.4980 | 5.4980 | 4.8872 | 4.2763 |
| SrCO3 (g) | 0.5536 | 0.5536 | 0.5536 | 1.1072 | 1.6608 |
| Ga2O3 (g) | 3.1631 | 2.8116 | 2.4602 | 2.8116 | 2.8116 |
| C6H8O7.H2O (g) | 31.521 | 31.5214 | 31.5221 | 31.5312 | 31.6002 |
| Mg(NO3)2 0.3M (ml) | 25 | 25 | 25 | 25 | 25 |
| C2H6O2 (ml) | 25.1 | 25.1 | 25.1 | 25.5 | 25.5 |
| Deionized H2O (ml) | 115 | 105 | 95 | 110 | 110 |
| HNO3 (ml) | 115 | 105 | 95 | 110 | 110 |
Table 2.
Total mass loss and yield in ceramic product of the LSGM compounds.
| Sample | Total Mass Loss (%) | Yield in Ceramic Product (%) |
|---|---|---|
| LSGM9191 | 68.3 | 31.7 |
| LSGM9182 | 68.7 | 31.3 |
| LSGM9173 | 68.9 | 31.1 |
| LSGM8282 | 74.0 | 26.0 |
| LSGM7382 | 77.2 | 22.8 |
Table 3.
Mineralogical composition of the calcined products at various temperatures (the main phase is highlighted in bold).
Table 3.
Mineralogical composition of the calcined products at various temperatures (the main phase is highlighted in bold).
| Samples | LSGM9191 | LSGM9182 | LSGM9173 | LSGM8282 | LSGM7382 |
|---|---|---|---|---|---|
| Precursor | Amorphous | Amorphous | Amorphous | Amorphous | Amorphous |
| 600 οC | Amorphous La2O2CO3 |
Amorphous La2O2CO3 |
Amorphous La2O2CO3 |
Amorphous La2O2CO3 |
Amorphous La2O2CO3 |
| 1000 οC | Perovskite SrLaGa3O7 SrLaGaO4 |
Perovskite SrLaGa3O7 SrLaGaO4 La4Ga2O9 |
Perovskite SrLaGa3O7 SrLaGaO4 La4Ga2O9 |
Perovskite SrLaGa3O7 SrLaGaO4 La4Ga2O9 |
Perovskite SrLaGa3O7 SrLaGaO4 |
| 1200 οC | Perovskite SrLaGa3O7 SrLaGaO4 |
Perovskite SrLaGaO4 |
Perovskite SrLaGa3O7 SrLaGaO4 |
Perovskite SrLaGa3O7 SrLaGaO4 |
Perovskite SrLaGa3O7 SrLaGaO4 |
| 1300 οC | Perovskite (93.3%) SrLaGa3O7 (6.7%) |
Perovskite (100%) | Perovskite (2.3%) SrLaGaO4 (9.7%) |
Perovskite (95.4%) SrLaGa3O7 (4.6%) |
Perovskite (57.1%) SrLaGa3O7 SrLaGaO4 (42.9%) |
Table 4.
Unit cell parameters, atomic positions, quantitative analysis, and reliability factors for the LSGM compounds after XRD Rietveld analysis.
Table 4.
Unit cell parameters, atomic positions, quantitative analysis, and reliability factors for the LSGM compounds after XRD Rietveld analysis.
| Sample | LSGM9191 | LSGM9182 | LSGM9173 | LSGM8282 | |
|---|---|---|---|---|---|
| Initial Model | ICSD 98170 | ICSD 96449 | ICSD 98170 | ICSD 98170 | ICSD 98170 |
| Crystal System | Cubic | Monoclinic | Cubic | Cubic | Cubic |
| Space Group | Pm3m (Νο 221) | I12/A1 (No 15) | Pm3m (Νο 221) | Pm3m (Νο 221) | Pm3m (Νο 221) |
| Ζ | 1 | 4 | 1 | 1 | 1 |
| Unit Cell | |||||
| a (Å) | 3.90354 (5) | 7.8166 (7) | 3.91276 (9) | 3.90855 (5) | 3.91225(2) |
| b (Å) | 3.90354 (5) | 5.5313 (4) | 3.91276 (9 | 3.90855 (5) | 3.91225(2) |
| c (Å) | 3.90354 (5) | 5.5082 (3) | 3.91276 (9 | 3.90855 (5) | 3.91225(2) |
| β (°) | - | 90.101 (7) | - | - | - |
| V/Z (Å3) | 59.481 (1) | 59.54 (3) | 59.903 (3) | 59.710 (1) | 59.880 (1) |
| Atomic Parameters | |||||
| La/Sr | (1b) | (4e) | (1b) | (1b) | (1b) |
| x (Å) | 0.5 | 0.25 | 0.5 | 0.5 | 0.5 |
| y (Å) | 0.5 | -0.0008 (33) | 0.5 | 0.5 | 0.5 |
| z (Å) | 0.5 | 0 | 0.5 | 0.5 | 0.5 |
| Ga/Mg | 1(a) | (4b) | 1(a) | 1(a) | 1(a) |
| x (Å) | 0 | 0 | 0 | 0 | 0 |
| y (Å) | 0 | 0.5 | 0 | 0 | 0 |
| z (Å) | 0 | 0 | 0 | 0 | 0 |
| O1 | (3d) | (4e) | (3d) | (3d) | (3d) |
| x (Å) | 0.5 | 0.25 | 0.5 | 0.5 | 0.5 |
| y (Å) | 0 | 0.440 (6) | 0 | 0 | 0 |
| z (Å) | 0 | 0 | 0 | 0 | 0 |
| O2 | - | (8f) | - | - | - |
| x (Å) | - | 0.466 (2) | - | - | - |
| y (Å) | - | 0.774 (6) | - | - | - |
| z (Å) | - | 0.272 (6) | - | - | - |
| Quantitative analysis (%) | 93.2(6) | 80.0 (10) | 20.0(6) | 90.2(6) | 95.7(5) |
| Reliability Factors | |||||
| Rp (%) | 21.5 | 13.5 | 18.3 | 18.1 | |
| Rwp (%) | 26.1 | 17.9 | 21.8 | 20.6 | |
| Rexp (%) | 11.38 | 9.92 | 11.21 | 12.22 | |
| S | 2.03 | 1.87 | 2.08 | 1.98 | |
| χ2 | 4.82 | 3.27 | 3.77 | 2.83 | |
Table 5.
Selected distances and angles, tolerance factors, and critical radii of LSGM compounds.
| Sample | LSGM9191 | LSGM9182 | LSGM9173 | LSGM8282 | |
|---|---|---|---|---|---|
| La1/Sr1–O1(Å) | 2.76022(2) ×12 | 3.09(4) ×1 2.44(4) ×1 2.775(5) ×2 |
2.76674 (5) ×12 | 2.76376(2) ×12 | 2.76638(1) ×12 |
| La1/Sr1–O2(Å) | - | 2.58(3) ×2 2.96(3) ×2 2.97(3) ×2 2.59(3) ×2 |
- | - | - |
| <La1/Sr1–O> (Å) | 2.76022(2) | 2.744(8) | 2.76674(5) | 2.76376(2) | 2.76638(2) |
| Ga1/Mg1–O1(Å) | 1.95177(2) ×6 | 1.982(6) ×2 | 1.95638(5) ×6 | 1.95428(2) ×6 | 1.95612(1) ×6 |
| Ga1/Mg1–O2(Å) | 2.15(3) ×2 1.79(3) ×2 |
- | - | - | |
| <Ga1/Mg1–O>(Å) | 1.95177(2) | 1.974 (11) | 1.95638 (5) | 1.95428(2) | 1.95612(1) |
| La1–La1(Å) | 3.90354(5) ×12 | 3.9083(3) ×2 3.897(18) ×2 3.909(18) ×2 |
3.91276 (9) ×12 | 3.90855(5) | 3.91225(2) |
| Critical Radius to Ionic Radius Ratio O2- rc/rO | 1.0432 | 1.0433 1.0400 1.0435 |
1.0446 | 1.0420 | 1.0443 |
| Tolerance Factors | 0.99998 (1) | 0.983 (3) | 0.99998 (3) | 1.00000(1) | 1.00000(1) |
| Ga1–O1–Ga1 (°) | 180.000(3) | 168.04(12) | 180.000(6) | 180.000(3) | 180.000(1) |
| Ga1–O2–Ga1 (°) | - | 165.3(14) | - | - | |
| O1 displacement | 234.119.10-4 | 220.809.10-4 | 234.119.10-4 | 234.120.10-4 | 234.119.10-4 |
| O2 displacement | - | 283.931.10-4 | |||
| Dscherrer (nm) | 48.8 | 69.6 | 68.1 | 45.4 | 69.8 |
Table 6.
Thermal expansion coefficients α (x10⁻⁶ K⁻¹) of the compounds LSGM9191, LSGM9182 and LSM8282 in different temperature ranges.
Table 6.
Thermal expansion coefficients α (x10⁻⁶ K⁻¹) of the compounds LSGM9191, LSGM9182 and LSM8282 in different temperature ranges.
| Sample | α300 – 600 (x10-6 Κ-1) |
α300 – 700 (x10-6 Κ-1) |
α300 – 800 (x10-6 Κ-1) |
α300 – 1000 (x10-6 Κ-1) |
|---|---|---|---|---|
| LSGM9191 | 7.82±0.006 | 8.00±0.005 | 8.22±0.005 | 8.56±0.005 |
| LSGM9182 | 10.72±0.006 | 10.50±0.006 | 10.48±0.004 | 10.86±0.005 |
| LSGM8282 | 9.02±0.006 | 9.00±0.006 | 9.18±0.005 | 9.82±0.008 |
Disclaimer/Publisher’s Note: The statements, opinions and data contained in all publications are solely those of the individual author(s) and contributor(s) and not of MDPI and/or the editor(s). MDPI and/or the editor(s) disclaim responsibility for any injury to people or property resulting from any ideas, methods, instructions or products referred to in the content. |
© 2024 by the authors. Licensee MDPI, Basel, Switzerland. This article is an open access article distributed under the terms and conditions of the Creative Commons Attribution (CC BY) license (http://creativecommons.org/licenses/by/4.0/).
Copyright: This open access article is published under a Creative Commons CC BY 4.0 license, which permit the free download, distribution, and reuse, provided that the author and preprint are cited in any reuse.


