
Submitted:
22 December 2024
Posted:
23 December 2024
You are already at the latest version
Abstract
This study evaluates the performance and feasibility of hybrid photovoltaic-hydrogen systems in-tegrated with 4.2 MW PV installations, focusing on the interplay between electrolyzer capacity, energy storage, and hydrogen production. Key findings reveal that downsizing electrolyzers, such as using a 1 MW unit instead of a 2 MW model, increases operational efficiency by extending nominal power usage, though it reduces total hydrogen output by approximately 50%. Meanwhile, expanding energy storage systems show diminishing returns, with added capacity offering minimal gains in hydrogen production and raising economic concerns. The system's performance is highly weather-dependent, with daily hydrogen production ranging from 26 kg on cloudy winter days to 375 kg during sunny summer conditions. Surplus energy export to the grid peaks at 3300 kWh during periods of high solar generation but is minimal otherwise. For economic and operational viability, the system design must prioritize directing a majority of PV energy to hydrogen production while minimizing grid export, requiring a minimum of 50% PV energy allocation to the hydrogen value chain. Cost analysis estimates a Levelized Cost of Hydrogen (LCOH) as low as €6/kg with an optimized configuration of a 2 MW electrolyzer and 2 MWh battery. Although high production costs challenge economic sustainability, careful component optimization and supportive policies can enable competitive hydrogen pricing and a positive net present value (NPV) over the system's lifetime.
Keywords:
Hydrogen generation
; PV-hydrogen integration
; Electrolysis
; Cost of hydrogen production
; Standardized energy solutions
1. Introduction
The global energy transition is driving an urgent search for sustainable solutions to reduce greenhouse gas emissions and enhance energy resilience. Among these solutions, renewable energy systems, particularly photovoltaic (PV) plants, have become a cornerstone due to their scalability and decreasing costs. However, the rapid deployment of large-scale PV installations has highlighted new challenges. Grid congestion, overproduction during peak sunlight hours, and the intermittent nature of solar power underline the need for integrated energy strategies that optimize the use of PV-generated electricity. One promising approach is coupling PV systems with hydrogen production infrastructure. Green hydrogen, produced via electrolysis powered by renewable energy, is increasingly recognized as a key player in decarbonizing hard-to-abate sectors, providing a versatile energy carrier and renewable energy storage solution. The integration of hydrogen production with PV plants offers several benefits, such as mitigating curtailment issues, enhancing energy storage capabilities, and diversifying the utilization of renewable energy. However, the feasibility of these systems is closely tied to their economic viability and technical performance, which remain under active investigation.
In this context, the development of standardized methodologies and configurations for PV-hydrogen (PV-H2) systems represents a critical step toward their broader adoption. This study aims to contribute to this effort by examining the design, operation, and economic potential of such systems, focusing on a fully integrated PV-H2 solution.
1.1. State of the Art
Research into PV-H2 systems has evolved significantly over the last decade. Capurso et al. in [1] underscored hydrogen's pivotal role in sustainable energy systems, emphasizing its potential to provide both flexibility and long-term storage for renewable energy. Early studies, such as those by Boudries et al., [2], explored the technical feasibility of coupling PV systems with electrolyzers for industrial-scale hydrogen production, laying the groundwork for more complex hybrid configurations. Hinkley et al. in [3] introduced a financial perspective, analyzing the economic barriers and opportunities for PV-driven hydrogen production. As the field matured, studies began addressing the integration of PV systems with other renewable sources and storage solutions. Qolipour et al. in [4] demonstrated the viability of hybrid PV and wind configurations for hydrogen generation, while different authors provided insights into grid-connected systems and their environmental impacts through lifecycle assessments, [5-6].
In more recent times Maurer et al. in [7] and Gallardo et al. in [8] advanced the optimization of system designs, focusing on parameter studies and standalone configurations, respectively. Wei et al. in [9] introduced integrated energy storage models, highlighting the growing importance of storage in enhancing system performance. Despite these advancements, the field lacks a unified framework for standardizing PV-H2 systems. Many studies are constrained by specific case studies or experimental setups, making it challenging to generalize findings or apply them across varied scenarios. Recent calls for standardization and replicable design methodologies reflect the need for a broader, more systematic approach to this promising technology.
1.2. Motivation for the Study
The present study investigates the potential for developing a standardized photovoltaic-hydrogen (PV-H₂) system that integrates photovoltaic generation and hydrogen production into a single, scalable solution. Drawing inspiration from the standardization of PV installations, which has accelerated solar energy deployment, this research extends the concept to PV-H₂ systems, aiming to enhance their adaptability and economic viability in the renewable energy landscape. The proposed approach not only seeks to optimize system performance by balancing hydrogen production and electricity export but also addresses the pressing need for renewable energy systems to support the thermal energy sector. As the penetration of photovoltaic systems continues to grow, their future expansion must inherently involve solutions that include energy storage. In this context, hydrogen offers a particularly promising pathway, acting as a versatile energy carrier capable of bridging the gap between renewable electricity generation and thermal energy applications.
A key aspect of this framework is the prioritization of hydrogen generation, with system configurations designed to direct at least 50% of PV energy to the hydrogen value chain. This ensures operational flexibility while aligning with sustainability goals. The study also explores the interplay between electrolyzer sizing, energy storage, and overall system efficiency, presenting a framework for evaluating the scalability and replicability of such systems under diverse environmental and market conditions.
By targeting a replicable "PV-H₂ package," the research contributes original insights into the integration of these systems within the renewable energy sector, offering a flexible blueprint for decentralized hydrogen hubs. These systems are poised to enable broader adoption of sustainable energy solutions, fostering the integration of renewable energy not only in electricity generation but also in thermal energy applications.
2. System Configuration and Operational Constraints
Figure 1 illustrates the recent growth in global photovoltaic (PV) installations, showing both the energy generated (in TWh) and the installed capacity (in GW). By the end of 2023, according to GSR data [10], global PV installations reached approximately 1589 GW, producing just over 1600 TWh of energy. This implies an average of around 1000 equivalent operating hours per year for PV systems worldwide, a figure that has remained relatively stable over time with minor fluctuations. As we have observed, one of the primary challenges of photovoltaic (PV) systems today is that they tend to feed energy into the grid during predictable time windows, which can strain the grid’s capacity and limit its ability to manage power effectively. Given the proliferation of PV installations, relying solely on grid capacity is no longer a viable approach for integrating large amounts of solar power.
As we have observed, the increase in installed capacity of photovoltaic plants, which has risen in less than ten years from just over 180 GW to approximately 1600 GW by 2023, highlights how this technology—due to its modular design, ease of installation, and relatively affordable component costs—has driven significant growth in these installations. However, further expansion cannot rely solely on management systems, and it would be wise to begin identifying viable alternatives that also address the need for storage solutions for the generated energy. In this regard, hydrogen presents an interesting option: by complementing electricity generation with hydrogen production, it not only allows for the potential to further increase renewable energy installations, but also provides the opportunity to extend the use of renewables to thermal applications and mobility sectors. However, it will be essential to impose constraints on hydrogen generation, making it a priority over direct electricity production.
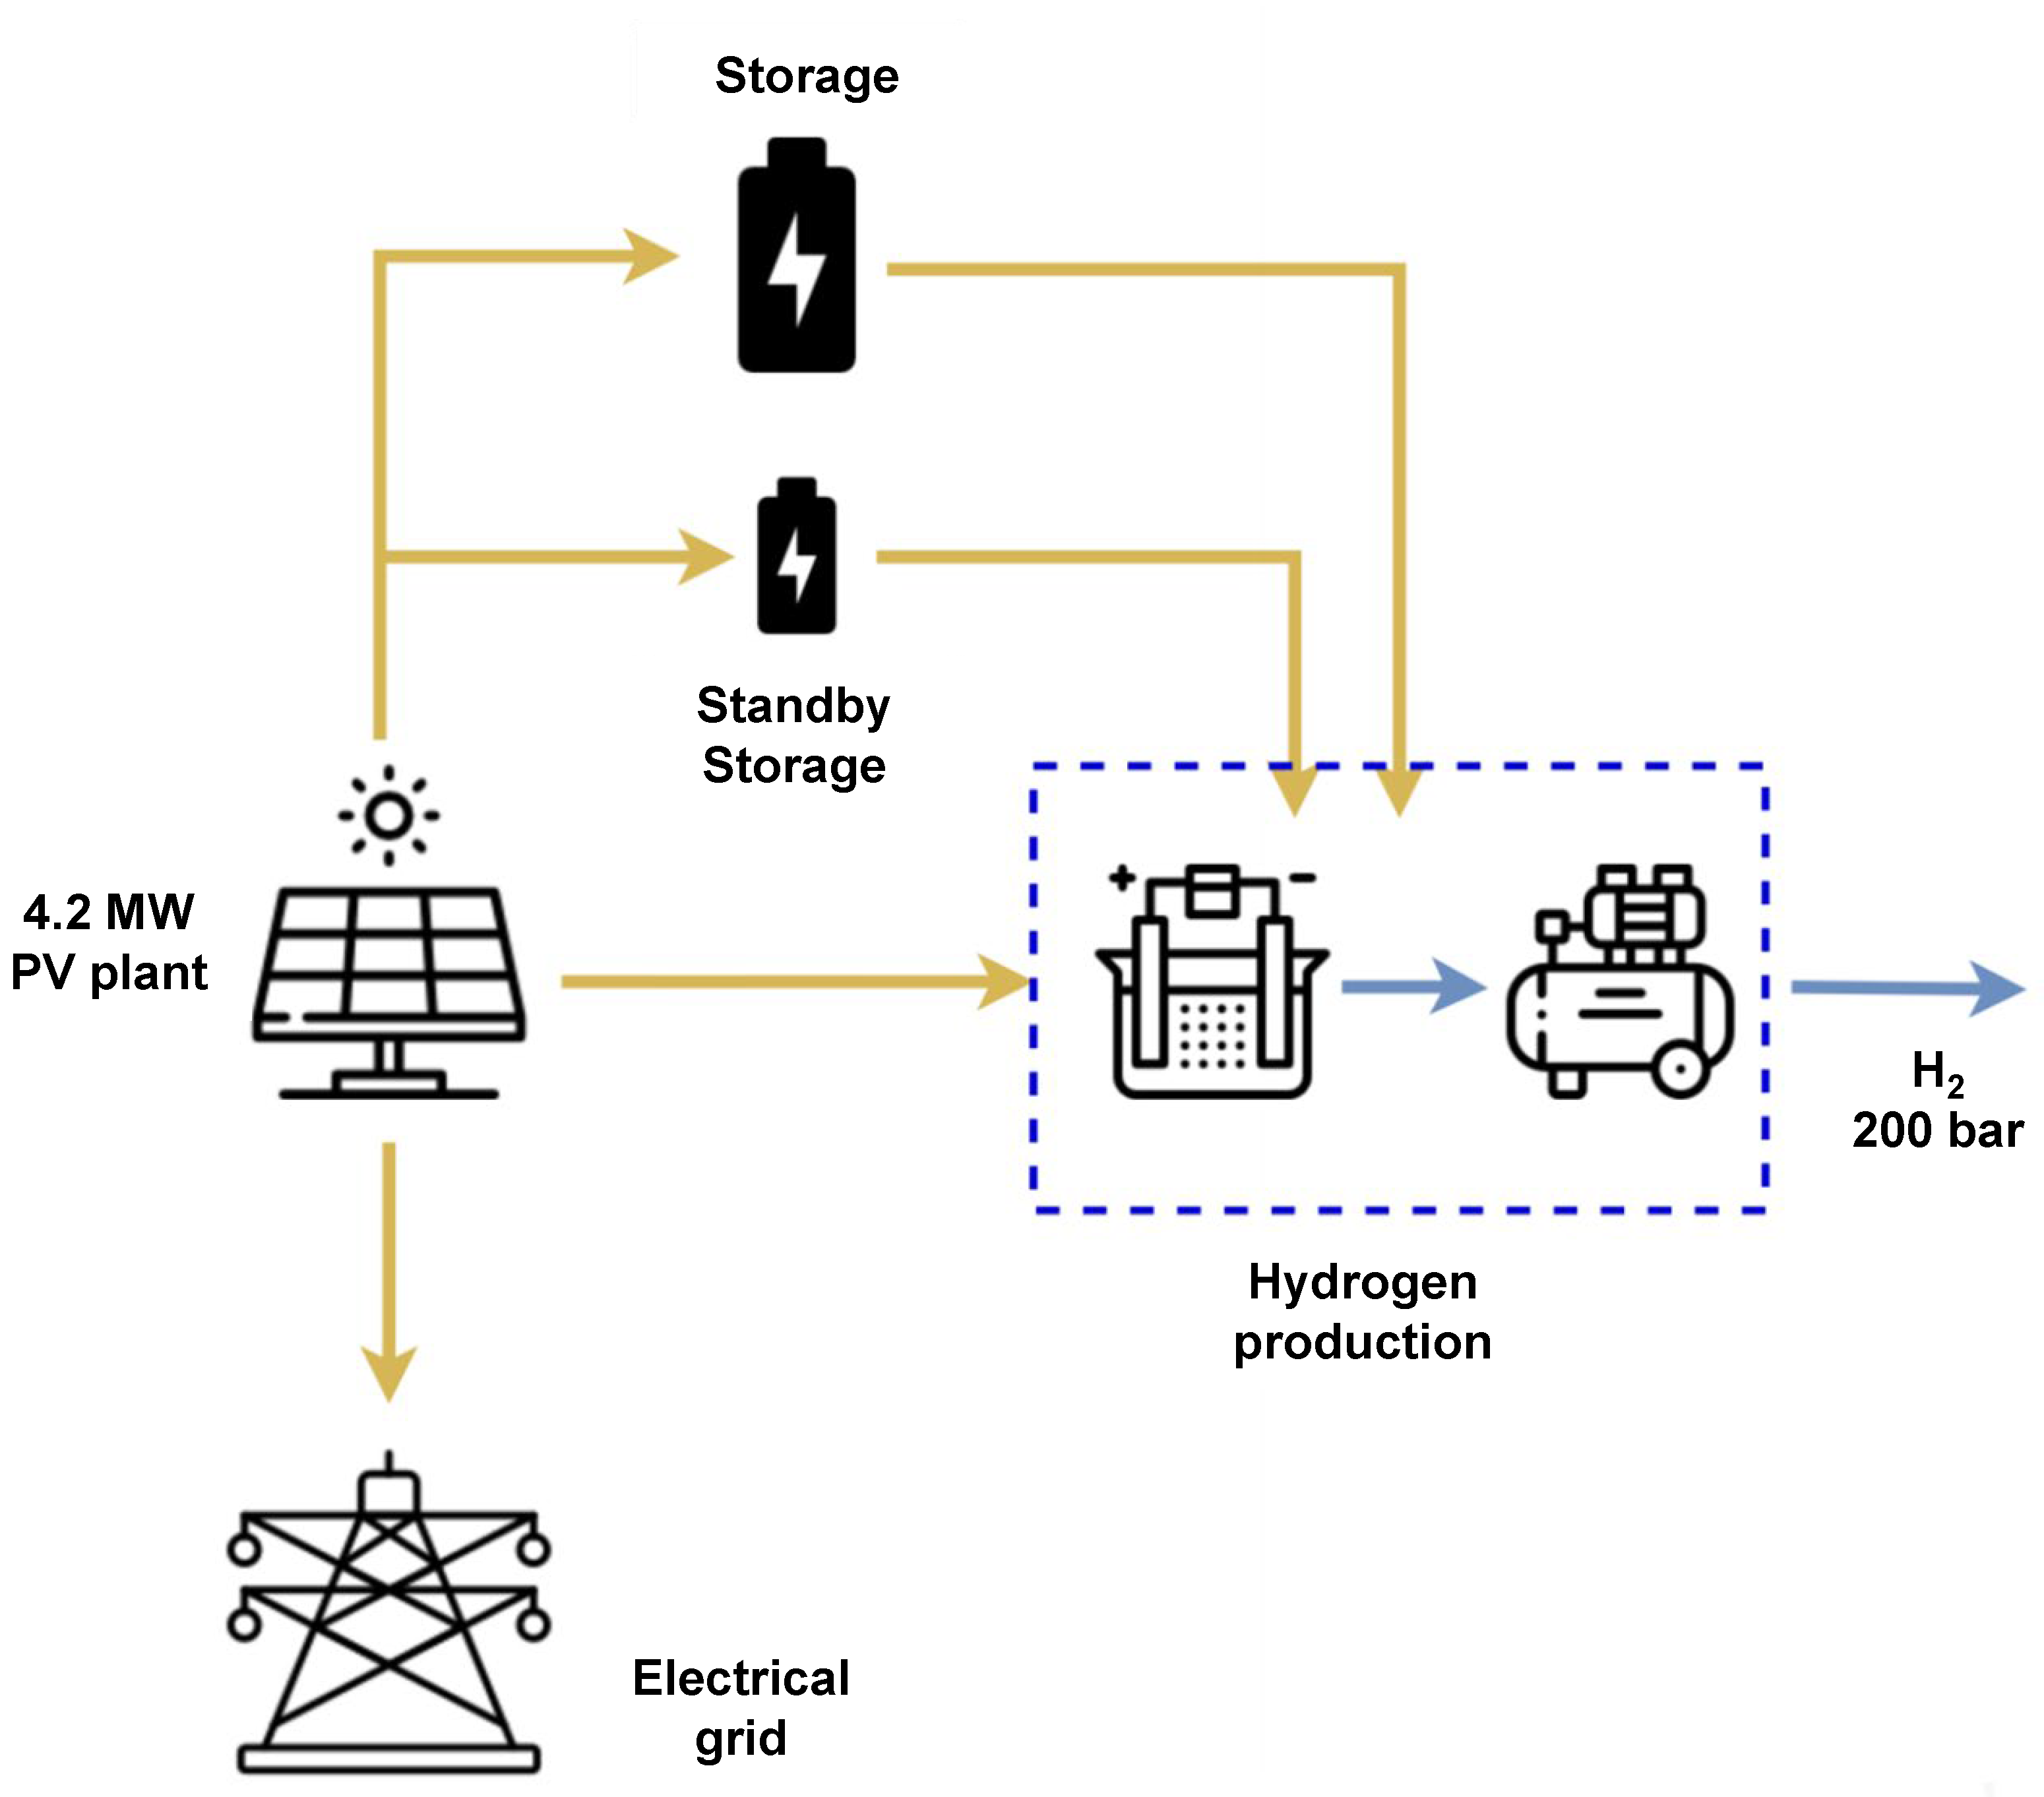
Innovative projects are increasingly focused on the use of hydrogen as a storage solution, which can offer flexibility by capturing excess energy and storing it for use outside peak solar production hours. A viable and scalable plant configuration combines hydrogen generation and distribution with electrical power generation. To ensure system flexibility, the plant includes a storage system of adequate capacity. An outline of this setup is provided in Fig. 2., illustrating a flexible system design. Specifically, we focus on a configuration with a 4.2 MW photovoltaic installation, examining its performance and adaptability for hydrogen production and energy distribution. This project aims to design and scale a large photovoltaic plant, evaluating configurations that can meet a specific technical and regulatory requirement: at least 50% of the plant’s annual electricity production is allocated to hydrogen production, with the remaining portion supplied to the electrical grid. The examined plant consists of a 4.2 MW photovoltaic array, configured to supply power to a hybrid energy system that includes an electrolyzer and an energy storage system. The next section describes the technical characteristics of the two electrolyzer sizes considered, 1 MW and 2 MW, as well as some options for the two storage systems. The operational constraints analysis focuses on the requirement to allocate at least 50% of the energy generated to hydrogen production and the impact of different configurations on system flexibility and management.
Figure 2.
Schematic representation of a scalable and flexible plant configuration integrating hydrogen generation and compression, and electrical power generation.
Figure 2.
Schematic representation of a scalable and flexible plant configuration integrating hydrogen generation and compression, and electrical power generation.
3. Characteristics of the Components and Selected Subsystems
This section provides an overview of the plant's design and of the specific components used, highlighting key technical specifications and sizing considerations. To ensure that the proposed system is both practical and representative of real-world conditions, the components referenced in this study are all commercially available. This choice not only lends credibility to technical assumptions but also enables the development of an accurate and realistic economic model for the plant.
By relying on market-ready components, the study aligns with the broader goal of developing scalable and replicable PV-H₂ systems that can be deployed using existing supply chains and infrastructure. This approach ensures that the findings are grounded in current technological capabilities while providing a solid foundation for future advancements.
3.1. PV Plant
The photovoltaic (PV) plant is designed using commercially available modules with nominal power ratings between 500 and 550 W and efficiencies in the range of 20-22%, commercially available today from different producers. To reach the target capacity, approximately 7836 to 8400 modules will be required. The system will be equipped with eight 500 kW inverters, providing a total inverter capacity of 4 MW, slightly undersized relative to the total PV capacity installed. This configuration allows for efficient energy conversion while minimizing potential overproduction losses.
The design incorporates standardized components to facilitate cost estimation and optimize overall system performance. The slight undersizing of inverter capacity relative to PV output helps reduce system costs without significantly impacting energy yield, as minor energy losses during peak production are balanced by a lower overall equipment investment. This configuration provides a cost-effective balance between production capacity and energy efficiency, establishing a solid foundation for integrating hydrogen production modules in a modular and scalable way.
3.2. Electrolyzer
In selecting and sizing electrolyzers for hydrogen production alongside the PV plant, we chose a low-temperature alkaline electrolyzer based on data from manufacturers' catalogs. These electrolyzers are available in 1 MW, 2 MW, and 4 MW models, corresponding to approximately 25%, 50%, and 100% of the nominal power of the PV installation, respectively. Table 1 summarizes general data for a commercially available electrolyzer; the data presented are partially derived from [11] and have been partially rearranged and adapted by the authors.
As the 4 MW model would seldom operate at full capacity in this configuration, it is not considered a cost-effective option. Consequently, our analysis focuses on the 1 MW and 2 MW models, evaluating their energy efficiency, compatibility with PV output, and cost-effectiveness within the overall system design.
3.3. Storage Systems
The storage system in this design incorporates two distinct types of batteries, each serving a specific purpose yet both ultimately supporting hydrogen production. The first battery (back-up) is designed to extend the operation of the electrolyzer beyond typical sunlight hours, ensuring a more continuous production cycle. The second battery (hot stand-by) plays a complementary role by maintaining the electrolyzer in hot stand-by mode, when not in operation, ready to resume operation without delays.
This dual-storage approach optimizes the integration of PV plant with hydrogen production, enhancing system flexibility and aligning with the overall objective of maximizing energy utilization for hydrogen generation. A purely electrical energy storage system was deliberately excluded from the design, as it would significantly increase costs without providing substantial benefits to the overall system performance. In the context of a system like the one under study, the storage component could theoretically be sized for any capacity, including seasonal usage. However, such a configuration would be impractical and inefficient. Therefore, a short-duration storage option has been chosen. It is important to consider that, with this setup, hydrogen generation will be heavily skewed toward periods of higher energy availability, such as the summer months.
3.3.1. Back-Up Battery
The back-up battery can be sized, for example, to provide an additional hour at nominal power output. Considering a 2 MW size electrolyzer, this could be not less than 2 MWh, allowing. This sizing can later be adjusted downward, depending on operational needs and cost considerations.
3.3.2. Hot Stand-By Battery
The stand-by battery ensures continuous and reliable electrolyzer operation, even during periods of reduced or no solar input. This can be designed to support a minimum period of stand-by power. According to the data available in the technical literature for electrolyzers, energy requirement is set at 1.5% of nominal power, so that the sizing of the stand-by battery depends on the number of hours required to maintain the operation of the electrolyzer:
The sizing of a standby battery depends on the desired standby duration. For instance, to maintain 10 hours of standby for the 2 MW electrolyzer, a preliminary estimate suggests a battery capacity of approximately 300 kWh. If the standby period increases to 16 hours, the required capacity rises to around 480 kWh. For a maximum stand-by period of 20 hours, the capacity would need to be scaled up to 600 kWh.
The storage batteries must be slightly oversized to account for the fact that they cannot be fully discharged without impacting performance and longevity. Assuming a discharge rate limit of 80%, the actual capacity of each battery needs to be increased accordingly to meet the required energy needs. This ensures that even with the discharge limit, the back-up and stand-by batteries can reliably provide the necessary power for uninterrupted electrolyzer operation. If a maximum acceptable depth of discharge is considered - reasonably set at 80% - the battery capacity must be oversized accordingly. This can be estimated using the following formula, where SC = 0.8.
Applying this adjustment, the required capacity increases to approximately 375 kWh in the first case (10-hour standby) and about 750 kWh in the third case (20-hour standby).
3.4. Compressor
For the compressor, we have referenced data from real models available in the literature, such as 60% efficiency, from which we extracted the specific energy required for compression. The estimation of the energy required for compression was derived using manufacturer-provided data, considering the theoretical minimum work of compression, [12]:
The energy required to obtain a final pressure of 200 bar, starting from 353 K and 27 bar (Table 1), is about 2,94 MJ/kgH2:
So that the real work is:
The relevant data of the compressor are summarized in Table 2.
4. Economic Analysis and Economic Parameters
To assess the viability of a solution like the one proposed, it is essential to develop an economic analysis aimed at understanding the cost of hydrogen production relative to current standards and established benchmarks.
To evaluate the economic feasibility of the proposed PV-H₂ system, several approaches can be considered. These include life cycle cost analysis (LCCA), payback period evaluations, and profitability assessments based on net present value (NPV). Each of these methods offers unique insights into different aspects of the system's economic performance. The concept of minimizing the cost of hydrogen production is a key principle that can greatly aid in optimizing any renewable energy generation system. This approach helps determine how resources and components, such as electrolyzers, can be configured to maximize efficiency and reduce the costs associated with hydrogen production, making the best use of available green energy, [13].
To perform the economic analysis of the hybrid system considered, key costs include Capital Expenditures (CAPEX), the capital costs to build the plant, amortized over time, Operating Expenses (OPEX), or ongoing costs for operation, including energy use and maintenance, all the costs for Operations & Maintenance (O&M), including the costs for system management and preventive maintenance and in some cases the costs for the Balance of Plant (BoP), or the costs for non-energy-producing components, such as distribution and cooling systems. Understanding these costs is essential for assessing the system’s economic viability and optimizing investment returns.
The variable identified for the analysis is first of all the Levelized Cost of Hydrogen (LCOH), a key metric that represents the per-unit cost of producing hydrogen over the lifecycle of a project, accounting for capital expenses, operational costs, and system efficiency. The topic of LCOH has been extensively addressed in a series of publications, highlighting its critical role in evaluating the economic viability of hydrogen production technologies, [14-15]. The LCOH calculation excludes revenues from selling surplus electricity to the grid, in order to prevent the system from being oversized for the purpose of electricity sales. The formula for estimating LCOH (in €/kgH2) is presented in equation (6):
Where [kg] is the mass of hydrogen produced during j-th year, is the lifetime of the project set at 20 years, is the investment rate set at 5%, is the investment cost of the k-th component [€], are the operation and maintenance costs for the k-th component during the j-th year, and are the project costs estimated at 12.5% of CAPEX excluding PV and battery. Another important economic parameter to monitor is the Net Present Value (NPV), which measures the difference between the present value of cash inflows and outflows over the lifecycle of a project, providing an indicator of its overall profitability. NPV is defined according to equations (7-8):
Where is the cash flow during the j-th year. The positive cash flows are associated with the sale of green hydrogen produced and the excess electricity generated by photovoltaics, whereas the negative cash flows are linked to the purchasing of demineralized water for the electrolyzer andthe operation and maintenance of the technologies.
The NPV is very sensitive to the selling price of energy vectors, particularly that of hydrogen. Consequently, we have examined three distinct price scenarios to assess the impact of substituting hydrogen produced from natural gas with or without carbon capture (referred to as blue or grey hydrogen, respectively) or hydrogen from renewable plants (green hydrogen).
5. Energy Flow Management and Performance and Production Scenarios
It is important to emphasize that a plant like the one illustrated in Figure 2, which integrates photovoltaic generation with hydrogen production and the electric grid, is viable primarily if most of the energy generated by the PV system is dedicated to the hydrogen supply chain. Given the current market price of hydrogen, the plant conceptually makes sense only if hydrogen production is the dominant outcome, with minimal energy diversion to the grid. A definitive assessment, however, will require an economic analysis to validate the plant's feasibility under real-world conditions.
The operational logic of the proposed system is based on a simulation derived from a typical climatic profile for the region, incorporating a realistic alternance of favorable, average, and bad weather conditions. In terms of system prioritization, hydrogen generation is always favored. Electricity distribution to the grid occurs only when the storage battery is fully charged, ensuring that the maximum amount of energy is directed toward hydrogen production. This strategy aligns with the system's goal of maximizing hydrogen output and minimizing energy losses. For the purposes of this study, it is assumed that hydrogen utilization follows a daily consumption pattern, enabling a consistent operational framework for the system's design and performance evaluation.
In section 3 we have discussed the main components of the whole system. Although the sizes of the photovoltaic plant and electrolyzers under consideration have been discretely defined, the system also includes storage solutions that can come in various capacities. Each storage capacity corresponds to a specific duration for which the energy generated by the photovoltaic plant can be stored. It is evident that significantly increasing the size of the storage system may not be economically viable. Nonetheless, multiple configurations remain possible, allowing flexibility in system design.
For preliminary evaluations, specific configurations with a production constraint on hydrogen generation were considered too. Specifically, we assumed that at least 50% of the PV plant's energy must be allocated to hydrogen production. This constraint ensures a reliable energy flow to the hydrogen system while keeping grid interaction at a reduced level. To enforce this 50% allocation, careful energy management between the photovoltaic array, the electrolyzer, and the storage system becomes critical. The energy flow needs to be dynamically distributed, accounting for solar irradiance fluctuations and storage demands to maintain continuous hydrogen production.
Our design approach focused on maximizing the plant’s efficiency and reducing unnecessary energy diversion to the grid. With a nominal PV capacity of approximately 4 MW, it became clear that the system would produce above 2 MW for only a limited number of hours. Consequently, using a 4 MW electrolyzer was considered impractical. Instead, we opted to analyze electrolyzer configurations of 1 MW (about 25% of PV capacity) and 2 MW (almost 50% of PV capacity), allowing the system to operate directly with the PV plant's output during significant portions of the day. Surplus energy beyond the electrolyzer's capacity could then be routed to the grid or stored for later use to enhance hydrogen production. To explore these options further, we evaluated three scenarios: one without storage, one with a 1 MWh storage system, and one with a 2 MWh storage system. This approach enables us to prioritize hydrogen generation while optimizing plant flexibility and aligning with broader sustainability goals.
Based on the four configurations resulting from combining the two electrolyzer sizes and the two storage systems, this section presents an analysis of overall system performance. The plant has been virtually located in a coastal area of central Italy. The reference climate data are reported in Table 5. This profile is built upon a detailed climate analysis conducted for the year 2023.
Different production scenarios are explored to highlight how each configuration affects the amount of hydrogen produced and the system’s overall efficiency. The results illustrate achievable hydrogen production levels and each scenario's impact on costs and system reliability. Considering the PV plant production, Figure 3 shows three realistic weeks, one in winter (a), one in spring (b) and one in summer (c), consisting of alternating beautiful days and worse days. As can be observed, on many days throughout the year, the power production of the plant exceeds the capacity of the electrolyzer. In different cases, corresponding to many winter days and certain days with unfavorable weather conditions during intermediate seasons, the power generated by the photovoltaic system is not sufficient for the direct activation of the electrolyzer.
However, with the support of the storage system, hydrogen production can still be initiated.This highlights the necessity of utilizing the storage system to capture the excess energy. Once the storage battery reaches its maximum capacity, any additional power generated by the PV system is directed to the grid. This approach ensures that the system operates efficiently, making full use of the available energy for hydrogen production while also maintaining flexibility to export excess power when storage is full.
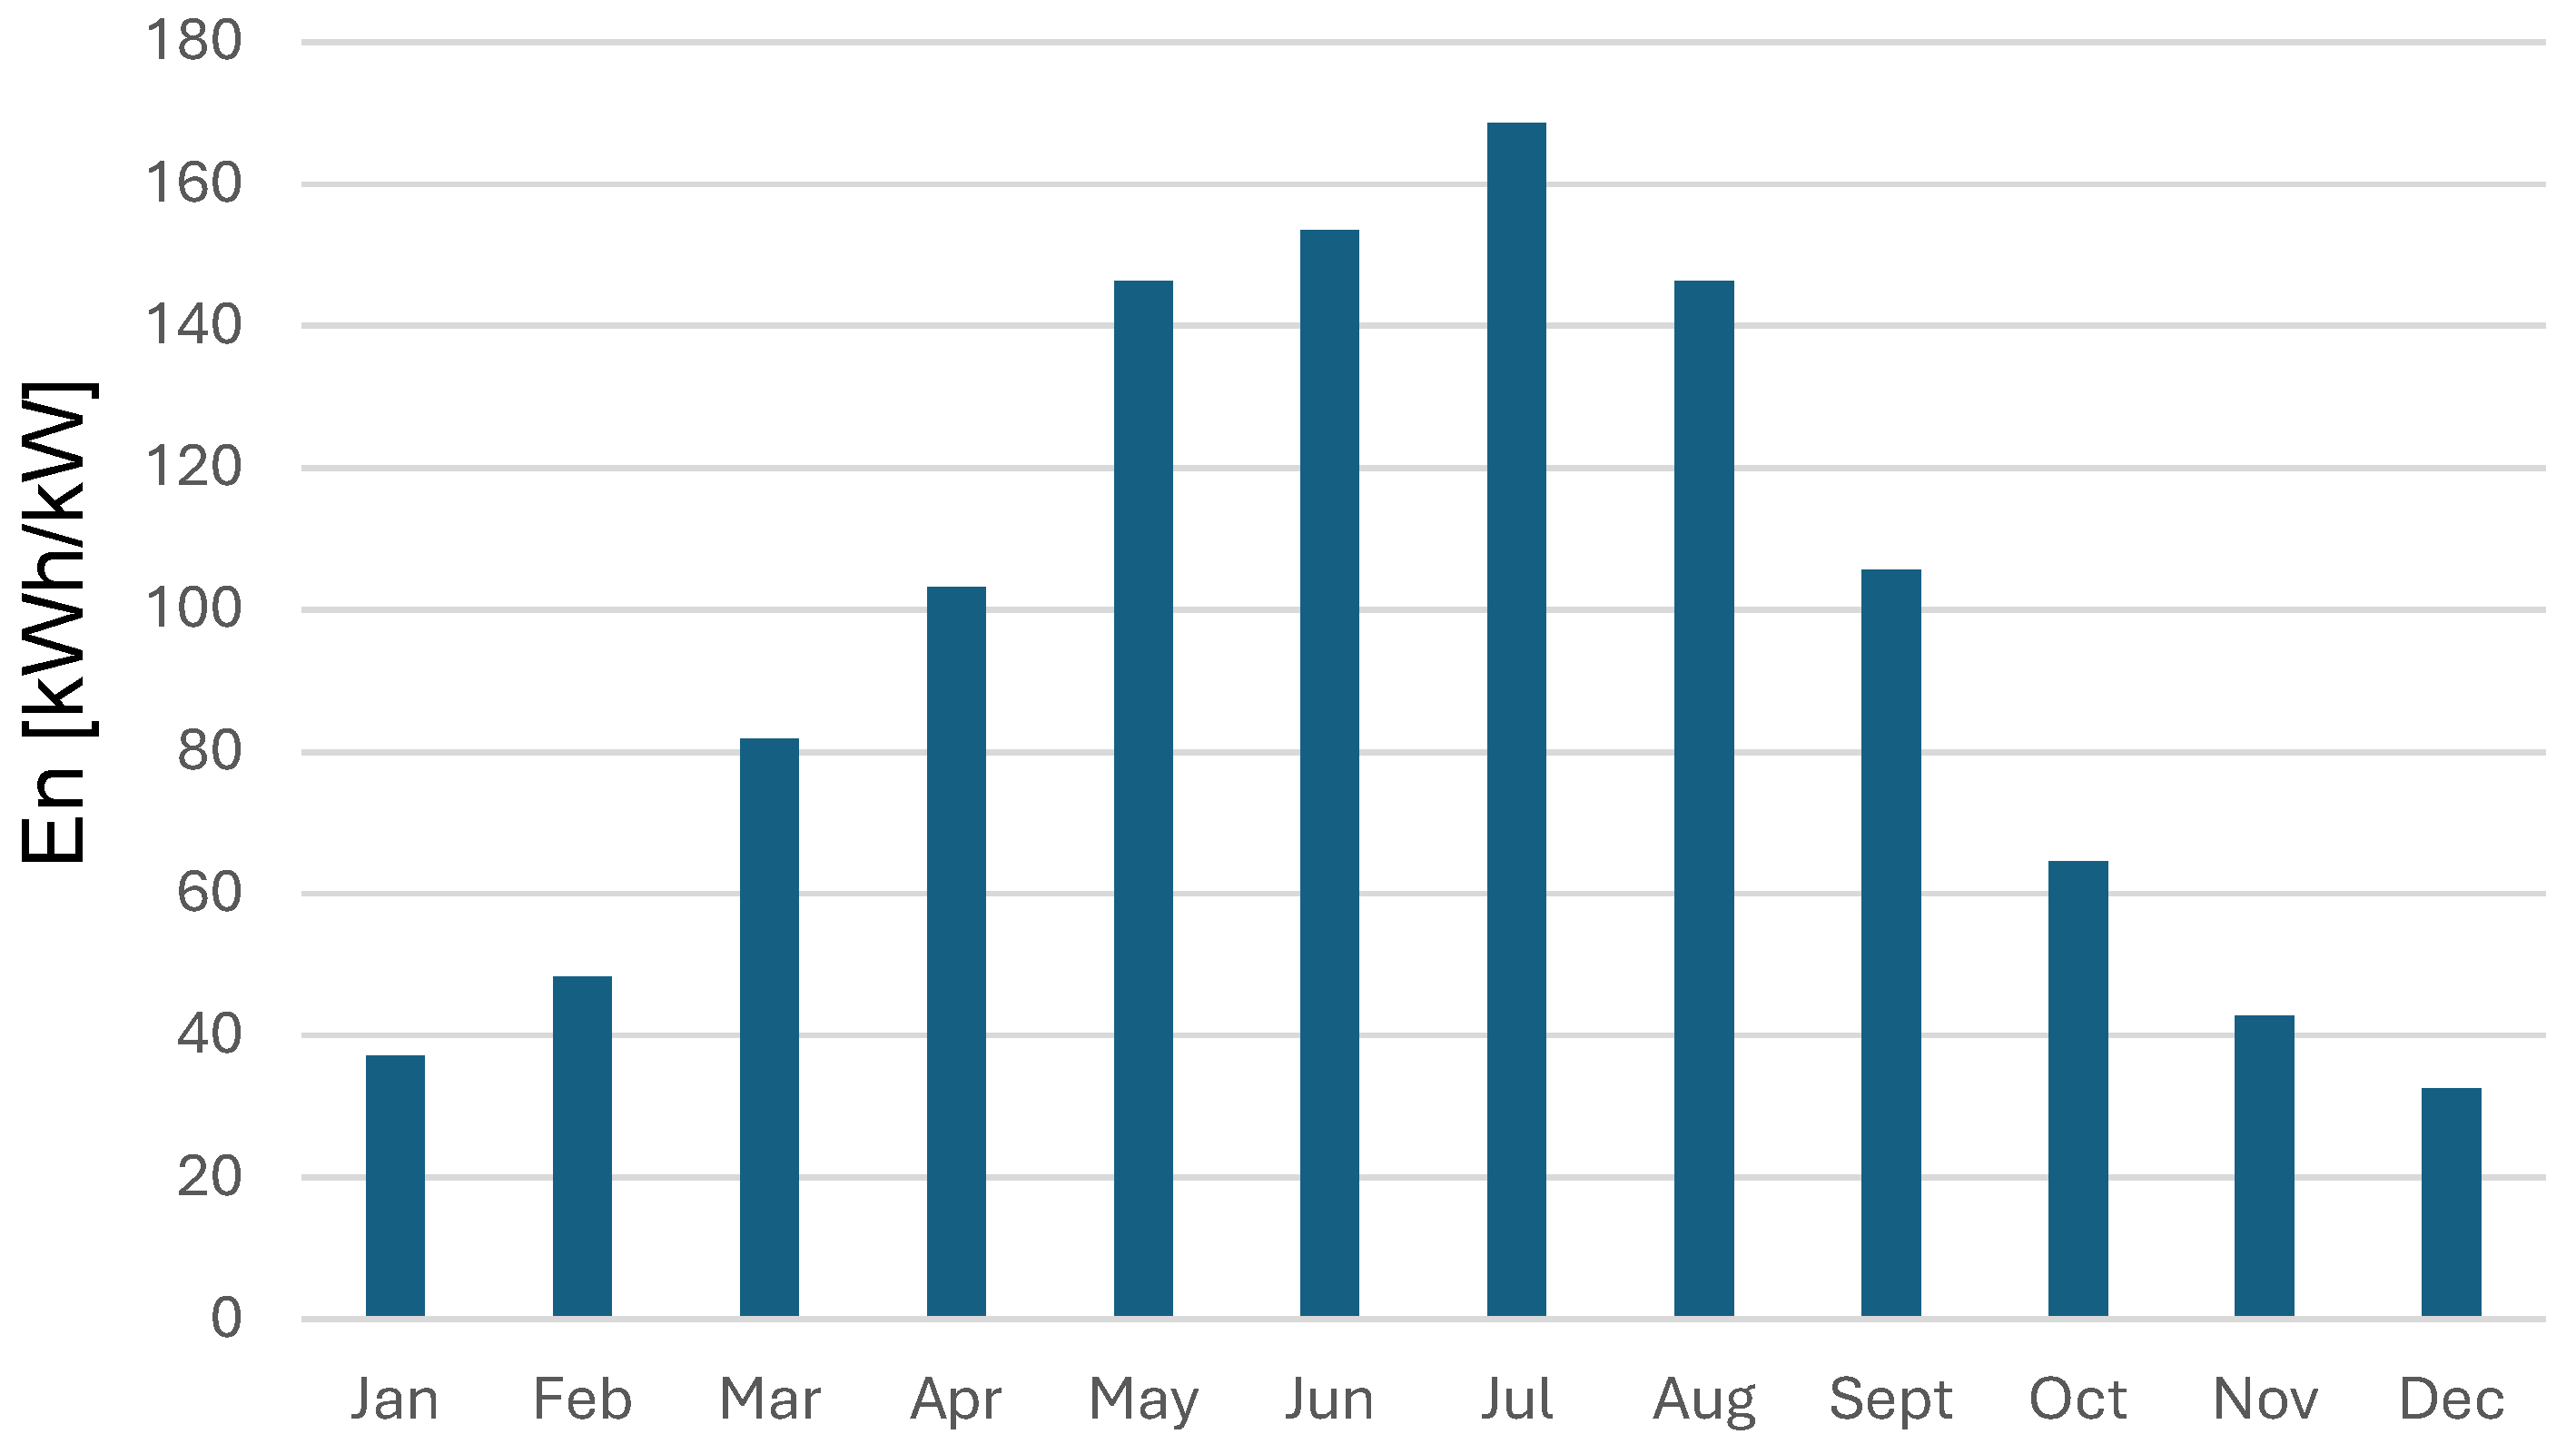
Fig. 4 provides the monthly production of the PV plant, while Fig. 5 provides a specific production, considering the energy produced for each month for the unit value of the peak power installed (1 kW). From a conceptual standpoint, the trends shown in the following figures are similar, although they offer valuable insights into some quantitative details, providing a clear understanding of the plant's performance both in total and on a per-unit basis. The logic of the system operation prioritizes hydrogen production and sending energy to the grid only when there are production surpluses, and the electrolyzer operates at nominal power and storage is full. The electrolyzer operates at four discrete power levels: 25% of nominal power, 50% of nominal power, 75% of nominal power, and full nominal power. No intermediate operating ranges are allowed.
Figure 4.
Energy generated by the PV plant for each month.
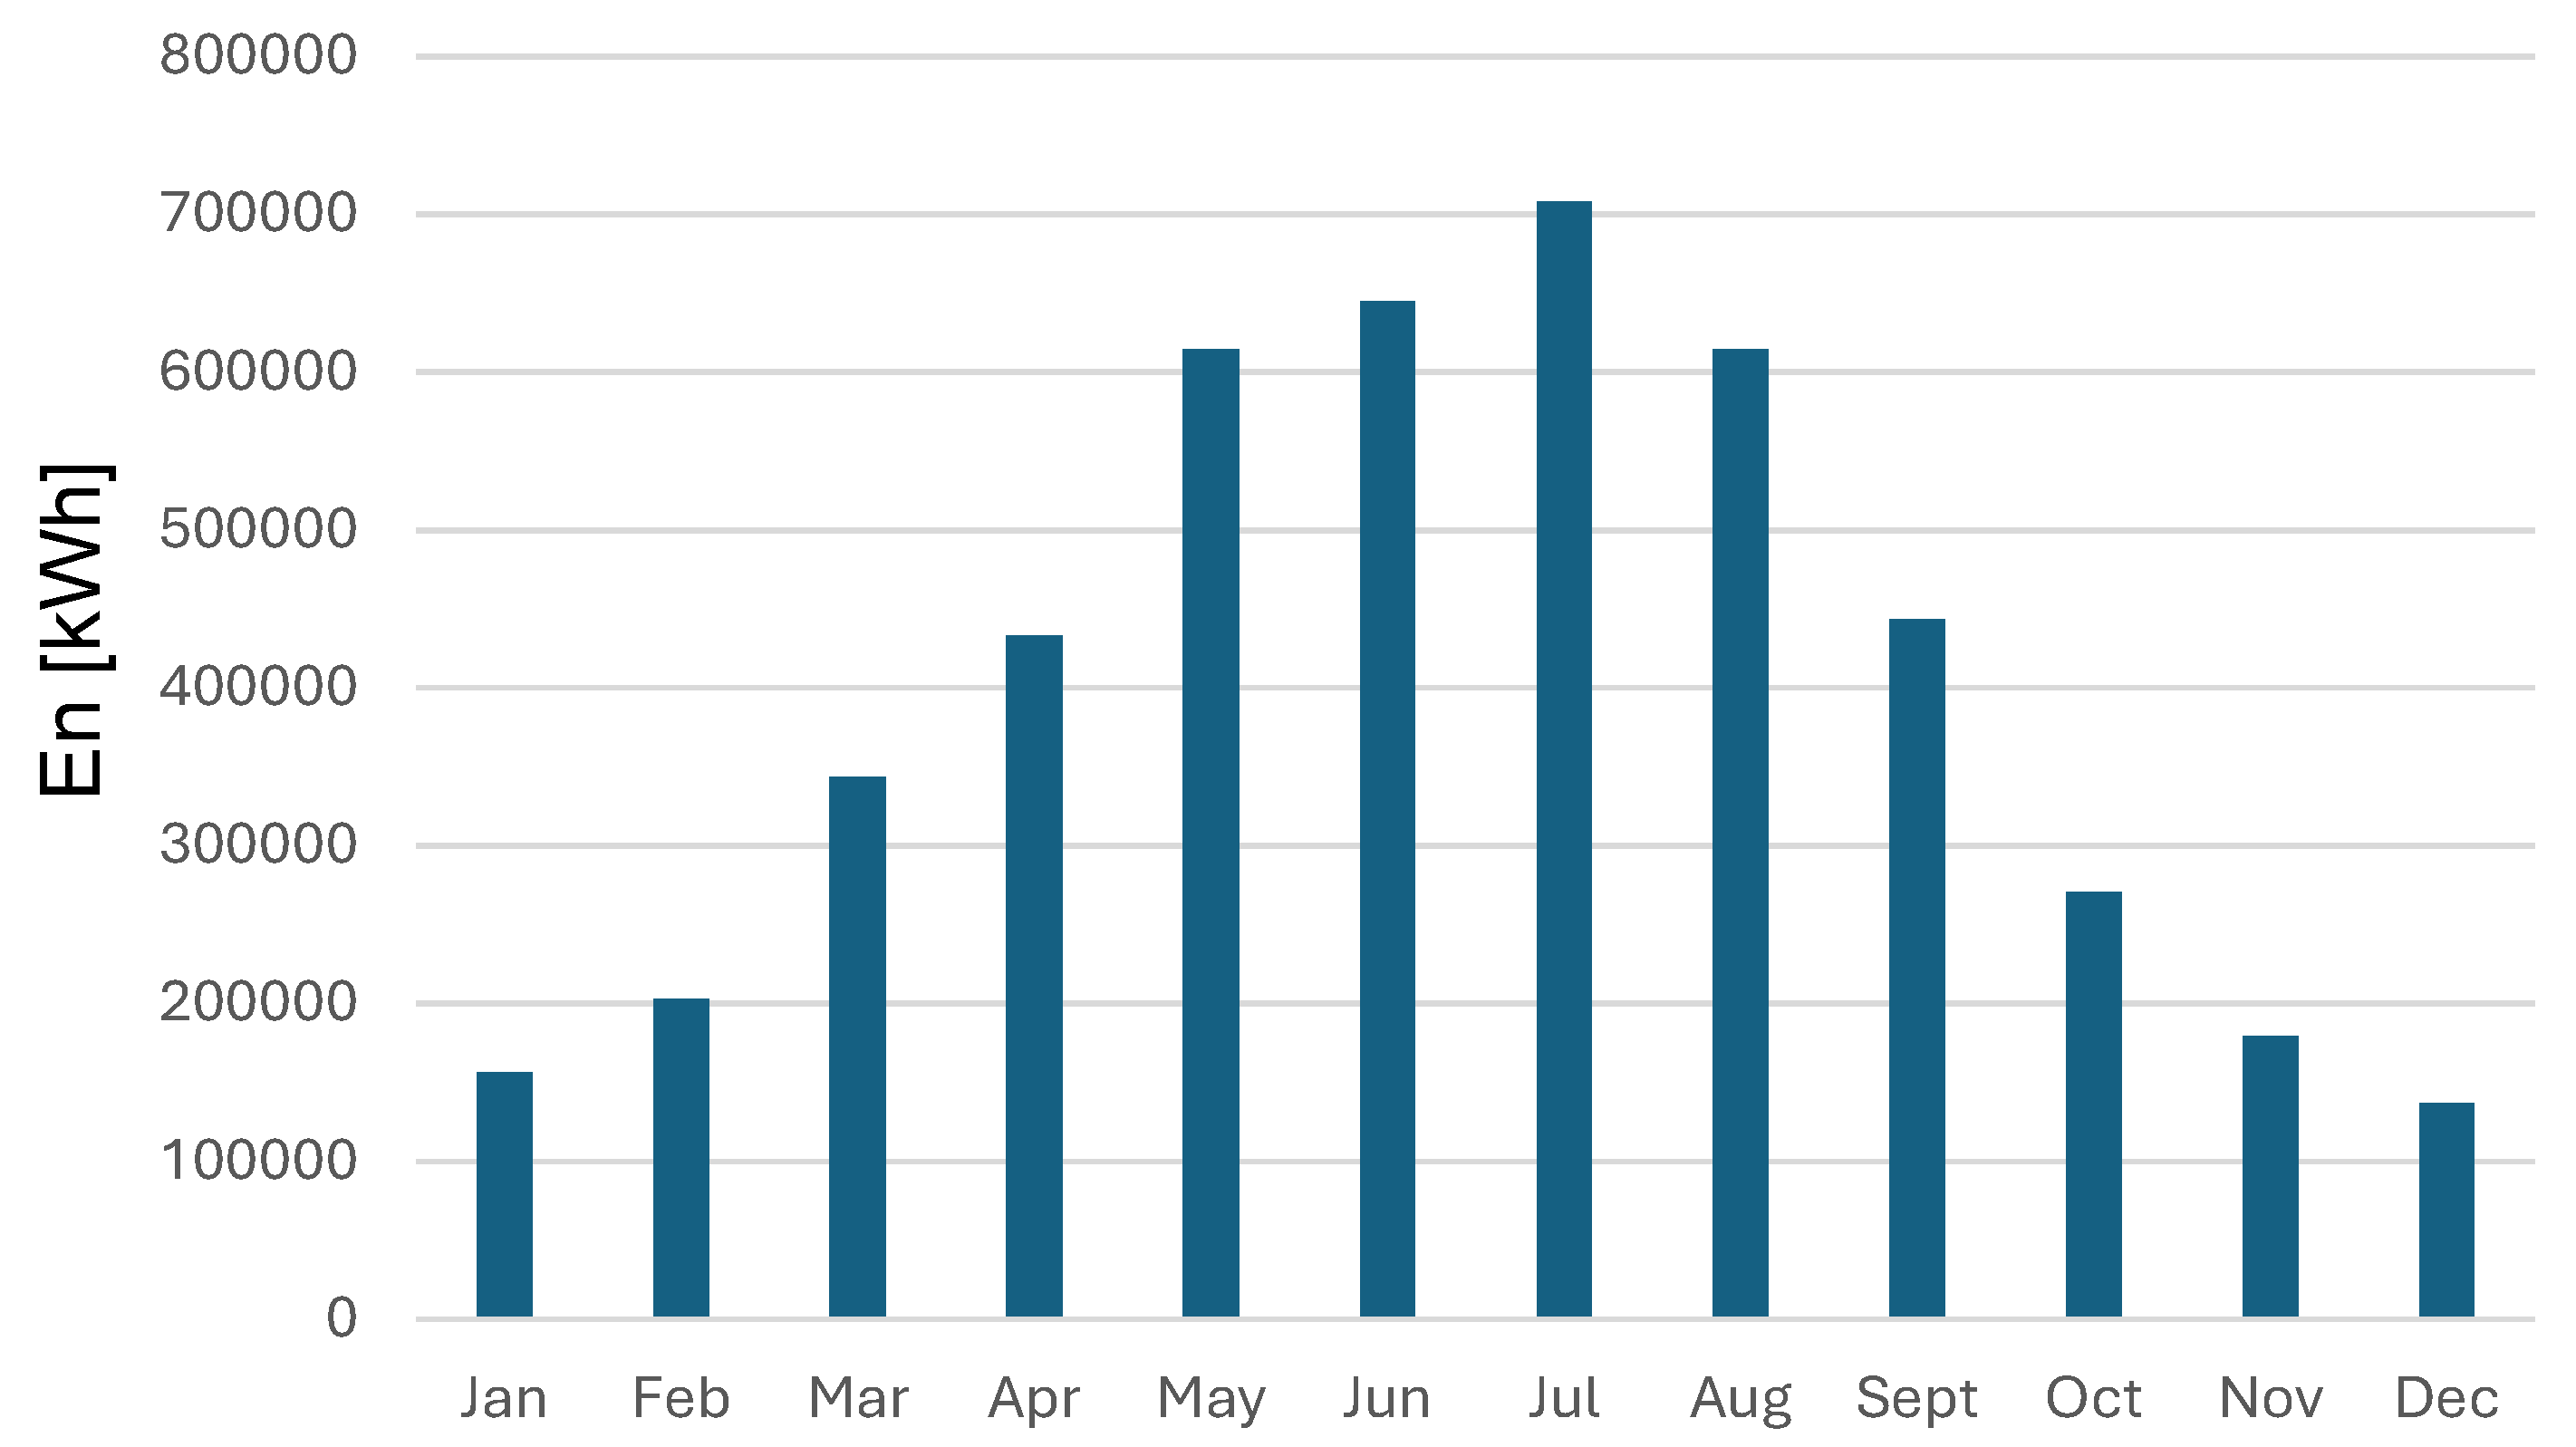
Figure 5.
Specific energy produced monthly by the PV plant.
The primary workflow is as follows:
Energy Allocation: The photovoltaic plant generates energy that is first directed towards meeting the demand of the electrolyzer, which converts the excess power into hydrogen through electrolysis. This hydrogen serves as an energy storage solution for later use or other applications.
Battery Charging: If the electrolyzer is operating at its nominal capacity and still there is additional photovoltaic energy, it is stored in a battery. The battery serves as a secondary storage medium, enabling the system to manage fluctuations in PV generation.
Grid Export: Only when both the electrolyzer is running at its full capacity and the battery reaches 100% charge does the system send any surplus energy to the grid. This typically occurs during periods of exceptionally high PV production, such as sunny summer days, when the storage facilities reach their maximum capacity.
Energy Discharge: Once the PV system ceases production (for example in the evening), the energy stored in the battery is then discharged to support the electrolyzer’s needs.
This strategy ensures efficient use of the PV generation by prioritizing hydrogen production while minimizing energy export to the grid. Six different system configurations have been analyzed. Initially, two electrolyzer configurations were selected: one with a 2 MW capacity and one with a 1 MW capacity, corresponding to around 50% and 25% of the nominal power of the photovoltaic plant, respectively. In both cases, a storage system of 2 MWh has been considered. Considering the reference case of a 2 MW electrolyzer, it operates at nominal power only briefly, remains inactive for nearly 50% of the time, and functions at nominal power for about 10% of the time. Table 6 summarizes the key operational metrics. Reducing the size of the electrolyzer while maintaining the same storage capacity increases the time the electrolyzer operates at nominal conditions and the overall hydrogen production time, as shown in Table 7. Equivalent operating hours also increase by approximately 50%, as indicated in Table 8, but total hydrogen production decreases by 50%.
Additionally, three different storage levels were examined: no storage, 1 MWh of storage, and 2 MWh of storage. Naturally, given the two electrolyzers, the larger one will operate at nominal power only for a limited number of hours, while the smaller electrolyzer will run for a greater number of hours. Table 8 provides the operating hours for each of the two electrolyzers. Table 9 provides a general analysis of the various examined strategies. As shown by the data analysis in Table 9, the requirement that 50% of the energy production be allocated to the hydrogen supply chain is met in all six cases examined, including an electrolyzer sized at a quarter of the photovoltaic plant’s power capacity. In the case of a 1 MW electrolyzer, it will operate for many more hours overall, both in total and at nominal power, ensuring that at least 50% (58%) of the generated energy is directed to the hydrogen chain. For an electrolyzer sized at half the peak power of the photovoltaic plant (2 MW), with a storage system of 2 MWh, approximately 93% of the generated energy will be allocated to hydrogen production. Solutions incorporating larger components are, from an energy perspective, less effective. However, to determine which of the six solutions is the most cost-effective, an economic analysis is necessary.
Increasing the size of the storage system appears to be not energetically advantageous. As shown in Figure 6 for the 2 MW electrolyzer case, such an increase does not result in significant improvements in hydrogen production levels. Increasing the size of the storage system, even up to 4 MWh (equivalent to the photovoltaic plant capacity), does not yield any significant energetic benefits.
Considering the case of the 2 MW electrolyze paired with a 2 MWh storage system, the following table provides an overview of the hydrogen produced and the energy exported to the electrical grid for selected typical days, offering a clear perspective on the orders of magnitude involved. Table 10 summarizes the main data. As shown in the table, the system's production varies significantly across different days, which can pose challenges for the hydrogen supply chain. Daily production ranges from approximately 26 kg on a typical cloudy winter day to a maximum of about 375 kg on a clear summer day. Similarly, the energy exported to the grid fluctuates considerably, becoming significant only during summer or mid-season days, with a peak of 3300 kWh.
6. Economic Viability and Cost-Analysis
Currently, green hydrogen production costs pose a significant challenge to the economic viability of the system. This section provides an overview of production costs for each configuration and explores possible optimization strategies, considering the six different cases summarized in Table 7.
Cost-reduction opportunities are identified by optimizing the size of the electrolyzes and storage systems, pinpointing configurations that yield the best cost-efficiency results. Figure 7 illustrates the heat map of LCOH as a function of electrolyzer and battery storage size. It can be observed that when the electrolyze size is minimal, a larger battery can be a cost-effective solution.
Conversely, when the electrolyzer size is increased, the energy from PV is more fully exploited, and consequently a smaller battery capacity optimizes the system. The minimum LCOH results equal to 5,868 €/kg with an electrolyzer power of 2 MW and a battery capacity of 2 MWh. These findings broadly align with the technical evaluations discussed in the previous section, reinforcing the idea that system optimization in terms of electrolyzer and storage size plays a critical role in achieving both energy efficiency and cost-effectiveness."
As visible in Figure 8, the requirement that at least 50% of the PV plant’s energy must be allocated toward the hydrogen production system is not a constraint within the zone of the minimum LCOH.
Indeed, the percentage falls below 50% with electrolyzer power lower than 1 MW and with low battery capacities. As previously seen, with the optimal electrolyzer and battery size, 90% of the produced energy is directed toward the hydrogen production system, with an annual hydrogen production of about 104 tonnes.
Figure 9 represents the contributions of each technology to LCOH. It can be noted that PV and electrolyzer are the main contributors to the total cost. PV impact is about 45%, of which 30.4% are for CAPEX and 14.6% are for OPEX, while electrolyzer impact is 35.7%, of which 16.1% are for CAPEX and 19.7% are for OPEX.
With regard to the NPV, a sensitivity analysis on the price of hydrogen is conducted with the objective of identifying the optimal system sizes.
Figure 10 illustrates the results. It can be observed that the positive cash flow is insufficient to repay the investment in both the grey and blue hydrogen scenarios, as the hydrogen selling price is lower than the production price, which is the LCOH.
However, if the hydrogen is sold at a price of 8 €/kg, the investment is paid back in less than nine years, with a NPV of 3.5 M€ at the end of the system's lifetime. Nevertheless, it is important to note that a hydrogen price of 8 €/kg is still considered quite high, which raises questions about the economic competitiveness of green hydrogen compared to conventional hydrogen production methods and other energy sources
7. Conclusions
This study analyzed the performance of a hybrid photovoltaic-hydrogen system, focusing on a specific configuration tied to a 4.2 MW photovoltaic plant. While the analysis is centered on this particular scale, the proposed methodology and findings have a broader conceptual significance. The framework can be adapted to systems of different sizes without losing generality, offering flexibility for various applications and scaling requirements. The findings provide valuable insights for optimizing such systems, both from a technical and from an economical perspectives:
Electrolyzer Utilization: Larger electrolyzers (e.g., the 2 MW model) operate at nominal power only for limited periods, remaining inactive for nearly half the time. Downsizing improves efficiency and operating hours at nominal power but reduces total hydrogen production by approximately 50%.
Energy Storage: Increasing storage capacity shows diminishing returns in hydrogen production beyond a certain threshold, particularly in the 2 MW electrolyzer scenario. This highlights the need for balanced and context-specific storage sizing.
Production Variability: Hydrogen production is highly variable, ranging from 26 kg/day on cloudy winter days to 375 kg/day on sunny summer days. Similarly, grid energy export peaks at 3300 kWh during high solar generation, emphasizing the need for systems to manage seasonal and daily variability.
Economic Viability: Economic feasibility depends on minimizing grid energy export and maximizing the share of photovoltaic energy directed to hydrogen production. For instance, systems designed to ensure at least 50% of PV energy supports hydrogen generation can improve economic performance.
Compression Energy: Accurate assessments of energy consumption for hydrogen compression, based on theoretical and manufacturer data, are critical to system optimization.
The analysis highlights the importance of balancing system components—photovoltaic generation, electrolyzer size, and storage capacity—to achieve operational goals and improve overall system efficiency. From an economic perspective, optimizing electrolyzer and storage sizes significantly reduces the Levelized Cost of Hydrogen (LCOH), with the best configuration achieving a minimum LCOH of 5.868 €/kg. The cost analysis indicates that the photovoltaic system and electrolyzer are the primary contributors to LCOH, accounting for 45% and 35.7%, respectively. A sensitivity analysis shows that with a hydrogen selling price of 8 €/kg, the system could achieve payback within nine years and generate a positive NPV of 3.5 M€ over its lifetime.
In conclusion, while reducing hydrogen production costs is technically feasible through system optimization, achieving economic sustainability depends on competitive hydrogen pricing and supportive policies. Future research should explore strategies to mitigate production variability, integrate other renewable sources, and analyze scalability for broader energy network integration."
From a more general perspective, systems like the one analyzed in this study could be adapted to integrate other renewable energy sources, such as wind or hydropower. These resources could complement photovoltaic generation by mitigating variability and enhancing overall system reliability. For instance, wind energy could provide a steady contribution during periods of low solar availability, while hydropower might offer dispatchable energy to stabilize operations. Such hybrid systems hold significant promise for supporting the energy transition and achieving a more balanced and resilient renewable energy network.
Author Contributions
For research articles with several authors, a short paragraph specifying their individual contributions must be provided. The following statements should be used “Conceptualization, A.F. and C.C.; methodology, A.F. and C.C.; software, A.F, C.C., A.A., M.C..; validation, A.F., C.C, A.A. M.C. and C.G.; formal analysis, A.F., C.C, A.A. M.C. and C.G..; investigation, A.F., C.C, A.A. M.C. and C.G.; resources, A.F.; data curation, A.F., C.C, A.A. M.C. and C.G..; writing—original draft preparation, A.F., C.C, A.A. M.C. and C.G..; writing—review and editing, A.F., C.C, A.A. M.C. and C.G..; visualization, A.F., C.C, A.A. M.C. and C.G..; supervision, A.F, C.C..; project administration, A.F.; funding acquisition, A.F., C.C. All authors have read and agreed to the published version of the manuscript.” Please turn to the CRediT taxonomy for the term explanation. Authorship must be limited to those who have contributed substantially to the work reported.
Funding
This work was supported by the National Recovery and Resilience Plan (NRRP), Mission 4 Com-ponent 2 Investment 1.3—Call for tender No. 1561 of 11.10.2022 of Ministero dell’Università e della Ricerca (MUR); project funded by the European Union—NextGenerationEU. Award Number: Project code PE0000021, Concession Decree No. 1561 of 11.10.2022 adopted by Ministero dell’Università e della Ricerca (MUR), CUP I53C22001450006, according to attachment E of Decree No. 1561/2022, Project title “Network 4 Energy Sustainable Transition—NEST”.
Data Availability Statement
The data will be made available upon request to interested parties.
Acknowledgments
In this section, you can acknowledge any support given which is not covered by the author contribution or funding sections. This may include administrative and technical support, or donations in kind (e.g., materials used for experiments).
Conflicts of Interest
The authors declare no conflicts of interest.
References
- Capurso, T., Stefanizzi, M., Torresi, M., & Camporeale, S. M. (2022). Perspective of the role of hydrogen in the 21st century energy transition. Energy Conversion and Management, 251, 114898. [CrossRef]
- Boudries, R., Khellaf, A., Aliane, A., Ihaddaden, L., & Khida, F. (2014). PV system design for powering an industrial unit for hydrogen production. International journal of hydrogen energy, 39(27), 15188-15195. [CrossRef]
- Hinkley, J., Hayward, J., McNaughton, R., Gillespie, R., Matsumoto, A., Watt, M., & Lovegrove, K. (2016). Cost assessment of hydrogen production from PV and electrolysis. Report to ARENA as part of Solar Fuels Roadmap, Project A-3018, 1-4.
- Qolipour, M., Mostafaeipour, A., & Tousi, O. M. (2017). Techno-economic feasibility of a photovoltaic-wind power plant construction for electric and hydrogen production: A case study. Renewable and sustainable energy reviews, 78, 113-123. [CrossRef]
- Yang, Y., Ma, C., Lian, C., Zhang, Y., & Pang, X. (2021). Optimal power reallocation of large-scale grid-connected photovoltaic power station integrated with hydrogen production. Journal of Cleaner Production, 298, 126830. [CrossRef]
- Palmer, G., Roberts, A., Hoadley, A., Dargaville, R., & Honnery, D. (2021). Life-cycle greenhouse gas emissions and net energy assessment of large-scale hydrogen production via electrolysis and solar PV. Energy & Environmental Science, 14(10), 5113-5131. [CrossRef]
- Maurer, W., Rechberger, P., Justl, M., & Keuschnigg, R. (2022). Parameter study for dimensioning of a PV optimized hydrogen supply plant. International Journal of Hydrogen Energy, 47(97), 40815-40825. [CrossRef]
- Gallardo, F., García, J., Ferrario, A. M., Comodi, G., & Chiu, J. N. (2022). Assessing sizing optimality of OFF-GRID AC-linked solar PV-PEM systems for hydrogen production. international journal of hydrogen energy, 47(64), 27303-27325. [CrossRef]
- Wei, D., Li, H., Ren, Y., Yao, X., Wang, L., & Jin, K. (2022). Modeling of hydrogen production system for photovoltaic power generation and capacity optimization of energy storage system. Frontiers in Energy Research, 10, 1004277. [CrossRef]
- REN21, Renewables 2024 Global Status Report – Global Overview, available at: https://www.ren21.net/reports/global-status-report/ (last accessed on 18 December 2024).
- MCPHY MCLYZER PRODUCT LINE Pressurized alkaline electrolysis, available at https://cellar-c2.services.clever-cloud.com/com-mcphy/uploads/2023/06/2023_McLyzer-Product-Line-EN.pdf (last accessed on 18 December 2024).
- Franco, A., & Giovannini, C. (2024). Hydrogen Gas Compression for Efficient Storage: Balancing Energy and Increasing Density. Hydrogen, 5(2), 293-311. [CrossRef]
- Ríos, C., Molina, P., de León, C. M., & Brey, J. J. (2024). Simulation of the optimal plant size to produce renewable hydrogen based on the available electricity. International Journal of Hydrogen Energy, 52, 1325-1337. [CrossRef]
- Marocco, P., Gandiglio, M., & Santarelli, M. (2024). Optimal design of PV-based grid-connected hydrogen production systems. Journal of Cleaner Production, 434, 140007. [CrossRef]
- Mati, A., Ademollo, A., & Carcasci, C. (2023). Assessment of paper industry decarbonization potential via hydrogen in a multi-energy system scenario: A case study. Smart Energy, 11, 100114. [CrossRef]
- IEA, Photovoltaic Power Systems Programme, National Survey Report of PV Power Applications in Italy 2022, available at https://iea-pvps.org/wp-content/uploads/2023/08/National-Survey-Report-of-PV-Power-Applications-in-Italy-2022.pdf (last accessed on 18 December 2024).
- NREL Annual Technology Baseline (ATB), available at https://atb.nrel.gov/ (last accessed on 18 December 2024).
- Cole, W. and Akash K., (2023). Cost Projections for Utility-Scale Battery Storage: 2023 Update. Golden, CO: National Renewable Energy Laboratory.NREL/TP-6A40-85332. Available at https://www.nrel.gov/docs/fy23osti/85332.pdf. (last accessed on 18 December 2024).
- European Hydrogen Observatory, Electrolyzers cost at reference year 2023, available at https://observatory.clean-hydrogen.europa.eu/hydrogen-landscape/production-trade-and-cost/electrolyser-cost (last accessed on 18 December 2024).
- Brandt, J., Iversen, T., Eckert, C., Peterssen, F., Bensmann, B., Bensmann, A., ... & Hanke-Rauschenbach, R. (2024). Cost and competitiveness of green hydrogen and the effects of the European Union regulatory framework. Nature Energy, 1-11. [CrossRef]
- Ademollo, A., Mati, A., Pagliai, M., & Carcasci, C. (2024). Exploring the role of hydrogen in decarbonizing energy-intensive industries: A techno-economic analysis of a solid oxide fuel cell cogeneration system. Journal of Cleaner Production, 469, 143254. [CrossRef]
- BloombergNEF, Green Hydrogen to Undercut Gray Sibling by End of Decade, available at https://about.bnef.com/blog/green-hydrogen-to-undercut-gray-sibling-by-end-of-decade/ (last accessed on 18 December 2024).
Figure 1.
Global photovoltaic (PV) installations: trends in installed capacity (GW) and energy generation (TWh) in the current century.
Figure 1.
Global photovoltaic (PV) installations: trends in installed capacity (GW) and energy generation (TWh) in the current century.
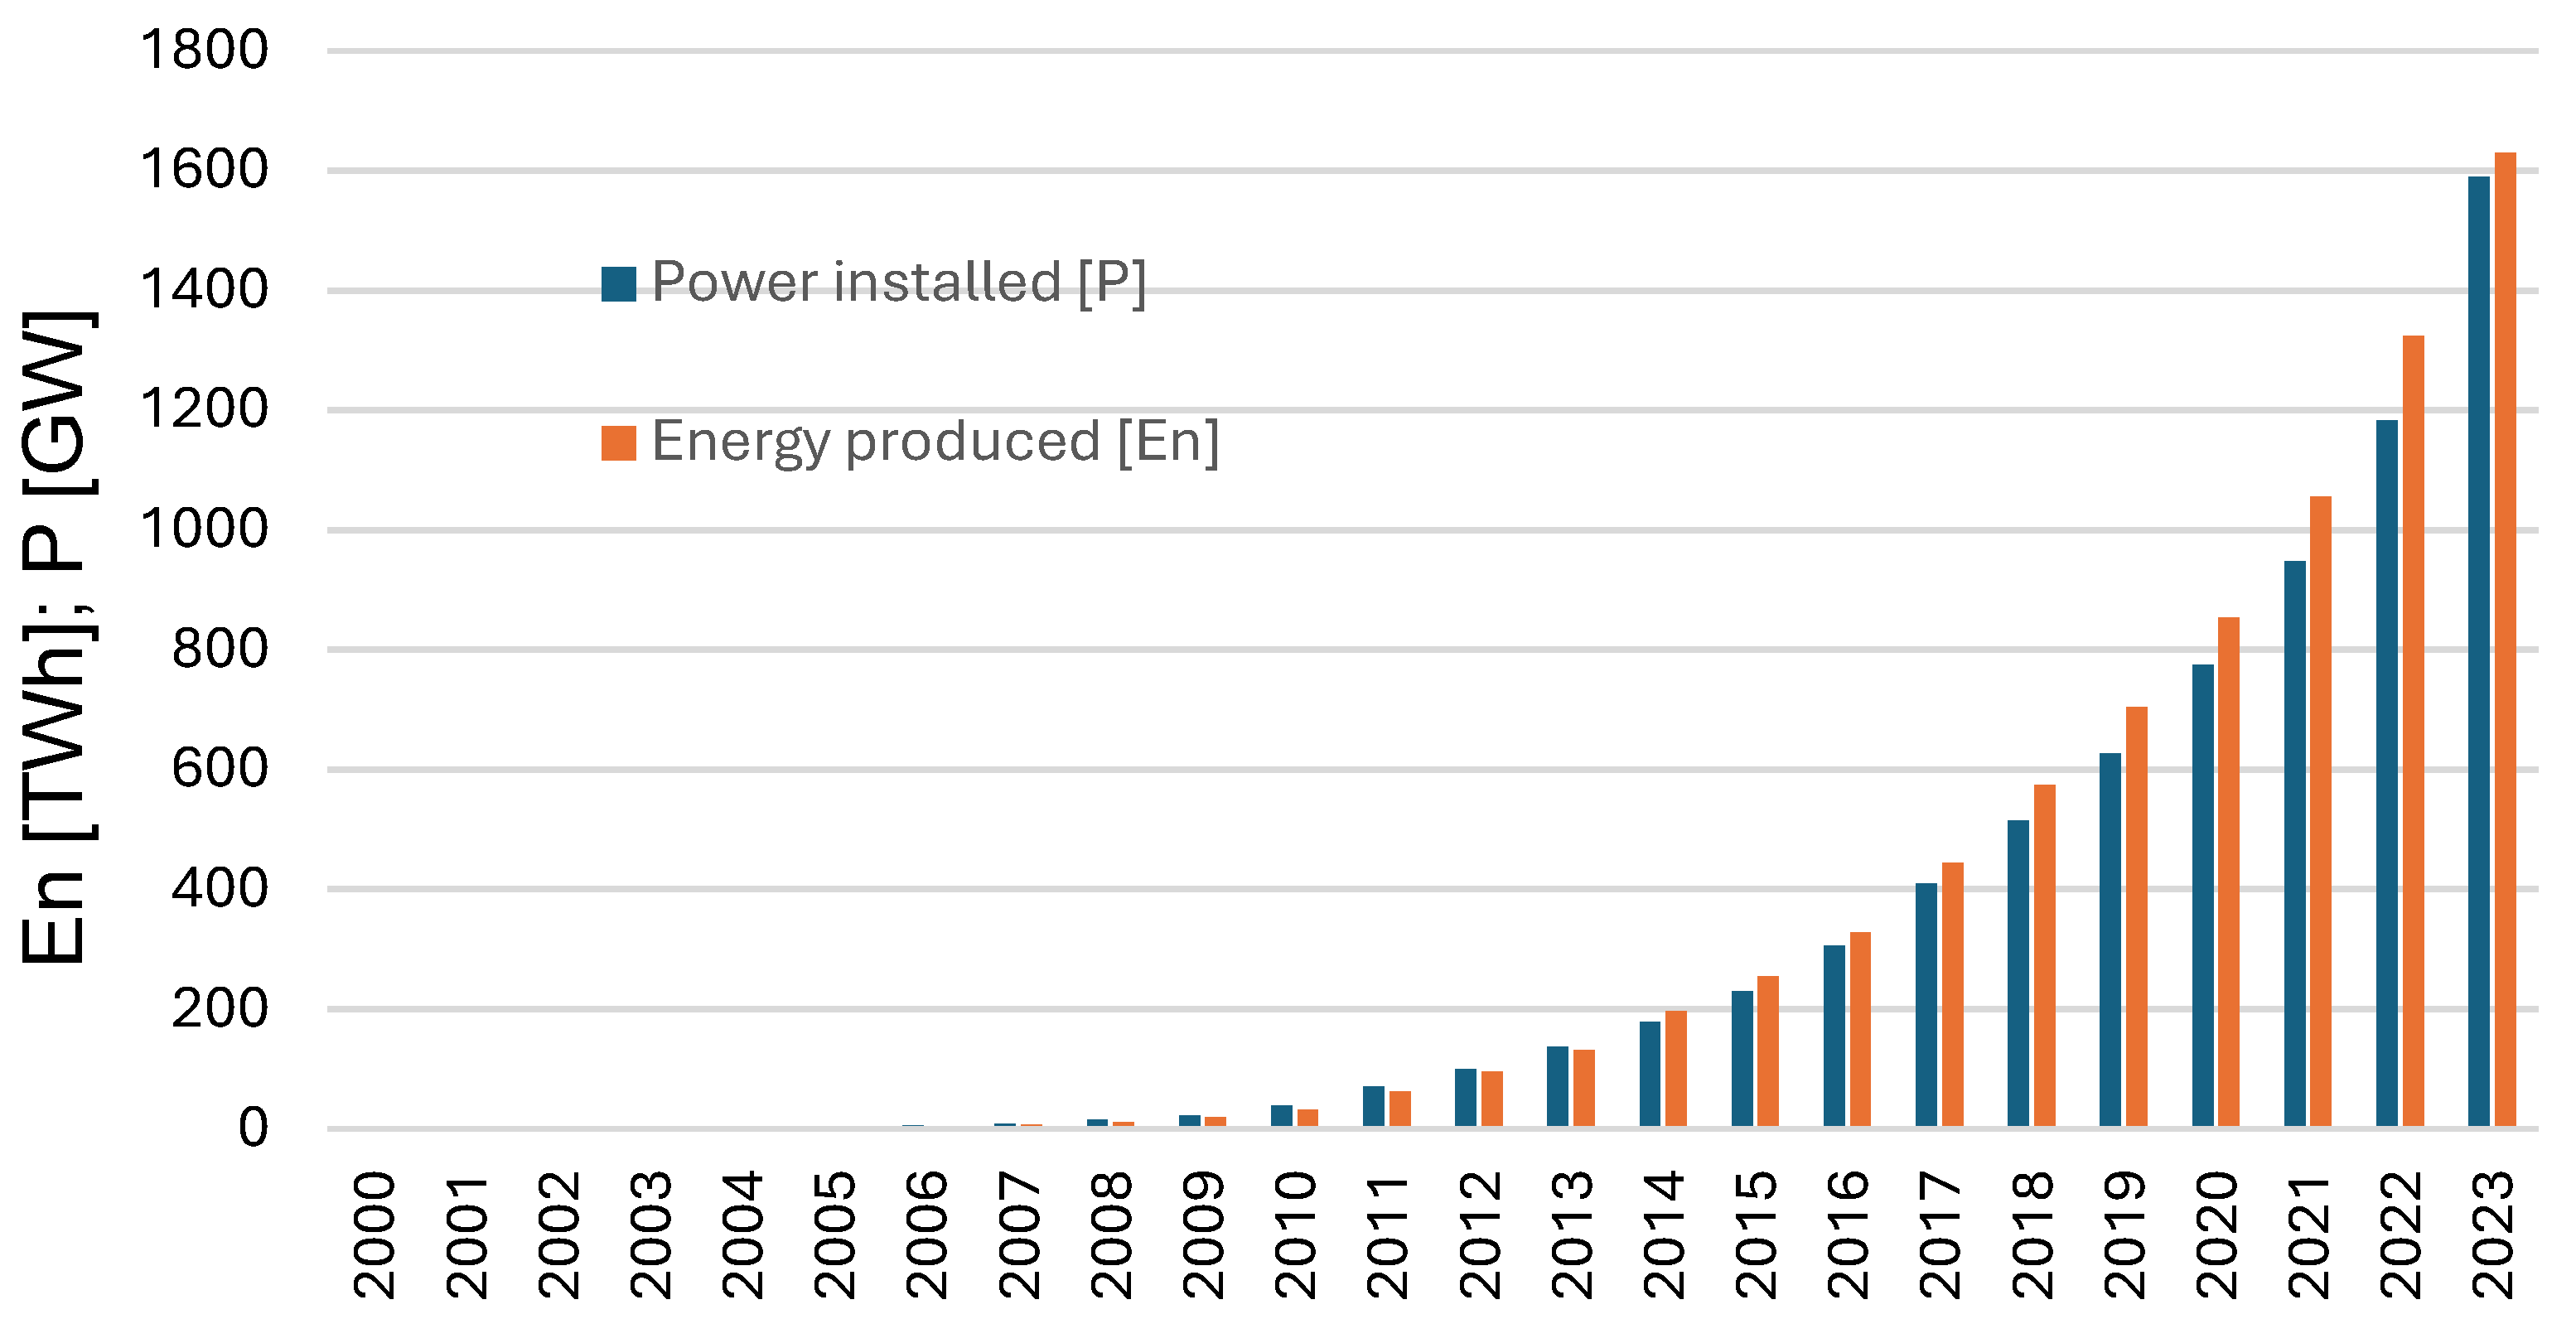
Figure 3.
Energy generated by the PV plant in three weeks in January (a), April (b) and July (c).
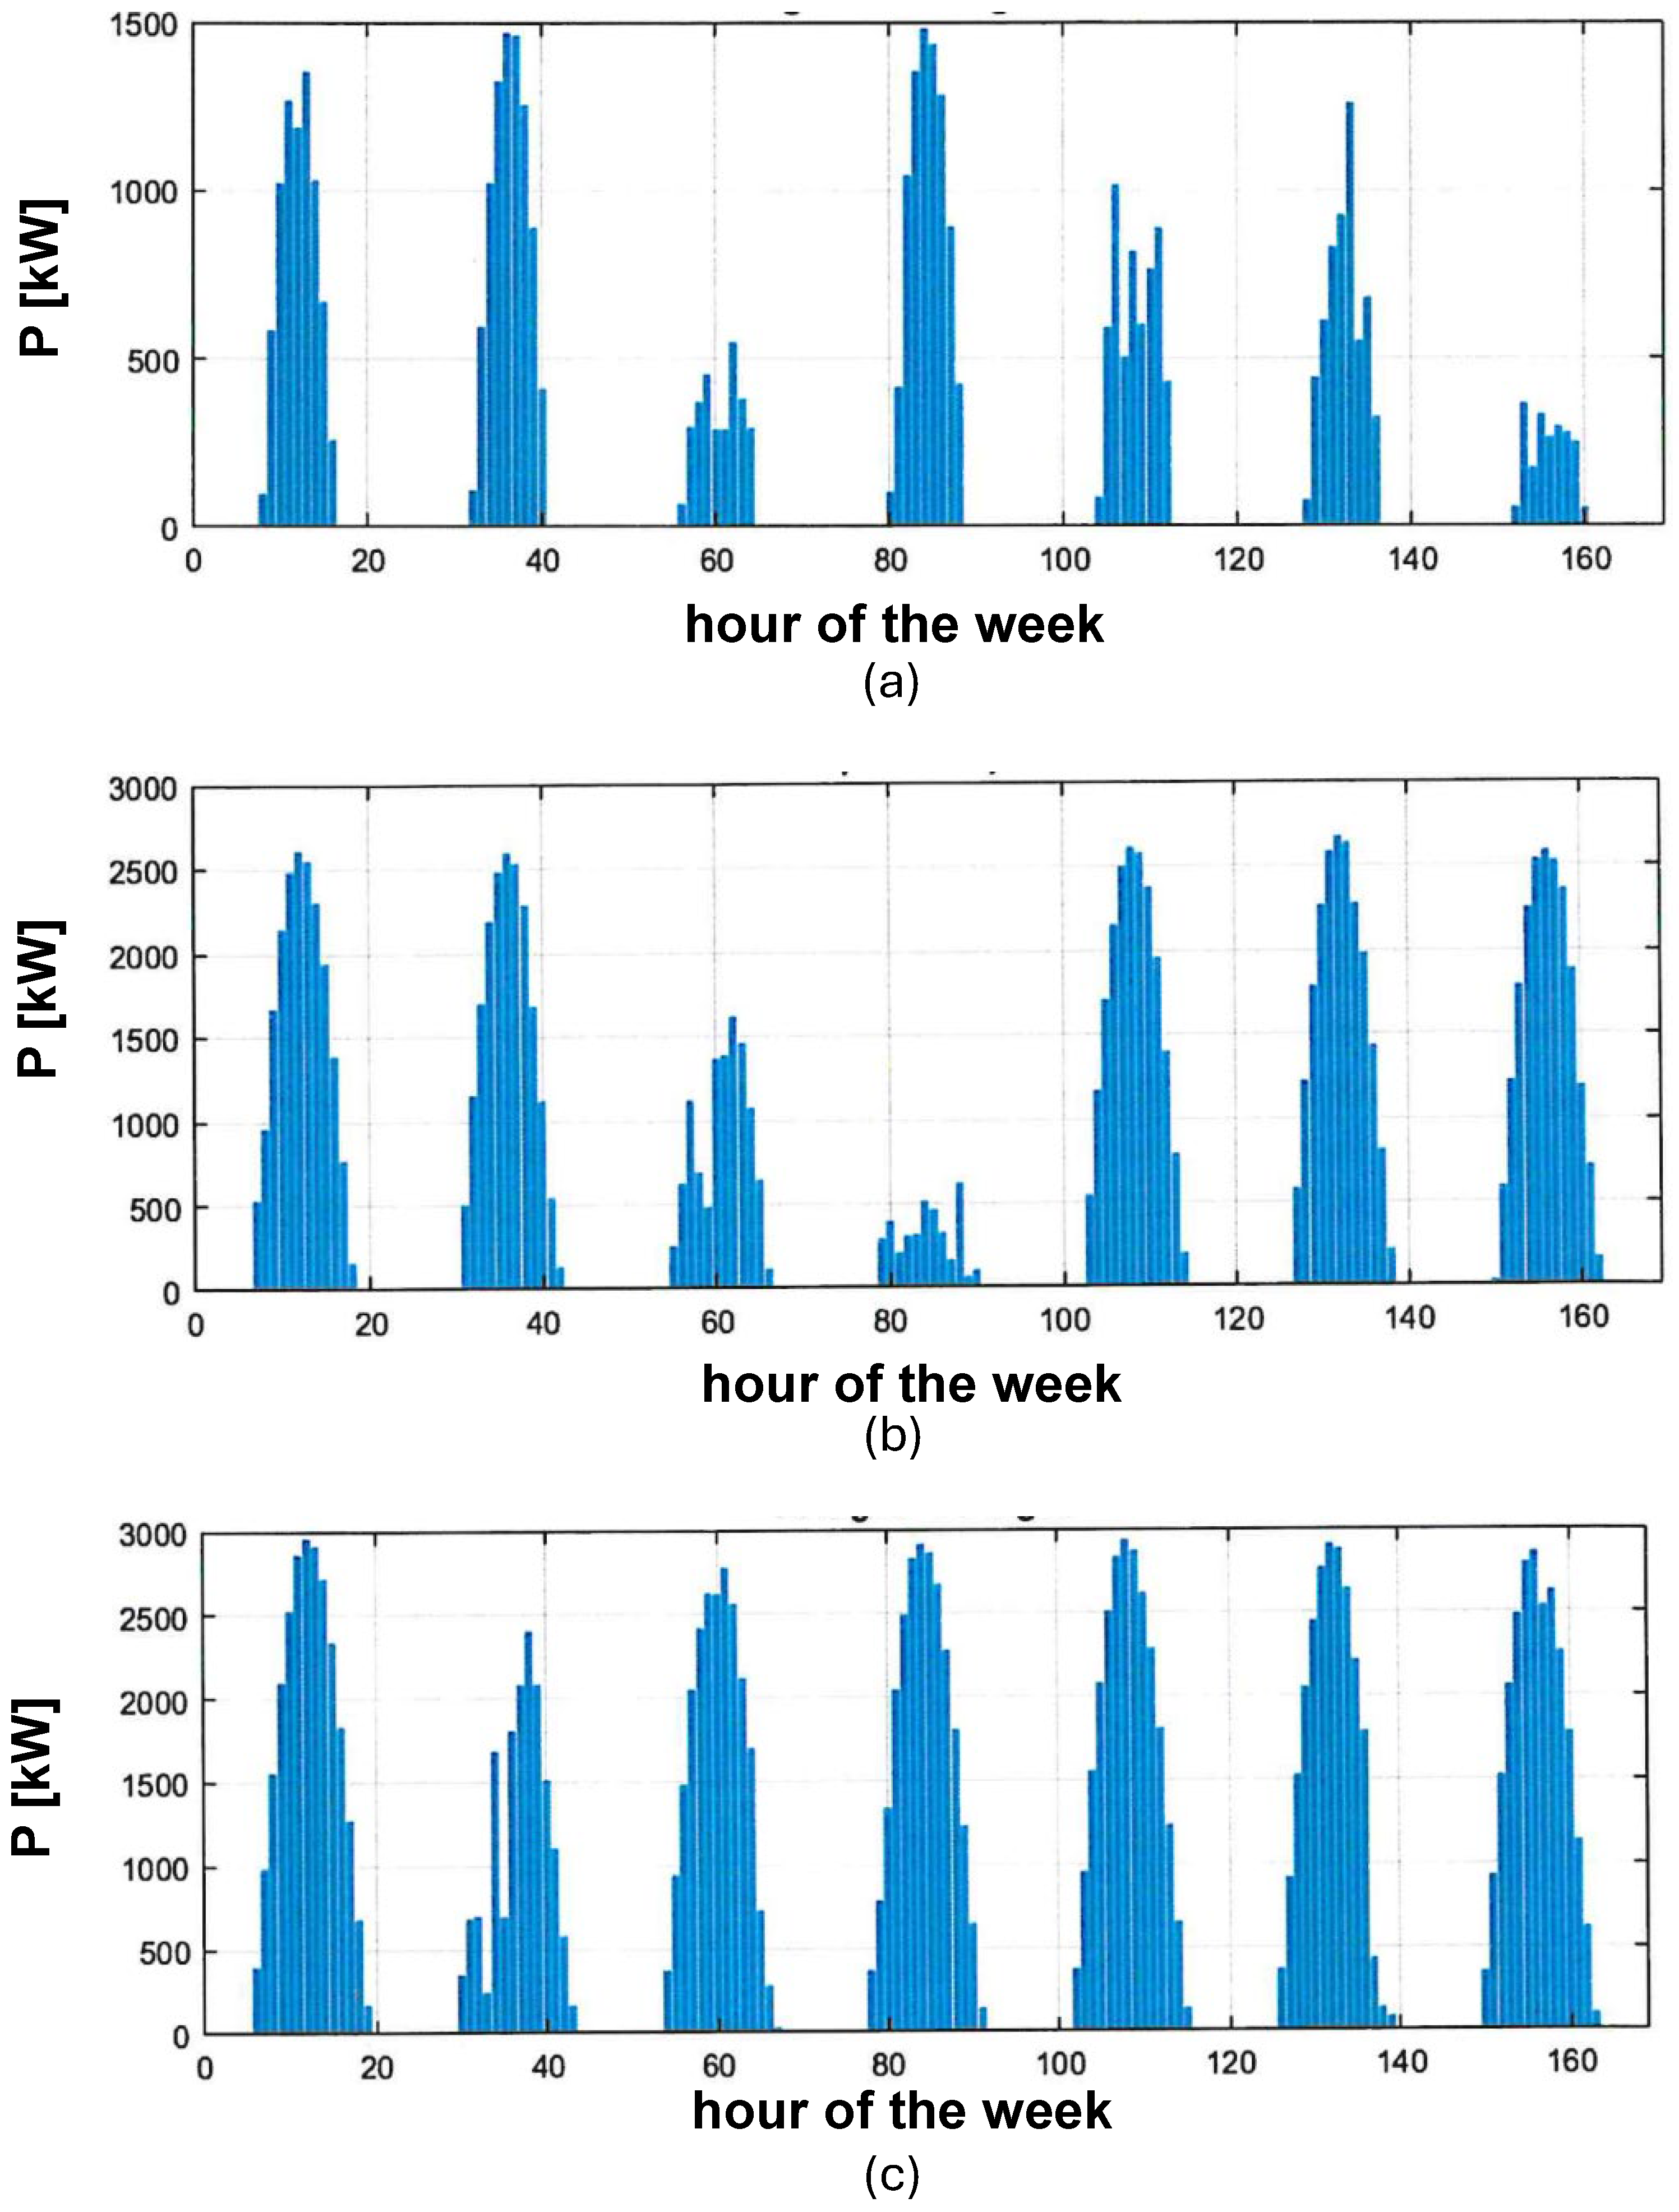
Figure 6.
Increase of hydrogen production with the increase of the size of the storage.
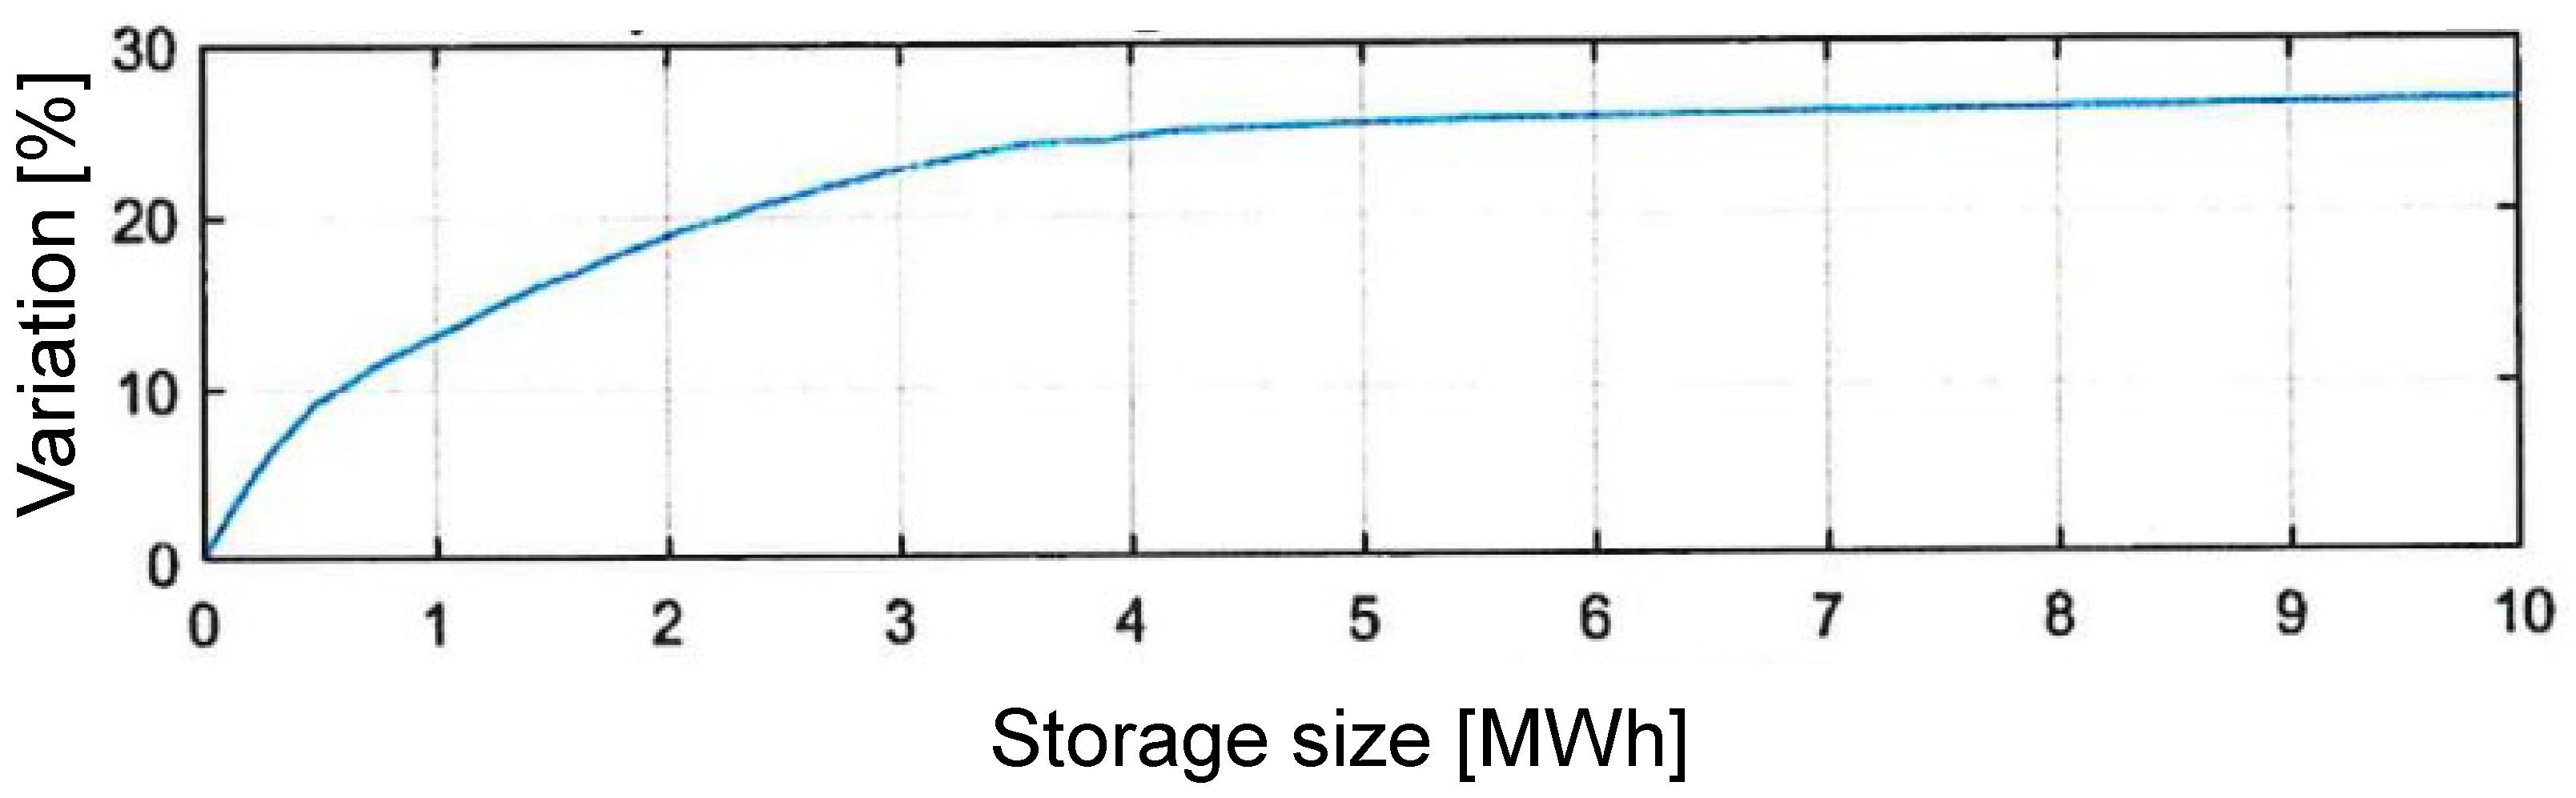
Figure 7.
LCOH heatmap varying battery capacity and electrolyzer power.
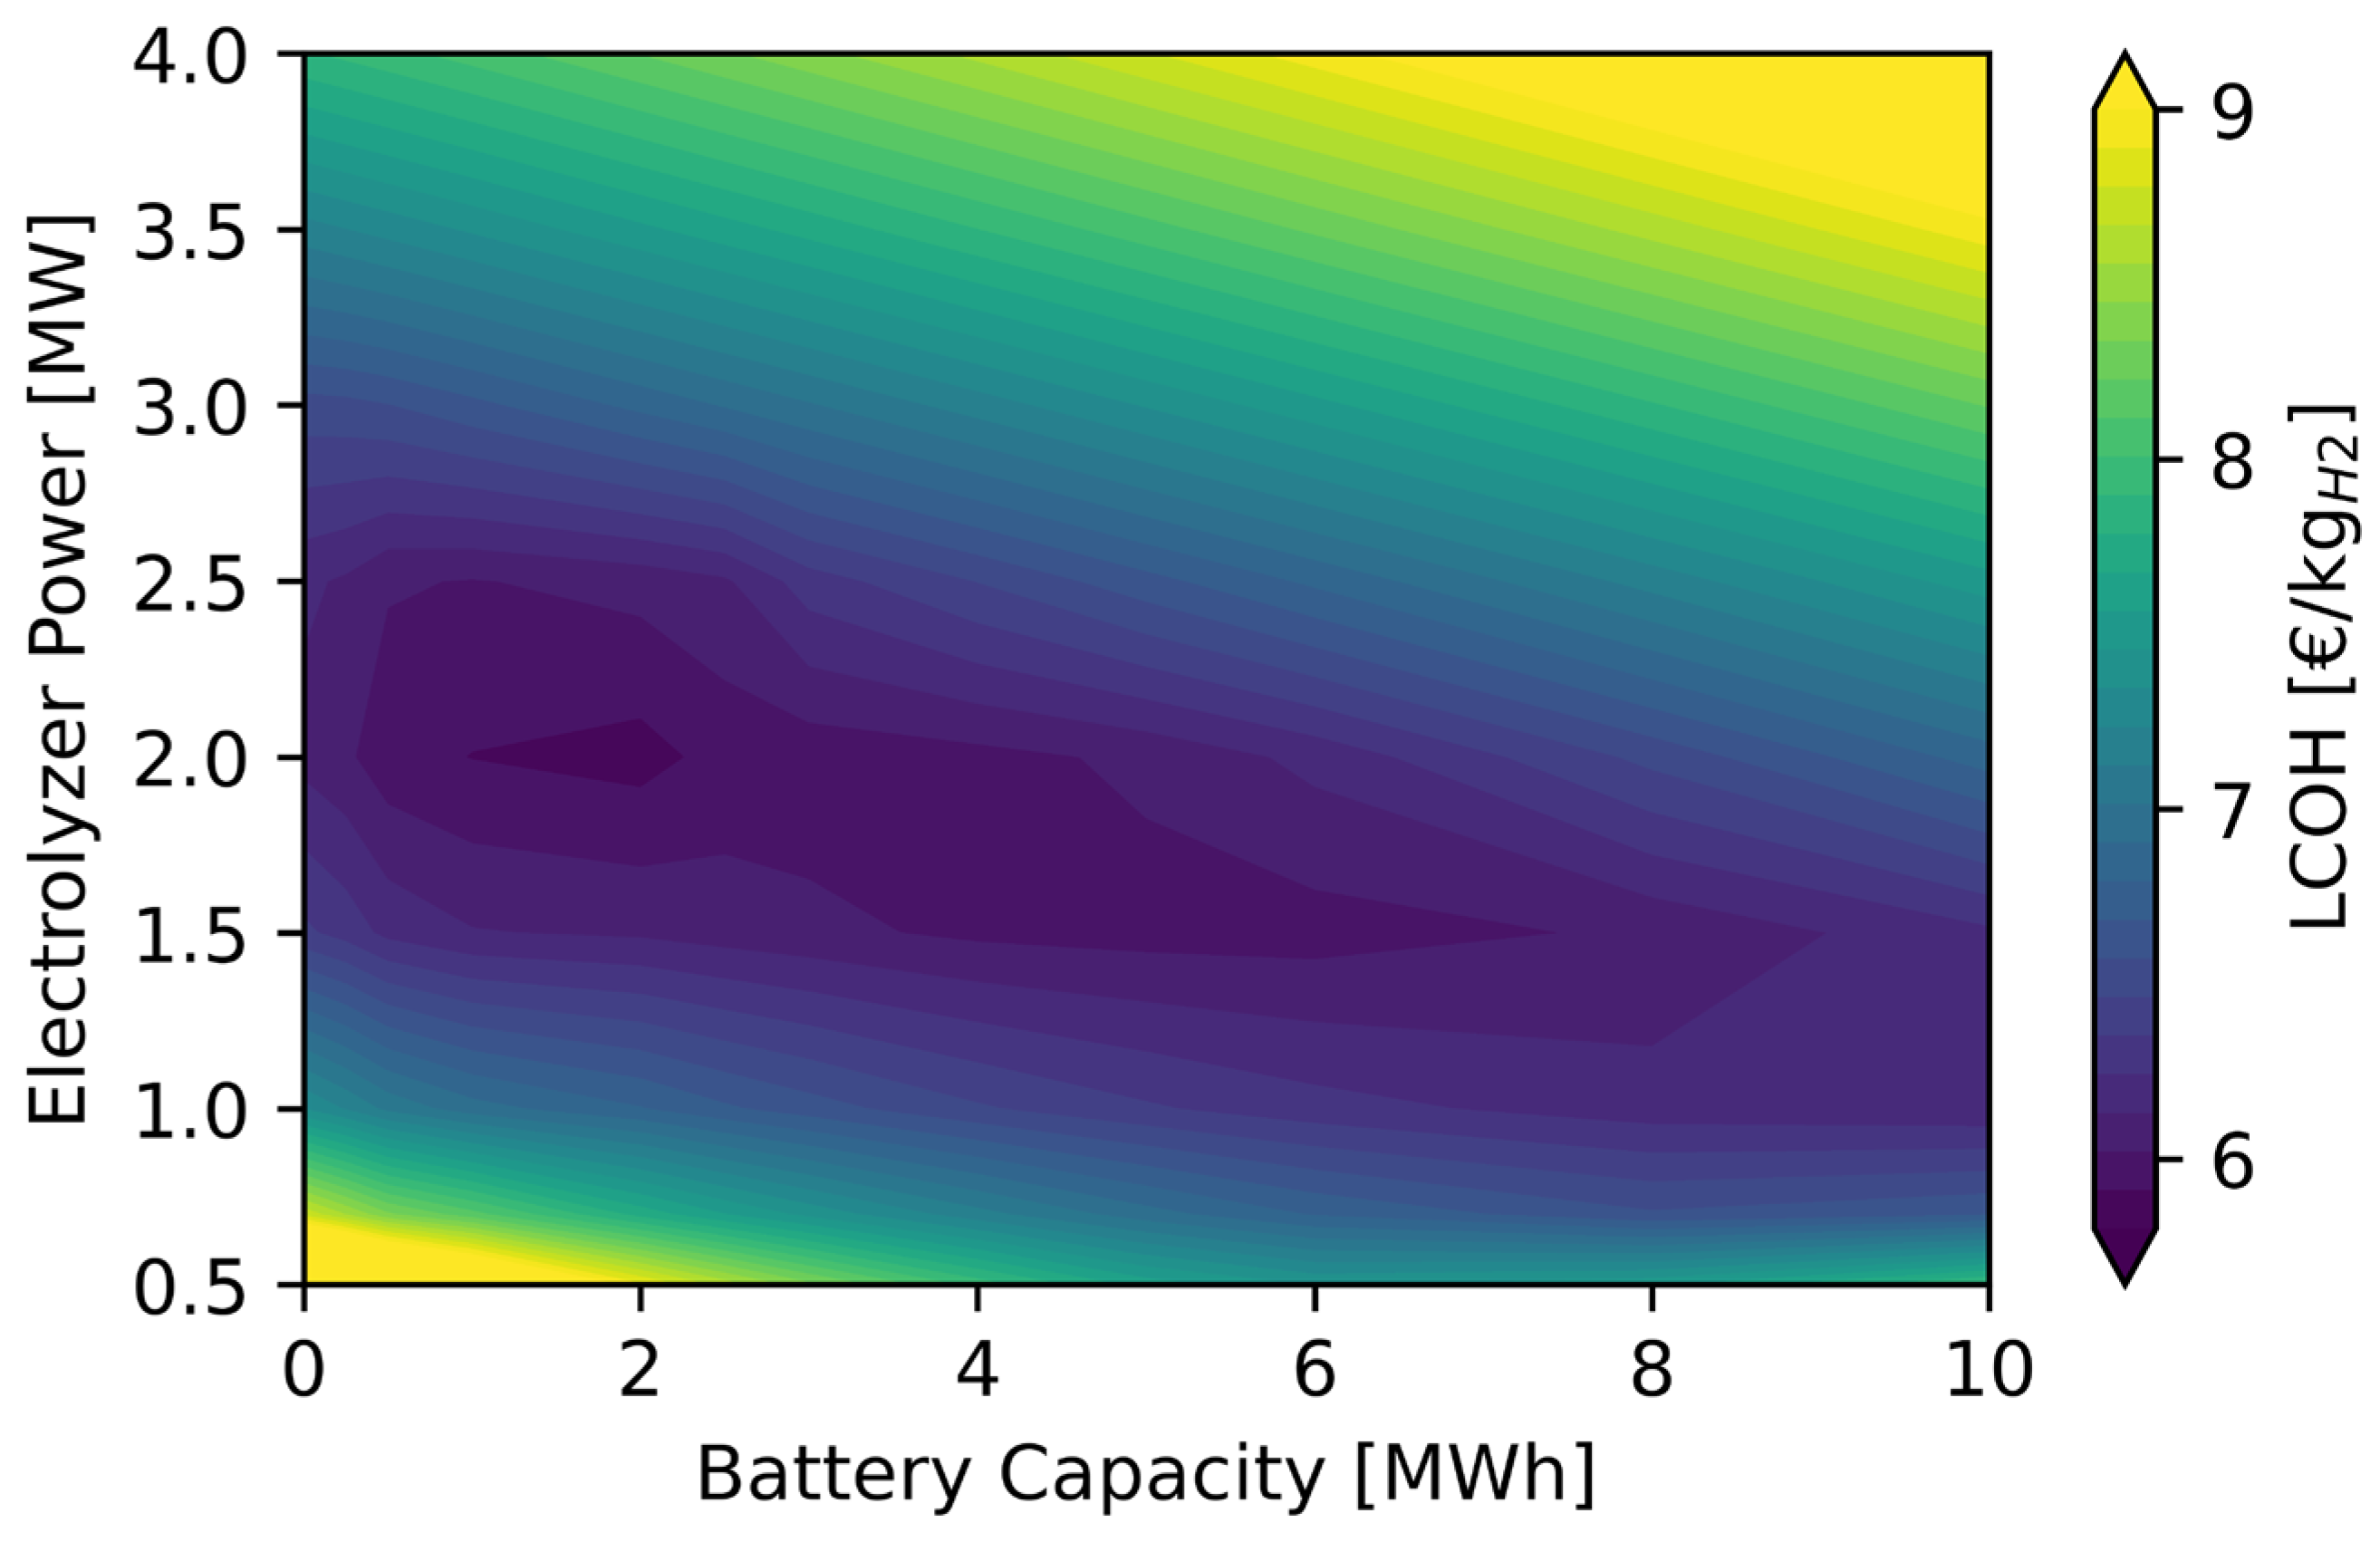
Figure 8.
Percentage of PV energy to hydrogen production heatmap varying battery capacity and electrolyzer power.
Figure 8.
Percentage of PV energy to hydrogen production heatmap varying battery capacity and electrolyzer power.
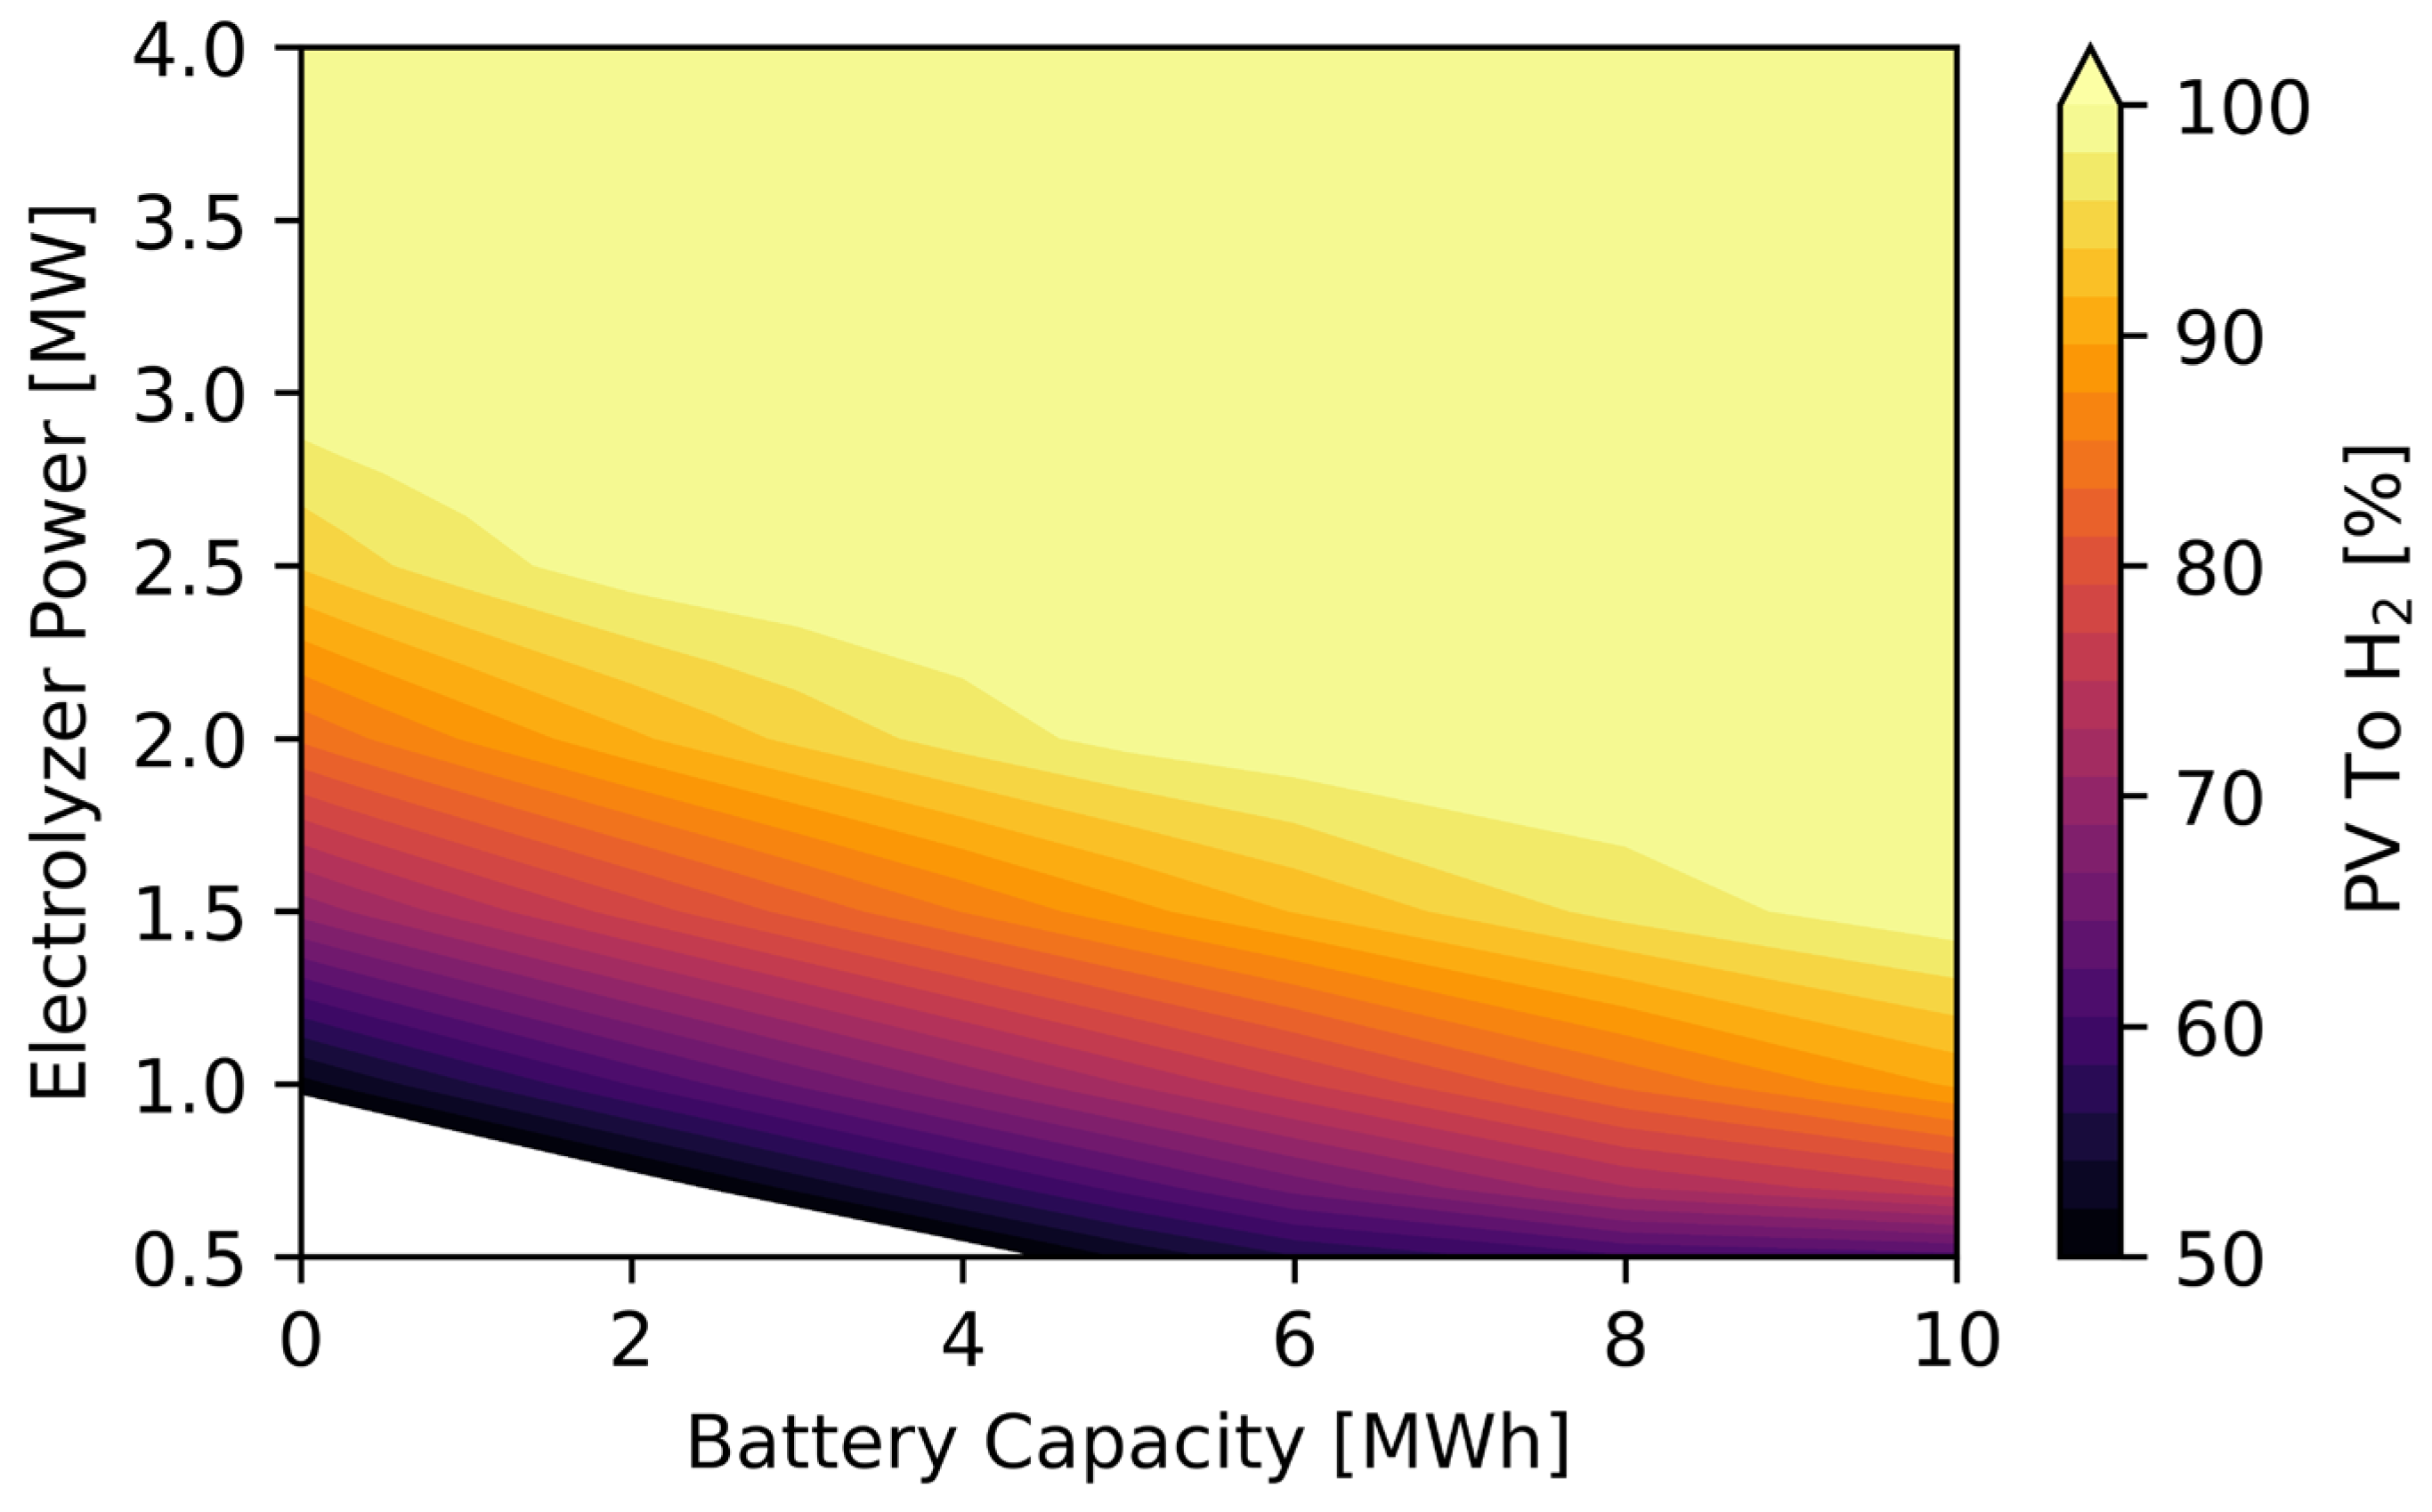
Figure 9.
Technologies contributions to Levelized Cost of Hydrogen.
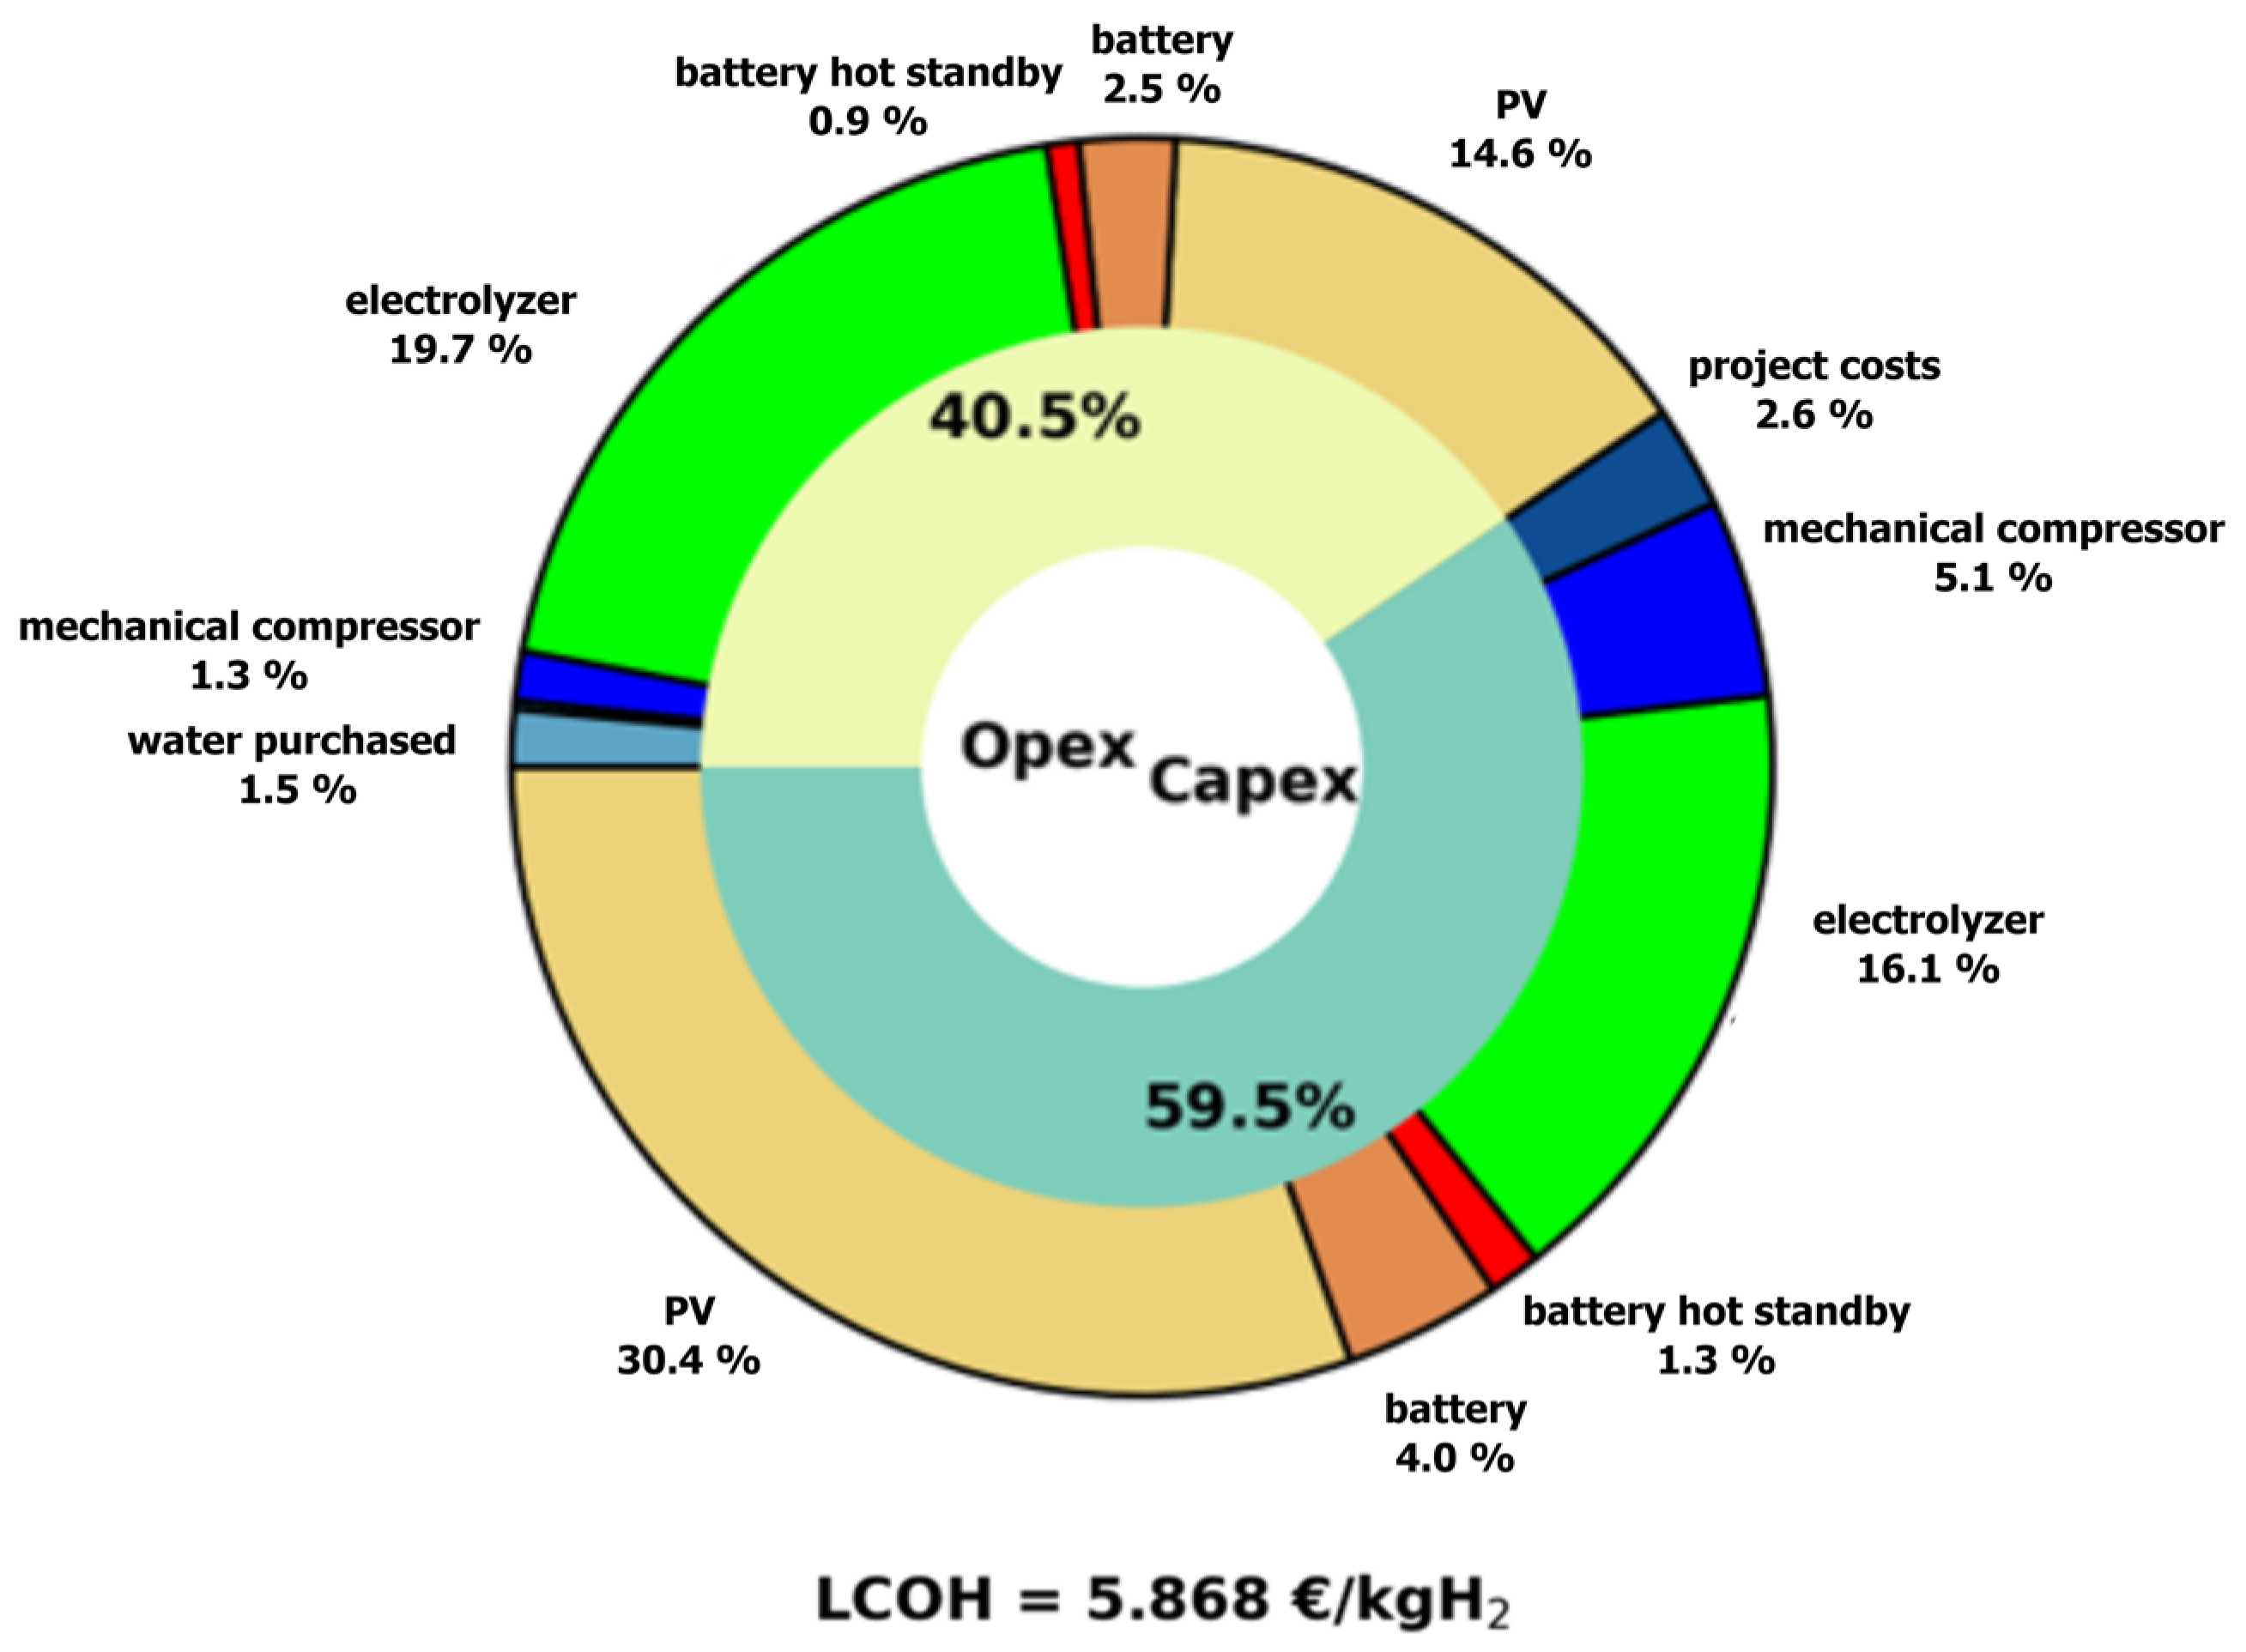
Figure 10.
Net Present Value with different hydrogen prices.
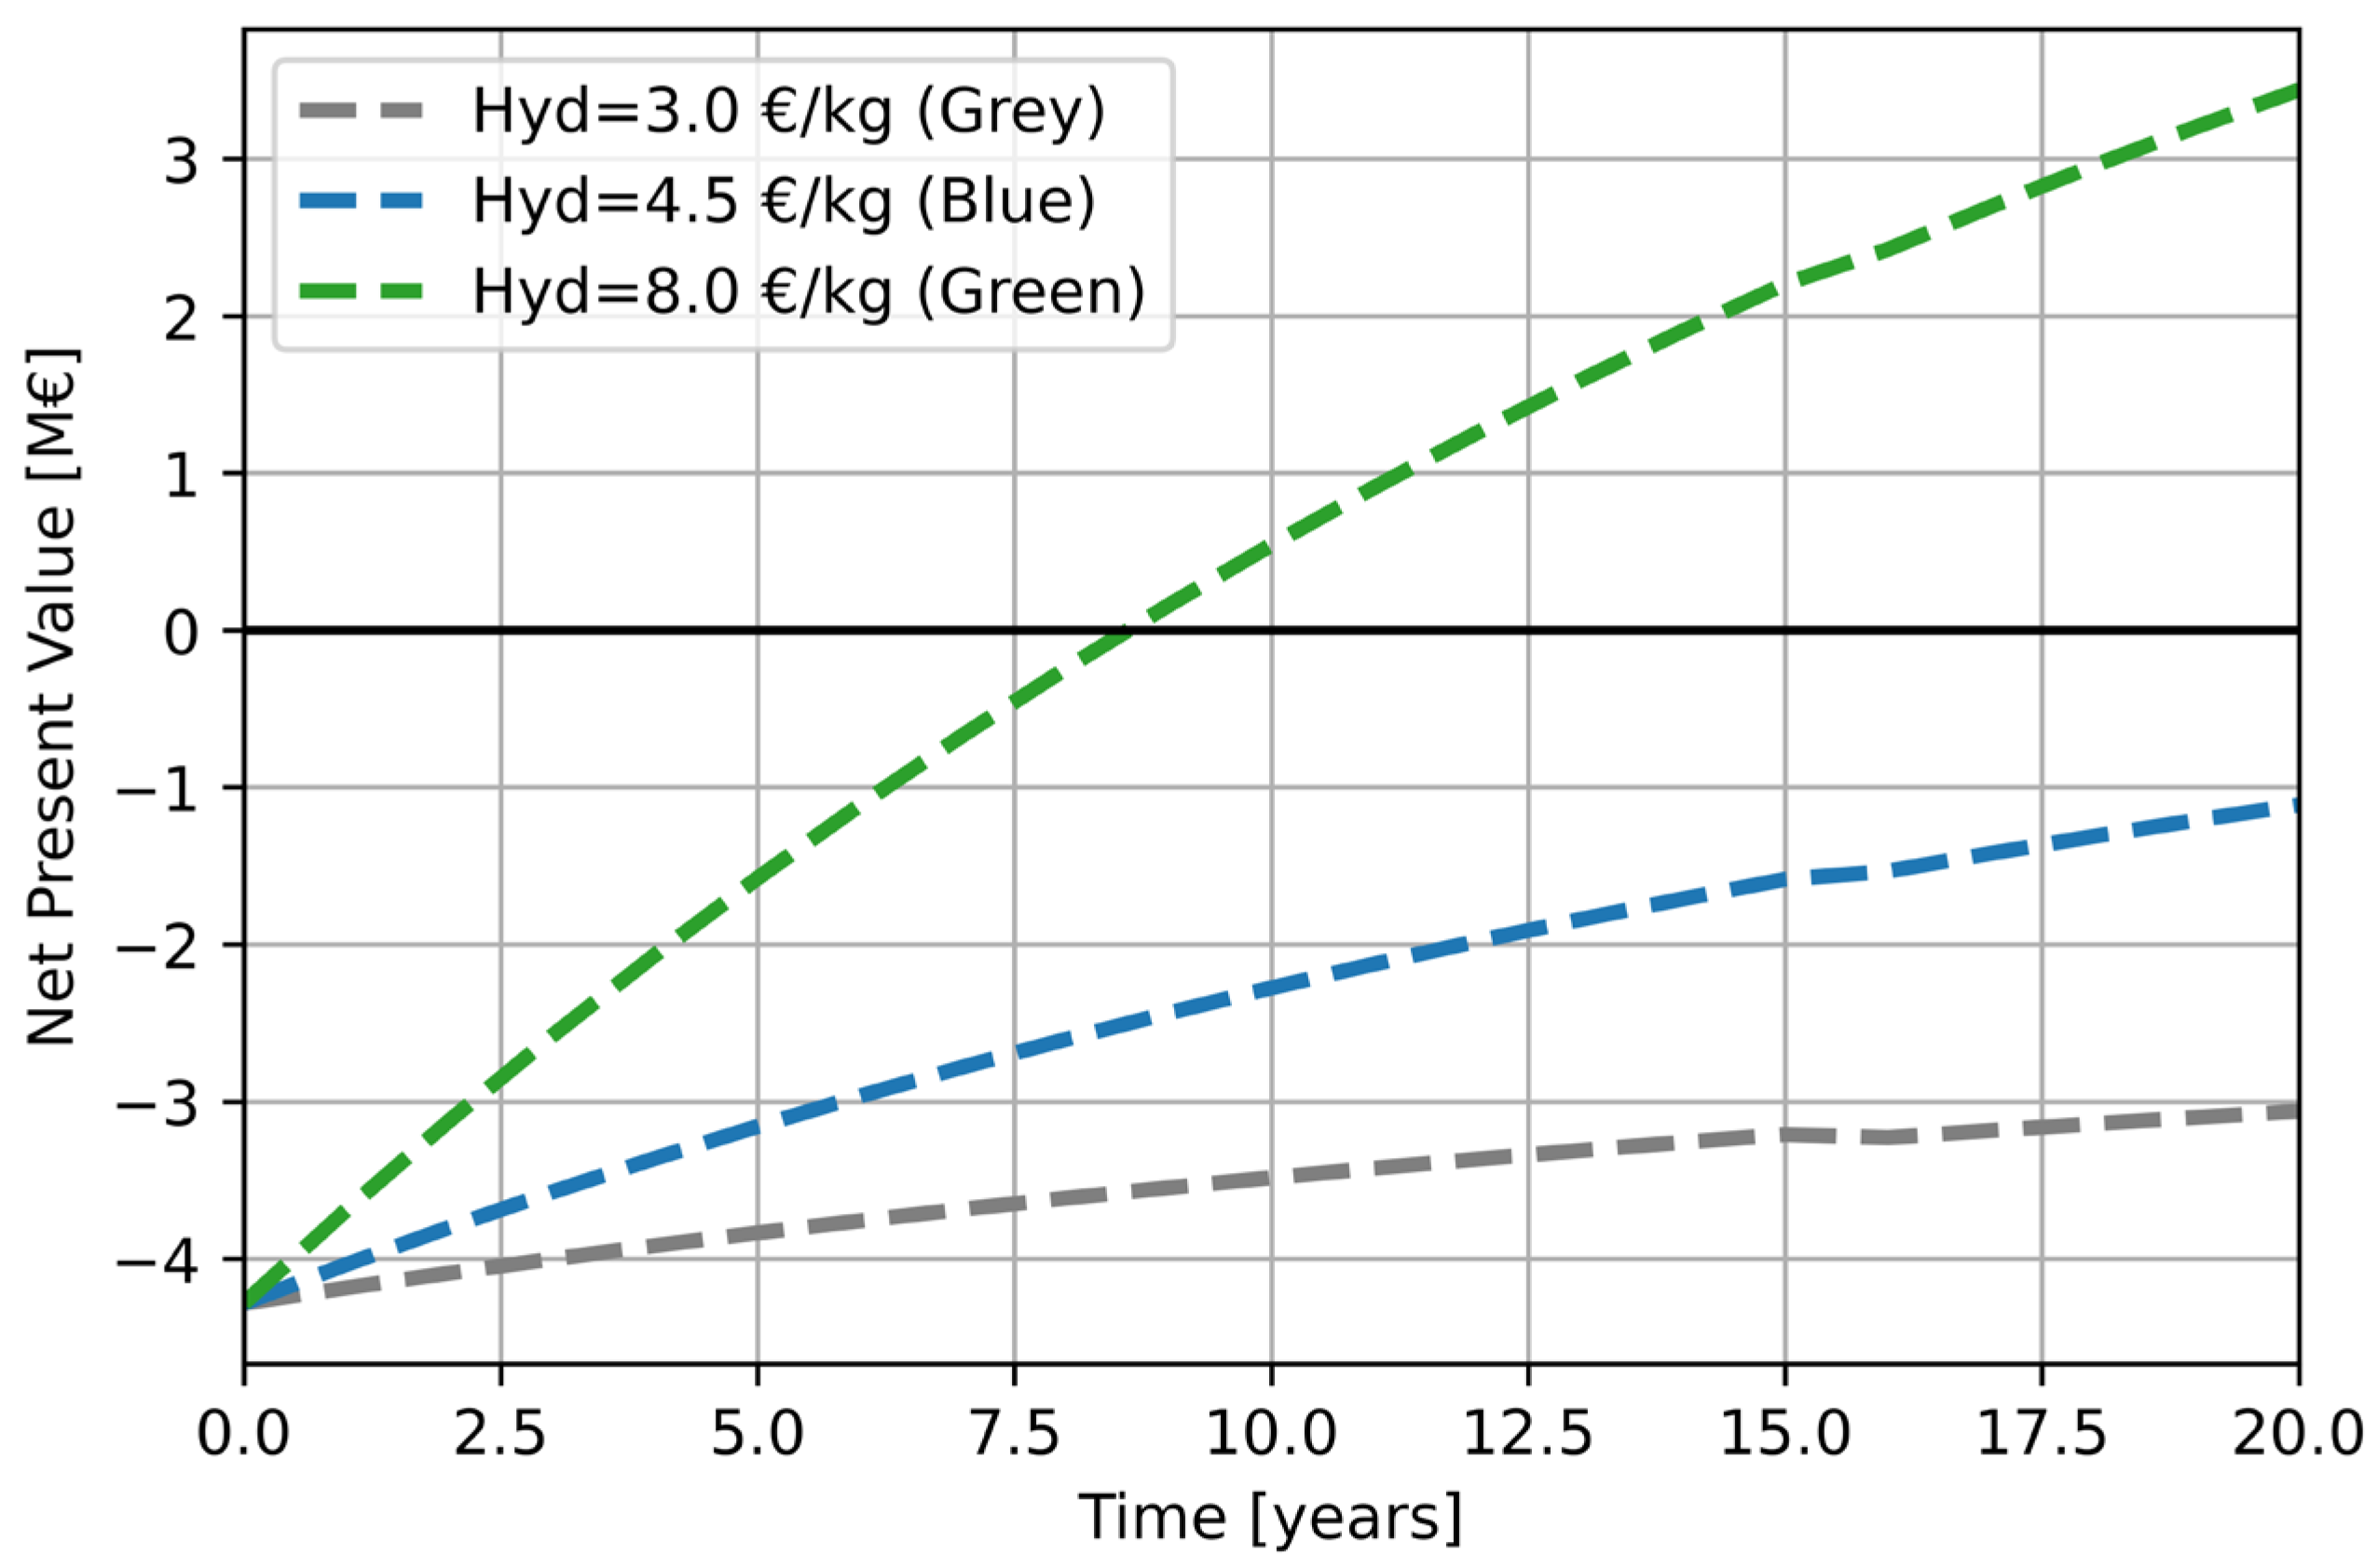

Table 1.
Electrolyzer’s specification and assumptions of the authors basing on commercial data [11].
Table 1.
Electrolyzer’s specification and assumptions of the authors basing on commercial data [11].
| Type 1 | Type 2 | Type 3 | |
| Power class | 1 MW | 2 MW | 4 MW |
| H2 nominal flow rate | 200 Nm3/h | 400 Nm3/h | 800 Nm3/h |
| H2 nominal flow rate | 18 kg/h | 36 kg/h | 72 kg/h |
| H2 delivery pressure | 27-30 bar | 27-30 bar | 27-30 bar |
| Output temperature | 80 °C | 80 °C | 80 °C |
| Energy consumption | 5.1 kWh/Nm3 | 5.0 kWh/Nm3 | 5.0 kWh/Nm3 |
| Energy consumption | 57 kWh/kg | 56 kWh/kg | 56 kWh/kg |
| Operational Range | 20-100% | 20-100% | 20-100% |
| Minimum power | 0.2 MW | 0.4 MW | 0.8 MW |
| Hot standby power | 15 kW | 30 kW | 60 kW |
| Water consumption | 15 l/kg H2 | 15 l/kg H2 | 15 l/kg H2 |
Table 2.
Compressor specific data.
| Value | |
| Output pressure | 200 bar |
| Inlet pressure | 27 bar |
| Inlet temperature | 80 °C |
| H2 mass flow rate | 40 kg/h |
| Maximum power | 150 kW |
| Specific consumption | 1,36 kWh/kg |
| Efficiency | 0,6 |
Table 3.
Economic model: cost of the various components.
| Component | Voice | Value |
| PV Plant | Investment cost (CAPEX) | 1060 €/kW, [16] |
| O&M (after 15 years) | 30 €/kWp year | |
| OPEX fixed | 2% CAPEX/year, [17] | |
| Storage system | Investment cost (CAPEX) | 300 €/kWh, [18] |
| OPEX fixed | 2.5% CAPEX/year, [18] | |
| Electrolyzer | Investment cost (CAPEX) | 732 €/kW, [19] |
| Balnce of Plant (BoP): | 464 €/kW | |
| OPEX fixed: | 5% CAPEX/year | |
| Compressor | Investment cost (CAPEX) | 4577 €/kW, [20] |
| OPEX fixed | 2% CAPEX/year, [21] |
Table 4.
Economic model: cost of the energy vectors. [22].
Table 4.
Economic model: cost of the energy vectors. [22].
| Vector | Type | Value |
| Hydrogen | Grey H2 | 3 €/kg |
| Blue H2 | 4.5 €/kg | |
| Green H2 | 8 €/kg, | |
| Electricity | - | 7 c€/kWh |
| Demineralized Water | - | 3.58 €/m3 |
Table 5.
Reference climatic data for the reference place in central Tuscany (Italy).
| Jan | Feb | Mar | Apr | May | Jun | Jul | Aug | Sept | Oct | Nov | Dec | Year | |
| Tavg, [°C] | 7,3 | 7,4 | 10,7 | 12,9 | 17,9 | 20,6 | 22,9 | 23,1 | 19,8 | 15,6 | 11,7 | 7,6 | 14,8 |
| Hd [kWh/(m2 day)] | 1,6 | 2,3 | 3,3 | 4,3 | 5,9 | 6,4 | 6,8 | 5,9 | 4,4 | 2,6 | 1,9 | 1,4 | 3,9 |
| Outdoor RH [%] | 85,0 | 74,8 | 79,8 | 78,9 | 74,4 | 74,2 | 71,5 | 76,6 | 81,5 | 86,2 | 78,3 | 85,8 | 79,0 |
| Wind velocity [m/s] | 1,8 | 1,5 | 1,3 | 1,6 | 1,9 | 1,6 | 1,7 | 1,3 | 1,0 | 1,4 | 1,6 | 2,1 | 1,6 |
Table 6.
Operating hours of the 2 MW electrolyzer in various modes.
| Electrolyzer operation | Share | Operating hours |
| Inactive | 54,8% | 4798 |
| 25% | 17,1% | 1496 |
| 50% | 11,8% | 1039 |
| 75% | 6,2% | 542 |
| Nominal power | 10,1% | 885 |
Table 7.
Operating hours of the 1 MW electrolyzer in various modes (without storage).
| Electrolyzer operation | Share | Operating hours |
| Inactive | 48,5% | 4242 |
| 25% | 9,4% | 826 |
| 50% | 14,3% | 1257 |
| 75% | 4,4% | 384 |
| Nominal power | 23,4% | 2050 |
Table 8.
Operating hours of the two electrolyzers.
| Electrolyzer type | Equivalent operating hours at nominal power for the electrolyzer |
| Electrolyzer (1 MW) | 3173 |
| Electrolyzer (2 MW) | 2185 |
Table 9.
General analysis of the examined strategiest in all six scenarios.
| Electrolyze | Storage |
Electricity for H2 production [kWh] |
% |
Electricity for grid [kWh] |
% |
Energy Losses [kWh] |
% |
| 2 MW | 2 MWh | 4,51 106 | 90 | 3,96 105 | 7 | 1,49 105 | 3 |
| 1 MWh | 4,29 106 | 85 | 5,81 105 | 12 | 1,57 105 | 3 | |
| 0 MWh | 3,80 106 | 76 | 1,05 106 | 21 | 1,79 105 | 4 | |
| 1 MW | 2 MWh | 3,38 106 | 67 | 1,58 106 | 31 | 6,97 104 | 1 |
| 1 MWh | 3,26 106 | 65 | 1,70 106 | 34 | 7,14 104 | 1 | |
| 0 MWh | 2,92 106 | 58 | 2,02 106 | 40 | 8,44 104 | 2 |
Table 10.
Economic model: cost of the various components.
| Day | Clear-sky day | Cloudy day |
| July (Summer day) |
Hydrogen produced: 375 kg | Hydrogen produced: 275 kg |
| Electricity to grid: 3300 kWh | Electricity to grid: 0 kWh | |
| April (Mid-season day) |
Hydrogen produced: 303 kg | Hydrogen produced: 62 kg |
| Electricity to grid: 1270 kWh | Electricity to grid: 0 kWh | |
| January (Winter day) |
Hydrogen produced: 116 kg | Hydrogen produced: 27 kg |
| Electricity to grid: 0 kWh | Electricity to grid: 0 kWh |
Disclaimer/Publisher’s Note: The statements, opinions and data contained in all publications are solely those of the individual author(s) and contributor(s) and not of MDPI and/or the editor(s). MDPI and/or the editor(s) disclaim responsibility for any injury to people or property resulting from any ideas, methods, instructions or products referred to in the content. |
© 2024 by the authors. Licensee MDPI, Basel, Switzerland. This article is an open access article distributed under the terms and conditions of the Creative Commons Attribution (CC BY) license (http://creativecommons.org/licenses/by/4.0/).
Copyright: This open access article is published under a Creative Commons CC BY 4.0 license, which permit the free download, distribution, and reuse, provided that the author and preprint are cited in any reuse.


