
Submitted:
08 October 2025
Posted:
09 October 2025
You are already at the latest version
Abstract
The integration of renewable energy sources, particularly photovoltaic (PV) solar, is increasingly challenged by the limited flexibility and storage capacity of existing ener-gy systems. Hydrogen produced via renewable-powered electrolysis offers a promising pathway to address these constraints. Among the various utilization options, hydrogen injection into natural gas grids represents a technically feasible and strategically rele-vant solution in the medium term. The paper develops a methodological framework aimed at interpreting hydrogen injection as a flexibility option for renewable energy integration and storage. The approach focuses on identifying those gas network seg-ments where flow fluctuations are minimal, conditions more suitable for hydrogen blending, and on quantifying the potential contribution of this strategy to PV expan-sion. The methodology is applied to the Italian energy system, a paradigmatic case characterized by strong PV growth and extensive natural gas utilization. Results indi-cate that, under current regulatory constraints (up to 5% hydrogen blending), the ad-ditional PV capacity that could be effectively integrated remains limited, and the overall decarbonization impact modest. Nonetheless, the analysis highlights the con-ceptual and methodological value of considering gas networks as dynamic compo-nents of an integrated energy system. In this perspective, hydrogen injection emerges less as an immediate large-scale solution and more as a framework for coupling power and gas systems, paving the way for future assessments under evolving technical, economic, and regulatory conditions.
Keywords:
Hydrogen blending
; Natural gas network
; Photovoltaic integration
; Renewable energy expansion
; Power-to-gas
; Grid flexibility
; Case study: Italy
1. Introduction
Hydrogen is a key element in the strategies for the energy transition [1,2,3]. Hydrogen is an energy carrier that can be produced, stored, and used when needed to generate electricity, but it can also be used as a fuel and as a chemical reagent in some industrial sectors [4,5]. To date, the largest production and consumption of hydrogen occur in the industrial sector, where hydrogen is often self-produced and used for specific chemical processes [6], as for example for the ammonia production.
Hydrogen can be crucial in enabling the decarbonization of sectors that are not easily electrified, making the penetration of renewable energy more difficult. In particular, the electrification of some industrial processes is particularly complicated or impossible with current technologies [7,8]. Concerning the use of hydrogen in the energy transition, it is almost exclusively considered the “green” hydrogen, that is, hydrogen produced using renewable energy. Although several hydrogen production techniques are under development, the most readily available “green” technology today is electrolysis powered by energy from renewable sources. One of the great potentials of hydrogen is its ability to be stored in large quantities and for extended periods. However, this is not a “free” operation: hydrogen has allow density, and to be stored in significant quantities, it must be brought to very high pressures or transformed into a liquid state (at very low temperatures).
To date, numerous obstacles must be overcome before the hydrogen chain can be implemented on a large scale and thus a true hydrogen “economy” can be established. The use of minimal-impact strategies that enable the initial deployment of hydrogen-related technologies can represent a crucial first step in promoting the effective widespread use of hydrogen. Among these, the most interesting concerns the use of hydrogen as a fuel and injected in limited quantities into existing natural gas networks. Injecting hydrogen into the natural gas network is not the technique that best exploits hydrogen’s potential, but it remains very interesting as a support strategy for its diffusion.
On a global scale, renewable energy technologies have experienced a remarkable diffusion, supported by falling costs, technological improvements, and targeted national and international incentive schemes. Many countries have significantly expanded their installed capacity, with solar photovoltaic (PV) and wind power representing the largest contributors to the growth of clean energy generation, [9]. This global trend highlights a structural shift towards more sustainable energy systems, aiming to reduce dependence on fossil fuels and mitigate the effects of climate change. The recent expansion of renewables has been driven by photovoltaics, with more than 1000 GW installed in the world over the past three years (Figure 1). This remarkable growth highlights both the economic competitiveness of solar power and the maturity of a technology that is well established and easily replicable. While this is undoubtedly positive, it also brings side effects, as noted by the author in earlier works [10,11]. Moreover, the focus on electricity production, accounting for only about 20% of global energy consumption, means that the rapid rise of solar does little to address other critical sectors, such as energy for industrial heat and energy for mobility. In this context, Italy has followed the global increase. At the end of the year, total installed capacity from PV power plants had reached approximately 38 GW, marking an increase of about 8 GW compared to 2023 [12], (Figure 2).
Surplus electricity from renewable generation, often concentrated in specific regions, calls for storage solutions that go beyond large-scale electrochemical systems or general economic optimization strategies such as energy communities. In this context, hydrogen can play a valuable role as an energy storage medium. By converting excess electricity into hydrogen and injecting it into the natural gas grid, it becomes possible to stabilize the system while also enabling renewable penetration into the thermal sector. The concept is not new: hydrogen injection into gas networks has already been tested in several pilot projects and it is analyzed in several recent scientific papers, with different perspectives [13,14,15,16]. Mahajan et al. in [13] provided one of the first comprehensive reviews on hydrogen–natural gas co-transport, outlining the main technological barriers, safety concerns, and modeling approaches. Expanding on these aspects, Sánchez-Laínez et al. in [14] investigated the effects of hydrogen injection into high-pressure gas grids, focusing on its impact on pipeline materials, sealing systems, and compression equipment, critical factors for ensuring long-term infrastructure integrity. On the operational side, Fernandes et al. in [15] analyzed flow dynamics through numerical simulations, demonstrating how hydrogen fractions alter velocity, pressure, and density distributions within the network. Finally, Rosa et al., in [16] synthesized the latest advances in hydrogen injection and blending technologies, highlighting the importance of integrated fluid dynamic and system-level analyses to assess network adaptability [13,14,15,16], energy efficiency, and safety under varying hydrogen concentrations.
In parallel, Guzzo et al. in [17,18] further advanced the discussion by addressing both the operational optimization and the fluid-dynamic implications of hydrogen injection in gas networks. Their studies demonstrate how smart management of pressure regulating stations can enhance hydrogen blending capacity while maintaining network stability, and provide detailed insights into the associated flow behavior, operational risks, and mitigation strategies necessary to ensure safe and efficient system performance.
While the examined literature appears to be mainly focused on the issue of hydrogen blending into natural gas networks, the approach presented in this work aims to highlight a complementary perspective. The objective is to restore hydrogen to its original role as an energy carrier—an essential element for large-scale energy storage and, consequently, for assessing its real potential as a stabilizing factor for electrical grids. As clearly illustrated in Figure 1, the significant growth in renewable energy generation observed in recent years has been largely driven by the expansion of intermittent sources such as solar, wind, and hydro power. These technologies are relatively easy to install and often economically attractive, yet they share an inherent limitation: they generate only electrical power, which must then be stored. This underlines the growing need to enhance the capacity and flexibility of energy storage systems.
In this context, hydrogen production offers a promising pathway. What appears more interesting today, however, is not merely its technical feasibility, but rather the assessment of the scale of renewable growth that such an approach could effectively support. Admittedly, part of the energy is lost during electrolysis, just as in other storage methods. Yet this inefficiency is comparable to that of pumped-hydro storage, where roughly half of the initially stored electricity can be recovered. Similarly, producing hydrogen from surplus power and injecting it into the gas grid may recover only part of the original energy. Still, the process provides a dual benefit: it enables the integration of additional renewable capacity and extends its usefulness beyond electricity, supporting applications in the thermal and industrial sectors. The aim of this paper is therefore to assess—using the Italian national natural gas grid as a case study—the potential for hydrogen injection and the corresponding photovoltaic capacity required to generate green hydrogen. This photovoltaic capacity can serve as an indicator of the possible expansion of solar systems in the reference area, while also reflecting the broader capability of the energy system to absorb excess renewable electricity. Although the analysis focuses on Italy, the methodology and insights can be readily applied to other national contexts.
2. Hydrogen Injection into the Gas Grid: Lessons from Past Projects
The integration of hydrogen into the existing natural gas infrastructure represents a possible pathway to store and utilize surplus renewable energy in a flexible and efficient way. As illustrated in Figure 3, excess electricity from renewable sources is converted into hydrogen through electrolysis, which is then purified, conditioned, and compressed.
The injection of hydrogen into the grid has already been the subject of several projects carried out in past years, mainly in Europe: the characteristics of the various projects are summarized in Table 1. All projects have focused on the possibility of injecting small quantities (up to 20% by volume) of hydrogen into the natural gas pipelines without problems for the natural gas network and for end uses, [13].
The first experiment dates to 2007, when the project “Hydrogen in natural gas on Ameland” [19] was launched in The Netherlands to investigate the impact of injection of up to 20% hydrogen in the natural gas grid supplying 14 homes.
In 2013, a demonstration plant to produce hydrogen and its injection into the natural gas grid with a volume content of up to 5% was built in Falkenhagen, in the district of Prignitz in Brandenburg, Germany, [20]. The Power-to-Gas plant used electricity generated by wind turbines and produced hydrogen through an electrolysis process with a production capacity of approximately 360 Nm3/h.
The GRHYD project was developed in France starting in 2014 [21]. During the first two years, the technical and sociological aspects were studied. In 2018, to assess the technical, economic, and environmental relevance of Power-to-Gas, a five-year demonstration phase was carried out for two uses of hydrogen injection: transportation and housing. The transportation demonstrator included a bus refueling station adapted to handle a hydrogen/natural gas blend, with a hydrogen content ranging from 6% to 20%. The residential demonstrator was refueled with a hydrogen/natural gas blend with a variable hydrogen content of less than 20%.
In 2019, SNAM experimentally tested the injection of hydrogen into its natural gas transmission network in Contursi Terme (Salerno) in Italy [22,23]. The project involved direct supply to two nearby companies: a pasta factory and a mineral water bottling company operating in the area. Subsequently, at the same site in 2020, the national operator in the gas market, SNAM, doubled the volume of hydrogen injected into the grid to 10%.
In the same year, the HyDeploy project started in the UK [24]. The trial used a blend of up to 20% hydrogen by volume, injected into fossil gas. The results confirmed that hydrogen blended up to 20% by volume does not adversely interact with existing materials used within infrastructure such as network pipes or in homes or businesses, such as boilers, hobs, cookers, or meters. The success of HyDeploy at Keele University paved the way for a larger trial in Winlaton, near Gateshead, from August 2021 until June 2022.
In 2021, three projects started in three different European countries. In Italy, the INRETE project [25] involves a series of experimental temporary injections into a portion of the distribution network serving approximately forty recently built homes in the municipality of Castelfranco Emilia in the province of Modena. The first injection planned was successfully completed at the end of October 2022 for a short period, using a blend of natural gas and hydrogen (H2NG) at 2% hydrogen by volume. In subsequent phases, the project envisaged increasing the percentage of hydrogen first to 5% and then to 10%.
In addition to being widely discussed in scientific literature, the topic of hydrogen injection into gas distribution networks is also the focus of numerous technical-scientific collaboration projects involving research institutions, universities, and network operators.
In Germany, Ohringen, as part of the “Hydrogen Island” project [26], tests have been conducted involving the addition of a hydrogen blend to the natural gas grid. The goal is to demonstrate that safe and reliable operation is possible even with 100% hydrogen.
In UK the project “Future Grid” is relevant [27]. In a plant at Spadeadam, tests were conducted on 2%, 5%, 10%, and 20% hydrogen/natural gas mixtures, and 100% hydrogen.
A recent experience is in Italy. In 2024, in Arezzo, the Italian National Agency for New Technologies, Energy and Sustainable Economic Development (ENEA) and Centria (Distribution company of the Estra Group), signed a collaboration agreement aimed at testing new blending standards for the natural gas distribution network. [28]. The portion of the network undergoing experimental activity, the Centria Test Field, will be progressively subjected to gas-hydrogen blends with increasing hydrogen percentages of 2%, 5%, and 10% in the first phase, and then further increased in the second phase.
As highlighted, various initiatives have explored Power-to-Gas concepts, particularly projects involving hydrogen injection into existing natural gas networks. Most of these studies and pilot projects have demonstrated that blending hydrogen with natural gas is technically feasible from the perspective of transmission and distribution infrastructure, even at concentrations of up to about 20%. The potential effects of increasing hydrogen content on end users, especially in terms of appliance performance, safety, and industrial processes, remain largely uncertain. These initiatives have generally not been conceived as part of a broader strategy aimed at evaluating the overall energy expansion potential of renewable-based systems, except for some specific papers, like [29]. Instead, they often remained limited or exploratory experiences, rather than structural actions linking the electricity, gas, and thermal energy sectors within an integrated transition framework.
3. Hydrogen Injection as a Tool for Balancing Intermittent Renewables: Model and Theoretical Approach
Given that most existing Power-to-Gas initiatives have remained exploratory rather than playing a structural role, the methodology described below aims to provide a systematic approach for assessing the integration of hydrogen into the natural gas network, according to the scheme of Figure 3. Specifically, it is designed to determine the optimal power of renewable energy systems, in particular PV systems that, when combined with electrolyzers, can produce green hydrogen in quantities sufficient to allow for injection into the natural gas grid at a maximum flow rate of 5% by volume.
From a conceptual standpoint, it may appear straightforward to envision the injection of surplus renewable energy into gas networks. However, it is essential to clearly account for the constraints that govern such integration. These constraints are mainly determined by two factors: on the one hand, the transport capacity of the network, which sets limits on the allowable percentage of hydrogen in the blend and the specific composition of the gas, which varies according to its origin and characteristics, [30].
When discussing hydrogen blending in natural gas grids, it is essential to clarify what is meant by a given percentage of hydrogen. A volumetric percentage is the most common way of expressing the blend (e.g., “10% hydrogen by volume”), but this does not directly correspond to an equivalent percentage in terms of mass or energy content.
This is due to the large difference in physical properties between methane and hydrogen. Hydrogen has a much lower density than methane, even when measured at the same temperature and pressure. As a result, one cubic meter of hydrogen contains significantly less energy than one cubic meter of methane. Table 2 illustrates the density of methane and hydrogen at standard conditions (Tstd = 288.15 K, pstd = 101325 Pa) and at typical network operating pressures. This discrepancy arises because hydrogen is much less dense than methane, even at the same temperature and pressure. As a result, one cubic meter of hydrogen contains significantly less energy than one cubic meter of methane. For example, at standard conditions, the Lower Heating Value (LHV) of methane is about 32.3 MJ/Sm3, while that of hydrogen is only about 9.7 MJ/Sm3, [31]. So, at standard conditions, 1 Sm3 of methane delivers about 35.8 MJ, while 1 Sm3 of hydrogen delivers only about 10.8 MJ. Therefore, a 10% hydrogen blend by volume results in only about 3% hydrogen by energy content, as can be evinced by Table 3.
For this reason, when reporting hydrogen blending levels, it is important to always specify whether the reference is volumetric, mass-based, or energy-based, since the implications for grid operation, billing, and end-user performance can differ substantially.
In analogy with natural gas transport, hydrogen blending should be expressed with reference to standard cubic meters (Sm3), i.e., volumes at standard reference conditions, rather than at operating pipeline pressures. This avoids ambiguities related to pressure differences and allows direct comparison of volumetric, mass, and energy fractions.
From an operational perspective, however, hydrogen injection is typically carried out at high pressures, consistent with the network operating pressure. The additional energy required for compression is relatively small compared to the energy needed for hydrogen production by electrolysis, as discussed in [31] while the benefits in terms of grid integration, mixing, and avoiding recompression downstream are significant.
Several theoretical and applied studies are currently being conducted worldwide to assess the feasibility of transporting natural gas–hydrogen blends through existing pipelines. In particular, the cited work proposes for the first time a set of simplified but closed-form equations that describe how variations in gas properties, due to different hydrogen blending percentages, affect key parameters such as pressure drop, compressor power requirements, and the system’s linepack capacity. A recent paper discusses the fact that increasing the hydrogen fraction causes a monotonic rise in pressure fluctuations within the network, resulting in greater pipeline fatigue and an increased risk of failure. Of course, the application of hydrogen blending in gas pipelines requires a preliminary analysis of the gas network nodes and their transfer capacity to ensure feasible and effective hydrogen injection. The methodology can be summarized in the following points.
- 1)
- Analysis of natural gas network. The characteristics of the natural gas network (considering flow rate and chemical composition of natural gas) must be analyzed, with particular attention to the reception points present throughout the country, their relative reception capacities, and the natural gas storage capacity.
- 2)
- Flow analysis. In this second phase, the daily or hourly flow rates of natural gas passing through the various reception points are collected and analyzed.
- 3)
- Definition of the characteristic flow rate of natural gas and the maximum flow rate of hydrogen to be injected into the gas network. At this stage, for each receiving point, the characteristic flow rate of natural gas or reference flow rate is defined, which can be considered as the minimum “guaranteed” flow rate of natural gas at any time of the year. Having defined the characteristic natural gas flow rate and set a maximum percentage of hydrogen to be injected into the network equal to 5% by volume, it is possible to determine the hydrogen flow rate to be injected.
An essential aspect of hydrogen blending analysis concerns gas interchangeability, which ensures that any gas-fired equipment continues to operate within its original performance and safety standards when a substitute fuel is used. Although traditional approaches based on synthetic indicators have often been guided by commercial or regulatory considerations, some of these metrics, particularly the Wobbe Index (WI), remain of high technical relevance. The Wobbe Index, introduced as a key gas quality parameter for defining fuel interchangeability, quantifies the relationship between a gas’s calorific value and its specific gravity, thus allowing the comparison of different gaseous fuels in terms of their heat release behavior, [32]. Gases with similar Wobbe index tend to produce comparable thermal outputs and combustion characteristics. It is defined as
where RD is the ratio between the density of natural gas, and air, . Considering a mixture of hydrogen and natural gas the Wobbe Index can be defined as:
with
The basic concept for blended combustion is that gases with similar Wobbe index will produce the same heat release in a furnace through the same nozzle at a pressure of similar power supply. Calculating WI of the hydrogen-methane mixture shows that it is not profitable to increase too much hydrogen percentage, so that the share of hydrogen in the mixture must be reduced. The topic has been largely discussed by the authors in a recent paper, [33]. Once these steps referred at the beginning of the section have been completed, hydrogen can be injected into the natural gas transmission network, where it blends with the conventional gas stream, ensuring that renewable energy is effectively captured and redistributed within the broader energy system.
When the quantities of hydrogen to be injected into the gas network is defined, the possible connection of hydrogen to PV plants can be considered. A specific energy required to produce 1 kg of H2 equal must be considered (generally a value between 55 and 65 kWh/kg) for electrolysis and consequently it is possible to determine the quantity of energy necessary to produce green hydrogen. Then, knowing the maximum hourly hydrogen flow rates and the specific energy required for its production, it is possible to connect the PV system power that can be used to generate hydrogen for injection for each reception point. It can be assumed that PV systems would be installed near the reception points (the calculation can be performed considering the geographic coordinates of the reception points); it was chosen to hypothesize a “simple” hydrogen production system like the one represented in Figure 3. This solution does not allow for a constant hydrogen flow to be guaranteed (a flow rate of 5% by volume of the natural gas flow rate is reached only as a maximum peak), but it allows for the avoidance of any storage system and the related compression systems. Summarizing, the connection between volume of hydrogen injected in the gas grid, VH2 (expressed in Sm3), defined as a fraction BF of the volume flow rate of natural gas circulating through the grid, VH2. The volume of hydrogen can be easily transformed into a mass of hydrogen produced during the period of observation, for example one day, considering a number of hours of operation of the system, heq. the mass of hydrogen produced, can be defined:
The total mass of hydrogen that can be injected into the gas grid can be easily connected with electricity production from the PV system. The daily hydrogen production depends directly on the available solar energy. Since photovoltaic output is highly seasonal, the value of the daily energy produced per kW of installed capacity varies in the day and month by month. Therefore, the hydrogen yield will fluctuate accordingly, with higher production in summer and lower production in winter. To accurately estimate the connection between hydrogen production in a well-defined period (one hour, one month, the whole year), the hydrogen produced can be connected to the energy produced by the PV plant. The output of PV power plant in a day, , expressed in kWh for kW of peak power installed is proportional to the solar irradiation of the site, expressed in kWh/m2, and to the balance of system efficiency of the plant, (typically between 0.75 and 0.85). Only a part of the energy produced can be transformed into hydrogen, and this strongly depends on the efficiency of the transformation system, (electrolyzer, compressor and auxiliary component), being this value in the range between 0.55 and 0.6. So, it is possible to correlate energy produced and mass of hydrogen,
For convenience, the lower heating value (LHV) is used as reference value for the energy content of hydrogen. The daily volume of hydrogen produced can be directly related to the electrical energy supplied to the electrolyzer. This electrical energy, in turn, depends on the installed photovoltaic power and the available daily solar irradiation. Therefore, the hydrogen volume can be expressed as a function of the PV power, the electrolyzer efficiency, and the hydrogen density and energy content.
or alternatively, the PV power installed can be expressed as a function of the maximum volumetric amount of hydrogen that can be injected on the grid:
4. Analysis of the Natural Gas Network and the Injection of Hydrogen: The Case Study of Italian Gas Grid
In this section, to move from a general to a more specific context, the analysis developed in the previous section is applied to the case of the Italian gas transmission network. A preliminary assessment of the Italian network is presented. The objective is to evaluate the potential of the gas network to absorb excess photovoltaic power generation through hydrogen. To assess the potential contribution of hydrogen injection, however, it is necessary to consider the specific dynamics of gas flows, which depend on technical, economic, geopolitical, seasonal, and contractual factors.
An analysis of the structure of natural gas use in Italy is presented in a previous paper by Franco, [34]. That study examined national consumption trends identifying the strong dependence of residential and civil gas demand on temperature and seasonality. The analysis also highlighted daily and sectoral patterns (residential, industrial, and thermoelectric) and proposed a mathematical framework for forecasting thermal energy demand. Although the analysis refers to data from some years ago, it clearly highlights the strong link between natural gas consumption and civil uses, a relationship that remains substantially unchanged today. This persistent pattern poses additional challenges when considering the integration of surplus PV power through hydrogen injection into the gas network. In general, gas demand varies throughout the year: heating needs peak in winter, industrial consumption follows production, and thermoelectric demand rises in summer. Import flows are also shaped by supply contracts, spot market conditions, and geopolitical dynamics. After the Russia–Ukraine conflict, Italy phased out Russian imports by 2025, increasing reliance on Algeria, Azerbaijan, Northern Europe, and LNG. Storage infrastructure further balances supply and demand, with a national capacity of 17 billion m3, 12.5 billion are operational and 4.5 billion are strategic.
4.1. Hydrogen Reception Capacity in the Italian Gas Network
In 2024, Italy consumed about 61.7 billion Sm3 of natural gas. Only 4–5% came from domestic production and 95% was imported via pipelines and LNG terminals (Figure 4). To better understand the structure of Italy’s natural gas supply, Table 4 presents the main pipeline entry points and LNG regasification terminals, highlighting annual flows and maximum reception capacity in 2023 and 2024, according to the data provided by [35].
4.2. Composition of Natural Gas Imported in Italy
Natural gas is a mixture of different hydrocarbons and inert materials, the main element of which is always methane, but whose composition differs depending on the deposit from which it is extracted. Table 5 shows the average values in the period October 2023—September 2024 of the molar compositions of the imported natural gas, both in the gaseous and liquid state, through the various reception points.
For each reception point, the annual average values for the net calorific value, gross calorific value, density, absolute and relative density, and molecular weight are also reported. Natural gas imported into Italy is mainly composed of methane (CH4, typically 86.6–95.4%), with smaller fractions of heavier hydrocarbons (ethane, propane, butane), carbon dioxide (CO2), nitrogen (N2), and trace amounts of hydrogen sulfide (H2S).
The exact composition varies depending on the source country: North African and Azerbaijani gas tend to have higher methane content, while LNG cargoes may present slightly different hydrocarbon balances due to liquefaction and regasification processes. These data are essential for calculating both the energy yield of the gas mixture and its fluid dynamic characteristics. To assess how Italy’s natural gas networks could accommodate hydrogen, it is necessary to analyze actual flow variations at each reception point. Daily flow analysis for 2024 highlights site-specific differences: Melendugno shows the most stable trend, followed by Gela and Livorno, while Tarvisio displays the largest fluctuations, partly reflecting the different utilization levels (94% for Melendugno vs. 14% for Tarvisio). Table 6 reports the statistical distribution of daily and hourly flows for four reference days in 2024, providing key indicators such as minimum, median, mean, and standard deviation. These values allow setting a realistic flow threshold for hydrogen injection, avoiding both oversizing of production and surplus volumes that cannot be absorbed by the grid. As can be seen, some transmission lines maintain nearly steady flow rates over the year, whereas others experience pronounced variations between their lowest and highest levels. Figure 5 shows the daily gas flow trends at the Melendugno (a) and Tarvisio (b) reception points in 2024. As observed in Figure 5a at Melendugno, except for a pipeline interruption, flows ranged between 22.1 and 30.7 MSm3/day, with an average value of 26.7 MSm3/day. This means that a volume flow of hydrogen up to 0.5 MSm3/day can be accepted. The point of Tarvisio, Figure 6b, displayed greater variability, with a peak of 65.4 MSm3/day, but typical flow rate between 5 and 20 MSm3/day.
Figure 6 presents box plots reporting the daily gas flows at each reception point in 2024, highlighting site-specific differences already observed in Figure 5. In addition, more detailed information on the natural gas inflow at the entry terminals is provided in Appendix A. Hourly flow data (Table 7) reveal very small variations during the days, with standard deviations much lower than daily values. Based on the analysis of daily and hourly variations, gas flows can be reasonably assumed to be constant within each day.
To better capture the variability of daily gas consumption, the data were grouped into four ranges (quartiles). This classification makes it possible to identify those networks where fluctuations are less pronounced, conditions that are generally more favorable for hydrogen injection. To account for daily variations, a statistical threshold was defined using the first quartile value for each reception point. The corresponding hourly flow rate was then obtained by uniformly distributing this daily value over 24 hours.
5. Sizing of PV Systems for Hydrogen Injection in the Gas Grid
Referring to the scheme in Figure 3, hydrogen production can also play a role in the stabilization of the electrical grid, thus restoring hydrogen’s function as an energy storage system. This concept can be applied to various intermittent renewable sources; however, the example developed in this section focuses solely on photovoltaic (PV) systems. This choice is made for the sake of simplicity and because PV generation, while still intermittent, generally offers slightly higher levels of predictability and programmability compared to other renewable sources such as wind or hydro power. Couplings with other renewable energy sources, such as wind power, can also be found in the literature, as [37].
In this section, the results of the sizing of PV systems directly connected to hydrogen production are presented, following the criteria described in Section 4. The analysis can be referred to the hourly hydrogen production reported in Table 6 for each Italian reception point, to the average value of natural gas flow rate, or to the average daily value.
The maximum flow rate of hydrogen that can be introduced (i.e., the flow rate corresponding to 5% by volume of the natural gas flow rate) can permit obtaining the capacity of the PV systems. This value can be obtained by considering the geographical position of the reception points and consequently the production of the PV systems, the quantity of hydrogen produced in a year and the average coverage of the hydrogen flow with respect to the overall natural gas flow. Table 8 and Table 9 provide some reference value of energy produced by the PV plants in Italy, in the various zones and in the various phases of the year. The data of productivity are referred to the kW of peak power installed, value that is referred to the typical Standard Test Conditions of PV plants, to the input solar power I = 1000 W/m2.
Having established that hydrogen production will be powered solely by PV systems and having established that no storage systems will be used, neither hydrogen production nor its injection into the grid will be continuous or constant; for this reason, the average percentage flow coverage is much lower than the maximum value (set at 5%) and fluctuates between 0.67% and 1.13%. For greater clarity, Figure 7 shows the results of daily hydrogen production and related injection into the network for the Melendugno reception points; a solid red line shows the maximum limit for hydrogen injection into the network obtained by considering a constant natural gas flow rate (a value established by analyzing daily gas flow data) and setting a maximum injection percentage (5% by volume). At this stage, it is possible to evaluate the impact of injecting hydrogen into the network in terms of reducing natural gas consumption. Since natural gas is imported into Italy from multiple foreign sources, it is not sufficient to consider a single uniform blend; rather, the characteristics of the gas must be considered according to its origin.
Table 10 provides the connection between hydrogen production and PV plant installed. It was constructed in which, using the model described by Equations (4)–(11) and solar radiation data representative of southern Italy, typical daily PV generation was estimated for a given installed capacity, using estimated value of the efficiency parameters.
Considering the flow capacity at the Melendugno reception point, the amount of hydrogen that could be injected into the network exceeds 1,000,000 m3 per day, corresponding to roughly 45,000 m3/h. Such a flow could support the operation of a Power-to-Gas system with an installed capacity in the range of 500–600 MW. Smaller-scale plants could instead be associated with other, less capacitive networks. Overall, under the current blending limits compatible with natural gas infrastructure, the systematic injection of hydrogen into the transmission network could justify an additional installation of PV capacity in the order of 1–1.5 GW. This value, however, remains relatively modest when compared with Italy’s existing photovoltaic capacity of nearly 40 GW. Based on the data in the table and considering the existing natural gas flows, the injection of hydrogen into the natural gas transmission network, as illustrated by the Italian case, does not currently appear to be particularly effective in supporting a significant future expansion of renewable energy plants. In the Italian context, even considering all transmission networks, such an approach could at most enable an increase of around 2,000 MW of installed renewable capacity. From an economic standpoint, even assuming a progressive reduction in installation costs, developing large-scale systems for hydrogen injection into natural gas networks remains far from straightforward. In addition to ensuring that gas quality standards are maintained, a dedicated economic assessment would be required. Such an analysis would likely reveal that capital expenditures associated with non-plant components—such as compression, purification, safety systems, and grid adaptation—could be substantial, ultimately leading to relatively high hydrogen costs for network injection.
The economic implications of hydrogen injection into natural gas transmission networks are a subject of significant interest, as they represent a critical factor influencing the scalability of this decarbonization strategy. Several studies have specifically addressed these aspects, examining not only the cost of hydrogen production but also the expenses related to infrastructure upgrades, land acquisition, and continuous monitoring and maintenance of the gas networks, such as [38,39].
For instance, the National Renewable Energy Laboratory [40] and the National Energy Technology Laboratory, [41] of the U.S. Department of Energy have reported that the transportation and blending costs can account for approximately 20–40% of the total delivered hydrogen cost, with variations depending on the hydrogen concentration and pipeline distance. These considerations underscore the importance of considering infrastructure and operational costs in the techno-economic analyses of hydrogen blending, as they are often treated separately from purely technical or energy-related evaluations.
For completeness of the analysis and considering that the deployment of hydrogen is closely linked to the potential prospects for decarbonizing the energy system, we propose to provide a preliminary estimate of the potential CO2 emission reductions. This assessment will allow quantifying, in both energy and environmental terms, the contribution that hydrogen injection into natural gas networks could make to the transition toward a low-carbon system, providing an indicative overview of its overall impact on energy and the environment. To provide a complete assessment, it is possible to quantify avoided emissions by comparing the baseline emissions from displaced natural-gas use with the full lifecycle emissions of hydrogen production (including electricity supply, electrolysis losses and upstream methane emissions). Results will be reported as tonnes CO2 avoided per year. The reduction in natural gas consumption was determined for the same energy output. First, the energy output from 100% natural gas was calculated (using the flow rates and properties of the gas at each reception point). Then, the new flow rate was determined considering a mixture of natural gas and hydrogen in proportions established in Table 11. Table 12 provides the results of this analysis. It is possible, by difference, to determine (with the same energy output) the quantity of natural gas “saved” and considering the two gas flow rates (pre and post hydrogen injection), a standard national CO2 production coefficient for natural gas combustion equal to 2.019 tCO2/m3 [42] and equal to 0 for hydrogen combustion, the reduction in CO2 emissions was determined. From the results reported in Table 12, it can be observed that although the percentage reduction of natural gas and CO2 emitted into the atmosphere is within 0.3% and 1% with a reduction of approximately 184 million Sm3 of natural gas and approximately 372,000 tons of CO2 emitted into the atmosphere is achieved.
6. Conclusions
The injection of green hydrogen into the natural gas network has been investigated as a potential strategy to support energy transition and foster the development of the hydrogen economy. Conceptually, this approach is attractive because it would enable the use of existing gas infrastructure without major structural modifications, requiring only the deployment of renewable-based hydrogen production systems such as photovoltaic plants and electrolysers. However, when analyzed in practical terms and under the current regulatory framework, several limitations significantly reduce its potential impact—particularly the strict blending limit of 5% hydrogen by volume, which constrains the achievable scale of decarbonization. The analysis performed for the Italian case study highlights the following key findings:
- -
- The proposed approach enables the identification of network segments where daily flow fluctuations are minimal—those that could, in principle, better accommodate hydrogen injection as a flexibility mechanism for renewable integration.
- -
- Even under optimal blending conditions (up to 5%), the increase in photovoltaic generation that could be effectively absorbed through hydrogen injection would be limited to approximately 2000 MW.
- -
- The corresponding reduction in natural gas consumption and CO2 emissions would not exceed 1% and 0.3% if compared with current levels.
- -
- Economic considerations are crucial: even with declining costs of photovoltaic generation, the cost of green hydrogen remains significant and could further limit the feasibility of large-scale deployment. The estimated cost of green hydrogen produced via electrolysis due mainly to CAPEX, assuming even a zero marginal cost for photovoltaic electricity, remains above 5 €/kg, making it currently non-competitive with natural gas
Despite these constraints, the methodology developed in this work provides a valuable framework for assessing the technical, spatial, and temporal compatibility between renewable generation and gas network operation and could serve as a basis for future analyses under evolving regulatory and market conditions.
In summary, while the concept of hydrogen injection into the gas network remains technically interesting, its practical relevance under current conditions appears limited. The decarbonization path therefore remains long and challenging. Nevertheless, the outlook could change if the current regulatory constraints were relaxed and higher hydrogen blending ratios were permitted. In that case, the contribution of this strategy to decarbonization could become more substantial and worthy of renewed investigation.
Author Contributions
Conceptualization, A.F. and M.R.; methodology, A.F. and M.R.; validation, A.F. and M.R.; formal analysis, A.F. and M.R.; investigation, A.F. and M.R.; resources, A.F. and M.R.; data curation, A.F. and M.R.; writing—original draft preparation, A.F. and M.R.; writing—review and editing, A.F. and M.R.; visualization, A.F. and M.R.; supervision, A.F.; project administration, A.F.; funding acquisition, A.F. All authors have read and agreed to the published version of the manuscript.
Funding
This work was supported by the National Recovery and Resilience Plan (NRRP), Mission 4 Com-ponent 2 Investment 1.3—Call for tender No. 1561 of 11.10.2022 of Ministero dell’Università e della Ricerca (MUR); and by the European Union—NextGenerationEU. Award Number: Project code PE0000021, Concession Decree No. 1561 of 11.10.2022 adopted by Ministero dell’Università e della Ricerca (MUR), CUP I53C22001450006, according to attachment E of Decree No. 1561/2022, Pro-ject title “Network 4 Energy Sustainable Transition—NEST”.
Data Availability Statement
The original contributions presented in the study are included in the article. Further inquiries can be directed to the corresponding author.
Conflicts of Interest
The authors declare no conflicts of interest.
Abbreviations
The following abbreviations are used in this manuscript:
| BF | Blending Fraction (% vol) |
| Eel | Energy used to generate hydrogen [kWh] |
| EPV | Energy produced by PV plant [kWh] |
| Daily solar producibility of PV plant in the site [kWh/kWpeak] | |
| Annual solar producibility of PV plant in the site [kWh/kWpeak] | |
| Equivalent hours of operation at full load of the PV plant in the period | |
| Daily solar irradiation in the site [kWh/m2] | |
| Annual solar irradiation in the site [kWh/m2] | |
| HHV | Higher heating value [kWh/kg] |
| Hydrogen higher heating value [kWh/kg] | |
| Blended mixture higher heating value [kWh/kg] | |
| Natural gas higher heating value [kWh/kg] | |
| LNG | Liquefid Natural Gas |
| Hydrogen lower heating value [kWh/kg] | |
| Hydrogen mass flow rate [kg/s] | |
| Mass of hydrogen produced in the period [kg] | |
| pstd | Standard pressure [Pa] |
| PhotoVoltaic power [kW or MW] | |
| PV | PhotoVoltaic |
| RD | Density ratio |
| Tstd | Standard temperature [°C, K] |
| Volumetric flow rate of hydrogen produced [m3/s] | |
| Volumetric flow rate of natural gas [m3/s] | |
| x% | Volumetric percentage of hydrogen |
| WI | Wobbe Index [kWh/kg] |
| Conversion efficiency from PV electricity to hydrogen | |
| Balance of system efficiency | |
| Air density [kg/m3] | |
| Methane density [kg/m3] | |
| Hydrogen density [kg/m3] | |
| Natural gas density [kg/m3] |
Appendix A. Daily Gas Flow Rate of Natural Gas at the Different Reception Point
This appendix presents the data concerning natural gas flows at the different entry points of the network. Figure A1 presents the characteristics of the natural gas flows at three entry points supplied by pipelines, whereas Figure A2 reports the main features of the transmission networks associated with the regasification terminals.
Figure A1.
Daily gas flow rate of natural gas imported in Italy (SNAM data [xxx]).
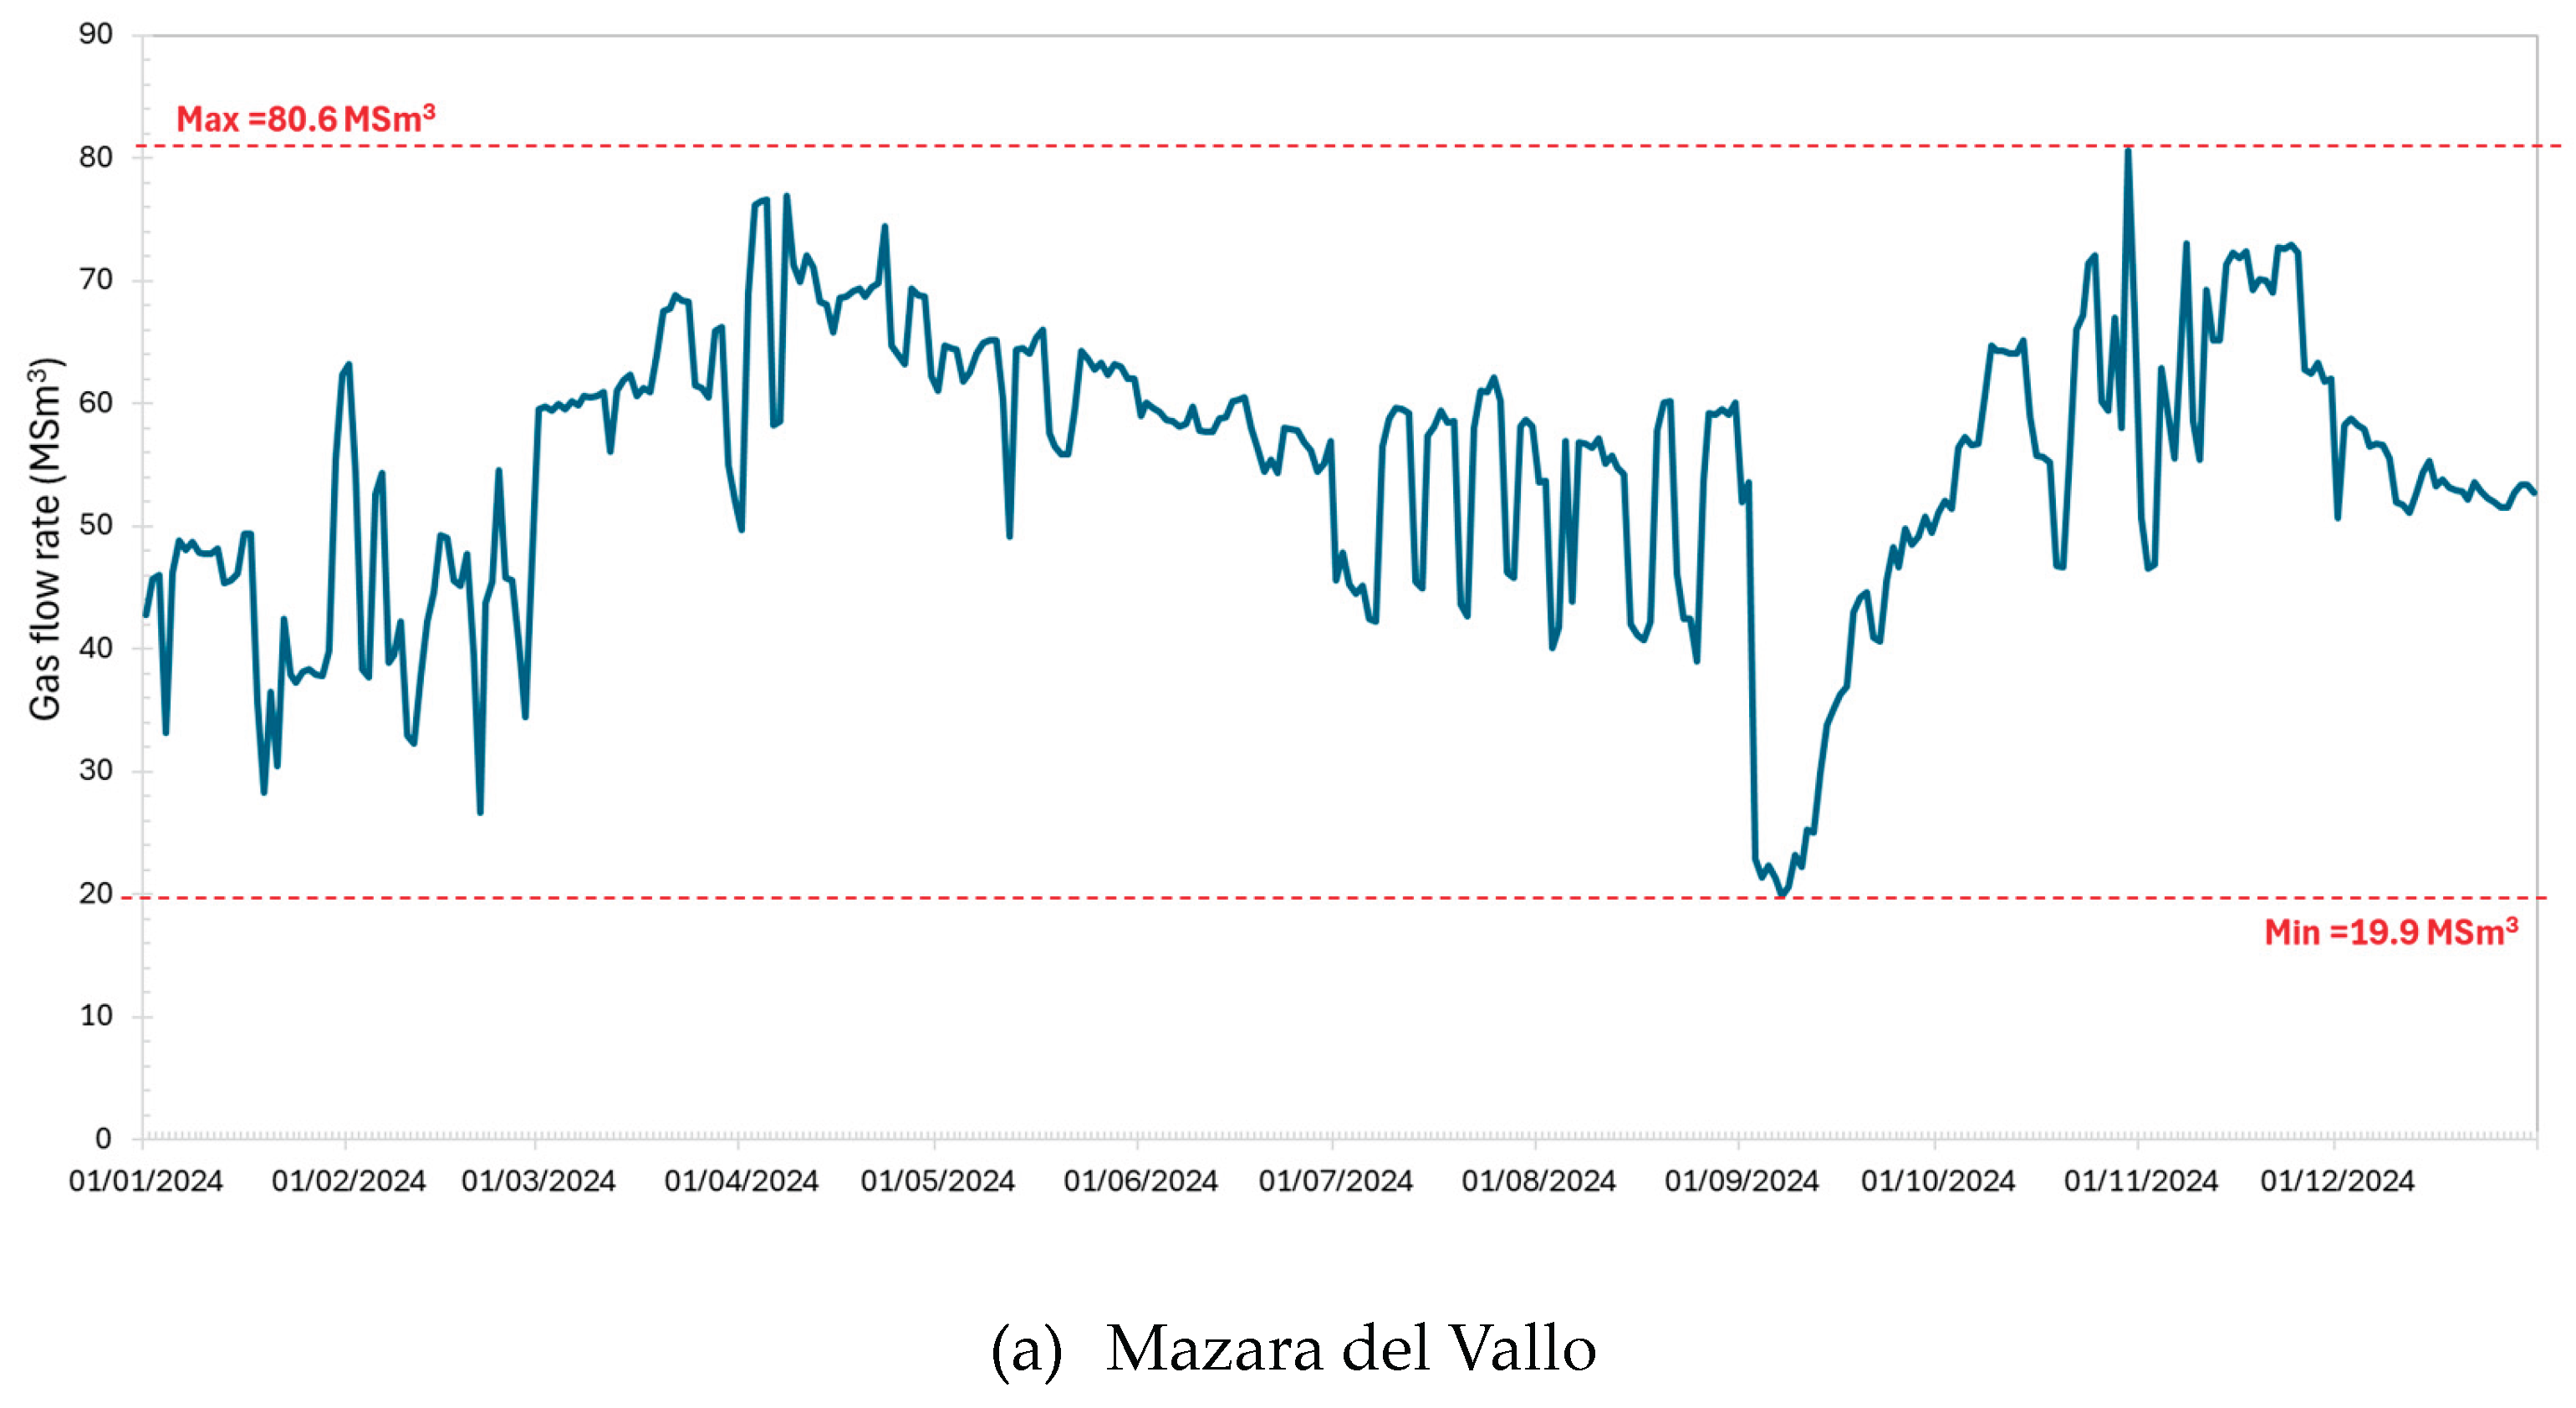
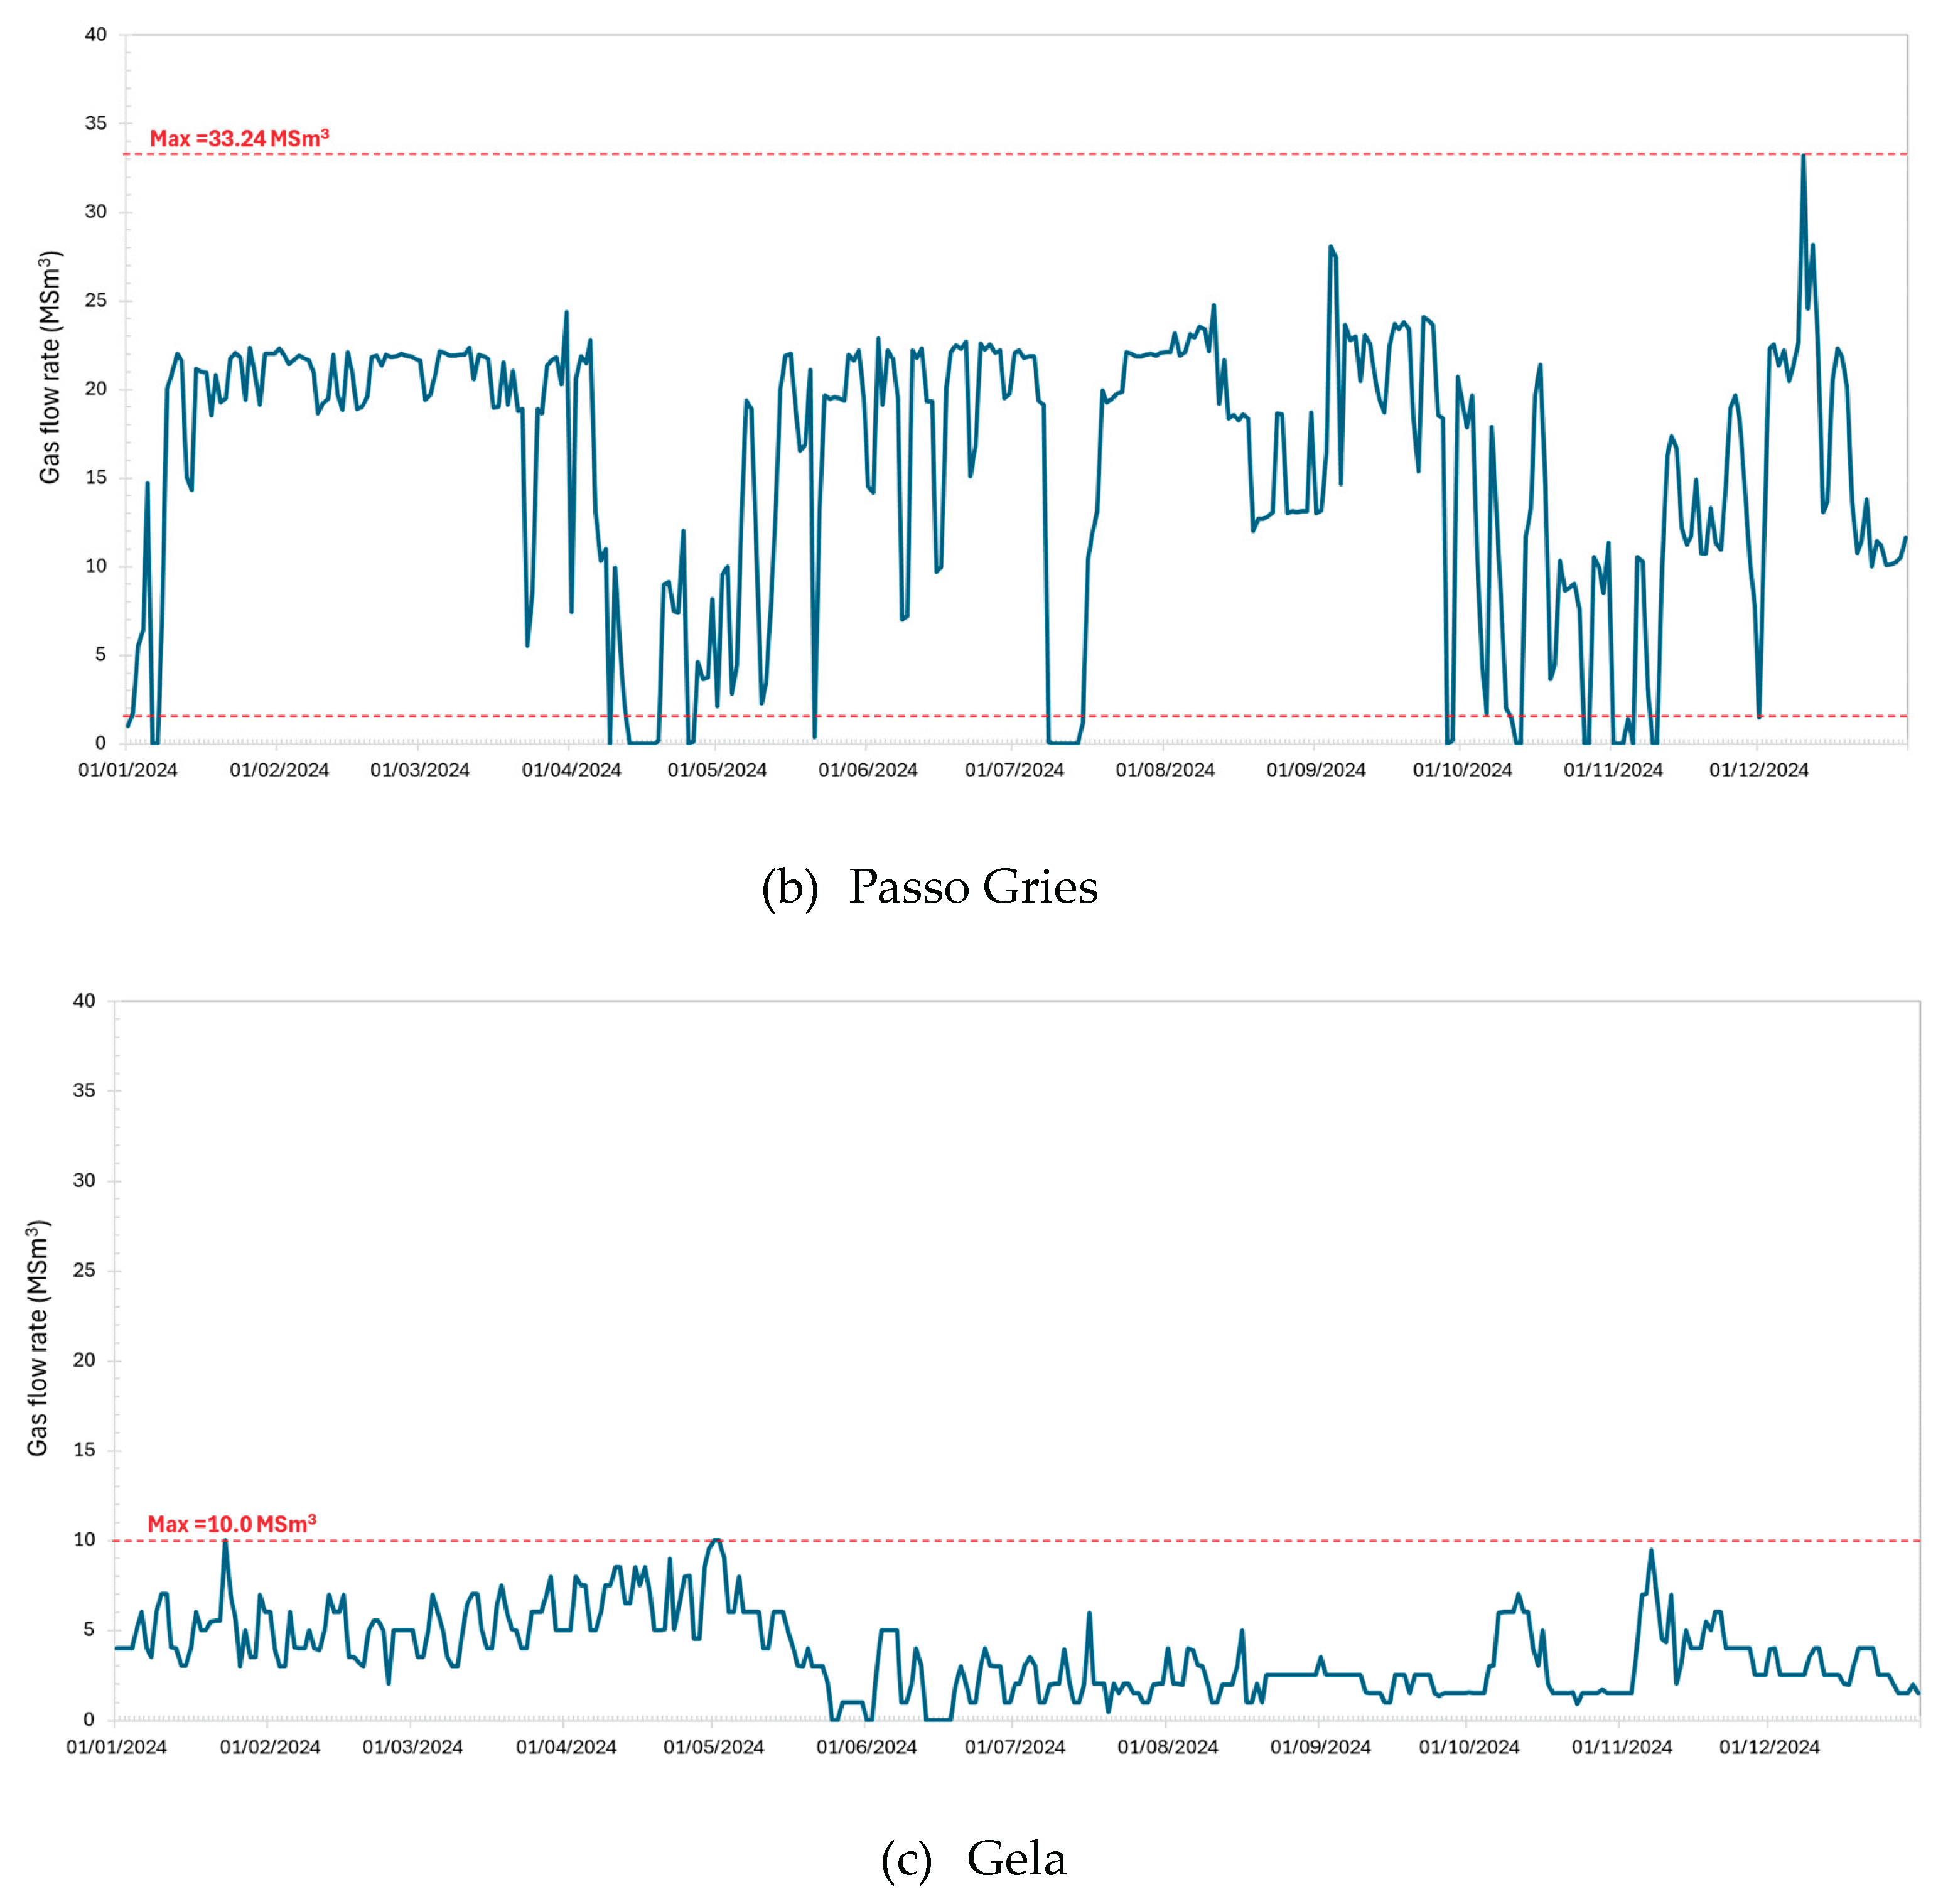
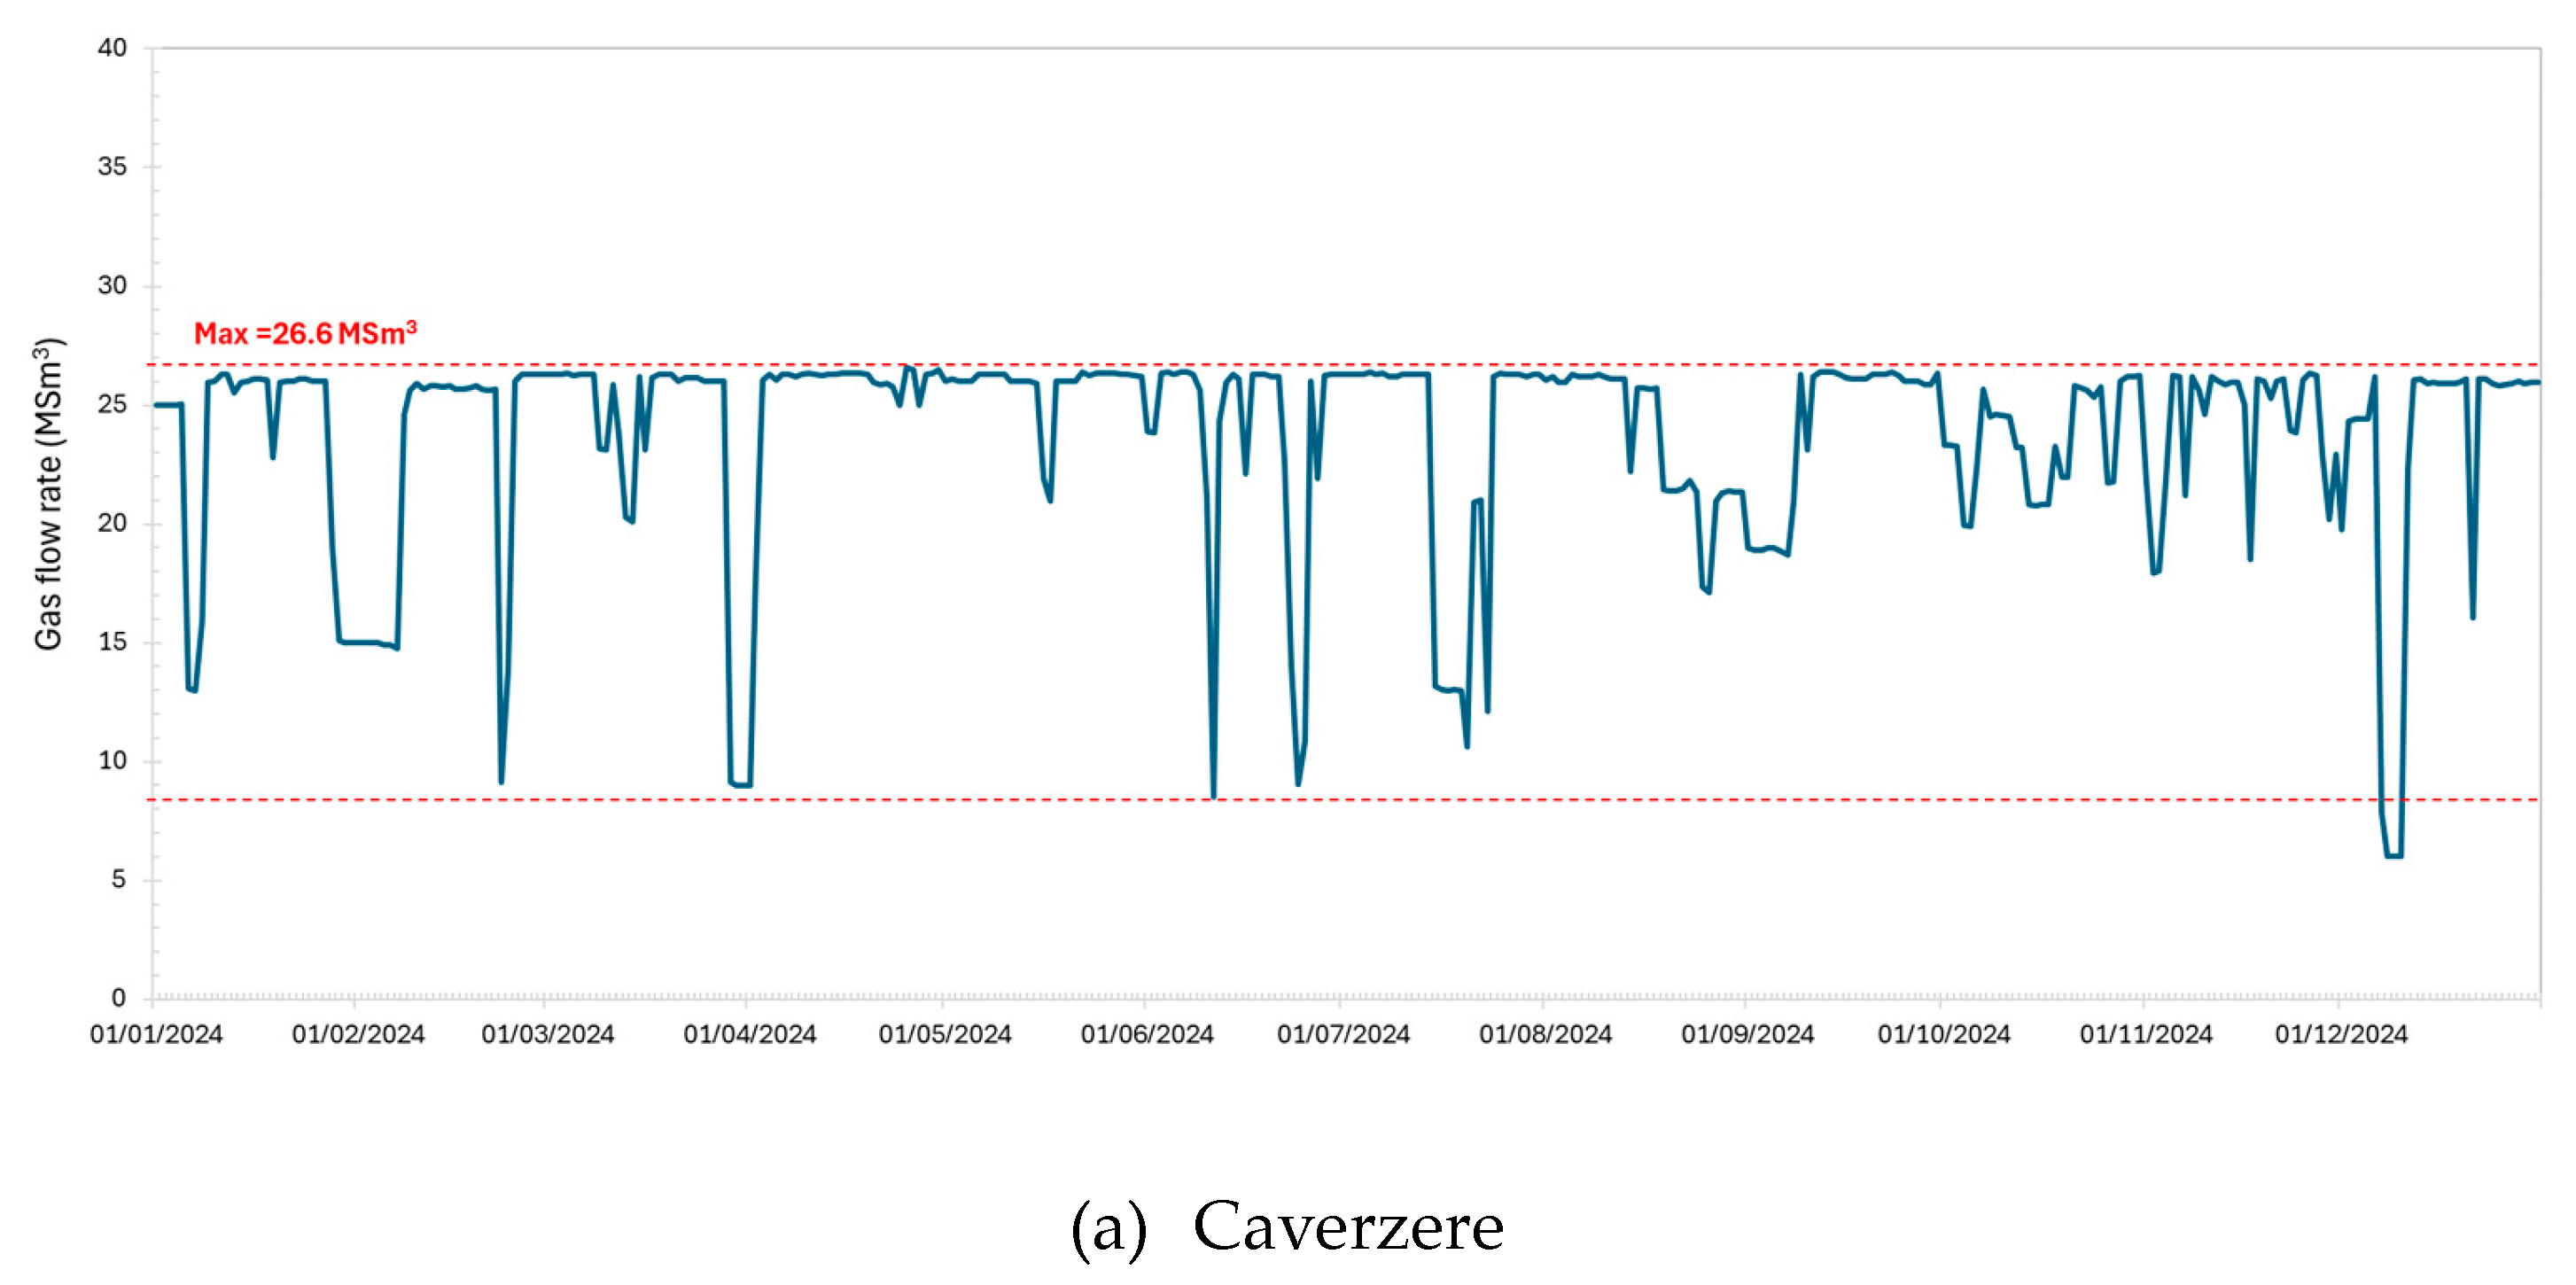
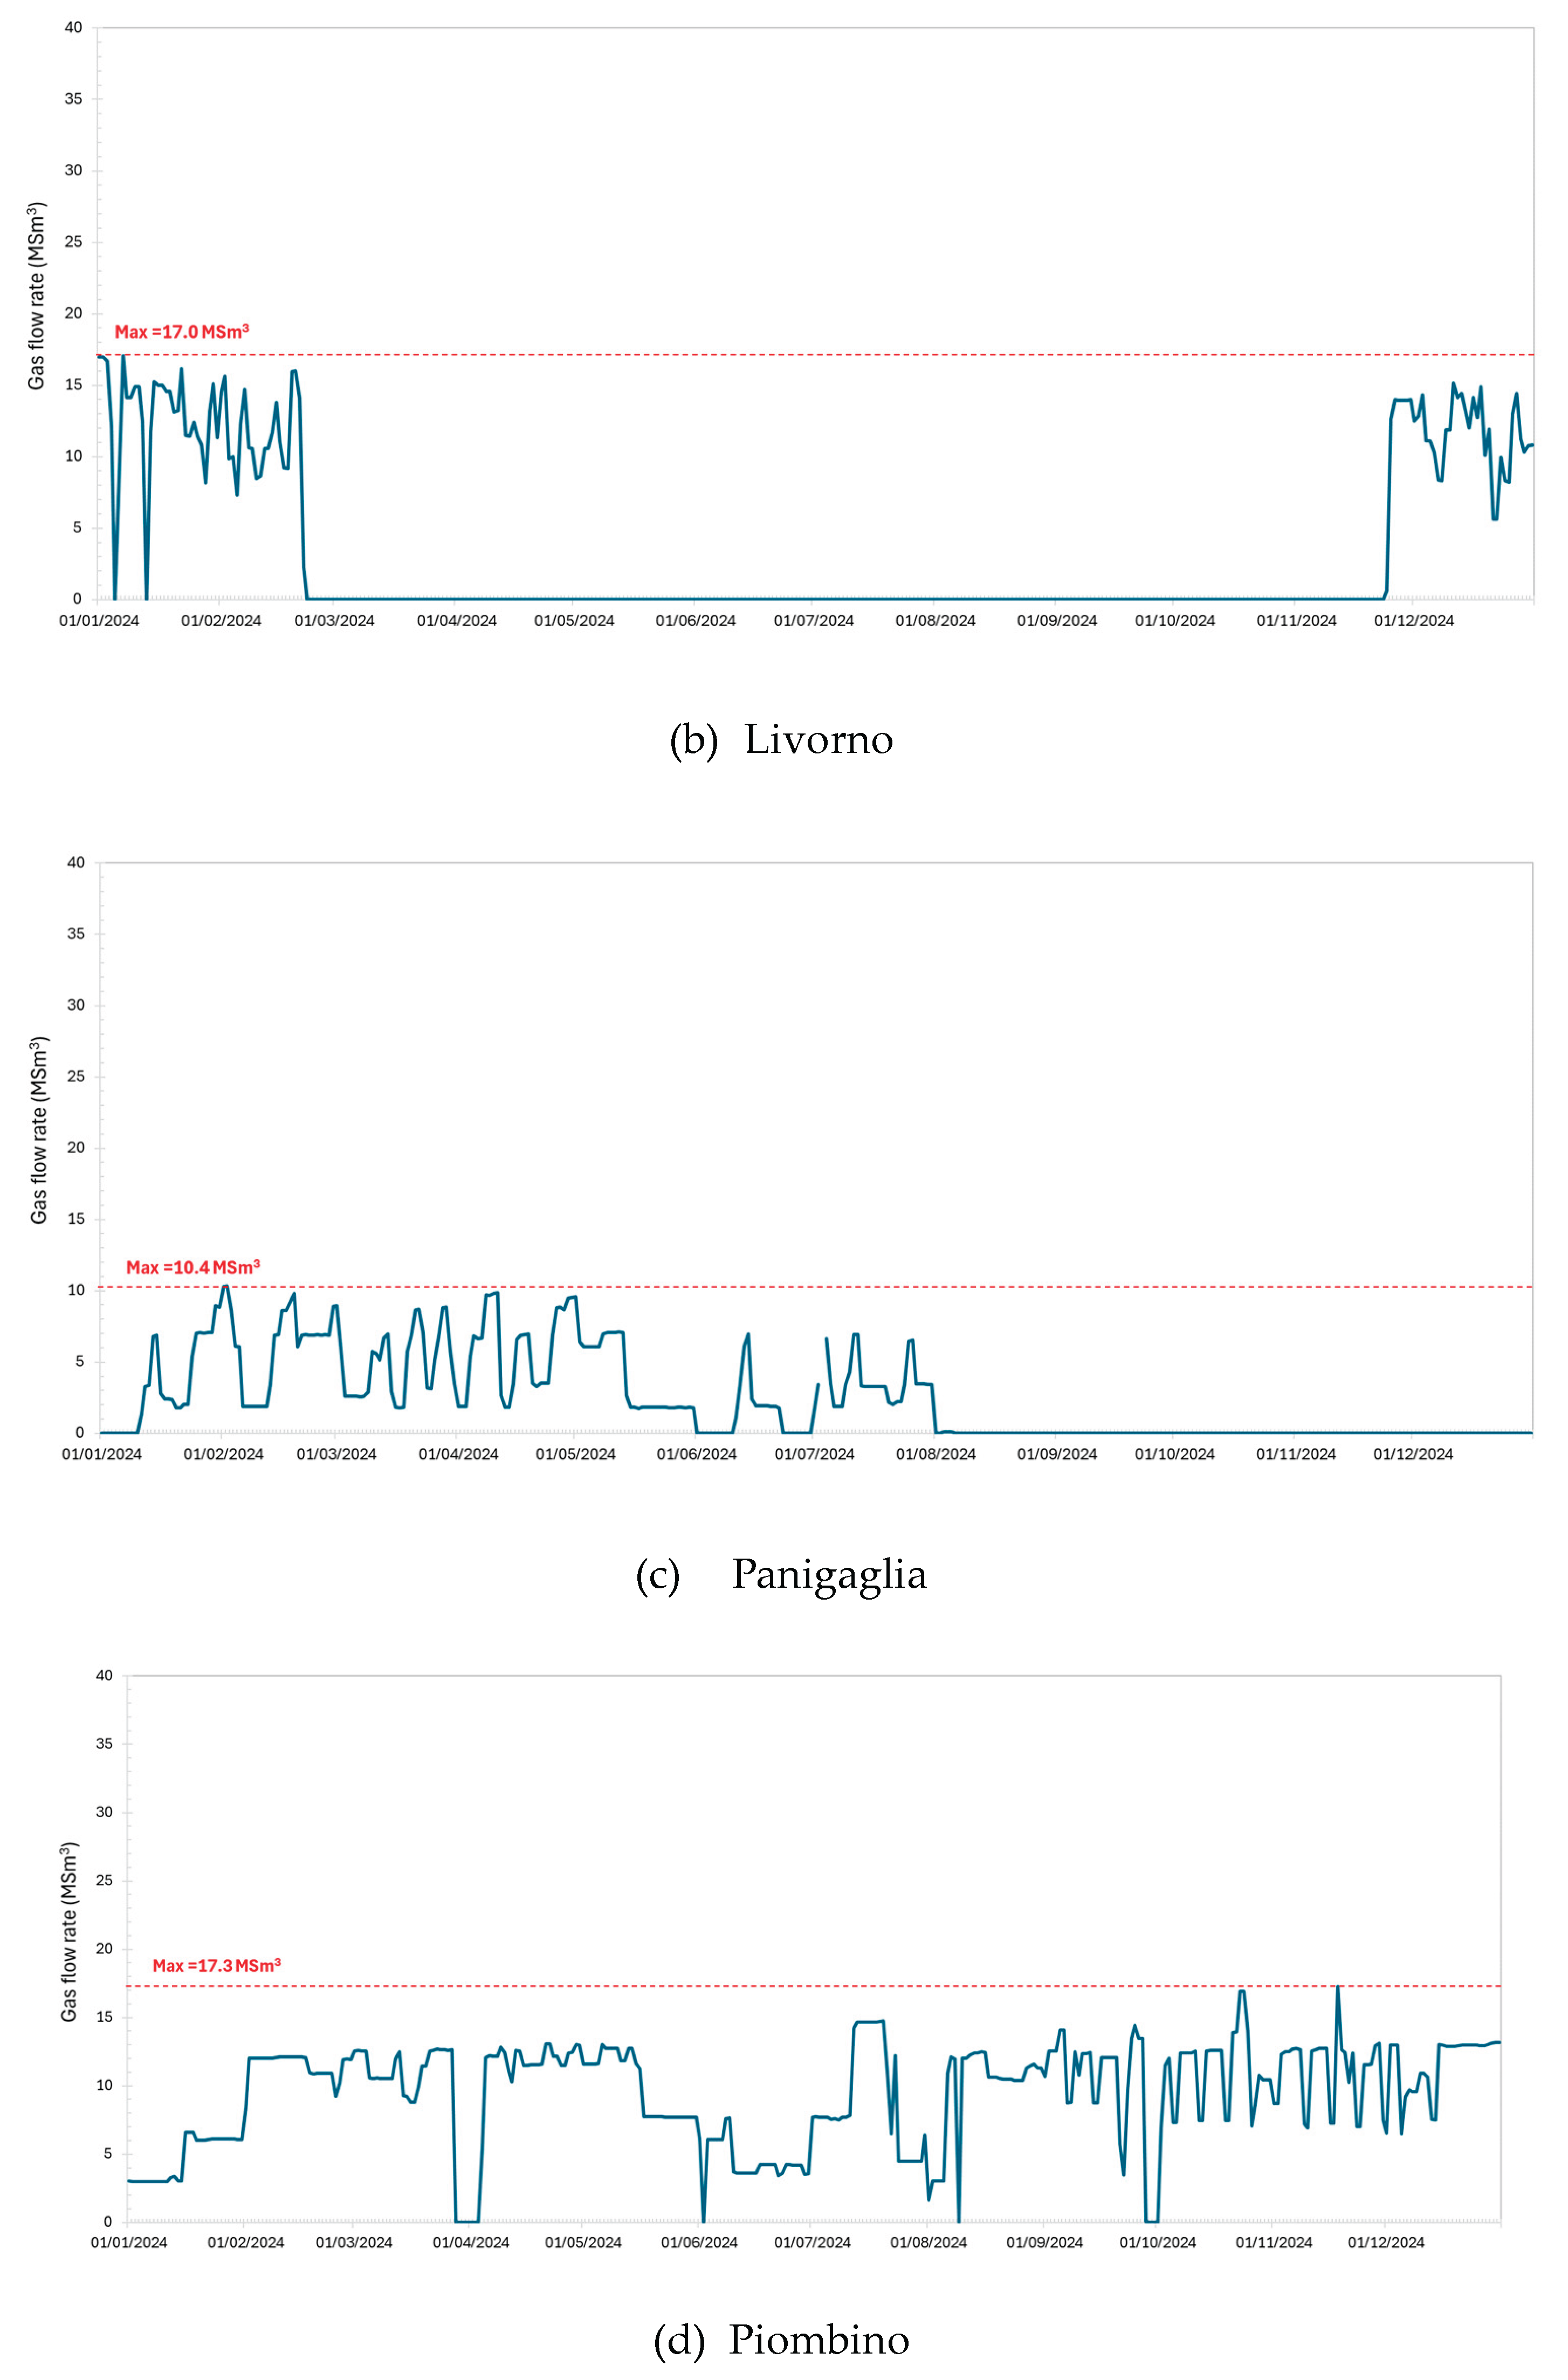
Figure A2.
Daily gas flow rate of natural gas imported by ship (SNAM data [11]).
Figure A2.
Daily gas flow rate of natural gas imported by ship (SNAM data [11]).
References
- Angelico, R., Giametta, F., Bianchi, B., & Catalano, P. (2025). Green hydrogen for energy transition: A critical perspective. Energies, 18(2), 404. [CrossRef]
- Franco, A. (2025). Green Hydrogen and the Energy Transition: Hopes, Challenges, and Realistic Opportunities. Hydrogen, 6(2), 28. [CrossRef]
- Johnson, N., Liebreich, M., Kammen, D. M., Ekins, P., McKenna, R., & Staffell, I. (2025). Realistic roles for hydrogen in the future energy transition. Nature Reviews Clean Technology, 1-21. [CrossRef]
- Akpasi, S. O., Smarte Anekwe, I. M., Tetteh, E. K., Amune, U. O., Mustapha, S. I., & Kiambi, S. L. (2025). Hydrogen as a clean energy carrier: Advancements, challenges, and its role in a sustainable energy future. Clean Energy, 9(1), 52-88. [CrossRef]
- Guduru, R., Singh, R., Patel, R., & Vij, R. K. (2025). Hydrogen as an energy carrier. In Subsurface Hydrogen Energy Storage (pp. 31-61). Elsevier.
- Etezadi, R., Wang, R., & Tsotsis, T. T. (2025). Hydrogen, a versatile chemical for the future: Applications and production methods. AIChE Journal, 71(2), e18645. [CrossRef]
- Franco, A., & Giovannini, C. (2023). Routes for hydrogen introduction in the industrial hard-to-abate sectors for promoting energy transition. Energies, 16(16), 6098. [CrossRef]
- Jayachandran, M., Gatla, R. K., Flah, A., Milyani, A. H., Milyani, H. M., Blazek, V., … & Kraiem, H. (2024). Challenges and opportunities in green hydrogen adoption for decarbonizing hard-to-abate industries: A comprehensive review. Ieee Access, 12, 23363-23388. [CrossRef]
- REN21. Renewables 2025 Global Status Report. Paris: REN21 Secretariat, 2025, available at https://www.ren21.net/gsr-2025/downloads/pdf/go/GSR_2025_GO_2025_Full_Report.pdf.
- Franco, A., & Salza, P. (2011). Strategies for optimal penetration of intermittent renewables in complex energy systems based on techno-operational objectives. Renewable energy, 36(2), 743-753. [CrossRef]
- Antonelli, M., Desideri, U., & Franco, A. (2018). Effects of large scale penetration of renewables: The Italian case in the years 2008–2015. Renewable and Sustainable Energy Reviews, 81, 3090-3100. [CrossRef]
- Terna “Statistical data on electricity in Italy” available at https://dati.terna.it/en/generation/statistical-data#capacity/renewable-sources (last accessed: 30 September 2025).
- Mahajan, D., Tan, K., Venkatesh, T., Kileti, P., & Clayton, C. R. (2022). Hydrogen blending in gas pipeline networks—a review. Energies, 15(10), 3582. [CrossRef]
- Sánchez-Laínez, J., Cerezo, A., de Gracia, M. D. S., Aragón, J., Fernandez, E., Madina, V., & Gil, V. (2024). Enabling the injection of hydrogen in high-pressure gas grids: Investigation of the impact on materials and equipment. International Journal of Hydrogen Energy, 52, 1007-1018. [CrossRef]
- Fernandes, L. A., Marcon, L. R. C., & Rouboa, A. (2024). Simulation of flow conditions for natural gas and hydrogen blends in the distribution natural gas network. International Journal of Hydrogen Energy, 59, 199-213. [CrossRef]
- Rosa, N., Fereidani, N. A., Cardoso, B. J., Martinho, N., Gaspar, A., & da Silva, M. G. (2025). Advances in hydrogen blending and injection in natural gas networks: A review. International Journal of Hydrogen Energy, 105, 367-381. [CrossRef]
- Guzzo, G., Francesconi, M., & Carcasci, C. (2024). Smart management of pressure regulating stations to maximize hydrogen injection in a gas distribution network. International Journal of Hydrogen Energy, 69, 626-634. [CrossRef]
- Guzzo, G., Saedi, I., Mhanna, S., Carcasci, C., & Mancarella, P. (2025). Hydrogen blending in gas pipelines: Fluid-dynamic insights, risks, and recommendations. International Journal of Hydrogen Energy, 120, 67-77. [CrossRef]
- Kippers, M. J., De Laat, J. C., Hermkens, R. J. M., Overdiep, J. J., Van Der Molen, A., Van Erp, W. C., & Van Der Meer, A. (2011). Hydrogen injection in natural gas on island of Ameland in the Netherlands. Seoul, 2011—IGRC South Korea. Available at https://www.kiwa.com/globalassets/netherlands/kiwa-technology/downloads/pilot-project-on-hydrogen-injection-in-natural-gas-on-island-of-ameland-in-the-netherlands-igrc-2011.pdf (last accessed: 25 September 2025).
- Schirrmeister, S., Morstein, O. V., & Föcker, H. (2019). Innovative large-scale energy storage technologies and Power-to-Gas concepts after optimisation. Demonstration plant Falkenhagen commissioned/commissioning report (D2. 3).
- Energy Storage & P2G, 2018. GRHYD project inaugurates first P2G demonstrator in France. Fuel Cells Bull. 2018, 9–10. https://doi.org/10.1016/S1464-2859(18)30251-7. [CrossRef]
- Snam. Snam: hydrogen blend doubled to 10% in Contursi trial [Online]. Available: https://www.snam.it/en/media/news-and-press-releases/news/2020/snam-hyd rogen-blend-doubled-to-10–in-contursi-trial.html. (last accessed: 6 October 2025).
- Rossi, M., Jin, L., Monforti Ferrario, A., Di Somma, M., Buonanno, A., Papadimitriou, C., … & Comodi, G. (2024). Energy hub and micro-energy hub architecture in integrated local energy communities: enabling technologies and energy planning tools. Energies, 17(19), 4813. [CrossRef]
- Isaac, T. (2019). HyDeploy: The UK’s first hydrogen blending deployment project. Clean Energy, 3(2), 114-125. [CrossRef]
- Pellegrini, M., Guzzini, A., & Saccani, C. (2020). A preliminary assessment of the potential of low percentage green hydrogen blending in the Italian natural gas network. Energies, 13(21), 5570. [CrossRef]
- The Öhringen Hydrogen Island. available at https://www.ees-europe.com/news/the-oehringen-hydrogen-island (last accessed 8 October 2025).
- Future Grid Project progress report (2022). Available at https://www.nationalgas.com/sites/default/files/documents/FutureGrid%20Project%20Progress%20Report%20(PPR)%202022.pdf (last accessed 8 October 2025).
- Deiana P., McPhail S., Monteleone G. (2024) ENEA Hydrogen Valley, towards an infrastructural hub in Italy https://www.eai.enea.it/archivio/pianeta-idrogeno/enea-hydrogen-valley-towards-an-infrastructural-hub-in-italy.html DOI 10.12910/EAI2021-029 (last accessed 8 October 2025).
- Raugei, M., Leccisi, E., Azzopardi, B., Jones, C., Gilbert, P., Zhang, L., … & Mancarella, P. (2018). A multi-disciplinary analysis of UK grid mix scenarios with large-scale PV deployment. Energy Policy, 114, 51-62. [CrossRef]
- Guzzo, G., Cheli, L., & Carcasci, C. (2022). Hydrogen blending in the Italian scenario: Effects on a real distribution network considering natural gas origin. Journal of Cleaner Production, 379, 134682. [CrossRef]
- Franco, A., & Giovannini, C. (2024). Hydrogen gas compression for efficient storage: Balancing energy and increasing density. Hydrogen, 5(2), 293-311. [CrossRef]
- Weaver E.R. Formulas and Graphs for Representing the Interchangeability of Fuel Gases. Journal of Research of the National Bureau of Standards 1951, 46 (3), 213-245. [CrossRef]
- Franco, A., & Rocca, M. (2024). Industrial decarbonization through blended combustion of natural gas and hydrogen. Hydrogen, 5(3), 519-539. [CrossRef]
- Franco, A. (2016). Natural gas consumption and correlation with the uses of thermal energy: Analysis of the Italian case. Journal of Natural Gas Science and Engineering, 31, 703-714. [CrossRef]
- SNAM Rete Gas: Physical Flows available at https://www.snam.it/en/our-businesses/transportation/phisical-flows-on-the-national-network.html (last accessed 7 October 2025).
- Snam Measurement portal. Compositions of typical gases fed into the Snam Rete Gas transportation network AT2023-2024.Available at: https://misura.snam.it/portmis/coortecDocumentoController.do (last accessed 7 October 2025).
- Yan, Y., Wang, Y., Yan, J., Zhang, H., & Shang, W. (2024). Wind electricity-hydrogen-natural gas coupling: An integrated optimization approach for enhancing wind energy accommodation and carbon reduction. Applied Energy, 369, 123482. [CrossRef]
- Huang, H., Sun, X., Li, J., Yu, B., Wang, X., Pu, M., & Ma, L. (2025). Economic analysis of blending hydrogen into natural gas pipelines: Supply chain and station modification. International Journal of Hydrogen Energy, 118, 300-311. [CrossRef]
- Zacepins, A., Kotovs, D., Komasilovs, V., & Kviesis, A. (2024). Economic modelling of mixing hydrogen with natural gas. Processes, 12(2), 262. [CrossRef]
- Topolski, K., Reznicek, E. P., Erdener, B. C., San Marchi, C. W., Ronevich, J. A., Fring, L., … & Chung, M. (2022). Hydrogen blending into natural gas pipeline infrastructure: Review of the state of technology. Technical Report NREL/TP-5400-81704, available at https://docs.nrel.gov/docs/fy23osti/81704.pdf (last accessed 8 October 2025).
- Morgan, D., Sheriff, A., Wallace, M., Wijaya, N., Vikara, D., & Liu, G. (2024). FECM/NETL Hydrogen Pipeline Cost Model (2024): Description and User’s Manual (No. DOE/NETL-2024/4841). National Energy Technology Laboratory (NETL), Pittsburgh, PA, Morgantown, WV, and Albany, OR (United States). https://www.osti.gov/servlets/purl/2339568 (last accessed 8 October 2025).
- Ministry of Environment and Energy Security (MASE), and Institute for Environmental Protection and Research (ISPRA). Table of national standard coefficients 2021-2023, version 13/01/2025.
Figure 1.
Variation of Renewable Power installed in the world [9].
Figure 1.
Variation of Renewable Power installed in the world [9].
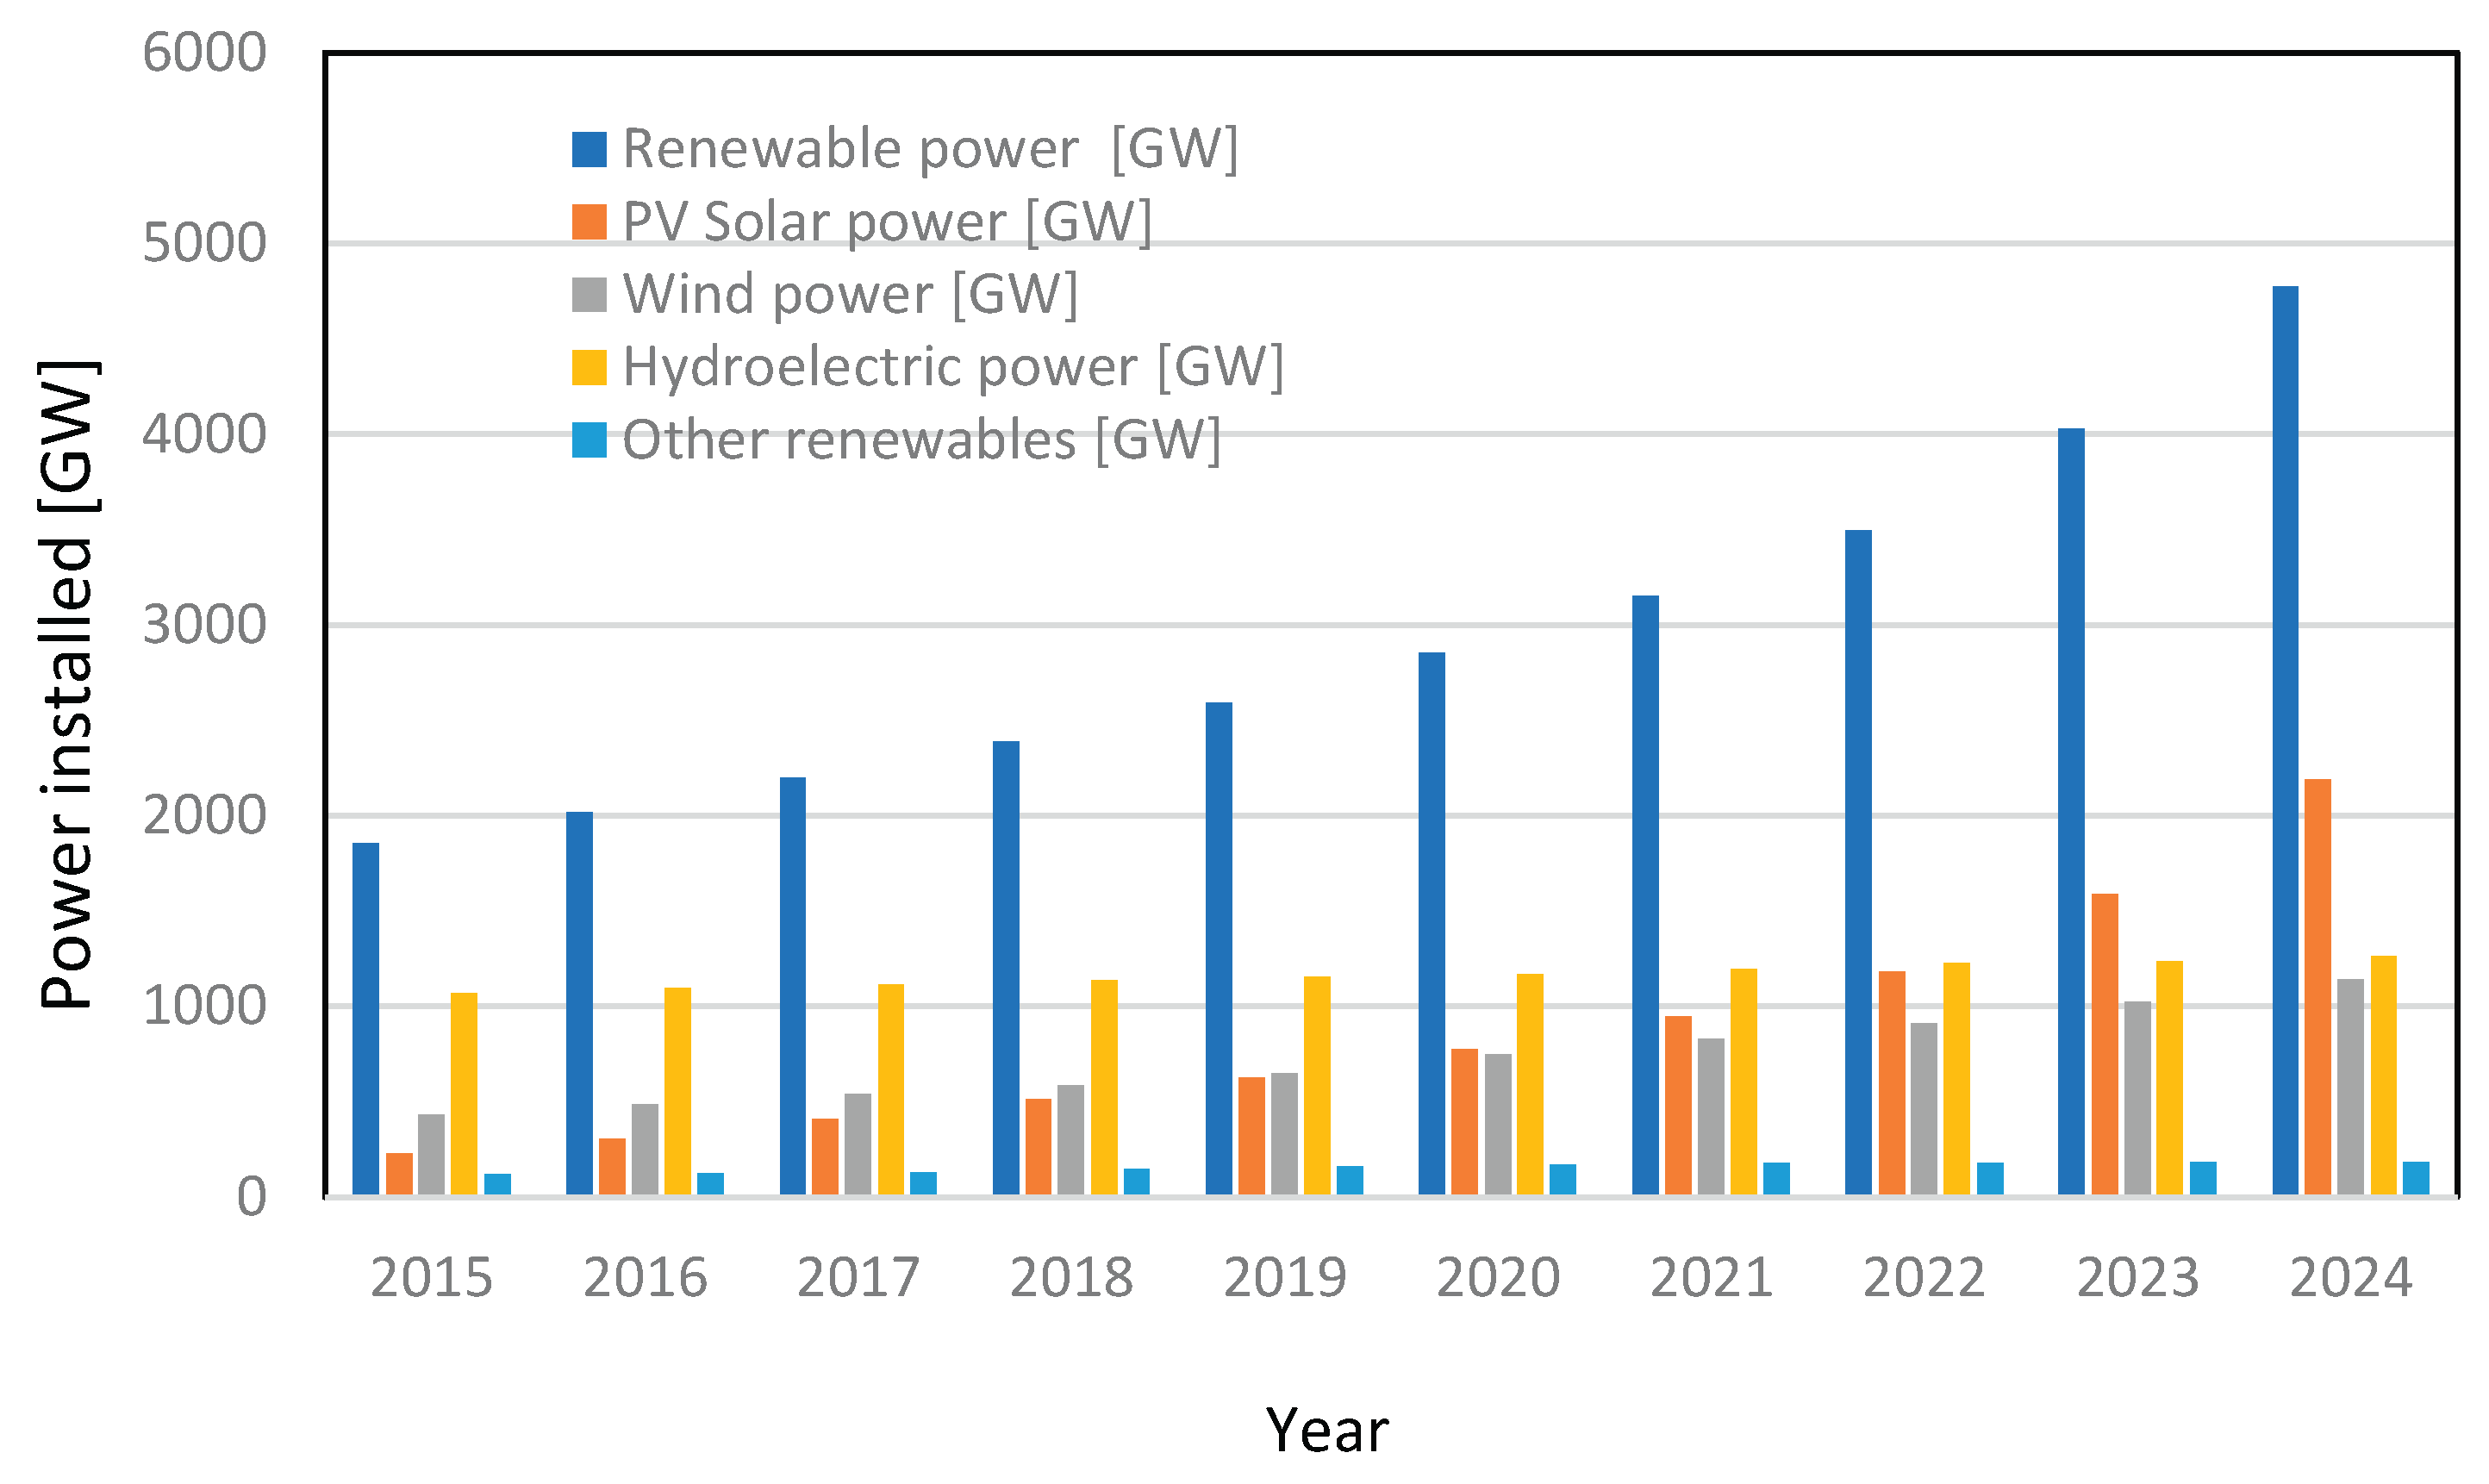
Figure 2.
Variation of PV capacity installed in Italy [12].
Figure 2.
Variation of PV capacity installed in Italy [12].
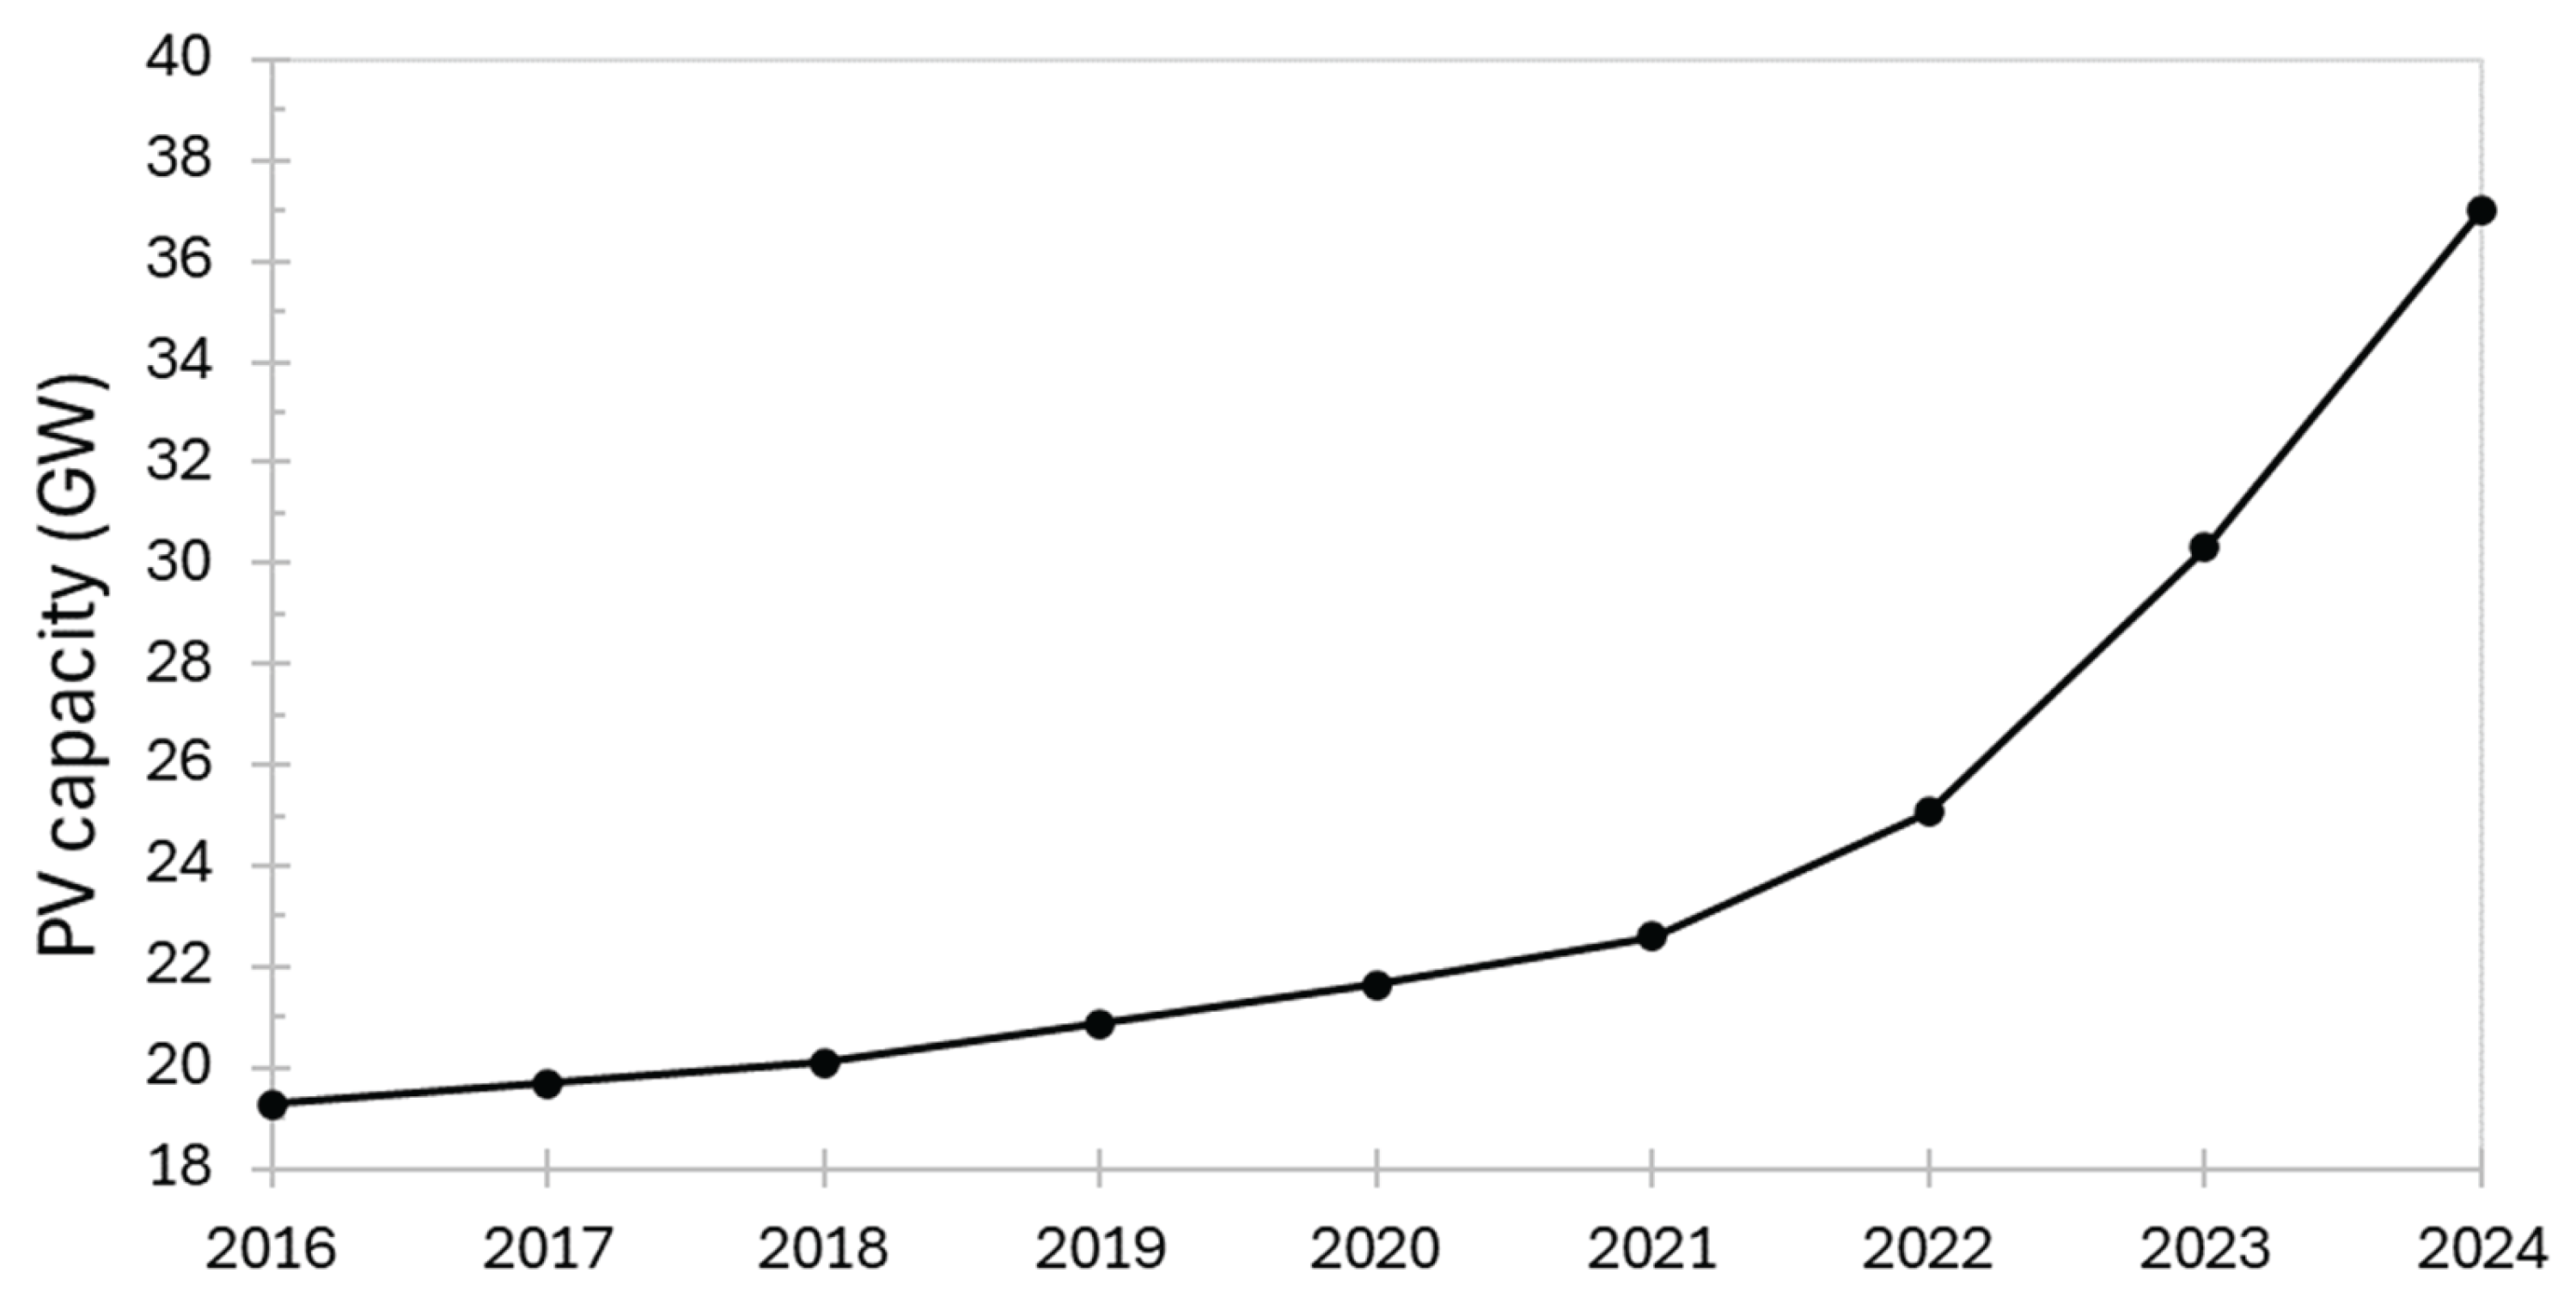
Figure 3.
The concept of integration of hydrogen into the natural gas grid.
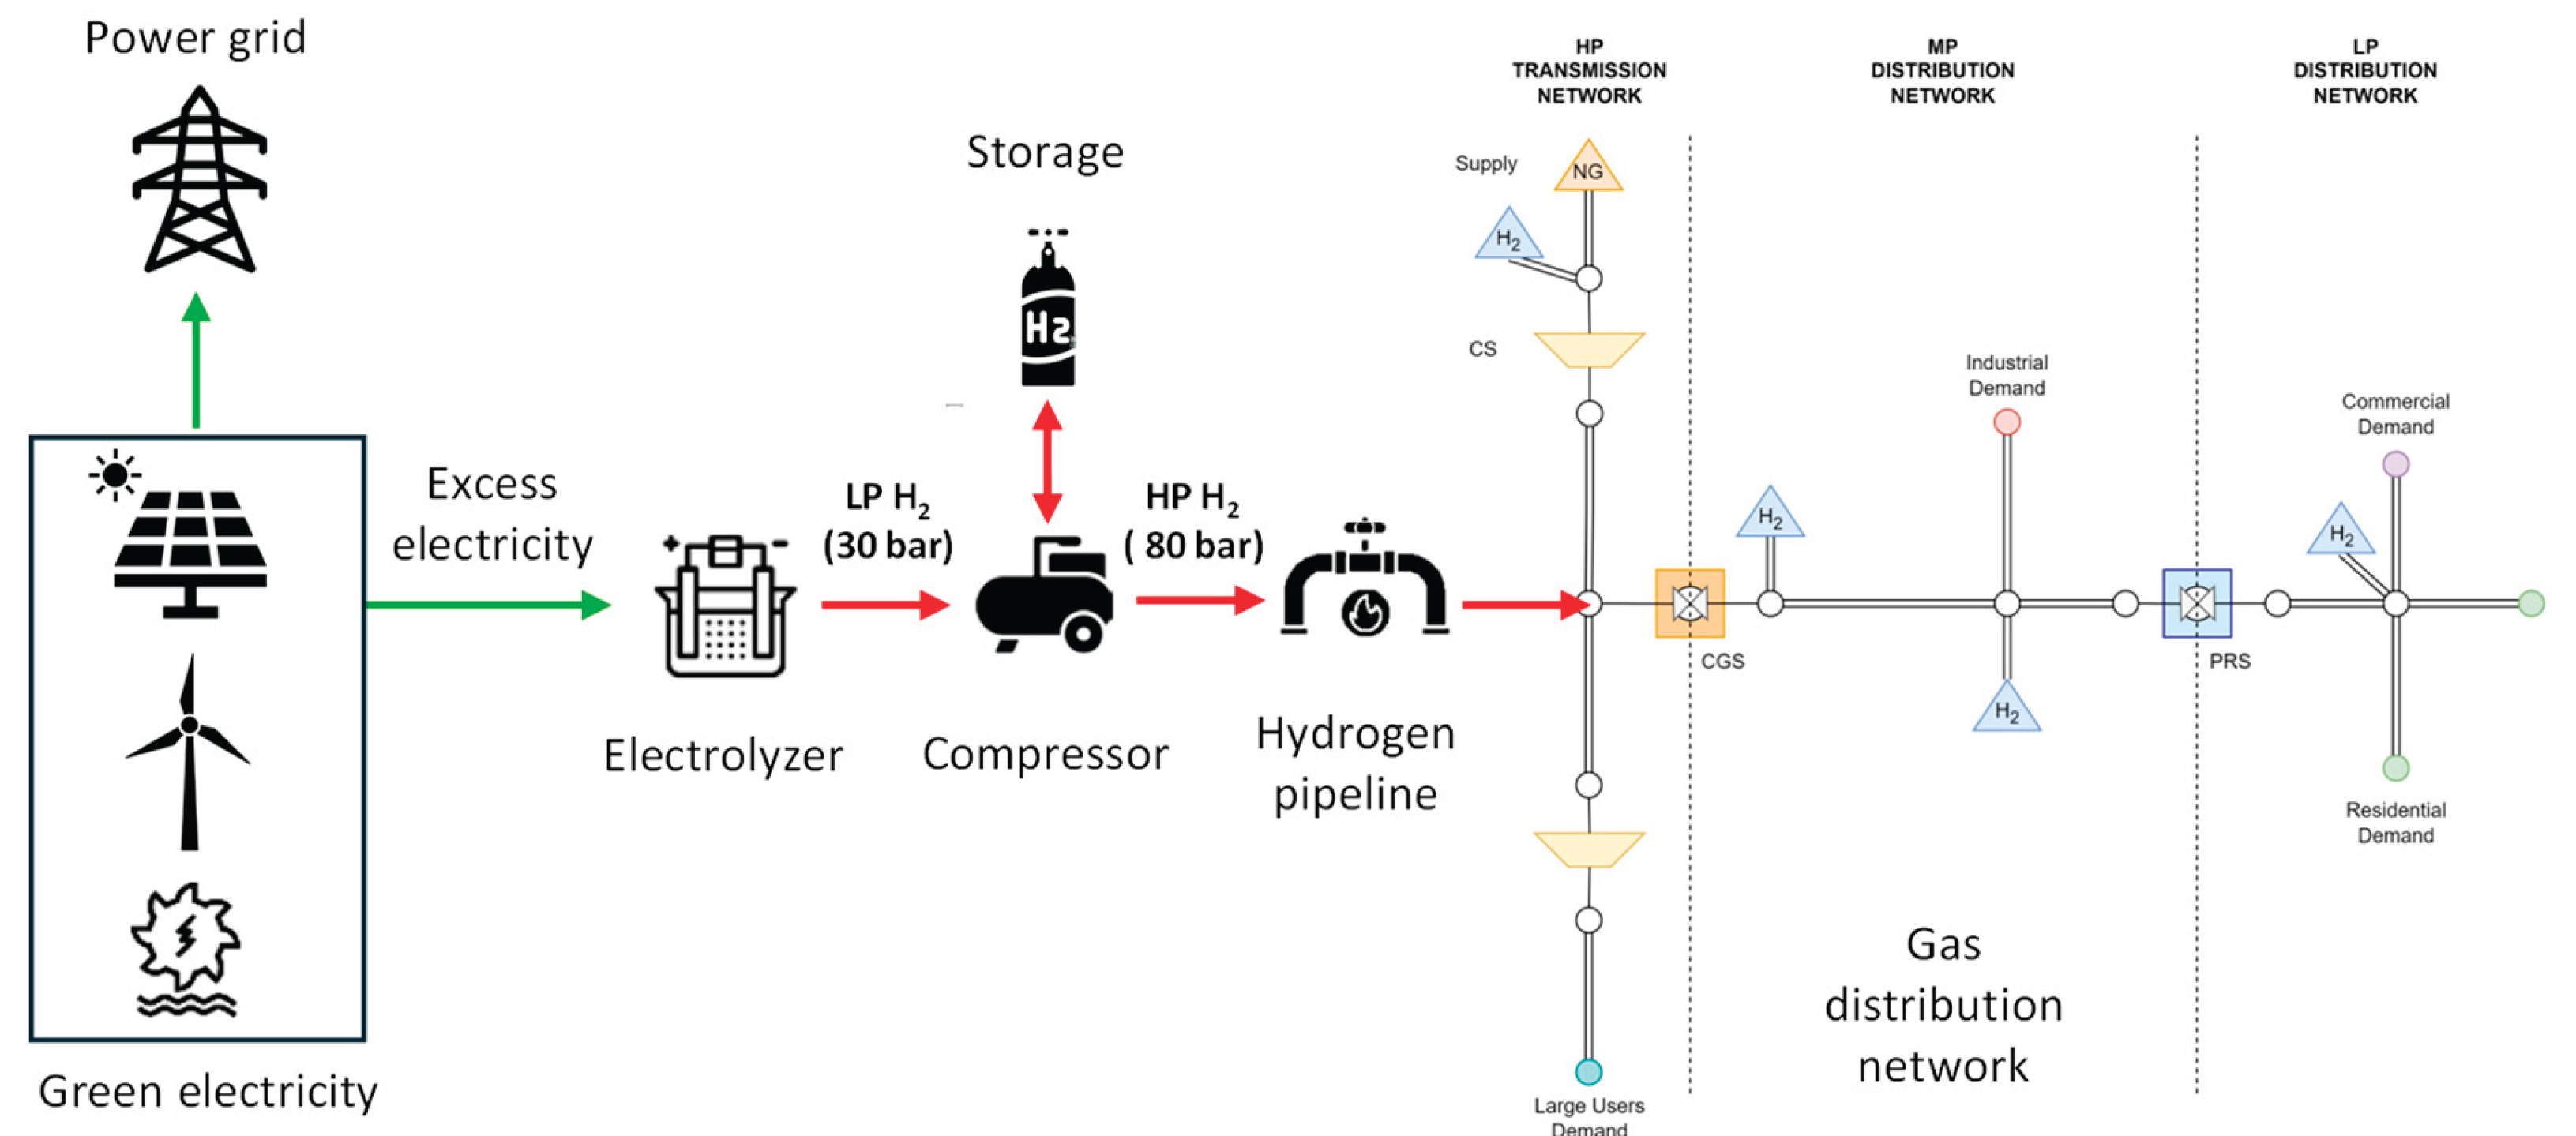
Figure 4.
Italian natural gas reception points and GNL reception points.
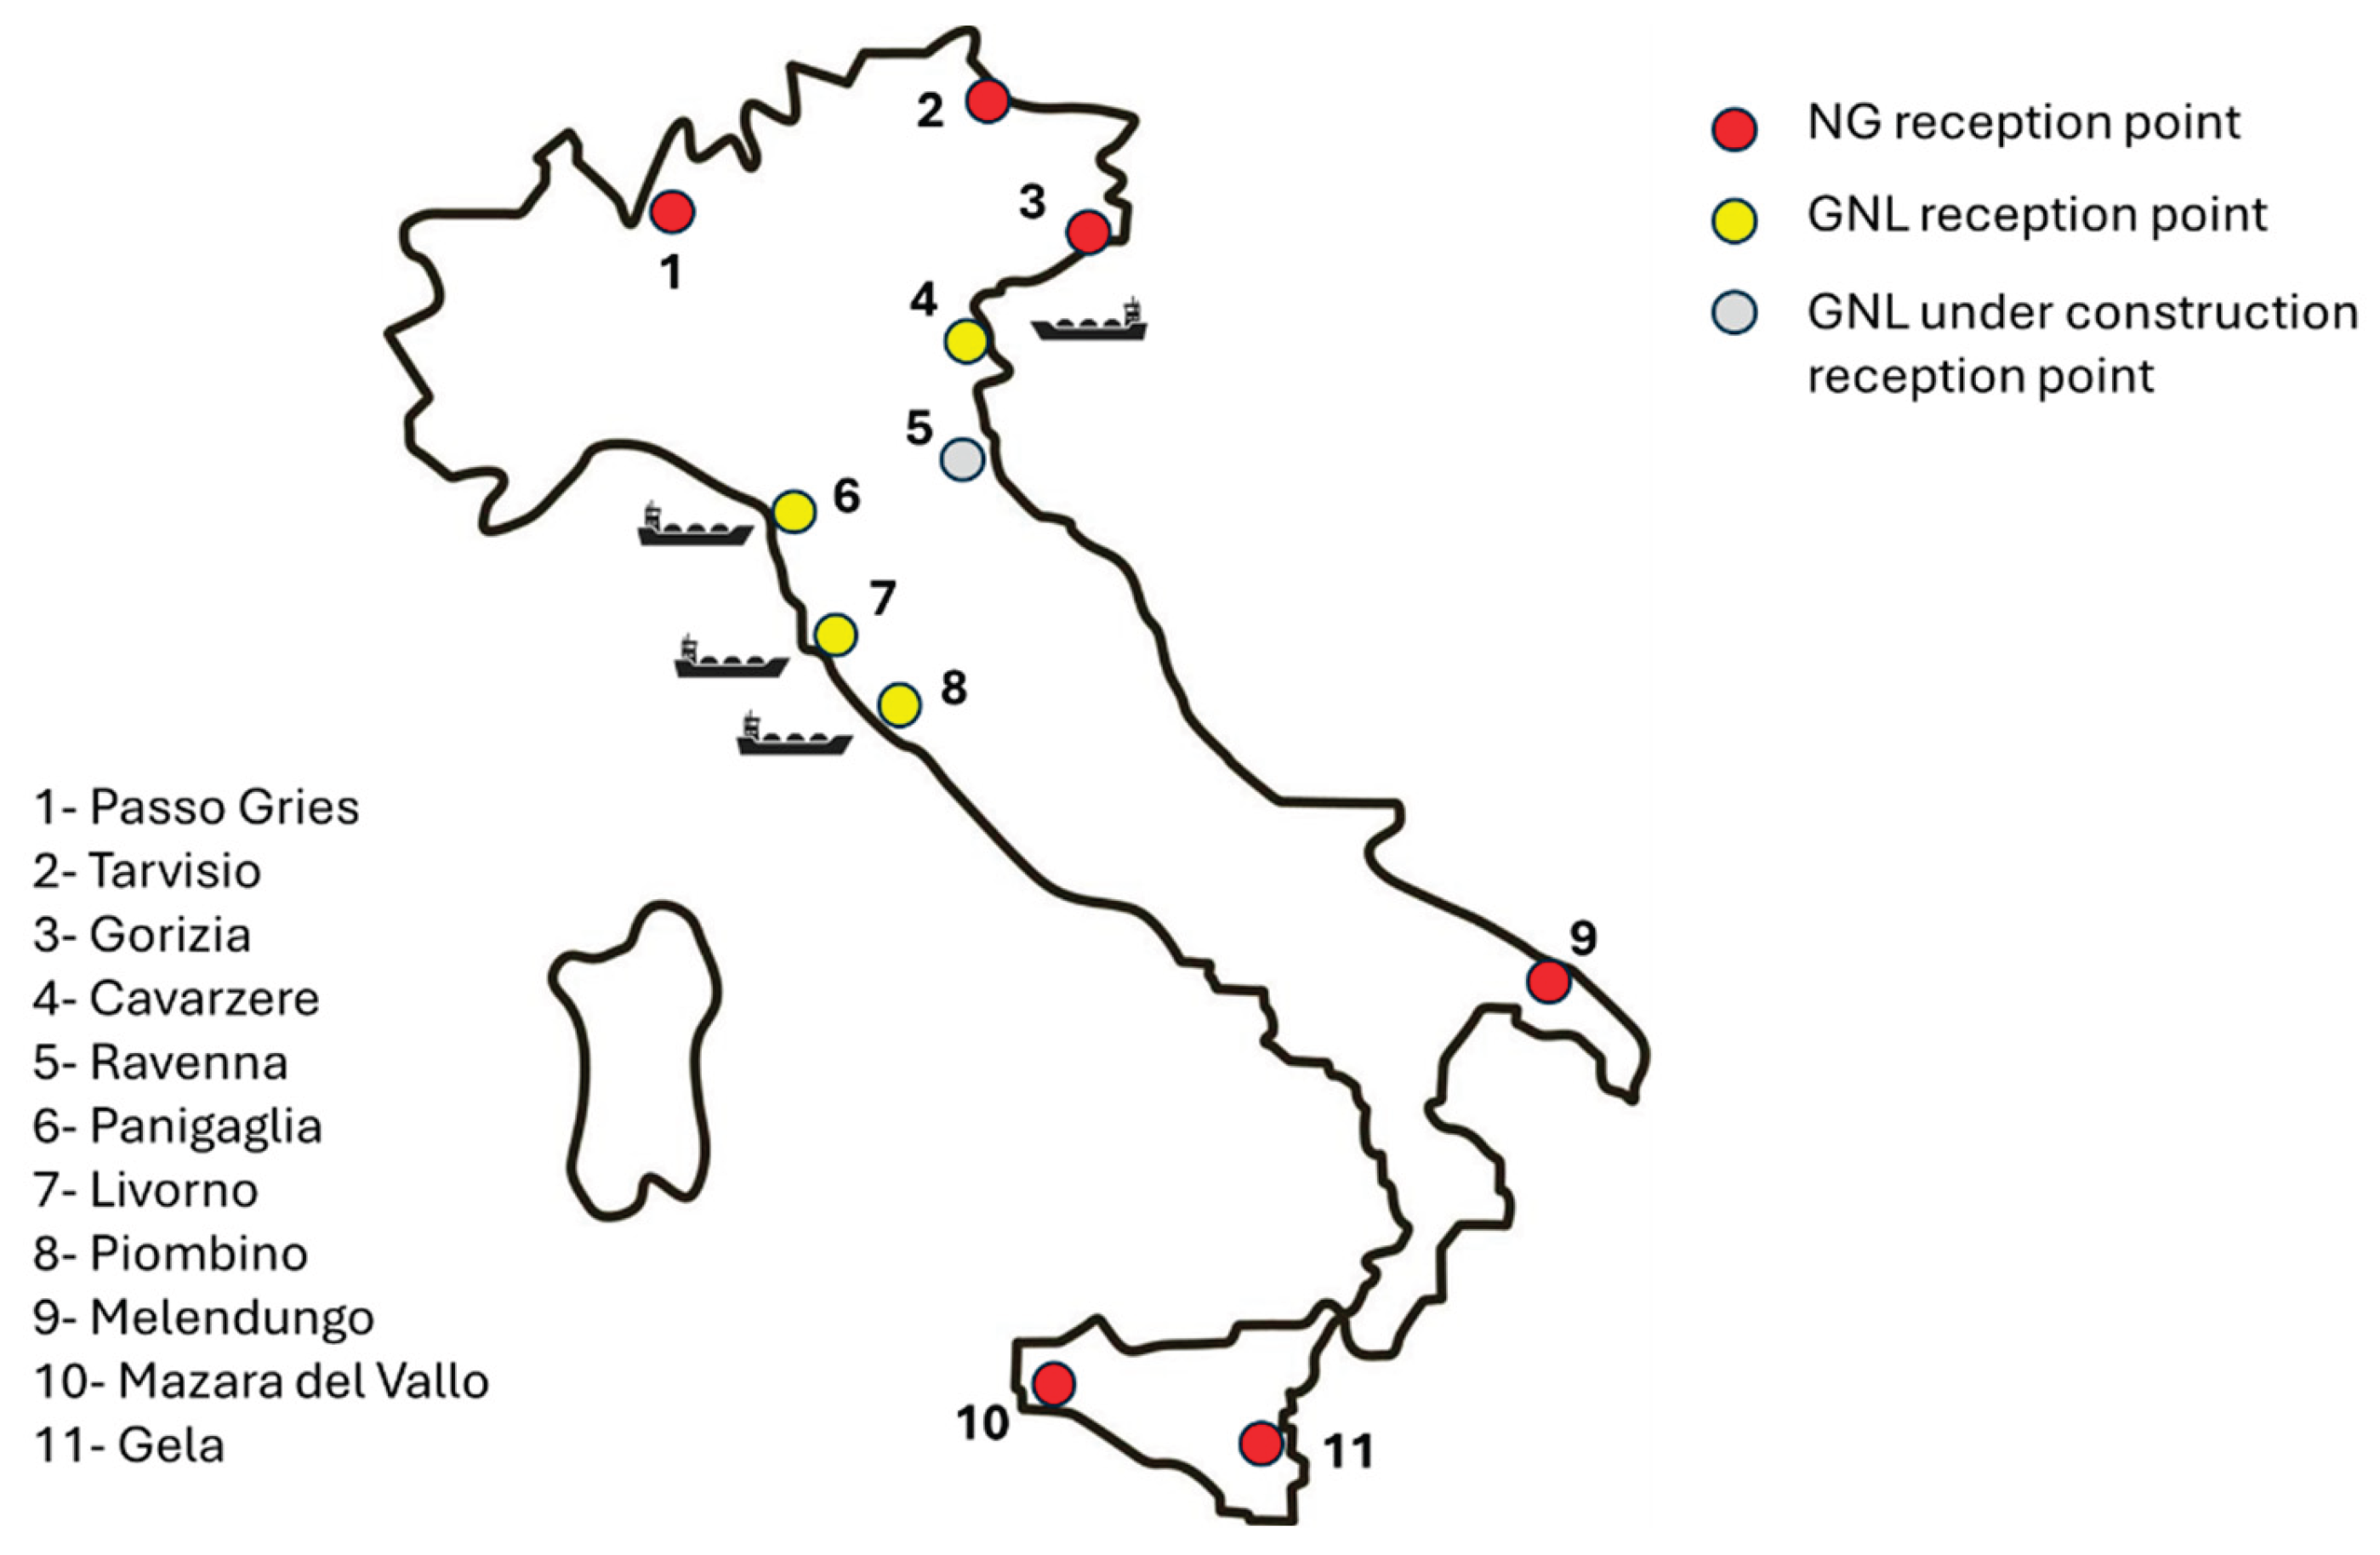
Figure 5.
Daily flow rates during 2024 at the reception points of Melendugno (a) and Tarvisio (b).
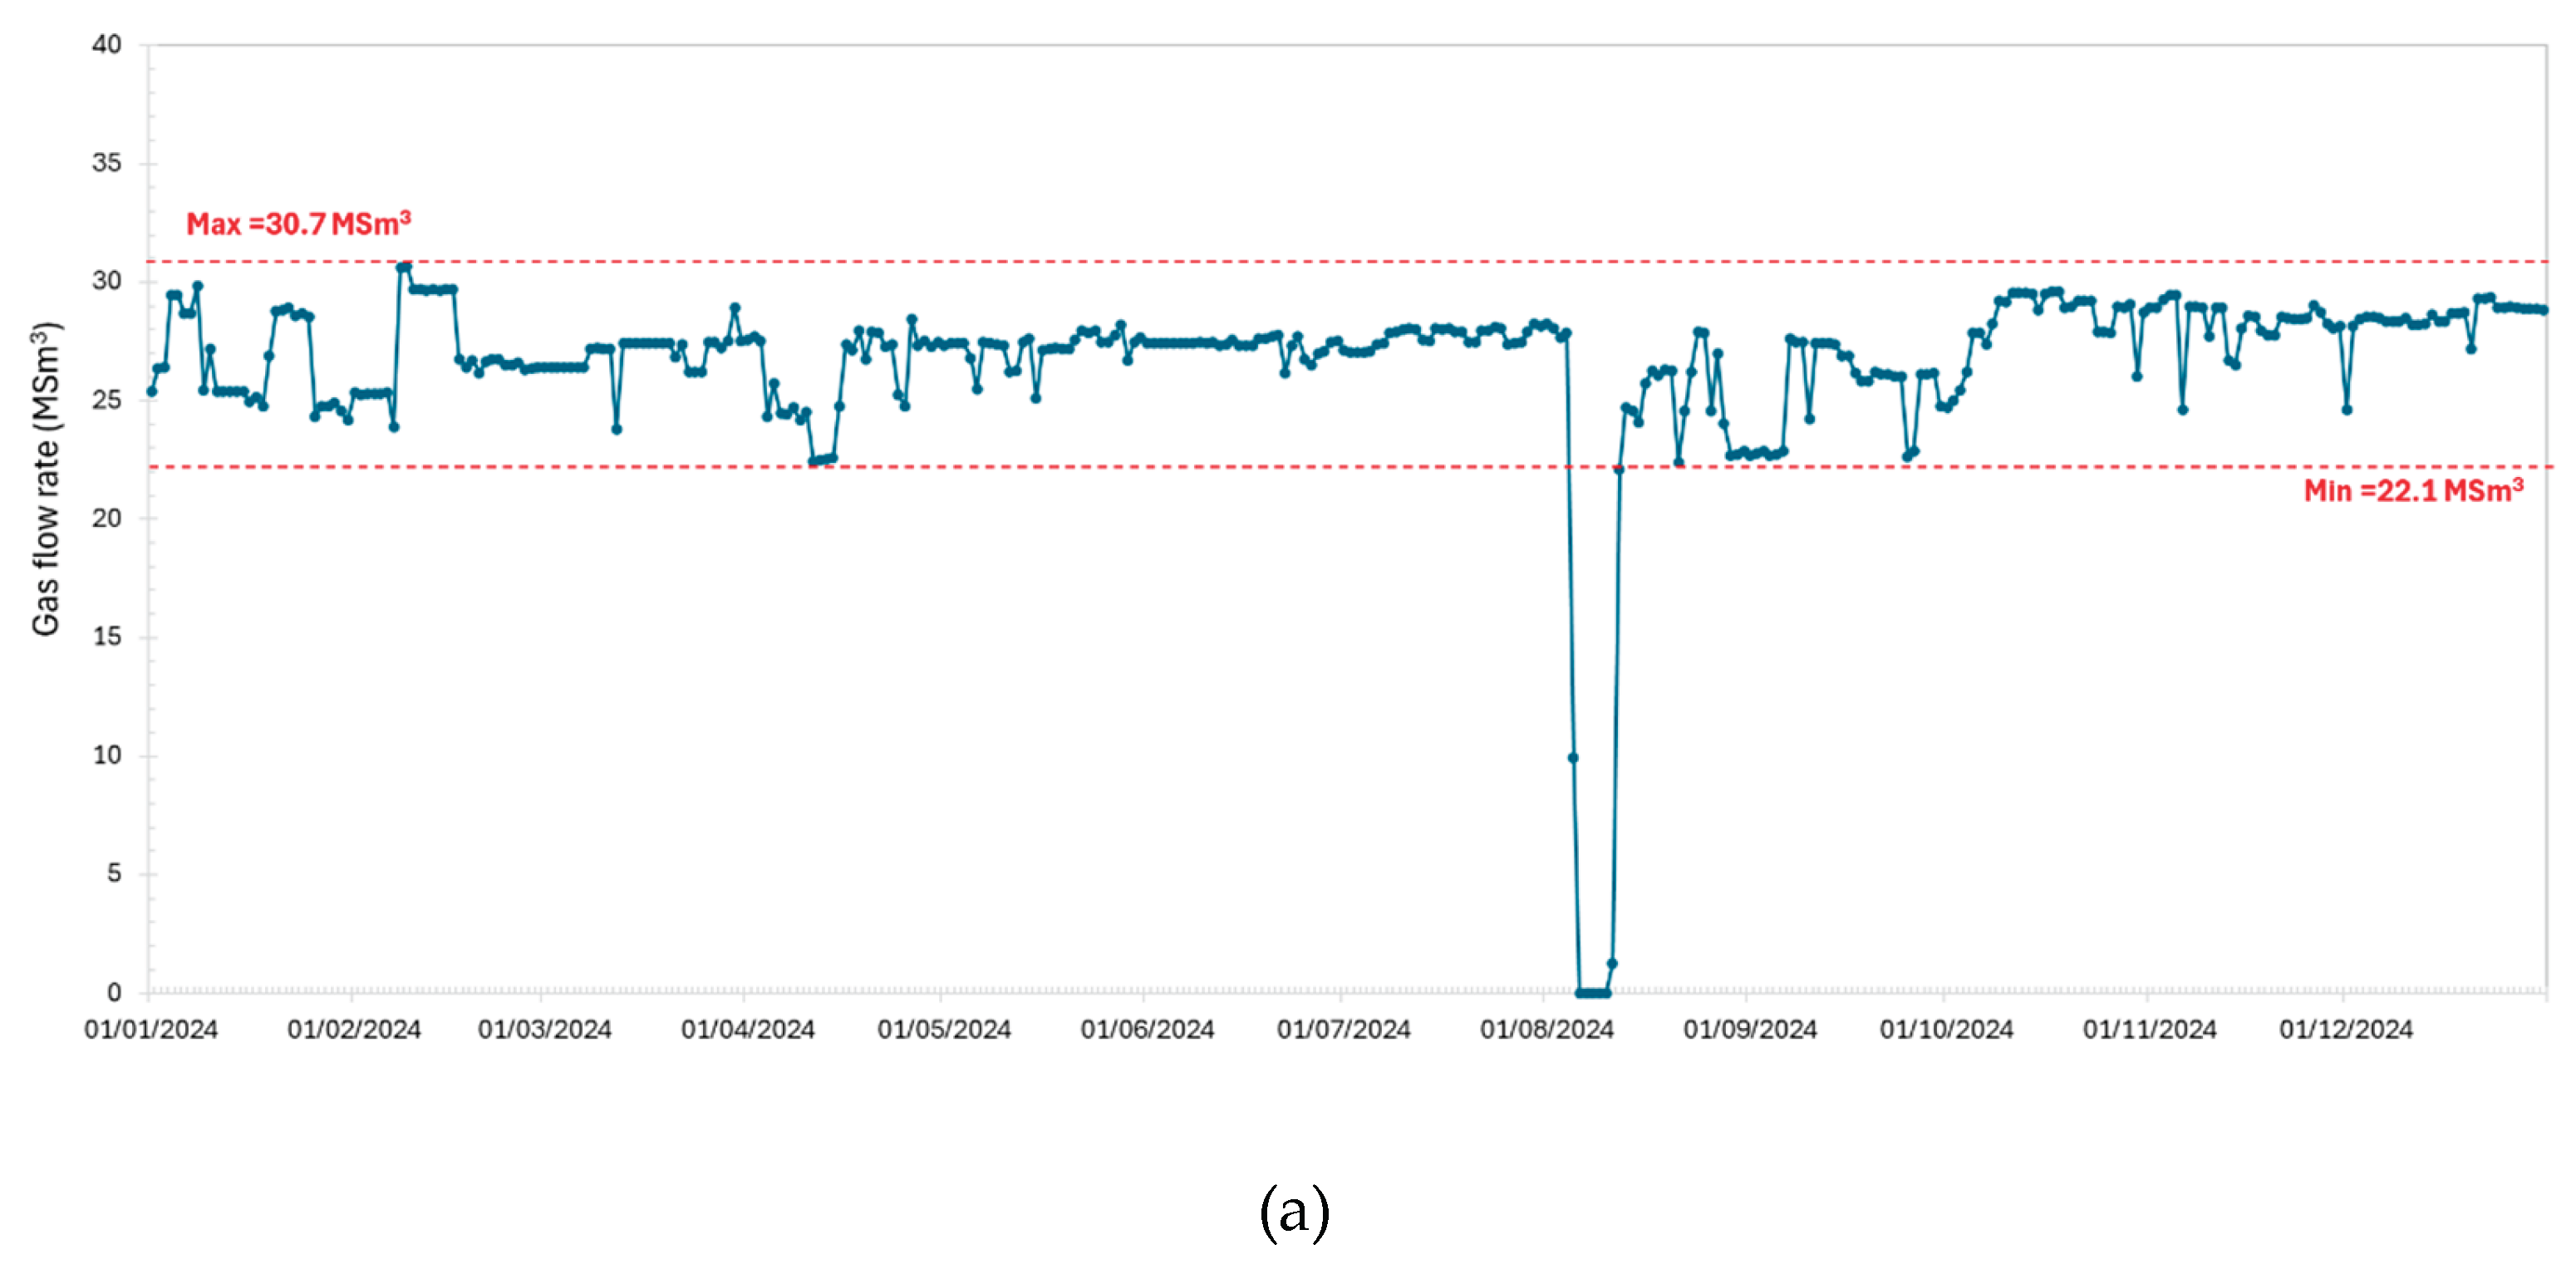
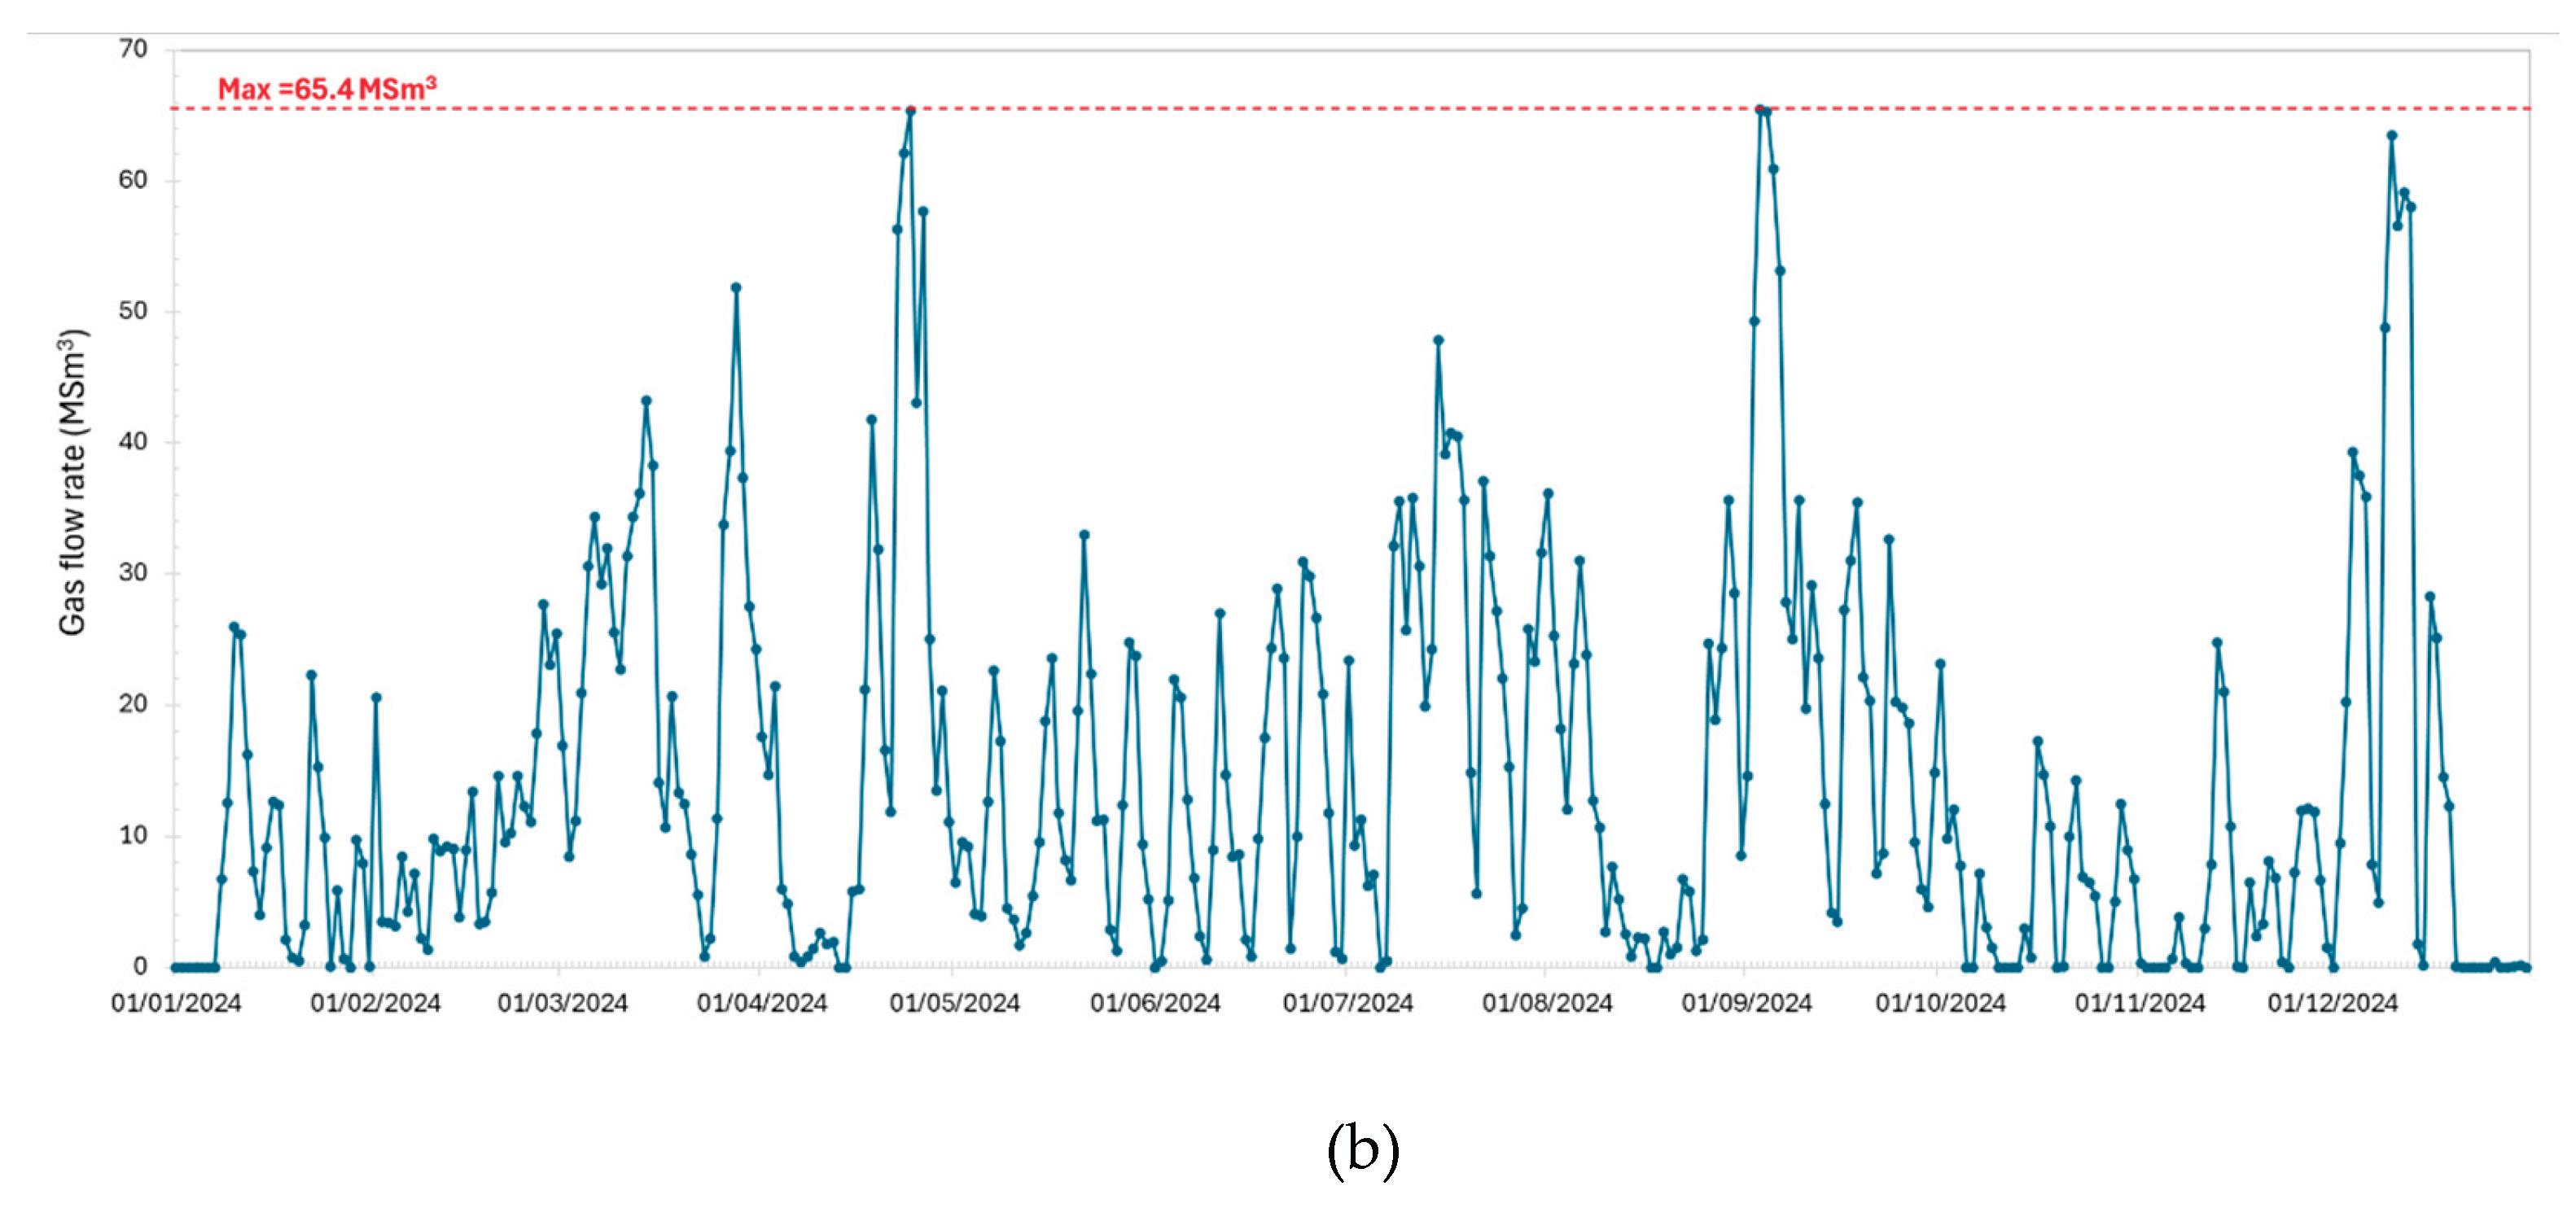
Figure 6.
Daily flow rates of natural gas imported in 2024 through reception points in Italy.
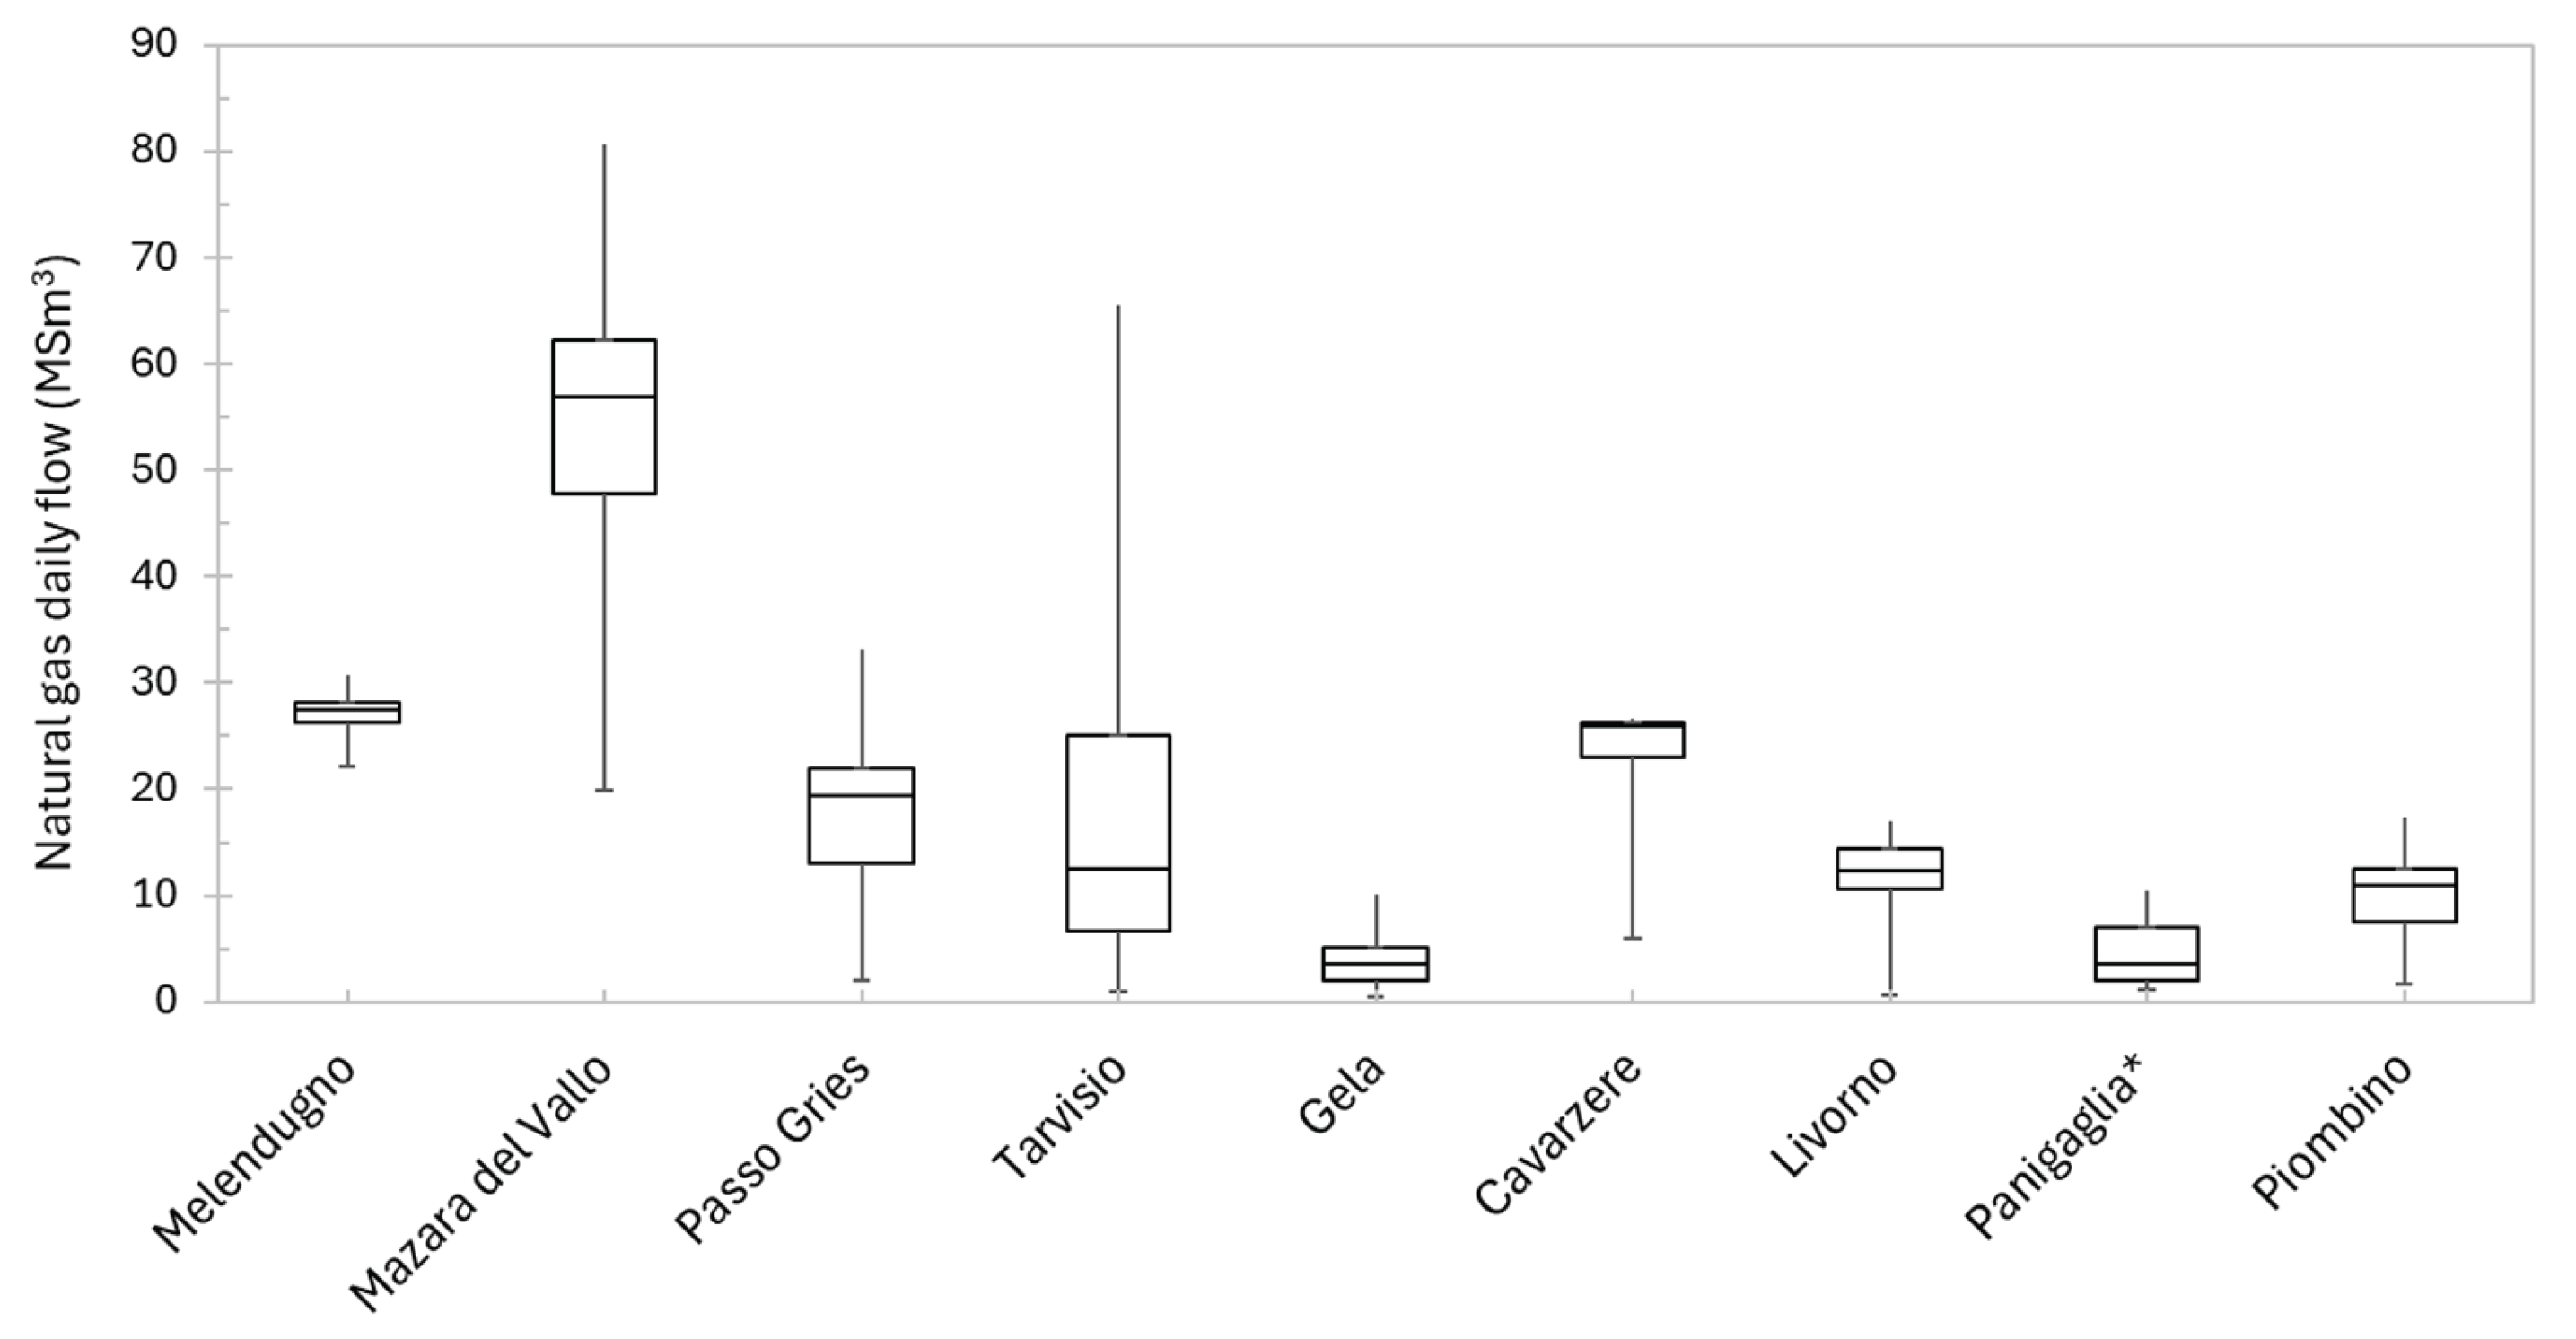
Figure 7.
Daily Hydrogen production and network injection at Melendugno reception point.
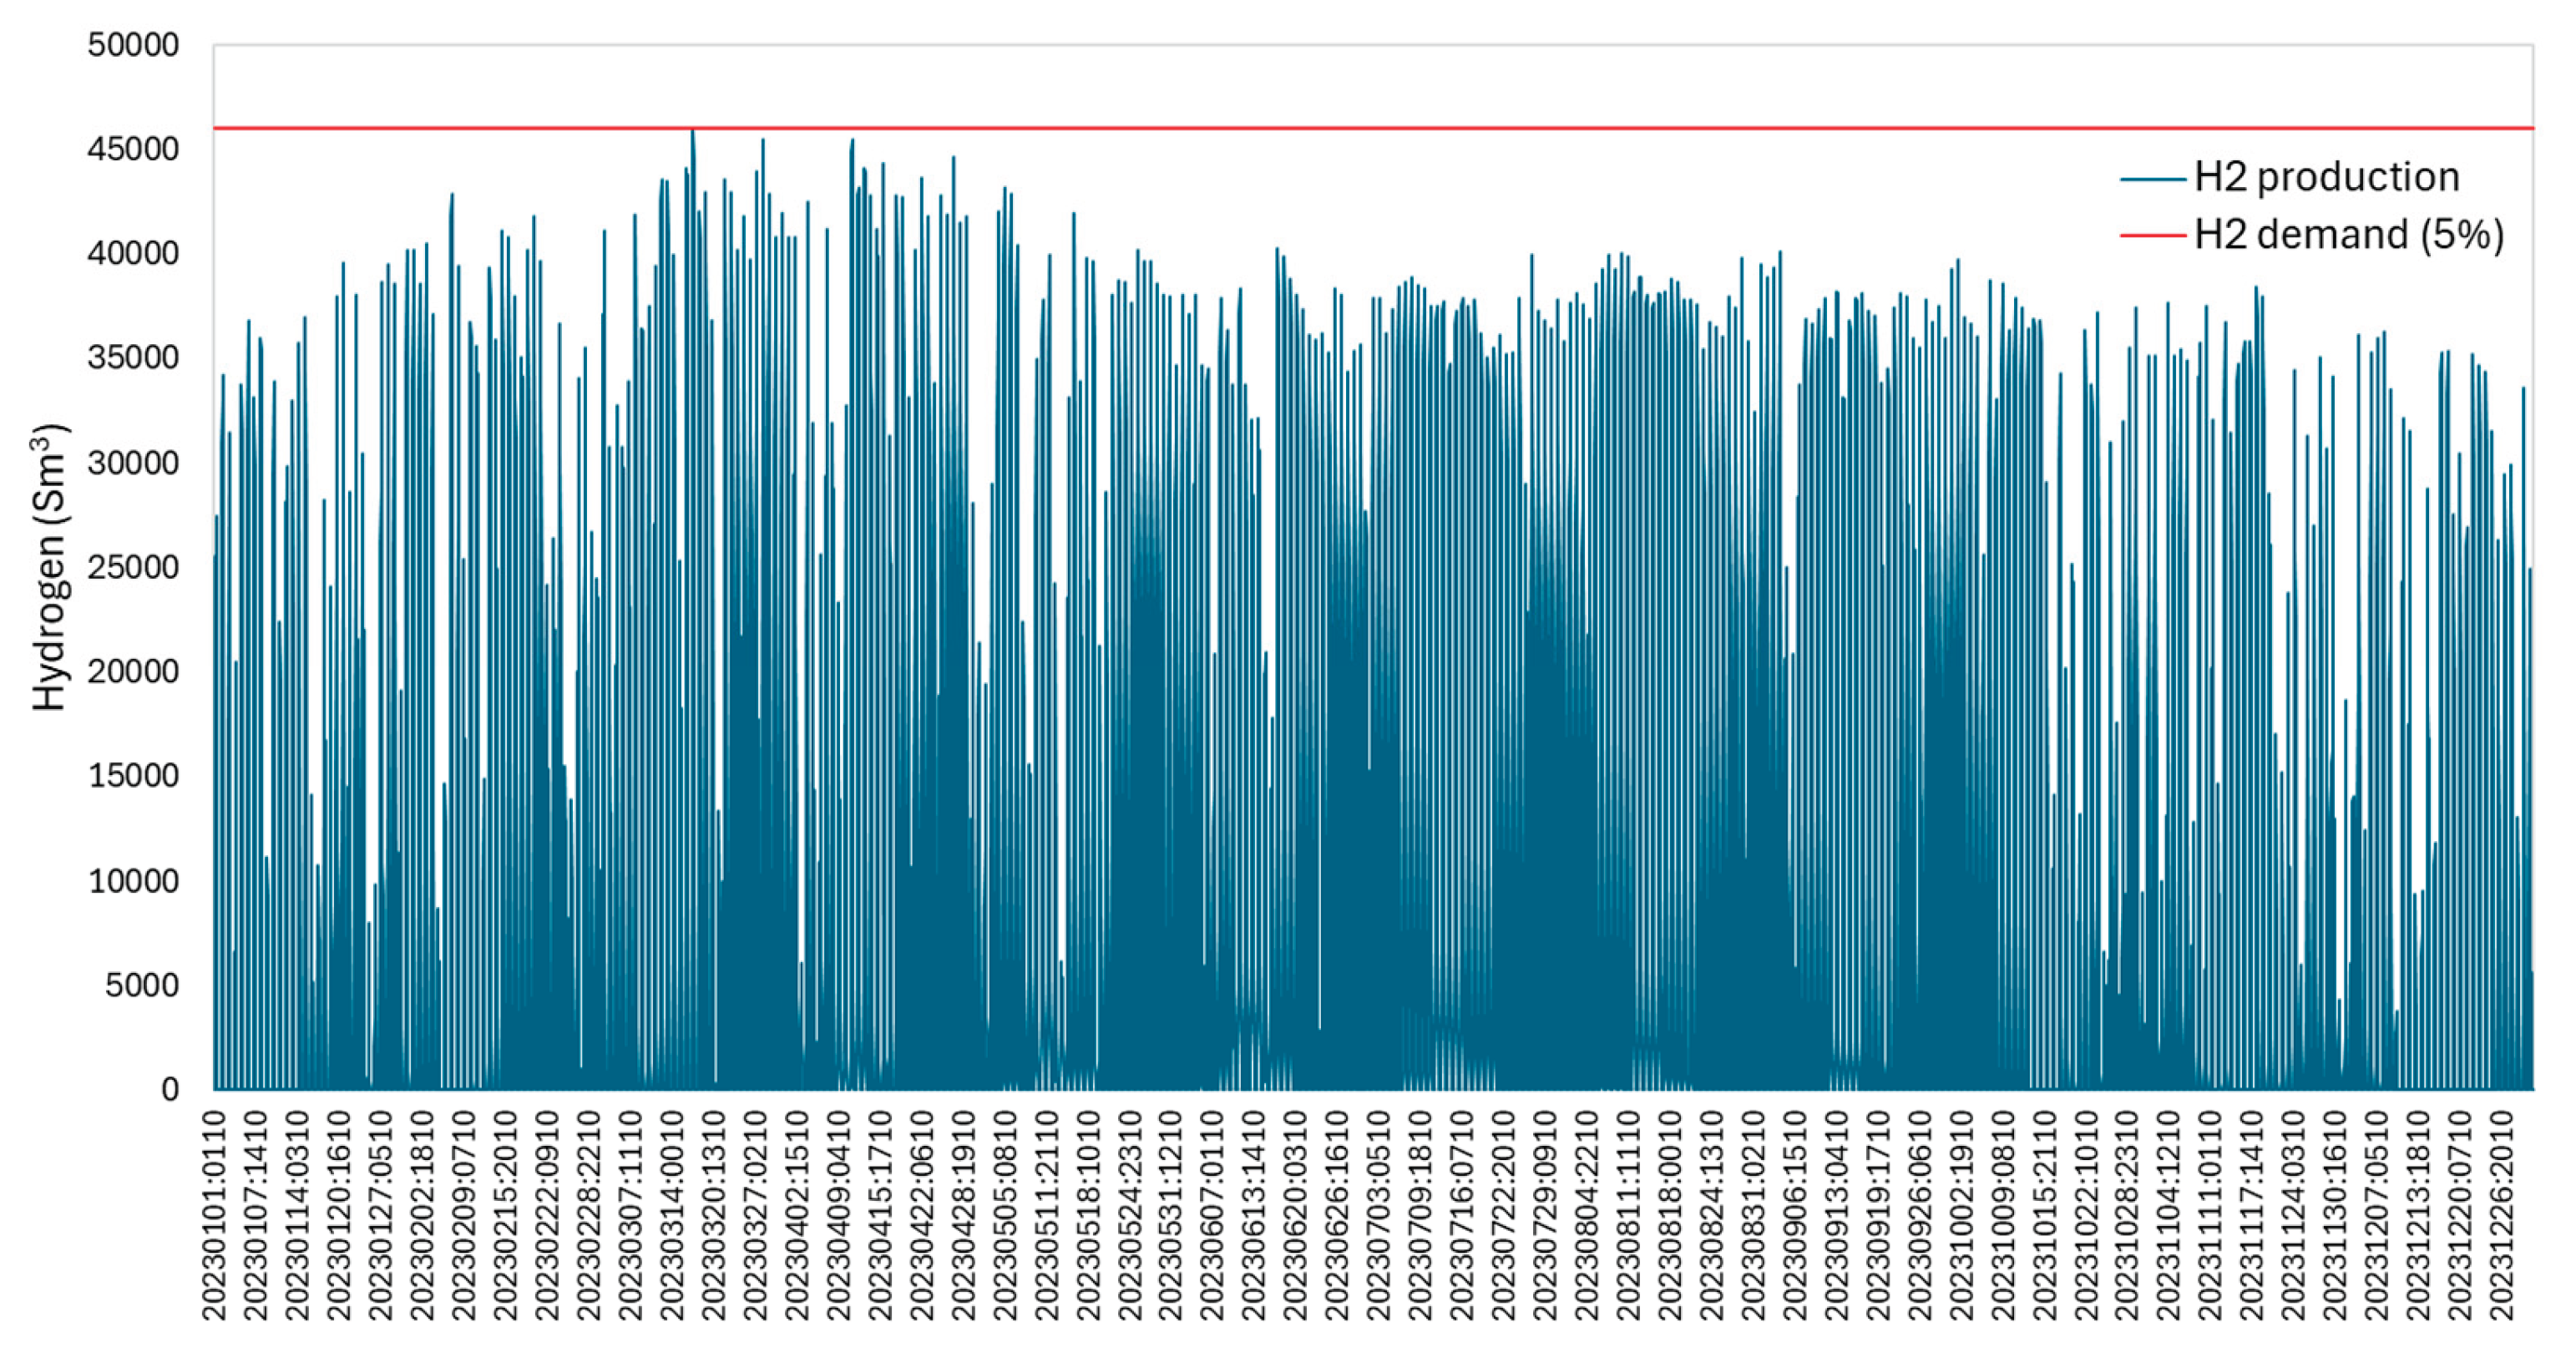

Table 1.
Summary of the main projects in Europe for the hydrogen injection in the natural gas grid.
| Year | Site | Project | H2 % |
|---|---|---|---|
| 2007 | Ameland—The Netherlands | Hydrogen in natural gas on Ameland | Up to 20% |
| 2013 | Falkenhagen—Germany | Falkenhagen Hydrogen Project | 5% |
| 2018 | Dunkerque—France | GRHYD | 6%, 10%, 15%, 20% |
| 2019 | Keele—UK | HyDeploy—Phase 1 | Up to 20% |
| 2020 | Contrursi Terme—Italy | SNAM experimentation | 10% |
| 2021 | Ohringen—Germany | Hydrogen Island | Up to 100% |
| 2021 | Winlaton—UK | HyDeploy | Up to 20% |
| 2021 | Castelfranco Emilia—Italy | INRETE | 2%, 5%, 10% |
| 2021 | Spadeadam—UK | Future Grid | 2%, 5%, 10%, 20%, 100% |
| 2024 | Arezzo—Italy | ENEA—Centria project | 2%, 5%, 10% |
Table 2.
Density of Methane and Hydrogen at Different Pressures.
| Pressure [bar] | H2 density [kg/m3] | CH4 density [kg/m3] |
|---|---|---|
| 1 | 0,0835 | 0,668 |
| 30 | 2,4630 | 19,704 |
| 60 | 4,9261 | 39,408 |
| 80 | 6,5681 | 52,545 |
Table 3.
Properties of the two main chemical components (hydrogen and methane).
| Fuel | LHV [MJ/kg] |
HHV [MJ/kg] |
LHV [MJ/m3] |
HHV [MJ/m3] |
|---|---|---|---|---|
| Methane (CH4) | 50 | 55.8 | 32.289 | 36.034 |
| Hydrogen (H2) | 120 | 144 | 9.687 | 11.624 |
Table 4.
Reception points and gasification plants In Italy: annual flows and max capacity: the data are expressed in Billion (109) m3 per year.
Table 4.
Reception points and gasification plants In Italy: annual flows and max capacity: the data are expressed in Billion (109) m3 per year.
| Reception point | Pipeline/Gasification plant | Countries Involved |
2023 | 2024 | ||
|---|---|---|---|---|---|---|
| VNG [Bm3/year] |
% | VNG [Bm3/year] |
% | |||
| Mazara del Vallo | TRANSMED—Trans Mediterranean Pipelines | Algeria, Tunisia, Italy | 23.04 | 37.60% | 21.07 | 35.67% |
| Melendugno | TAP—Trans Adriatic Pipelines | Azerbaijan, Georgia, Türkiye, Greece, Albania, Italy | 9.99 | 16.30% | 10.31 | 17.45% |
| Passo Gries | TRANSITGAS | Switzerland, Italy | 6.57 | 10.72% | 6.00 | 10.16% |
| Tarvisio | TAG—Trans Austria Gas Pipelines | Austria, Italy | 2.84 | 4.64% | 5.60 | 9.48% |
| Gela | Green Stream | Libia, Italy | 2.52 | 4.11% | 1.41 | 2.39% |
| Cavarzere | GNL—by ship | 8.78 | 14.33% | 9.01 | 15.25% | |
| Livorno | GNL—by ship | 3.78 | 6.17% | 1.11 | 1.88% | |
| Panigaglia | GNL—by ship | 2.57 | 4.19% | 0.95 | 1.61% | |
| Piombino | GNL—by ship | 1.14 | 1.86% | 3.59 | 6.08% | |
Table 5.
Compositions of the natural gas imported in Italy in the period 2023-2024 [36].
Table 5.
Compositions of the natural gas imported in Italy in the period 2023-2024 [36].
| Chemical Species |
Unit | Melendugno | Mazara del Vallo |
Passo Gries | Tarvisio | Gela | Cavarzere (LNG) |
Livorno (LNG) |
Piombino (LNG) |
Panigaglia (LNG) |
|---|---|---|---|---|---|---|---|---|---|---|
| Methane | %MOLE | 94.243 | 86.867 | 92.656 | 93.208 | 86.645 | 93.999 | 93.930 | 95.384 | 89.703 |
| Ethane | %MOLE | 3.278 | 8.657 | 4.073 | 3.838 | 5.246 | 5.646 | 5.178 | 4.111 | 8.469 |
| Propane | %MOLE | 1.246 | 1.162 | 0.748 | 1.055 | 2.022 | 0.072 | 0.522 | 0.273 | 1.178 |
| Iso Butane | %MOLE | 0.233 | 0.072 | 0.220 | 0.158 | 0.317 | 0.006 | 0.057 | 0.031 | 0.069 |
| Normal Butane | %MOLE | 0.325 | 0.112 | 0.144 | 0.165 | 0.478 | 0.011 | 0.076 | 0.031 | 0.062 |
| Iso Pentane | %MOLE | 0.110 | 0.019 | 0.054 | 0.035 | 0.071 | 0.004 | 0.013 | 0.007 | 0.070 |
| Normal Pentane | %MOLE | 0.087 | 0.019 | 0.028 | 0.028 | 0.026 | 0.005 | 0.003 | 0.001 | 0.023 |
| Exane + | %MOLE | 0.058 | 0.014 | 0.056 | 0.033 | 0.060 | 0.000 | 0.000 | 0.006 | 0.000 |
| Nitrogen | %MOLE | 0.218 | 1.333 | 1.086 | 0.780 | 4.455 | 0.236 | 0.198 | 0.139 | 0.411 |
| Carbon dioxide | %MOLE | 0.182 | 1.671 | 0.910 | 0.700 | 0.602 | 0.000 | 0.000 | 0.000 | 0.000 |
| Helium | %MOLE | 0.020 | 0.074 | 0.025 | 0.000 | 0.078 | 0.021 | 0.023 | 0.017 | 0.000 |
| Oxygen | %MOLE | - | - | - | - | - | - | - | - | 0.015 |
| HHV | kWh/m3 | 11.111 | 11.092 | 10.846 | 10.908 | 10.919 | 10.923 | 10.990 | 10.856 | 11.357 |
| LHV | kWh/m3 | 10.035 | 10.026 | 9.793 | 9.849 | 9.872 | 9.859 | 9.921 | 9.796 | 10.264 |
| Wobbe Index WI | kWh/m3 | 14.358 | 13.936 | 13.962 | 14.075 | 13.660 | 14.289 | 14.331 | 14.264 | 14.504 |
| Density | kg/m3 | 0.73394 | 0.77633 | 0.73946 | 0.73593 | 0.78302 | 0.71606 | 0.72068 | 0.70978 | 0.75131 |
| Relative Density | 0.59894 | 0.63353 | 0.60344 | 0.60056 | 0.63899 | 0.58434 | 0.58812 | 0.57922 | 0.61311 | |
| Molecular weight | kg/kmol | 17.31 | 18.31 | 17.44 | 17.36 | 18.47 | 16.89 | 17.00 | 16.75 | 17.72 |
Table 6.
Statistical distribution of natural gas daily flow (MSm3/day) imported in 2024 (min = min value; 1° Q = First quartile; 3° Q = third quartile; MAX = max value; avg = average value; SD = Standard Deviation).
Table 6.
Statistical distribution of natural gas daily flow (MSm3/day) imported in 2024 (min = min value; 1° Q = First quartile; 3° Q = third quartile; MAX = max value; avg = average value; SD = Standard Deviation).
| Mazara del Vallo |
Passo Gries |
Melendugno | Tarvisio | Gela | Panigaglia | Livorno | Piombino | Caverzere | |
|---|---|---|---|---|---|---|---|---|---|
| Min | 19.87 | 2.04 | 22.08 | 1.02 | 0.51 | 1.09 | 0.64 | 1.64 | 6.00 |
| 1 °Q | 47.76 | 13.06 | 26.28 | 6.69 | 2.02 | 1.93 | 10.60 | 7.45 | 23.00 |
| median | 56.91 | 19.47 | 27.43 | 12.45 | 3.52 | 3.49 | 12.39 | 10.94 | 25.99 |
| 3 °Q | 62.25 | 21.93 | 28.23 | 25.00 | 5.02 | 6.91 | 14.34 | 12.50 | 26.26 |
| MAX | 80.65 | 33.24 | 30.68 | 65.47 | 10.03 | 10.36 | 17.05 | 17.28 | 6.00 |
| Avg | 54.85 | 17.37 | 26.64 | 17.54 | 3.83 | 4.73 | 12.10 | 9.80 | 23.74 |
| SD | 11.30 | 5.82 | 3.91 | 14.37 | 2.10 | 2.66 | 3.05 | 3.41 | 4.42 |
Table 7.
Statistical distribution flow rate (MSm3/h) of the gas imported in four days of 2024.
| M. del vallo | Passo Gries | Melendugno | Tarvisio | Gela | Panigaglia | Livorno | Piombino | Caverzere | ||
|---|---|---|---|---|---|---|---|---|---|---|
| 21.03.2024 | min | 2.808 | 0.753 | 1.113 | 0.190 | 0.177 | 0.318 | 0.000 | 0.507 | 1.056 |
| 1°Q | 2.826 | 0.763 | 1.117 | 0.299 | 0.190 | 0.361 | 0.000 | 0.518 | 1.073 | |
| median | 2.827 | 0.782 | 1.119 | 0.366 | 0.190 | 0.362 | 0.000 | 0.523 | 1.083 | |
| 3°Q | 2.829 | 0.800 | 1.123 | 0.387 | 0.202 | 0.364 | 0.000 | 0.527 | 1.099 | |
| MAX | 2.830 | 0.835 | 1.127 | 0.561 | 0.295 | 0.367 | 0.000 | 0.531 | 1.103 | |
| Avg | 2.825 | 0.783 | 1.119 | 0.357 | 0.211 | 0.360 | 0.000 | 0.522 | 1.084 | |
| SD | 0.0067 | 0.0235 | 0.0044 | 0.0799 | 0.0405 | 0.0095 | 0.0000 | 0.0064 | 0.0170 | |
| 21.06.2024 | min | 2.299 | 0.396 | 1.150 | 0.052 | 0.083 | 0.074 | 0.000 | 0.172 | 1.049 |
| 1°Q | 2.300 | 0.925 | 1.154 | 0.825 | 0.084 | 0.077 | 0.000 | 0.174 | 1.072 | |
| median | 2.315 | 1.032 | 1.158 | 0.871 | 0.084 | 0.079 | 0.000 | 0.176 | 1.103 | |
| 3°Q | 2.323 | 1.066 | 1.162 | 1.154 | 0.084 | 0.081 | 0.000 | 0.179 | 1.110 | |
| MAX | 2.324 | 1.075 | 1.166 | 1.619 | 0.103 | 0.089 | 0.000 | 0.184 | 1.117 | |
| Avg | 2.312 | 0.945 | 1.158 | 0.984 | 0.084 | 0.079 | 0.000 | 0.177 | 1.092 | |
| SD | 0.0112 | 0.1857 | 0.0047 | 0.3688 | 0.0040 | 0.0038 | 0.0000 | 0.0034 | 0.0234 | |
| 21.09.2024 | min | 1.700 | 0.668 | 1.084 | 0.147 | 0.104 | 0.000 | 0.000 | 0.129 | 1.062 |
| 1°Q | 1.702 | 0.731 | 1.088 | 0.232 | 0.104 | 0.000 | 0.000 | 0.130 | 1.090 | |
| median | 1.703 | 0.765 | 1.089 | 0.260 | 0.104 | 0.000 | 0.000 | 0.300 | 1.102 | |
| 3°Q | 1.703 | 0.795 | 1.090 | 0.383 | 0.105 | 0.000 | 0.000 | 0.322 | 1.107 | |
| MAX | 1.727 | 0.857 | 1.092 | 0.451 | 0.106 | 0.000 | 0.000 | 0.445 | 1.113 | |
| Avg | 1.704 | 0.764 | 1.088 | 0.298 | 0.105 | 0.000 | 0.000 | 0.238 | 1.096 | |
| SD | 0.0051 | 0.0585 | 0.0018 | 0.0874 | 0.0004 | 0.0000 | 0.0000 | 0.1049 | 0.0149 | |
| 21.12.2024 | min | 1.998 | 0.389 | 1.176 | 0.000 | 0.165 | 0.000 | 0.206 | 0.530 | 1.021 |
| 1°Q | 2.086 | 0.423 | 1.217 | 0.000 | 0.165 | 0.000 | 0.207 | 0.537 | 1.074 | |
| median | 2.249 | 0.443 | 1.221 | 0.000 | 0.167 | 0.000 | 0.229 | 0.538 | 1.097 | |
| 3°Q | 2.250 | 0.477 | 1.227 | 0.000 | 0.168 | 0.000 | 0.229 | 0.544 | 1.105 | |
| MAX | 2.252 | 0.507 | 1.234 | 0.000 | 0.169 | 0.000 | 0.448 | 0.554 | 1.115 | |
| Avg | 2.177 | 0.449 | 1.221 | 0.000 | 0.167 | 0.000 | 0.236 | 0.540 | 1.086 | |
| SD | 0.1085 | 0.0326 | 0.0110 | 0.0000 | 0.0015 | 0.0000 | 0.0526 | 0.0067 | 0.0275 |
Table 8.
Typical PV plant annual producibility values across Italy.
| Location | Region (example) |
Gyear [kWh/m2·y] | EPV,year ( = 0.8) [kWh/kWp·y] |
heq [h/year] |
|---|---|---|---|---|
| Northern Italy | Lombardy/Veneto | 1200–1400 | 840–1000 | 840–1000 |
| Central Italy | Tuscany/Lazio | 1400–1600 | 960–1120 | 960–1120 |
| Southern Italy | Puglia/Calabria | 1600–1800 | 1120–1280 | 1120–1280 |
| Islands | Sicily | 1700–1900 | 1200–1360 | 1200–1360 |
Table 9.
Typical PV plant daily producibility values across Italy in the different seasons.
| Location | Region (example) |
EPV,year ( = 0.8) [kWh/kW] |
EPV,day ( = 0.8) (winter) [kWh/kW] |
EPV,day ( = 0.8) (intermediate) [kWh/kW] |
EPV,day ( = 0.8) (summer) [kWh/kW] |
|---|---|---|---|---|---|
| North Italy | Lombardy | 920 | 1.26 | 2.52 | 4.03 |
| Central Italy | Tuscany | 1040 | 1.42 | 2.85 | 4.56 |
| South Italy | Puglia | 1200 | 1.64 | 3.29 | 5.26 |
| Islands | Sicily | 1280 | 1.76 | 3.51 | 5.62 |
Table 10.
Sizes of PV systems and daily injection of hydrogen in the gas network.
|
[MW] |
(winter day) [kWh] |
(summer day) [kWh] |
(mid season) [kWh] |
(winter) [Sm3] |
(summer) [Sm3] |
(mid-season) [Sm3] |
|---|---|---|---|---|---|---|
| 1 | 800 | 5600 | 3200 | 159.6288 | 1117.4016 | 638.5152 |
| 5 | 4000 | 28,000 | 16,000 | 798.144 | 5587.008 | 3192.576 |
| 10 | 8000 | 56,000 | 32,000 | 1596.288 | 11,174.016 | 6385.152 |
| 50 | 40,000 | 280,000 | 160,000 | 7981.44 | 55,870.08 | 31,925.76 |
| 100 | 80,000 | 560,000 | 320,000 | 15,962.88 | 111,740.16 | 63,851.52 |
| 500 | 400,000 | 2,800,000 | 1,600,000 | 79,814.4 | 558,700.8 | 319,257.6 |
| 1000 | 800,000 | 5,600,000 | 3,200,000 | 159,628.8 | 1,117,401.6 | 638,515.2 |
| 2000 | 1,600,000 | 11,200,000 | 6,400,000 | 319,257.6 | 2,234,803.2 | 1,277,030.4 |
Table 11.
Photovoltaic Power vs. Admissible Hydrogen Injection Volume.
| Reception point |
[Sm3/day] |
[Sm3/h] |
PPV [MWp] |
Max H2 flow coverage [%] |
Avg H2 flow coverage [%] |
|---|---|---|---|---|---|
| Mazara del Vallo | 1.99 × 10⁶ | 9.95 × 10⁴ | 542 | 5.00 | 1.04 |
| Passo Gries | 5.44 × 10⁵ | 2.72 × 10⁴ | 135 | 5.00 | 0.67 |
| Melendugno | 1.095 × 10⁶ | 5.47 × 10⁴ | 250 | 5.00 | 0.97 |
| Tarvisio | 2.79 × 10⁵ | 1.39 × 10⁴ | 83 | 5.00 | 0.71 |
| Gela | 8.54 × 10⁴ | 4.27 × 10³ | 24.4 | 5.00 | 1.13 |
| Panigaglia | 8.04 × 10⁴ | 4.02 × 10³ | 22.2 | 5.00 | 0.84 |
| Livorno | 4.41 × 10⁵ | 2.20 × 10⁴ | 117 | 5.00 | 0.90 |
| Piombino | 3.10 × 10⁵ | 1.55 × 10⁴ | 8.5 | 5.00 | 0.98 |
| Cavarzere | 9.58 × 10⁵ | 4.79 × 10⁴ | 256 | 5.00 | 0.87 |
Table 12.
Reduction of natural gas and CO2 emissions due to H2 injection into the NG network.
| Reception point | (VNG)year [MSm3] |
(VH2)year [MSm3] |
NG reduction [MSm3/year] |
% NG Reduction |
CO2 reduction [tons/year] |
% CO2 Reduction |
|---|---|---|---|---|---|---|
| Mazara del Vallo | 20,075.1 | 210.27 | 66.87 | 1.04 | 135,023.7 | 0.33 |
| Passo Gries | 6357.4 | 42.79 | 13.92 | 0.67 | 28,099.0 | 0.22 |
| Melendugno | 9750.2 | 95.21 | 30.23 | 0.97 | 61,031.8 | 0.31 |
| Tarvisio | 9419.6 | 45.80 | 14.81 | 0.71 | 29,905.6 | 0.23 |
| Gela | 1401.8 | 15.96 | 5.16 | 1.13 | 10,412.3 | 0.37 |
| Panigaglia | 1731.2 | 14.63 | 4.54 | 0.84 | 9173.1 | 0.26 |
| Livorno | 4428.6 | 40.10 | 12.87 | 0.90 | 25,990.8 | 0.29 |
| Piombino | 3586.8 | 35.38 | 11.50 | 0.98 | 23,215.8 | 0.32 |
| Cavarzere | 8688.8 | 76.04 | 24.56 | 0.87 | 49,584.9 | 0.28 |
| TOTAL | 184.46 | 372,347.0 |
Disclaimer/Publisher’s Note: The statements, opinions and data contained in all publications are solely those of the individual author(s) and contributor(s) and not of MDPI and/or the editor(s). MDPI and/or the editor(s) disclaim responsibility for any injury to people or property resulting from any ideas, methods, instructions or products referred to in the content. |
© 2025 by the authors. Licensee MDPI, Basel, Switzerland. This article is an open access article distributed under the terms and conditions of the Creative Commons Attribution (CC BY) license (http://creativecommons.org/licenses/by/4.0/).
Copyright: This open access article is published under a Creative Commons CC BY 4.0 license, which permit the free download, distribution, and reuse, provided that the author and preprint are cited in any reuse.


