
Submitted:
17 May 2024
Posted:
20 May 2024
You are already at the latest version
Abstract
Incorporating renewables in the power grid presents challenges for stability, reliability, and operational efficiency. Integrating Energy Storage Systems (ESS) offers a solution by managing unpredictable loads, enhancing reliability, and serving the grid. Hybrid storage solutions have gained attention for specific applications, suggesting higher performance in some respects. This paper compares the performance of hybrid energy storage systems (HESS) to single battery, evaluating their energy supply cost and environmental impact through optimization problems. The model generates an optimized dispatch, minimizing cost or environmental impact of supplying energy to a generic load while considering battery degradation. Seven technologies are assessed, with an example applied to an industrial site contrasting vanadium redox flow (VRFB) and lithium batteries considering the demand of a local load (building). The results also indicates that efficiency and degradation curves have the highest impact in the final costs and environmental functions on the various storage technologies assessed. For the simulations of the example case, a single system only outperforms the hybrid system in cases where lithium efficiency is higher than approximately 87% and vanadium is lower approximately 82%.
Keywords:
hybrid energy storage systems
; Vanadium batteries
; optimize
; battery degradation
; emission reduction
1. Introduction
The Production and use of energy account for more than 75 % of the European Union’s greenhouse gas emissions. The European Commission has put forward the European Green Deal [1], aiming at achieving climate neutrality by 2050, among others. In this context, the Fit for 55 [2] package aims at reducing net greenhouse gas emissions by at least 55 % by 2030. Moreover, the REPowerEU Communication [3], came as a speed up plan to improve reliability, energy independence and mitigate the energy crisis by accelerating the clean energy transition. Energy storage stands as an indispensable technology, essential for delivering the requisite adaptability, steadiness, and dependability in shaping the energy landscape of tomorrow. This demand for system flexibility is especially pronounced within the European Union’s electric power infrastructure, given the projection that renewable energy sources are poised to account for approximately 69% by 2030 and an even more substantial 80% by 2050.Many European energy-storage markets are growing strongly, with 2.8 GW (3.3 GWh) of utility-scale energy storage newly deployed in 2022, giving an estimated total of more than 9 GWh. According to an IEA report [4], installed battery storage capacity in Europe would grow to over 18 GW by 2025.
The European battery energy storage market has been expanding rapidly. In 2020, the market value was estimated at around $1.9 billion. However, with increasing deployments and falling costs, it is expected to grow substantially in the coming years, enabling renewable energy integration, balancing the grid, support renewable energy communities and provide a multitude of services [5]. The International Energy Agency (IEA) expects global installed storage capacity to expand by drastically in the following years, reaching over 590 GW by 2030 [4]. Different studies have analyzed the likely future paths for the deployment of energy storage in the EU. These studies point to more than 200 GW and 600 GW of energy storage capacity by 2030 and 2050 respectively (from roughly 60 GW in 2022, mainly in the form of pumped hydro storage).
The deployment of hybrid energy storage systems (HESS) emerged from the need to find solutions that combine the best features of different technologies. Over time, various technologies have been developed, each with its own advantages and limitations. The motivation is to leverage the strongest characteristics of each technology, aiming to complement and surpass their weaknesses. Thus, it is expected that in specific cases, the overall performance of the hybrid system will be superior to that achieved by an alternative individual technology [6].
The objective of this study is to evaluate the performance of a hybrid system against a single one, optimizing a cost function of supplying electric energy to a generic load. The system was implemented in a real-life industrial demonstration, in which the load is an office building supported by the energy storage system. The optimization model brings together the energy cost already seen in other publications, while incorporating battery degradation into the function, applying it to a hybrid storage system. Additionally, it introduces a novel element by offering a dual perspective: minimizing energy costs and emissions associated with the energy supplied to the load. Based on this model, the article presents an assessment for 7 different storage technologies, proposing two objective functions with outputs in €/kWh and gCO2eq/kWh, corresponding to Energy Cost and Environmental/emissions respectively.
2. Battery Modelling and State of the Art
The topic of ESS optimal scheduling has been widely discussed in literature, integrated for example in microgrids, energy communities. In most cases, a simplified BESS modelling strategy is taken into account, adopting constant battery charging/discharging powers and efficiency. These models can be found in several recent articles that aim to find the BESS control method [7,8,9,10,11,12,13,14]. In [15], the authors have tested the impact of modelling battery dynamics and electrochemical degradation in the optimal control strategy of BESS, demonstrating that a simplified model could lead to an inaccurate techno-economic performance assessment.
Meanwhile the proposed review of the life cycle assessment of energy storage technologies in [16] shows the importance of the economic performances. Although the literature presents different angles of control and dispatch of batteries, a perspective from a hybrid storage system focusing on cost and degradation comparative performance is missing, which is what this study proposes.
2.1. Technology Comparison
2.2. The Optimization Model
The optimization model consists of an objective function and constraints in a mixed integer linear programming approach. The objective function is provided with two perspectives: to minimize the energy cost and emissions for supplying energy to the building. The model builds on previous work [18] which only focuses on minimizing the cost of supplying energy from the Grid and using a PV system to a load, using a battery as a buffer. The authors develop a control algorithm for a single lithium battery instead of a hybrid system for multiple technologies, and do not consider the degradation or the emissions perspective. In this article the model includes the degradation factor in the minimization function and corresponding constraints. Moreover, the model includes hybrid storage systems of several technologies and as inputs, both tariff and environmental signal, €/kWh and gCO2eq/kWh respectively, and their initial capital cost of each technology (also both in € and gCO2eq). The following technologies are considered:
- Lithium battery
- Vanadium Redox Flow Battery (VRFB)
- Lead Acid battery
- Niquel Cadmium battery (NiCd)
- Sodium-Sulphur battery (NaS)
- Flywheel
- Supercapacitors
Additionally, this model proposes a new formulation of the battery degradation cost for the optimal scheduling of energy storage technologies and was included in the objective function.
Furthermore, the environmental footprints of the storage systems which is represented by g/CO2 emissions is also an output from the model. The model is focused on two fundamental characteristics: degradation and environmental impact. In this case, the optimization model has two objective functions and ten main restrictions which will be explained next. Despite proposing two objective functions, the model is not a multi-objective algorithm, instead it allows the user the option to choose which objective function to generate, as explained in Equations 1 and 2.
The model receives two inputs, the market prices, represented by for cost or for environment impact, and the load consumption of the building.
Objective function:
The general formulation considers 2 different objective functions: minimizing the energy supply cost (OF1, (1)) and minimizing emissions for supplying energy to the same load (OF2, (2)).
In the objective function 1 (OF1) a weight was added for each technology (k1 and k2), which represents the total capital cost per unit of storage capacity and that value will multiply by the degradation of each battery, depending on the chosen technology. For the environmental impact, shown in Equation 2 (OF2), similarly to the degradation, a weight was added for each technology (C1 and C2), which represents the GWP of each technology during its life cycle. Below the constraints for the optimization algorithm:
Constraints:
The constraints applied in the general formulation include: (3), an equilibrium equation, where the power absorbed by the system is equal to the difference between the injected power and withdrawn power; (4) to limit, when applicable, a maximum power limit at the connection to the grid ; (5) and (6) not to allow for the charge and discharge of the BESS at the same time, when = 0, only charging (Pt+) is allowed, precluding discharging (Pt−), and vice versa when =1; (7) and (8) represent the maximum charging and discharging power of the battery; (9) and (10) to update the energy content of the BESS between steps ( is the BESS initial energy content); and (11) to bound that energy content within the battery’s limits. For the degradation, which will be referred next, the capacity loss curve is linearized by a least squares’ approximation, forcing it to intersect the origin. The line’s slope is used to estimate the degradation caused by each discharge cycle using (12).
2.3. Degradation
The battery degradation is affected by various non-operational factors such as temperature, humidity, and calendar time, and operational factors such as cycle depth, over charge or discharge, current rate, voltage level, and average State of charge (SOC). Among these factors, cycle depth is one of the most important for grid-connected batteries while effect of other factors may be limited by battery controller or neglected for grid connected applications [17].
The charging and discharging of a battery cause cell degradation, which reduces the battery cycle life. From an economic standpoint, this reduction leads to a battery degradation cost. The battery’s capacity is decreased as a result of cell deterioration caused by energy exchange. Despite the complexity of the battery ageing mechanism, from the perspective of ideal scheduling, it can be said that the deterioration is mostly impacted by the depth of discharge (DoD) and charge and discharge cycles [17]. The maximum number of charge and discharge cycles for a BESS operation is determined by how many cycles must pass before the energy capacity reaches a certain threshold (for example, 70% of rated capacity). The battery must be replaced when it reaches this point, which is considered the battery deterioration cost. For the optimal operation of BESS, the battery degradation cost should be integrated into the optimal scheduling problem. In this work, the degradation cost is modelled based on cycle depth factor to maintain a balance between the degradation modelling accuracy and complexity of the optimization problem. Depending on the technology chosen, we apply a weight to the objective function for each technology that represents the entire capital cost per unit of storage capacity and multiplies with battery degradation. Deterioration can thus significantly affect the anticipated operating expenses for those systems. In Table 2 we can see the total capital cost of a grid-scale ESS systems based on [17].
The degradation curves were obtained from [19], where a methodology for selection of the most suitable energy storage technology for grid integration is proposed, and ESS technologies are compared in terms of cycle life for a given depth of discharge. Figure 1 represents the lithium and vanadium battery degradation curves, respectively as an example. Notice that, although the vanadium degradation curve is linear, the lithium degradation curve is nonlinear, which demonstrates that for high dept of discharges the lithium battery will have more degradation when compared with a Vanadium battery. This complement suggests that complementarity and synergies can be explored if the right control mechanism is put in place.
2.4. Environmental Weight in the Model
The environmental impact taken into consideration in this article is based on the ranges found in the literature. The Life cycle assessment (LCA) of batteries has been a topic covered extensively in other research works and hence outside of the scope of this article. The LCA of ESS involves estimating different methods such as energy use and emissions as well as particulate matter at various stages, from material extraction, manufacturing, transportation, and operation to final decommissioning [16].
Figure 2 shows a generalized system boundary of an LCA of ESSs. Typical battery system boundaries include material production and transportation, construction, operation, and decommissioning.
For the purpose of this article the study conducted by [16] was considered. The authors perform an LCA overview of more than 50 studies, summarized in Table 3. Table 3 shows the LCAs of energy storage technologies. Despite the few LCA studies, in [16] it is provided a database that includes the most recent costs and emissions figures for energy storage technologies while also integrating the economic and environmental elements of ESSs for stationary applications in the power network.
These studies have covered the technical and economic aspects of energy storage technologies. Moreover, they have reviewed the technical characteristics, the sizing of various ESSs, and challenges associated with their applications. These studies help us understand technical properties, such as efficiency, energy and power densities, depth of discharge, lifetime, etc.
Techno-economic assessments (TEAs) of energy storage technologies evaluate their performance in terms of capital cost, life cycle cost, and levelized cost of energy in order to determine how to develop and deploy them in the power network. Given the growing environmental concerns and policy regulations, the quantification of energy consumption and environmental footprints has become increasingly important in the deployment of energy systems in the power network. Understanding the trade-off between the economic viability and environmental performance of an ESS is crucial in order to make decisions towards sustainability. While a few studies assessed the impacts from cradle-to-grave, some considered cradle-to gate. Also, the emissions are from GWP (Global Warming potential). CED (Cumulative Energy Demand) and GWP are the most common impact categories in ESS studies because of their wide acceptance in decision making. Human toxicity, particulate matter formation, and fossil resource depletion are also used. For this study, were considered GWP emissions and focus on impacts from cradle to grave stages as they are widely accepted in the scientific community.
The values were taken into consideration for the weights of the carbon factor of the optimization function C1 and C2. Given that the study presents a wide range of studies corresponding to a wide interval, for the sake of this study, the average values of each interval were considered.
3. Demonstrations and Results
3.1. Model Simulation
This section presents the application of the two scenarios, each corresponding to each objective. The first scenario refers to the energy cost objective function (Equation 1) and the second scenario to the environmental impact function (Equation 2). For each objective function, the comparison of a singular system composed of a lithium battery, was made against a hybrid system composed by a group of one lithium battery and one of each of the other 6 technologies.
Figure 3 illustrates the daily market prices and emission changes considered as inputs for corresponding scenarios 1 and 2, while in Figure 4 the input forecasted load is provided.
The load corresponds to the electricity consumption of a building on the industrial partner site, it is based on a machine learning forecast module, trained with it’s a full year of historical data and is the same for both scenarios/functions. For the day ahead market prices and emissions, these are extracted from ENTSO-E transparency platform [20] every day and a third-party platform called Sentinel by InescTec which forecasts the emissions for the following day based of generation forecast, market clearing and weather inputs.
The degradation curves [19] and efficiencies [17] considered as inputs for the model to run, were based on the values found in the literature. For a single battery the rates of 110 kW and 140 kWh were considered to run all simulations, while for the hybrid pair one battery was assumed to have 100 kW, 100 kWh (Li) and the second one 10kW and 40 kWh (other tech), both matching the size and capacity of the single unit.
As can be seen in Figure 4, the load forecast demonstrates an accentuated reduction around midday. This is because the considered building is making use of the energy generated by the local PV system illustrated in Figure 5 for self-consumption. The remaining consumption is requested to the grid and is the reference for the dispatch of the batteries.
Table 4 shows the results for all technologies considering the objective function 1. The columns show a range of results because both values (upper and lower bounds) of efficiency found in the literature, were considered, to capture the wide spectrum of possibilities of outcomes. The comparative results, show that two hybrid systems stand out. The Hybrid systems Lithium-Vanadium and Lithium-Supercapacitors outperforms the singular system. Vanadium batteries take advantage of its partially less intense degradation curve and supercapacitors of its high efficiency. The lowest value of the total cost column is observed in the upper bound of the supercapacitors, with a cost of 1188.8 €, while the highest total cost is observed in both Lead-Acid batteries and Ni-Ca batteries, with 1249.3 € in the lower bound of the range.
When compared to the Lithium single battery, there are two hybrid combinations that can clearly have lower total cost as can be seen in the last column by analyzing the lower values of the range. These correspond to the Lithium-Vanadium (-0.3% cost) and Lithium-Supercapacitors (-2.4% cost) pairs.
It is interesting to observe however, that most of the technologies have lower costs of degradation when compared to the lithium technology. Nevertheless, its relative weight when compared to the energy cost term of the optimization function, is two orders of magnitudes lower and hence contribute with little effect on the outcome of the objective function.
When two Lithium batteries are paired as a hybrid system the cost performance is worse. Even though the difference is minimum, it happens because the singular system, in order to fully charge its battery only needs two full charging cycle to do so. In turn, for the hybrid system to charge the same amount of energy, since the smaller battery can only charge at a 10 kW rate per cycle, it needs to do 4 charging cycle (40 kWh). While the singular system does less cycles of charging, it has a better energy cost. This happens because of the price intermittence between each cycle. The higher power battery has a higher C-rate which allows it to fully charge in the least costly hour. The same does not happen in the other battery which has a lower C-rate, resulting in an increase in the energy cost of the hybrid system.
In this situation, despite the same degradation curve, the singular system experiences slightly worse degradation (+1,6%) because the small battery from hybrid system, as mentioned before, just have a power of 10 kW, so the dept of discharge in cycles, in the hybrid system is smaller causing less degradation.
In Scenario 2 (OF2), with a shift in focus towards environmental impact emissions, the performance dynamics see mild changes. The single lithium battery system and supercapacitors stand out as best performers, however the hybrid system with vanadium and lithium batteries also reveal strong performance, particularly with regard to degradation.
All technologies in fact have lower degradation in terms of emissions than lithium batteries, being the lowest the supercapacitors ranging from (-18.3%) to (-15.7 %) less degradation. The total impact however can hardly be seen in the last column for most technologies, except for the Lithium-supercapacitors pair which demonstrate less 0.8% CO2 emissions followed by the Li-Flyweel pair with (-0.2%) CO2 emissions.
3.2. Field Data and Demonstration
For verification purposes, the model was tested with real data applying the dispatch optimization model to an existing HESS. The demonstration assets and conditions were made available by an industrial partner of the project in the North of Portugal. The existing HESS on-site is composed of two batteries: One is a vanadium redox flow battery, with 10 kW and 40 kWh and the other is a set of second life lithium batteries with 100 kW and 100 kWh. These batteries are connected to their individual inverters and are operated according to an EMS (energy management system), installed in a local PC. The HESS is connected to the building, ‘behind the meter’ through a common bus to which a PV system is also installed. The PV enables self-consumption and is explored by another internal entity, with its own business model and hence not part of possible decision variables of the model. As part of the optimal dispatch of the battery systems, several components interact according to the Figure 5. The cloud data monitoring system, of the industrial site, sends the consumption data of the building every day. This consumption load profile is the part requested to the grid, including self-consumption as can be seen in Figure 5. This data is stored in a database on InescTec side and is used by a forecasting model (to train and predict) to provide the expected consumption for the following day. InescTec energy management system (HEMS) is comprised of this forecasting module, but also by the incentive collection module and the management and optimization modules. The optimization module algorithm receives as inputs, the battery characteristics and both the load forecast and the incentives (price or environmental signals) and runs every day the algorithm. The output is a dispatch recommendation for the HESS to operate, minimizing the energy or environmental cost of supplying energy to the building, including to this end, the degradation of the batteries. The dispatch is provided to the Cloud Data Monitoring System, which sends the schedule to the local EMS.
The singular system is composed by a lithium battery with 140 kWh of capacity and 110 kW of power. The hybrid system is composed of two batteries. One lithium battery with 100 kWh of capacity and 100 kW of power and a vanadium with 40 kWh and 10 kW.
The introduction of a vanadium battery offers relevant performance due to the slower degradation of vanadium battery. Although it has slightly lower efficiency (75-85%) than Lithium (85-95%), the substantial reduction in degradation costs (-18.3%) is offset by increase in energy costs (+0.8%).
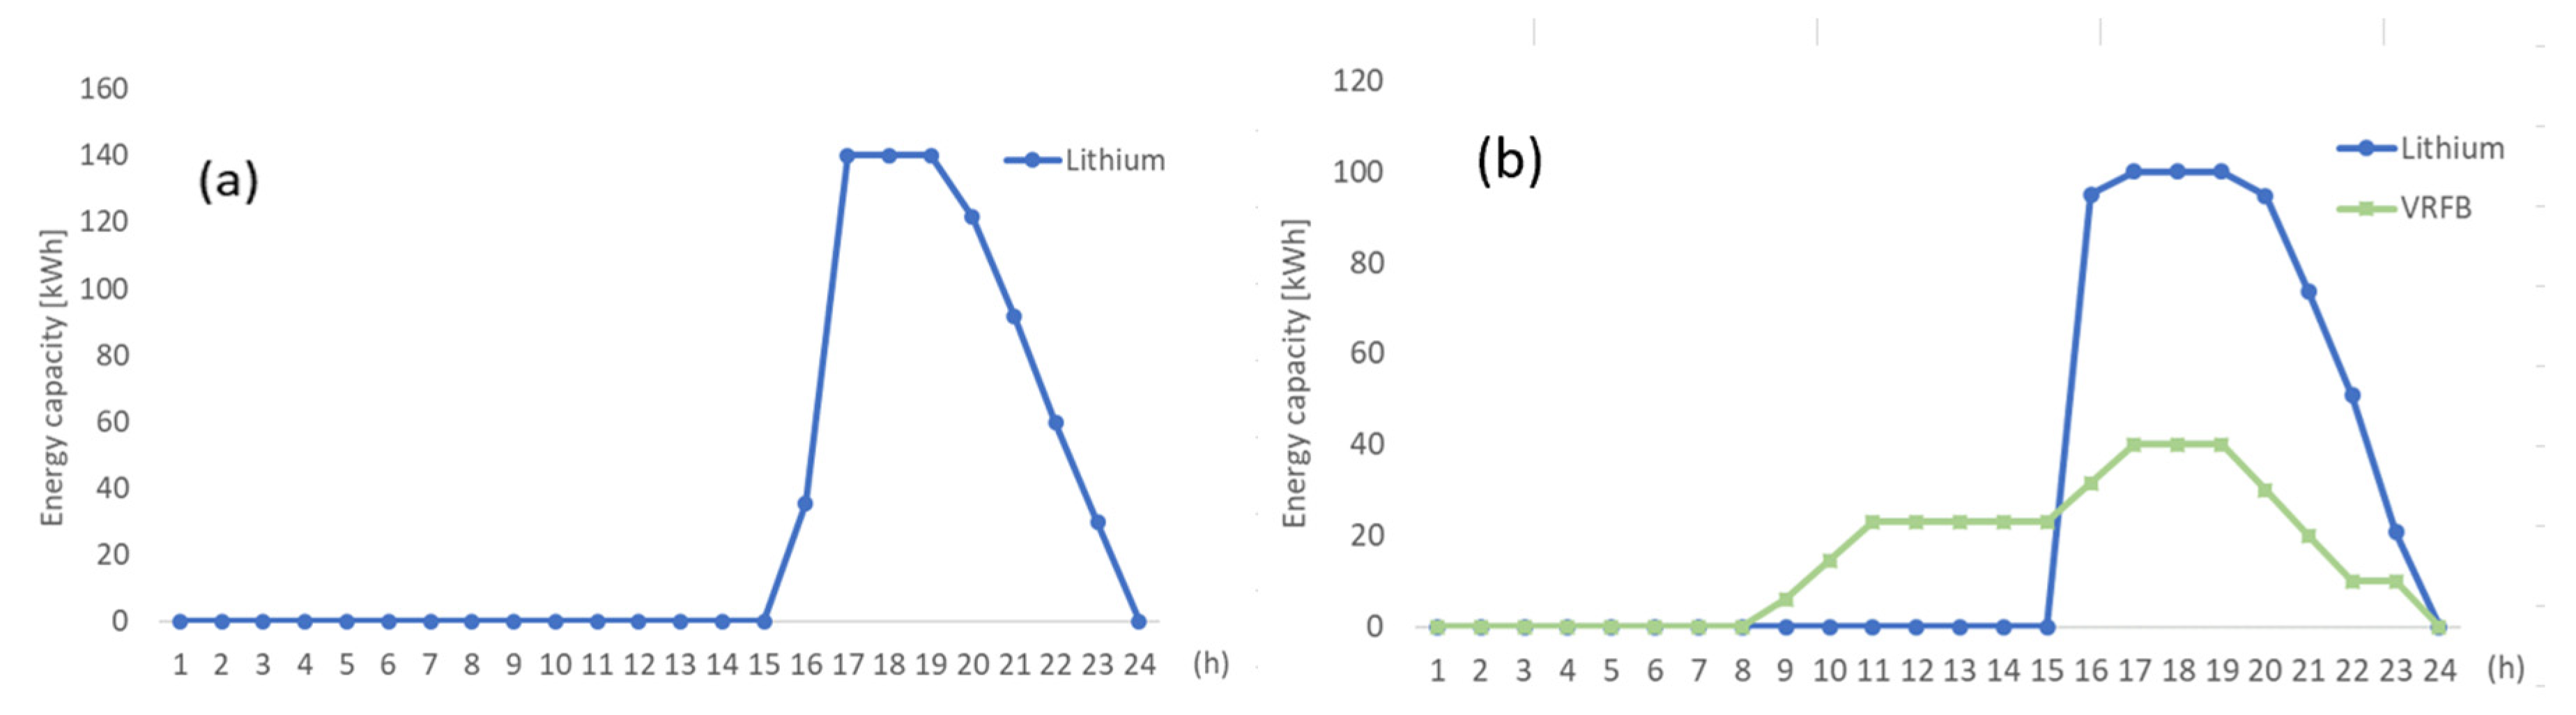
Table 4 and Table 5 shows the outputs results for each scenario and technology for a full month of simulations, so that the results could be recurring and visible. In Figure 6 and Figure 7, is represented the recommendation dispatch and the state of charge of the batteries for one day, for a singular system respectively. The chosen systems were a Singular system (Lithium Battery) vs Hybrid system (Lithium and Vanadium batteries).
Scenario 1 (OF1)
Figure 6.
Daily dispatch example of the single Lithium battery (a) and dispatch of the Lithium and VRFB Hybrid System (b) using OF1.
Figure 6.
Daily dispatch example of the single Lithium battery (a) and dispatch of the Lithium and VRFB Hybrid System (b) using OF1.
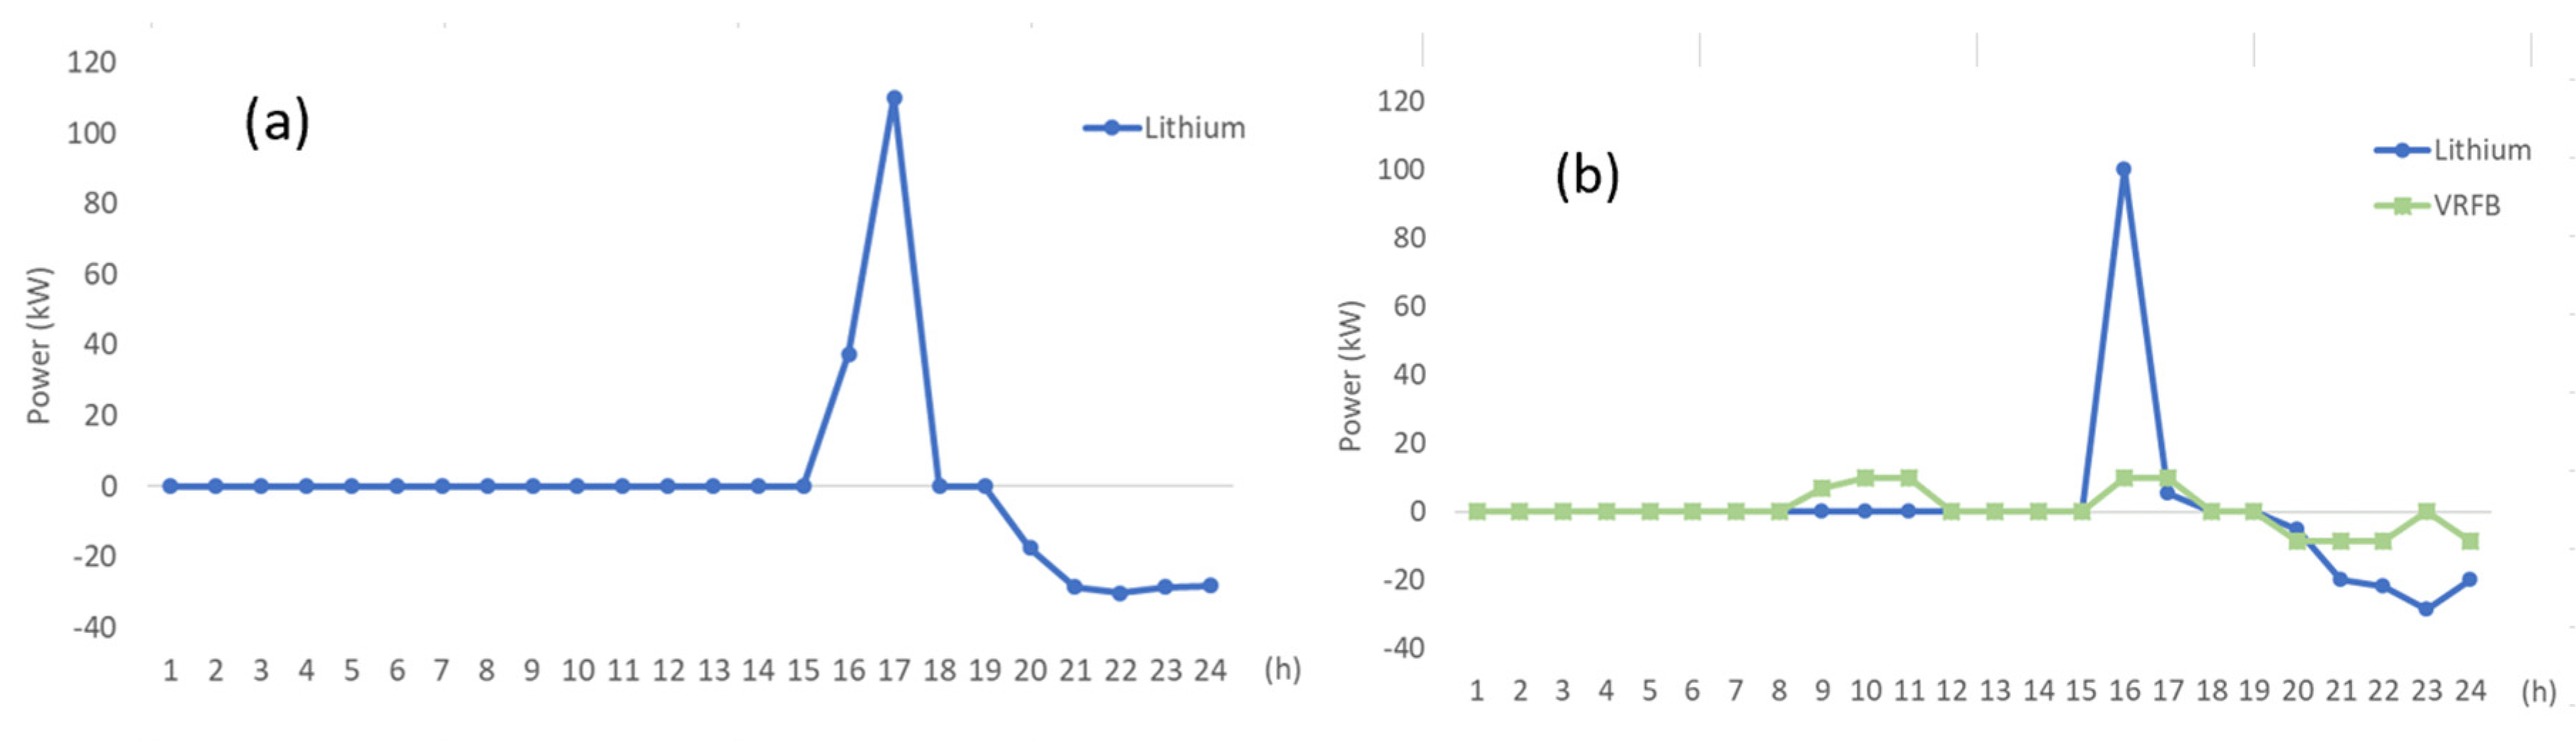
Figure 7.
Daily SOC example of the single Lithium battery (a) and SOC of the Lithium and VRFB Hybrid System (b) using OF1.
Figure 7.
Daily SOC example of the single Lithium battery (a) and SOC of the Lithium and VRFB Hybrid System (b) using OF1.
In Figure 8 it is illustrated a map/scatter chart that represents the area which system predominates depending on the chosen efficiency.
The performance of the HESS is only verified in specific cases of both battery efficiencies. The cost remains approximately the same as the improving element of the function related to the degradation is relatively small when compared to the contribution of the energy term. The inclusion of 2nd life batteries in the HESS is an opportunity for having higher performance when coupled with the VRFB as can be seen in the Figure 8. It can be seen that when the efficiency is lower in Lithium batteries, regardless of the efficiency of the VRFB (within the uncertainty range) the cost of the whole system is improved. The model shows that the hybrid storage system improves lifetime of the batteries (minimize degradation), on only specific cases of battery efficiency at approximately the same cost. For the simulation run a single system only outperforms a HESS in cases where Lithium efficiency if higher than approximately 87% and vanadium is lower approximately 82%.
Figure 9 and Figure 10 show the results when applying the emissions optimization function (OF2). The results only show a single day of dispatch, with one Lithium battery and when the system is operated as a HESS. The incentives and load demand will dictate the entries of each battery. In this daily case, as an example, one can see in Figure 9 on the right, the second battery charging at 19h at 3 kW and discharging immediately after also at 3 kW.
Scenario 2 (OF2)
Figure 9.
Daily dispatch example of the single Lithium battery (a) and dispatch of the Lithium and VRFB Hybrid System (b) using OF2.
Figure 9.
Daily dispatch example of the single Lithium battery (a) and dispatch of the Lithium and VRFB Hybrid System (b) using OF2.
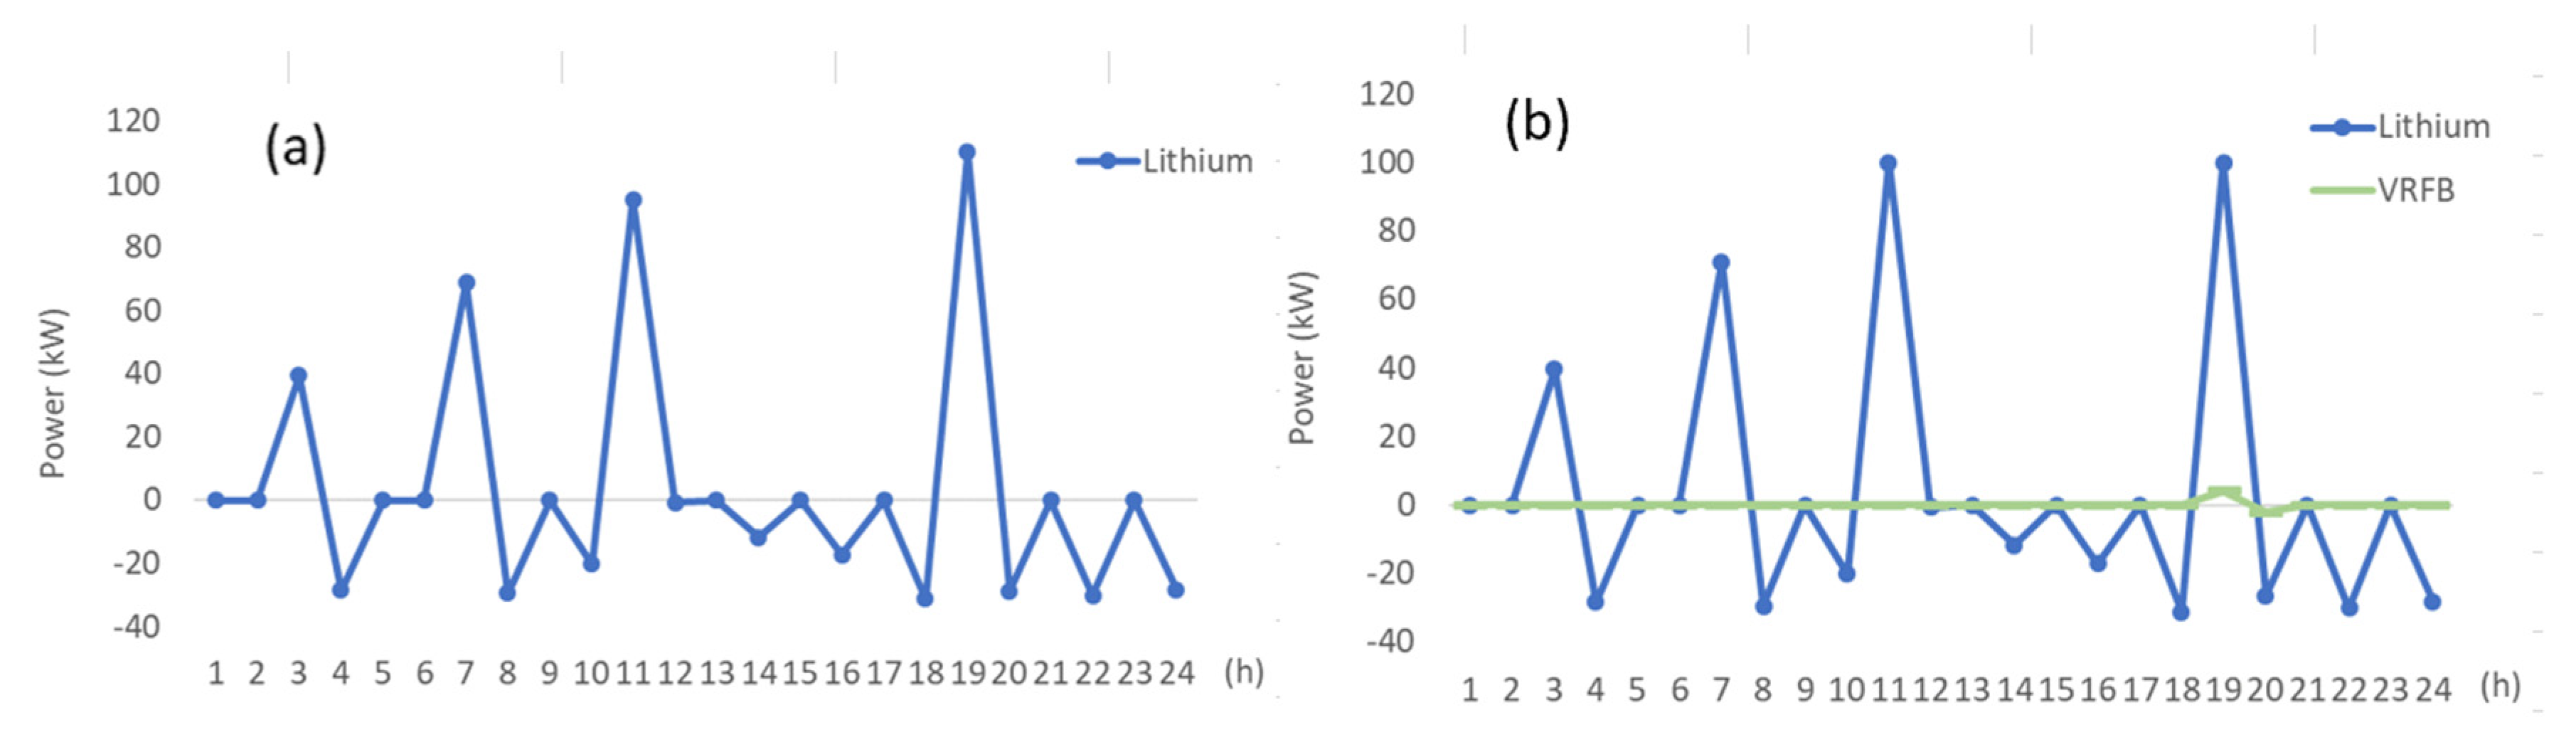
Figure 10.
Daily SOC example of the single Lithium battery (a) and SOC of the Lithium and VRFB Hybrid System (b) using OF1.
Figure 10.
Daily SOC example of the single Lithium battery (a) and SOC of the Lithium and VRFB Hybrid System (b) using OF1.
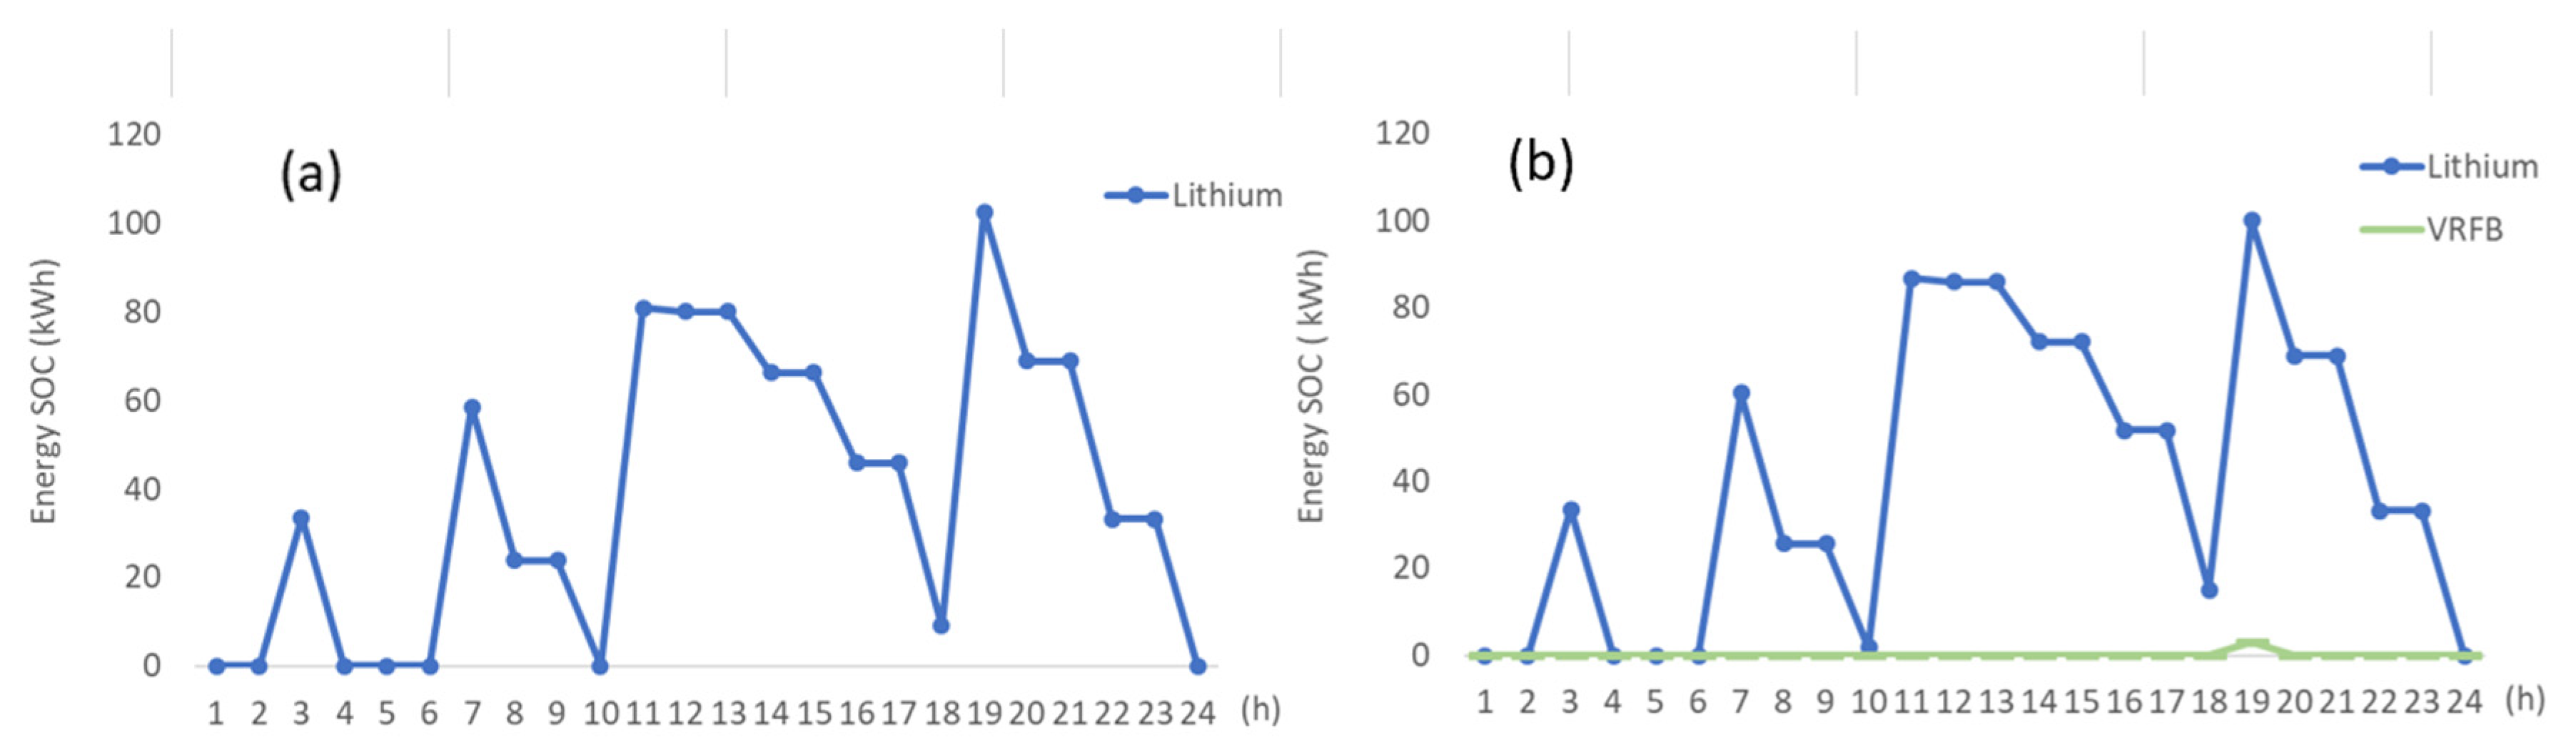
Figure 10 show the state of charge of the single Lithium battery operation and on the right the HESS operation. Consequently, the green battery only charges 3 kWh at 19h and discharges to zero in the following hour. The relatively small contribution of the second battery is explained by the relative high weight of the Vanadium battery on the energy term of the optimization function when compared to the lithium one. The second term regarding the degradation even though smaller in the VRFB case its contribution to the OF2 is very small and it ends up being called very seldomly.
The emissions cost in hybrid system with vanadium increase because now, the input is not the market prices but emissions. This input requires the hybrid system to perform more charge cycles and due to the low efficiency of vanadium battery causes an increase in the emissions cost.
At this point it is also important to complement the analysis from the battery C-rate perspective. The C-rate can be regarded as the ratio of the rated power by the energy capacity. It determines the speed at which a battery is fully charged or discharged. In the existing HESS pair of the industrial partner considered in the verification of this article, the Lithium battery has a C-Rate 1 (100 kW/100 kWh), taking one hour to charge, while the VRFB has a C-rate of 0.25, which takes four hours to charge (10 kW/40 kWh).
The choice of the two batteries should bear in mind the C-Rate dedicated to each, whose higher distance in rate will mean higher cost. This is because when a much higher energy capacity exists compared to the rated power, as in the example studied, the energy-based battery takes longer to fully charge, meaning that it needs more hourly slots with potential different (higher) prices, resulting in an overall higher cost of energy. If the same model is run, but assuming similar values for the C-Rates for example 0.785 which corresponds to Lithium with 55kW, 70 kWh and VRFB with 55kW 70 kWh, the cost performance improves as shown in Table 6.
4. Conclusions
Energy storage systems can help mitigate the uncertainty associated with the electrical load and operations in the power network. In this article, the performance of hybrid systems was assessed regarding their energy supply cost and emissions for an energy support service. Results show that the lithium battery single case is overall slightly improved by adding a vanadium battery and supercapacitors to supply energy to load. Moreover, it shows that the efficiency and degradation of the batteries play an impactful role. The application of HESS and its improved performance, however, may rely in grid support services, taking advantage of their reaction time and their power or energy-based services. In the case assessed, hybrid systems do not improve significantly either the cost or the emissions. The hybrid system might however be justified by other factors such as i) capacity increase need, ii) the case where one system cannot rely on a single battery, iii) the case in which a given technology cannot be deployed in the same location as an already existing battery iv) complementarity of characteristic and performances to provide services. HESS may also reduce the physical space needed for the installation and at least make it more versatile for deployment.
As future work, the emergence of solid-state batteries can provide potential solutions for the many problems of the assessed storage systems in this study. This is an area to be explored in future studies when hybrid systems are considered. Another approach that can be considered is the concept of value stacking, where combining energy-based batteries, which excel at long-duration energy storage and renewable energy integration, with power-based batteries designed for quick energy delivery and high-power applications, a hybrid system can efficiently meet diverse demands. This combination of technologies may allow for the maximization of the energy storage system’s value and enhance the relevance of battery hybridization [21].
Author Contributions
Conceptualization, A.L. and M.P.; methodology, A.L. and M.P.; validation, A.L. and M.P.; formal analysis, A.L. and M.P.; writing—original draft preparation, M.P. and A.L.; writing— review and editing, A.L., M.P. and P.B.; supervision, A.L. All authors have read and agreed to the published version of the manuscript.
Funding
This research was developed within the InterStore project, which has received funding from the European Union’s Horizon Europe research and innovation programme, under grant agreement No 101096511).
Data Availability Statement
The model can be tested in the following WebApp built for this specific purpose and made Open Source to the community http://interstore-dev.inesctec.pt:3000/.
Conflicts of Interest
The authors declare no conflicts of interest.
Nomenclature
| Indices and sets | |
| t T | Set of time intervals |
| J J | Horizon: if 1, variable is within optimization horizon, if 2, variable is part of the next horizon |
| s | Segment of inverter’s linearization curve; |
| Parameters | |
| Length of time intervals (h) | |
| Forecasted market prices (€/kWh) | |
| Maximum power injection/absorption at the point of common coupling (kW) | |
| BESS initial energy content (kWh) | |
| BESS maximum energy content (kWh) | |
| BESS minimum energy content (kWh) | |
| BESS degradation curve linearization slope | |
| Constant charging efficiency ( | |
| Constant discharging efficiency ( | |
| BESS maximum charging power (inverters’ limits) (VA) | |
| BESS maximum discharging power (inverters’ limits) (VA) | |
| BESS minimum charging power (inverters’ limits) (VA) | |
| BESS minimum discharging power (inverters’ limits) (VA) | |
| Variables | |
| Active power absorption at PCC (kW) | |
| BESS charging active power set point at AC side (kW) for battery one | |
| BESS discharging active power set point at AC side (kW) for battery one | |
| BESS charging active power set point at AC side (kW) for battery two | |
| BESS discharging active power set point at AC side (kW) for battery two | |
| BESS charging active power set point at AC side (kW) | |
| BESS discharging active power set point at AC side (kW) | |
| Auxiliary binary variable for non-simultaneity of inverse flows at BESS | |
| Auxiliary binary variable for non-simultaneity of inverse flows at PCC | |
| BESS energy content (kWh) | |
| BESS degraded energy content as a result of a discharge event (Wh) |
References
- European Commission, “Communication from the Commission to the European Parliament, the European Council, the Council, the European Economic and Social committee and the committee of the regions,” Dec. 2019. Accessed: Oct. 26, 2023. [Online]. Available: https://eur-lex.europa.eu/resource.html?uri=cellar:b828d165-1c22-11ea-8c1f-01aa75ed71a1.0002.02/DOC_1&format=PDF.
- European Commission, “Fit for 55,” 2023, Accessed: Oct. 26, 2023. [Online]. Available: https://www.consilium.europa.eu/en/policies/green-deal/fit-for-55-the-eu-plan-for-a-green-transition/.
- European Commission, “Economic and social committee and the committee of the regions REPowerEU: Joint European Action for more affordable, secure and sustainable energy,” Strasbourg, Mar. 2022.
- Energy Agency, “Net Zero by 2050 - A Roadmap for the Global Energy Sector,” 2050. [Online]. Available: www.iea.org/t&c/.
- Energy Storage,” International Energy Agency: IEA, 2023, Accessed: Sep. 12, 2023. [Online]. Available: https://www.iea.org/energy-system/electricity/grid-scale-storage.
- Leon, J.I.; Dominguez, E.; Wu, L.; Alcaide, A.M.; Reyes, M.; Liu, J. Hybrid Energy Storage Systems: Concepts, Advantages, and Applications. IEEE Ind. Electron. Mag. 2021, 15, 74–88. [Google Scholar] [CrossRef]
- Wu, X.; Zhao, W.; Wang, X.; Li, H. An MILP-Based Planning Model of a Photovoltaic/Diesel/Battery Stand-Alone Microgrid Considering the Reliability. IEEE Trans. Smart Grid 2021, 12, 3809–3818. [Google Scholar] [CrossRef]
- Andrychowicz, M. The Impact of Energy Storage along with the Allocation of RES on the Reduction of Energy Costs Using MILP. Energies 2021, 14, 3783. [Google Scholar] [CrossRef]
- Farrokhifar, M.; Aghdam, F.H.; Alahyari, A.; Monavari, A.; Safari, A. Optimal energy management and sizing of renewable energy and battery systems in residential sectors via a stochastic MILP model. Electr. Power Syst. Res. 2020, 187, 106483. [Google Scholar] [CrossRef]
- Liu, P.; Cai, Z.; Xie, P.; Li, X.; Zhang, Y. A Computationally Efficient Optimization Method for Battery Storage in Grid-connected Microgrids Based on a Power Exchanging Process. Energies 2019, 12, 1512. [Google Scholar] [CrossRef]
- Pippia, T.; Sijs, J.; De Schutter, B. A Single-Level Rule-Based Model Predictive Control Approach for Energy Management of Grid-Connected Microgrids. IEEE Trans. Control. Syst. Technol. 2020, 28, 2364–2376. [Google Scholar] [CrossRef]
- A MILP optimization model for assessing the participation of distributed residential PV-battery systems in the ancillary services market. CSEE J. Power Energy Syst. 2021, 7, 348–357. [CrossRef]
- Li, Y.; Wu, J. Optimum Integration of Solar Energy With Battery Energy Storage Systems. IEEE Trans. Eng. Manag. 2022, 69, 697–707. [Google Scholar] [CrossRef]
- IEEE Power & Energy Society. and Institute of Electrical and Electronics Engineers, ICPEA 2019 : 2019 IEEE 2nd International Conference on Power and Energy Applications (ICPEA) : April 27-30, 2019, Singapore.
- Reniers, J.M.; Mulder, G.; Ober-Blöbaum, S.; Howey, D.A. Improving optimal control of grid-connected lithium-ion batteries through more accurate battery and degradation modelling. J. Power Sources 2018, 379, 91–102. [Google Scholar] [CrossRef]
- Rahman, M.; Oni, A.O.; Gemechu, E.; Kumar, A. Assessment of energy storage technologies: A review. Energy Convers. Manag. 2020, 223, 113295. [Google Scholar] [CrossRef]
- Zakeri, B.; Syri, S. Electrical energy storage systems: A comparative life cycle cost analysis. ISSN 1364-0321. Renew. Sustain. Energy Rev. 2015, 42, 569–596. [Google Scholar] [CrossRef]
- R. Silva, C. Gouveia, L. Carvalho, and J. Pereira, “Improved battery storage systems modeling for predictive energy management applications,” 22 Power Systems Computation Conference, Jul. 2022.
- Swierczynski, M.; Stroe, D.I.; Stan, A.-I.; Teodorescu, R.; Sauer, D.U. Selection and Performance-Degradation Modeling of LiMO$_{2}$/Li$_{4}$Ti$_{5}$O$_{12}$ and LiFePO$_{4}$/C Battery Cells as Suitable Energy Storage Systems for Grid Integration With Wind Power Plants: An Example for the Primary Frequency Regulation Service. IEEE Trans. Sustain. Energy 2014, 5, 90–101. [Google Scholar] [CrossRef]
- Entsoe Transparency Platform”, Accessed: Oct. 26, 2023. [Online]. Available: https://transparency.entsoe.eu/.
- Englberger, S.; Jossen, A.; Hesse, H. Unlocking the Potential of Battery Storage with the Dynamic Stacking of Multiple Applications. Cell Rep. Phys. Sci. 2020, 1. [Google Scholar] [CrossRef]
Figure 1.
Lithium and Vanadium degradation curves [19].
Figure 1.
Lithium and Vanadium degradation curves [19].
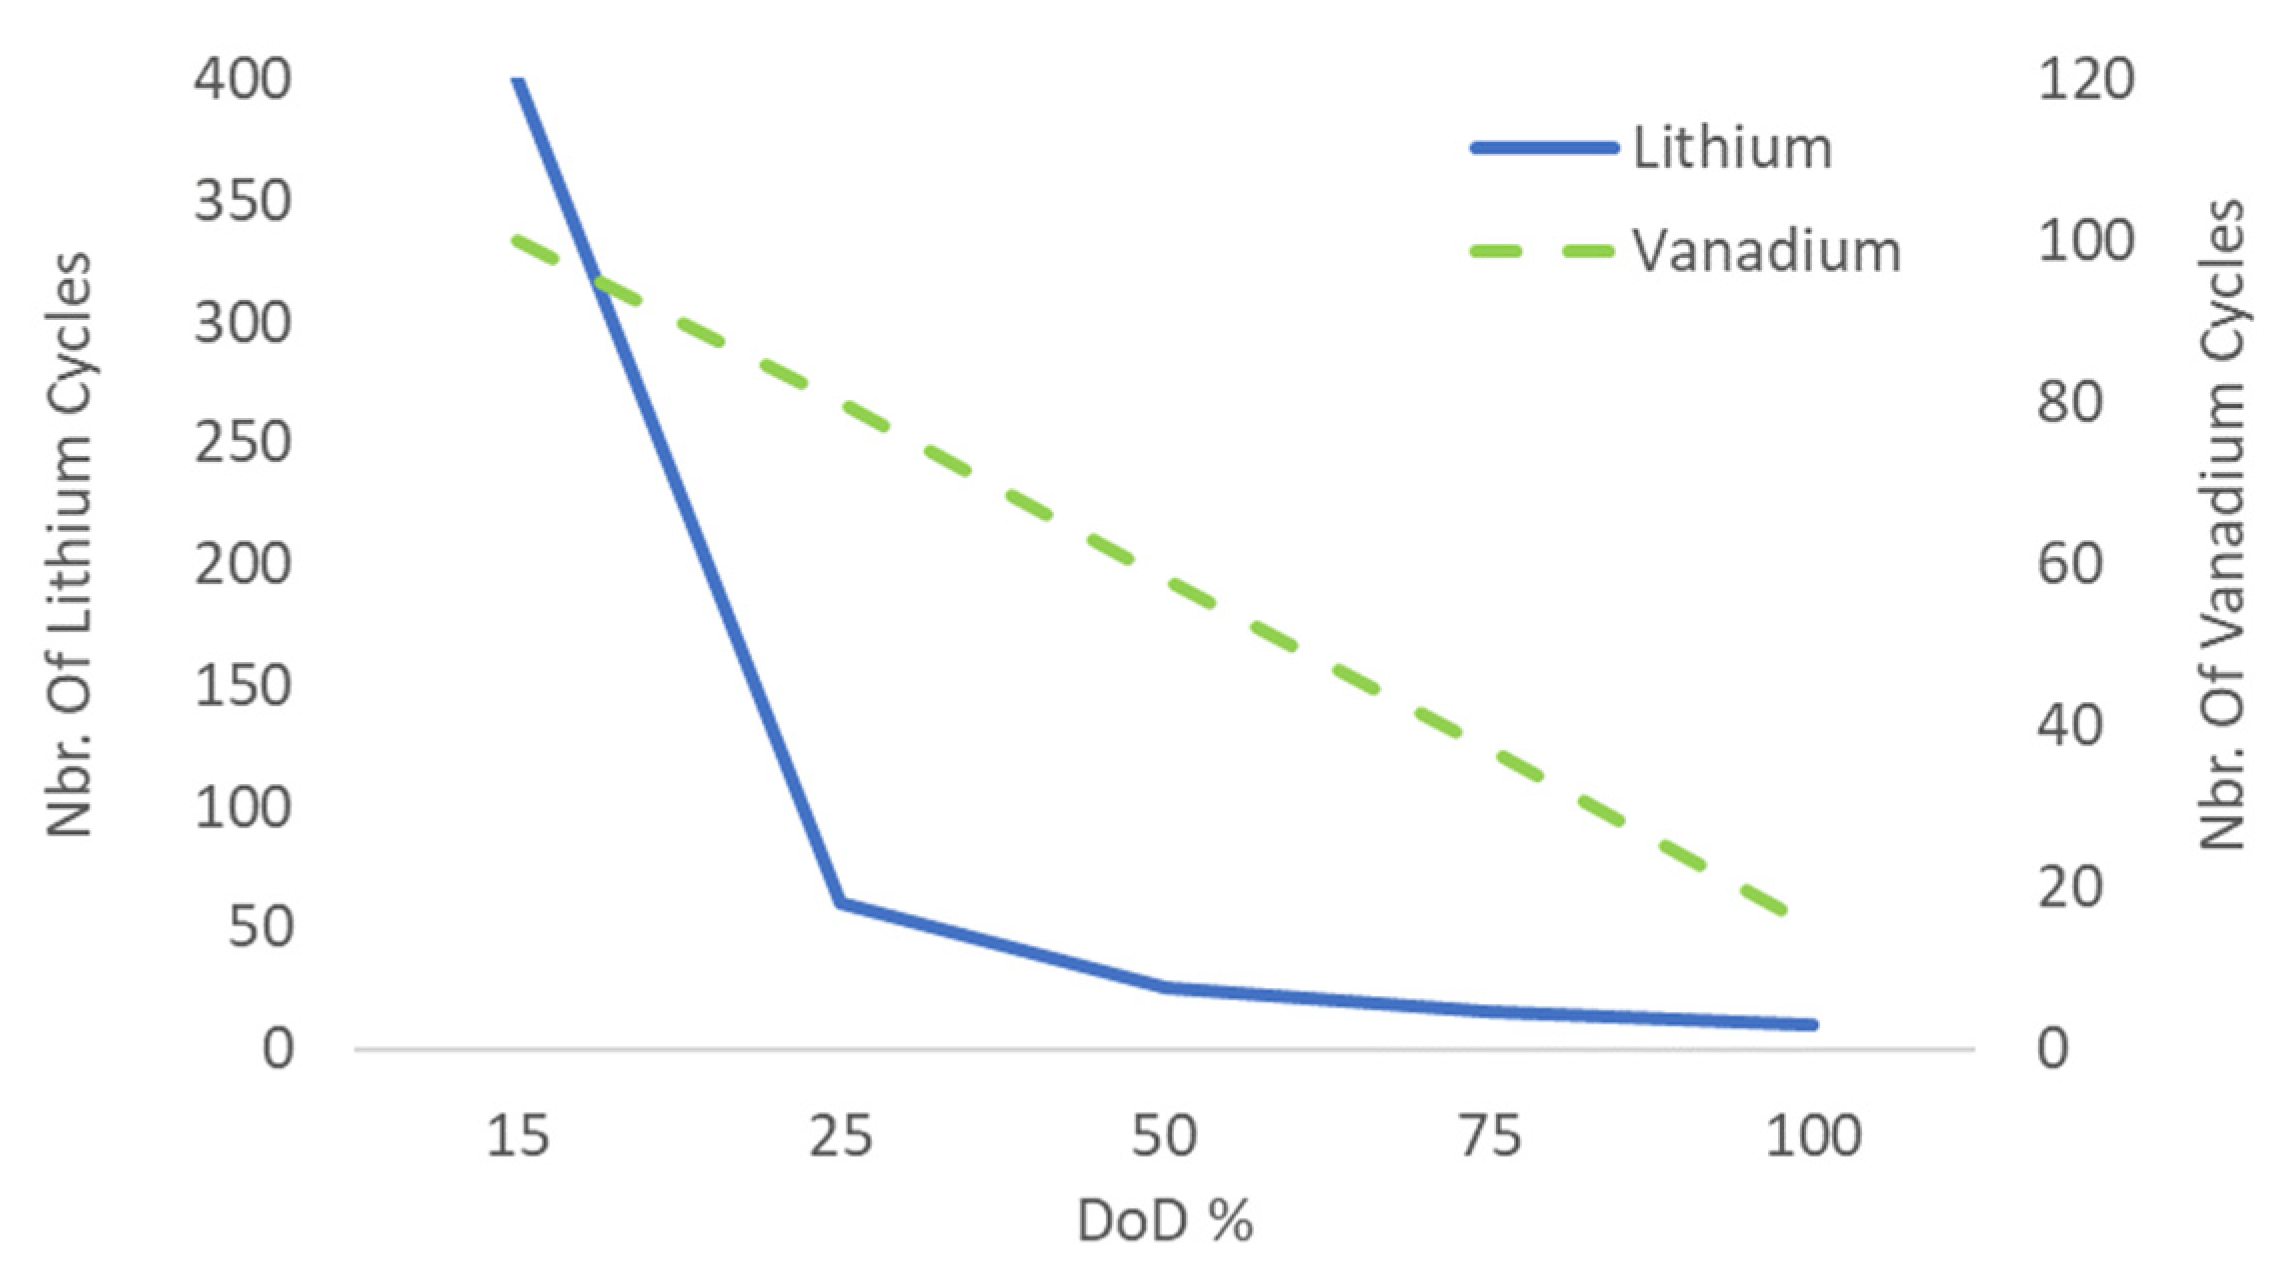
Figure 2.
System Boundary considered.
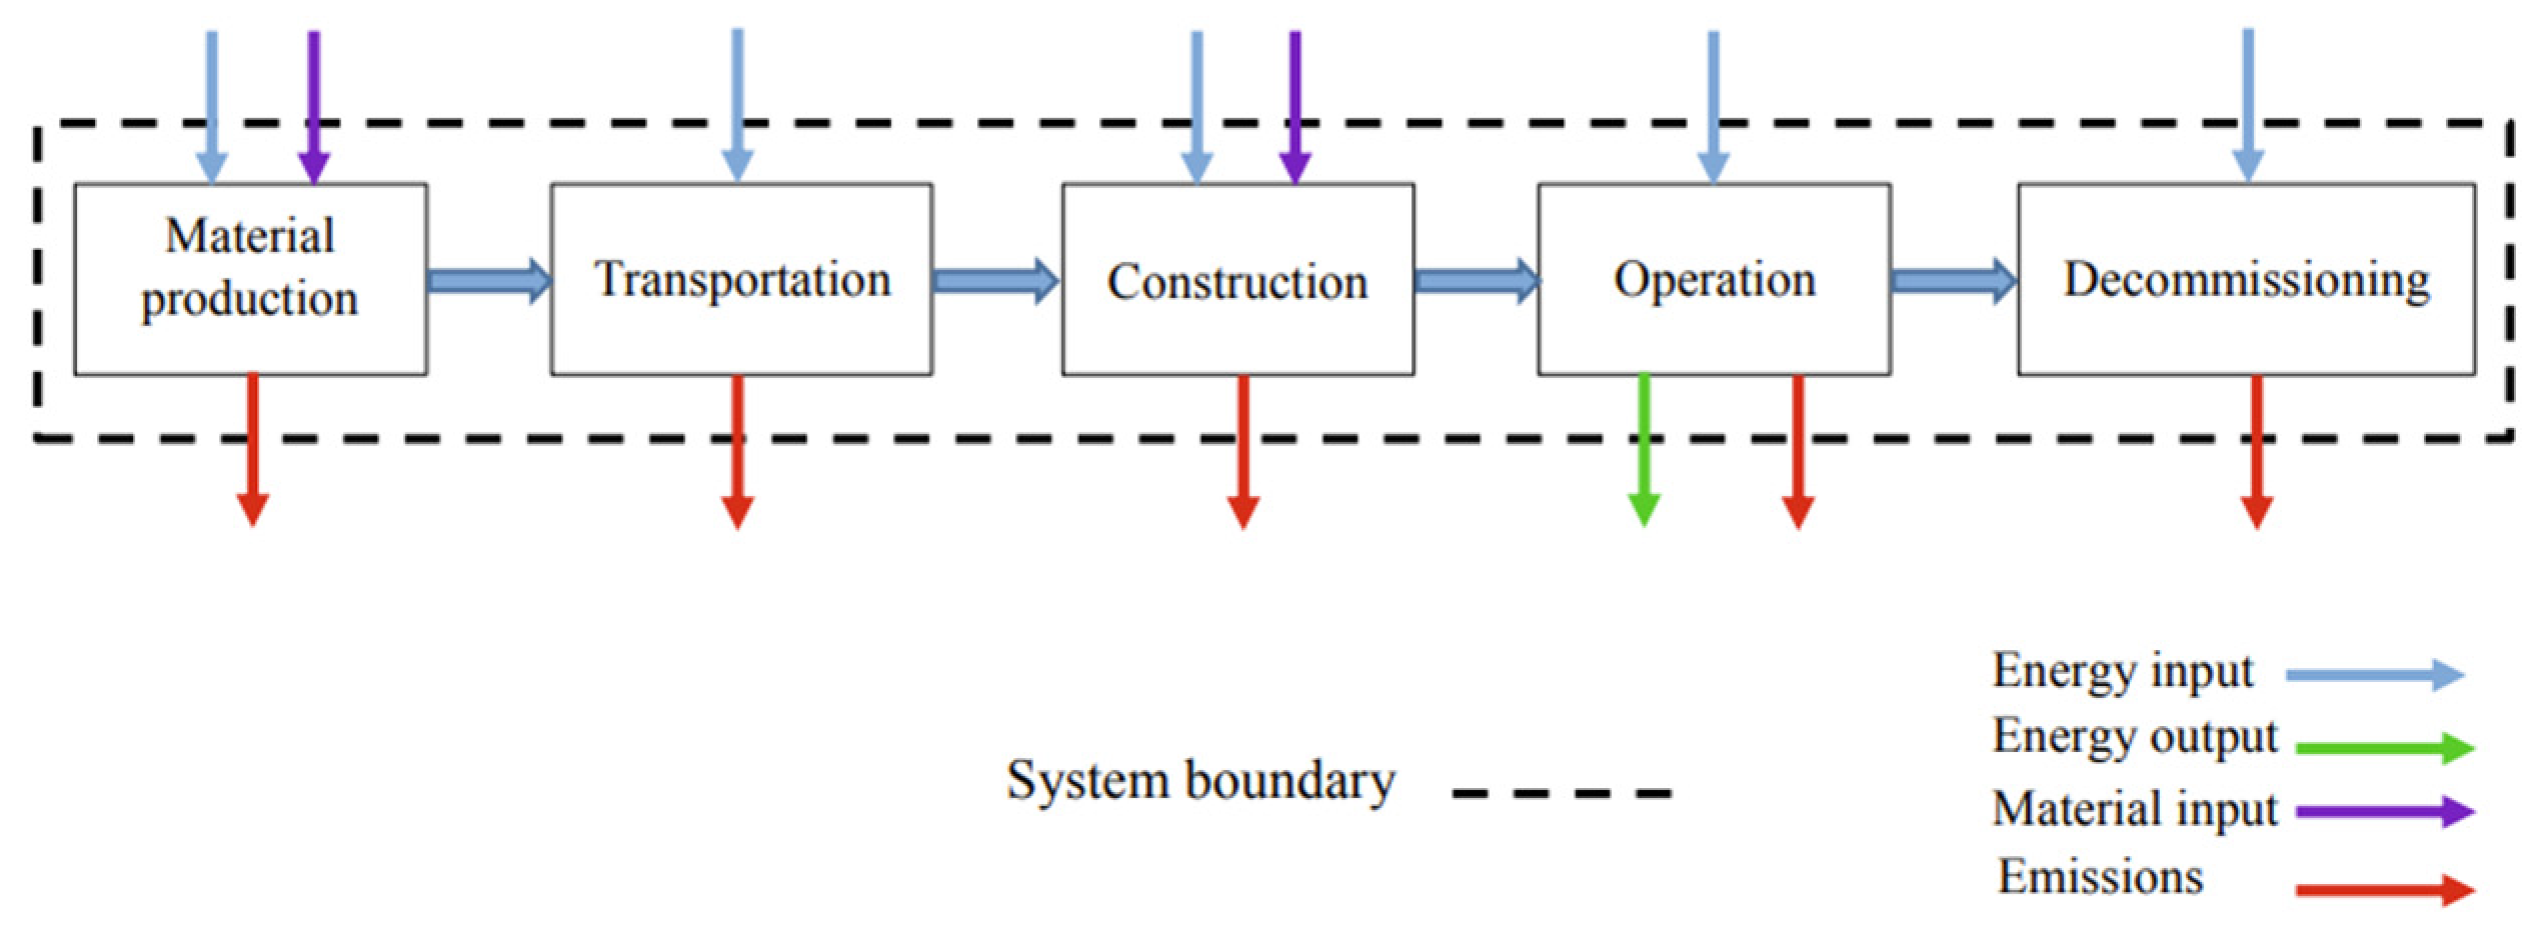
Figure 3.
Day-ahead Market prices example from ENTO-E (a) and emissions incentives (b).
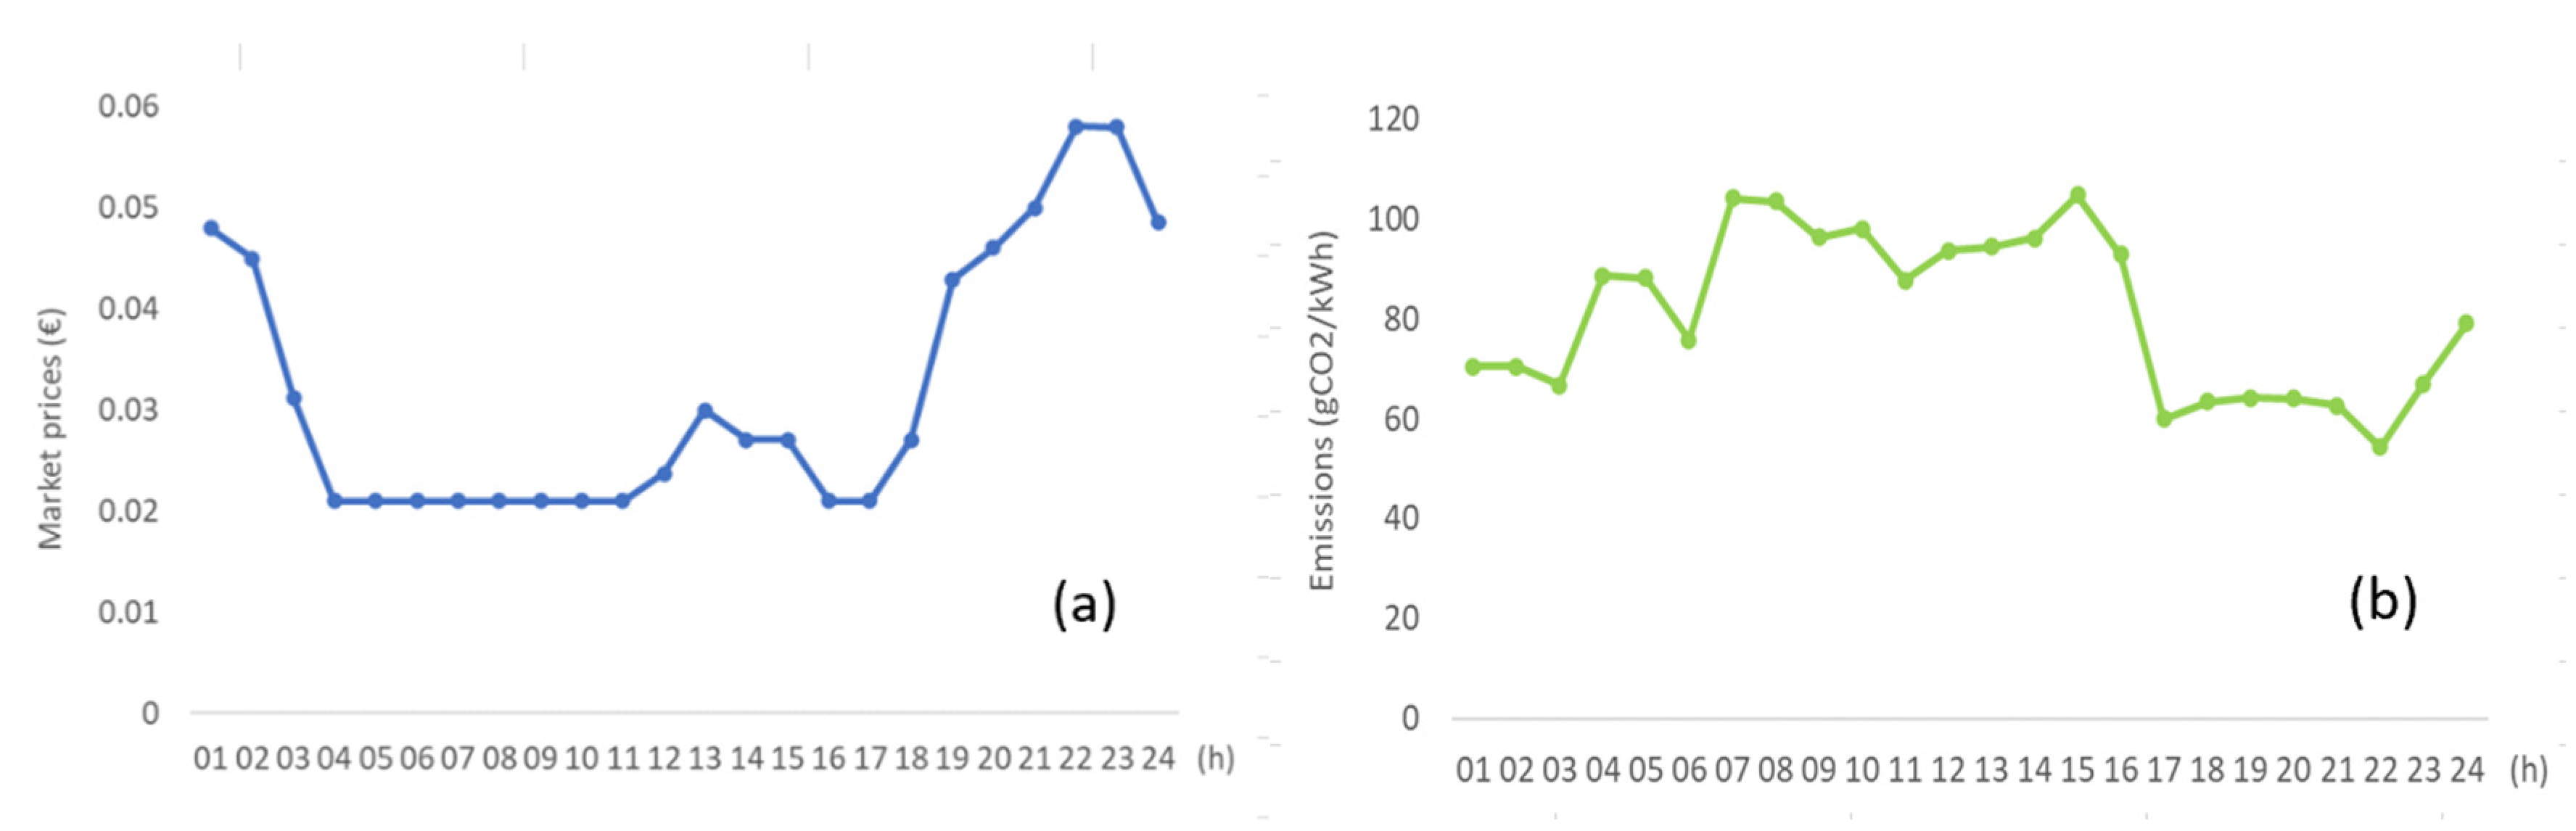
Figure 4.
Load forecast input from the building in the industrial partner site.
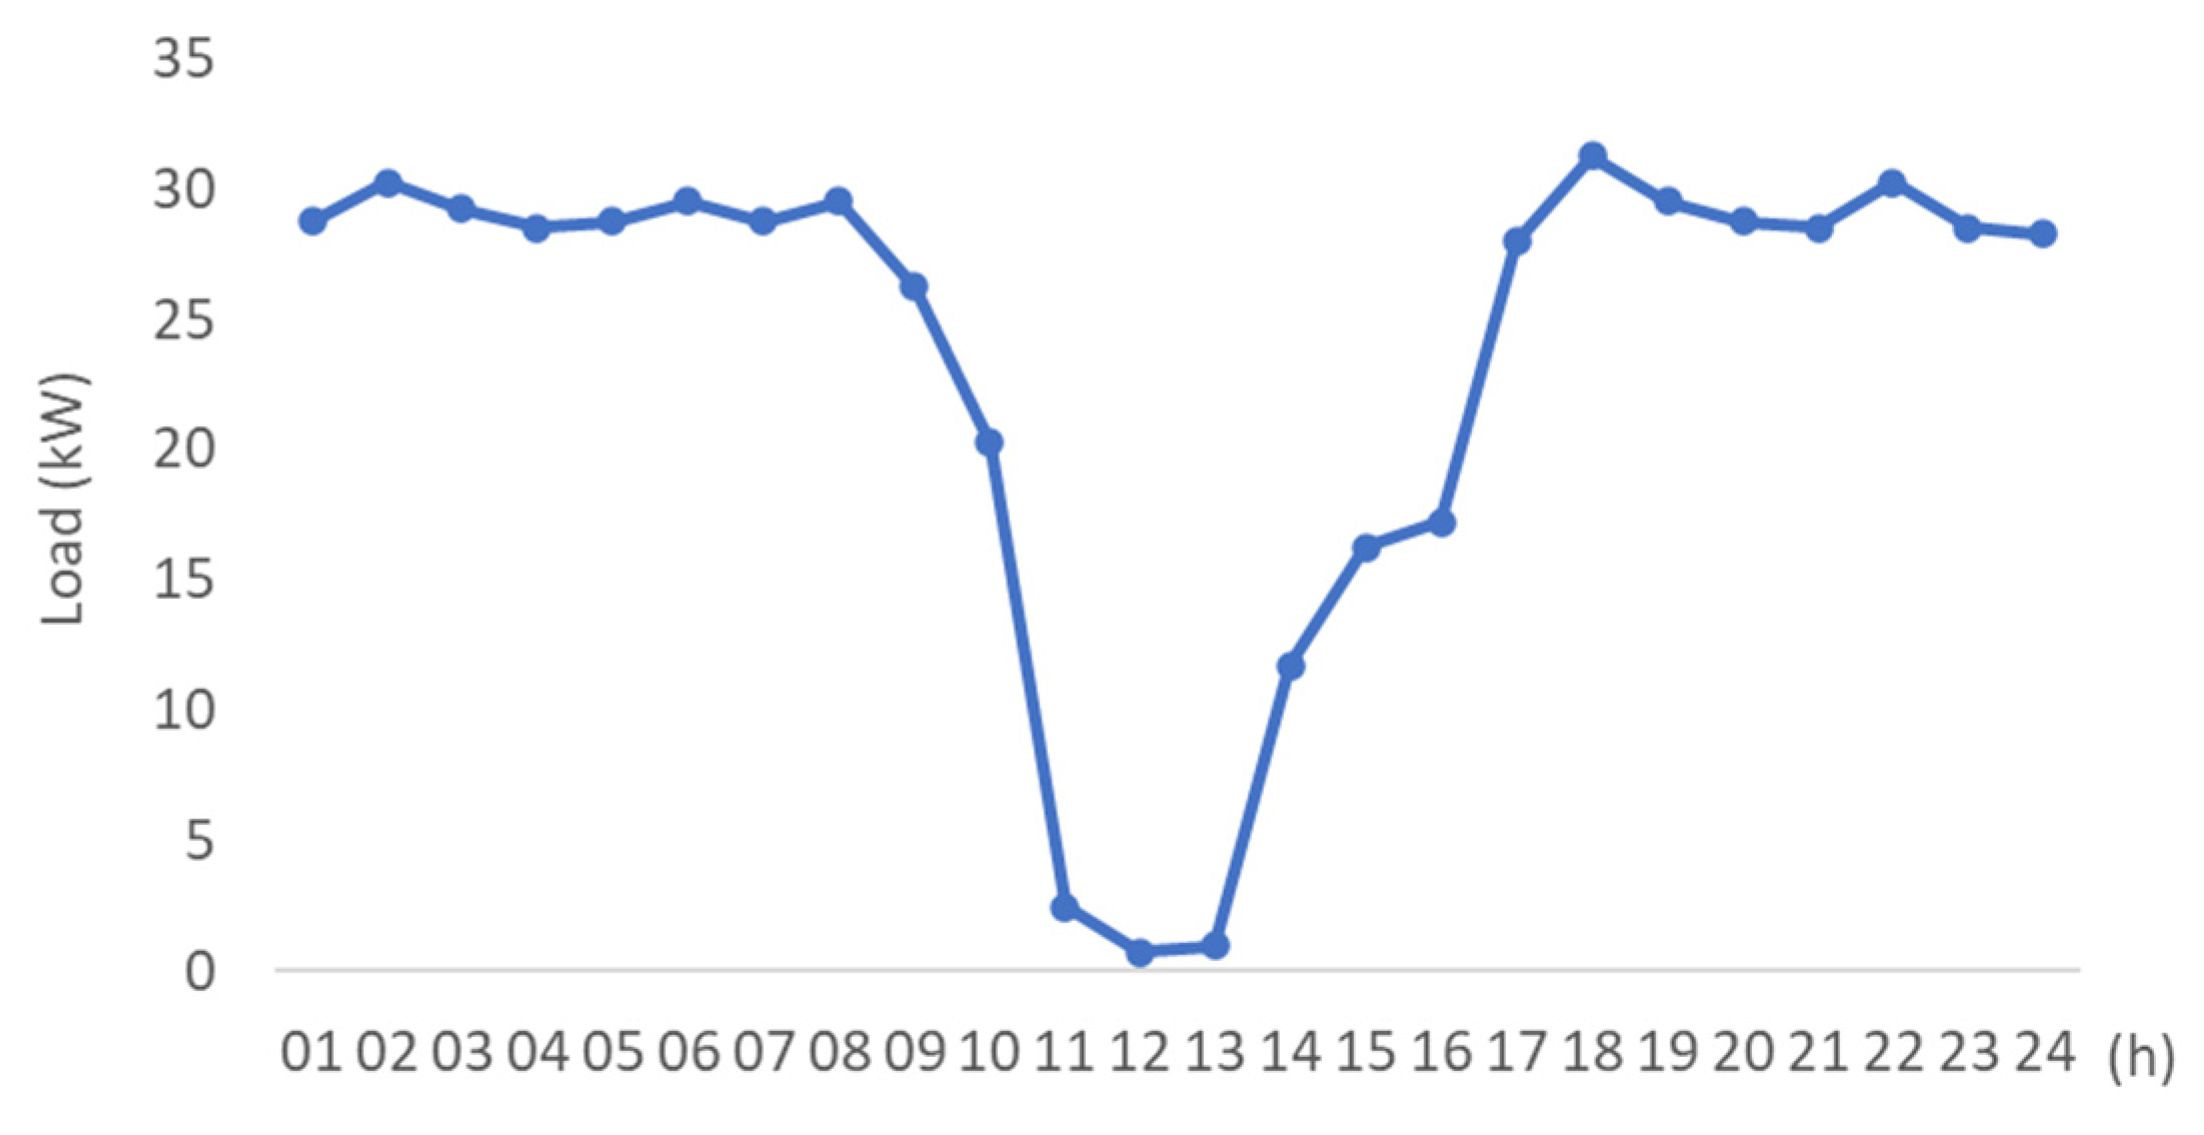
Figure 5.
Connection overview of the HESS and functional block.
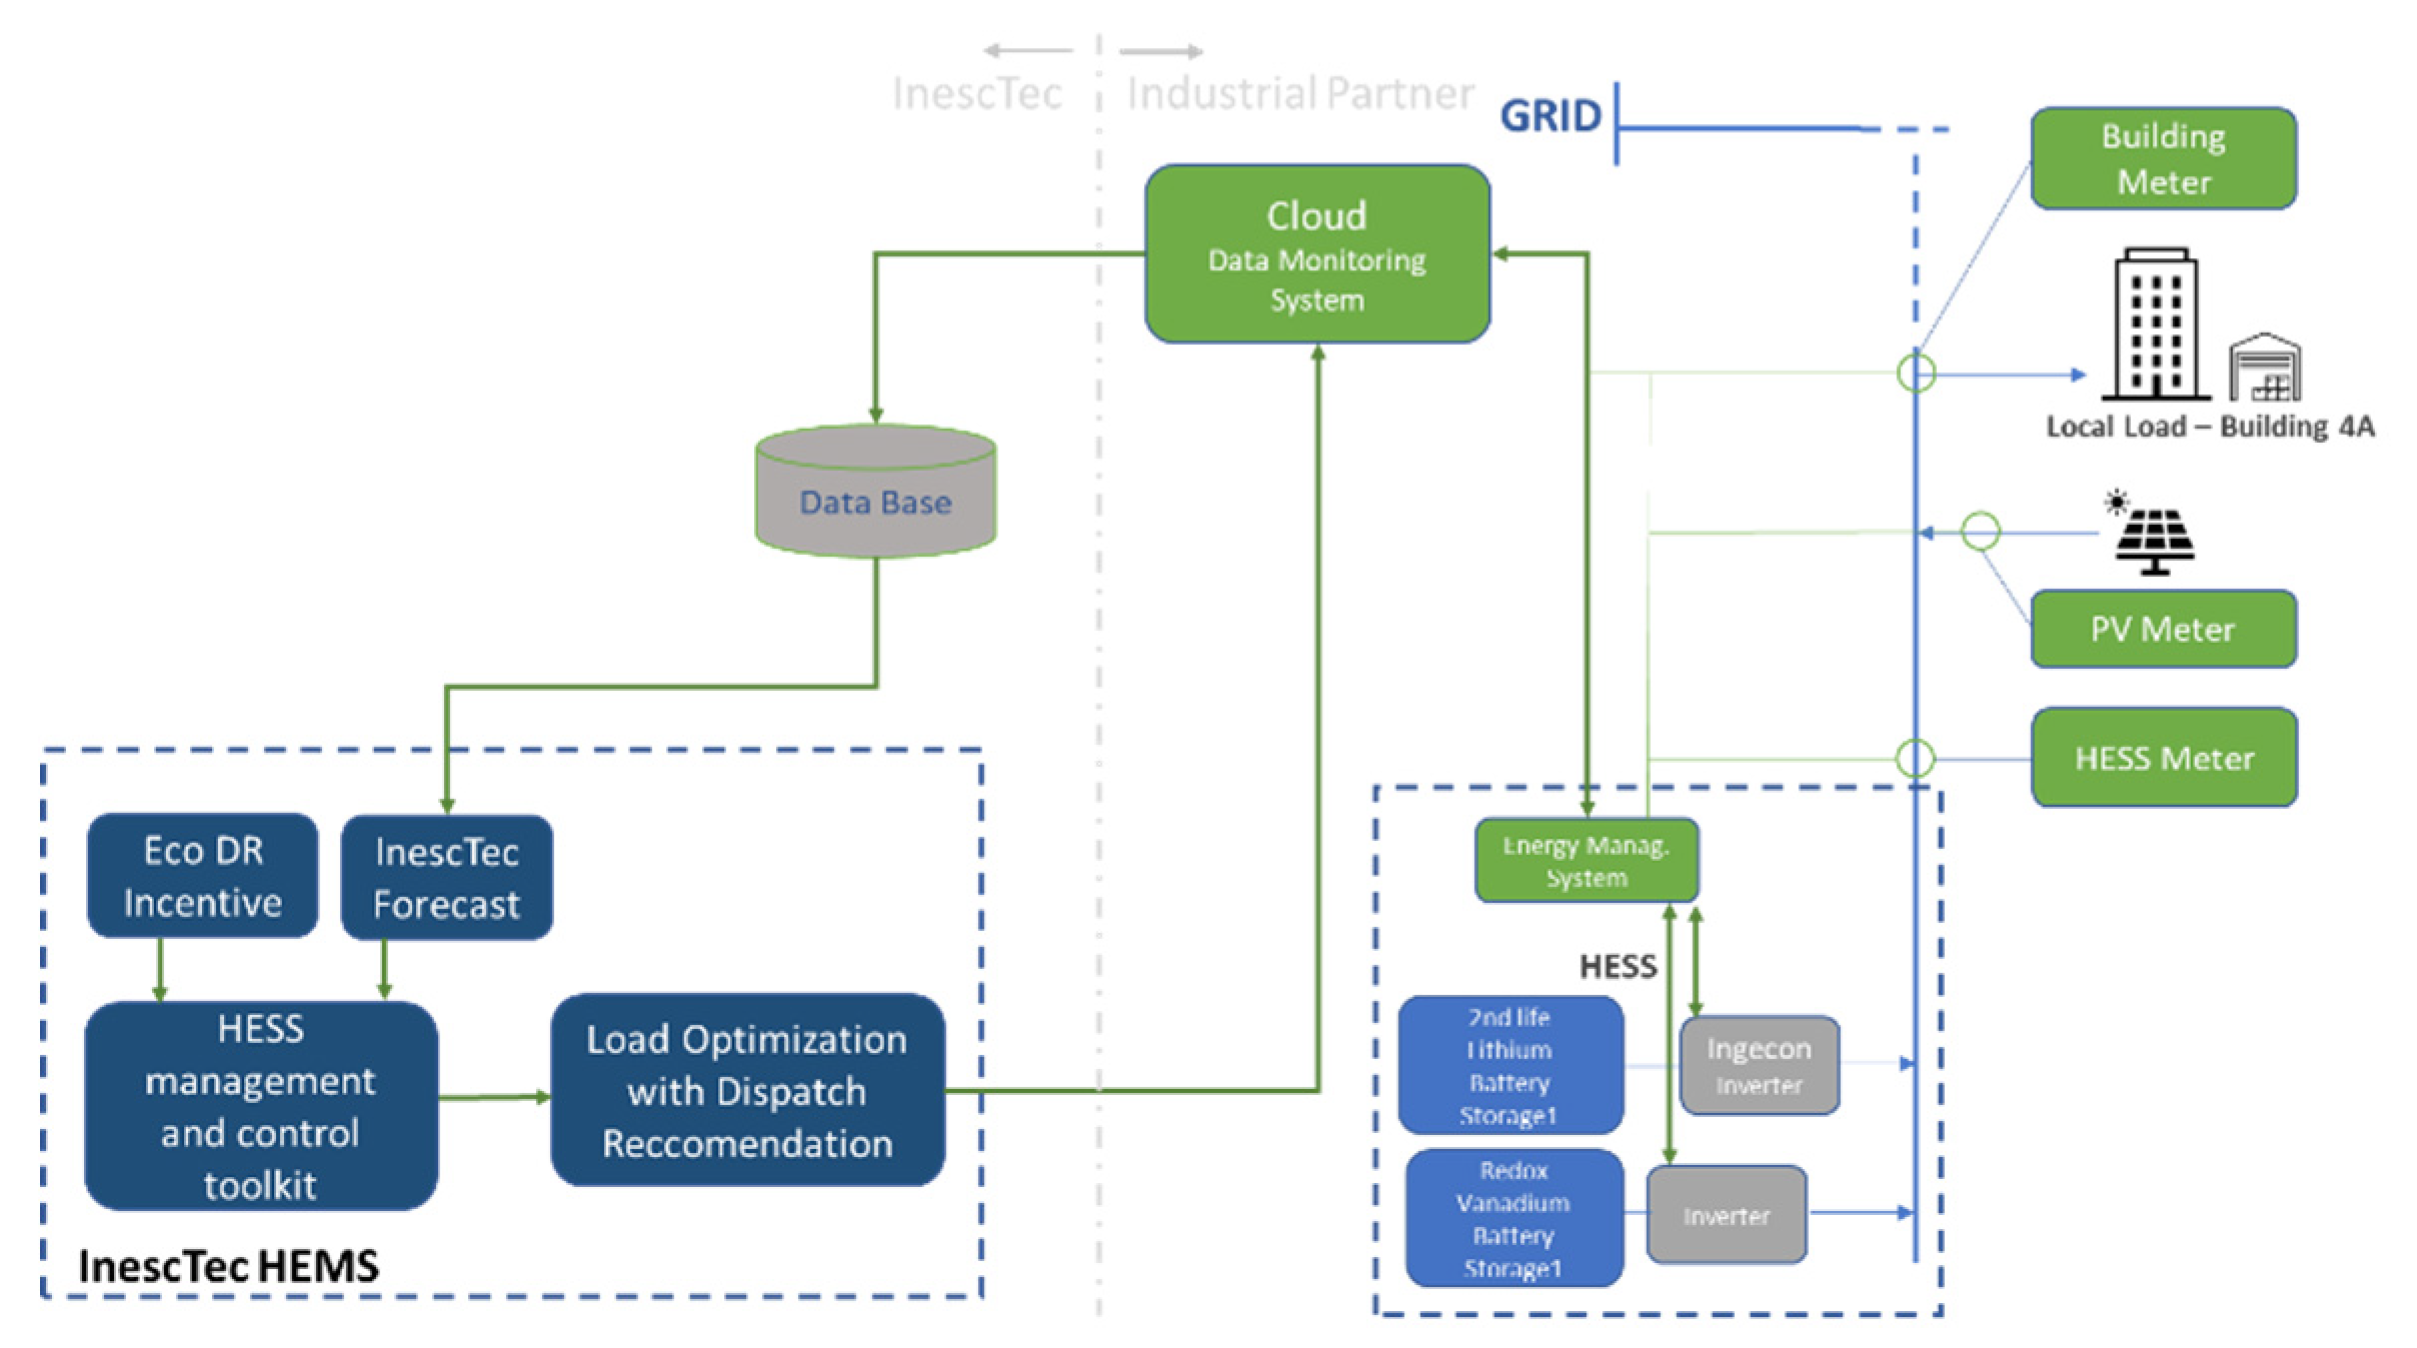
Figure 8.
VRFB-Lithium and Lithium batteries efficiency and cost performance boundary map.
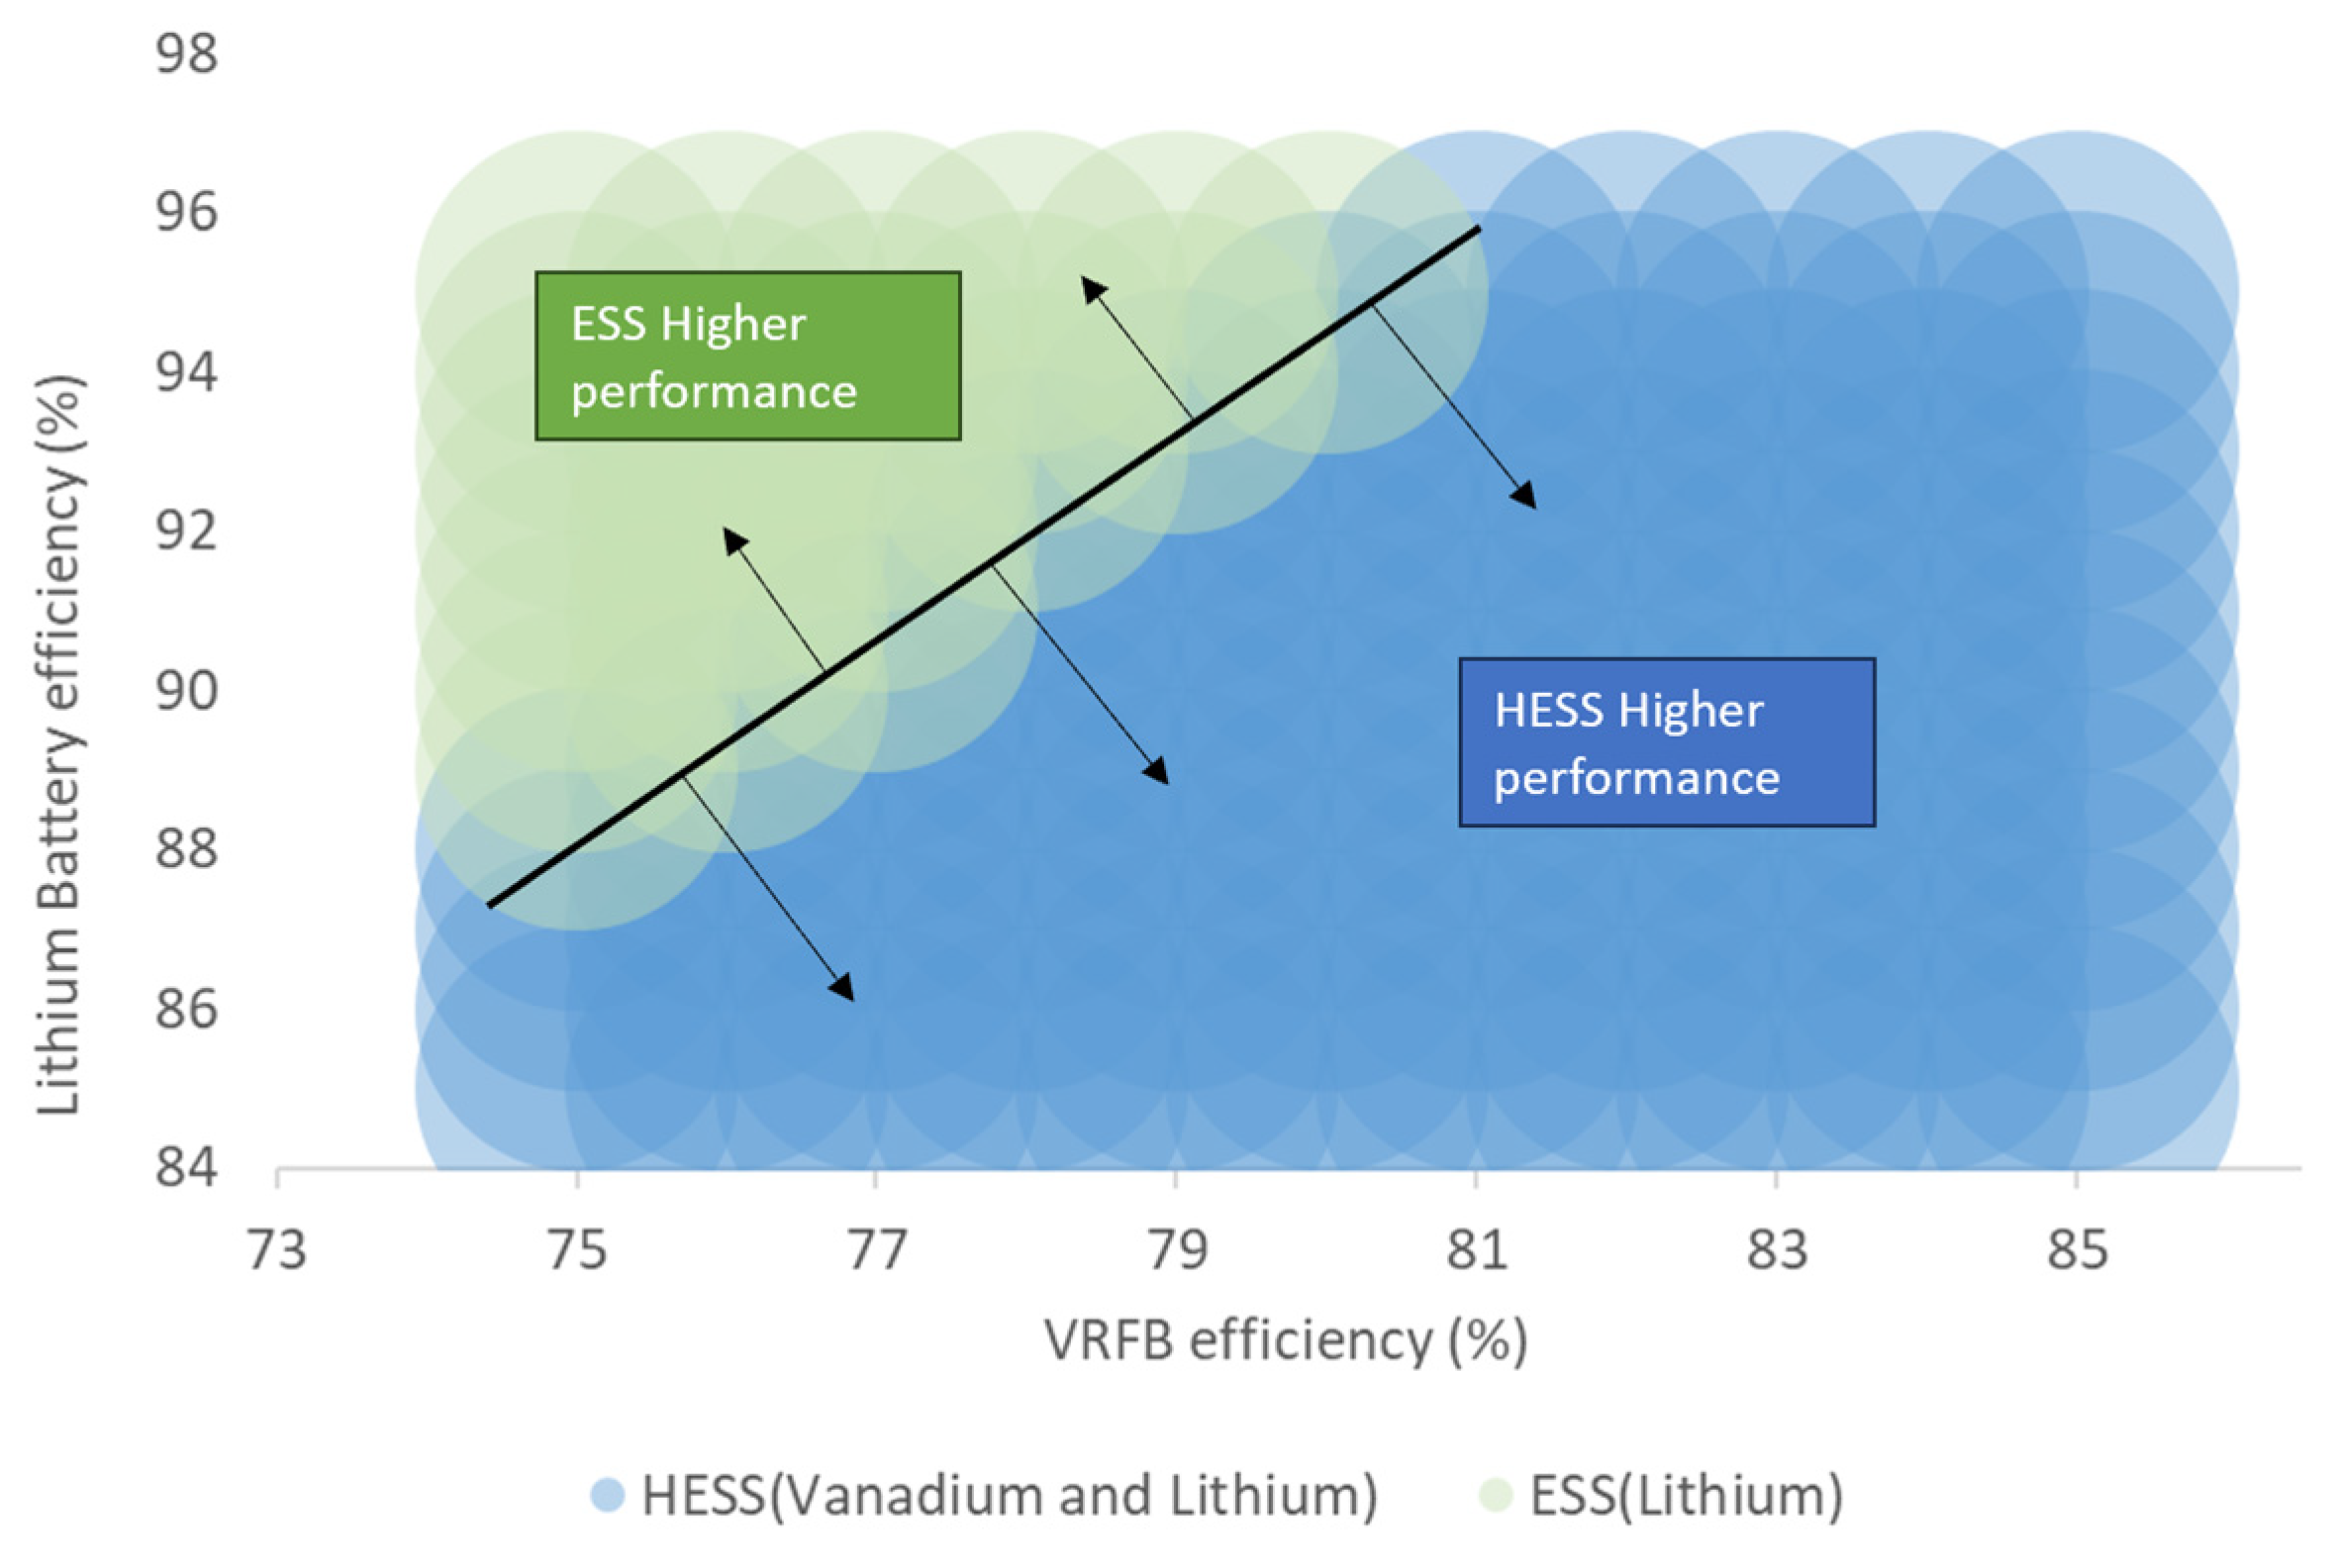

Table 1.
Technical characteristics of electrical energy storage systems (EES).
| ESS Technology | Power range (MW) | Efficiency | Power density (W/kg) | Energy density (Wh/kg) | Lifetime (year) | Nbr. Life cycles | Discharge time | Self-discharge (%) |
| Flywheel | Up to 0.25 | 0.80-0.93 | 1000 | 5-100 | 15-20 | 20,000-100,000 | ms-15 m | 100 |
| Lead-acid | Up to 20 | 0.75-0.85 | 75-300 | 30-50 | 5-15 | 2000-4500 | s-h | 0.1-0.3 |
| NaS | 0.05-8 | 0.80-0.90 | 150-230 | 150-250 | 10-15 | 2500-4500 | s-h | 20 |
| Ni-Cd | Up to 40 | 0.60-0.70 | 50-1000 | 15-300 | 10-20 | 2000-2500 | s-h | 0.2-0.6 |
| Li-ion | Up to 0.01 | 0.85-0.95 | 50-2000 | 150-350 | 5-15 | 1500-4500 | m-h | 0.1-0.3 |
| VRFB | 0.03-3 | 0.75-0.85 | 166 | 10-35 | 5-10 | 10,000-13,000 | s-10 h | Small |
| Supercapacitors | Up to 0.05 | 0.85-0.98 | 100,000 | 0.05-5 | 5-8 | 50,000 | ms-60 m | 40 |
Table 2.
Total capital Cost for each technology [17].
Table 2.
Total capital Cost for each technology [17].
| ESS technology | Configuration | Total capital cost (TCC) per unit of power rating €/kW | Total capital cost (TCC) per unit of storage capacity €/kW | ||||
| Min | Average | Max | Min | Average | Max | ||
| Flywheel | High-speed | 590 | 867 | 1446 | |||
| Lead-acid | Advanced | 1388 | 2140 | 3254 | 346 | 437 | 721 |
| NaS | - | 1863 | 2254 | 2361 | 328 | 343 | 398 |
| Ni-Cd | - | 2279 | 3376 | 4182 | 596 | 699 | 808 |
| Li-ion | - | 2109 | 2512 | 2746 | 459 | 546 | 560 |
| VRFB | - | 1277 | 1360 | 1649 | 257 | 307 | 433 |
| Supercapacitors | Double layer | 214 | 229 | 247 | 691 | 765 | 856 |
Table 3.
A summary of LCAs of energy storage technologies [16].
Table 3.
A summary of LCAs of energy storage technologies [16].
| Functional unit | System boundary | Data sources and models | Impact categories considered | Sensitivity/ Uncertainty analysis | Emissions (gCO2eq/kWh) |
|
|---|---|---|---|---|---|---|
| Pb-A | 1 kWh | Cradle to gate and operation | Industry and ecoinvent database | GWP | Y/Y | 170-740 |
| Li-ion | 1 kWh | Cradle to grave | Existing studies and ecoinvent studies | GWP | Y/N | 170-740 |
| Na-S | 1 MWh | Cradle to gate and emission | Existing literature and ecoinvent database | CED and GWP | Y/N | 170-740 |
| VRFB | 1 MWh | Cradle to grave | Ecoinvent database | GWP, HT, acidification and abiotic depletion | N/N | 170-740 |
| Flywheel | 150 kWh | Cradle to gate | Existing literature | GHG | NA | 173 |
| Supercapacitors | 150 kWh | Cradle to gate | Existing literature | GHG | NA | 416 |
Table 4.
Results for each technology considering energy costs (OF1).
| Technology | Efficiency % | Scenario 1 (OF1) | ||
| Energy cost € | Degradation cost € | Total Cost € | ||
| One Lithium Battery | 0.85-0.95 | 1185.8-1143.5 | 55.6 -74.1 | 1241.3-1217.6 |
| Two Lithium batteries | 0.85-0.95 | 1190.4- 1145.7 | 52.4-73.1 | 1242.8-1218.8 |
| Lithium and Vanadium batteries | 0.75-0.85 | 1195.1-1152.9 | 44.4-60.6 | 1239.5-1213.5 |
| Lithium and Lead-Acid batteries | 0.75-0.85 | 1208.2-1175.0 | 41.1-55.4 | 1249.3-1230.4 |
| Lithium and Ni_Cd batteries | 0.60-0.70 | 1208.2-1175.0 | 41.1-55.4 | 1249.3-1230.4 |
| Lithium and NaS batteries | 0.80-0.90 | 1203.9-1166.1 | 43.7-62.0 | 1247.5-1228.1 |
| Lithium battery and flywheel | 0.80-0.95 | 1208.1-1173.3 | 41.1-57.0 | 1249.2-1230.3 |
| Lithium battery and supercapacitors | 0.85-0.98 | 1184.1-1134.4 | 40.7-54.5 | 1224.8-1188.8 |
Table 5.
Results for each technology considering emissions (OF2).
| Technology | Efficiency % | Scenario 2 (OF2) | ||
| Energy term (kgCO2) | Degradation term (kgCO2) | Total Emissions (kgCO2) | ||
| One Lithium Battery | 0.85-0.95 | 5123.7- 4877.2 | 19.1- 91.8 | 5142.8-4968.0 |
| Two Lithium batteries | 0.85-0.95 | 5124.2-4879.8 | 18.8.3-91.8 | 5143.0-4971.6 |
| Lithium and Vanadium batteries | 0.75-0.85 | 5125.2-4891.7 | 18.3-87,4 | 5143.5-4979.1 |
| Lithium and Lead-Acid batteries | 0.75-0.85 | 5125.2-4891.9 | 18.3-87.4 | 5143.5-4979.3 |
| Lithium and NaS batteries | 0.80-0.90 | 5125.2-4891.9 | 18.3-87.4 | 5143.5-4979.3 |
| Lithium battery and flywheel | 0.80-0.95 | 5125.2-4877.8 | 18.2-80.4 | 5143.4-4958.2 |
| Lithium battery and supercapacitors | 0.85-0.98 | 5123.2-4853.6 | 16.1-75.0 | 5139.3-4928.6 |
Table 6.
Results for each technology considering energy costs (OF1 and OF2).
| Technology | Efficiency % | Scenario 1 (OF1) | ||
| Energy cost € | Degradation cost € | Total Cost € | ||
| One Lithium Battery | 0.85-0.95 | 1185.8-1143.5 | 55.6 -74.1 | 1241.3-1217.6 |
| Lithium and Vanadium batteries | 0.75-0.85 | 1196.9-1157.6 | 35.6-48.4 | 1232.5-1206 |
| Technology | Efficiency % | Scenario 2 (OF2) | ||
| Energy term (kgCO2) | Degradation term (kgCO2) | Total Emissions (kgCO2) | ||
| One Lithium Battery | 0.85-0.95 | 5123.7- 4877.2 | 19.1- 91.8 | 5142.8-4968.0 |
| Lithium and Vanadium batteries | 0.75-0.85 | 5134.3-4945.9 | 14.0-67.9 | 5148.3-5013.8 |
Disclaimer/Publisher’s Note: The statements, opinions and data contained in all publications are solely those of the individual author(s) and contributor(s) and not of MDPI and/or the editor(s). MDPI and/or the editor(s) disclaim responsibility for any injury to people or property resulting from any ideas, methods, instructions or products referred to in the content. |
© 2024 by the authors. Licensee MDPI, Basel, Switzerland. This article is an open access article distributed under the terms and conditions of the Creative Commons Attribution (CC BY) license (http://creativecommons.org/licenses/by/4.0/).
Copyright: This open access article is published under a Creative Commons CC BY 4.0 license, which permit the free download, distribution, and reuse, provided that the author and preprint are cited in any reuse.


