
Submitted:
13 December 2024
Posted:
16 December 2024
You are already at the latest version
Abstract
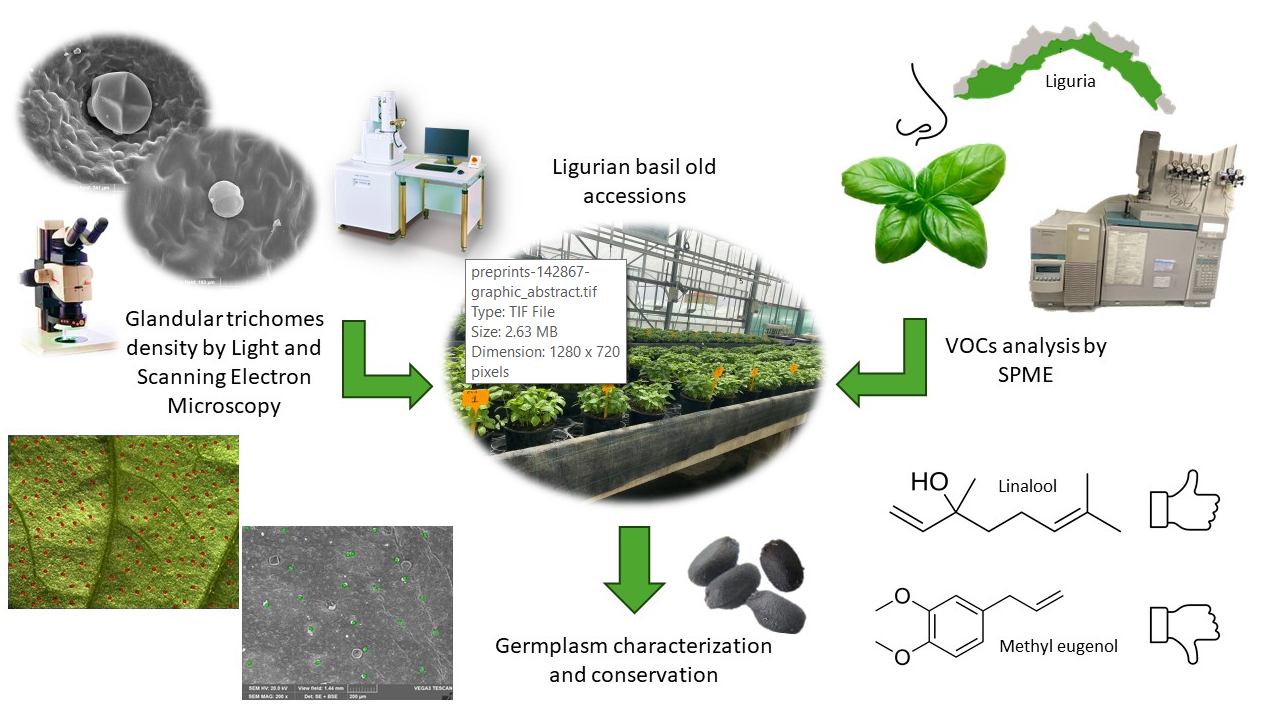
Since the 19th century, cultivation of Ocimum basilicum L. has increasingly been established in Liguria, with in situ reproduction of seeds. Over the years, Ligurian basil accessions were crossed with allochthonous genomes to obtain disease-resistant plants. To preserve the original genetic resource, nine old Ligurian accessions (CV1-9) were recovered. As part of the PSR 2014-2022 Mis. 10.2 of Liguria Region, this work aimed at characterizing these CVs by morphological and phytochemical analyses to safeguard their biodiversity. Commercial O. basilicum Genovese Superbo grown in Liguria (SL) was added for comparison. Micro-morphological investigation showed a significantly different trichomes density among the samples. CV4 showed the highest density of both peltate and capitate trichomes, while CV9 and CV1 had the lowest one of peltate and capitate, respectively. VOCs analysis was performed on CV1-9, SL and on a plant of Superbo grown in Piedmont (SP), to test the influence of the territory on basil aromatic profile. Indeed, the old accessions and SL were rich in linalool, eugenol, and bergamotene. Only CV1 slightly differed for higher levels of methyl eugenol, eucalyptol, and camphor. On the contrary, SP had very high levels of methyl eugenol and camphor. This data represents valuable insights for preserving Ligurian old basil accessions and maintaining Genovese Basil PDO production in the future.
Keywords:
Ocimum basilicum
; Liguria
; agrobiodiversity
; germplasm conservation
; glandular trichomes
; VOCs
1. Introduction
Ocimum basilicum L. is an herbaceous, annual plant native to the African continent and the Indian subcontinent, belonging to the Lamiaceae family. It was introduced to the Mediterranean basin, and particularly to Italy, between the 17th and 18th centuries. Starting from the 19th century, basil cultivation has increasingly been established in Liguria Region (Italy), especially in the West of Genoa [1]. In the 1970s, basil production gradually expanded also in other Ligurian areas, thanks to the climate, the skills of growers, and the introduction of greenhouse cultivation. This allowed growing basil also for seed propagation and not only for fresh consumption.
The basil production cycle was closed as it involved in situ reproduction by seeds selected over time to preserve the best aromatic characteristics. However, at the end of the 1980s, phytosanitary problems (e.g., the spread of Fusarium oxysporum f. sp. basilici in the growing areas) and related economic needs led to the opening of this closed system, in search of resistant or at least disease-tolerant plants from allochthonous genetic lines. Thus, specialized seed companies improved native seeds making them more productive and less susceptible to damage from disease attacks [2].
In the following years (1991-1993), the Centre for Agricultural Experimentation and Assistance (CeRSAA) of Albenga (SV, Italy) carried out a census of the areas cultivated with basil and a simultaneous collection of the seeds from old basil accessions (or cultivars sensu lato, CVs) self-propagated by the local farmers. This operation made it possible to recover nine local accessions from different areas: 2 in Genoa (GE), 1 in Albenga (SV), 1 in Andora (SV), 5 in the Dianese zone (IM). Since then, CeRSAA has always preserved these seeds, periodically reproducing them using traditional methods.
Over the years, the entire Ligurian territory has demonstrated a high vocation for basil cultivation, obtaining a unique product characterized by an intense and sweet aroma devoid of minty scent. Therefore, in 2005, basil grown in Liguria has been labelled with the Protected Designation of Origin (PDO) [3] taking the name of “Genovese Basil PDO”, renowned worldwide as the key ingredient of pesto sauce. Its characteristics derive from the combined action of three factors: the botanical traits of the plant, the environment, and the “human factor”, i.e. the traditional cultivation methods refined over time by Ligurian producers.
According to the PDO Product Specifications [4], the seeds used to produce Genovese Basil PDO must belong to O. basilicum deriving from native accessions. The plants of Genovese Basil PDO currently on the market adequately express their typical characteristics under the pedo-climatic conditions and traditional growing techniques of Liguria. It is therefore necessary to safeguard the biodiversity of basil reproduced and cultivated in Liguria for centuries, recovering and characterizing the original genetic resource. In this way, it is possible to avert genetic erosion and a potential loss of cultural and historical heritage.
Considering this, Liguria Region financially supported a project (PSR 2014-2022 Mis. 10.2) to study the nine accessions of old basil (called CV1-9) to define precisely their macro- and micro-morphology, and phytochemical characteristics, and to evaluate their agronomic performance and increase the seed supply for each accession. Moreover, the project also focuses on ensuring the germplasm protection and conservation both ex situ (in a repository) and in situ (in growers’ fields), creating a network of “custodians of biodiversity”.
Overall, the aim of our work was to carry out a multidisciplinary study of nine basil old accessions (CV1-9) using UPOV descriptors (International Union for the Protection of New Varieties of Plants), Light and Scanning Electron Microscopy, and SPME (Solid Phase Microextraction) analysis.
The cultivars currently used for producing Genovese Basil PDO derived from these old accessions (CV1-9). Among the actual commercial cultivars allowed by the PDO Specifications, we selected and analyzed Superbo grown in Liguria (SL) for comparison.
For the pharmacognostic characterization of all samples, type and density of the glandular trichomes scattered on the leaf surface were assessed. Moreover, the morphometric parameters of the seeds were estimated to characterize the germplasm. Volatile Organic Compounds (VOCs) analysis of all plants examined was also performed to highlight the more representative compounds emitted by the essential oil (EO), including terpenoids, alcohols, aldehydes, ketones and esters [5,6]. In addition, also VOCs from Superbo grown in Piedmont (SP) were examined to highlight differences in the aromatic profile directly linked to the territory of cultivation [7].
The overall data will be useful to ensure the preservation of the Ligurian old and native basil accessions that represent an important reserve of agrobiodiversity of typical Italian products.
2. Results
2.1. Phenotypical Analysis
According to the criteria of the UPOV sheet, the nine old accessions and SL resulted similar in terms of their phenotypical characteristics. The most significant differences found concerned leaf blade color, shape, profile in cross section and blistering.
CV1 differed for a less intense green leaf color and, together with CV3, for a concave instead of convex leaf blade and an upright blade orientation. CV5, CV6 and CV7 showed a slight leaf blistering, while in the other cultivars this trait was absent. SL was characterized by a darker green leaf color and by a rounded leaf shape instead of lanceolate or ovate one.
2.2. Micro-Morphological Analysis
2.2.1. Leaves
The micro-morphological investigation showed the distribution of both non-glandular (NGTs) and glandular trichomes (GTs). NGTs were uniseriate, uni- or multicellular, generally bent towards the epidermis, with a tapering apex and a warty surface (Figure 1a-b). They were located only on the leaf veins and along the leaf margin.
Two morphologically distinct types of glandular trichomes were spread on the leaf surfaces: (i) capitate glandular trichomes (CGTs), with a unicellular short stalk and a bicellular head (Figure 1c-d); (ii) peltate glandular trichomes (PGTs), characterized by a short stalk and a large spherical head with four secretory cells (Figure 1e-f).
Mean values of GTs count are reported in Table 1 and 2, together with the ANOVA or Kruskal-Wallis results and the post-hoc test p-values.
Statistical analysis highlighted that PGTs density was significantly different (p<2e-16) between the accessions on both leaf surfaces (lower and upper) (Table 1). In particular, CV4 showed the highest mean PGTs density on the lower surface (205.0 ± 52.3), resulting significantly different from all other accessions (Table 1, Figure 2a). The richest accessions in PGTs on the upper surface were instead CV2, CV3 and CV4 (Table 1). On the other hand, CV9 was the least rich in PGTs on both leaf surfaces (59.6 ± 12.8 and 9.5 ± 2.36 for lower and upper surface, respectively) (Table 1). SL was not significantly different from CV7 and CV9 for PGTs density on the lower surface, and from CV5 and CV9 for the upper one (Table 1).
p-values of the post-hoc pairwise significant comparisons (lower surface) in ascending order: 3 vs. 1 (<0.001), 4vs 1 (<0.001), 9 vs. 1 (<0.001), SL vs. 1 (<0.001), 4 vs. 2 (<0.001), 7 vs. 2 (<0.001), 9 vs. 2 (<0.001), SL vs. 2 (<0.001), 4 vs. 3 (<0.001), 5 vs. 3 (<0.001), 7 vs. 3 (<0.001), 8 vs. 3 (<0.001), 9 vs. 3 (<0.001), SL vs. 3 (<0.001), 5 vs. 4 (<0.001), 6 vs. 4 (<0.001), 7 vs. 4 (<0.001), 8 vs. 4 (<0.001), 9 vs. 4 (<0.001), SL vs. 4 (<0.001), 9 vs. 5 (<0.001), 7 vs. 6 (<0.001), 9 vs. 6 (<0.001), SL vs. 6 (<0.001), 9 vs. 8 (<0.001), SL vs. 5 (0.0011), SL vs. 8 (0.030), 6 vs. 3 (0.0047), 8 vs. 2 (0.0062), 5 vs. 2 (0.0144), 7 vs. 1 (0.0299).
p-values of the post-hoc pairwise significant comparisons (upper surface) in ascending order: 4 vs. 1 (<0.001), 5 vs. 1 (<0.001), 6 vs. 1 (<0.001), 7 vs. 1 (<0.001), 8 vs. 1 (<0.001), 9 vs. 1 (<0.001), SL vs. 1 (<0.001), 5 vs. 2 (<0.001), 6 vs. 2 (<0.001), 7 vs. 2 (<0.001), 8 vs. 2 (<0.001), 9 vs. 2 (<0.001), SL vs. 2 (<0.001), 5 vs. 3 (<0.001), 6 vs. 3 (<0.001), 7 vs. 3 (<0.001), 8 vs. 3 (<0.001), 9 vs. 3 (<0.001), SL vs. 3 (<0.001), 5 vs. 4 (<0.001), 6 vs. 4 (<0.001), 7 vs. 4 (<0.001), 8 vs. 4 (<0.001), 9 vs. 4 (<0.001), SL vs. 4 (<0.001), 6 vs. 5 (<0.001), 9 vs. 6 (<0.001), SL vs. 6 (<0.001), 9 vs. 8 (<0.001), SL vs. 8 (<0.001), 3 vs. 1 (0.001), 8 vs. 5 (0.003), 9 vs. 7 (0.003), 9 vs. 5 (0.047), SL vs. 7 (0.0047), 8 vs. 7 (0.0053), 7 vs. 6 (0.0083).
The boxplot of PGTs density on the upper surface (Figure 2b) also revealed that accessions could be divided into two different clusters: a cluster with a mean PGTs density < 20, including CV1-4; and a cluster with a mean PGTs density > 20, including CV5-9 and SL.
The CGTs density was significantly different (p=4.432e-07 for the lower surface, p=8.947e-07 for the upper surface) among the accessions too (Table 2). CV4 and CV5 showed the highest density on the lower surface (20 ± 5.92, 15 ± 4.26, respectively) (Table 2, Figure 3a), while CV1 had the lowest density on the upper surface (4.08 ± 0.669), also with a low level of variability (Figure 3b). SL differed from CV4 for both surfaces, and only from CV5 for the lower and CV1 for the upper ones.
p-values of the post-hoc pairwise significant comparisons (lower surface) in ascending order: 1 vs. 4 (0.0006), 4 vs. 8 (0.0006), 4 vs. 9 (0.0006), SL vs. 4 (0.0006), SL vs. 5 (0.0006), 2 vs. 4 (0.0008), 5 vs. 8 (0.0008), 1 vs. 5 (0.0012), 4 vs. 6 (0.0013), 5 vs. 9 (0.0018), 4 vs. 7 (0.0021), 2 vs. 5 (0.0044), 5 vs. 6 (0.0068), 5 vs. 7 (0.0378).
p-values of the post-hoc pairwise significant comparisons (upper surface) in ascending order: 1 vs. 2 (0.0003), 1 vs. 4 (0.0003), 1 vs. 5 (0.0003), 1 vs. SL (0.001), 1 vs. 6 (0.0004), 1 vs. 7 (0.0004), 1 vs. 8 (0.0005), 1 vs. 3 (0.0028), 4 vs. 8 (0.0028), 4 vs. SL (0.0102), 5 vs. 8 (0.0135), 4 vs. 9 (0.0401), 4 vs. 6 (0.0424), 2 vs. 8 (0.0494).
In addition, CGTs density was not significantly different between the accessions considering different leaf zones, that were near midvein or near the edge (nested two-way nonparametric ANOVA: p=0.363 for the lower surface, p=0.581 for the upper one).
Overall, we observed that PGTs density was higher on the lower surface than on the upper surface. On the contrary, CGTs density was similar on the two surfaces.
2.2.1. Seeds
Mean values of seeds measurement are reported in Table 3, together with the ANOVA results and the post-hoc test p-values. As can be appreciated from both pairwise comparisons (Table 3) and boxplots (Figure 4a,b), the differences in seed length and width were not as significant as in the case of trichomes.
CV1 had the smallest length at all (2.10 ± 0.122 mm) (Table 3, Figure 4a, Figure 5a), but its width differed only from CV 7 and CV9. CV6 showed the highest mean length value (2.32 ± 0.114 mm) (Table 3, Figure 5b), while CV9 had the highest mean width value (1.39 ± 0.124 mm) (Table 3). However, only a few significant comparisons were found.
p-values of the post-hoc pairwise significant comparisons (length) in ascending order: 1 vs. 6 (0.0000), 1 vs. 7 (0.0000), 1 vs. 8 (0.0000), 1 vs. 9 (0.0007), 1 vs. SL (0.0009), 1 vs. 4 (0.0027), 1 vs. 2 (0.0113), 3 vs. 6 (0.0121), 1 vs. 5 (0.0183), 5 vs. 6 (0.0216), 1 vs. 3 (0.0319), 2 vs. 6 (0.0340).
p-values of the post-hoc pairwise significant comparisons (width) in ascending order: 1 vs. 9 (0.0014), 5 vs. 9 (0.0121), 1 vs. 7 (0.0464).
2.3. Phytochemical Analysis
In total, considering all basil samples, 112 volatile organic compounds were identified, as can be seen from Table 4.
The Hierarchal Cluster Analysis (HCA) highlighted the dominant effect of both genetic and pedo-climatic factors on the VOCs profile. Indeed, four clusters could be recognized (Figure 6): 1) SP; 2) CV1; 3) CV9, SL, CV2, CV6; 4) CV4, CV5, CV8, CV3 and CV7. SP was completely separated from old basil accessions (CV1-9) and from SL.
In Table 5 and Table 6 are reported the highest absolute differences in the aromatic composition between SP and the mean of all other accessions (CV1-9 and SL). SP was characterized by a considerable amount of methyl eugenol, β-farnesene and β-cubebene (Table 4, Table 5), while the other accessions (CV1-9 and SL) were richer in linalool, eugenol and cis α-bergamotene (Table 4, Table 6). A difference in the camphor amount was also observed, with higher levels found in SP (Table 4, Table 5).
In addition, CV1 was categorized as a separate cluster respect to the other Ligurian accessions (CV2-9 and SL), showing slightly higher levels of methyl-eugenol, eucalyptol, and camphor (Table 4), representing thus the closest accession to SP.
3. Materials and Methods
3.1. Plant Material and Growing Methods
Leaves and seeds of the nine old basil accessions were provided by CeRSAA.
The cultivation of the nine accessions was carried out following standard techniques for basil seed propagation.
Since the seeds came from a collection stored at 5°C, a preliminary check was conducted to assess the germinability of the reproductive material. In the laboratory, 30 seeds of each accession, divided into three replications, were placed in Petri dishes containing a bibulous paper disc with a diameter matching the dish. The dishes with the seeds were then placed in an incubator at 22-24°C for a period of 7 days. At the end of this period, the correctly germinated seeds were counted to assess the germinability (percentage of germinated seeds on the total tested seeds). Considering that seeds had been stored for over 10 years, the germination energy was not evaluated.
Once the germinability was known, an adequate number of seeds for each variety was placed in seed trays to produce at least 100 basil plants per accession. The germination substrate used was chosen from those commonly used for this purpose (100% black peat). The trays were placed on benches in a greenhouse with controlled temperature and air humidity (minimum T°C 20°C; maximum T°C 24°C; RH 75-85%). The substrate temperature was not controlled, and the lighting was the natural light available under the greenhouse.
At the phenological stage of two fully expanded leaves, plants were removed from the seed trays and transplanted into final pots (18 cm diameter). The growing substrate was the common Ligurian soil where Genovese Basil PDO is cultivated. Plant nutrition was ensured by incorporating, at the time of pot filling, a controlled-release fertilizer with a formulation of N:P2O5:K2O=15:15:15 at 2 g/L of substrate (release over 12 months at 20°C). The pots were placed on raised benches in a greenhouse with controlled temperature and air humidity (minimum T°C 20°C; maximum T°C 24°C; RH 75-85%) (Figure 7). The substrate temperature was not controlled, and the lighting was the natural light available under the greenhouse.
At the end of the initial root establishment phase and the first growth of the aerial parts of the plants, two successive pruning sessions were carried out to promote the tillering of the young plants.
To prevent infection and the spread of pathogens and pests that could affect the plants under the described cultivation conditions (such as Peronospora belbahrii, Botrytis cinerea, aphids, and thrips), authorized fungicides and insecticides were applied to the crop. Leaf sampling was carried out at the end of the safety period required for the applied plant protection products.
3.2. Phenotypic Traits
The nine old accessions and SL (Figure 7) were scored according to a standardized descriptor list developed by the International Union for the Protection of New Varieties of Plants (UPOV) [29]. The phenotypic traits studied were plant habit, plant height, leaf blade length, leaf blade length/width ratio, leaf blade shape, leaf blade blistering, leaf blade intensity of green color, leaf blade profile in cross section, leaf blade orientation and petiole pigmentation.
3.3. Micro-Morphological Analysis
3.3.1. Leaves
For each accession, 3 plants were randomly selected, and 2 fresh adult leaves were sampled from the third node [5,30] of each plant (Figure 8), for a total of 6 leaves per accession. The third node was chosen because, during harvesting, only the apical part of the plant, which is the most tender and fragrant, is cut off [3].
Leaves were then observed under a stereomicroscope (LEICA M205 C, Leica Microsystems, Wetzlar, Germany) to acquire images useful for calculating peltate glandular trichomes (PGTs) density on both leaf surfaces. The following magnifications were used: 1.25x for the lower page (Figure 9), which is richer in PGTs; 2.5x for the upper page, which is generally characterized by a lower density of PGTs, making their identification more difficult. The analysis was conducted on the median zone of the leaf blade, considering 12 random fields within the area of investigation (6 for the lower and 6 for the upper surface), for a total of 72 micrographs per accession (36 for the lower surface and other 36 for the upper one). PGTs density was estimated as number of peltate glandular trichomes per unit leaf surface area (n/mm2). The areas were 85 mm2 for observation at 1.25x and 20.5 mm2 at 2.5x.
Capitate glandular trichomes (CGTs) are smaller than PGTs and so not well visible under stereomicroscopy. For this reason, their density was estimated using a Scanning Electron Microscope. Small portions of the median zone of the leaves were fixed in a FineFIX working solution (Milestone SRL, Sorisole, Bergamo, Italy), left overnight at 4°C [31] and then dehydrated through a graded series of ethanol (70, 80, 90, and 100%). After being critically point dried in CO2 (CPD, K850 2M Strumenti s.r.l., Rome, Italy), specimens were mounted on aluminium stubs, covered with a 10 nm layer of gold and observed under a VEGA3-Tescan-type LMU microscope (Apollo, Tescan USA Inc., Cranberry Twp, PA, USA), operating at an accelerating voltage of 20 kV. Images were acquired at a magnification of 200x (Figure 10). The count was conducted on 24 random fields per accession (12 for the lower surface and other 12 for the upper one), distinguishing marginal zones and midvein zones. CGTs density was estimated as number of capitate glandular trichomes per unit leaf surface area (n/mm2). The area was 1.55 mm2.
All the captured images were analyzed using the image processing software ImageJ (v 1.53t) [32].
3.3.2. Seeds
Seeds analysis was conducted on 30 samples per accession. Seeds were manually cleaned to remove impurities (vegetal fragments, stones, soil residues, etc.) (Figure 11a). Then, their length and width were measured in millimeters (mm) using LAS EZ (Leica Application Suite, version 1.6.0, Leica Microsystems) (Figure 11b).
3.4. Phytochemical Analysis
To identify and quantify the compounds that characterize basil aroma, Solid-Phase Micro-Extraction (SPME) analysis of basil leaves was used. This is a fast, solvent-free method to determine the volatile constituents of essential oils [19]. VOCs analysis considers how consumers choose the basil plants to purchase; indeed, smelling the plants, they look for the aroma that is closest to their "olfactory memory". This characteristic, easily distinguishable by consumers, is also one of the prerogatives of products with a PDO.
The SPME analysis involved the following steps: (1) sample preparation: basil leaves were collected and immediately taken to the laboratory located close to the greenhouse. At laboratory, leaves were chopped and placed in specific valve containers; (2) fiber selection: a specific fiber suitable for capturing volatile and semi-volatile compounds analogous to those normally found on basil leaves and in the surrounding atmosphere was used; (3) extraction: the fiber was positioned in contact with basil leaves in a sealed container. Under controlled temperature and time conditions, the volatile compounds present in the leaves were adsorbed onto the fiber; (4) desorption: once the extraction was complete, the fiber was introduced into a gas chromatograph where the adsorbed compounds were desorbed by heating; (5) analysis: the desorbed compounds were separated and identified using gas chromatography coupled with mass spectrometry (GC-MS); (6) data interpretation: the results were analyzed to identify and quantify the compounds present in basil leaves.
3.5. Statistical Analysis
Data obtained from PGTs count and seeds measurement were analyzed by a one-way parametric Analysis of Variance (ANOVA), followed by pairwise comparisons (post hoc Tukey tests), since the sample size was sufficiently large (n = 36 and n = 30, respectively, per accession). Instead, CGTs density was estimated considering a smaller sample (n<30), so data were analyzed by a one-way non-parametric Kruskal-Wallis test, followed by pairwise comparisons (post hoc Wilcox tests). A nested two-way nonparametric ANOVA was also performed to find potential differences in CGTs density among midvein and marginal zones of the leaf.
Moreover, a Hierarchical Cluster Analysis (HCA) was carried out to group the nine basil accessions, SL and SP according to similarities in the aromatic profile obtained using SPME. The HCA was performed using the Ward’s method and considering absolute values (mg/kg).
All analyses were carried out with software R version 4.3.2 (R Core Team 2022). The significance level has been set at 0.05.
4. Discussion
The characterization of plants of food interest is extremely important to valorize the products labelled with a PDO mark, showing typical intrinsic characteristics, such as taste, color and aroma [8]. The high quality of these agri-food products derives from the interaction between the cultivar used, the geographical environment and the traditional methods of cultivation [7,8]. Therefore, reliable cultivar identification is fundamental for the protection of PDOs, ensuring authenticity and traceability of these products [9,10].
Regarding O. basilicum, both morphological and phytochemical characterization of the different accessions/cultivars is crucial to correctly distinguish each specimen and so manage a germplasm collection. Basil seeds are widely used in breeding programs to obtain plants whose specific functional traits allow selecting the most suitable cultivar for different applications, e.g. pharmacology, medicine, phytopathology, and horticulture [11,12]. Indeed, the cultivars currently used in Liguria to produce Genovese Basil PDO derive from old local accessions crossed over the time with allochthonous genetic lines, to obtain more disease-resistant plants.
Since they are highly hereditable, UPOV descriptors can be reliably used for a first classification of basil accessions [13]. However, as the nine old accessions (CV1-9) and SL showed similar phenotypic characteristics, the macro-morphological investigation should be followed by both micro-morphological and SPME analyses to accurately highlight the intra-specific variability.
For the micro-morphological characterization of basil, it is essential to assess the different types and density of the secreting trichomes scattered on the leaf surface. These structures include peltate and capitate glandular trichomes [14,15]. PGTs represent the main site of essential oil biosynthesis and accumulation, while CGTs are responsible for the synthesis of polysaccharides, proteins and lipids [15,16]. The density and relative proportion of PGTs versus CGTs influence the essential oil content and composition, so both types of trichomes contribute to the final aroma of basil [5].
Some cultivars were richer in PGTs, such as CV3 and CV4. CV4 also showed a higher amount of CGTs on the lower surface, together with CV5. On the other hand, the cultivars that differed mostly from all the others in terms of lower trichomes density were CV9 for PGTs and CV1 for CGTs.
Trichomes density can vary depending on plant genetic factors and growing environment [17]. However, since the old basil accessions were cultivated under the same conditions [4], it can be assumed that the differences in glandular trichome density are linked to the plant’s genome. The presence of a high number of glandular trichomes, as in CV4, can play an important ecological role, since they are important for the passive resistance of plants to pathogens and other biotic or abiotic stressors [17,18]. This supports the variability in disease-resistance among the commercial cultivars currently used to produce Genovese Basil PDO.
Seed morpho-metric data highlighted that only CV1 had significantly shorter seeds. The diversity of CV1 for phenotypical traits, trichome density and seed size agrees with the composition of its VOCs profile, which showed greater similarity to SP than to the other Ligurian samples (CV2-9 and SL).
SL showed a strong similarity with CV7 and CV9 in terms of PGTs density, and with CV8 and CV9 considering CGTs mean values. Additionally, the proximity to CV9 in the HCA of VOC profiles suggests that SL could derive from this local old cultivar.
The different VOCs (e.g. terpenoids, alcohols, aldehydes, ketones and esters) giving basil its distinctive scent [19] have a strong impact on the consumer’s sensory perception [6]. Since the composition of VOCs can vary according to both genetic, environmental and agricultural factors [20], their analytical profile is relevant [6] to distinguish the different accessions. HCA analysis of the old Ligurian basil accessions (CV1-9) compared with SL and SP highlighted that the volatile fraction was affected by both cultivar and geographical area.
Methyl-chavicol (or estragole), commonly found in other sweet Italian basils (e.g., cv. Neapolitan) was absent in all samples, including SP, confirming that a cultivar is strictly associated to a particular aromatic profile [21]. This compound imparts a strong anise/liquorice aroma to basil [6], reducing the quality of this product. Genovese Basil PDO is indeed characterized by a preponderance of linalool and the absence of estragole [22].
Regarding SP, the considerable amount of cubebene and farnesene provides to basil leaves an intense herb odor [23,24] that, together with the camphoraceous aroma due to the presence of camphor, is often less appreciated by the consumers. Moreover, the high levels of methyl-eugenol found are considered responsible for a clove/minty-like aroma. It has been highlighted that high amounts of this compound could be of toxicological concern to human health, due to its suspected carcinogenic action [15,25]. In addition, it should be underlined that the absence of the minty-like aroma is one of the prerogatives of Genovese Basil PDO according to the PDO Product Specifications [4].
Among the old basil accessions, only CV1 showed slightly higher concentrations of methyl eugenol and camphor, resulting the closest accession to SP. Therefore, the different traits revealed by the morphological analyses match a different composition of the volatile compounds emitted by the essential oil.
The other clusters (CV2-9 and SL) presented instead an abundance of linalool, eugenol and cis α-bergamotene, which contribute to a fruity and sweet aroma, typical of Genovese Basil PDO.
In particular, the presence of bergamotene can be a marker of basil cultivated in Liguria. Indeed, a previous work [26] showed that this component, although in very low percentages, can be considered a distinctive characteristic of pesto sauce prepared with Genovese Basil PDO.
Essential oils are typified by major compounds that lead to specific odors (VOCs) [27]. Volatile Organic Compounds represent important quality markers, whose qualitative and quantitative differences have a pivotal role in gastronomy and consumer appreciation [22,28]. The aroma of basil arises from the interaction between VOCs, which are influenced by numerous factors, including cultivar and geographical origin. The consumers can distinguish basil plants grown in Liguria from those cultivated in other regions exactly by their distinctive aroma.
5. Conclusions
This study provides a comparative account of intra-specific diversity in glandular trichomes density and VOCs composition among several old Ligurian basil accessions from which Genovese Basil PDO originated. The high quality of this Ligurian crop of excellence derives from the interaction between the cultivar used, the geographical environment and the traditional methods of cultivation. Our data highlight the importance of both in situ and ex situ conservation of the old basil accessions, to preserve germplasm biodiversity and maintain the production of Genovese Basil PDO in the future.
Author Contributions
Conceptualization, L.C., P.M., G.M. and G.B.; methodology, L.C., P.M., F.B., F.R., G.M. and G.S.; software, F.R.; validation, L.C., P.M., F.R. and G.M.; formal analysis, L.C., P.M., F.B., D.C., F.R., G.M. and G.S.; investigation, L.C., P.M., F.B., D.C., F.R. and G.M.; plant sampling, D.C.; data curation, L.C., F.R., G.M. and F.B.; writing—original draft preparation, L.C., F.B., F.R. and G.M.; writing—review and editing, L.C., P.M., F.R. and G.M.; supervision, L.C., P.M., F.R. and G.M.; funding acquisition, L.C., G.M. and G.B. All authors have read and agreed to the published version of the manuscript.
Funding
This research was funded by “PSR 2014-2022 Liguria, Misura 10.2”.
Data Availability Statement
The data presented in this study are available in this published paper.
Acknowledgments
This experimental study was performed in the framework of the PhD project of Federica Betuzzi (PhD School in Science and Technologies for the Earth and Environment, curriculum Biology Applied to Agriculture and the Environment, XXXIX cycle, University of Genoa), granted by the Ministry of University and Research. We thank Mrs. Laura Negretti (DISTAV, University of Genova) for SEM technical assistance.
Conflicts of Interest
The authors declare no conflicts of interest.
References
- Consorzio di tutela del Basilico Genovese, D.O.P.Available online:. https://www.basilicogenovese.it/(accessed on 13 May 2024).
- Garibaldi, A.; Gullino, M.L.; Minuto, G. Diseases of Basil and Their Management. Plant Dis. 1997, 81, 124–132. [Google Scholar] [CrossRef] [PubMed]
- Gazzetta Ufficiale della Repubblica Italiana GU 273/2005. Available online: https://www.gazzettaufficiale.it/atto/serie_generale/caricaDettaglioAtto/originario?atto.dataPubblicazioneGazzetta=2005-11-23&atto.codiceRedazionale=05A10864&elenco30giorni=false (accessed on 13 May 204).
- Gazzetta Ufficiale della Repubblica Italiana GU 176/2010. Available online: https://www.gazzettaufficiale.it/atto/serie_generale/caricaDettaglioAtto/originario?atto.dataPubblicazioneGazzetta=2010-07-30&atto.codiceRedazionale=10A09209&elenco30giorni=false (accessed on 13 May 204).
- Maurya, S.; Chandra, M.; Yadav, R.K.; Narnoliya, L.K.; Sangwan, R.S.; Bansal, S.; Sandhu, P.; Singh, U.; Kumar, D.; Sangwan, N.S. Interspecies comparative features of trichomes in Ocimum reveal insights for biosynthesis of specialized essential oil metabolites. Protoplasma 2019, 256, 893–907. [Google Scholar] [CrossRef] [PubMed]
- D’Alessandro, A.; Ballestrieri, D.; Strani, L.; Cocchi, M.; Durante, C. Characterization of Basil Volatile Fraction and Study of Its Agronomic Variation by ASCA. Mol. 2021, 26, 3842. [Google Scholar] [CrossRef] [PubMed]
- Montemurro, C.; Miazzi, M.M.; Pasqualone, A.; Fanelli, V.; Sabetta, W.; di Rienzo, V. Traceability of PDO Olive Oil ‘‘Terra di Bari’’ Using High Resolution Melting. J. Chem. 2015, 205, 1–7. [Google Scholar] [CrossRef]
- Di Costanzo, L. Signs of quality and food protected designation of origin. In Law and Food, 1st Edition; Mancuso S., Routledge: London, UK, 2021; pp. 221–236. [Google Scholar]
- Pasqualone, A. Cultivar identification and varietal traceability in processed foods: a molecular approach. In: Cultivars, Carbone K., Nova Biomedical, New York, 2013, 83-105.
- Puchades, R.; Maquieira, A. ELISA Tools for Food PDO Authentication. In: Comprehensive Analytical Chemistry, de la Guardia, M., Gonzálvez, A.; Elsevier, Amsterdam, Nederland, 2013; Volume 60, 145-193. [CrossRef]
- Varga, F.; Carović-Stanko, K.; Ristić, M.; Grdiša, M.; Liber, Z. Morphological and biochemical intraspecific characterization of Ocimum basilicum L. Ind Crops Prod 2017, 109, 611–618. [Google Scholar] [CrossRef]
- Abduche Galvão Pimentel, F.; Altenhofen da Silva, M.; Sartorio de Medeiros, S.D.; Queiroz Luz, J.M.; Sala, F.C. Agronomic, Sensory and Essential Oil Characterization of Basil (Ocimum basilicum L.) Accessions. Hortic. [CrossRef]
- Carović-Stanko, K.; Šalinović, A.; Grdiša, M.; Liber, Z.; Kolak, I.; Šatović, Z. Efficiency of morphological trait descriptors in discrimination of Ocimum basilicum L. accessions. Plant Biosyst 2011, 145, 298–305. [Google Scholar] [CrossRef]
- Werker, E.; Putievsky, E.; Ravid, U.; Dudai, N.; Katzir, I. Glandular Hairs and Essential Oil in Developing Leaves of Ocimum basilicum L. (Lamiaceae). Ann. Bot. 1993, 71, 43–50. [Google Scholar] [CrossRef]
- Pistelli, L.; Ascrizzi, R.; Giuliani, C.; Cervelli, C.; Ruffoni, B.; Princi, E.; Fontanesi, G.; Flamini, G.; Pistelli, L. Growing basil in the underwater biospheres of Nemo's Garden®: Phytochemical, physiological and micromorphological analyses. Sci. Hortic. (Amsterdam) 2020, 259. [Google Scholar] [CrossRef]
- Kaur, J.; Kariyat, R. ; Role of Trichomes in Plant Stress Biology. In: Evolutionary Ecology of Plant-Herbivore Interaction; Núñez-Farfán, J., Valverde, P.L., Springer Nature Switzerland. [CrossRef]
- Passinho-Soares, H.C.; David, J.P.; de Santana, J.R.F.; David, J.M.; de, M. Rodrigues, F.; Mesquita, P.R.R.; de Oliveira, F.S.; Bellintani, M.C. Influence of growth regulators on distribution of trichomes and the production of volatiles in micropropagated plants of Plectranthus ornatus. Rev. Bras. Farmacogn. 2017, 27, 679–690. [Google Scholar] [CrossRef]
- dos Santos Tozin, L.R.; Rodrigues, T.M. Glandular trichomes in the tree-basil (Ocimum gratissimum L., Lamiaceae): Morphological features with emphasis on the cytoskeleton. Flora. [CrossRef]
- Klimánková, E.; Holadová, K.; Hajšlová, J.; Čajka, T.; Poustka, J.; Koudela, M. Aroma profiles of five basil (Ocimum basilicum L.) cultivars grown under conventional and organic conditions. Food Chem. [CrossRef]
- Marotti, M.; Piccaglia, R.; Giovanelli, E. Differences in Essential Oil Composition of Basil (Ocimum basilicum L.) Italian Cultivars Related to Morphological Characteristics. J. Agric. Food Chem. 1996, 44, 3926-3929.
- Boggia, R.; Leardi, R.; Zunin, P.; Bottino, A.; Capannelli, G.; Dehydration of PDO Genovese basil leaves (Ocimum basilicum maximum L. cv Genovese Gigante) by direct osmosis. J. Food Process. Preserv. 2012, 37, 621-629. https://doi.org/10.1111/j.1745-4549.2012.00682.x. [CrossRef]
- Ciriello, M.; Formisano. L.; Graziani, G.; Romano, R.; De Pascale, S.; Rouphael, Y.; Corrado, G. Comparative analysis of aromatic and nutraceutical traits of six basils from Ocimum genus grown in floating raft culture. Sci. Hortic. (Amsterdam) 2023, 322, 112382. [Google Scholar] [CrossRef]
- Patel, M.; Lee, R.; Merchant, E.V.; Juliani, H.R.; Simon, J.E.; Tepper, B.J.; Descriptive aroma profiles of fresh sweet basil cultivars (Ocimum spp. ): Relationship to volatile chemical composition. J. Food Sci. 2021, 86, 3228–3239. [Google Scholar] [CrossRef] [PubMed]
- Wongpraneekul, A.; Havananda, T.; Luengwilai, K. Variation in aroma level of holy basil (Ocimum tenuiflorum L.) leaves is related to volatile composition, but not trichome characteristics. J Appl Res Med Aromat Plants 2022, 27. [Google Scholar] [CrossRef]
- Ciriello, M.; Kyriacou, M.C.; De Pascale, S.; Rouphael, Y. An appraisal of critical factors configuring the composition of basil in minerals, bioactive secondary metabolites, micronutrients and volatile aromatic compounds. J Food Compost Anal 2022, 111, 111. [Google Scholar] [CrossRef]
- Salvadeo, P.; Boggia, R.; Evangelisti, F.; Zunin, P. Analysis of the volatile fraction of “Pesto Genovese” by headspace sorptive extraction (HSSE). Food Chem. 2007, 105, 1228–1235. [Google Scholar] [CrossRef]
- Trantallidi, M.; Dimitroulopoulou, C.; Wolkoff, P.; Kephalopoulos, S.; Carrer, P. EPHECT III: Health risk assessment of exposure to household consumer products. Sci. Total Environ. 2015, 536, 903–913. [Google Scholar] [CrossRef] [PubMed]
- Lenti, L.; Rigano, D.; Woo, S.L.; Nartea, A.; Pacetti, D.; Maggi, F.; Fiorini, D. Rapid Procedure for the Simultaneous Determination of Eugenol, Linalool and Fatty Acid Composition in Basil Leaves. Foods 2022, 11, 3315. [Google Scholar] [CrossRef] [PubMed]
- UPOV. Available online: https://www.upov.int/portal/index.html.en (accessed on 10 July 2024).
- Saran, P.L.; Kalariya, K.A.; Meena, R.P.; Manivel, P. Selection of Dwarf and Compact Morphotypes of Sweet Basil for High Density Plantation. J Plant Physiol Pathol 2018, 6. [Google Scholar] [CrossRef]
- Chieco, C.; Rotondi, A.; Morrone, L.; Rapparini, F.; Baraldi, R. An ethanol-based fixation method for anatomical and micro-morphological characterization of leaves of various tree species. Biotech. Histochem. 2013, 88, 109–119. [Google Scholar] [CrossRef] [PubMed]
- Schneider, C.A.; Rasband,W.S.; Eliceiri, K.W. NIH Image to ImageJ: 25 years of image analysis. Nat. Methods 2012, 9, 671-675.
Figure 1.
LM (a, c, e) and SEM (b, d, f) micrographs of old basil leaves. a-b) a NGT with a warty cuticle located on a vein; c-d) a CGT with a bicellular head (red arrows); e-f) a PGT with four secretory cells (black arrows), sunken in the epidermis. Bar = 50 micron (a), Bar = 30 micron (c,e).
Figure 1.
LM (a, c, e) and SEM (b, d, f) micrographs of old basil leaves. a-b) a NGT with a warty cuticle located on a vein; c-d) a CGT with a bicellular head (red arrows); e-f) a PGT with four secretory cells (black arrows), sunken in the epidermis. Bar = 50 micron (a), Bar = 30 micron (c,e).

Figure 2.
Box-plots of PGTs density on the lower (a) and upper (b) leaf surface for the nine old accessions (CVs) and SL.
Figure 2.
Box-plots of PGTs density on the lower (a) and upper (b) leaf surface for the nine old accessions (CVs) and SL.
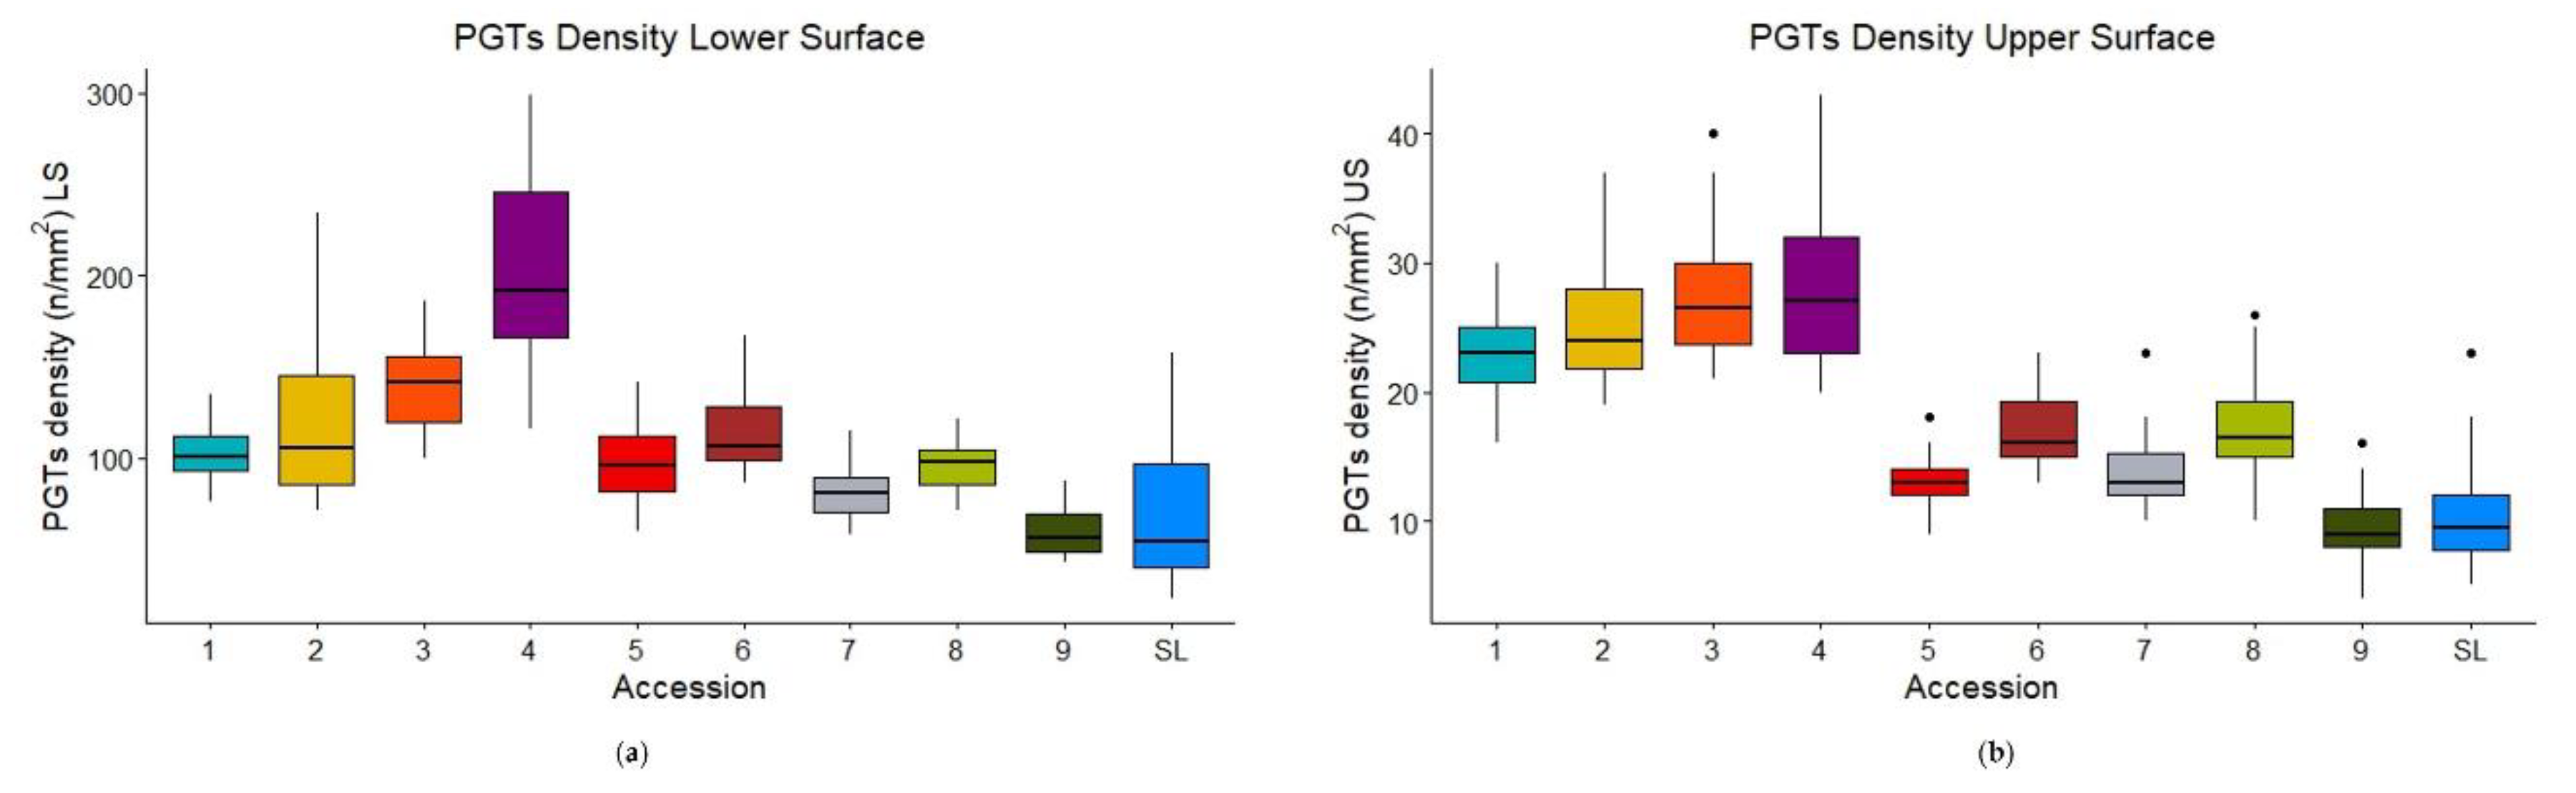
Figure 3.
Box-plots of CGTs density on the lower (a) and upper (b) leaf surface for the nine old accessions (CVs) and SL.
Figure 3.
Box-plots of CGTs density on the lower (a) and upper (b) leaf surface for the nine old accessions (CVs) and SL.
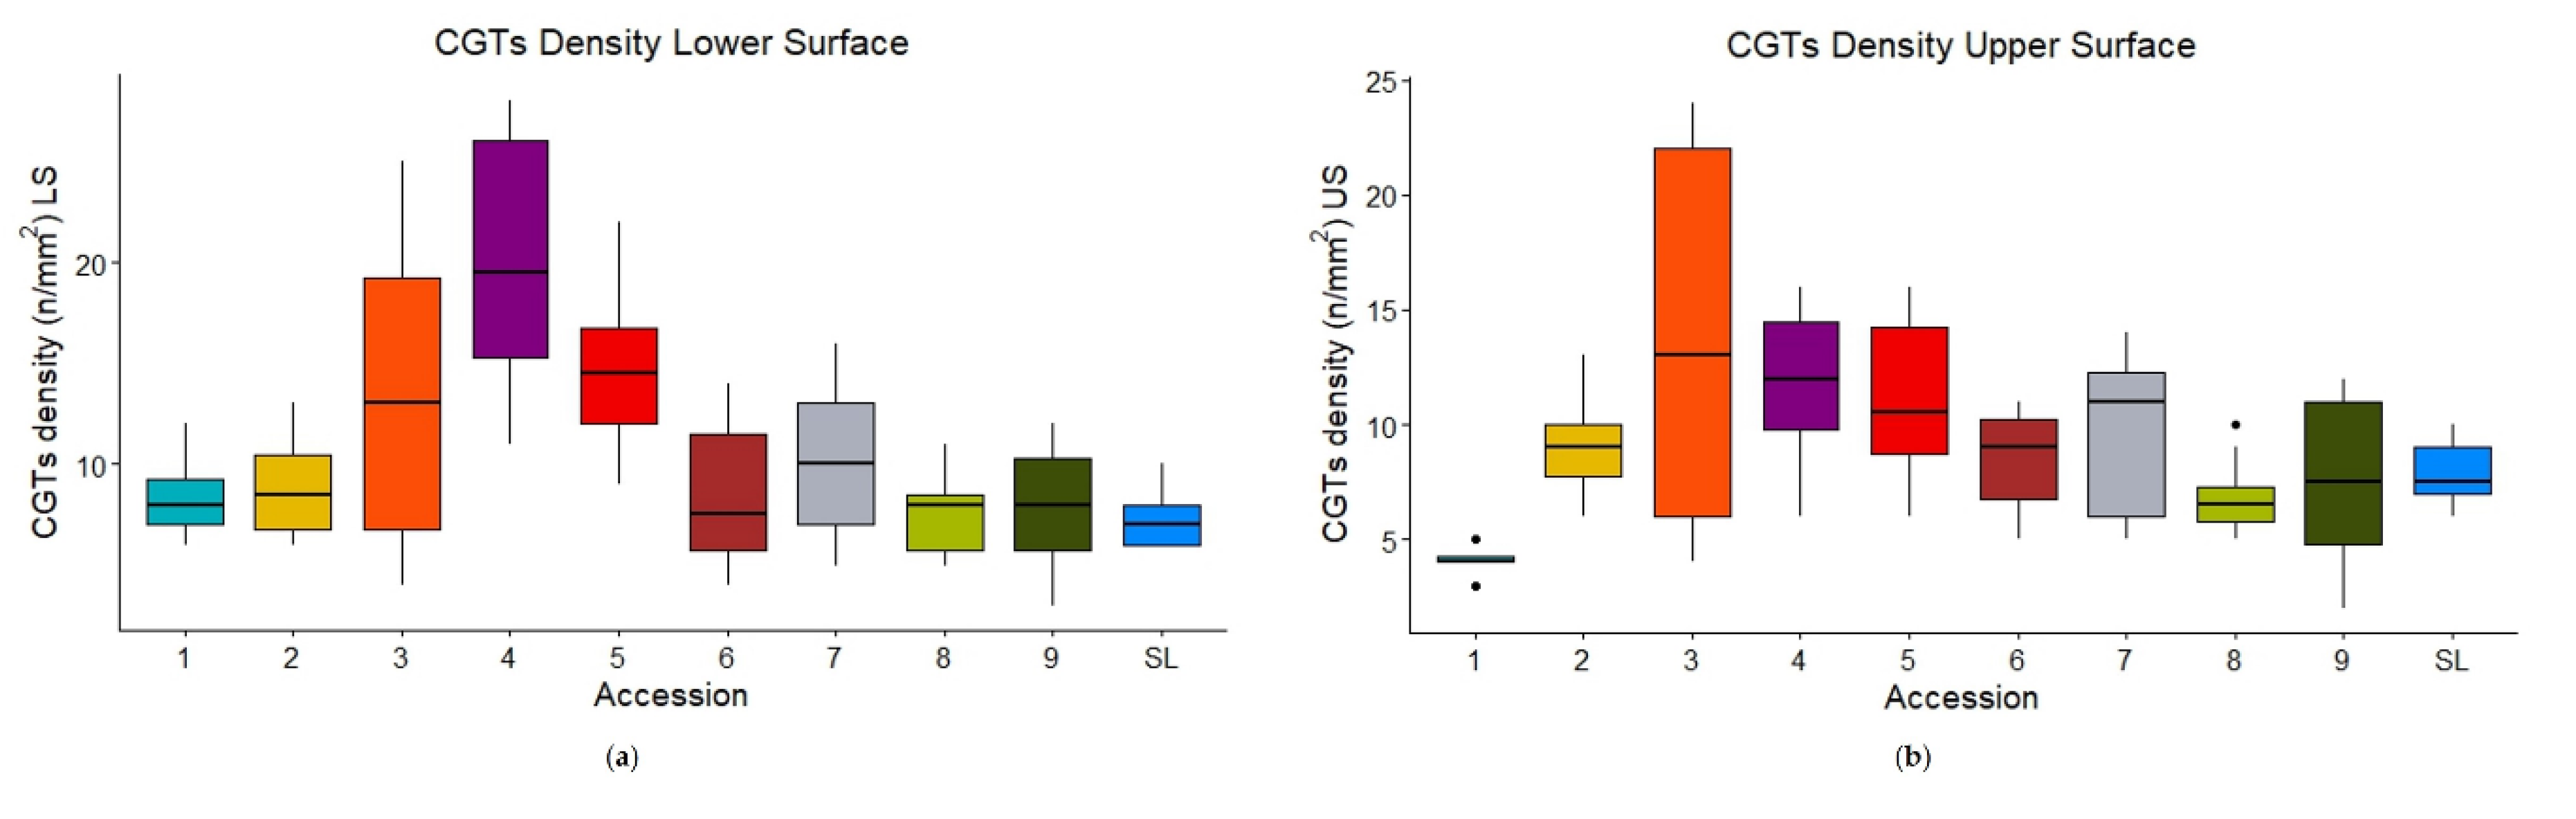
Figure 4.
Box-plots of seeds length (a) and width (b) for the nine old accessions (CVs) and SL.
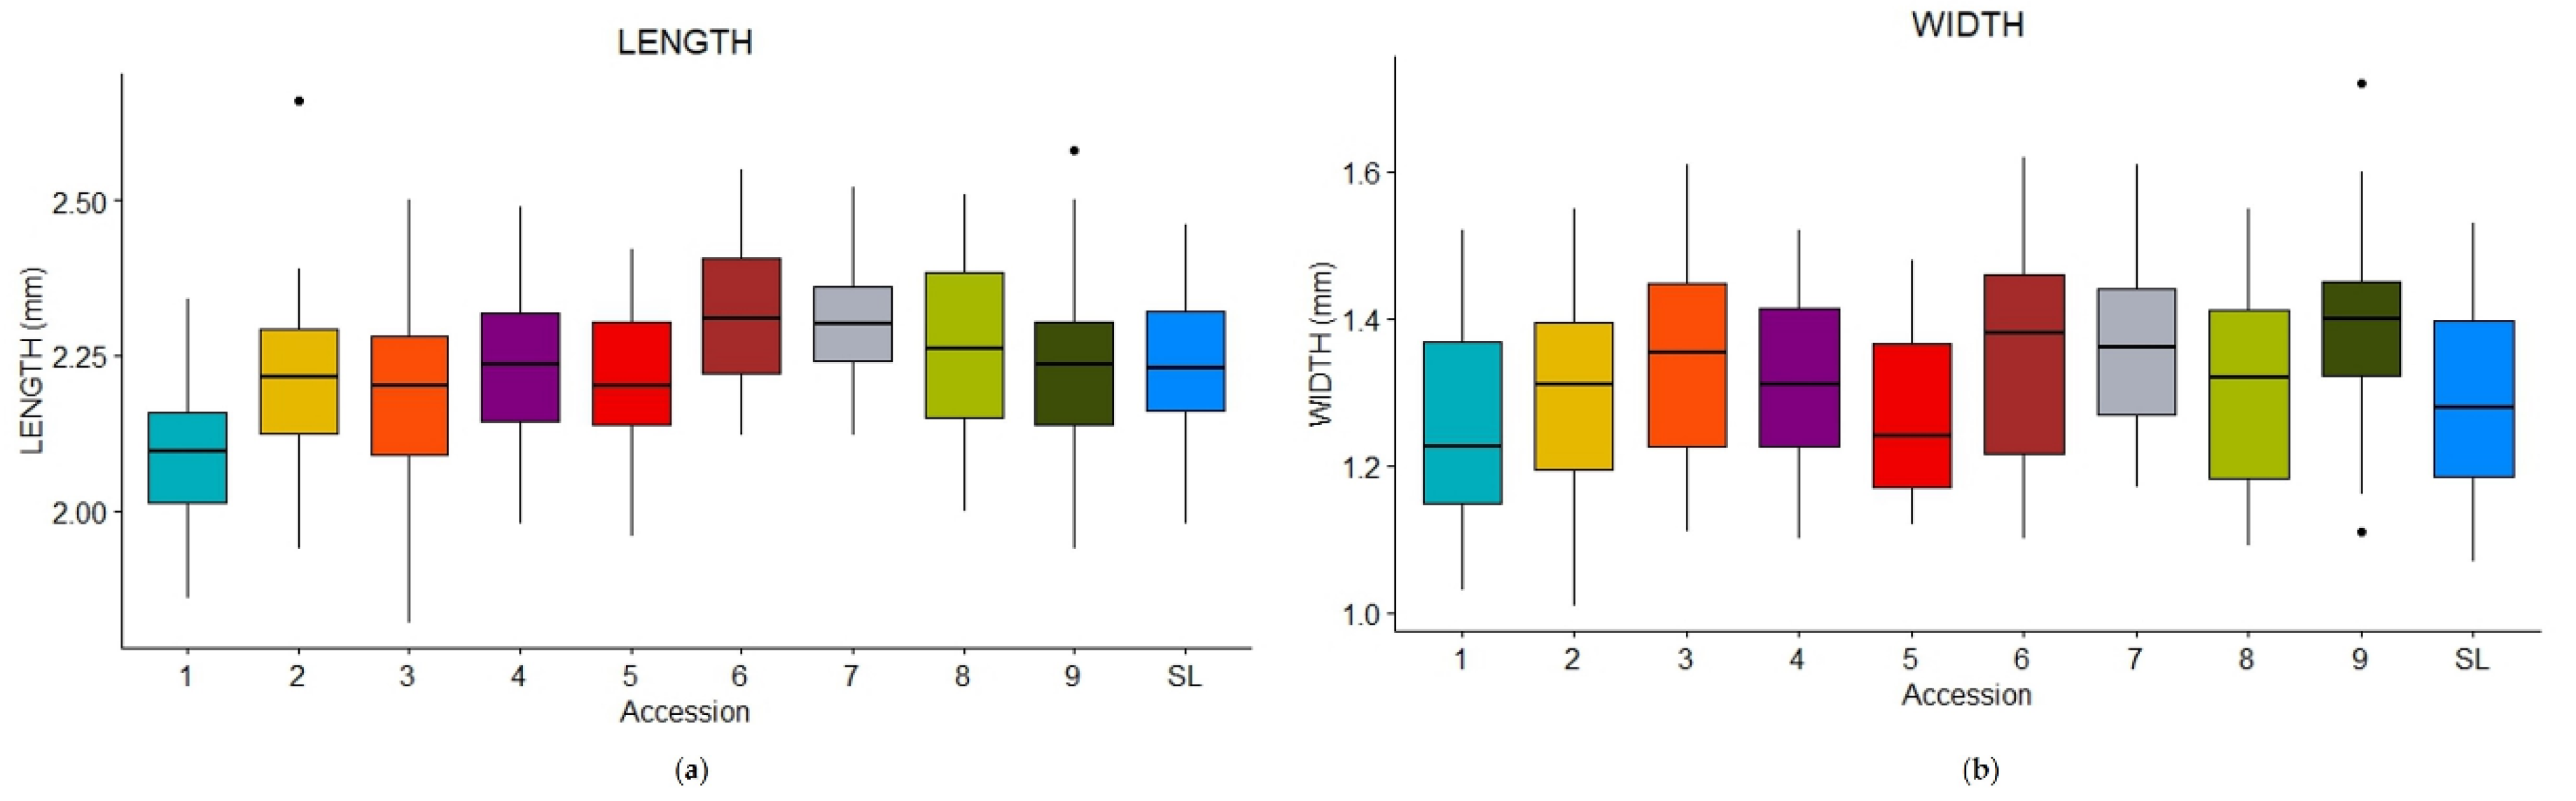
Figure 5.
Seed length and width measurement: comparison between CV1 (a) and CV6 (b).
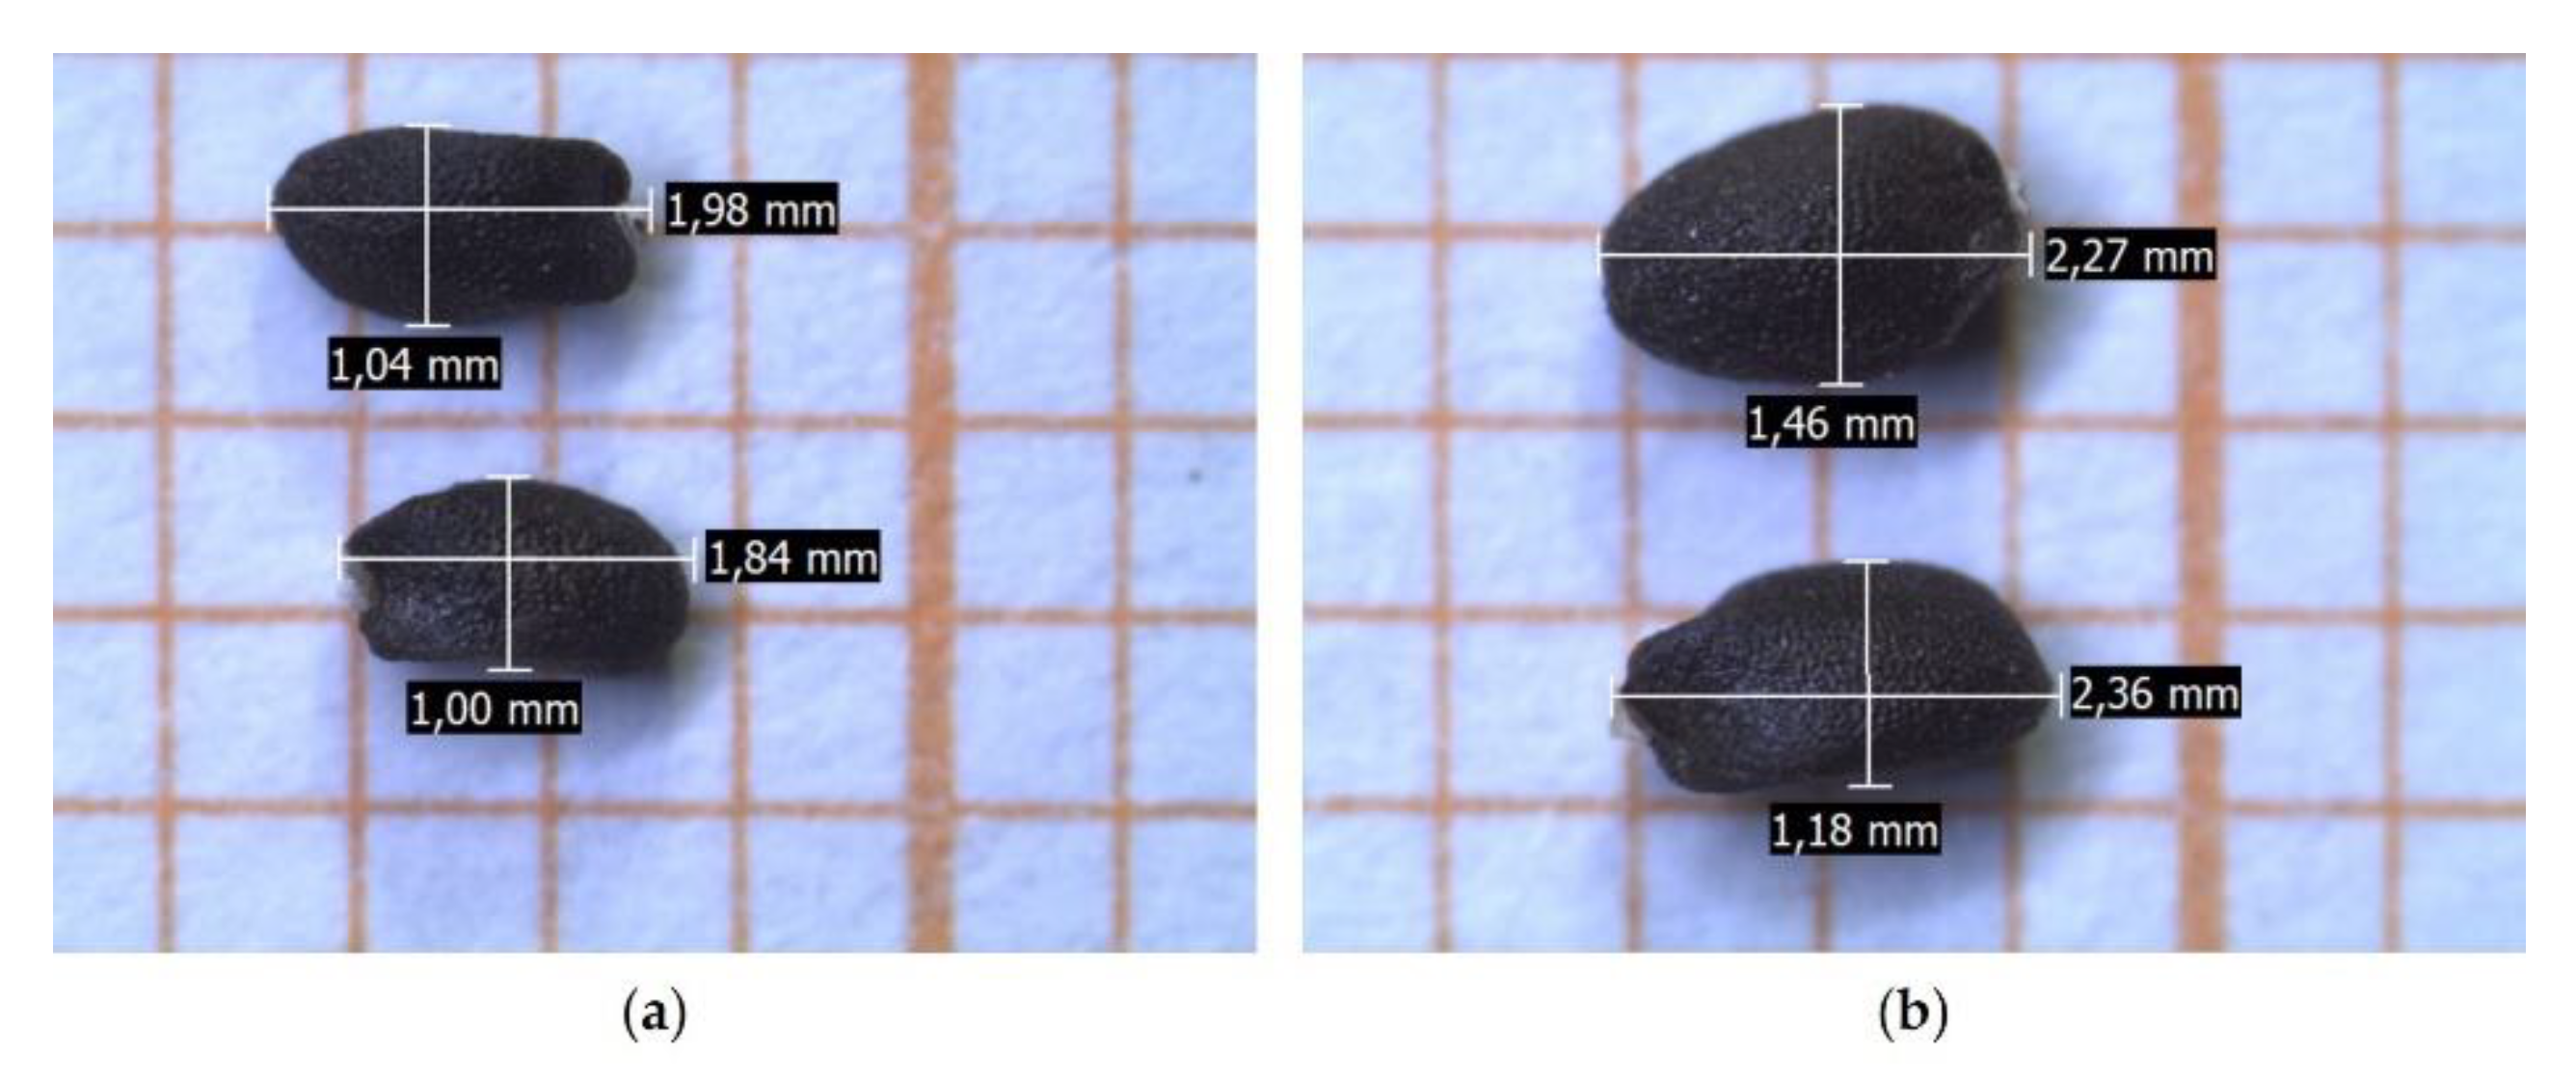
Figure 6.
Dendrogram of the HCA performed on the complete composition of SPME microextraction of the leaves of CV1-9, SL and SP. The dotted line cuts the dendrogram and forms 4 clusters: 1) SP; 2) CV1; 3) CV9, SL, CV2, CV6; 4) CV4, CV5, CV8, CV3 and CV7.
Figure 6.
Dendrogram of the HCA performed on the complete composition of SPME microextraction of the leaves of CV1-9, SL and SP. The dotted line cuts the dendrogram and forms 4 clusters: 1) SP; 2) CV1; 3) CV9, SL, CV2, CV6; 4) CV4, CV5, CV8, CV3 and CV7.
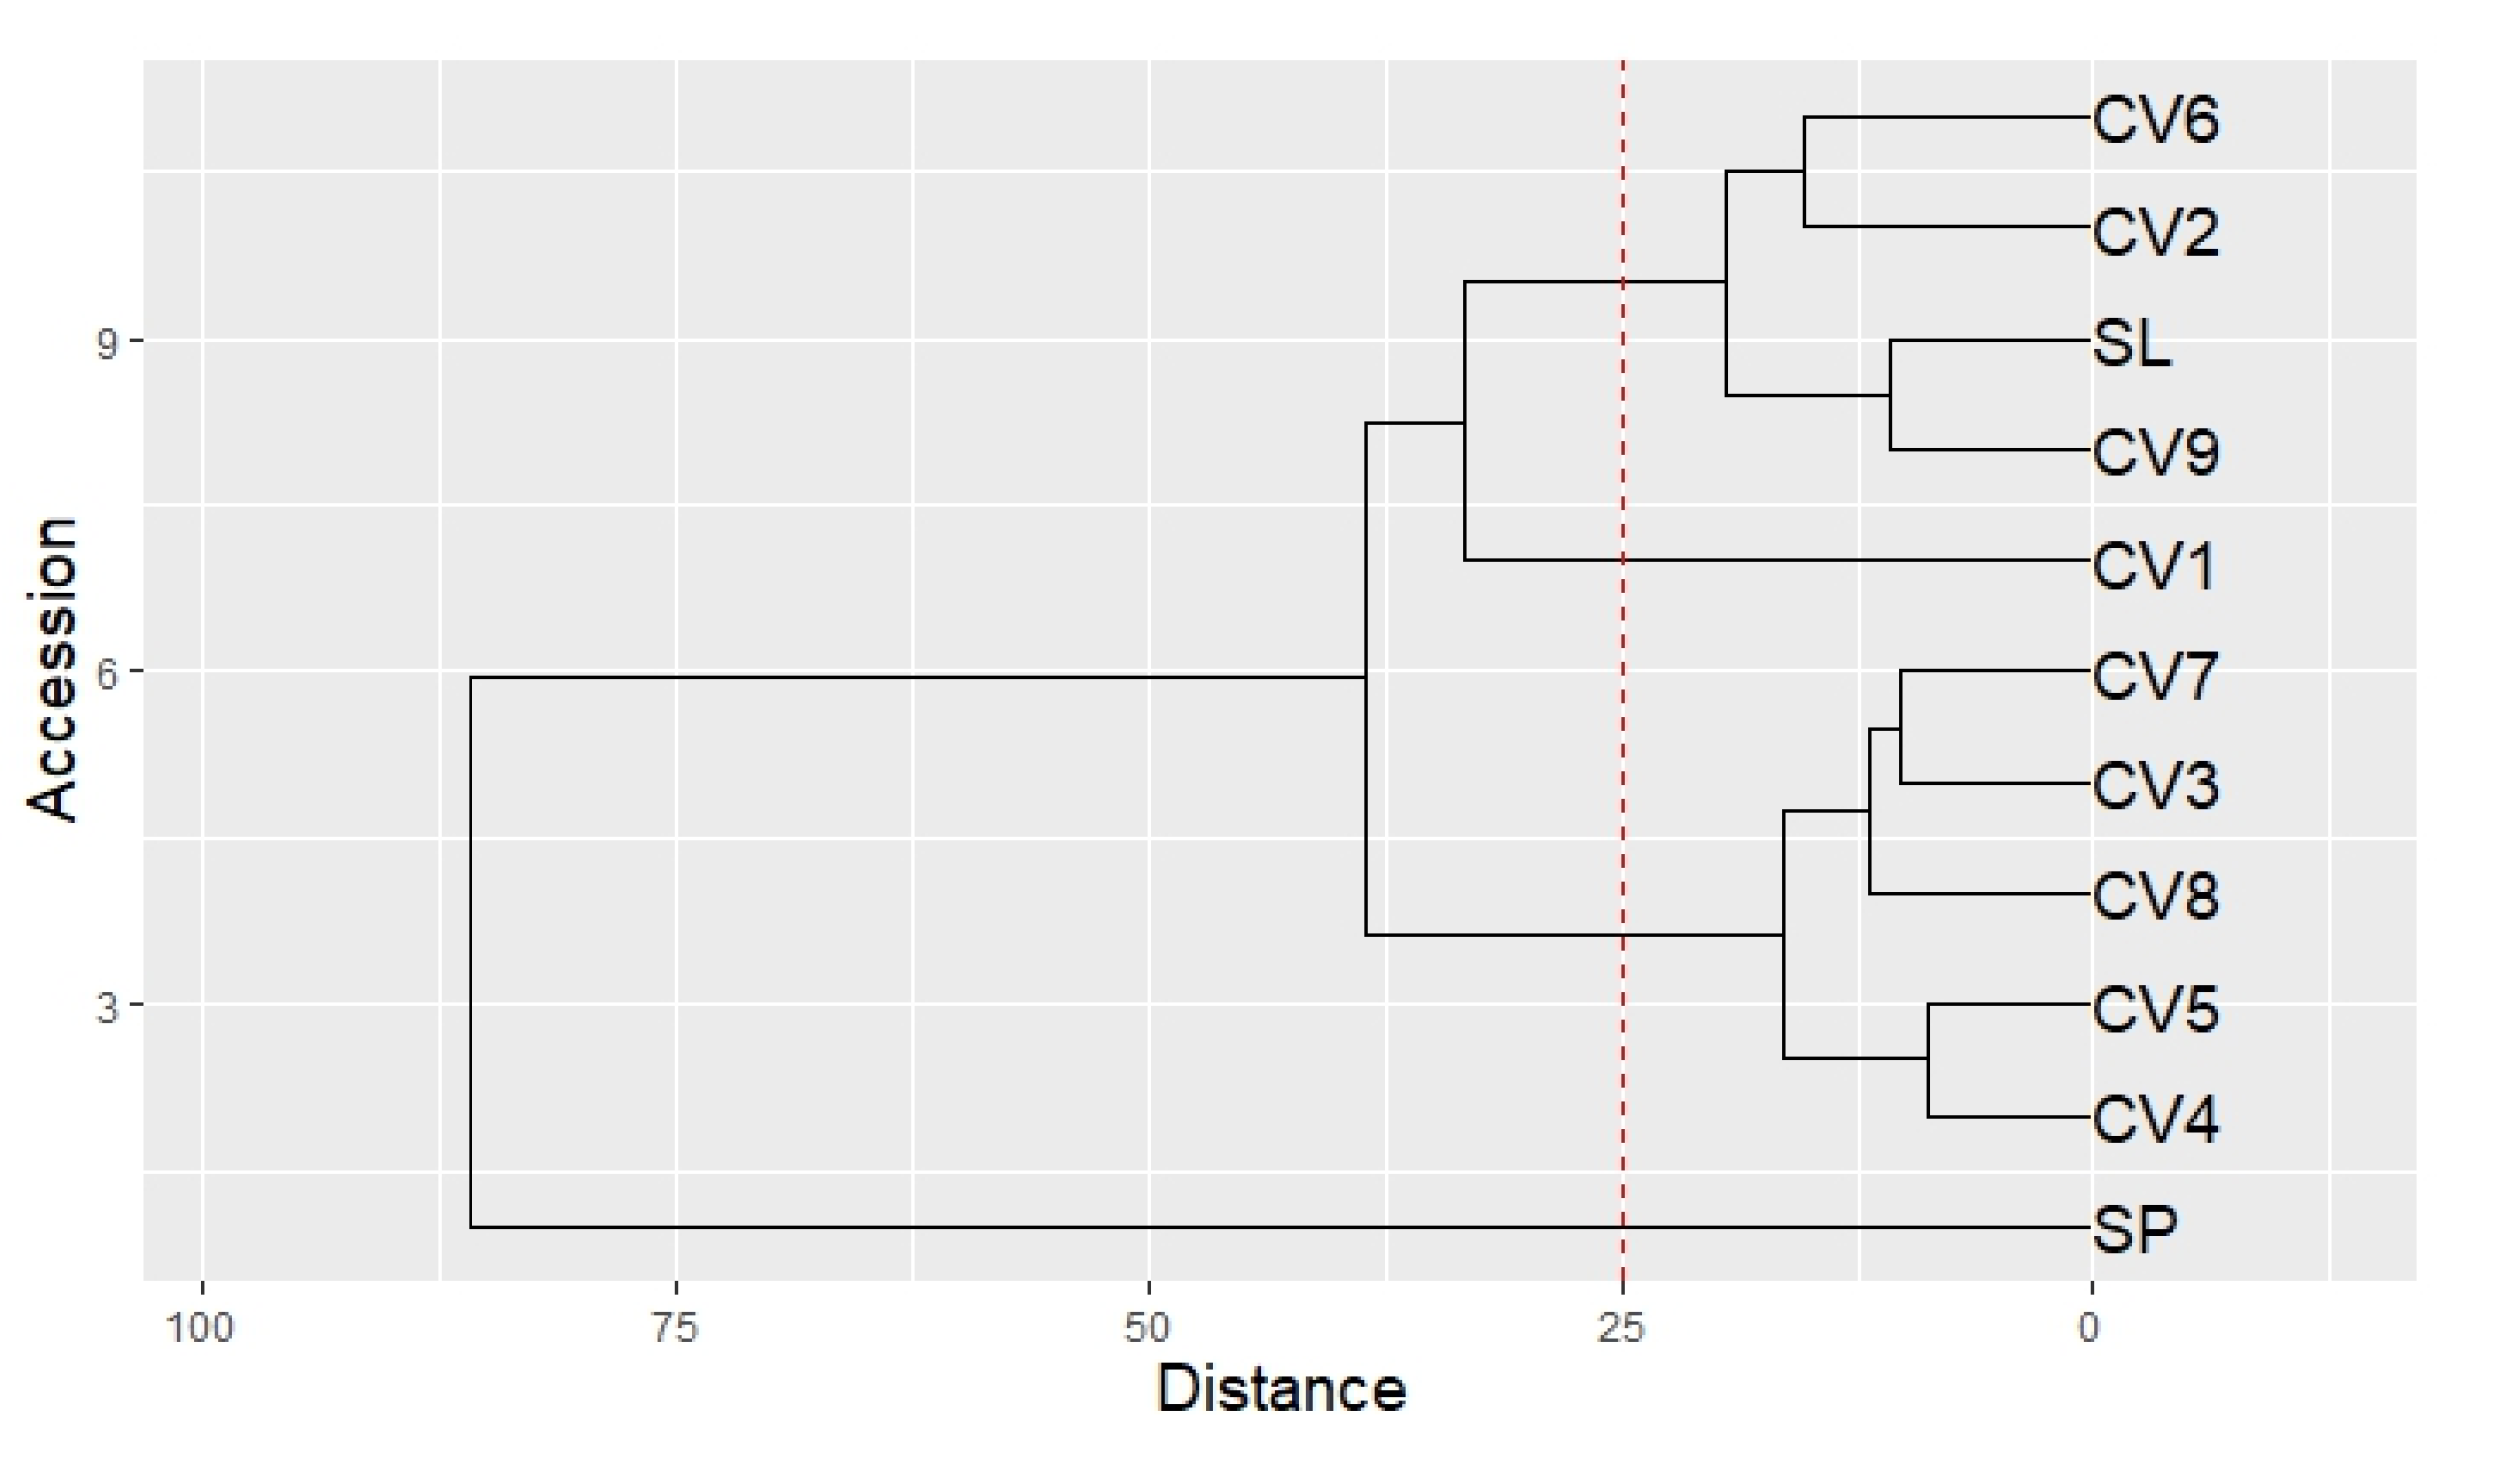
Figure 7.
Greenhouse cultivation of old basil accessions and SL at CeRSAA.
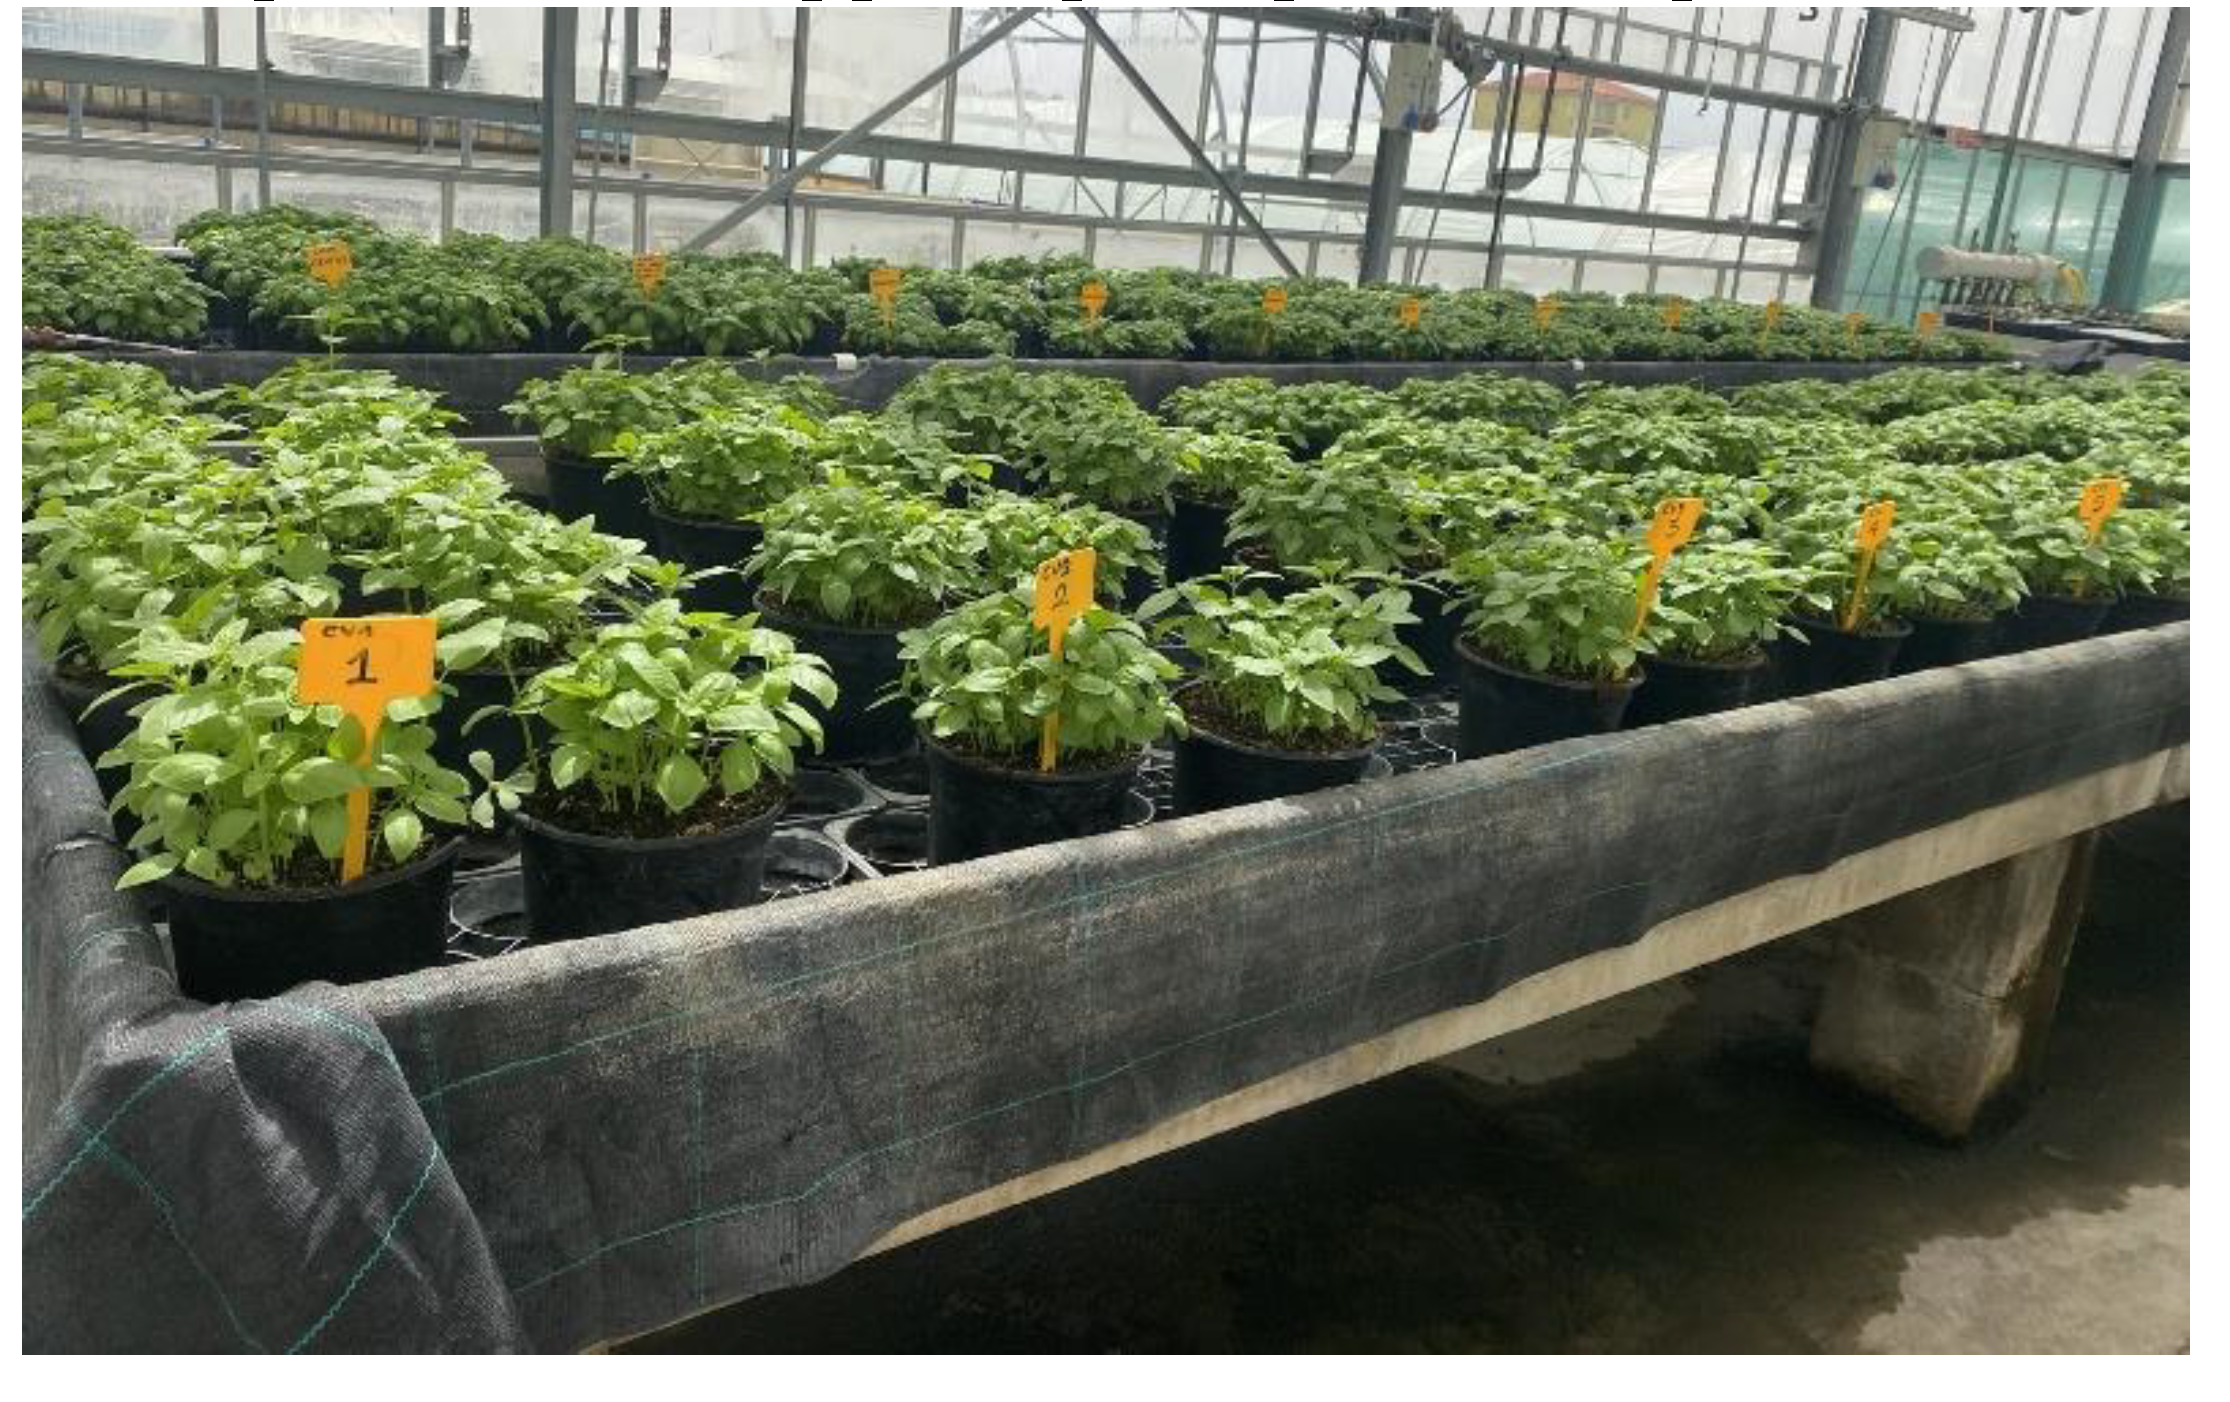
Figure 8.
The third node of a basil plant, from which leaf samples were collected.
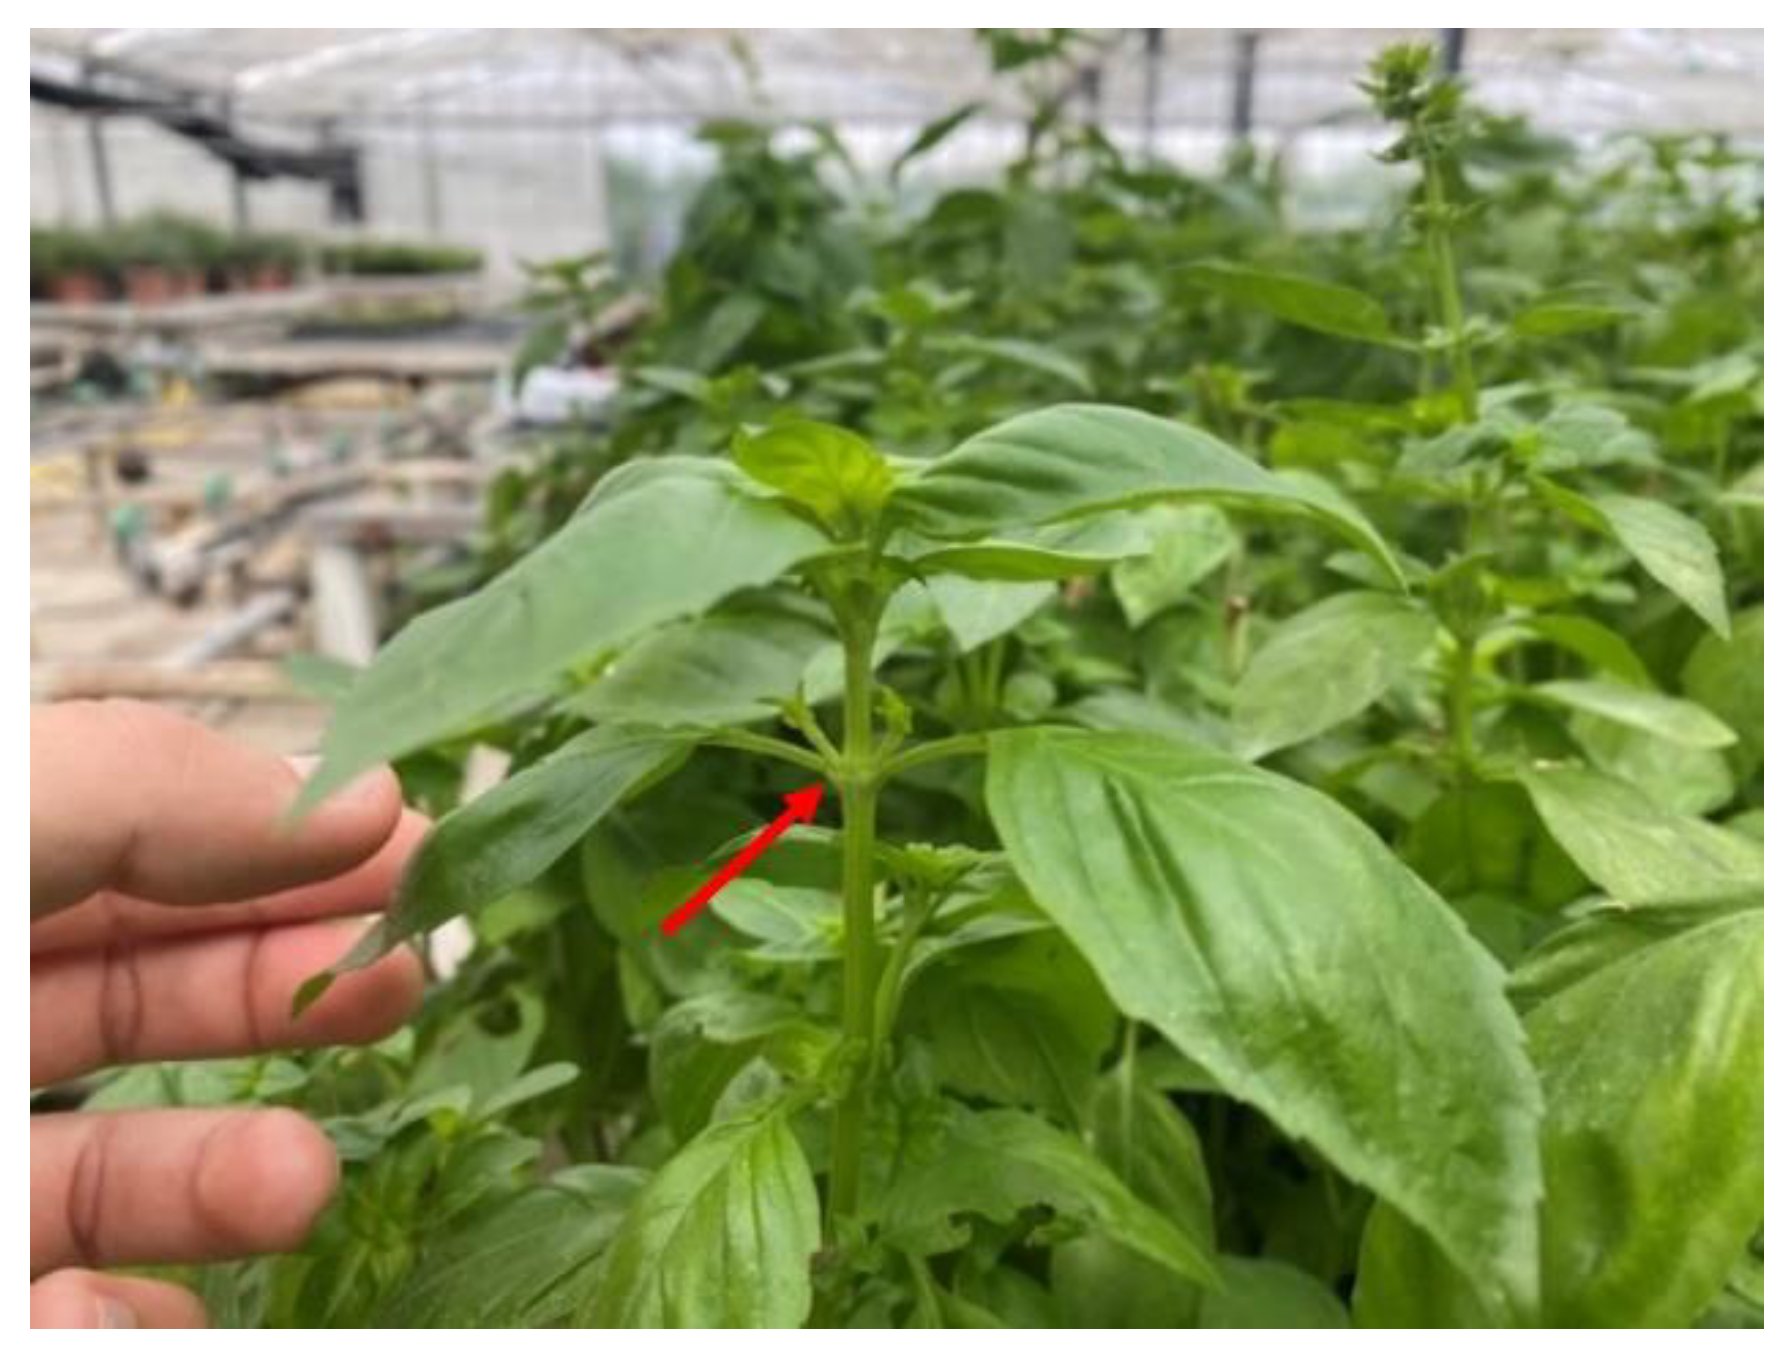
Figure 9.
Lower surface of basil leaf: a) a field of study, with clearly visible PGTs appearing as round, translucent vesicles partially sunken in the epidermis (arrows); b) PGTs count on the same field (each trichome is marked with a red dot).
Figure 9.
Lower surface of basil leaf: a) a field of study, with clearly visible PGTs appearing as round, translucent vesicles partially sunken in the epidermis (arrows); b) PGTs count on the same field (each trichome is marked with a red dot).
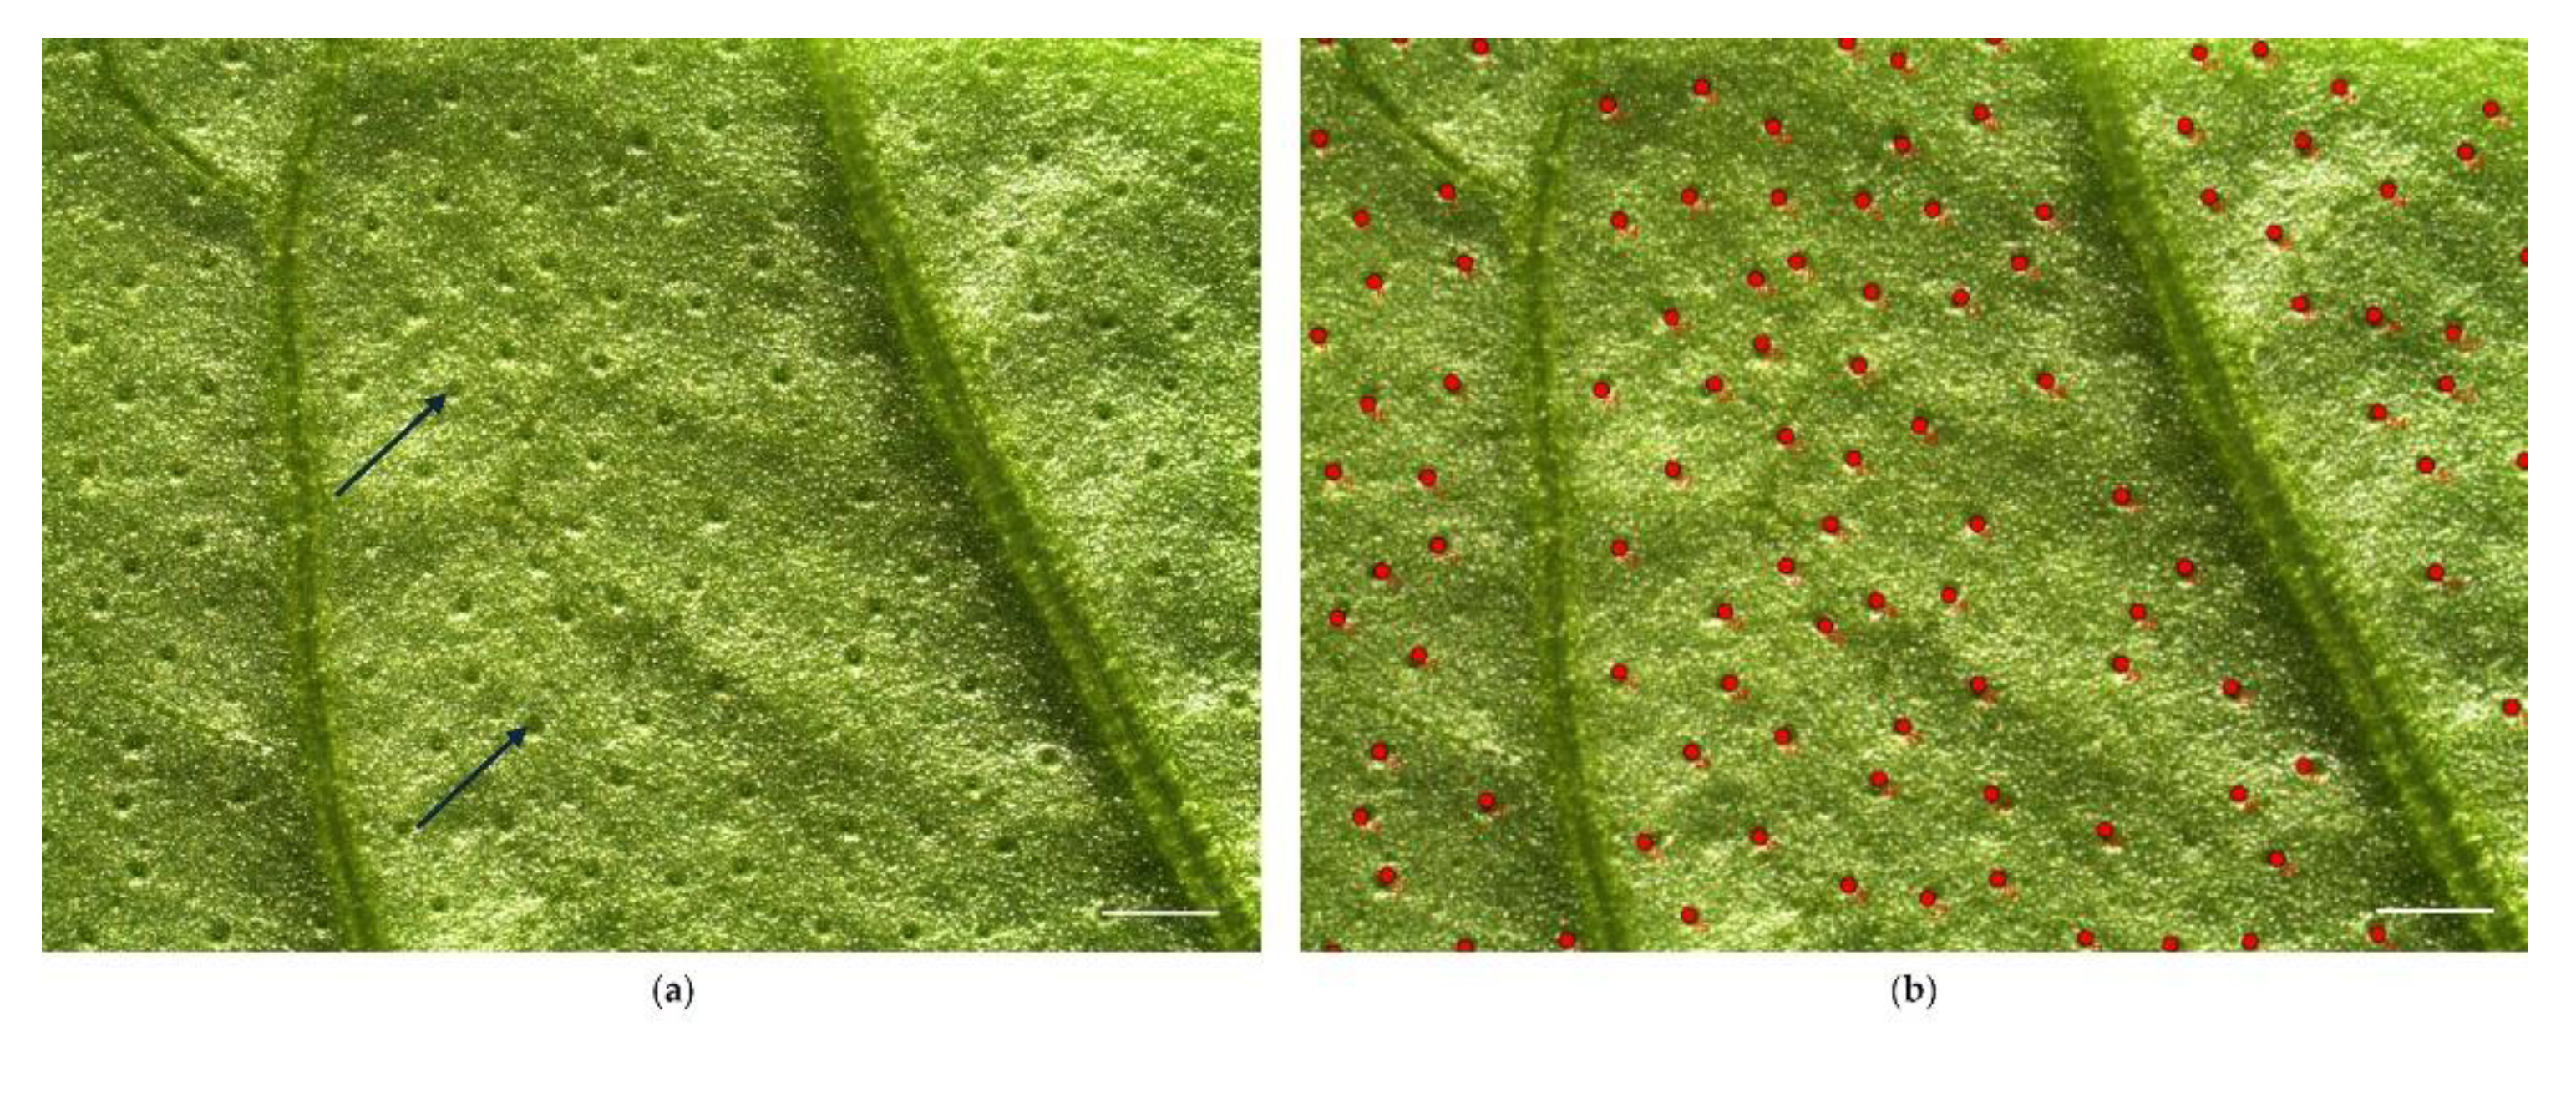
Figure 10.
Lower surface of basil leaf: a) a field of study, with small CGTs (arrows) spread among PGTs; b) CGTs count on the same field (each trichome is marked with a green dot).
Figure 10.
Lower surface of basil leaf: a) a field of study, with small CGTs (arrows) spread among PGTs; b) CGTs count on the same field (each trichome is marked with a green dot).
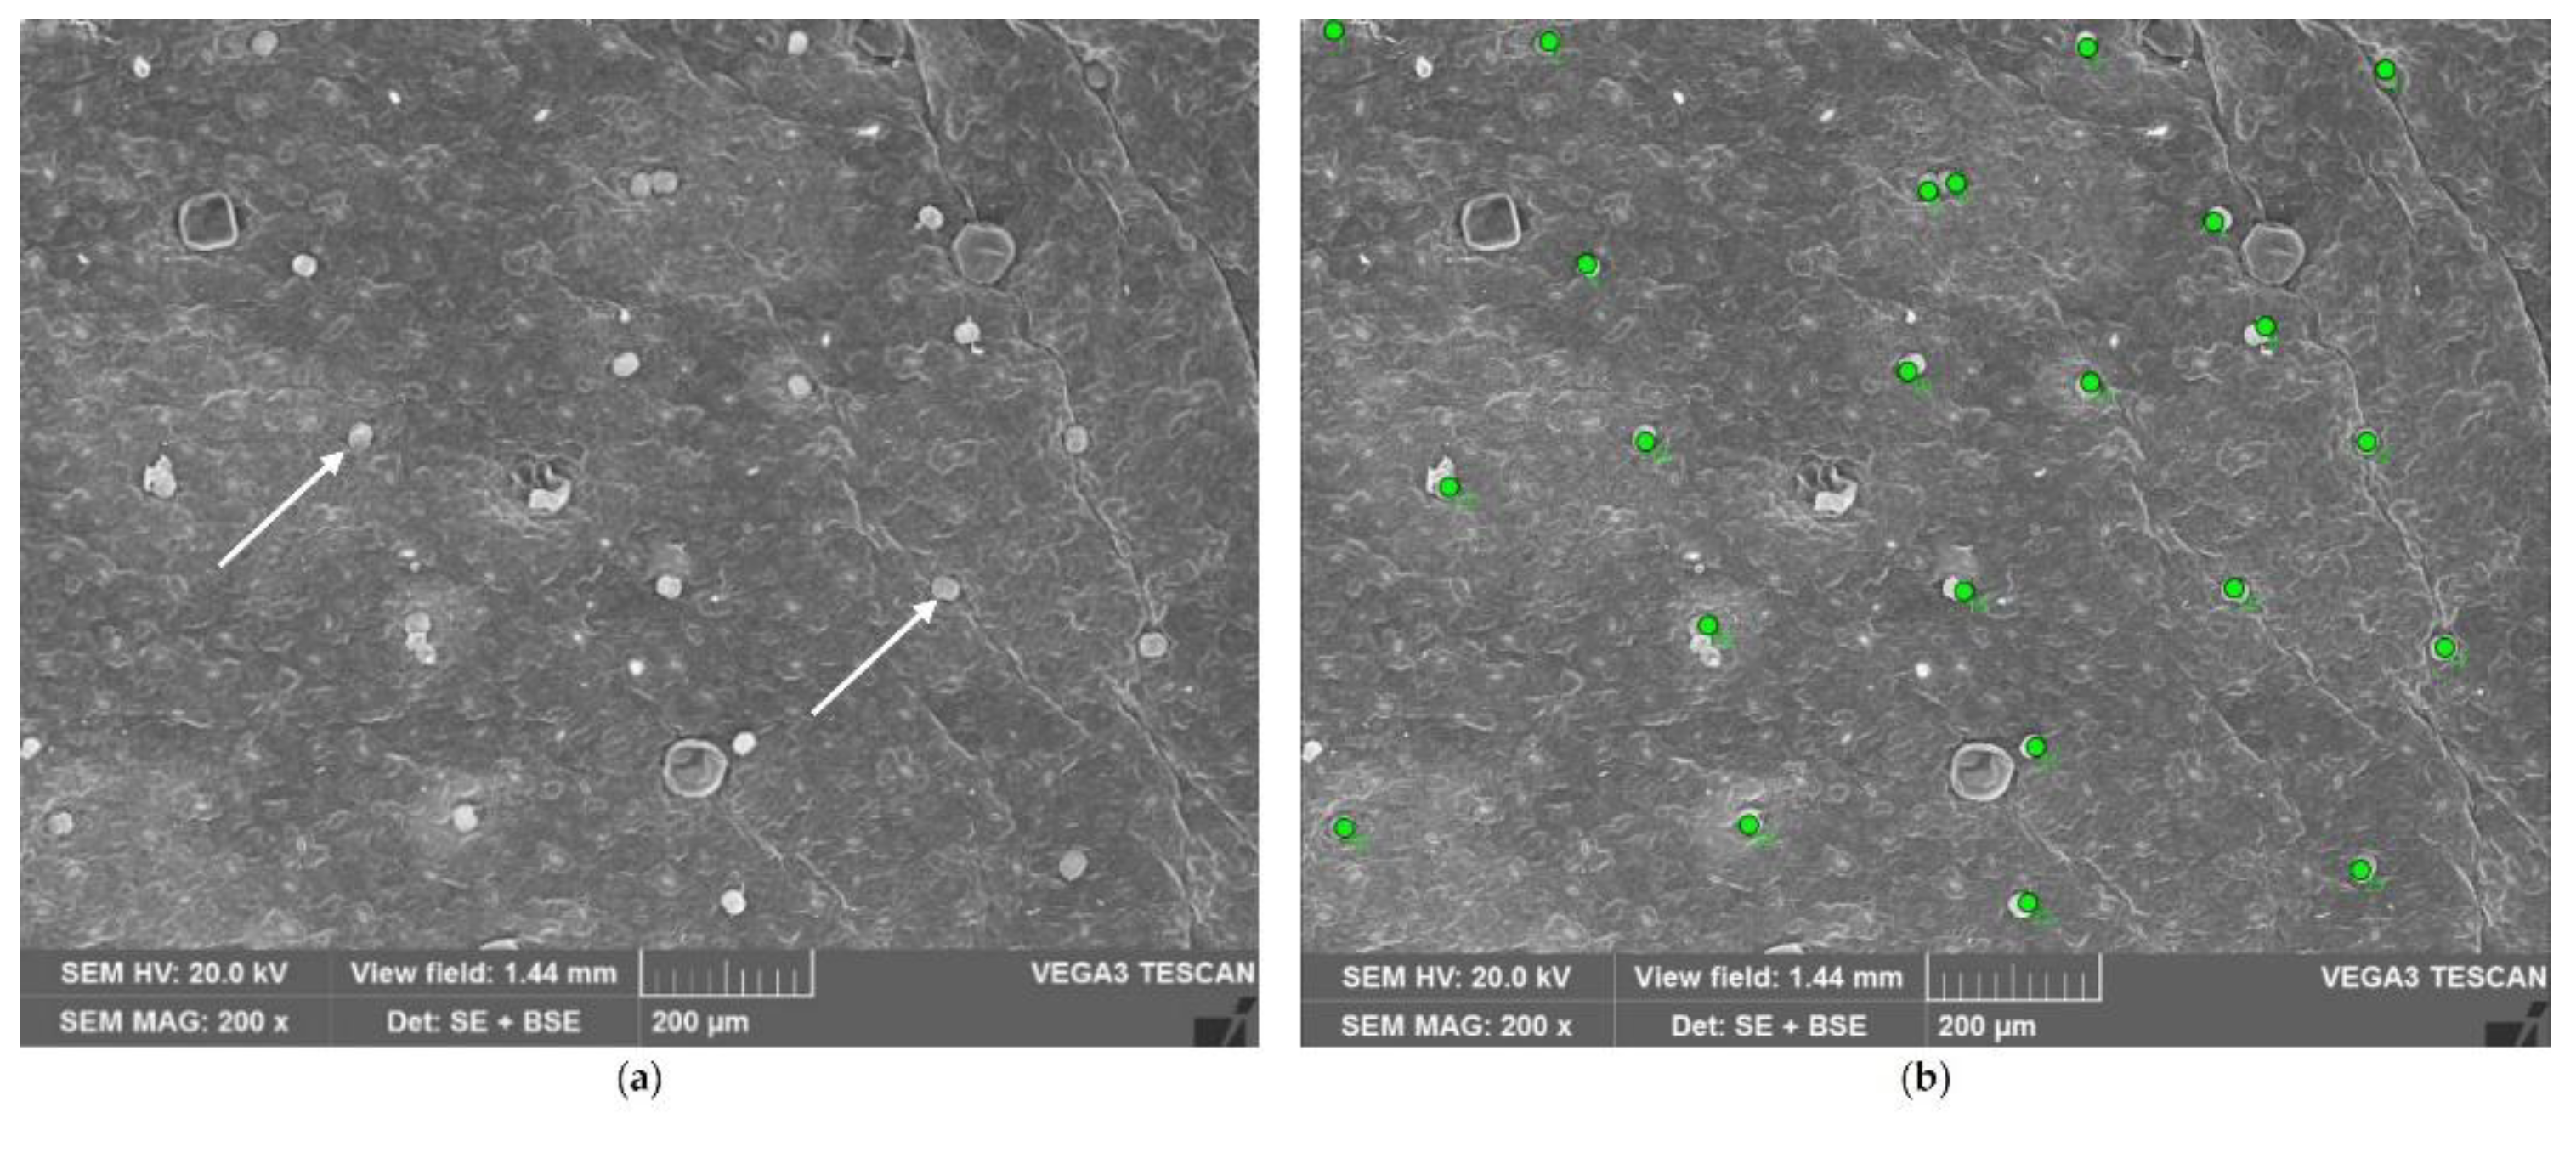
Figure 11.
a) Cleaning of the old basil accessions seeds, b) detail of the seeds under the stereomicroscope (CV4).
Figure 11.
a) Cleaning of the old basil accessions seeds, b) detail of the seeds under the stereomicroscope (CV4).
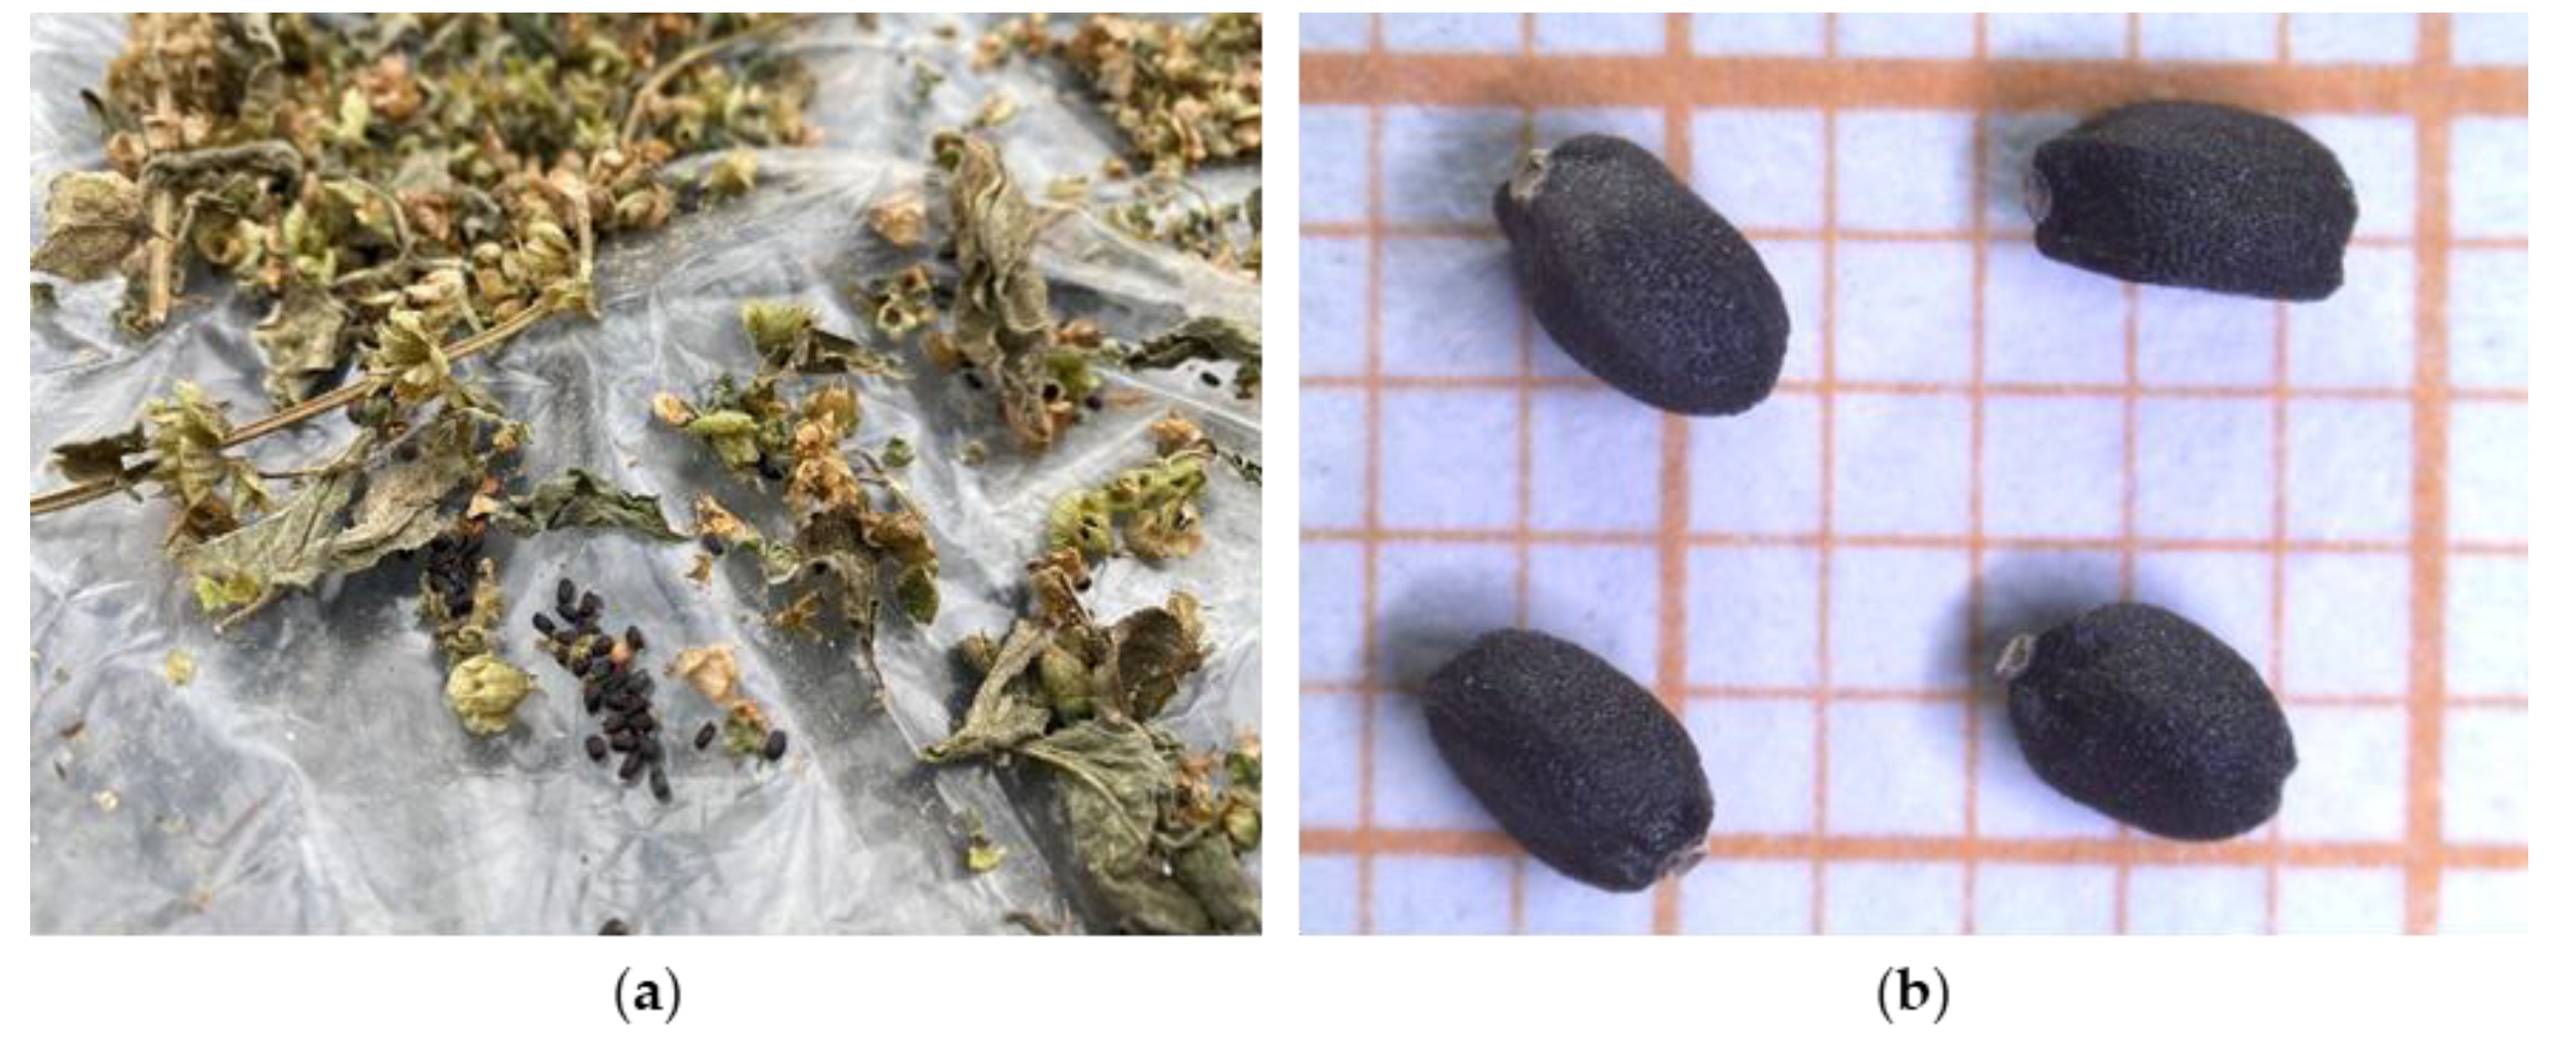

Table 1.
PGTs density of the nine old accessions (CVs) and SL, shown as mean value ± SD, for both lower and upper surface.
Table 1.
PGTs density of the nine old accessions (CVs) and SL, shown as mean value ± SD, for both lower and upper surface.
| Accession (CV) | PGTs density (n/mm2) | |
|---|---|---|
| Lower surface | Upper surface | |
| Mean ± SD | Mean ± SD | |
| 1 | 103.0 ± 14.0 | 23.0 ± 3.09 |
| 2 | 121.0 ± 44.7 | 25.6 ± 5.16 |
| 3 | 141.0 ± 24.9 | 27.3 ± 4.77 |
| 4 | 205.0 ± 52.3 | 27.8 ± 5.99 |
| 5 | 97.0 ± 20.6 | 13.1 ± 2.14 |
| 6 | 114.0 ± 21.9 | 17.1 ± 2.84 |
| 7 | 80.6 ± 12.8 | 13.7 ± 2.61 |
| 8 | 95.4 ± 13.6 | 17.2 ± 3.71 |
| 9 | 59.6 ± 12.8 | 9.5 ± 2.36 |
| SL | 68.2 ± 36.4 | 10.2 ± 3.81 |
| ANOVA F-value | 75.72 | 119.2 |
| ANOVA p-value | <0.001 | <0.001 |
Table 2.
CGTs density of the old nine accessions (CVs) and SL, shown as mean value ± SD, for both lower and upper surface.
Table 2.
CGTs density of the old nine accessions (CVs) and SL, shown as mean value ± SD, for both lower and upper surface.
| Accession (CV) | CGTs density (n/mm2) | |
|---|---|---|
| Lower surface | Upper surface | |
| Mean ± SD | Mean ± SD | |
| 1 | 8.5 ± 1.78 | 4.08 ± 0.669 |
| 2 | 9 ± 2.63 | 8.92 ± 2.15 |
| 3 | 13.3 ± 7.60 | 13.7 ± 8.22 |
| 4 | 20 ± 5.92 | 11.9 ± 3.29 |
| 5 | 15 ± 4.26 | 11 ± 3.62 |
| 6 | 8.58 ± 3.60 | 8.5 ± 2.28 |
| 7 | 10 ± 3.74 | 9.75 ± 3.39 |
| 8 | 7.58 ± 2.07 | 6.75 ± 1.60 |
| 9 | 7.83 ± 3.10 | 7.5 ± 3.71 |
| SL | 7.25 ± 1.22 | 7.75 ± 1.29 |
| Kruskal-Wallis statistic | 46.717 | 45.072 |
| Kruskal-Wallis p-value | <0.001 | <0.001 |
Table 3.
Length and width of the seeds of the nine old accessions (CVs) and SL, shown as mean value ± SD.
Table 3.
Length and width of the seeds of the nine old accessions (CVs) and SL, shown as mean value ± SD.
| Seeds | ||
|---|---|---|
| Accession (CV) | Length (mm) | Width (mm) |
| Mean ± SD | Mean ± SD | |
| 1 | 2.10 ± 0.122 | 1.25 ± 0.137 |
| 2 | 2.22 ± 0.137 | 1.30 ± 0.134 |
| 3 | 2.20 ± 0.156 | 1.35 ± 0.137 |
| 4 | 2.23 ± 0.114 | 1.32 ± 0.112 |
| 5 | 2.21 ± 0.114 | 1.27 ± 0.115 |
| 6 | 2.32 ± 0.114 | 1.34 ± 0.143 |
| 7 | 2.31 ± 0.097 | 1.36 ± 0.124 |
| 8 | 2.26 ± 0.134 | 1.31 ± 0.138 |
| 9 | 2.24 ± 0.147 | 1.39 ± 0.124 |
| SL | 2.24 ± 0.119 | 1.29 ± 0.127 |
| ANOVA F-value | 7.220 | 3.245 |
| ANOVA p-value | <0.001 | <0.001 |
Table 4.
VOCs identified in CV1-9, SL and SP, expressed as mg/kg. In bold are showed the chemical compounds which differed mostly among CVs.
Table 4.
VOCs identified in CV1-9, SL and SP, expressed as mg/kg. In bold are showed the chemical compounds which differed mostly among CVs.
| Compound | CV1 | CV2 | CV3 | CV4 | CV5 | CV6 | CV7 | CV8 | CV9 | SL | SP |
| (+)-Aromadendrene | 0,538 | 0,390 | 0,689 | 0,690 | 0,553 | 0,607 | 0,938 | 0,983 | 0,427 | 0,446 | 0,785 |
| (+)-Epi-bicyclosesquiphellandrene | 0,000 | 0,306 | 0,906 | 0,669 | 0,756 | 1,029 | 0,754 | 1,218 | 0,542 | 0,650 | 0,946 |
| (+)-trans-Chrysanthenyl Acetate | 0,000 | 0,000 | 0,000 | 0,004 | 0,004 | 0,003 | 0,004 | 0,004 | 0,003 | 0,019 | 0,000 |
| (-)-Myrtenyl acetate | 0,009 | 0,014 | 0,020 | 0,020 | 0,018 | 0,017 | 0,018 | 0,021 | 0,016 | 0,019 | 0,000 |
| 1-(2-Furyl)-2-pentanone | 0,022 | 0,014 | 0,039 | 0,020 | 0,018 | 0,017 | 0,018 | 0,009 | 0,016 | 0,004 | 0,000 |
| 1,2-Dihydrolinalool | 0,043 | 0,042 | 0,059 | 0,061 | 0,074 | 0,051 | 0,037 | 0,064 | 0,049 | 0,037 | 0,000 |
| 2-Hydroxycineol | 0,000 | 0,000 | 0,000 | 0,000 | 0,000 | 0,000 | 0,000 | 0,000 | 0,000 | 0,000 | 0,023 |
| 2-Oxo-1,8-cineole | 0,043 | 0,028 | 0,039 | 0,020 | 0,037 | 0,017 | 0,037 | 0,043 | 0,033 | 0,037 | 0,069 |
| 2,4-Hexadienal | 0,022 | 0,014 | 0,020 | 0,020 | 0,000 | 0,000 | 0,000 | 0,009 | 0,005 | 0,000 | 0,000 |
| 3-Carene | 0,129 | 0,056 | 0,098 | 0,061 | 0,092 | 0,067 | 0,037 | 0,085 | 0,082 | 0,093 | 0,115 |
| 3-Octanol | 0,000 | 0,000 | 0,000 | 0,000 | 0,000 | 0,202 | 0,037 | 0,085 | 0,066 | 0,074 | 0,069 |
| 3-Octenol | 0,301 | 0,348 | 0,217 | 0,081 | 0,111 | 0,236 | 0,276 | 0,256 | 0,378 | 0,223 | 0,669 |
| 3-Octanone | 0,000 | 0,042 | 0,177 | 0,101 | 0,129 | 0,000 | 0,092 | 0,299 | 0,164 | 0,037 | 0,231 |
| 3-Thujene | 0,086 | 0,070 | 0,079 | 0,061 | 0,055 | 0,051 | 0,037 | 0,043 | 0,049 | 0,056 | 0,069 |
| 3,7-Dimethyl-1-octene | 0,000 | 0,000 | 0,000 | 0,000 | 0,000 | 0,000 | 0,000 | 0,000 | 0,000 | 0,093 | 0,000 |
| 4-Terpineol | 1,184 | 0,279 | 0,650 | 0,243 | 0,683 | 0,101 | 0,074 | 0,043 | 0,230 | 0,093 | 0,000 |
| Acoradiene | 0,129 | 0,139 | 0,295 | 0,203 | 0,129 | 0,270 | 0,258 | 0,278 | 0,131 | 0,186 | 0,000 |
| Borneol | 0,172 | 0,460 | 0,236 | 0,649 | 0,553 | 0,489 | 0,405 | 0,192 | 0,673 | 0,483 | 0,000 |
| Bornyl Acetate | 1,615 | 0,000 | 0,000 | 0,000 | 0,000 | 0,000 | 0,000 | 0,000 | 0,000 | 0,000 | 0,000 |
| Camphene | 0,043 | 0,084 | 0,098 | 0,061 | 0,055 | 0,051 | 0,037 | 0,043 | 0,049 | 0,074 | 0,092 |
| Camphor | 2,541 | 0,864 | 1,792 | 1,704 | 1,015 | 1,164 | 1,159 | 1,047 | 1,182 | 1,244 | 3,531 |
| Caryophyllene | 0,861 | 0,529 | 0,807 | 0,710 | 0,572 | 0,826 | 0,699 | 1,133 | 0,640 | 0,762 | 1,846 |
| Chavicol | 0,043 | 0,028 | 0,020 | 0,041 | 0,018 | 0,017 | 0,018 | 0,043 | 0,016 | 0,037 | 0,023 |
| cis 3-Hexen-1-ol | 0,000 | 0,000 | 0,138 | 0,000 | 0,166 | 0,000 | 0,000 | 0,000 | 0,000 | 0,000 | 0,069 |
| cis α-Bergamotene | 13,544 | 14,097 | 18,156 | 20,850 | 18,134 | 12,177 | 23,711 | 18,463 | 13,481 | 19,874 | 11,610 |
| cis-allo-Ocimene | 0,022 | 0,028 | 0,039 | 0,041 | 0,037 | 0,051 | 0,055 | 0,000 | 0,049 | 0,019 | 0,000 |
| cis-Geraniol | 0,000 | 0,000 | 0,000 | 0,000 | 0,000 | 0,000 | 0,000 | 0,000 | 0,000 | 0,019 | 0,000 |
| cis-β-Ocimene | 2,627 | 2,452 | 3,072 | 2,799 | 1,992 | 2,479 | 2,115 | 2,222 | 1,741 | 1,932 | 2,285 |
| cis Methyl p-methoxycinnamate | 0,108 | 0,000 | 0,000 | 0,000 | 0,000 | 0,000 | 0,000 | 0,000 | 0,000 | 0,093 | 0,069 |
| cis-Pinen-3-ol | 0,000 | 0,000 | 0,039 | 0,020 | 0,018 | 0,017 | 0,018 | 0,021 | 0,000 | 0,019 | 0,023 |
| m-cymene | 0,043 | 0,028 | 0,039 | 0,020 | 0,055 | 0,034 | 0,018 | 0,000 | 0,016 | 0,037 | 0,023 |
| Copaene | 0,000 | 0,000 | 0,000 | 0,000 | 0,000 | 0,000 | 0,000 | 0,000 | 0,000 | 0,000 | 0,000 |
| Cubenol | 0,775 | 0,432 | 0,827 | 0,974 | 0,922 | 1,349 | 0,865 | 1,624 | 0,772 | 0,836 | 0,923 |
| Eremophylene | 0,000 | 0,000 | 0,000 | 0,000 | 0,000 | 0,000 | 0,000 | 0,000 | 0,000 | 0,000 | 0,000 |
| Eucalyptol | 27,905 | 16,228 | 18,944 | 15,921 | 14,961 | 12,295 | 15,231 | 16,262 | 15,320 | 14,191 | 16,965 |
| Eugenol | 58,502 | 32,373 | 39,069 | 51,415 | 46,784 | 39,753 | 39,476 | 44,127 | 44,153 | 50,986 | 37,714 |
| Farnesol | 0,237 | 0,042 | 0,059 | 0,041 | 0,055 | 0,051 | 0,037 | 0,043 | 0,066 | 0,074 | 0,046 |
| Fenchyl acetate | 0,000 | 0,028 | 0,000 | 0,000 | 0,000 | 0,000 | 0,000 | 0,000 | 0,000 | 0,000 | 0,000 |
| Fenchone | 0,000 | 0,167 | 0,000 | 0,000 | 0,000 | 0,000 | 0,000 | 0,000 | 0,000 | 0,000 | 0,000 |
| Elixene | 0,172 | 0,084 | 0,217 | 0,162 | 0,148 | 0,270 | 0,110 | 0,214 | 0,099 | 0,111 | 0,000 |
| exo-2-Hydroxycineole acetate | 0,172 | 0,070 | 0,118 | 0,101 | 0,111 | 0,101 | 0,018 | 0,085 | 0,066 | 0,111 | 0,023 |
| Eudesm-7(11)-en-4-ol | 0,215 | 0,070 | 0,059 | 0,041 | 0,074 | 0,067 | 0,055 | 0,064 | 0,049 | 0,074 | 0,162 |
| Hexanal | 0,043 | 0,056 | 0,059 | 0,061 | 0,055 | 0,034 | 0,074 | 0,064 | 0,066 | 0,056 | 0,046 |
| Himachala-2,4-diene | 0,624 | 0,209 | 0,197 | 0,487 | 0,351 | 0,540 | 0,570 | 0,427 | 0,246 | 0,390 | 0,785 |
| Isoborneol | 0,000 | 0,000 | 0,000 | 0,000 | 0,000 | 0,000 | 0,000 | 0,000 | 0,000 | 0,019 | 0,000 |
| Isobornyl acetate | 0,000 | 0,000 | 0,000 | 0,000 | 0,000 | 0,000 | 0,000 | 0,000 | 0,000 | 0,019 | 0,000 |
| Isocaryophyllene | 1,077 | 0,683 | 2,245 | 1,663 | 1,771 | 1,400 | 1,931 | 1,239 | 1,182 | 1,987 | 0,000 |
| Isoeugenol | 0,495 | 0,376 | 0,433 | 0,527 | 0,351 | 0,472 | 0,386 | 0,342 | 0,476 | 0,371 | 0,323 |
| Isolimonene | 0,000 | 0,000 | 0,000 | 0,000 | 0,000 | 0,000 | 0,000 | 0,000 | 0,016 | 0,000 | 0,000 |
| Isoterpinolene | 0,474 | 0,237 | 0,276 | 0,264 | 0,166 | 0,236 | 0,166 | 0,150 | 0,148 | 0,130 | 0,138 |
| (+)-Ledene | 1,787 | 1,100 | 2,225 | 1,055 | 0,830 | 1,349 | 1,232 | 2,244 | 0,443 | 0,594 | 0,969 |
| Limetol | 0,009 | 0,003 | 0,020 | 0,061 | 0,007 | 0,017 | 0,018 | 0,000 | 0,016 | 0,000 | 0,000 |
| Limonene | 1,034 | 0,836 | 0,197 | 0,183 | 0,406 | 0,759 | 0,423 | 0,085 | 0,066 | 0,074 | 0,069 |
| Linalool | 32,212 | 29,420 | 37,789 | 38,150 | 40,918 | 22,752 | 32,835 | 40,046 | 28,374 | 25,019 | 13,202 |
| Linalylanthranilate | 0,011 | 0,014 | 0,020 | 0,020 | 0,018 | 0,017 | 0,018 | 0,000 | 0,005 | 0,019 | 0,023 |
| Methyl Cinnamate | 0,237 | 0,306 | 0,197 | 0,183 | 0,332 | 0,034 | 0,074 | 0,107 | 0,213 | 0,260 | 0,046 |
| Methyl Eugenol | 18,151 | 6,770 | 4,903 | 5,415 | 2,306 | 2,446 | 1,380 | 2,137 | 9,212 | 11,590 | 54,448 |
| Nerolidol | 0,237 | 0,098 | 0,236 | 0,203 | 0,258 | 0,405 | 0,221 | 0,449 | 0,213 | 0,204 | 0,577 |
| Octanal | 0,151 | 0,098 | 0,138 | 0,101 | 0,037 | 0,000 | 0,055 | 0,128 | 0,099 | 0,074 | 0,115 |
| n-Octylacetate | 0,022 | 0,028 | 0,039 | 0,061 | 0,037 | 0,067 | 0,037 | 0,021 | 0,033 | 0,056 | 0,000 |
| Oxime methoxy phenyl | 0,000 | 0,000 | 0,000 | 0,000 | 0,000 | 0,000 | 0,037 | 0,000 | 0,000 | 0,000 | 0,000 |
| Pinocarvone | 0,022 | 0,014 | 0,059 | 0,041 | 0,018 | 0,017 | 0,037 | 0,043 | 0,016 | 0,019 | 0,046 |
| Sabinene | 0,301 | 0,320 | 0,394 | 0,264 | 0,387 | 0,219 | 0,313 | 0,534 | 0,279 | 0,316 | 0,346 |
| Spathulenol | 0,000 | 0,000 | 0,000 | 0,000 | 0,000 | 0,000 | 0,000 | 0,000 | 0,000 | 0,019 | 0,023 |
| trans-2-Hexenal | 0,194 | 0,293 | 0,197 | 0,304 | 0,258 | 0,169 | 0,497 | 0,278 | 0,164 | 0,409 | 0,231 |
| trans-3-Hexen-1-ol | 0,172 | 0,237 | 0,098 | 0,466 | 0,129 | 0,152 | 0,092 | 0,256 | 0,296 | 0,353 | 0,346 |
| trans-3-Hexenyl Butyrate | 0,000 | 0,000 | 0,000 | 0,000 | 0,000 | 0,034 | 0,000 | 0,000 | 0,000 | 0,000 | 0,000 |
| trans-Geraniol | 0,000 | 0,000 | 0,000 | 0,000 | 0,000 | 0,000 | 0,000 | 0,000 | 0,000 | 0,056 | 0,000 |
| trans-α-Bergamotene | 0,345 | 0,334 | 0,610 | 0,852 | 0,553 | 0,304 | 0,497 | 0,577 | 0,345 | 0,613 | 0,000 |
| trans-β-Ocimene | 0,000 | 0,000 | 0,000 | 0,000 | 0,000 | 1,467 | 1,619 | 1,389 | 0,969 | 0,947 | 0,831 |
| trans Methyl p-methoxycinnamate | 0,194 | 0,000 | 0,000 | 0,000 | 0,000 | 0,000 | 0,000 | 0,000 | 0,000 | 0,167 | 0,115 |
| α-Amorphene | 1,012 | 0,306 | 0,807 | 0,892 | 0,664 | 0,742 | 0,828 | 0,684 | 0,493 | 0,260 | 0,785 |
| α-Bisabolene | 0,151 | 0,111 | 0,118 | 0,203 | 0,111 | 0,169 | 0,166 | 0,085 | 0,066 | 0,111 | 0,115 |
| α-Bisabolol | 0,151 | 0,070 | 0,098 | 0,142 | 0,111 | 0,118 | 0,147 | 0,192 | 0,131 | 0,204 | 0,162 |
| L-α-Bornyl acetate | 0,000 | 0,947 | 1,418 | 1,379 | 1,254 | 1,855 | 0,736 | 0,705 | 1,067 | 1,374 | 0,577 |
| α-Bulnesene | 1,959 | 1,142 | 4,135 | 2,474 | 2,490 | 3,711 | 2,962 | 3,611 | 1,773 | 2,043 | 5,563 |
| α-Citral | 0,022 | 0,014 | 0,000 | 0,000 | 0,000 | 0,000 | 0,007 | 0,009 | 0,007 | 0,019 | 0,023 |
| α-Copaene | 0,215 | 0,111 | 0,354 | 0,203 | 0,000 | 0,287 | 0,110 | 0,342 | 0,115 | 0,204 | 0,000 |
| α-Cubebene | 0,689 | 0,376 | 0,788 | 0,548 | 0,646 | 0,742 | 0,552 | 0,855 | 0,378 | 0,520 | 0,739 |
| α-Humulene | 3,079 | 1,588 | 2,087 | 2,414 | 3,136 | 3,609 | 2,612 | 2,906 | 2,184 | 3,473 | 4,478 |
| α-Ionene | 0,409 | 0,376 | 0,610 | 0,629 | 0,941 | 1,467 | 0,589 | 1,560 | 0,197 | 0,984 | 0,254 |
| α-Muurolene | 0,560 | 0,237 | 0,473 | 0,548 | 0,369 | 0,742 | 0,497 | 0,641 | 0,279 | 0,204 | 0,462 |
| α-Phellandrene | 0,345 | 0,084 | 0,158 | 0,162 | 0,092 | 0,101 | 0,055 | 0,128 | 0,082 | 0,093 | 0,046 |
| α-Pinene | 0,280 | 0,362 | 0,354 | 0,203 | 0,240 | 0,236 | 0,221 | 0,299 | 0,246 | 0,297 | 0,369 |
| α-Selinene | 0,000 | 0,000 | 0,709 | 0,264 | 0,609 | 0,590 | 0,975 | 1,175 | 0,411 | 0,706 | 1,962 |
| (R) α-Terpineol | 0,517 | 0,237 | 0,217 | 0,000 | 0,424 | 0,169 | 0,074 | 0,150 | 0,345 | 0,371 | 0,415 |
| (S) α-Terpineol | 2,756 | 1,254 | 1,615 | 1,765 | 1,660 | 1,400 | 1,637 | 1,496 | 2,151 | 1,727 | 1,916 |
| α-Terpinolene | 0,624 | 0,529 | 0,571 | 0,588 | 0,351 | 0,405 | 0,368 | 0,342 | 0,312 | 0,334 | 0,439 |
| L-β-Bisabolene | 0,603 | 0,474 | 0,866 | 1,136 | 0,719 | 0,860 | 1,140 | 0,470 | 0,887 | 0,334 | 0,369 |
| β-Bisabolol | 0,000 | 0,042 | 0,039 | 0,061 | 0,055 | 0,067 | 0,037 | 0,085 | 0,033 | 0,037 | 0,069 |
| β-Cadinene | 2,261 | 1,114 | 0,945 | 1,582 | 1,347 | 2,108 | 1,288 | 0,962 | 0,706 | 0,929 | 1,823 |
| β-Citral | 0,000 | 0,000 | 0,000 | 0,000 | 0,000 | 0,000 | 0,000 | 0,000 | 0,000 | 0,019 | 0,000 |
| β-Copaene | 0,108 | 0,139 | 0,295 | 0,183 | 0,240 | 0,202 | 0,202 | 0,363 | 0,181 | 0,279 | 0,277 |
| β-Cubebene | 1,227 | 1,867 | 5,593 | 5,192 | 4,963 | 6,999 | 7,064 | 9,616 | 4,417 | 6,092 | 11,817 |
| (+)-β-Elemene | 0,409 | 0,125 | 0,354 | 0,284 | 0,369 | 0,506 | 0,313 | 0,513 | 0,213 | 0,223 | 0,485 |
| (-)-β-Elemene | 2,153 | 1,212 | 4,273 | 2,677 | 2,970 | 4,351 | 2,649 | 5,193 | 2,250 | 2,322 | 5,678 |
| β-Eudesmol | 0,581 | 0,195 | 0,295 | 0,406 | 0,332 | 0,489 | 0,331 | 0,598 | 0,296 | 0,409 | 0,600 |
| β-Farnesene | 6,976 | 3,580 | 8,093 | 6,470 | 1,642 | 3,744 | 5,776 | 5,919 | 6,010 | 6,371 | 14,333 |
| β-Gurjunene | 0,926 | 0,209 | 0,335 | 1,237 | 0,941 | 0,287 | 1,140 | 0,000 | 0,821 | 0,873 | 0,000 |
| β-Himachalene | 0,000 | 0,111 | 0,000 | 0,345 | 0,424 | 0,422 | 0,386 | 0,962 | 0,181 | 0,000 | 0,000 |
| β-Myrcene | 1,636 | 1,268 | 1,457 | 1,217 | 0,959 | 0,995 | 0,773 | 1,197 | 0,706 | 0,762 | 0,508 |
| β-Patchoulene | 1,507 | 1,240 | 4,391 | 2,698 | 3,173 | 3,795 | 2,888 | 5,364 | 2,003 | 3,065 | 6,232 |
| (-)-β-Pinene | 0,646 | 0,613 | 0,591 | 0,406 | 0,406 | 0,405 | 0,497 | 0,620 | 0,361 | 0,576 | 0,716 |
| β-Sesquiphellandrene | 0,840 | 0,418 | 1,122 | 1,217 | 1,181 | 0,523 | 1,656 | 1,026 | 0,772 | 0,984 | 0,623 |
| β-Terpineol | 0,129 | 0,139 | 0,295 | 0,162 | 0,314 | 0,169 | 0,258 | 0,321 | 0,378 | 0,316 | 0,300 |
| δ-Cadinene | 0,194 | 0,181 | 0,256 | 0,183 | 0,166 | 0,388 | 0,147 | 0,342 | 0,148 | 0,167 | 0,300 |
| (-)-δ-Cadinol | 0,108 | 0,042 | 0,079 | 0,122 | 0,074 | 0,152 | 0,074 | 0,150 | 0,082 | 0,111 | 0,115 |
| τ-Cadinene | 4,565 | 2,549 | 7,325 | 6,571 | 5,479 | 6,645 | 6,935 | 10,236 | 3,251 | 4,476 | 4,408 |
| τ-Cadinol | 4,091 | 2,173 | 3,840 | 5,395 | 4,206 | 6,139 | 3,955 | 8,419 | 4,286 | 4,736 | 4,893 |
| τ-Gurjunene | 0,431 | 0,376 | 1,634 | 0,710 | 1,107 | 2,176 | 1,619 | 1,774 | 0,394 | 0,464 | 1,131 |
| τ-Muurolene | 0,452 | 0,306 | 0,748 | 0,750 | 0,498 | 0,911 | 0,883 | 1,004 | 0,673 | 0,687 | 0,785 |
| τ-Terpinene | 0,754 | 0,446 | 0,512 | 0,446 | 0,369 | 0,422 | 0,221 | 0,278 | 0,328 | 0,297 | 0,000 |
Table 5.
Comparison between SP and all other accessions (CV1-9 and SL). The highest positive values (Delta abs) are due to higher quantities of the listed compounds in SP.
Table 5.
Comparison between SP and all other accessions (CV1-9 and SL). The highest positive values (Delta abs) are due to higher quantities of the listed compounds in SP.
| SP | Mean others | Delta abs | |
| Methyl eugenol | 54.448 | 6.431 | 48.017 |
| β-Farnesene | 14.333 | 5.458 | 8.875 |
| β-Cubebene | 11.817 | 5.303 | 6.515 |
| β-Patchoulene | 6.232 | 3.012 | 3.220 |
| α-Bulnesene | 5.563 | 2.630 | 2.932 |
| (-)-β-Elemene | 5.678 | 3.005 | 2.673 |
| Camphor | 3.531 | 1.371 | 2.160 |
| α-Humulene | 4.478 | 2.709 | 1.769 |
Table 6.
Comparison between SP and all other accessions (CV1-9 and SL). The highest values with a negative sign (Delta abs) are due to lower quantities of the listed compounds in SP.
Table 6.
Comparison between SP and all other accessions (CV1-9 and SL). The highest values with a negative sign (Delta abs) are due to lower quantities of the listed compounds in SP.
| SP | Mean others | Delta abs | |
| Linalool | 13.202 | 32.751 | -19.549 |
| Eugenol | 37.714 | 44.664 | -6.949 |
| cis α-Bergamotene | 11.610 | 17.249 | -5.639 |
| Isocaryophyllene | 0.000 | 1.518 | -1.518 |
| τ-Cadinene | 4.408 | 5.803 | -1.395 |
| β-Gurjunene | 0.000 | 0.677 | -0.677 |
| β-Myrcene | 0.508 | 1.097 | -0.589 |
| α-Ionene | 0.254 | 0.776 | -0.522 |
Disclaimer/Publisher’s Note: The statements, opinions and data contained in all publications are solely those of the individual author(s) and contributor(s) and not of MDPI and/or the editor(s). MDPI and/or the editor(s) disclaim responsibility for any injury to people or property resulting from any ideas, methods, instructions or products referred to in the content. |
© 2024 by the authors. Licensee MDPI, Basel, Switzerland. This article is an open access article distributed under the terms and conditions of the Creative Commons Attribution (CC BY) license (http://creativecommons.org/licenses/by/4.0/).
Copyright: This open access article is published under a Creative Commons CC BY 4.0 license, which permit the free download, distribution, and reuse, provided that the author and preprint are cited in any reuse.


