
Submitted:
02 January 2024
Posted:
03 January 2024
You are already at the latest version
Abstract
Bioactive compound profiles in organic and conventional sweet basil were analyzed by HPLC, and the enzymatic status and antioxidant status of plants cultivated with the two systems were also examined. Unique chemical compound locations in the basil leaves were also estimated by fluorescence microscopy. The experiment was conducted from 2019-2021. Organic and conventional basil samples were obtained directly from the largest Polish herb producers. The results showed that the chemical structures of organic and conventional basil leaves are different. Not only cultivation method but also experimental year had a significant impact on the antioxidants content in basil leaves. Organic basil contained significantly more dry matter (11.97 g 100 g-1 FW) compare to conventional one (10.54 g 100g-1 FW) and showed a higher tendency for total phenolic (5.24 mg g -1 DW) concentrations than conventional basil (4.99 mg g-1 DW). The higher bioactive compound content reflects the antioxidant activity ( 61.0%, 54.33% and 46%) in organic basil compare to conventional 46.87%, 38.055 and 39.24%), respectively to analysis method (ABTS, DPPH and FRAP), as well catalase activity (39 µmol H2O2 min-1 mg-1) in organic compare to conventional (23.19 µmol H2O2 min-1 mg-1) of examined basil plants. The obtained results are a very unique and could be used by herbs producers as a key for q high quality basil production.
Keywords:
antioxidant activity
; basil
; carotenoids
; conventional
; enzymes
; organic
; polyphenols
1. Introduction
Sweet basil (Ocimum basilicum L.) is one of the most popular aromatic, medicinal and spice plants around the world. The plant is also called great basil and is a culinary herb of the Lamiaceae family. In Western cuisine, the generic term “basil” refers to the variety also known as sweet basil or Genovese basil [1]. Basil is native to tropical regions from Central Africa to Southeast Asia in temperate climates and is treated as an annual plant; however, basil can be grown as a short-lived perennial or biennial in warmer horticultural zones with tropical or Mediterranean climates [2]. Basil is plant-rich in different bioactive compounds, such as phenolic acids, flavonoids, carotenoids and chlorophylls. In basil leaves, different phenolic acids were identified: gallic, caffeic, chlorogenic, hydroxybenzoic, vanillic, ferulic, and trans-cinaminic [3,4]. In the group of flavonoids, rutin, naringin, naringenin and quercetin were found [5,6]. Green and purple basil leaves contain many pigments. Active in the photosynthetic process are chlorophylls, protective carotenoids and anthocyanins, [7], [8]. Basil leaves contain many essential oils. The most important oil compounds are linalool (52.4%), methyl eugenol (18.7%) and borneol (9.3%). The minor compounds are neral (8.1%), 1,8-cineol (5.6%) and myrcene (5.4%) [9,10,11,12]. Such a high concentration of different active substances gives basil phenomenal medicinal, pharmaceutical and health-promoting properties. The most well-known pro-health direction of their activity is anticancer, anti-mutagenic, anti-thrombotic, antioxidant, anti-hyperlipidaemic, anticonvulsant, anti-inflammatory and immunomodulatory effects [13]. The flavonoid composition in Ocimum basilicum can boost the phagocytic action of neutrophils and immunostimulant effects [14]. Anti-inflammatory activity and anti-proliferative activity of the hydroethanolic extract of lemon basil (O. x citriodorum) were reported in four different human cancer cell lines (HT-144, MCF-7, NCI-H460 and SF-268) [15]. Interestingly, the study by Mahmoud [16] explored basil as a potent anticancer agent in in vitro and in vivo experiments. In another study involving a variety of basil extracts, Elansary and Mahmoud [17] investigated different compositions with regards to their anticancer activities on several human cancer lines, so as to verify which combination had the greatest impact. All of the examined concentrations and varieties demonstrated powerful anticancer effects, with the Ocimum basilicum (sweet basil) variety exhibiting significant antioxidant and anticancer action.
Basil is a herb, which contain a lot of bioactive compounds from phenolic and carotenoids groups. The quality and quantity of those compounds is depended from plant genetic, but from farm management as well. Organic agriculture is characterized by strict rules. Chemical plant protection and artificial mineral fertilizers are not allowed. Only natural fertilizers, such as plant and animal manure, are widely used [18]. Phenolic compounds are essential elements of plant protection systems. In such situations, plants produce phenolic compounds in time of environmental biotic and abiotic stresses. The major biotic stress of organic plants is pest attack [19,20,21,22]. Therefore, organic plants produce more phenolic compounds [20]. In the present literature, there is still not enough information about organic herbs and spices and their chemical composition. Organic plant management is represented by systems that are stabilized for years. To better understand the chemical composition of organic and conventional plants, long-term experiments should be conducted [23,24,25,26,27]. In the present literature only few experiment were conducted with phenolic and carotenoid compounds distribution in plant tissues, but not with basil, especially in comparison between organic and conventional plants. Because organic cultivation system give different quantity in plants composition we want to know, about compounds distribution in plant tissues [28,29]. The main aim of the present experiment was to show differences in the chemical composition of organic and conventional basil in three years of cultivation.
2. Materials and Methods
2.1. Chemicals and Reagents
The following were used in this study: ABTS•+(2’2-azinebis-3-ethylbenzothiazolin-6-sulfonic acid), acetonitrile (HPLC grade), acetone (HPLC grade), aluminium chloride (pure for analysis grade), ammonium molybdate (pure for analysis grade), carotenoid standards (beta-carotene, lutein, zeaxanthin), chlorophyll standards (chlorophyll a, chlorophyll b), deionized water, ethyl acetate (HPLC grade), Folin-Ciocalteu reagent (pure for analysis grade), methanol (HPLC grade), hydrochloric acid (35%), PBS (phosphate-buffered saline), potassium persulfate (pure for analysis grade), sodium hydroxide (pure for analysis grade), sodium carbonate (pure for analysis grade), polyphenols standards (benzoic acid, caffeic acid, ferulic acid, gallic acid, kaempferol, kaempferol-3-O-glucodside, luteolin, myricetin, quercetin, quercetin-3-O-glucodside), hydrogen peroxide solution (>30%, for trace analysis), trichloroacetic acid (BioXtra), potassium phosphate dibasic (ACS reagent), potassium dihydrogen phosphate (for analysis), potassium iodide (BioXtra), TPTZ (2,4,6-tripyridyl-s-triazine), potassium peroxodisulfate (ACS reagent), DPPH• (2,2-diphenyl-1-picrylhydrazyl), Bradford reagent, hydrochloric acid, iron(III) chloride, tricine (titration), ethylene glycol-bis(2-aminoethylether)-N,N,N′,N′-tetraacetic acid (molecular biology grade), magnesium sulfate solution (molecular biology grade), DL-dithiothreitol (molecular biology grade), and prediluted protein assay standards: bovine serum albumin set, (-)-riboflavin (reagent grade), nitrotetrazolium blue chloride (HPLC grade), L-methionine (reagent grade), and ethylenediaminetetraacetic acid disodium salt dihydrate (molecular biology grade). All HPLC-standards were ultra-pure grade. All reagents were obtained from Merck and Sigma-Aldrich Company (Poland, Poznan).
2.2. Plant Material
The experiment was carried out in three continuous years: 2019-2021. Basil samples were obtained directly from organic and conventional herb and spice producers in Poland (Figure 1). Both organic and conventional sweet basil seeds were purchased directly from the largest seeds producer Plantico, Poland. Seeds were delivered to herbs producers. Herbs were cultivated in greenhouses in organic and conventional conditions according to law rules (regulation no. 2018/834) [28]. Basil was cultivated in organic and conventional farms (producers). The seeds were sown in every year in April (15 of April, 2019, 17 of April 2020 and 14 of April 2021), in organic coconut-fiber multiplied pallets (in organic farms) and plastic multiplied pallets (in conventional farms). Organic production was carried out with compost use, as basic growing medium. Conventional production was carried out with peat as a basic growing medium. Seeds were watered by water to keep the required growing medium moisture. Twenty days after sowing, the seedlings were transplanted into 1.0 L pots, containing appropriate growing substrate with fertilizers. In organic farm producers use: Humvit bio, Humiplant, Algaplant, Humvit bio universal. In conventional farms producers use: Ziołovit universal, Agrolinija-S, Basofoliar 2.0. In organic farms no chemical plant protection was conducted. In conventional farms yellow stick tables (according to producers declaration) against dark-winged fungus gnats were used. Temperature inside of greenhouses was between 20-25oC, and total humidity 65-70%. When basil plants grow-up to 15 cm, after 6 weeks, plants were used for experimental purposes. In every experimental year, three producers (the same in the whole experiment) were chosen. Six individual pots of basil were purchased from each producer in both cultivation systems (organic and conventional); ORG n=18 and CONV n=18 per one experimental year. In the whole 3-years experiment 54 plants (repetitions) were evaluated. Fresh basil was gently transported to the laboratory. One plant was treated as a one repetition. For experimental purposes, only basil leaves were used. After leaf separation from the plants, the material was divided into two parts: first only for dry matter measurement and second for freeze-drying. For analytical purposes, plant material was put into liquid nitrogen (-196 °C) and then freeze-dried with a LabconCo freeze-dryer (-60 °C, 0.100 mBar, 96 h). After that, the plant material was powdered with Mill-A11 basic IKA equipment. All results are presented in DW (dry weight) units.
2.3. Chemical Analysis
Dry Matter Content
Dry matter was measured by the gravimetric method described in the Polish standard protocol [31]. Briefly, the dry matter content was calculated based on the mass differences before and after drying at 105 °C in a laboratory drier Farma Play FP-25 W (Bielsko-Biala, Poland).
Total Polyphenol Content
The total polyphenol content was measured by the Folin-Ciocâlteu method [32]. One hundred milligrams of powdered plant material was weighed into a 250 mL beaker, and 50 mL of deionized water was added. The samples were extracted in an ultrasonic bath (20 min, 6000 Hz, temp. 30 °C). The samples were then vacuum filtered. The obtained supernatant was used for assays. A specified amount of the solution of the tested extracts (1.0 mL) was placed into 50 mL volumetric flasks, then 2.5 mL of Folin-Ciocalteu reagent and 5.0 mL of 20% sodium carbonate (Na2CO3) were added, and distilled water was added to the mark. Samples were incubated for 45 minutes at room temperature in the dark. After this time, absorbance was measured at a wavelength of λ = 750 nm using a BioSENS UV-6000 spectrophotometer (Warsaw, Poland). The total polyphenol content was calculated according to a mathematical formula with a dilution coefficient.
The final results are presented as gallic acid equivalents: GAE mg g-1 DW.
y = (2.125 x (absorbance) + 0.1317) x 100
Total Phenolic Acid Content
Total phenolic acid was measured by the Arnov method [33]. One hundred milligrams of powdered plant material was weighed into plastic testing tubes, and the next 5 mL of 80% ethanol was added. Samples were extracted in an ultrasonic bath (10 min, 6000 Hz, temp. 30 °C) and then centrifuged (6,000 rpm, 10 min, 0 °C). One millilitre of supernatant was injected into a glass testing tube and 1 mL of 0.5 M chloric acid (35%) HCl, 1 mL of Arnov reagent, 1 mL of 1 M sodium hydroxide and 6 mL of pure water. The sample was mixed up-and-down and used for UV‒Vis absorption measurements at a wavelength of 490 nm. A standard curve was prepared with gallic acid, and the results were calculated according to mathematical formula and presented as GAE mg g-1 DW.
y = (1353.2 x (absorbance) + 3.9761) x 10
Total Flavonoid Content
Total flavonoids were determined by the colorimetric method [34]. One gram of fine plant material was dissolved in methanol (100%). The samples were extracted in an ultrasonic bath and then filtered under vacuum. The obtained extract (5 mL) was mixed with sodium acetate C2H3NaO2 (5.0 mL, 100 g L-1) and aluminium chloride AlCl3 (3.0 mL, 25 g L-1) and brought to 25 mL with methanol in a calibrated flask. Each solution was compared with the same mixture but without the reagent (AlCl3). The absorbance was measured at 425 nm. The total flavonoid content was calculated using the equation obtained from the calibration curve of rutin (quercetin-3-O-rutinoside Q-3-R), according to mathematical formula and the results are presented as mg g-1 DW.
y = (6.452 x (absorbance) + 0.451) x 25
Individual Phenolic Identification and Quantification
Individual phenolics were extracted and measured by HPLC [35]. One hundred milligrams of powdered plant material was extracted with 80% methanol in an ultrasonic bath (10 min., 6000 Hz, temp. 30 °C). After extraction, the samples were centrifuged (10 min, 6000 rpm, temp. 0 °C). Fifty microliters of supernatant was injected into a Fusion RP-80 A column (250 x 4.6 mm, Phenomenex, Warsaw, Poland). For analysis purposes, an HPLC-set up was used, consisting of two LC-20AD pumps, a CMB-20A system controller, an SIL-20AC autosampler, an ultraviolet-visible SPD-20AV detector, an CTD-20AC oven. A flow rate of 1 mL min-1 of gradient phase prepared from acetonitrile and water with phosphoric acid (pH 3.0) was used. Time phases was follow: 1.00–22.99 min, phase A 95% and phase B 5%; 23.00-27.99 min phase A 50% and phase B 50%; 28.00–28.99 min phase A 80% and phase B 20%; and 29.00-38.00 min phase A 95 % and phase B 5%. The analysis time was 42 min, the detection wavelength for flavonoids was 360 nm, and the detection wavelength for phenolic acids was 250 nm. Polyphenols were identified on the basis of retention time, external standards. Chromatograms from phenolics analysis presented on the Figure S1 (Supplementary materials). Standard curves with their equations and R2 are presented on the Figures S3–S5 (Supplementary materials).
Total Chlorophyll and Carotenoid Contents
Total chlorophyll and carotenoid contents were measured by the colorimetric method [36] using a Spectrophotometer BioSens (Poland, Warsaw). A 100 mg sample of examined plant material was weighed into a glass beaker. Next, 50 mL of cold acetone (-20 °C) was added to the weighed sample. Thoroughly macerate the sample (thoroughly mix the extract with a glass rod). The contents of the beaker were transferred to a Schott funnel and paper filter under vacuum until the chlorophyll was completely washed out of the sample (pour with cold acetone until the falling drops were colourless). The contents of the receiving flask were quantitatively transferred to a 50 mL volumetric flask and, if necessary, made up to the mark with acetone. The sample was mixed thoroughly, and the absorbance of the test sample was measured at the following wavelengths: 441 nm, 646 nm, and 663 nm (the spectrophotometer was previously calibrated against cold 80% acetone). The extinction coefficients for chlorophyll a and chlorophyll b were calculated, and then the contents of chlorophyll (a and b) and the sum of carotenoids were calculated using the following formulas:
coefficient (chlorophyll a) we calculate from equilibration: (12.21 x A663) - (2.81 x A646)
coefficient (chlorophyll b) we calculate from equilibration: (20.13 x A646) - (5.03 x A663)
Chlorophyll a (µg g-1 DW) = (coef. chl. a x 50 x 1 g)/(1000 x 0.1)
Chlorophyll b (µg g-1 DW) = (coef. chl. b x 50 x 1 g)/(1000 x 0.1)
Total carotenoids (µg g-1 DW)= (1000 x (A441-((3.27 x coef. chl. a)-(104 x coef. chl. b))))/229
Individual Carotenoids and Chlorophylls Identification and Quantification
Chlorophylls and carotenoids were measured by the HPLC method [35]. Small amount (50 mg) of powdered plant tissue were extracted with cold acetone, and then magnesium carbonate was added. The samples were incubated in a cold ultrasonic bath (0 oC, 15 min). After extraction, the samples were centrifuged (5500 rpm, 2oC, 10 min). 1 mL of centrifuged extract was used for next step of analysis. For analytical purposes two mobile phase were used. First mobile phase (A)contained 90% acetonitrile and 10% methanol. Second phase (B): 68% methanol and 32% ethyl acetate with flow of 1 mL min-1 and time program of 1.00–14.99 min Phase A 100%; 15.00–22.99 min Phase A 40% and Phase B 60%; and 24.00–28.00 min Phase A 100%. The wavelengths used for detection was 450 nm. The carotenoids and chlorophylls were identified based on Fluka and Sigma Aldrich external standards with a purity of 99.5% (Poland). Chromatograms from carotenoids and chlorophylls identification is presented on the Figure S2 (Supplementary materials).
Hydrogen Peroxide Level Determination
To assess hydrogen peroxide (H2O2) levels, we followed the method originally described by Velikova et al. (2000) with some slight modifications [37]. A powered freeze-dried tissue sample was subjected to homogenization with cold 0.1% trichloroacetic acid using a TissueLyser LT (Qiagen, The Netherlands). Subsequently, the homogenate was centrifuged, and the supernatant was further mixed with 10 mM potassium phosphate buffer (pH 7.0) and 1 M KI. The absorbance of the resultant mixture was measured at a wavelength of 390 nm using a Multiscan-GO microplate reader from Thermo Scientific (USA). To determine the concentration of H2O2, we employed a suitable standard curve. The data obtained were expressed as micromoles of H2O2 per 100 mg of DW.
Antioxidant Activity ABTS, DPPH and FRAP
The antioxidant potential of methanol extracts was analyzed by the scavenging ability of ABTS and DPPH free radicals and the ability to reduce Fe3+TPTZ to Fe2+TPTZ (FRAP assay). A powered freeze-dried tissue sample was homogenized with methanol using a TissueLyser LT (Qiagen, The Netherlands) and centrifuged (15 min, 13 000 rpm, RT). The supernatant was used to determine the antioxidant potential of the samples. The activity against ABTS•+ was investigated as previously described, following the original method of Re et al. (1999). To obtain the green‒blue ABTS•+ solution, an aqueous mixture of 7 mM ABTS ((2,2′-azinobis(3-ethylbenzothiazoline-6-sulfonic acid)) and 2.45 mM potassium persulfate was left to stand in the dark overnight at room temperature. Later, the ABTS•+ solution was diluted with ethanol until the absorbance was 0.7±0.02 at 734 nm. The supernatant of the prepared samples was further mixed with ABTS•+ solution, and after 6 min of reaction, the absorbance was measured at a wavelength of 734 nm using a Multiscan-GO microplate reader from Thermo Scientific (USA). The percentage inhibition of ABTS•+ by the samples was calculated. The activity against DPPH radicals was examined as per the previously described method, following the original procedure by Chen and Ho (1995). The supernatant of the prepared samples was mixed with an ethanol solution of DPPH• (2,2-diphenyl-1-picrylhydrazyl), and after 20 min of reaction, the absorbance was measured at a wavelength of 517 nm using a microplate reader. The percentage inhibition of DPPH• by the samples was calculated. Activity expressed as the ability to reduce Fe3+ TPTZ (2,4,6-tripyridyl-s-triazine) to Fe2+TPTZ was performed according to the FRAP assay [39]. Briefly, working FRAP solution was freshly prepared by adding 10 mM TPTZ in 40 mM HCL, 20 mM FeCl3 and 300 mM acetate buffer (pH 3.6) at a ratio of 1:1:10. The supernatant of the prepared samples was mixed with FRAP solution, and the absorbance was measured at a wavelength of 593 nm using a microplate reader. The percentage reduction of Fe3+ TPTZ to Fe2+TPTZ by the samples was calculated. One equation was used for all methods of determining antioxidant activity, as follows: (%) = [(A0 − A1)/A0] × 100. Where A0 and A1 are the absorbance intensities of the control and the sample, respectively.
Protein Extraction and Enzyme Activity Measurements
A powered freeze-dried tissue sample was effectively homogenized using a TissueLyser LT by Qiagen (The Netherlands), along with extraction buffer containing 100 mM tricine, 3 mM MgSO4, 3 mM EGTA, 1 mM dithiothreitol, and 1 M Tris/HCl at a pH of 7.5. Following homogenization, the samples were incubated on ice and then subjected to centrifugation. Subsequently, the protein concentration was ascertained using a Bradford assay kit provided by Thermo Scientific, employing bovine serum albumin (BSA) as the standard. The spectrophotometric assay of superoxide dismutase (SOD) activity was conducted in accordance with the method established by Beauchamp and Fridovich (1971), incorporating modifications as previously documented (Rusaczonek et al., 2015) [40,41]. The enzyme assay mixture comprised 0.1 M phosphate buffer at a pH of 7.5, 2.4 μM riboflavin, 840 μM NBT, 150 mM methionine, and 12 mM Na2EDTA. The enzyme extract was combined with the enzyme assay mixture in a manner ensuring inhibition of NBT oxidation within the range of 20% to 80%. Absorbance measurements were taken at 560 nm for 15 minutes following sample exposure to either 500 μmol m–2s–1 illumination using an LED lamp (SL3500-W-D; PSI) or incubation in darkness as a blank sample. The results were expressed in units, representing the quantity of enzyme required to inhibit NBT photoreduction to blue formazan by 50% per milligram of protein. Catalase (CAT) activity was determined spectrophotometrically, following the methodology outlined by Aebi (1984), with adjustments as previously in Rusaczonek et al. (2015) [42]. Perhydrol was diluted with 50 mM phosphate buffer (pH 7.0) to achieve an absorbance of 0.5 (±0.02) at 240 nm, representing an initial H2O2 concentration of approximately 13 mM. The enzyme extract was combined with reaction buffer in a manner that resulted in a decrease in absorbance falling within the range of 20% to 80%. CAT activity was quantified based on the rate of H2O2 degradation observed over a 2-minute period, utilizing the molecular extinction coefficient of H2O2 at 240 nm (ε=43.6 mol–1 cm–1). The results were expressed in units of micromoles of H2O2 per minute per milligram of protein.
Microscopic Analyses
The localization of secondary metabolite autofluorescence was performed according to Muszyńska et al. (2019) [43]. Handmade cross sections of fresh samples were prepared from the leaves located in the second node on the stem, mounted on glass slides in a drop of distilled water and observed under a bright field or UV excitation using a fluorescence microscope equipped with a UMNU narrow-band filter cube (Olympus-Provis, Japan). Ten different leaf blades and their petioles were applied for both conventional and organic cultivation.
Statistical Analysis
The results obtained from chemical measurements were statistically evaluated with Statgraphics Centurion 15.2.11.0 software (StatPoint Technologies, Inc.,Warranton, VA, USA). Two-way ANOVA using Tukey’s test (α=0.05) was used. The factors of the experiment were the basil origin (ORG vs. CONV) and the cultivation year (2019, 2020, 2021). In the tables, average values with standard deviation for individual factors and interactions between factors are shown. Different letters indicate statistically significant differences between experimental groups.
3. Results and Discussion
Dry Matter in Plants
The obtained results showed that organic basil contained significantly more (p=0.0001) dry matter than conventional basil. We also observed the effect of cultivation year. In the first experimental year, basil contained significantly more (p<0.0001) dry matter than in the next two years. The interaction between cultivation and experimental years shows that in every year, organic basil was characterized by a significant (p=0.0045) concentration of dry matter (Table 1). Organic practices are affected by higher dry matter concentrations in herbs such as marjoram and oregano, sage, and lemon balm but not basil [45]]. Basil cultivated with organic fertilizers produced more shoot and leaf dry matter in the second experimental year than in the first year of observation [47]. In the present experiment, significantly more dry matter was observed in the organic basil in the first and third years of the experiment. Plants cultivated with organic soil growing media showed a higher rate of assimilation and photosynthesis. This can result in higher dry matter concentrations in plant tissues [48]. On the other hand, both plants organic and conventional intake inorganic ions with water from soil. In the case of organic plants, the presence of soil life makes ion intake easier. Therefore, conventional plants pump more water with ions into their tissues. It changes the balance between dry matter and water content in plant tissues. Many studies have shown that organic leafy vegetables and herbs are characterized by a higher dry matter content than conventional vegetables [49,50].
Phenolic Compounds in Plants
In the present experiment, we did not observe differences in total polyphenols, phenolic acids or total flavonoid content between organic and conventional basil. Only the effect of years was noticed. In 2021, plants produced significantly more phenolics (p<0.0001; p=0.0005; p<0.0001) than in the first and second experimental years. No significant interaction between cultivation system and experimental year was observed in the case of all phenolics (Table 1). The obtained results are contrary to those presented for oregano [20]. On the other hand, thymus plants sprayed with effective microorganisms (EMs) and bioalgeen S90 stimulators showed higher concentrations of total polyphenols and phenolic acids than untreated plants [51]. Organic air-dry basil was characterized by a higher content of all total phenolics (phenolic acids and flavonoids) compared to conventional basil in two experimental years [35]. In our experiment, we observed only some tendency for a higher phenolic concentration in organic plants, but no statistical evidence was obtained (Table 1). To the best of our knowledge, organic plants produce and use phenolics as defence systems against pest and fungal attack [52]. Evidently, other factors, such as cultivar, weather conditions or agricultural practices, are also important.
Individual profiling of phenolic acids showed that conventional basil contained significantly more p-coumaric acid (p<0.0001) than organic basil. We also observed a strong correlation between experimental combinations. In three years, conventional basil always contained significantly more p-coumaric acid (p<0.0001). A similar situation was observed with the individual compounds mirycetin (p<0.0001) and luteolin (Table 2). Organic basil was characterized by a higher p-coumaric acid concentration than hydroponic basil [53]. We obtained opposite results, but not with hydroponic cultivation, but with a typical conventional cultivation system.
Carotenoids Compounds in Plants
Carotenoids and chlorophylls are compounds essential for the photosynthesis process. Green colorants in plant leaves are directly connected with the nitrogen concentration in plants. In conventional cultivation systems, mineral, easily soluble nitrogen fertilizers are allowed. It affects the higher concentration of nitrogen in plant tissues and stimulates chlorophyll synthesis in leaves [54]. We did not observe a significant effect of cultivation method or experimental year on the chlorophyll content in basil leaves. Only the interaction between cultivation and year was important (p<0.0001). In every experimental year, conventional basil samples were characterized by a higher chlorophyll concentration in leaves (Table 1). Similar findings were observed with organic and conventional basil and thymus, but opposite results were presented with oregano [55,35,20]. In the individual chlorophyll fraction, only chlorophyll b was present in higher concentrations in the organic basil. Profiling of individual chlorophylls (a and b) showed that in the first two years, organic basil contained significantly (p<0.0001) that fraction compared to conventional basil (Table 2).
Carotenoids are compounds connected with chlorophyll synthesis. Leafy plants, as basil, produce photosynthetic system protection against photodestruction. The higher chlorophyll concentration in basil leaves is directly connected with high carotenoid abundance. In our experiment, we found an effect of cultivation (p=0.002) but not year on the total carotenoid concentration in basil. On the other hand, we observed a strong and statistically significant (p<0.0001) interaction between system and year. In every experimental year, conventional basil contained significantly more total carotenoids (Table 1). After carotenoid fraction measurement, we observed that only the lutein concentration was higher and statistically significant in the organic basil (Table 2). Basil is a good source of lutein. In the leaves, 9.23 mg g-1 DW of lutein was found [56]. In our experiment, the amount was lower but statistically significant. The organic basil contained significantly (p=0.022) more lutein than the conventional basil, and in 2020, the basil produced significantly more (p=0.0032) lutein than the rest of the experimental years (Table 2).
Enzymatic Status of Plants
The high hydrogen peroxide (H2O2) concentration in plants is an effect of oxidative stress. On the other hand, superoxide dismutase (SOD) is one of the key enzymes in the detoxification pathway of H2O2. In our experiment, we observed that conventional basil was characterized by a significantly (p<0.0001) higher activity of SOD, as well as a significantly higher concentration of H2O2 (p<0.0001) compared to organic basil. We concluded that the higher concentration of phenolics in organic basil led to a low stress situation connected, as we noted, with biotic stresses in the organic environment (Table 1). Conventional plants are protected by artificial pesticides at the time of cultivation. They protect against biotic stresses, but chemical agents create abiotic stresses focused on oxidative stress and H2O2 levels in plant tissues. On the other hand, organic basil was characterized by significantly higher catalase (CAT) activity (p<0.0001) than conventional basil. Perhaps this enzyme together with polyphenolic compounds is the basis of plant defense against environmental stresses. We also found a strong and significant correlation between years and cultivation system (p=0.0035). In all experimental years, organic basil was characterized by a significant and higher CAT activity (Table 3). The increase in CAT activity in organic basil could be an effect of salinity stress. Pepper mint reacts perfectly by increasing CAT synthesis over time under salinity stress conditions [57]. Organic cultivation methods consist of feeding plants only with organic fertilizers. Soil life in the presence of water decomposes organic matter into inorganic compounds. It may happen that in the root zone of organic plants, the level of salinity will suddenly increase. In such situations, organic basil plants may respond by increasing the synthesis of the CAT enzyme (Table 3).
Antioxidant Status in Plants
All compounds belonging to phenolic groups are strong antioxidants. They are stronger when they play an active role as free radical scavengers. As we noted, organic basil had a tendency to have higher polyphenol concentrations than conventional basil (Table 1). The presence of phenolics reflects the antioxidant power of basil. In the present experiment, organic basil was characterized by a significant (p<0.0001) and higher antioxidant activity compared to conventional basil in the case of three different measuring methods (ABTS, DPPH and FRAP) (Figure 2 and Figure 3). It is worth noting that in the third experimental year (2021), basil was characterized by the highest antioxidant power measured by three different methods. This is in accordance with the concentration of phenolics in plant tissue in that year (Table 1 and Table 2). Organic oregano, thyme and rosemary contained more total polyphenols than conventional ones [58]. At the same time, all tested organic herbs were characterized by significantly higher ABTS, DPPH and FRAP activity compared to conventional herbs. In the present experiment, we found a strong interaction between cultivation methods and years. Always, in three years of basic observation, organic plants were characterized by a higher antioxidant activity, but only the antioxidant activity measured by the ABTS method was statistically significant (p=0.0300).
Fluorescent Identification of Bioactive Compounds in Plants
The presented results showed that both organic and conventional basil produce bioactive compounds from phenolic, carotenoid and chlorophyll groups. Quantitative and qualitative comparison of the bioactive compounds in basil leaves shows that the cultivation system has a significant effect on the chemical basil composition. In our research, we performed yet another unique test of fluorescent identification of the place of accumulation of bioactive compounds in basil leaves from organic and conventional cultivation. The fluorescence microscopy images showed that there are some visible differences in the localization of biologically active compounds in the leaves of organic and conventional basil (Figure 4). The young leaves from the plants’ top are similar in both systems: organic and conventional. Some palisade parenchyma cells show orange‒yellow autofluorescence; however, it is a phenomenon visible in weak areas because of strong chlorophyll fluorescence. Therefore, in the young cells from that layer, tannins, aromatic quinones, and/or alkaloids occur (A1 and A2). It is worth noting that young leaves from organic basil begin to accumulate compounds in the upper epidermis, whereas conventionally, they do not. Organic basil epidermal cells give a turquoise colour. This may be an effect of autofluorescence imposition of compounds with blue and green emission (blue emission may represent coumarins, C6-C3 phenolic compounds, and stilbenes, while green colour gives phenolics such as chlorogenic acid and gallic acid). It is also probable that the turquoise colour belongs to flavonols quercetin and kaempferol (B1 and B2). Bioactive compounds, including flavonoids and phenolic acids, generally accumulate in the vacuoles of epidermal cells and act to decrease the transmittance of UV wavelengths to the mesophyll, protecting the deeper photosynthetic layers of the leaf (C1 and C2) [59]. Similar findings were presented by Karabourniotis and Fasseas (1996) [60]. This cell autofluorescence was probably due to the bathochromic shift of the flavonoids and/or other phenolics contained within the epidermal cells. Kaempferol glycosides are the main compounds in the leaves of Querqus ilex, whereas luteolin, apigenin and quercetin, both glucosides and aglycones, are components of the hairs of olive leaves. In our experiment, the main flavonoids in organic basil leaves were quercetin-3-O-glucosides and kaempferol. In the case of conventional basil, it was luteolin and quercetin (Table 3).
In conventional basil, palisade parenchyma cells of older leaves from the second node (fully developed) and upper epidermis puzzle-shaped cells showed blue autofluorescence of cell sap (B1 and C1). Some cells are more intensely blue, which may suggest a higher concentration of some bioactive compounds. Additionally, in some cells of spongy parenchyma, chloroplasts are visible on an intensely red background. That colour is an effect of autofluorescence of anthocyanins, some flavonoids and phenolic acids. This is in accordance with qualitative analysis and higher luteolin and p-coumaric acid concentrations in conventional basil. It is worth noting that in the organic basil epidermis, the cells are turquoise. while palisade parenchyma cells are in pink‒purple colour (B2 and C2). These are the effects of the imposition of red and blue or yellow and red autofluorescence of compounds. Additionally, there are strongly fluorescent cells of spongy parenchyma in a similar colour. Leaf petioles in both organic and conventional basil have cuticles covered with cutin with blue autofluorescence (D1 and D2). We can observe below-ground parenchyma cells with dark red anthocyanins. These cells are characteristic of cold/phosphorus stress reactions. Under normal conditions are in sleep mode, but in times of stress, they start to be visible in purple. In organic basil petioles, we identified many more cells with compounds showing green autofluorescence (D2). It is the effect of a higher concentration of some phenolics, such as kaempferol (Table 3).
4. Conclusions
In this work, not only was HPLC analysis of the chemical composition of sweet basil conducted, but the enzymatic status and antioxidant status of organic and conventional plants were also shown. Our findings showed that basil is a good source of bioactive compounds in our diet. Different cultivation methods can be useful as factors for increasing basil quality, such as polyphenol and carotenoid content. In the following three-year experiment, we showed the quantitative and qualitative status of organic and conventional basil, their reaction to environmental stresses and the unique distribution of bioactive compounds in the leaves. Organic basil contained significantly more selected carotenoids, such as lutein (0.13 mg g-1 DW) and chlorophylls a and b (2.03 mg g-1 DW and 0.15 mg g-1 DW), than conventional basil (0.10 mg g-1 DW; 1.97 mg g-1 DW and 0.10 mg g-1 DW), respectively. In this kind of aromatic plant, there was a tendency towards higher concentrations of polyphenols (5.24 mg g-1 DW) compared to conventional (4.16 mg g-1 DW) herbs. Obtained results presented in our experiment have a high utilitary application for basil producers. They can help them create the environmental conditions that will result in the best quality of this popular aromatic plant.
Supplementary Materials
The following supporting information can be downloaded at the website of this paper posted on Preprints.org.
Author Contributions
Conceptualization, E.H. and A.P; methodology, E.H., A.R., E.M; software, E.H., A.R., E.M.; validation, E.H., A.P., A.R., and E.M; formal analysis, D.Z., J.J., S.K., A.P., E.M.; investigation, D.Z., E.M., A.P., A.R.; resources, E.H., A.P.; data curation, A.P., S.K.; writing—original draft preparation, A.P., E.H.; writing—review and editing, E.H., A.R., J.J.; visualization, E.H.; supervision, A.P.; funding acquisition, A.P., E.H. All authors have read and agreed to the published version of the manuscript.
Acknowledgments
This paper has been published under the support of: Polish Ministry of Sciences and Higher Education within founds of Faculty of Human Nutrition and Consumer Sciences, Warsaw University of Life Sciences (WULS), for scientific research.
Conflicts of Interest
The authors declare no conflict of interest.
References
- Shahrajabian, M.H.; Sun, W.; Cheng, Q. Chemical components and pharmacological benefits of Basil (Ocimum Basilicum): a review. Int. J. Food Prop 2020, 23, 1961–1970. [Google Scholar] [CrossRef]
- Dudai, N.; Nitzan, N.; Gonda, I. Ocimum basilicum L. (Basil), chapter 12 [in book]: Medicinal, Aromatic and Stimulant Plants, ed. Novak, J.; Blüthner, W.-D., Publisher: Springer International Publishing; Springer (2020).
- Teofilović, B.; Grujić-Letić, N.; Karadžić, M.; Kovačević, S.; Podunavac-Kuzmanović, S.; Gligorić, E.; Gadžurić, S. Analysis of functional ingredients and composition of Ocimum basilicum. S. Afr. J. Bot. 2021, 141, 227–234. [Google Scholar] [CrossRef]
- Ghasemzadeh, A.; Ashkani, S.; Baghdadi, A.; Pazoki, A.; Jaafar, H.Z.E.; Rahmat, A. Improvement in flavonoids and phenolic acids production and pharmaceutical quality of sweet basil (Ocimum basilicum L.) by ultraviolet-B irradiation. Molecules 2016, 21, 1–15. [Google Scholar] [CrossRef] [PubMed]
- Ćavar Zeljković, S.; Komzáková, K.; Šišková, J.; Karalija, E.; Smékalová, K.; Tarkowski, P. Phytochemical variability of selected basil genotypes. Ind Crops Prod 2020, 157, 1–10. [Google Scholar] [CrossRef]
- Slimestad, R.; Fossen, T.; Brede, C. Flavonoids and other phenolics in herbs commonly used in Norwegian commercial kitchens. Food Chem. 2019, 125678. [Google Scholar] [CrossRef] [PubMed]
- Balanescu, F.; Mihaila, M.D.I.; Cârâc, G.; Furdui, B.; Vînătoru, C.; Avramescu, S.M.; Lisa, E.L.; Cudalbeanu, M.; Dinica, R.M. Flavonoid profiles of two new approved romanian Ocimum hybrids. Molecules 2020, 25, 1–15. [Google Scholar] [CrossRef]
- Stetsenko, L.A.; Pashkovsky, P.P.; Rvoloshin, A.; Kreslavski, V.D.; Kuznetsov, Vl.V.; Allakhverdiev, S.I. Role of anthocyanin and carotenoids in the adaptation of the photosynthetic apparatus of purple- and green-leaved cultivars of sweet basil (Ocimum basilicum) to high-intensity light. Photosynthetica 2020, 58, 890–901. [Google Scholar] [CrossRef]
- Da Silva, W.M.F.; Kringel, D.H.; de Souza, E.J.D.; da Rosa Zavareze, E.; Dias, A.R.G. Basil essential oil: methods of extraction, chemical composition, biological activities, and food applications. Food Bioproc. Tech. 2021, 1–27. [Google Scholar] [CrossRef]
- Avetisyan, A.; Markosian, A.; Petrosyan, M.; Sahakyan, N.; Babayan, A.; Aloyan, S.; Trchounian, A. Chemical composition and some biological activities of the essential oils from basil Ocimum different cultivars. BMC Complement Altern. Med 2017, 17, 1–8. [Google Scholar] [CrossRef]
- Stanojevic, L.P.; Marjanovic-Balaban, Z.R.; Kalaba, V.D.; Stanojevic, J.S.; Cvetkovic, D.J.; Cakic, M.D. Chemical composition, antioxidant and antimicrobial activity of basil (Ocimum basilicum L.) essential oil. J. Essent. Oil-Bear. Plants 2017, 20, 1557–1569. [Google Scholar] [CrossRef]
- Ahmed, A.F.; Attia, F.A.K.; Liu, Z.; Li, C.; Wei, J.; Kang, W. Antioxidant activity and total phenolic content of essential oils and extracts of sweet basil (Ocimum basilicum L.) plants. Food Sci. Hum. Wellness. 2019, 8, 299–305. [Google Scholar] [CrossRef]
- Purushothaman, B.; Srinivasan, R.P.; Purushothaman, S.; Ranganathan, B.; Gimbun, J.; Shanmugam, K. A comprehensive review on Ocimum basilicum. J. Nat. Remedies 2018, 71–75. [Google Scholar] [CrossRef]
- Jermini, M.; Dubois, J.; Rodondi, P.Y.; Zaman, K.; Buclin, T.; Csajka, C.; Orcurto, A.; Rothuizen, L.E. Complementary medicine use during cancer treatment and potential herb-drug interactions from a cross-sectional study in an academic centre. Sci. Rep. 2019, 9, 1–18. [Google Scholar] [CrossRef] [PubMed]
- Majdi, C.; Pereira, C.; Dias, M.I.; Calhelha, R.C.; Alves, M.J.; Frih, B.; Charrouf, Z.; Barros, L.; Amaral, J.S.; Ferreira, I.C.F.R. Phytochemical characterization and bioactive properties of cinnamon basil (Ocimum basilicum cv. ‘Cinnamon’) and Lemon Basil (Ocimum x citriodorum). Antioxidants 2020, 9, 369. [Google Scholar] [CrossRef] [PubMed]
- Mahmoud, G.I. Biological effects, antioxidant and anticancer activities of marigold and basil essential oils. J. Med. Plants Res. 2013, 7, 561–572. [Google Scholar] [CrossRef]
- Elansary, H.O.; Mahmoud, E.A. In vitro antioxidant and antiproliferative activities of six international basil cultivars. Nat. Prod. Res. 2015, 29, 2149–2154. [Google Scholar] [CrossRef] [PubMed]
- Matyjaszczyk, E. Plant protection means used in organic farming throughout the European Union. Pest Manag. Sci. 2017, 74, 505–510. [Google Scholar] [CrossRef] [PubMed]
- Pratyusha, S. Phenolic compounds in the plant development and defense, an overview, chapter 7 [in book]: Nahar K., Hasanuzzaman M., Plant stress physiology. Perspectives in agriculture. Publisher: British Library Cataloguing, ISSN 2631-8261, (2022).
- Jan, R.; Asaf, S.; Numan, M.; Lubna; Kim, K-M. Plant secondary metabolite biosynthesis and transcriptional regulation in response to biotic and abiotic stress conditions. Agronomy 2021, 11, 1–31. [Google Scholar] [CrossRef]
- Khare, S.; Singh, N.B.; Singh, A.; Hussain, I.; Niharika, K.; Yadav, V.; Yadov, R.K.; Amist, N. Plant secondary metabolites synthesis and their regulations under biotic and abiotic constraints. J. Plant Biol. 2020, 63, 203–216. [Google Scholar] [CrossRef]
- Balmer, D; Flors, V.; Glauser, G.; Mauch-Mani, B. Metabolomics of cereals under biotic stress: current knowledge and techniques. Front Plant Sci 2013, 4, 1–12. [CrossRef]
- Matłok, N.; Stępień, A.E.; Gorzelany, J.; Wojnarowska-Nowak, R.; Balawejder, M. Effects of organic and mineral fertilization on yield and selected quality parameters for dried herbs of two varieties of oregano (Origanum vulgare L.). Appl. Sci. 2020, 16, 1–10. [Google Scholar] [CrossRef]
- Stracke, B.A.; Eitel, J.; Watzl, B.; Mäder, P.; Rüfer, C.E. Influence of the production method on phytochemical concentrations in whole wheat (Triticum aestivum L.): A comparative study. J. Agric. Food Chem. 2009, 57, 10116–10121. [Google Scholar] [CrossRef] [PubMed]
- Raigón, M.D.; Rodríguez-Burruezo, A.; Prohens, J. Effects of organic and conventional cultivation methods on composition of eggplant fruits. J. Agric. Food Chem 2010, 58, 6833–6840. [Google Scholar] [CrossRef]
- Anton, D.; Matt, D.; Pedastsaar, P.; Bender, I.; Kazimierczak, R.; Roasto, M.; Kaart, T.; Luik, A.; Püssa, T. Three-year comparative study of polyphenol contents and antioxidant capacities in fruits of tomato (Lycopersicon esculentum Mill.) cultivars grown under organic and conventional conditions. J. Agric. Food Chem. 2014, 62, 5173–5180. [Google Scholar] [CrossRef] [PubMed]
- Głowacka, A.; Rozpara, E.; Hallmann, E. The dynamic of polyphenols concentrations in organic and conventional sour cherry fruits: results of a 4-year field study. Molecules 2020, 25, 1–12. [Google Scholar] [CrossRef]
- Casanova, J.M.; dos Santos Nascimento, L.B.; Casanova, L.M.; Leal-Costa, M.V.; Costa, S.S.; Tavares, E.S. Differential distribution of flavonoids and phenolic acids in leaves of Kalanchoe delagoensis Ecklon & Zeyher (Crassulaceae). Microsc. Microanal. 2020, 26, 1–8. [Google Scholar] [CrossRef] [PubMed]
- Ali, M.; Bahadur, S.; Hussain, A.; Saeed, S.; Khuram, I.; Ullah, M.; Shao, J.-W.; Akhtar, N. Foliar epidermal micromorphology and its taxonomic significance in Polygonatum (Asparagaceae) using scanning electron microscopy. Microsc. Res. Tech 2020, 83, 1381–1390. [Google Scholar] [CrossRef] [PubMed]
- Regulation (EU) 2018/848 of the European Parliament and of the Council of 30 May 2018 on organic production and labelling of organic products and repealing Council Regulation (EC) No 834/2007.
- Polish Norm (PN-EN 14346:2011), Fruit and vegetable preserves. Sample preparation and physicochemical test methods. Determination of dry matter content by gravimetric method. Polish Standards Committee, 2011, 1-5.
- Singleton, V.L.; Orthofer, R.; Lamuela-Raventos, R.M. Analysis of total phenols and other oxidation substrates and antioxidants by means of Folin-Ciocalteu reagent. Meth. Enzymol. 1999, 299, 152–178. [Google Scholar] [CrossRef]
- Polish Pharmacopoeia, VI. The Polish Pharm. Soc., Warsaw, 2002, 896-898.
- Toiu, A.; Vlase, L.; Vodnar, D.C.; Gheldiu, A.-M.; Oniga, I. Solidago graminifolia L. Salisb. (Asteraceae) as a valuable source of bioactive polyphenols: HPLC profile, in vitro antioxidant and antimicrobial potential. Molecules 2019, 24, 1–15. [Google Scholar] [CrossRef]
- Hallmann, E.; Sabała, P. Organic and conventional herbs quality reflected by their antioxidant compounds concentration. Appl. Sci. 2020, 10, 1–11. [Google Scholar] [CrossRef]
- Lichtenthaler, H.K. Chlorophyll and carotenoids: Pigments of photosynthetic biomembranes. Meth. Enzym. 1987, 148, 331–382. [Google Scholar] [CrossRef]
- Velikova, V.; Yordanov, I.; Edreva, A. Oxidative stress and some antioxidant systems in acid rain-treated bean plants. Protective role of exogenous polyamines. Plant Sci 2000, 151, 59–66. [Google Scholar] [CrossRef]
- Chen, C.W.; Ho, C.T. Antioxidant properties of polyphenols extracted from green and black teas. J. Food Lipids 1995, 2, 35–46. [Google Scholar] [CrossRef]
- Benzie, I.F.; Strain, J.J. Ferric reducing/antioxidant power assay: direct measure of total antioxidant activity of biological fluids and modified version for simultaneous measurement of total antioxidant power and ascorbic acid concentration. Meth. Enzymol. 1999, 299, 15–27. [Google Scholar] [CrossRef] [PubMed]
- Rusaczonek, A.; Czarnocka, W.; Kacprzak, S.; Witoń, D.; Ślesak, I.; Szechyńska-Hebda, M.; Gawroński, P.; Karpiński, S. Role of phytochromes A and B in the regulation of cell death and acclimatory responses to UV stress in Arabidopsis thaliana. J. Exp. Bot. 2015, 66, 6679–6695. [Google Scholar] [CrossRef] [PubMed]
- Beauchamp, C.; Fridovich, I. Superoxide dismutase: improved assays and an assay applicable to acrylamide gels. Anal. Biochem. 1971, 44, 276–287. [Google Scholar] [CrossRef] [PubMed]
- Aebi, H. Catalase in vitro. Meth. Enzymol. 1984, 105, 121–126. [Google Scholar] [CrossRef] [PubMed]
- Muszyńska, E.; Labudda, M.; Kamińska, I.; Górecka, M.; Bederska-Błaszczyk, M. Evaluation of heavy metal-induced responses in Silene vulgaris ecotypes. Protoplasma 2019, 256, 1279–1297. [Google Scholar] [CrossRef] [PubMed]
- Re, R.; Pellegrini, N.; Proteggente, A.; Nala, A.; Yang, M.; Rice-Evans, C. Antioxidant activity applying an improved ABTS radical cation decolorization assay. Free Radic. Biol. Med. 1999, 26, 1231–1237. [Google Scholar] [CrossRef]
- Aflatuni, A. The effect of manure composted with drum composter on aromatic plants. Acta Hort. 1993, 344, 63–68. [Google Scholar] [CrossRef]
- Kazimierczak, R.; Hallmann, E.; Rembiałkowska, E. Effects of organic and conventional production systems on the content of bioactive substances in four species of medicinal plants. Biol. Agric. Hortic 2014, 31, 118–127. [Google Scholar] [CrossRef]
- Tahami, M.K.; Jahan, M.; Khalilzadeh, H.; Mehdizadeh, M. Plant growth promoting rhizobacteria in an ecological cropping system: A study on basil (Ocimum basilicum L.) essential oil production. Ind. Crops Prod. 2017, 107, 97–104. [Google Scholar] [CrossRef]
- Dou, H.; Niu, G.; Gu, M.; Masabni, J.G. Responses of sweet basil to different daily light integrals in photosynthesis, morphology, yield, and nutritional quality. Hort. Sci. 2018, 53, 496–503. [Google Scholar] [CrossRef]
- Masamba, K.G.; Nguyen, M. Determination and comparison of vitamin C, calcium, and potassium in four selected conventionally and organically grown fruits and vegetables. AJB 2008, 7, 2915–2919. [Google Scholar]
- Evans, N. A., Bonaventure, K.M., Saajah, J.K. Effect of soil amendments on the nutritional quality of three commonly cultivated lettuce varieties in Ghana. Afr. J. Agric. Res. 2015, 10, 1796–1804. [CrossRef]
- Kwiatkowski, C.A.; Haliniarz, M.; Harasim, E.; Kołodziej, B.; Yakimovich, A. Foliar applied biopreparations as a natural method to increase the productivity of garden thyme (Thymus vulgaris L.) and to improve the quality of herbal raw material. Acta Sci. Pol. Hortorum Cultus 2020, 19, 107–118. [Google Scholar] [CrossRef]
- Ren, F.; Reilly, K.; Gaffney, M.; Kerry, J.P.; Hossain, M.; Rai, D.K. Evaluation of polyphenolic content and antioxidant activity in two onion varieties grown under organic and conventional production systems. J. Sci. Food Agric. 2017, 97, 2982–2990. [Google Scholar] [CrossRef] [PubMed]
- Braglia, R.; Costa, P.; Di Marco, G.; D’Agostino, A.; Redi, E.L.; Scuderi, F.; Gismondi, A.; Canini, A. Phytochemicals and quality level of food plants grown in an aquaponics system. J. Sci. Food Agric. 2021, 102, 844–850. [Google Scholar] [CrossRef]
- Xiong, D.; Chen, J.; Yu, T.; Gao, W.; Ling, X.; Li, Y.; Peng, Sh.; Huang, J. SPAD-based leaf nitrogen estimation is impacted by environmental factors and crop leaf characteristics. Sci. Rep. 2015, 5, 1–12. [Google Scholar] [CrossRef]
- Ievinsh, G.; Andersone-Ozola, U.; Zeipiņa, S. Comparison of the effects of compost and vermicompost soil amendments in organic production of four herb species. Biol. Agric. Hortic. 2020, 4, 1–16. [Google Scholar] [CrossRef]
- Dadan, M.; Tylewicz, U.; Tappi, S.; Rybak, K.; Witrowa-Rajchert, D.; Dalla Rosa, M. Effect of ultrasound, steaming, and dipping on bioactive compound contents and antioxidant capacity of basil and parsley. Pol. J. Food Nutr. Sci. 2021, 71, 311–321. [Google Scholar] [CrossRef]
- Chiappero, J.; del Cappellari, L.R.; Palermo, T.B.; Giordano, W.; Khan, N.; Banchio, E. Antioxidant status of medicinal and aromatic plants under the influence of growth-promoting rhizobacteria and osmotic stress. Ind. Crops Prod. 2021, 167, 1–14. [Google Scholar] [CrossRef]
- Hęś, M. Comparison of the antioxidant properties of spices from ecological and conventional cultivations. J. Res. Appl. Agric. Eng. 2022, 67, 5–12. [Google Scholar] [CrossRef]
- Nascimento, L.B. dos Santos; Brunetti, C.; Agati, G.; Iacono, C.L.; Detti, C.; Giordani, E.; Ferrini, F.; Gori, A. Short-term pre-harvest UV-B supplement enhances the polyphenol content and antioxidant capacity of Ocimum basilicum leaves during storage. Plants 2020, 9, 1–19. [Google Scholar] [CrossRef]
- Karabourniotis, G.; Fasseas, C. The dense indumentum with its polyphenol content may replace the protective role of the epidermis in some young xeromorphic leaves. Canad. J. Bot. 1996, 74, 347–351. [Google Scholar] [CrossRef]
Figure 1.
Plant of sweet basil used in experiment for chemical composition evaluation.
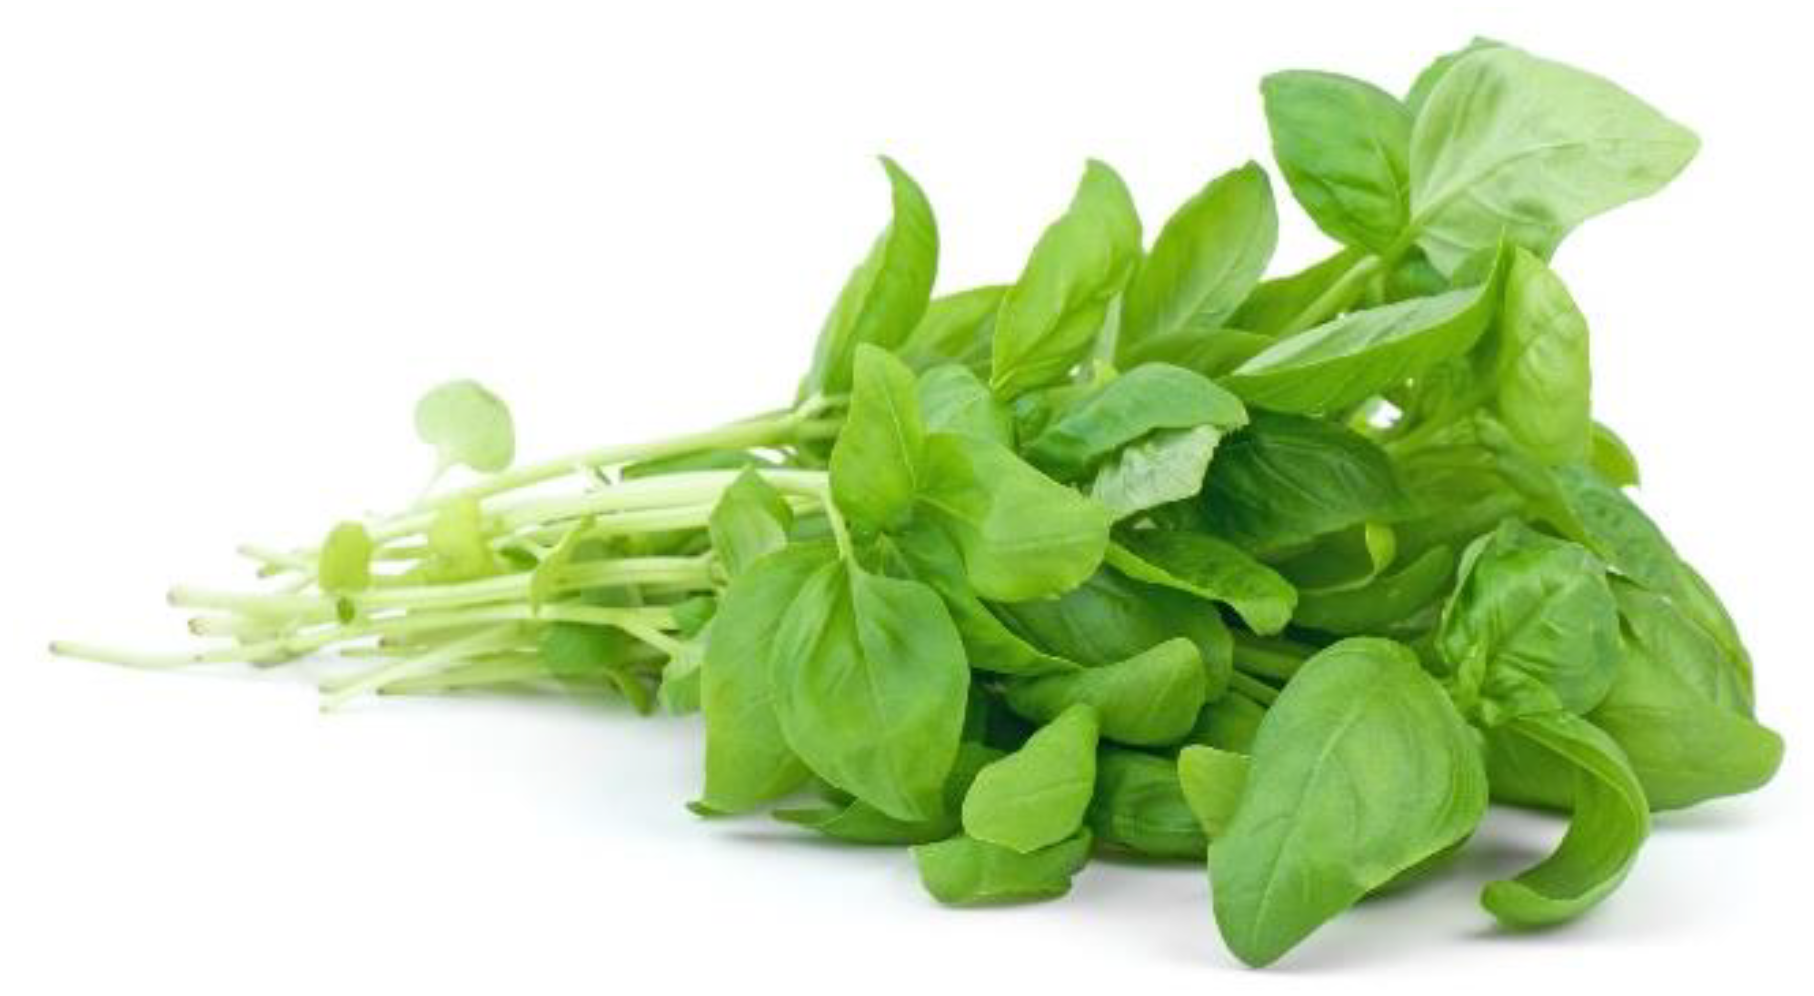
Figure 2.
Mean values for antioxidant activity measured by three methods for organic and conventional basil cultivated in three exprimental years; p-value (cultivation)<0.0001; (year)<0.0001 for three mrthods.
Figure 2.
Mean values for antioxidant activity measured by three methods for organic and conventional basil cultivated in three exprimental years; p-value (cultivation)<0.0001; (year)<0.0001 for three mrthods.
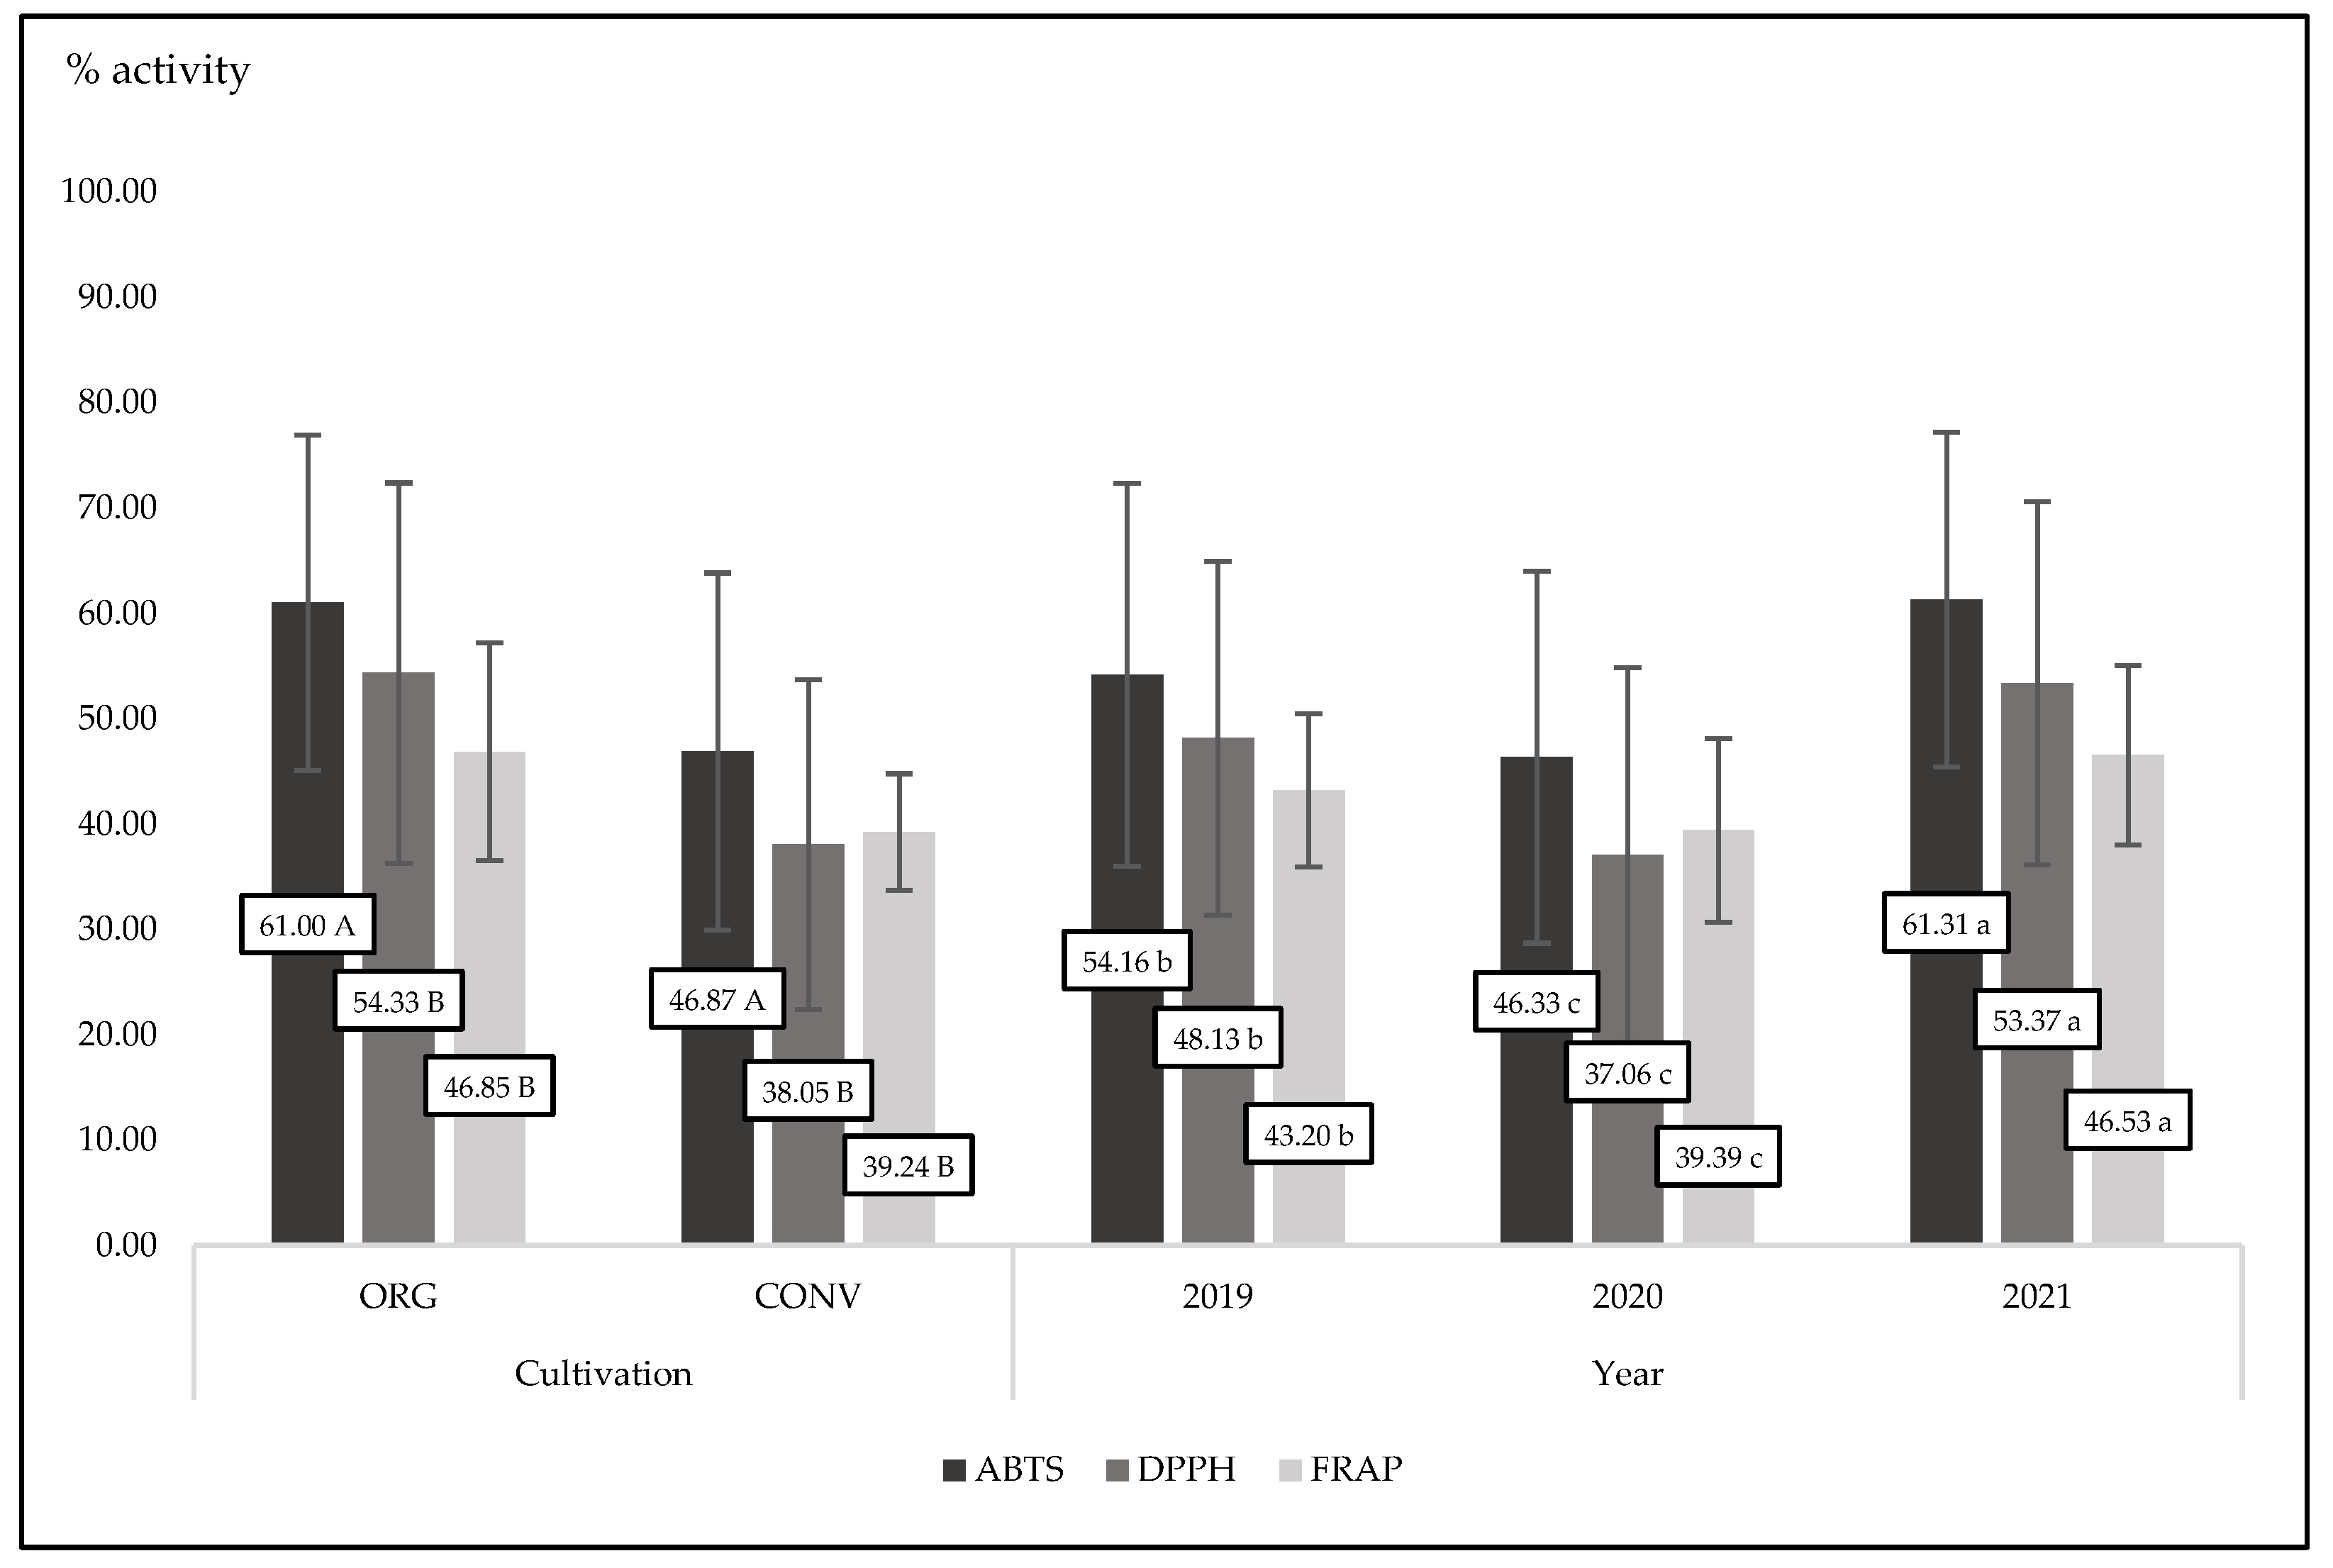
Figure 3.
Interaction between experimental factors for antioxidant activity measured by three methods for organic and conventional basil cultivated in three exprimental years; ABTS p=0.003; DPPH p= n.s.; FRAP p=n.s.
Figure 3.
Interaction between experimental factors for antioxidant activity measured by three methods for organic and conventional basil cultivated in three exprimental years; ABTS p=0.003; DPPH p= n.s.; FRAP p=n.s.
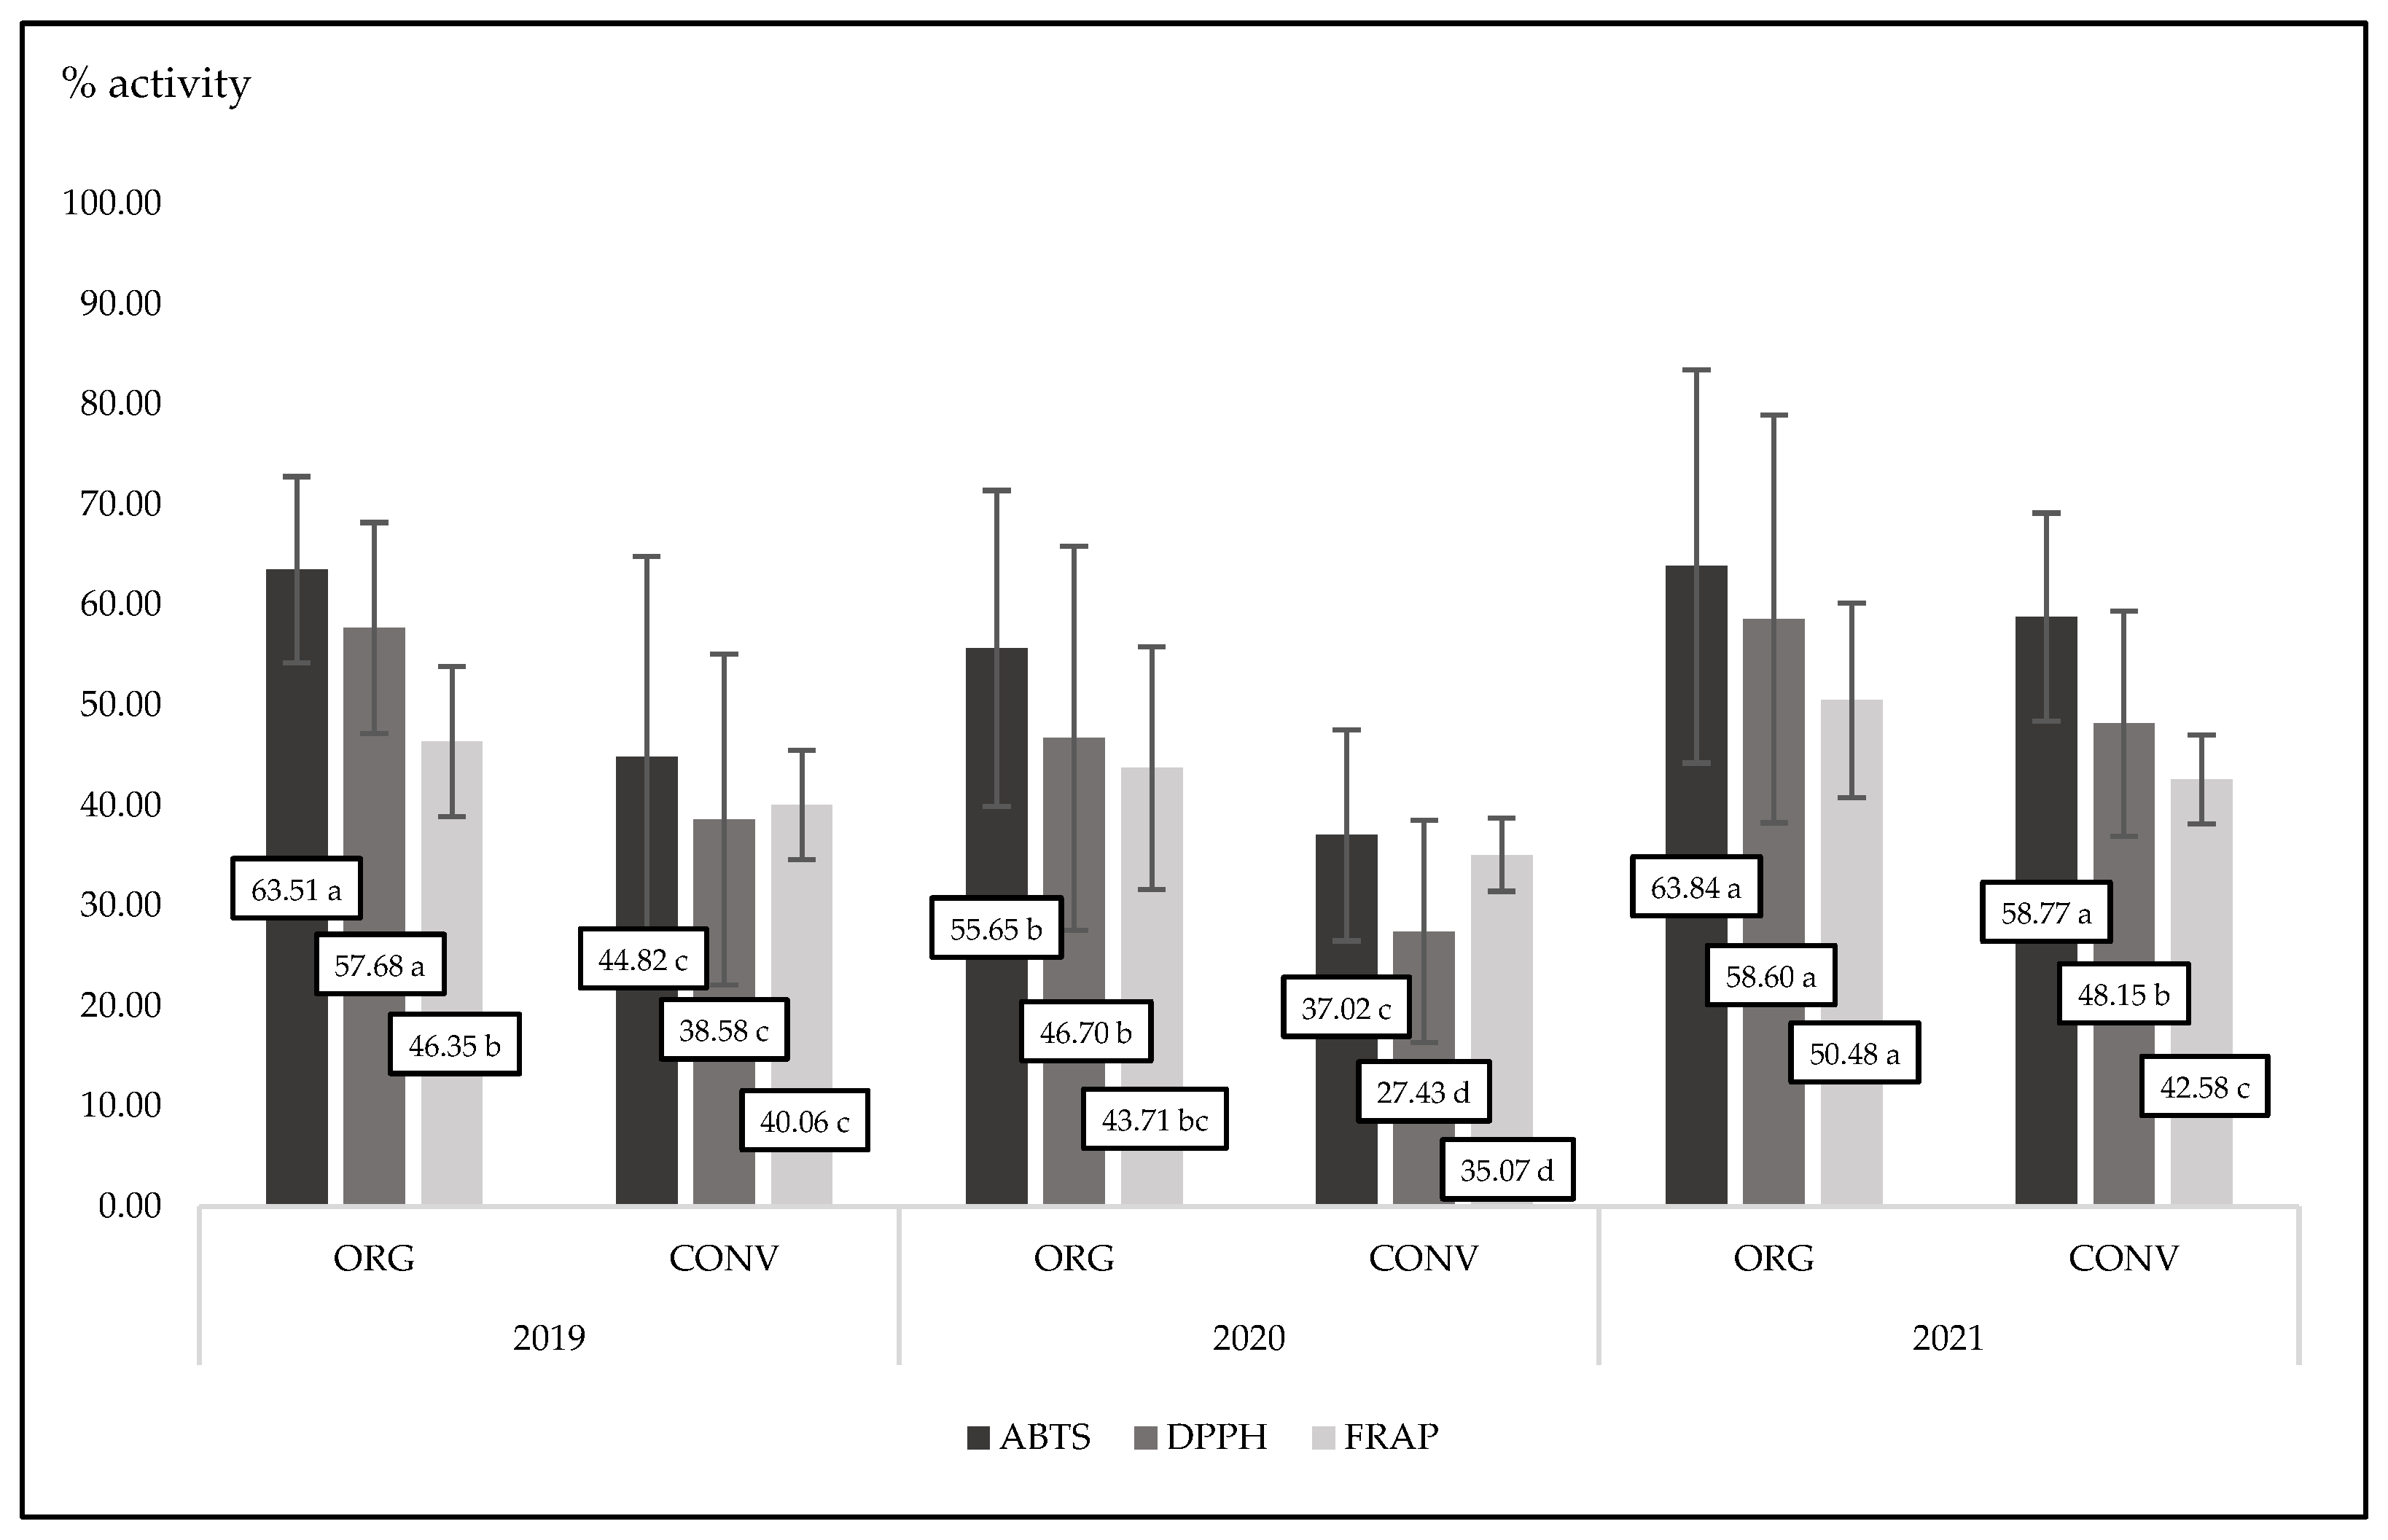
Figure 4.
The microscopic picture of selected part of basil leaves from organic and conventional production.
Figure 4.
The microscopic picture of selected part of basil leaves from organic and conventional production.
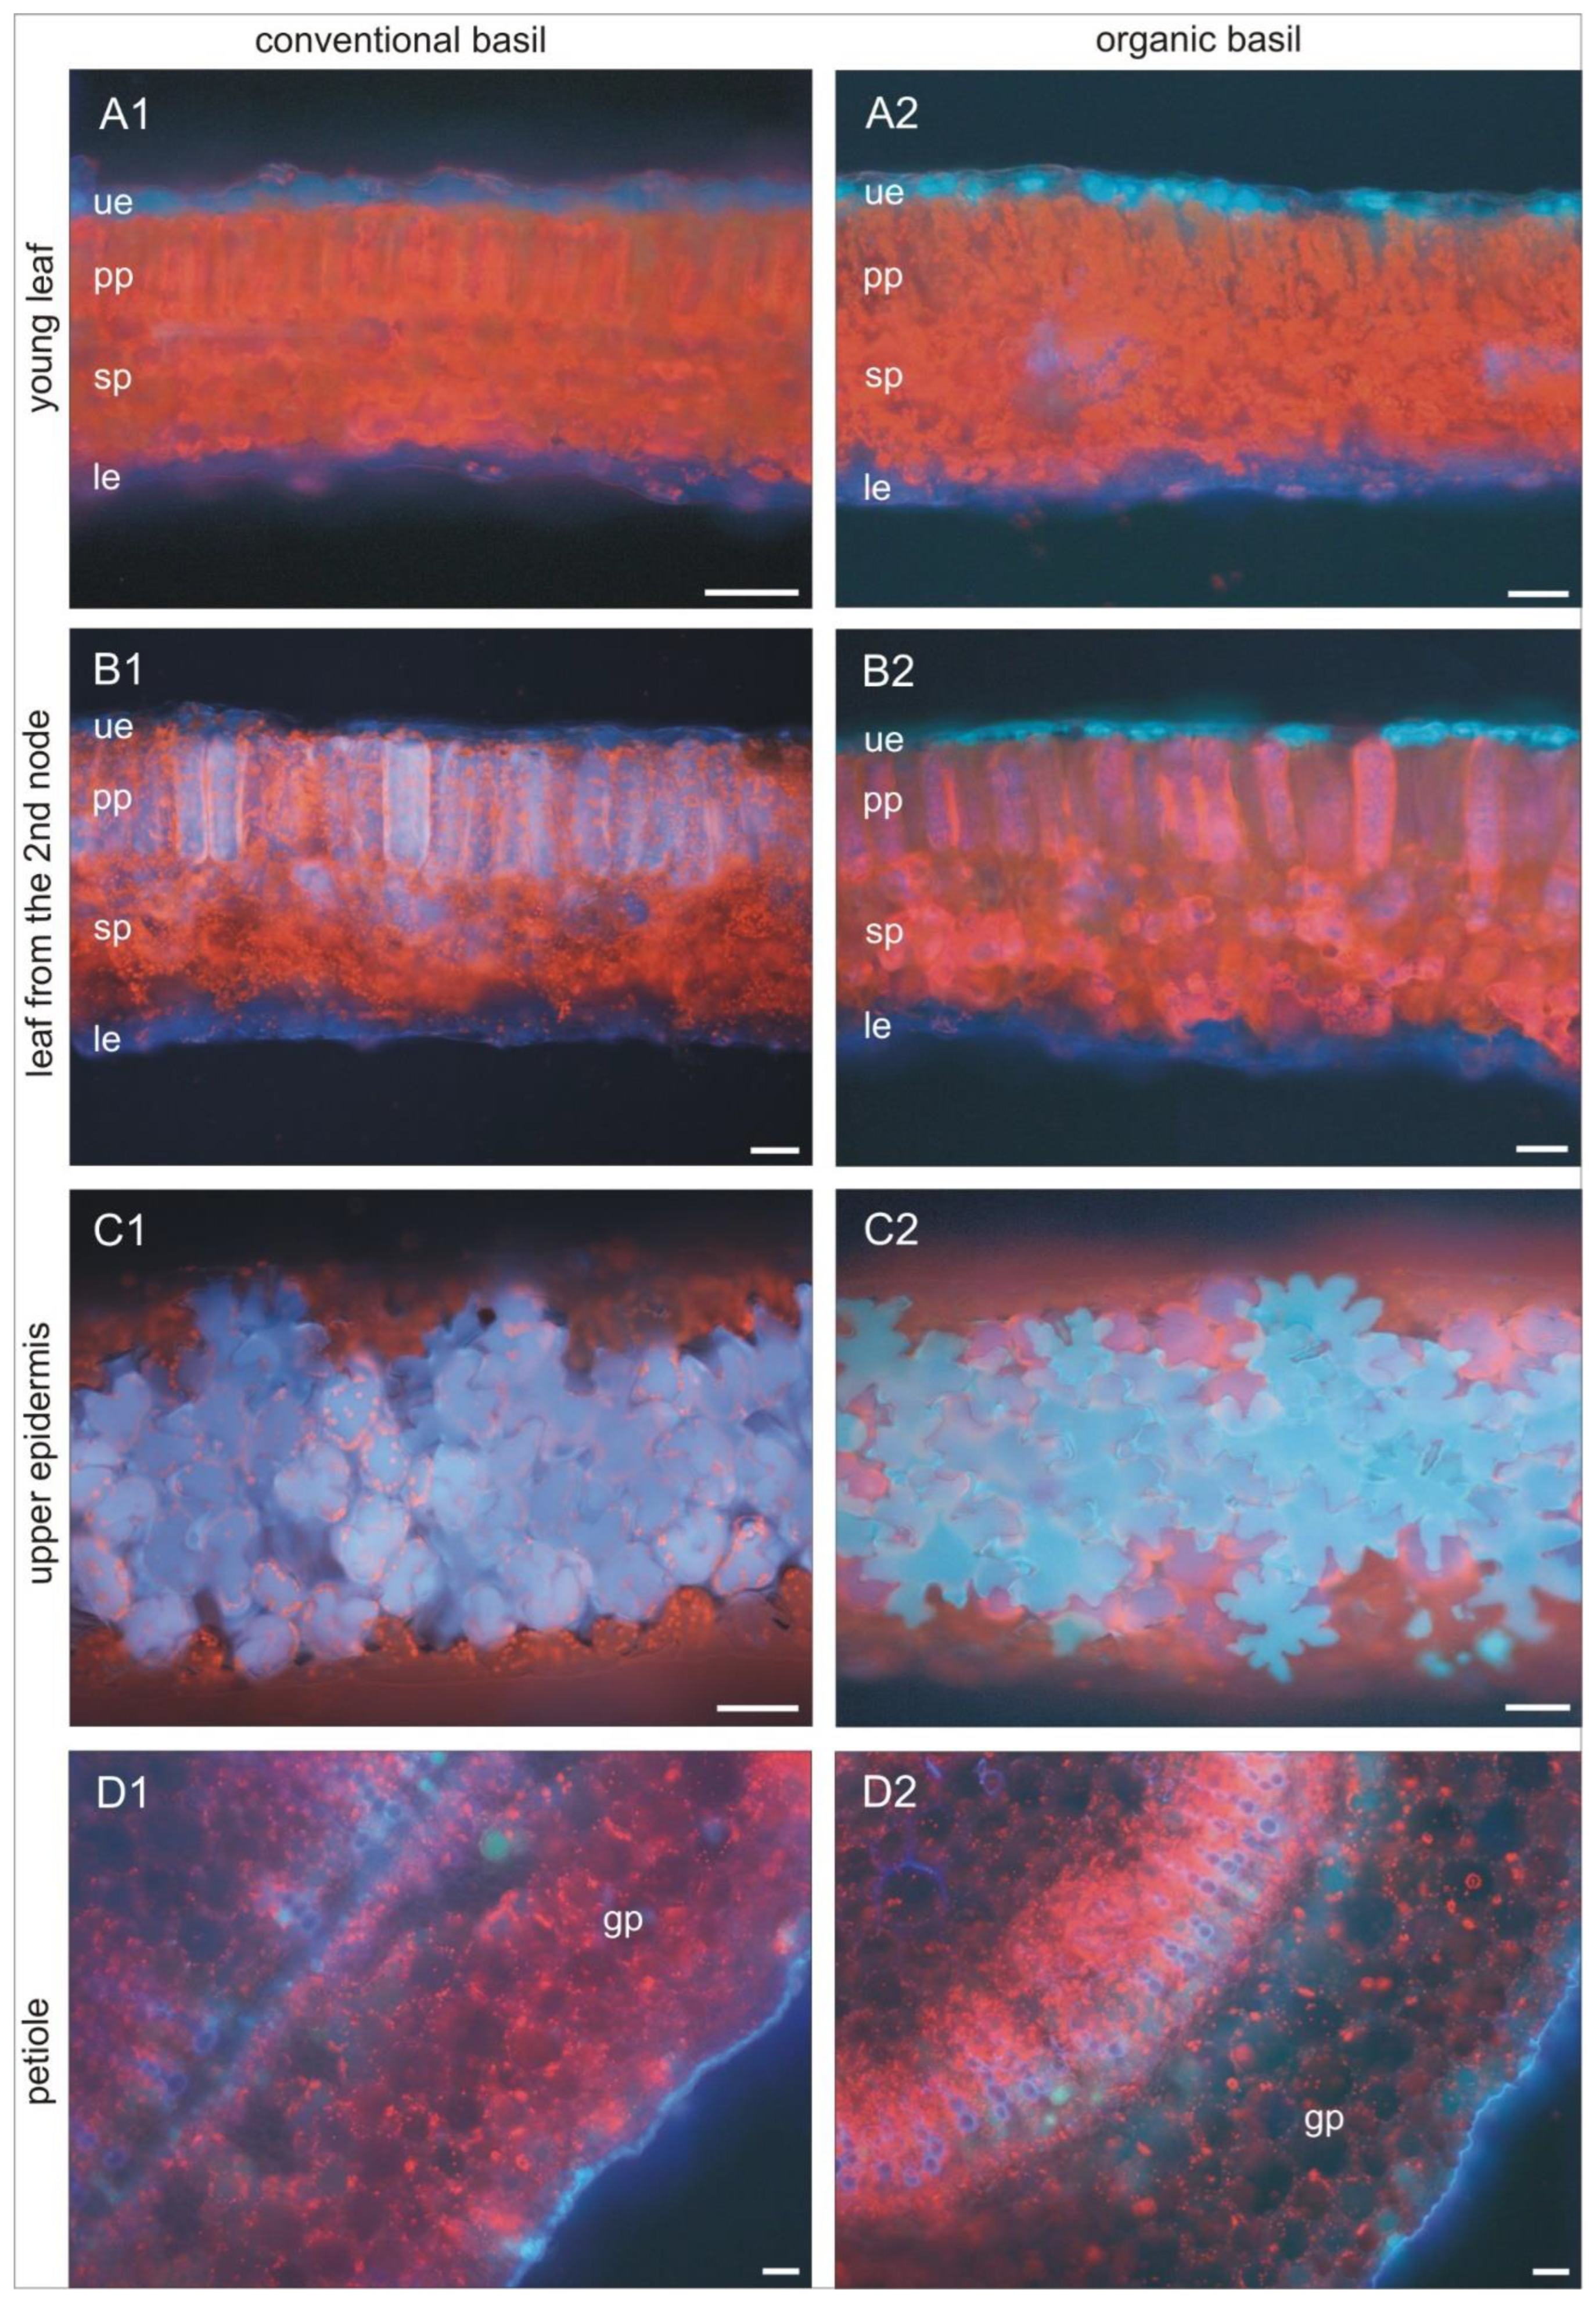

Table 1.
The content of bioactive compounds’ in total (in mg g-1 DW) and dry matter (in g 100 g-1 FW) in basil from two production systems and in three experimental year.
Table 1.
The content of bioactive compounds’ in total (in mg g-1 DW) and dry matter (in g 100 g-1 FW) in basil from two production systems and in three experimental year.
| bioactive compounds groups/experimental combination | 2019 | 2020 | 2021 | p-value | |||
| ORG | CONV | ORG | CONV | ORG | CONV | C x Y | |
| polyphenols | 4.341±0.93a2 | 4.16±0.59a | 4.71±1.25a | 4.33±2.01a | 6.66±0.80a | 6.57±0.83a | N.S.3 |
| phenolic acid | 3.97±0.56a | 4.09±0.58a | 4.56±1.11a | 4.01±2.24a | 5.70±0.90a | 5.60±0.80a | N.S. |
| flavonoids | 0.44±0.25a | 0.35±0.06a | 0.35±0.13a | 0.35±0.07a | 1.12±0.10a | 1.18±0.13a | N.S. |
| carotenoids | 0.66±0.16b | 0.80±0.07ab | 0.75±0.11b | 0.91±0.18a | 0.45±0.10c | 1.19±0.17a | <0.0001 |
| chlorophylls | 2.25±0.53b | 2.64±0.53ab | 2.16±0.31b | 3.15±0.45a | 1.86±0.73c | 2.79±1.11a | <0.0001 |
| dry matter | 13.34±3.59a | 11.01±2.32b | 11.52±2.95b | 10.95±4.59c | 12.06±5.15a | 9.68±4.91c | 0.0045 |
| bioactive compounds groups/experimental combination | C (cultivation) | Y (year) | p-value | ||||
| ORG | CONV | 2019 | 2020 | 2021 | C | Y | |
| polyphenols | 5.24±1.44A | 4.99±1.70A | 4.25±0.78b | 4.52±1.69b | 6.62±0.82a | N.S. | <0.0001 |
| phenolic acids | 4.74±1.14A | 4.56±1.59A | 4.03±0.57b | 4.29±1.79b | 5.65±0.85a | N.S. | 0.0005 |
| flavonoids | 0.64±0.38A | 0.61±0.40A | 0.40±0.19b | 0.35±0.11b | 1.15±0.12a | N.S. | <0.0001 |
| carotenoids | 0.72±0.23B | 0.85±0.28A | 0.73±0.14a | 0.83±0.17a | 0.82±0.40a | 0.002 | N.S. |
| chlorophylls | 2.44±0.76A | 2.55±0.81A | 2.44±0.57a | 2.66±0.63a | 2.33±1.05a | N.S. | N.S. |
| dry matter | 11.97±4.17A | 10.54±4.15B | 12.17±3.24a | 10.73±3.86b | 10.87±5.17b | 0.0001 | <0.0001 |
1Data are presented as the mean ± SD with ANOVA p-value; 2 Means in rows followed by the different letter are significantly different at the 5% level of probability (p<0.05); 3N.S. not significant statistically.
Table 2.
The content of individual compounds (in mg g-1 DW) in basil from two production systems and in three experimental year.
Table 2.
The content of individual compounds (in mg g-1 DW) in basil from two production systems and in three experimental year.
| individual compounds /experimental combination | 2019 | 2020 | 2021 | C (cultivation) | Y (year) | p-value | ||||||||
| ORG | CONV | ORG | CONV | ORG | CONV | ORG | CONV | 2019 | 2020 | 2021 | C | Y | C x Y | |
| gallic acid | 0.351±0.06a2 | 0.33±0.04a | 0.34±0.09a | 0.35±0.16a | 0.11±0.01a | 0.12±0.01a | 0.27±0.13A | 0.27±0.14A | 0.34±0.05a | 0.34±0.13a | 0.11±0.01b | N.S.3 | <0.0001 | N.S. |
| p-hydroxybenzoesic | 0.34±0.07b | 0.21±0.03c | 0.26±0.11c | 0.34±0.19b | 1.58±0.13a | 1.41±0.13a | 0.73±0.62A | 0.65±0.55A | 0.27±0.08b | 0.30±0.16b | 1.50±0.15a | N.S. | <0.0001 | 0.018 |
| caffeic | 2.14±0.23a | 1.90±0.41a | 2.47±0.52a | 2.31±0.19a | 2.34±0.27a | 2.05±0.23a | 2.32±0.39A | 2.08±0.53A | 2.02±0.35a | 2.39±0.64a | 2.19±0.29a | N.S. | N.S. | N.S. |
| p-coumaric | 0.06±0.04c | 0.23±0.04a | 0.10±0.07b | 0.15±0.05b | 0.04±0.00c | 0.29±0.02a | 0.07±0.05B | 0.22±0.08A | 0.14±0.09a | 0.13±0.09a | 0.16±0.12a | <0.0001 | N.S. | <0.0001 |
| ferulic | 0.054±0.002a | 0.063±0.001a | 0.054±0.002a | 0.053±0.002a | 0.025±0.001a | 0.014±0.001a | 0.044±0.002A | 0.043±0.003A | 0.058±0.001a | 0.053±0.002a | 0.020±0.001b | N.S. | <0.0001 | N.S. |
| benzoesic | 0.14±0.11a | 0.12±0.03a | 0.11±0.06a | 0.13±0.08a | 0.09±0.01a | 0.04±0.01a | 0.11±0.08A | 0.10±0.06A | 0.13±0.08a | 0.12±0.07a | 0.07±0.03b | N.S. | 0.025 | N.S. |
| kaempferol-3-O-glucoside | 0.028±0.001a | 0.037±0.001a | 0.027±0.001a | 0.025±0.001a | 0.043±0.001a | 0.044±0.001a | 0.033±0.001A | 0.035±0.001A | 0.032±0.001b | 0.026±0.001c | 0.044±0.001a | N.S. | <0.0001 | N.S. |
| myricetin | 0.038±0.010a | 0.058±0.010a | 0.054±0.030a | 0.059±0.030a | 0.034±0.001a | 0.106±0.050a | 0.042±0.020A | 0.075±0.040A | 0.048±0.010c | 0.056±0.030b | 0.070±0.050a | N.S. | 0.0007 | N.S. |
| luteolin | 0.017±0.001b | 0.024±0.001a | 0.021±0.001a | 0.024±0.010a | 0.019±0.001ab | 0.030±0.001a | 0.019±0.001 B | 0.026±0.010A | 0.020±0.010a | 0.022±0.010a | 0.024±0.010a | <0.0001 | N.S. | 0.046 |
| quercetin | 0.039±0.020a | 0.042±0.020a | 0.037±0.020a | 0.032±0.010ab | 0.019±0.001b | 0.045±0.001a | 0.032±0.020A | 0.040±0.010A | 0.041±0.020a | 0.035±0.020a | 0.032±0.010a | 0.036 | N.S. | 0.005 |
| quercetin-3-O-glucoside | 0.119±0.120b | 0.118±0.080b | 0.070±0.060c | 0.073±0.060c | 0.781±0.050a | 0.746±0.080a | 0.324±0.034A | 0.312±0.032A | 0.119±0.010b | 0.071±0.060c | 0.764±0.070a | N.S. | <0.0001 | <0.0001 |
| kaempferol | 0.029±0.001a | 0.032±0.010a | 0.021±0.001b | 0.022±0.001b | 0.028±0.001a | 0.017±0.001c | 0.026±0.010A | 0.023±0.010A | 0.030±0.010a | 0.021±0.001b | 0.022±0.010b | N.S. | 0.0004 | 0.007 |
| lutein | 0.13±0.02a | 0.11±0.06a | 0.17±0.05a | 0.12±0.07a | 0.10±0.01a | 0.07±0.02a | 0.13±0.04A | 0.10±0.05B | 0.12±0.04b | 0.15±0.06a | 0.09±0.02b | 0.022 | 0.0032 | N.S. |
| zeaxanthin | 0.027±0.001a | 0.027±0.010a | 0.027±0.001a | 0.024±0.010a | 0.023±0.001a | 0.020±0.001a | 0.026±0.001A | 0.023±0.010A | 0.027±0.010a | 0.026±0.001a | 0.021±0.001a | N.S. | N.S. | N.S. |
| beta-carotene | 0.52±0.15b | 0.40±0.03c | 0.57±0.16b | 0.40±0.07c | 0.20±0.02d | 0.94±0.02a | 0.43±0.21B | 0.58±0.28A | 0.46±0.12a | 0.49±0.15a | 0.57±0.39a | 0.0004 | N.S. | <0.0001 |
| chlorophyll a | 2.05±0.46ab | 1.82±0.47b | 2.63±0.28a | 1.78±0.35b | 1.41±0.46c | 2.30±0.82a | 2.03±0.64A | 1.97±0.63A | 1.93±0.48a | 2.21±0.53a | 1.85±0.80a | N.S. | N.S. | <0.0001 |
| chlorophyll b | 0.24±0.07a | 0.15±0.05ab | 0.16±0.05ab | 0.11±0.02b | 0.06±0.00c | 0.05±0.01c | 0.15±0.09A | 0.10±0.05B | 0.19±0.08a | 0.13±0.04b | 0.06±0.01c | 0.0002 | <0.0001 | 0.044 |
1Data are presented as the mean ± SD with ANOVA p-value; 2 Means in rows followed by the different letter are significantly different at the 5% level of probability (p<0.05); 3N.S. not significant statistically.
Table 3.
Enzymes activity, hydroxyperoxide concentration and antioxidant activity in basil from two production systems and three experimental years.
Table 3.
Enzymes activity, hydroxyperoxide concentration and antioxidant activity in basil from two production systems and three experimental years.
| activity/experimental combination | H2O2 | SOD | CAT | |
|---|---|---|---|---|
| µmol 100 mg-1 | units mg-1 | µmol H2O2 min-1 mg-1 | ||
| 2019 | ORG | 6.53±0.74b | 59.36±6.00a | 40.19±3.47a |
| CONV | 8.88±0.79a | 79.83±4.72a | 20.38±5.12b | |
| 2020 | ORG | 5.84±0.83bc | 58.21±6.79a | 40.10±6.44a |
| CONV | 9.07±0.16a | 79.27±3.80a | 26.98±3.26b | |
| 2021 | ORG | 5.76±0.94c | 55.26±3.96a | 37.53±4.12a |
| CONV | 7.44±0.46ab | 75.02±3.07a | 22.23±6.86b | |
| C (cultivation) | ORG | 6.04±0.91B | 57.61±5.69B | 39.28±5.00A |
| CONV | 8.47±0.90A | 78.04±4.47A | 23.19±5.98B | |
| Y (year) | 2019 | 7.70±1.40a | 69.60±11.57a | 30.28±10.83a |
| 2020 | 7.46±1.72a | 68.74±11.88a | 33.54±8.31a | |
| 2021 | 6.60±1.12b | 65.14±10.50b | 29.88±9.52b | |
| p-value | C | <0.0001 | <0.0001 | <0.0001 |
| Y | <0.0001 | <0.0001 | 0.0004 | |
| C x Y | <0.0001 | N.S. | 0.0035 | |
1 Data are presented as the mean ± SD with ANOVA p-value; 2 Means in columns followed by the different letters are significantly different at the level of probability (p<0.05); 3 N.S. not significant statistically.
Disclaimer/Publisher’s Note: The statements, opinions and data contained in all publications are solely those of the individual author(s) and contributor(s) and not of MDPI and/or the editor(s). MDPI and/or the editor(s) disclaim responsibility for any injury to people or property resulting from any ideas, methods, instructions or products referred to in the content. |
© 2024 by the authors. Licensee MDPI, Basel, Switzerland. This article is an open access article distributed under the terms and conditions of the Creative Commons Attribution (CC BY) license (http://creativecommons.org/licenses/by/4.0/).
Copyright: This open access article is published under a Creative Commons CC BY 4.0 license, which permit the free download, distribution, and reuse, provided that the author and preprint are cited in any reuse.


