
Submitted:
02 December 2024
Posted:
04 December 2024
You are already at the latest version
Abstract
Bovine Viral Diarrhea Virus (BVDV) is one of the most prevalent pathogens in Argentinian herds affecting the performance of both beef cattle and dairy cattle. The traditional approach of removing PI cattle to control BVDV infections is not feasible to implement at large scale in our country due to geographical and productive characteristics. In this study we evaluated the effect of a novel subunit targeted vaccine against BVDV to reduce the impact of the virus in dairy herds. Different reproductive, health and productive parameters including conception and abortion rates, open days, calves born per insemination, newborn and overall mortality, and milk production were studied for a ten-year period (2014 – 2023) in six different dairy farms from three different provinces of Argentina. Data were analyzed annually to study the evolution trend of each index and means were compared between two periods: years before and years after vaccine introduction to the herds. All the parameters analyzed showed a significant improvement after the incorporation of the targeted vaccine. The obtained results showed that vaccination with an effective non-replicating vaccine can be a successful approach to minimize the impact of BVDV in dairy farms.
Keywords:
Bovine Viral Diarrhea Virus 1
; Targeted Vaccine 2
; Dairy Farm 3
1. Introduction
Bovine Viral Diarrhea Virus (BVDV), one of the most important bovine pathogens worldwide and is responsible for enormous production losses in beef and dairy herds [1,2,3]. In this work we focused on the impact of the virus in dairy farms. BVDV belongs to the genus Pestivirus within the family Flaviviridae and includes three species, BVDV-1 (Pestivirus A), BVDV-2 (Pestivirus B), and Hobi-like pestivirus (HoBiPeV; Pestivirus H) [4]. The genome consists of a single-stranded, positive-sense RNA of 12.3–13 kb encoding a single open reading frame (ORF), which is flanked by 5′- and 3′-untranslated regions (UTRs) [4]. BVDV can affect both the reproductive tract of cows and bulls, or the semen in artificial insemination programs, at different levels that could leads to low fertility rates or even infertility, embryonic death, fetal loses and abortion as is reviewed by Oguejio, in 2019 [5]. BVDV infection during gestation can also lead to persistent fetal infection if dams are infected with a non citopatic virus biotype during the period of fetal immunocompetence development [6,7,8,9]. Moreover, BVDV infection can also result in fetal malformations in dams infected during the period of fetal organ formation, most probably due to viral-induced lesions, and disruption of embryogenesis that can lead to the development of congenital defects of several organ systems including cerebellar hypoplasia, hydrocephalus, ocular degeneration, thymic hypoplasia, pulmonary hypoplasia, brachygnathism, arthrogryposis, and growth retardation [9,10,11]. These congenital deformities lead to significant reproductive losses in the form of fetal losses, decreased calf yield, decreased availability of replacement heifers, dystocia and cows culled for reproductive problems [5].
Another important consequence of BVDV infection and the trademark of the BDV-viruses is immunosuppression that leads to a decrease in the number of white cells and platelets and a misfunction of immune cells in BVDV-infected cattle [12,13,14,15,16]. It also leads to the occurrence of increased disease and pathology severity when BVDV-infected cattle are coinfected with other pathogens such as Mannheimia haemolytica, bovine herpesvirus-1, bovine respiratory syncytial virus, and bovine Coronavirus [17,18,19,20,21,22,23]. Bovine respiratory disease may cause the greatest economic impact in the cattle feeding industry (feed lot) and dairy farms because of increased health related costs from morbidity and fatalities as well as decreased performance [24,25]. Vaccination against BVDV is an important component of prevention and control programs since it can prevent clinical signs of BRD, reduce viral spread and the birth of new persistently infected (PI) animals. In most countries, only modified live vaccines (MLV) and inactivated vaccines are used in vaccination programs. Both have historical disadvantages; MLV in terms of safety and inactivated vaccines in terms of immune protection. Over the last decade, our research group developed and optimized the first targeted subunit BVDV vaccine (BVD-TV). The core of the BVD TV is the E2 protein of the virus (Singer strain, BVDV 1a) fused to single chain antibody called APCH, that acts as a targeting molecule [26]. The APCH single chain antibody is directed against an invariant MHC II epitope. It was first developed and tested in swine but has now been shown to cross react with several species, including bovines [27,28,29]. The vaccine is produced in SF9 cells utilizing the baculovirus production system and was first released to the market in 2018. Vaccine immunogenicity tested in guinea pigs and cattle and efficacy results in feedlot cattle had been previously published [30,31]. In the current work we present new results regarding the improvement of herd reproductive and productive parameters collected during a ten-year period in six commercial dairy farms from three different provinces of Argentina that incorporated the BVD-TV to their routine vaccination schedules. A total of 256627 inseminations were studied, leading to 105175 pregnant dams and 77051 calves born alive, which represents one of the greatest BVDV-vaccine studies ever conducted and reported.
2. Materials and Methods
Dairy Farms: The longitudinal study includes six dairy farms (Dairy Farm 1 to 6) from 3 different provinces of Argentina: Dairy Farms 1 to 3 are located in Santa Fe, Dairy Farms 4 and 5 in Entre Ríos and Dairy Farm 6 in Buenos Aires provinces, respectively. All farms tested positive to BVDV infection. Information of the dairy farms is presented in Table 1.
Vaccines and Vaccine protocol: the different dairy farms have similar standard vaccination protocols:
Respiratory vaccine: a combined vaccine containing inactivated cultures of Bovine Alpha herpesvirus 1 (BoAHV1), bovine viral diarrhea virus (BVDV) and parainfluenza-3 virus (PI3) and bacterins of Mannheimia haemolytica, Pasteurella multocida and Histophilus somni. Calves received the first dose of respiratory vaccine between 45 and 60 days of age and the second dose 21 days later. The third dose was applied when the animals reach 180 kg, around 6 months of age.
Reproductive vaccine: a combined vaccine containing inactivated cultures of Bovine Alpha herpesvirus 1 (BoAHV1), bovine viral diarrhea virus (BVDV) and bacterins of Histophilus somni, Campylobacter fetus fetus, Campylobacter fetus veneralis, Leptospira interrogans and Leptospira borgpetersenii. Heifers received the first dose of reproductive vaccine at the eleventh months of age, the second dose 30 days later and the third dose at pregnancy confirmation. Cows received two doses, the first when they were cleared to breeding (50 to 60 days post-partum) and the second at pregnancy confirmation.
Targeted vaccine against BVDV (BVD-TV): Vedevax Block® (Bioinnovo S.A.) targeted subunit vaccine against BVDV [30]. Heifers received the first dose of the BVD-TV at the eleventh month of age, the second dose 30 days later and the third 30 days pre-partum. Cows received two doses, the first when they were cleared to breeding (50 to 60 days post-partum) and the second at confirmation of pregnancy (Figure 1).
Data collection: Data from all dairy farms were collected using the DairyComp 305® software (Valley Ag. Software). Data was collected individually from each dairy farm and then analyzed individually for each dairy farm or as the average of all farms for each parameter evaluated.
Parameters Evaluated: In this study all the reproductive, mortality rates and productive parameters were annually estimated and divided in three stages: i) the years before the introduction of the BV- TV (Pre-BVD TV), ii) year 0, when the BVD-TV was introduced, and iii) years after the introduction of the BVD-TV (Post-BVD TV). The different parameters evaluated were:
- (a)
- Conception Rate: defined as the number of pregnant out of all the inseminated dams. In the dairy farms included in this study gestation is diagnosed between days 35 and 45 post insemination.
- (b)
- Abortion Rate: defined as the number of pregnant dams that lost the pregnancy at any gestation point after being diagnosed pregnant.
- (c)
- Days Open: refers to the interval between calving and conception (DO).
- (d)
- Calves per Insemination ratio: defined as the ratio between the number of calves born that live more than 24 h and the number of inseminations performed.
- (e)
- Neonatal mortality: defined as the death of a live-born calf within the first 24 hours of life.
- (f)
- Overall Mortality: defined as the ratio between the number of death and the average number of animals present in the dairy farm. It does not include neonatal mortality.
- (g)
- Milk Production: defined as the average milk production per cow per day.
BVDV Infection Analysis
Viral circulation on the dairy farms was evaluated using a commercial anti-P80 ELISA (CIVTEST BOVIS BVD/BD P80, HIPRA) following the manufacturer’s instructions. Serum samples were taken between February and April 2024. Data from 97 farms (beef and dairy) of the same region collected during 2023 and 2024 were used as controls.
Statistical Analysis
Three different statistical analyses were conducted. The first one included the comparison of all the parameter rates two-year pre-vaccination compared with the rate obtained two years post-vaccination, excluding year 0 of vaccine introduction (2YPP). The second analysis compared the parameter rates included the same numbers of years pre and post-vaccination excluding year 0 (SYPP). And the third one, included all the years available for each dairy farm over a 10-years span from 1/1/2014 to 12/31/2023 (10YS) (Figure 2).
In all cases the Chi-square test was used for comparison of proportions. However, when the Chi-square test assumptions were not met, the Fisher’s exact test was applied to ensure the accuracy of the results. Additionally, a contingency analysis was conducted pre- and post-vaccination, odds ratios were calculated using the Baptista-Pike method [32].
Mean rates pre and post-vaccination in each farm and as a whole was compared using a paired Student T test, using the Welch correction when homoscedasticity assumption was not met. A repeated measures ANOVA was conducted to determine the evolution of each mean parameter through time. The different parameters on the farms were analyzed by a general linear mixed statistical model (GLMM). The model included two main fixed factors: farms (Dairy farms 1 to 6) and time (years pre and post vaccination). Animals were included in the model as a random variable. The GLMM analysis was conducted by using the Glimmer function (lme4 package, R Development Core Team, 2014). The analysis was performed with R 3.0.3 (R Development Core Team, 2014). Statistical significance was assessed at p < 0.05 for all comparisons.
Finally, a linear regression analysis was conducted pre- and post-BVD.TV incorporation to evaluate the evolution trend of the indexes.
Figure 2: Years evaluated for each dairy farm.
3. Results
The viral circulation analysis revealed a significant decrease (Fisher Exact Test, p < 0.0001) in BVDV circulation measured and the proportion of animal seropositive for antibodies against P80 viral protein in the dairy farms that included the BVD-TV at the end of the study period compared with proportion of seropositive cattle in control farms located the same region (Figure 3). The comparison of P80 antibody prevalences in the farms under study with other farms from the same region tested in 2024, was performed because there was no data available from all the farms under study in the pre-BVD TV period.
Figure 3: Viral Circulation Analysis
To analyze the effect of the BVD-TV on the dairy farms different parameters were evaluated both annually and as the summation the years before and after the application of the BVD-TV. The parameters can be grouped in three categories: i) reproductive parameters: conception and abortion rate, open days, and calves born per insemination; ii) mortality rates: neonatal and overall herd mortality; and iii) productive parameters: milk production.
The results of the comparison of reproductive, mortality rates and productive rates over the same number of years before and after BVD-TV application (SYPP) are shown in Table 2. The SYPP analysis demonstrated a significant improvement in all the parameters evaluated which were like those observed in the preliminary 2YPP analysis (data not shown, available upon request).
Table 2: Bold types with asterisks indicate significant differences. OR: Odds Ratio. IC95: 95% confidence interval.
Reproductive parameters:
Conception rate: the SYPP analysis shows this index increased significantly 4.4 points from 39.1% the years before to 43.5% the years after vaccine introduction. Odd ratios analysis shows that after the introduction of the BVD-TV cows have 22% more chances of getting pregnant when the is applied (Table 2).
The 10YS analysis, farm by farm, shows a significant increase in dairy farms 1, 3, 4 and 5 as well as a non-significant increase in farms 2 and 6 (Figure 4 and Table S1).
Figure 4: Conception Rate by farm
The average conception rate of the six dairy farms in the 10YS analysis indicated a significant increase of 5.4%, from 37.9% to 43.3% (Figure 5).
Figure 5: Conception Rate, average
Abortion Rate: The SYPP analysis shows a significant decrease in the dairy farms evaluated (Table 2). The 10YS analysis farm by farm showed a significant decrease in dairy farms 1 and 6 as well as a non-significant decrease in farms 2, 3, 4 and 5 (Figure 6 and Figure 1 SM & Table S2).
Figure 6: Abortion Rate
After the introduction of the BVD-TV a significant trend to reduce the abortion rate was observed (Figure 7). As examples, after 6 year of systematic vaccination Farm 1 reduced the abortion rate from 21% to 11% and Farm 2 went from 16% to 7% in three years Figure 1 SM). The overall result went from no trend in the years pre-vaccination to a significant linear reduction of 0.77 percentual points per year in the post vaccination period (R2=0.76, p-value=0.02).
Figure 7: Abortion Rate Tendency
Days Open: The SYPP analysis shows a significant decrease in 11 days open from 131 days open the years pre-BVD TV to 120 days open the years post-BVD TV (Table 2). The 10YS analysis farm by farm showed a significant decrease in dairy farms 1, 2, 4 and 6 as well as a non-significant decrease in farms 3 and 5 (Figure 8 and Table S3).
Figure 8: Days Open by farm
The Days open average of the six dairy farms in the years before and after the application of the BVD-TV indicated a significant decrease of 11 days, from 130 to 119 days (Figure 9).
Figure 9: Days open, average
Calves born per Insemination ratio: the final parameter among the reproductive parameters, encompassing all other reproductive parameters, is the Calves born per Insemination ratio. The SYPP analysis shows a significant increase of 5% from 28% the years pre-BVD TV to 33% the years pre-BVD TV calves born per insemination. OR analysis indicates that the chances of an inseminated cow delivering a live calf were increased in a 22% (Table 2). The 10YS analysis shows a significant increase in dairy farms 1, 2 and 4 as well as a non-significant increase in farms 5 and 6. On the other hand, dairy farm 3 showed a non-significant decrease, primarily because in year pre -3, the first year with data from this farm, the index was exceptionally high at 42% (Figure 10 and Table S4).
Figure 10: Calves per insemination ratio by farm
The overall mean rates of calves born per insemination of the six dairy farms in the years before and after the application of the BVD-TV indicated a significant increase of 6%, from 27% to 33% (Figure 11).
Figure 11: Calves per insemination ratio.
The kinetics of the reproductive parameters are summarized in Figure 12A and Figure 12B. In both graphs, greater separation between the lines and bars indicates better reproductive performance.
Figure 12: Kinetics of reproductive parameters, average
Mortality Rates:
Neonatal mortality: The SYPP analysis shows a significant decrease of 1,7%, from 6% the years pre-BVD TV to 4.3% days open the years post-BVD TV. The OR analysis for neonatal mortality revealed that a calf has 61% more chance to survive the first 24 h after the application of the BVD-TV against BVDV than before (Table 2). The 10YS analysis farm by farm shows a significant decrease in dairy farms 1 and 2 as well as a non-significant decrease in farms 3 to 6 (Figure 13 and Table S5).
Figure 13: Neonatal Mortality by farm
The neonatal mortality average of the six dairy farms in the years before and after the application of the BVD-TV presented a significant reduction of 2.8%, from 7% to 4.2% days (Figure 14)
Figure 14: Neonatal Mortality, average
Overall mortality: The SYPP analysis shows a significant decrease of 1.4%, from 9.0% the years pre-BVD TV to 7.6% the years post-BVD TV. The OR analysis for overall mortality revealed that bovines in the dairy farms evaluated have 26% more chances to survive after the application of the BVD-TV against BVDV than before (Table 2). The 10YS analysis farm by farm reveals a significant decrease in dairy farms 1, 2 and 5 as well as a non-significant decrease in farms 4 and 6. On the other hand, dairy farm 3 showed a non-significant increase, primarily influenced by the dry weather that affect the area in the years after the introduction of the vaccine (Figure 15 and Table S6).
Figure 15: Overall Mortality by farm
The overall mortality average of the six dairy farms in the years before and after the application of the BVD-TV presented a significant reduction of 2,6%, from 10.1% to 7.5% (Figure 16)
Figure 16: Overall Mortality
In the Figure 17 the kinetic of the mortality rates is represented.
Figure 17: Mortality Rates kinetic in the 6 dairy farms, average
Productive parameters
Milk production: The SYPP analysis shows a significant increase of the mean daily cow production of 2,34 L, from 25,85 the years pre-BVD TV to 28,19 L the years post-BVD TV (Table 2). The 10YS analysis farm by farm shows a significant increase in dairy farms 1 and 5 as well as a non-significant increase in farms 2, 3, 4 and 6 (Table 3).
Table 3: Bold type with asterisks indicates significant differences between means pre- vs post vaccination period within each farm (paired Student T Test).
The average daily milk production per cow of the six dairy farms in the years before and after the application of the BVD-TV presented a significant increase of 2 L, from 25.9 L to 27.9 L pre- vs post- vaccine introduction in the farms (Figure 18).
Figure 18: Milk production, average
The kinetic of the milk production is summarized in Figure 19.
Figure 19: Kinetic of milk production, average
4. Discussion
BVDV have been eradicated or is in the path to eradication in some European countries due to an extended campaign focused on the detection an elimination of PI animals with or without vaccination [33]. But on developing countries like Argentina, with large herds and extensive production system, this control strategy focused on PI elimination is not feasibly to reach at country level. It could be reached at individual farm level, but in the current economical and productive situation it is not feasibly to achieve at regional, province or country level. Therefore, an alternative approach to control and minimize the negative impact of the BVDV infection should be implemented. The strategy to minimize the impact of the virus was to add a targeted subunit BVD-TV to the current vaccination programs, vaccinating all animals in the herd, starting at 6 months of age. There is a previous work applying a similar strategy showing the impact of a live-attenuated vaccine (BVDV-MLV) in four dairy farms in Europe [34]. But in Argentina we cannot use this strategy since MLV are forbidden and only non-replicative vaccines are allowed. Vedevax Block® is the first recombinant targeted subunit vaccine approved to be used in bovines worldwide [35]. In the dairy farms under study combined killed vaccines were also used, before and after the introduction of the recombinant vaccine, with mild effect against BVDV. The synergistic effect of traditional killed vaccines and the BVD-TV was previously discussed. Although it cannot be completely ruled out, its influence in the improvement of the reproductive and production parameters evaluated appears to be significant [31].
To measure the impact of the BVD-TV introduction into the vaccine calendar data from more than 100,000 animals on 6 farms for a ten-year period was evaluated. Reproductive, mortality rates and production parameters were tested using different statistical approaches and significant improvements in all the parameters were observed after vaccine introduction. All farms tested positive for BVDV which was expected since the virus is endemic in the country [36] and almost 100% of the dairy farms tested positive for infection-related antibodies in milk tanks [37], but the average of animals showing signs of infection was significantly reduced in the farms under study after the incorporation of the vaccine, revealing the protective effect of the BVD-TV on the field and the massive impact that this virus may have in the dairy farms.
An important issue is that to a greater or lesser extent in the six farms there was an improvement in all the seven parameters evaluated (conception and abortion rates, days open, calves born per service, neonatal and overall mortality, and average daily milk production) after the introduction of the BVD-TV.
The 6% increment in the rate of calves born per insemination achieved post versus pre-BVD TV from 27% to 33%, resulted in the birth of a total of 2463 more calves post-BVD TV introduction in the vaccine calendar of the farms. This improvement was achieved together with a reduction of services in 12,861. The improvement in reproductive efficiency has a significant impact on dairy farms, as it affects not only the number of animals but also the milk production and heifer replacements.
To analyze the incidence of factors other than the BVD-TV, such as annual differences due to climate or external factors or a trend toward improved productivity on dairy farms, national data were evaluated from two databases. Different databases presented data in different manners, so we chose the two parameters with year-by-year data to compare: conception rate and milk production.
The conception rate outcome of the dairy farms in the study was compared with the outcome of almost 200 Argentinian dairy farms users of the DairyComp 305 software (DC 305 users) (Apendix B). At the national level the conception rate maintained stable from 2014 to 2020 between 31% and 32% and then improved to 35% in 2021. This behavior contrasts to the one observed in the analyzed dairy farms where a clear trend to the improvement was observed after the incorporation of the BVD-TV. It is important to note that there was not such a trend before the incorporation of the BVD-TV in these farms. Furthermore, the improvement in reproductive performance places the dairy farms in the top 15% of DC 305 users in Argentina, both in terms of conception and abortion rates.
To analyze milk production data from the National Minister of Agriculture was used (https://www.magyp.gob.ar/sitio/areas/ss_lecheria/estadisticas/_01_primaria/index.php). Data shows a peak of production in 2015 and then a decline from to 2016 to 2019, a slight recovery from 2020 to 2022 and again a drop in the milk production in 2023. Again, at national level milk production does not follow a tendency to improve in the period evaluated as it does in the six dairy farms after the incorporation of the BVD-TV.
Furthermore, in terms on annual or climate factors as it is a longitudinal analysis which not started at the same time, all the years between 2018 and 2021 could be year 0, pre or post vaccination depending on the farms. For example, 2020 is year 0 in farm 4, post-BVD-TV in farms 1 to 3 and pre-BVD-TV in farms 5 and 6, so positive or negative annual variances would affect both the pre and post vaccination periods depending on the farm.
Considering all these facts it cannot be discarded the influence of external variable in the observed results, but the influence of such factors would be minor and cannot explain the significant results that were consistently observed in the different seven parameters tested in six different farms located in 3 different provinces and with vaccination program starting at different time points.
Two critical aspects of BVDV infection are immunosuppression and foetal infections, both factors contributing to calf mortality. Interestingly, a recent study reported a reduction in the calves’ mortality index from 7.45% to 4.38% after implementing a control program based on the detection and elimination of PI animals [38]. These results are comparable to those obtained in the dairy farms included in this study, which implemented a BVD control program based on vaccination with a BVD-TV.
5. Conclusions
The addition of a subunit BVD-TV against BVDV into the vaccination programs of dairy farms contributed to a reduction in the viral circulation and an improvement in productive, reproductive and health parameters such as abortion and conceptions rates, days open, neonatal and general mortality and daily milk production. These findings highlight the importance of incorporating a BVD-TV with an excellent safety profile and DIVA capacity into comprehensive BVDV control strategies to enhance overall herd health and productivity.
Supplementary Materials
The following supporting information can be downloaded at the website of this paper posted on Preprints.org.
Author Contributions
“Conceptualization, Demian Bellido, Emanuel Gumina, Viviana Parreño and Andrés Wigdorovitz.; software, Diego Wenz; validation, Emanuel Gumina and Viviana Parreño; formal analysis, Emanuel Gumina and Viviana Parreño; investigation, Demian Bellido, Diego Wenz, Martin Schang, Facundo Tibaldo and Pablo Mangioni; resources, Andrés Wigdorovitz; data curation, Demian Bellido and Diego Wenz; writing—original draft preparation, Demian Bellido; writing—review and editing, Emanuel Gumina, Viviana Parreño and Andrés Wigdorovitz; visualization, Demian Bellido; supervision, Viviana Parreño and Andrés Wigdorovitz; project administration, Demian Bellido; funding acquisition, Andrés Wigdorovitz. All authors have read and agreed to the published version of the manuscript.”
Funding
“This research received no external funding”
Institutional Review Board Statement
“The research was carried out according to the Guide for the Care and Use of Agricultural Animals in Research and Teaching (3rd ed. 2010) as outlined by The American Society of Animal Science [39].”
Data Availability Statement
the original data presented in the study are openly available in Appendix A.
Acknowledgments
We would like to express our appreciation to Jeffrey W. Hall for editing and reviewing the final manuscript. We also want to thank Pablo Biga and Valeria González from VAS Argentina for sharing the DairyComp 305 users’ data.
Conflicts of Interest
Demian Bellido and Andrés Wigdorovitz are employees of Bioinnovo SA; Diego Wenz, Martin Schang, Facundo Tibaldo, Pablo Mangioni and Emanuel Gumina are employees of Vetanco SA.
Appendix A
The Appendix A contents the raw data from all dairy farms, the raw data for viral circulation, tables with two-way ANOVA and graph resulted from the general linear mix model of repeated measures through time.
Appendix B
The Appendix B contents the databases analysis of DC305 users from Argentina and Chile and Uruguay.
References
- Houe H. Epidemiological features and economical importance of bovine virus diarrhoea virus (BVDV) infections. Vet Microbiol. 1999;64(2-3):89–107. [CrossRef]
- Gunn GJ, Stott AW, Humphry RW. Modelling and costing BVD outbreaks in beef herds. Veterinary Journal. 2004;167(2). [CrossRef]
- Gunn GJ, Saatkamp HW, Humphry RW, Stott AW. Assessing economic and social pressure for the control of bovine viral diarrhoea virus. In: Preventive Veterinary Medicine. Vol 72. ; 2005. [CrossRef]
- ICTV. Genus Pestivirus [WWW Document]. 2020. Accessed November 9, 2022. Available online: https://ictv.global/report/chapter/flaviviridaeport/flaviviridaeport/flaviviridae/pestivirus.
- Oguejiofor CF, Thomas C, Cheng Z, Wathes DC. Mechanisms linking bovine viral diarrhea virus (BVDV) infection with infertility in cattle. Anim Health Res Rev. 2019;20(1):72-85. [CrossRef]
- Brownlie J, Hooper LB, Thompson I, Collins ME. Maternal recognition of foetal infection with bovine virus diarrhoea virus (BVDV)—the bovine pestivirus. Clin Diagn Virol. 1998;10(2-3):141-150. [CrossRef]
- Harding MJ, Cao X, Shams H, et al. Role of bovine viral diarrhea virus biotype in the establishment of fetal infections. Am J Vet Res. 2002;63(10):1455-1463. [CrossRef]
- Grooms DL. Reproductive consequences of infection with bovine viral diarrhea virus. Vet Clin North Am Food Anim Pract. 2004;20(1):5-19. [CrossRef]
- Lanyon SR, Hill FI, Reichel MP, Brownlie J. Bovine viral diarrhoea: Pathogenesis and diagnosis. The Veterinary Journal. 2014;199(2):201-209. [CrossRef]
- Baker JC. The Clinical Manifestations of Bovine Viral Diarrhea Infection. Veterinary Clinics of North America: Food Animal Practice. 1995;11(3):425-445. [CrossRef]
- Blanchard PC, Ridpath JF, Walker JB, Hietala SK. An Outbreak of Late-Term Abortions, Premature Births, and Congenital Deformities Associated with a Bovine Viral Diarrhea Virus 1 Subtype b that Induces Thrombocytopenia. Journal of Veterinary Diagnostic Investigation. 2010;22(1):128-131. [CrossRef]
- Walz PH, Bell TG, Wells JL, et al. Relationship between degree of viremia and disease manifestations in calves with experimentally induced bovine viral diarrhea virus infection. Am J Vet Res. 2001;62(7):1095-1103. [CrossRef]
- Roth JA, Kaeberle ML. Suppression of neutrophil and lymphocyte function induced by a vaccinal strain of bovine viral diarrhea virus with and without the administration of ACTH. Am J Vet Res. 1983;44(12):2366-2372.
- Kelling CL, Steffen DJ, Topliff CL, Eskridge KM, Donis RO, Higuchi DS. Comparative virulence of isolates of bovine viral diarrhea virus type II in experimentally inoculated six- to nine-month-old calves. Am J Vet Res. 2002;63(10):1379-1384. [CrossRef]
- Abdelsalam K, Rajput M, Elmowalid G, et al. The effect of bovine viral diarrhea virus (BVDV) strains and the corresponding infected-macrophages supernatant on macrophage inflammatory function and lymphocyte apoptosis. Viruses. 2020;12(7). [CrossRef]
- Chase CCL, Thakur N, Darweesh MF, Morarie-Kane SE, Rajput MK. Immune response to bovine viral diarrhea virus - Looking at newly defined targets. Anim Health Res Rev. 2015;16(1). [CrossRef]
- Potgieter LN, McCracken MD, Hopkins FM, Walker RD. Effect of bovine viral diarrhea virus infection on the distribution of infectious bovine rhinotracheitis virus in calves. Am J Vet Res. 1984;45(4).
- Potgieter LN, McCracken MD, Hopkins FM, Walker RD, Guy JS. Experimental production of bovine respiratory tract disease with bovine viral diarrhea virus. Am J Vet Res. 1984;45(8).
- Fulton RW, Purdy CW, Confer AW, et al. Bovine viral diarrhea viral infections in feeder calves with respiratory disease: Interactions with Pasteurella spp., parainfluenza-3 virus, and bovine respiratory syncytial virus. Canadian Journal of Veterinary Research. 2000;64(3).
- Kelling CL, Brodersen BW, Perino LJ, Cooper VL, Doster AR, Pollreisz JH. Potentiation of bovine respiratory syncytial virus infection in calves by bovine viral diarrhoea virus. World Association for Buiatrics - Xix Congress, Vols 1-3: Vols 1-2: Proceedings; Vol 3: Poster Presentation. Published online 1996.
- Carlos-Valdez L, Wilson BK, Burciaga-Robles LO, et al. Effect of timing of Mannheimia haemolytica challenge following short-term natural exposure to bovine viral diarrhea virus type 1b on animal performance and immune response in beef steers1. J Anim Sci. 2016;94(11):4799-4808. [CrossRef]
- Burciaga-Robles LO, Step DL, Krehbiel CR, et al. Effects of exposure to calves persistently infected with bovine viral diarrhea virus type 1b and subsequent infection with Mannheima haemolytica on clinical signs and immune variables: Model for bovine respiratory disease via viral and bacterial interaction1,2. J Anim Sci. 2010;88(6):2166-2178. [CrossRef]
- Ridpath JF, Fulton RW, Bauermann F V., Falkenberg SM, Welch J, Confer AW. Sequential exposure to bovine viral diarrhea virus and bovine coronavirus results in increased respiratory disease lesions: clinical, immunologic, pathologic, and immunohistochemical findings. Journal of Veterinary Diagnostic Investigation. 2020;32(4). [CrossRef]
- Houe H. Economic impact of BVDV infection in dairies. In: Biologicals. Vol 31. ; 2003. [CrossRef]
- Smith R. Effects of Feedlot Disease on Economics, Production and Carcass Value. American Association of Bovine Practitioners. 2000;33:125-128. [CrossRef]
- Pecora A, Malacari DA, Pérez Aguirreburualde MS, et al. Development of an enhanced bovine viral diarrhea virus subunit vaccine based on E2 glycoprotein fused to a single chain antibody which targets to antigen-presenting cells. Rev Argent Microbiol. 2015;47(1):4-8. [CrossRef]
- Gil F, Pérez-Filgueira M, Barderas MG, et al. Targeting antigens to an invariant epitope of the MHC Class II DR molecule potentiates the immune response to subunit vaccines. Virus Res. 2011;155(1):55-60. [CrossRef]
- Argilaguet JM, Pérez-Martín E, Gallardo C, et al. Enhancing DNA immunization by targeting ASFV antigens to SLA-II bearing cells. Vaccine. 2011;29(33):5379-5385. [CrossRef]
- Borrego B, Argilaguet JM, Pérez-Martín E, et al. A DNA vaccine encoding foot-and-mouth disease virus B and T-cell epitopes targeted to class II swine leukocyte antigens protects pigs against viral challenge. Antiviral Res. 2011;92(2):359-363. [CrossRef]
- Bellido D, Baztarrica J, Rocha L, et al. A novel MHC-II targeted BVDV subunit vaccine induces a neutralizing immunological response in guinea pigs and cattle. Transbound Emerg Dis. 2021;68(6):3474-3481. [CrossRef]
- Bellido D, Gumina E, Rodríguez Senes G, et al. First evaluation of the impact of a targeted subunit vaccine against bovine viral diarrhea virus in feedlot cattle. Transl Anim Sci. 2024;In Press. [CrossRef]
- Mantel N, Halperin M. The Baptista-Pike Algorithm (AS 115). J R Stat Soc Ser C Appl Stat. 1981;30(1):73-75. [CrossRef]
- Moennig V, Yarnall MJ. The Long Journey to BVD Eradication. Pathogens. 2021;10(10):1292. [CrossRef]
- Schmitt-van de Leemput E, Metcalfe LVA, Caldow G, Walz PH, Guidarini C. Comparison of milk production of dairy cows vaccinated with a live double deleted BVDV vaccine and non-vaccinated dairy cows cohabitating in commercial herds endemically infected with BVD virus. PLoS One. 2020;15(10):e0240113. [CrossRef]
- Al-Kubati AAG, Hussen J, Kandeel M, Al-Mubarak AIA, Hemida MG. Recent Advances on the Bovine Viral Diarrhea Virus Molecular Pathogenesis, Immune Response, and Vaccines Development. Front Vet Sci. 2021;8. [CrossRef]
- Pacheco JM, Lager I. [Indirect method ELISA for the detection of antibodies against bovine diarrhea virus in bovine serum]. Rev Argent Microbiol. 2003;35(1):19-23.
- Favaro P, Molineri AI, Occhi HLJ, Dus Santos MJ, Clavinho LF, Pecora A. Relevamiento de anticuerpos contra el virus de la diarrea viral bovina en muestras de leche de tanque provenientes de la provincia de Santa Fe. In: Congress of Veterinary Microbiology. AAVLD; 2021:313-314. Accessed April 18, 2024. Available online: https://www.aavld.org.ar/publicaciones/LIBRO-DE-RESUMENES-I-CMV-2021.pdf.
- Dobos A, Dobos V, Kiss I. How control and eradication of BVDV at farm level influences the occurrence of calf diseases and antimicrobial usage during the first six months of calf rearing. Ir Vet J. 2024;77(1):19. [CrossRef]
- Fass. Guide for the Care and Use of Agricultural Animals in Research and Teaching. 4th Edition. (Tucker CB, MacNeil MD, Webster AB, eds.).; 2010.
Figure 1.
BVD-TV Vaccination protocol. FTAI= Fixed time artificial insemination.
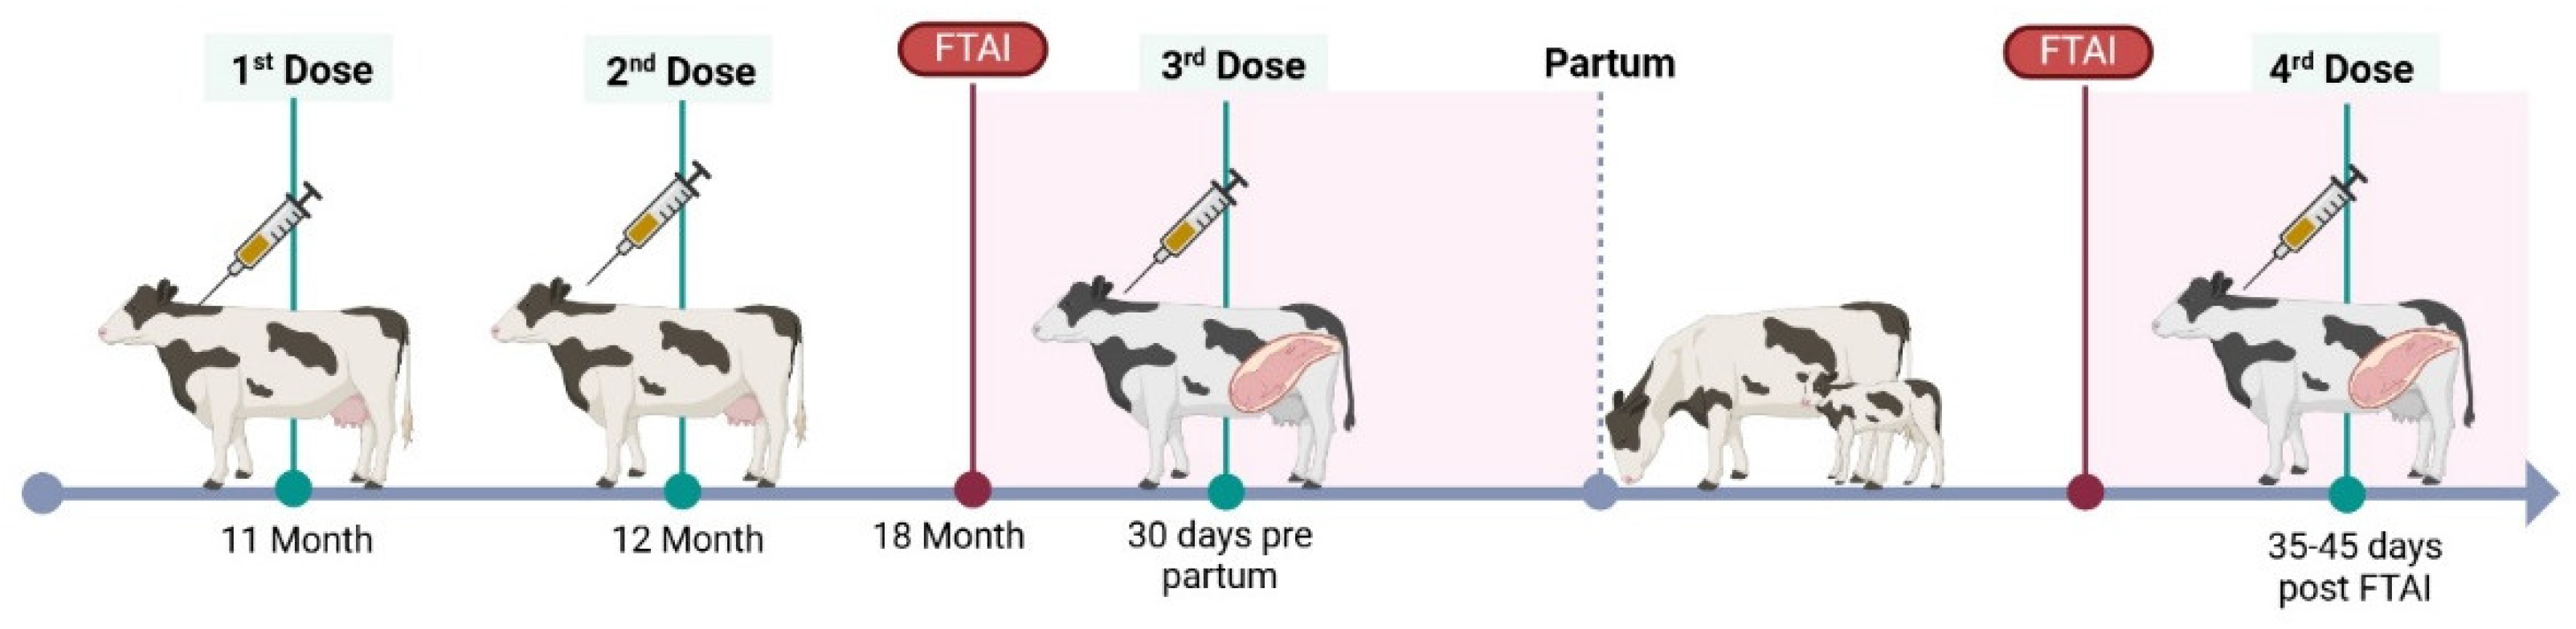
Figure 2.
Years used in each dairy farm to perform the statistical analysis. Years before the incorporation of the BVD-TV are listed from Pre-1 to Pre-7 and years after the incorporation of the BVD-TV are listed from Post 1 to Post 5. Year 0: year of incorporation of the BVD-TV. Gray: years used for SYPP analysis. All years, grays and white, were used to 10YS analysis. Years pre-2 & pre-1 and post 1& post 2 were used for the 2YPP analysis.
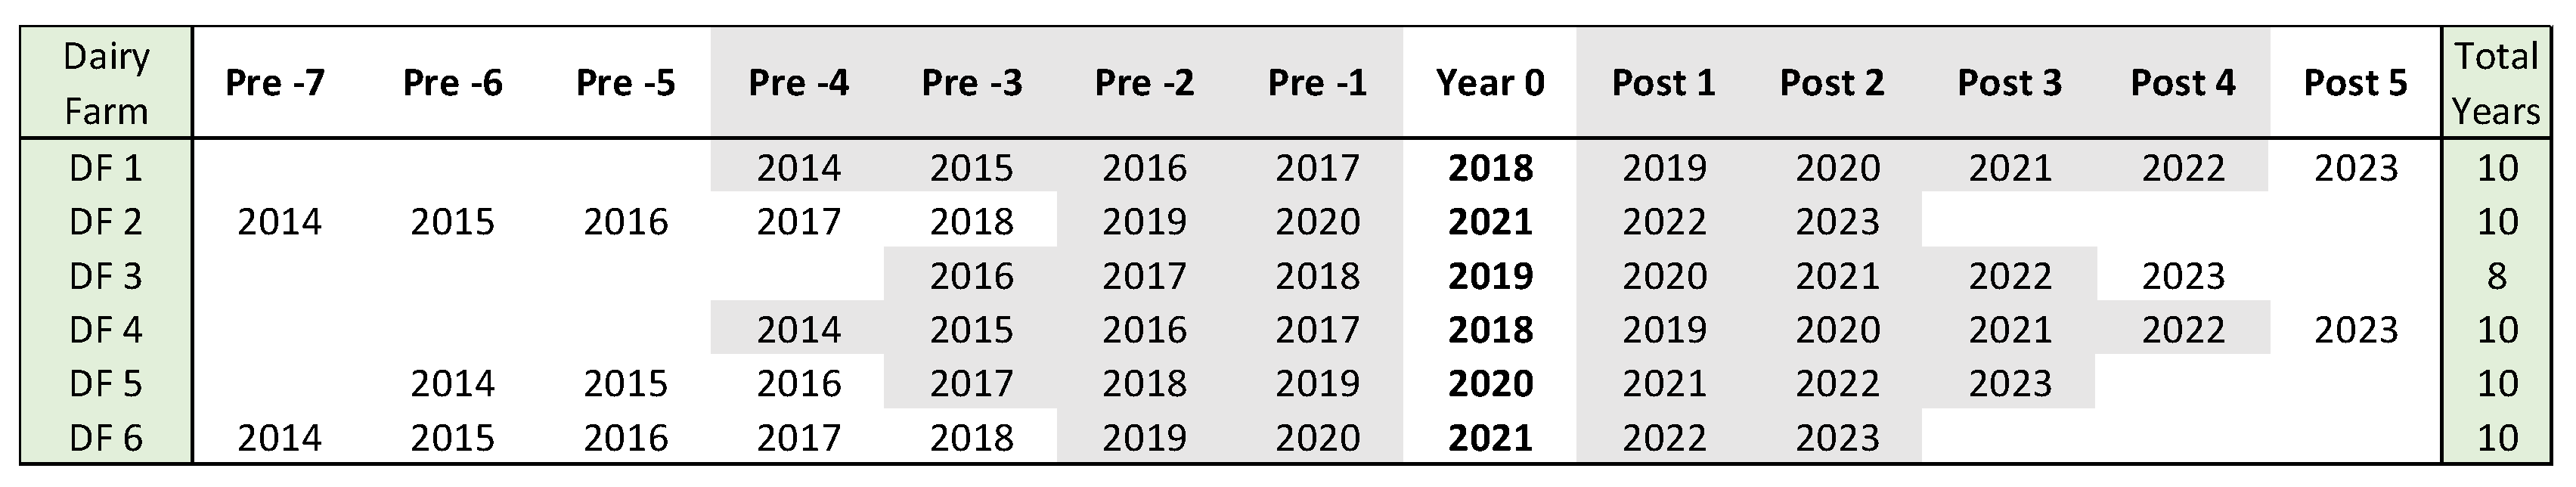
Figure 3.
Viral Circulation analysis: Left: average of 1922 samples from 97 farms, beef and dairy, from Buenos Aires, Santa Fe and Entre Ríos provinces; Right: average of 253 samples from the 6 dairy farms that use BVD-TV at the end of the study period. Dark Gray: percentage of seropositive animals for anti-P80 antibodies; Light Gray: percentage seronegative animals for anti-P80 antibodies.
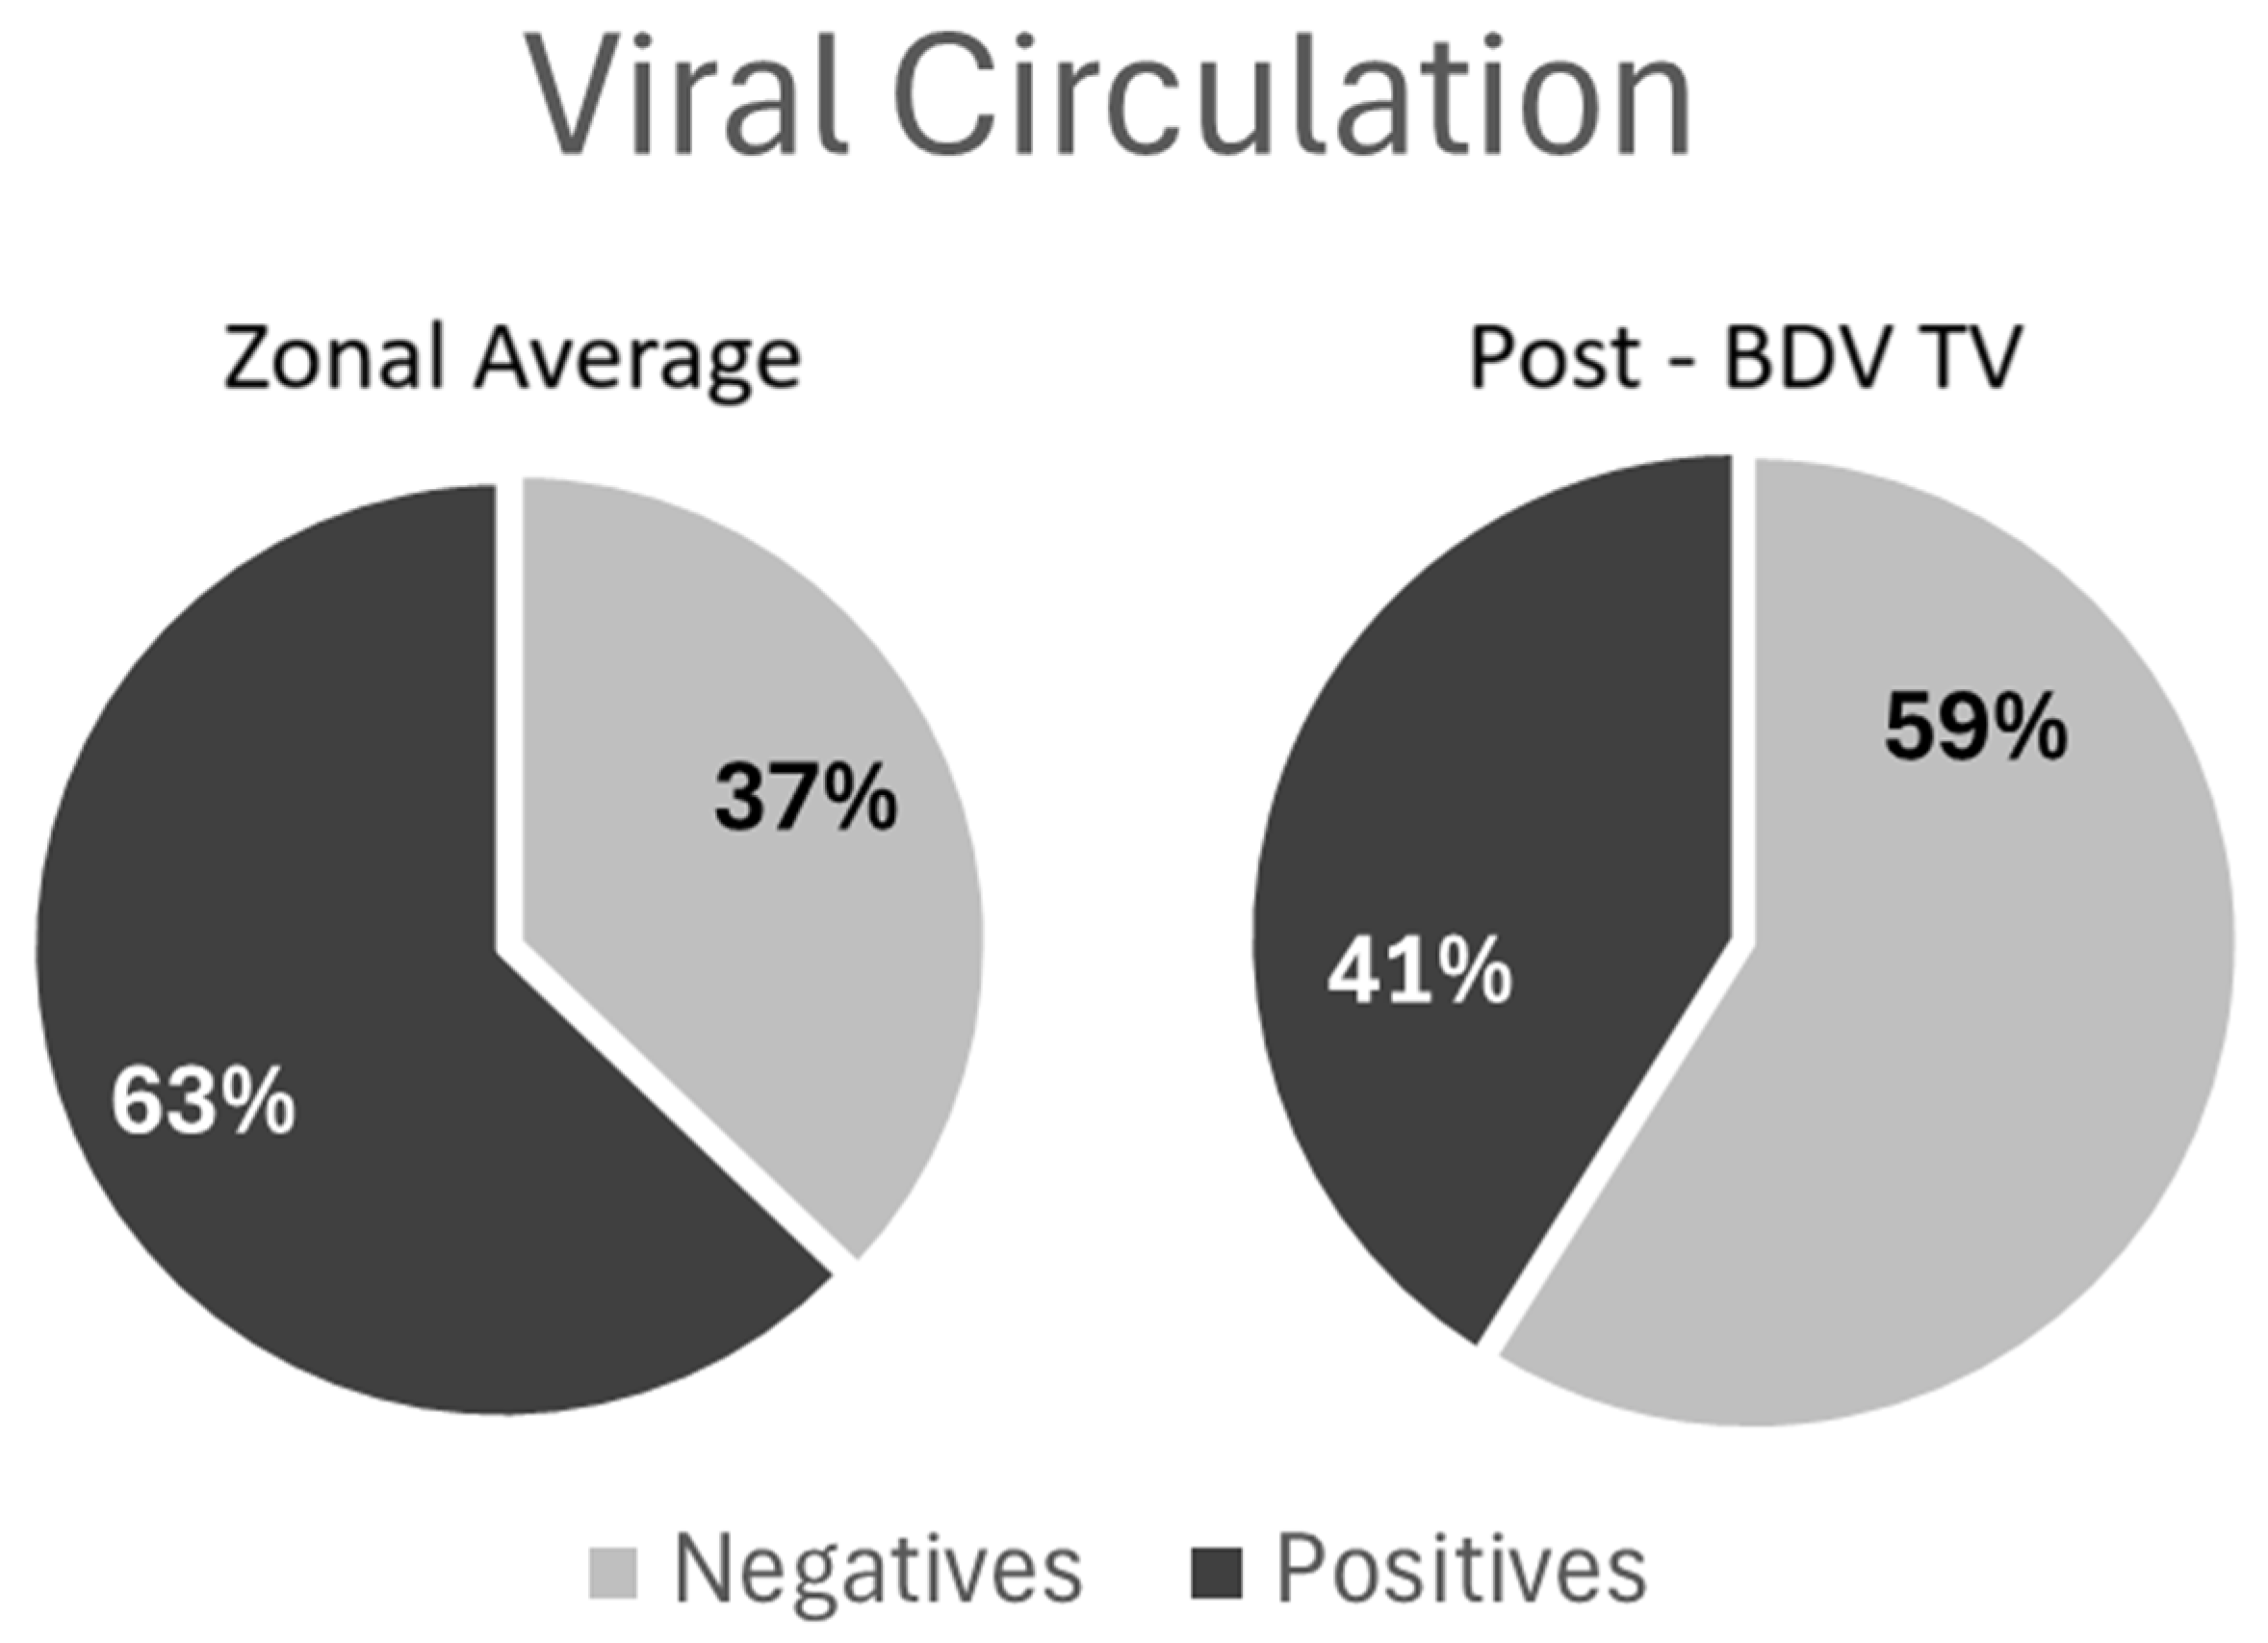
Figure 4.
Conception Rate (%) in six dairy farms (DF 1 – 6) before and after the application of the BVD-TV. Each point represents the annual conception rate for each farm, with lines indicating the mean ± standard deviation for each group (pre- and post-BVD TV). Statistically significant differences between groups are indicated (Chi-2 test, p < 0.05).
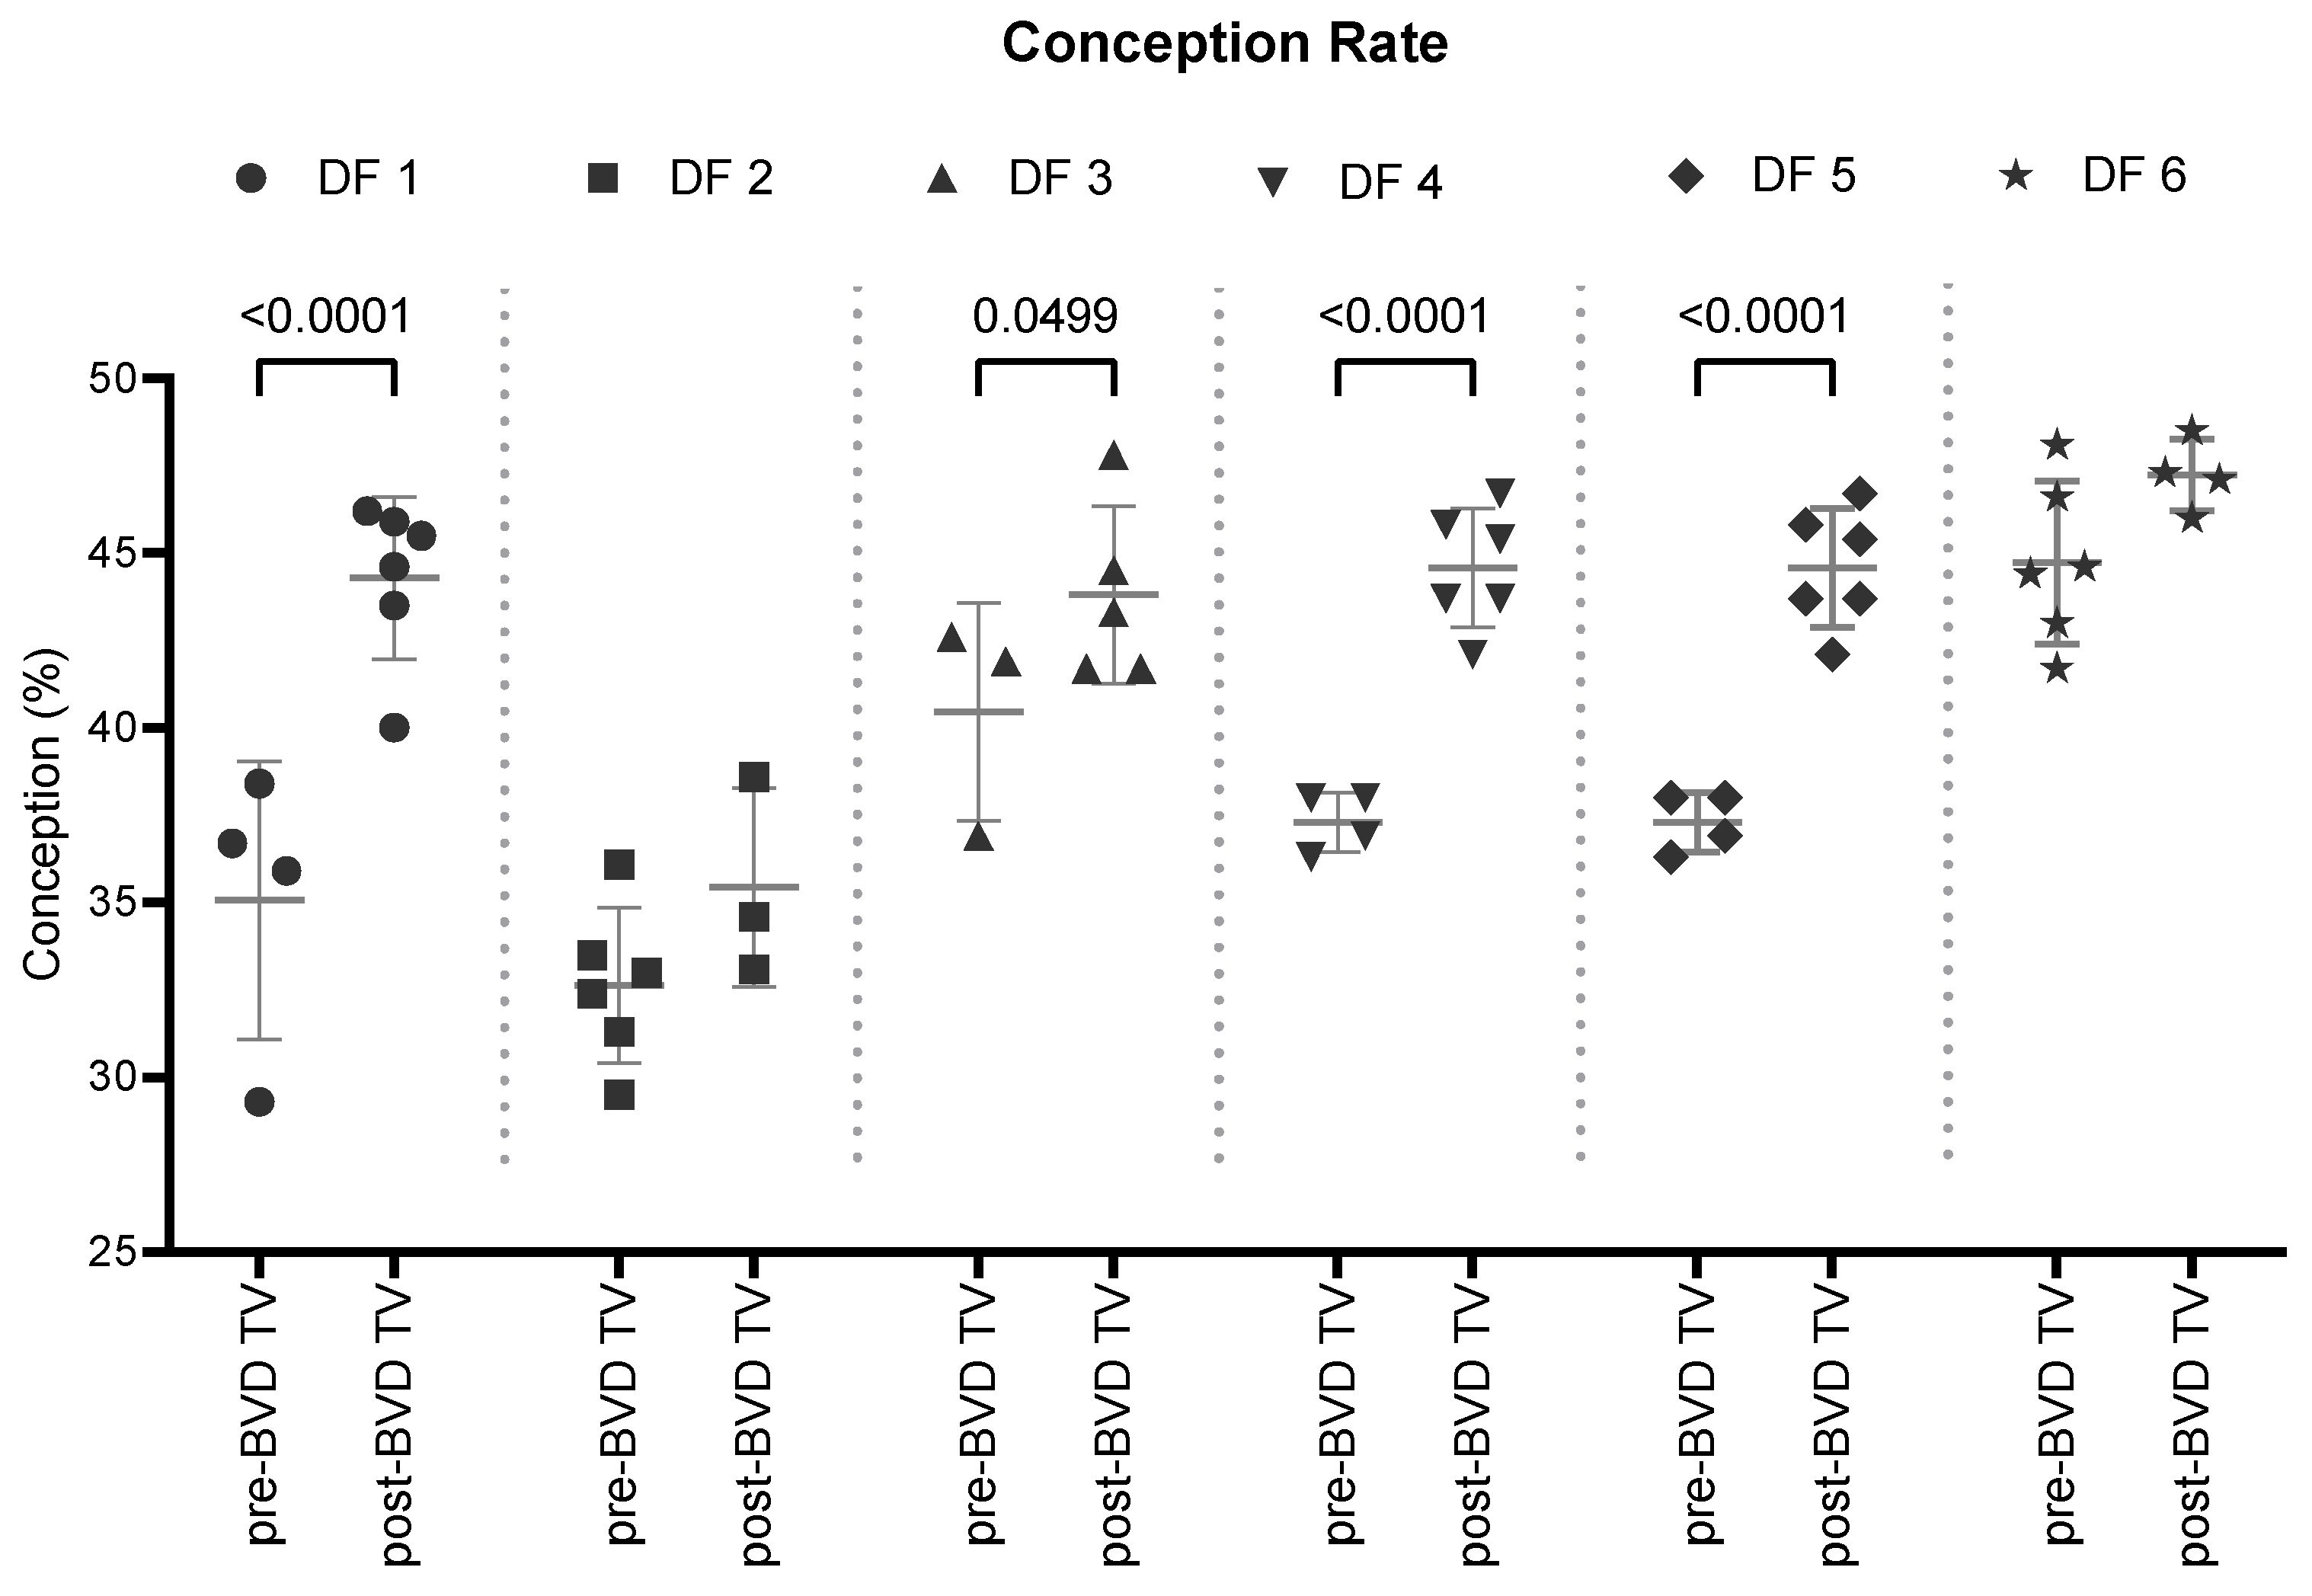
Figure 5.
Conception rate (%) across the six dairy farms before and after the application of the BVD-TV. Each point represents the annual conception rate of the six farms. Horizontal lines indicate the mean values for each group (pre- and post-BVD TV). Statistically significant differences between groups are indicated (Chi-2 test, p < 0.05). The boxes below the graph indicate the total conception rate for each group, along with the total number of pregnant cattle out of the total inseminations performed.
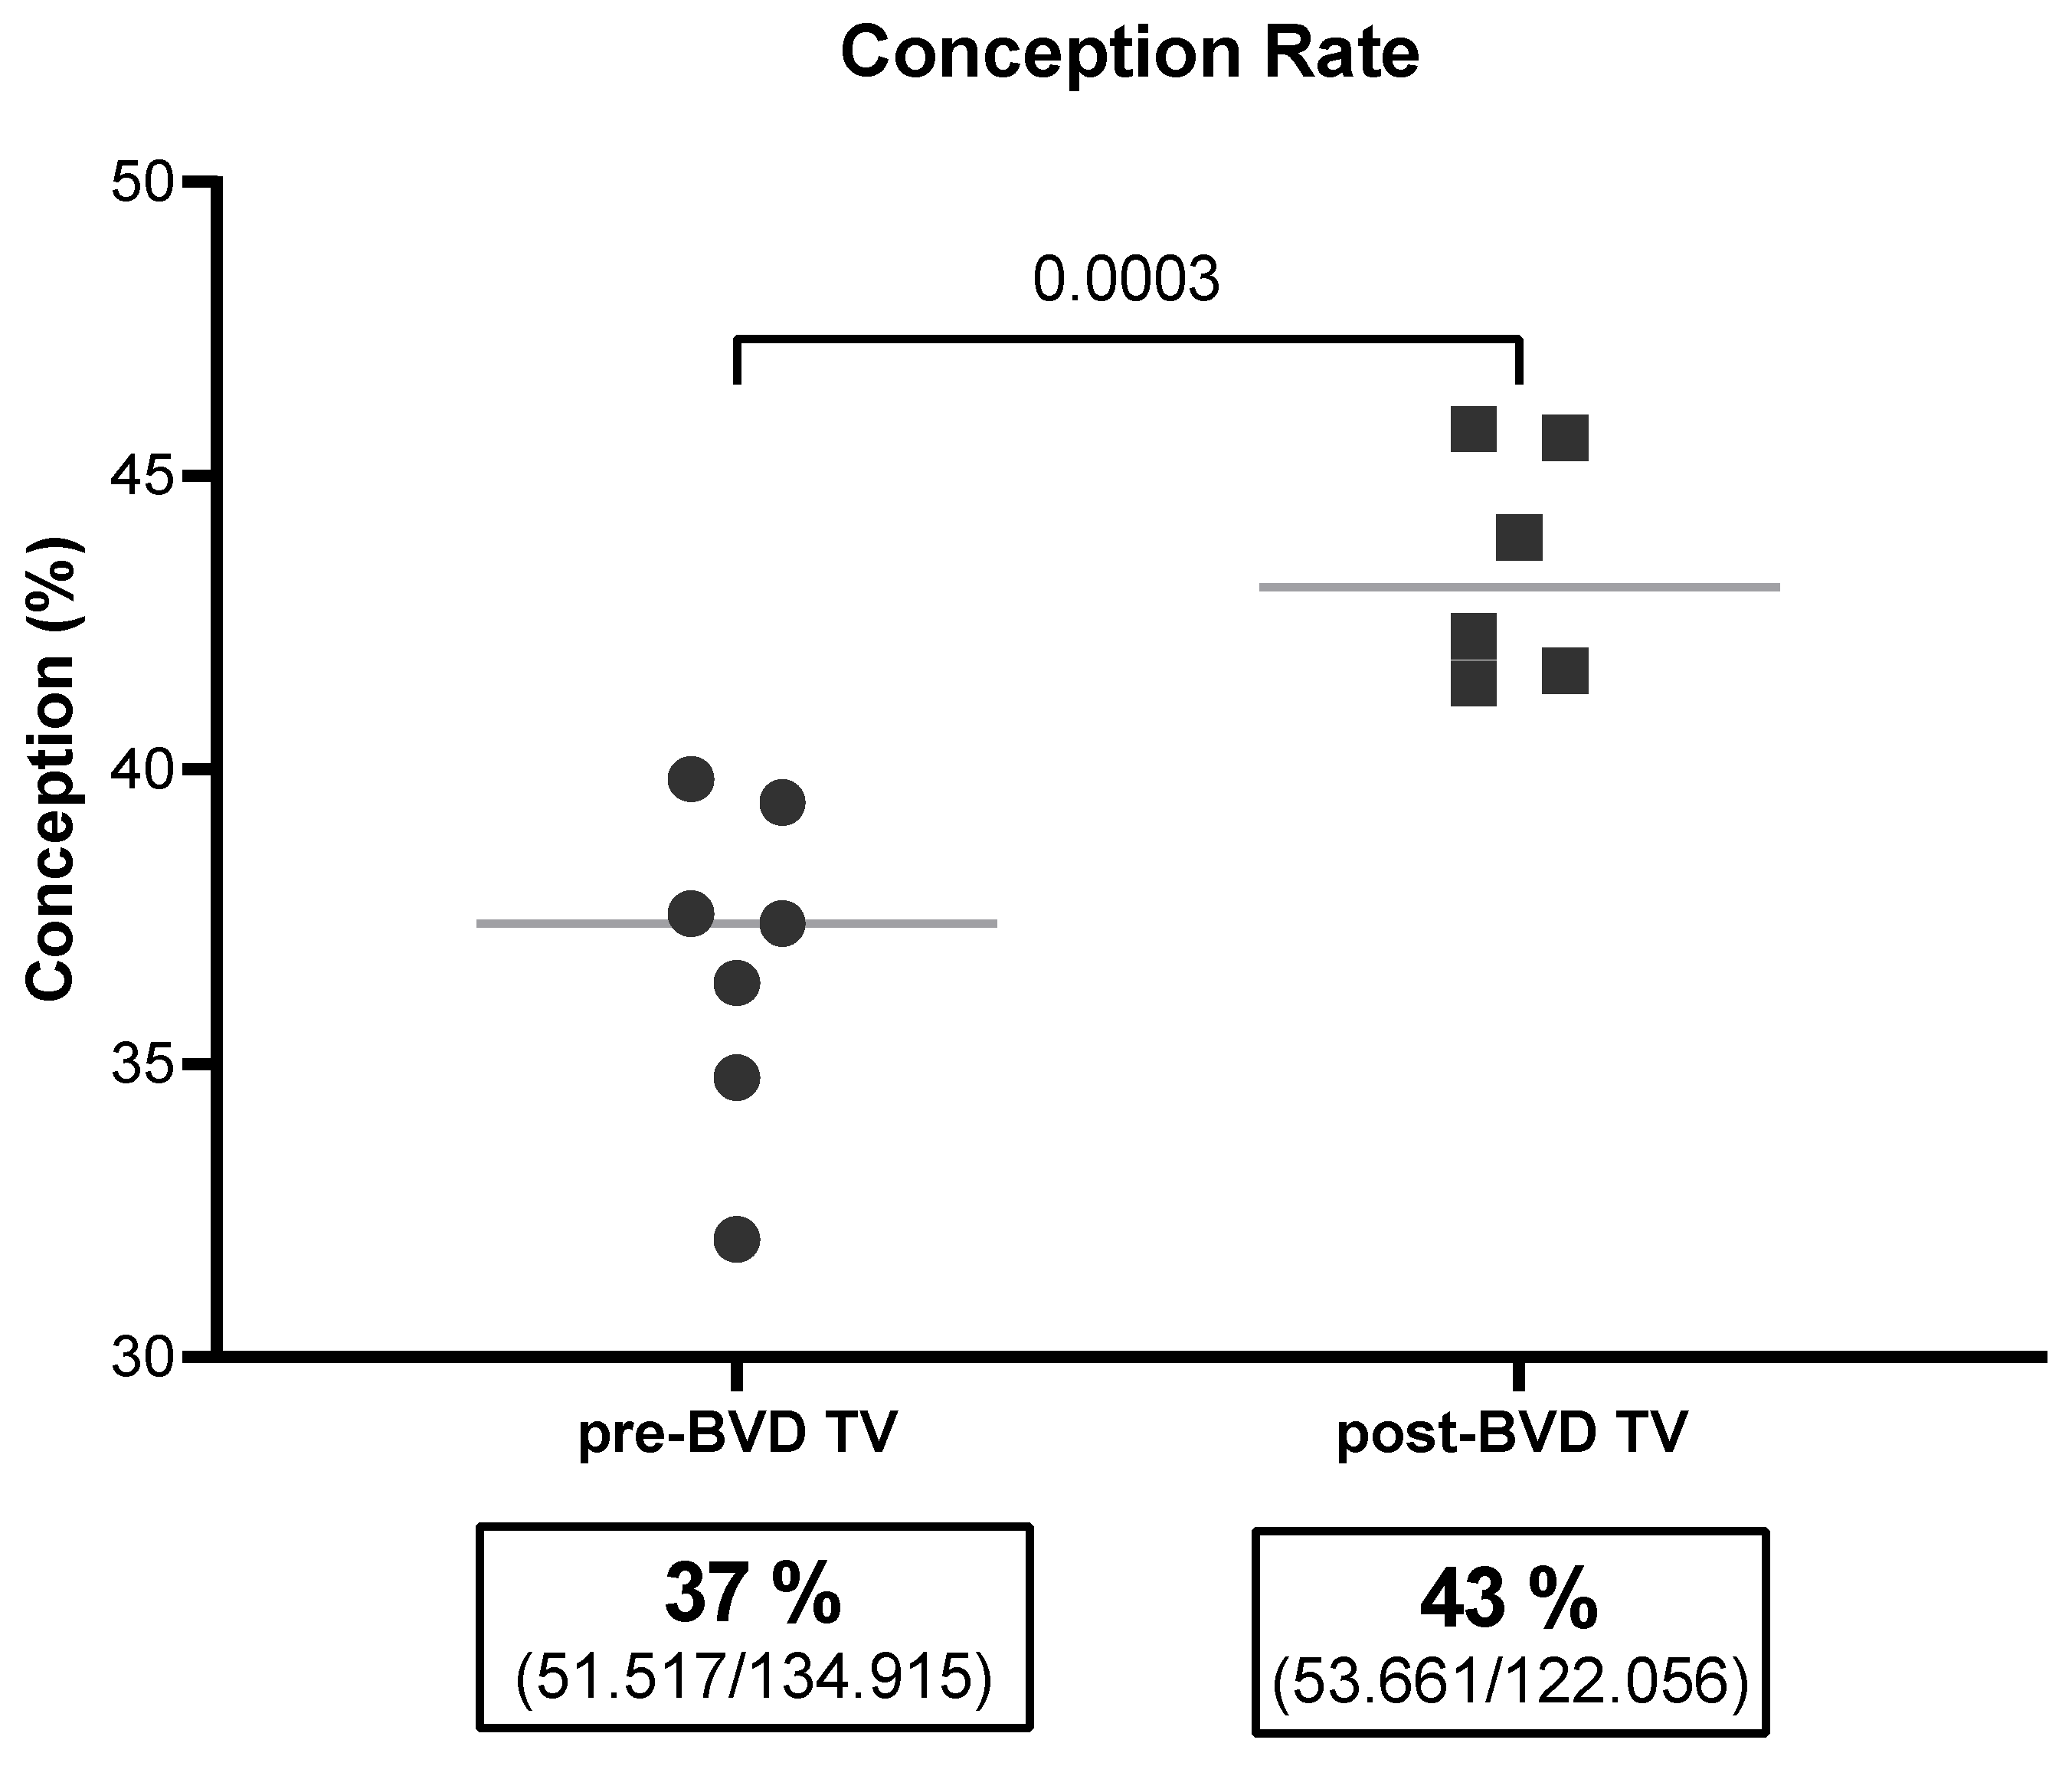
Figure 6.
Abortion Rate (%) in six dairy farms (DF 1 – 6) before and after the application of the BVD-TV. Each point represents the annual abortion rate for each farm, with lines indicating the mean ± standard deviation for each group (pre- and post-BVD TV). Statistically significant differences between groups are indicated.
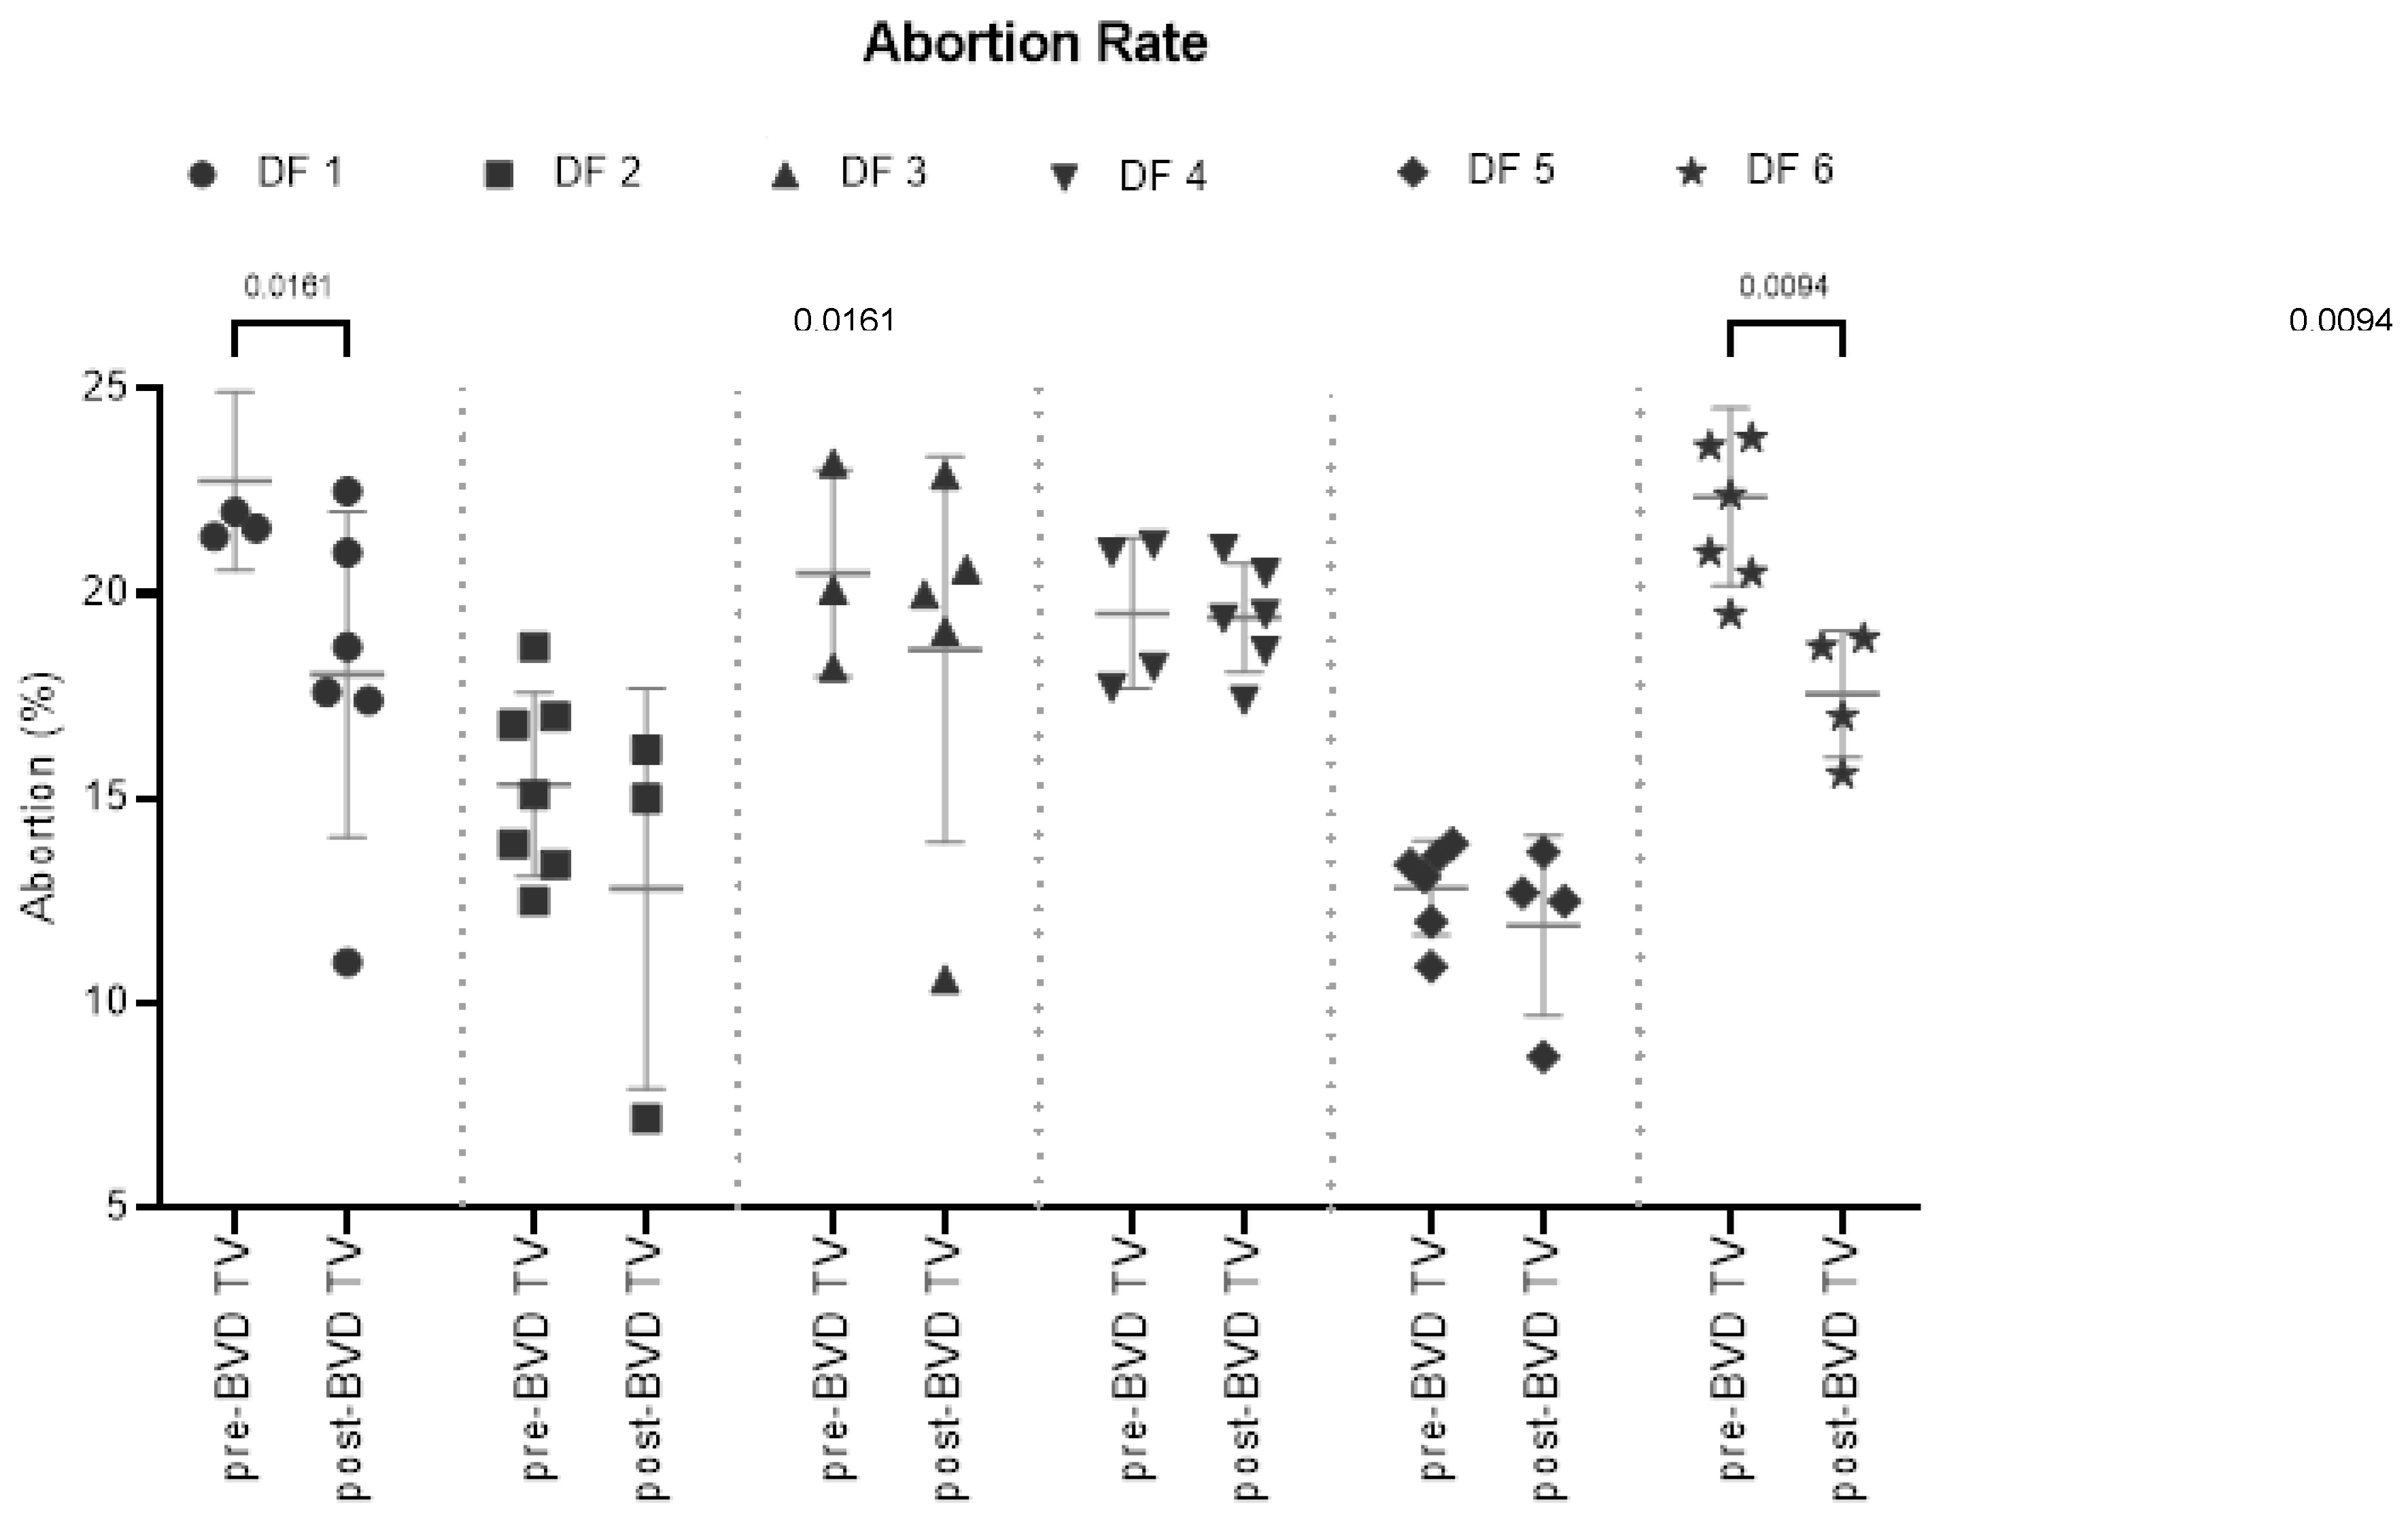
Figure 7.
Abortion Rate Tendency (%) of the six dairy farms, from seven years pre-BVD TV (-7) to five years post- BVD TV (5). Year 0 represents the years of introduction of the BVD-TV on the dairy farms. Each point represents the annual mean abortion rate with lines indicating the mean ± standard deviation. Circles: pre-BVD TV. Squares: post-BVD TV. Dark Gray Lines: linear regression trend. Dot Lines: IC95 confidence bands.
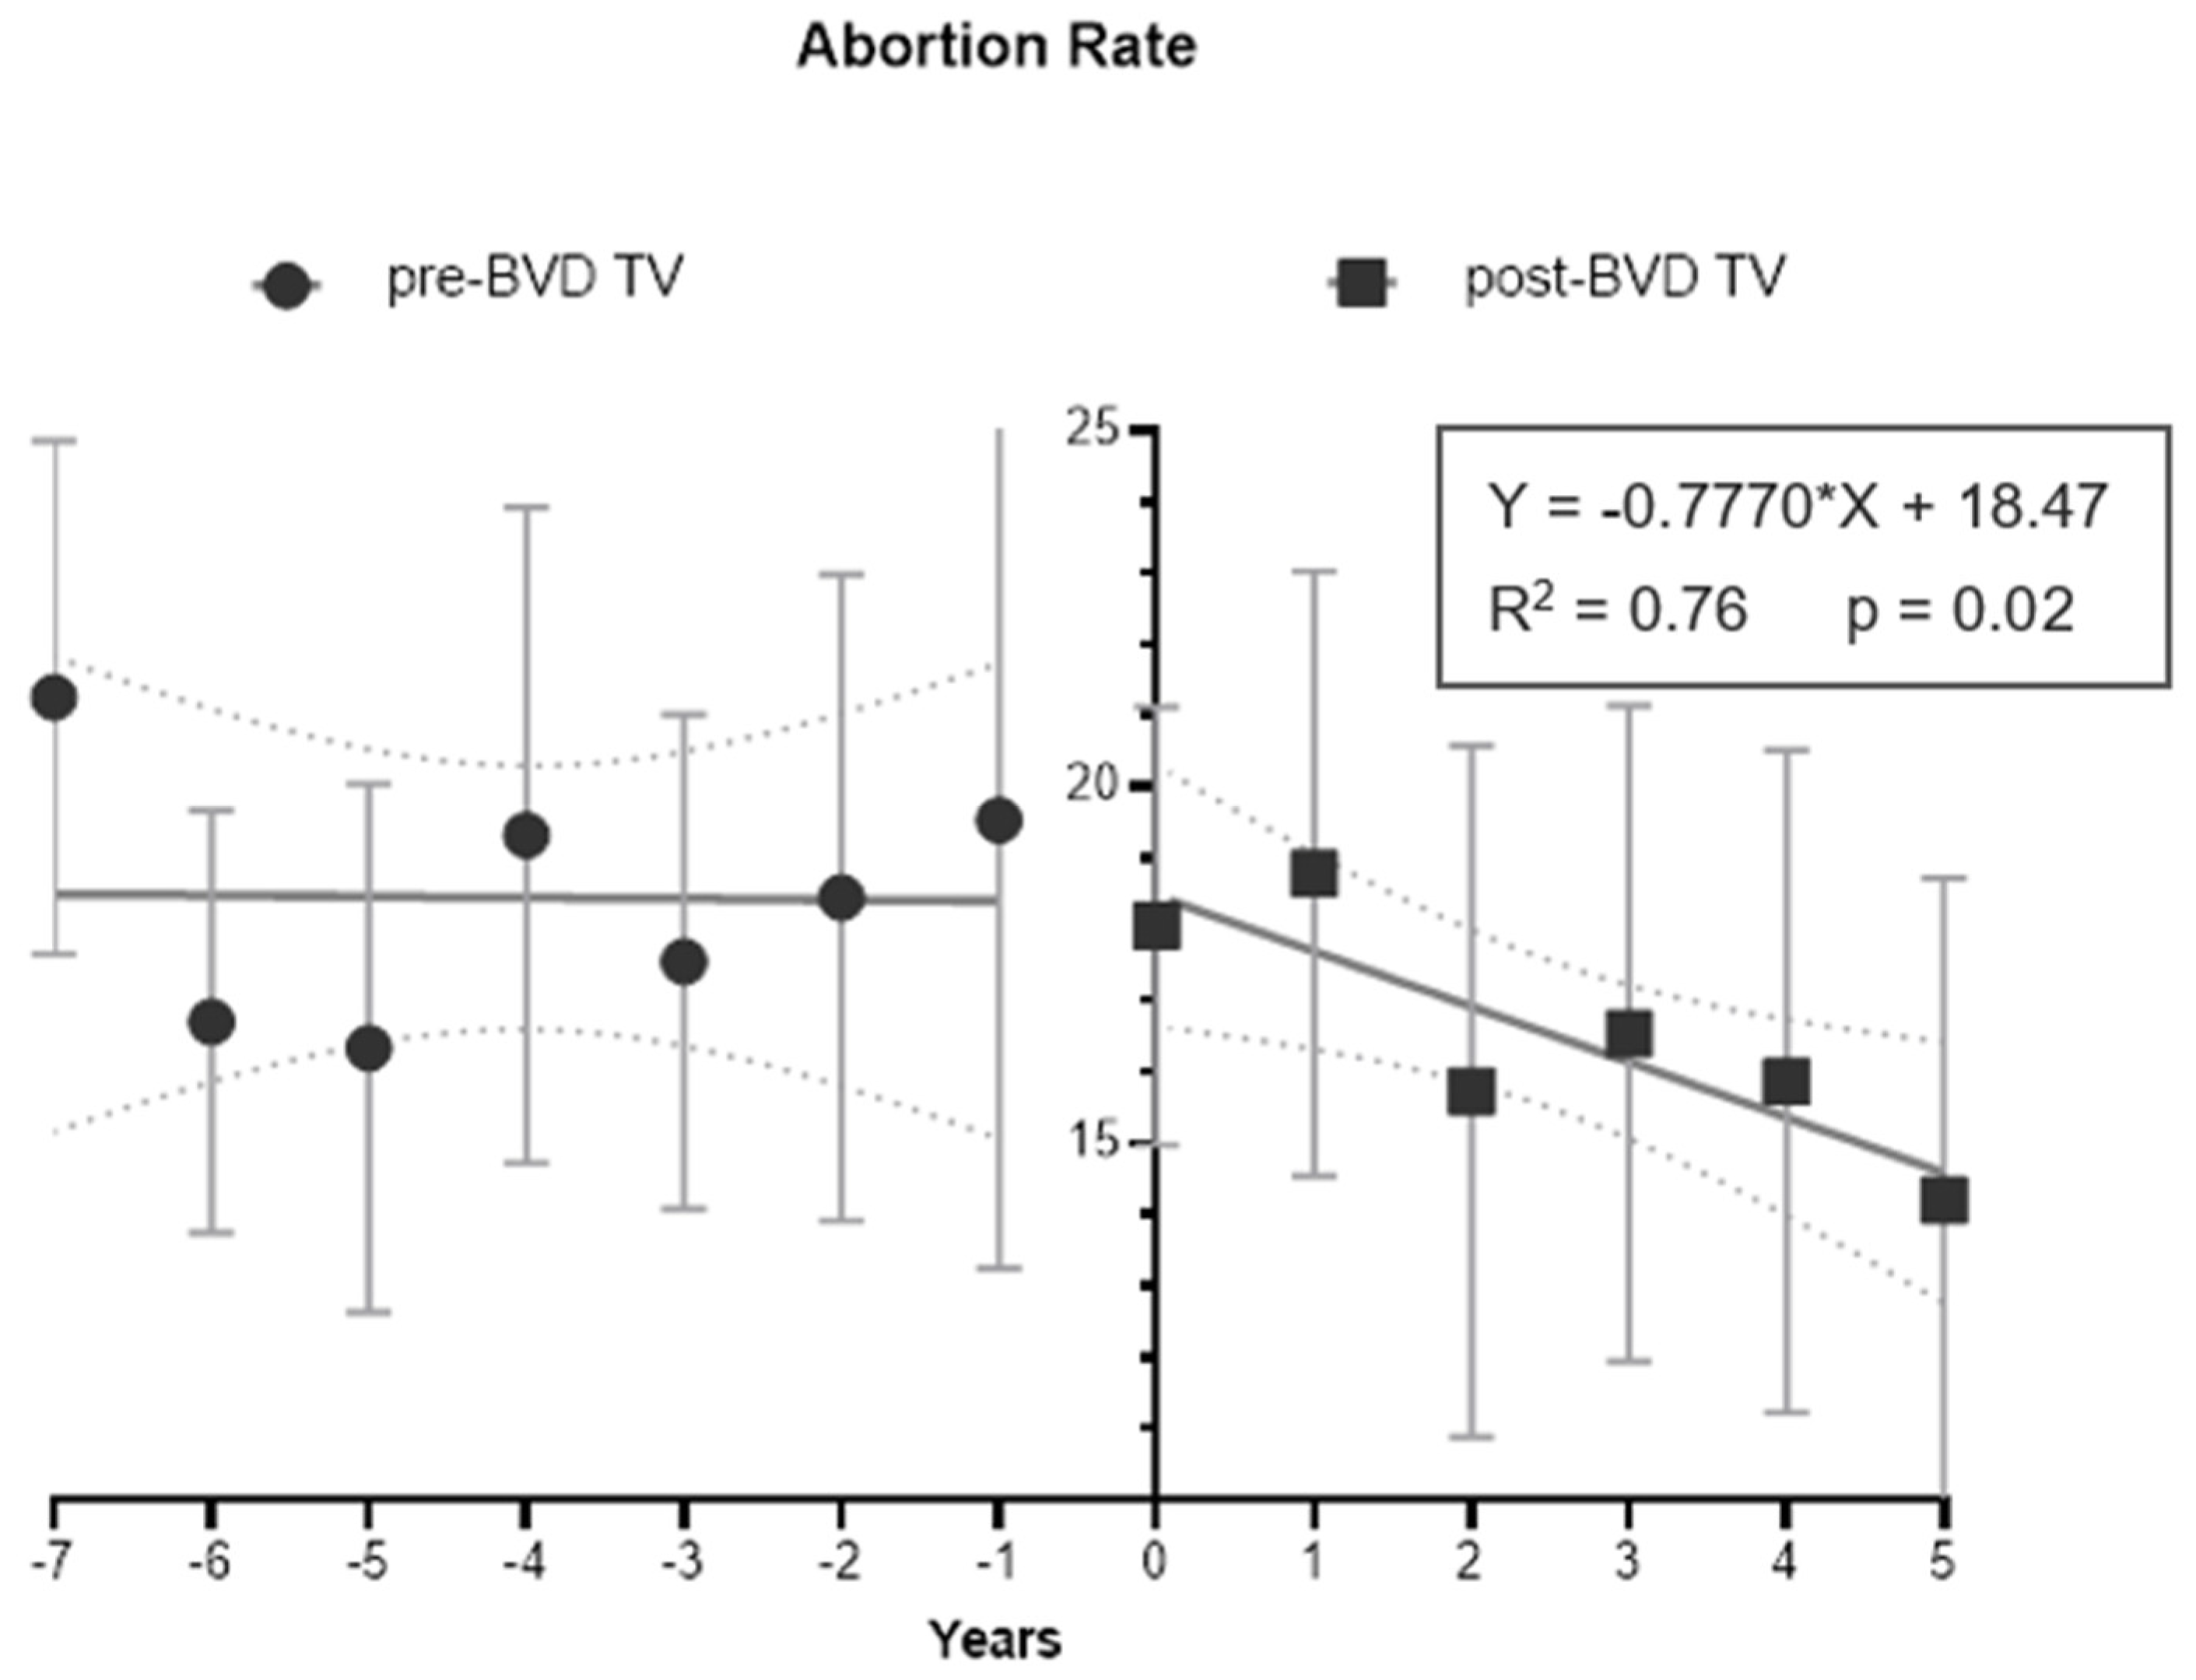
Figure 8.
Days open in six dairy farms (DF 1 – 6) before and after the application of the BVD-TV. Each point represents the annual Days open average for each farm, with lines indicating the mean ± standard deviation for each group (pre- and post-BVD TV). Statistically significant differences between groups are indicated.
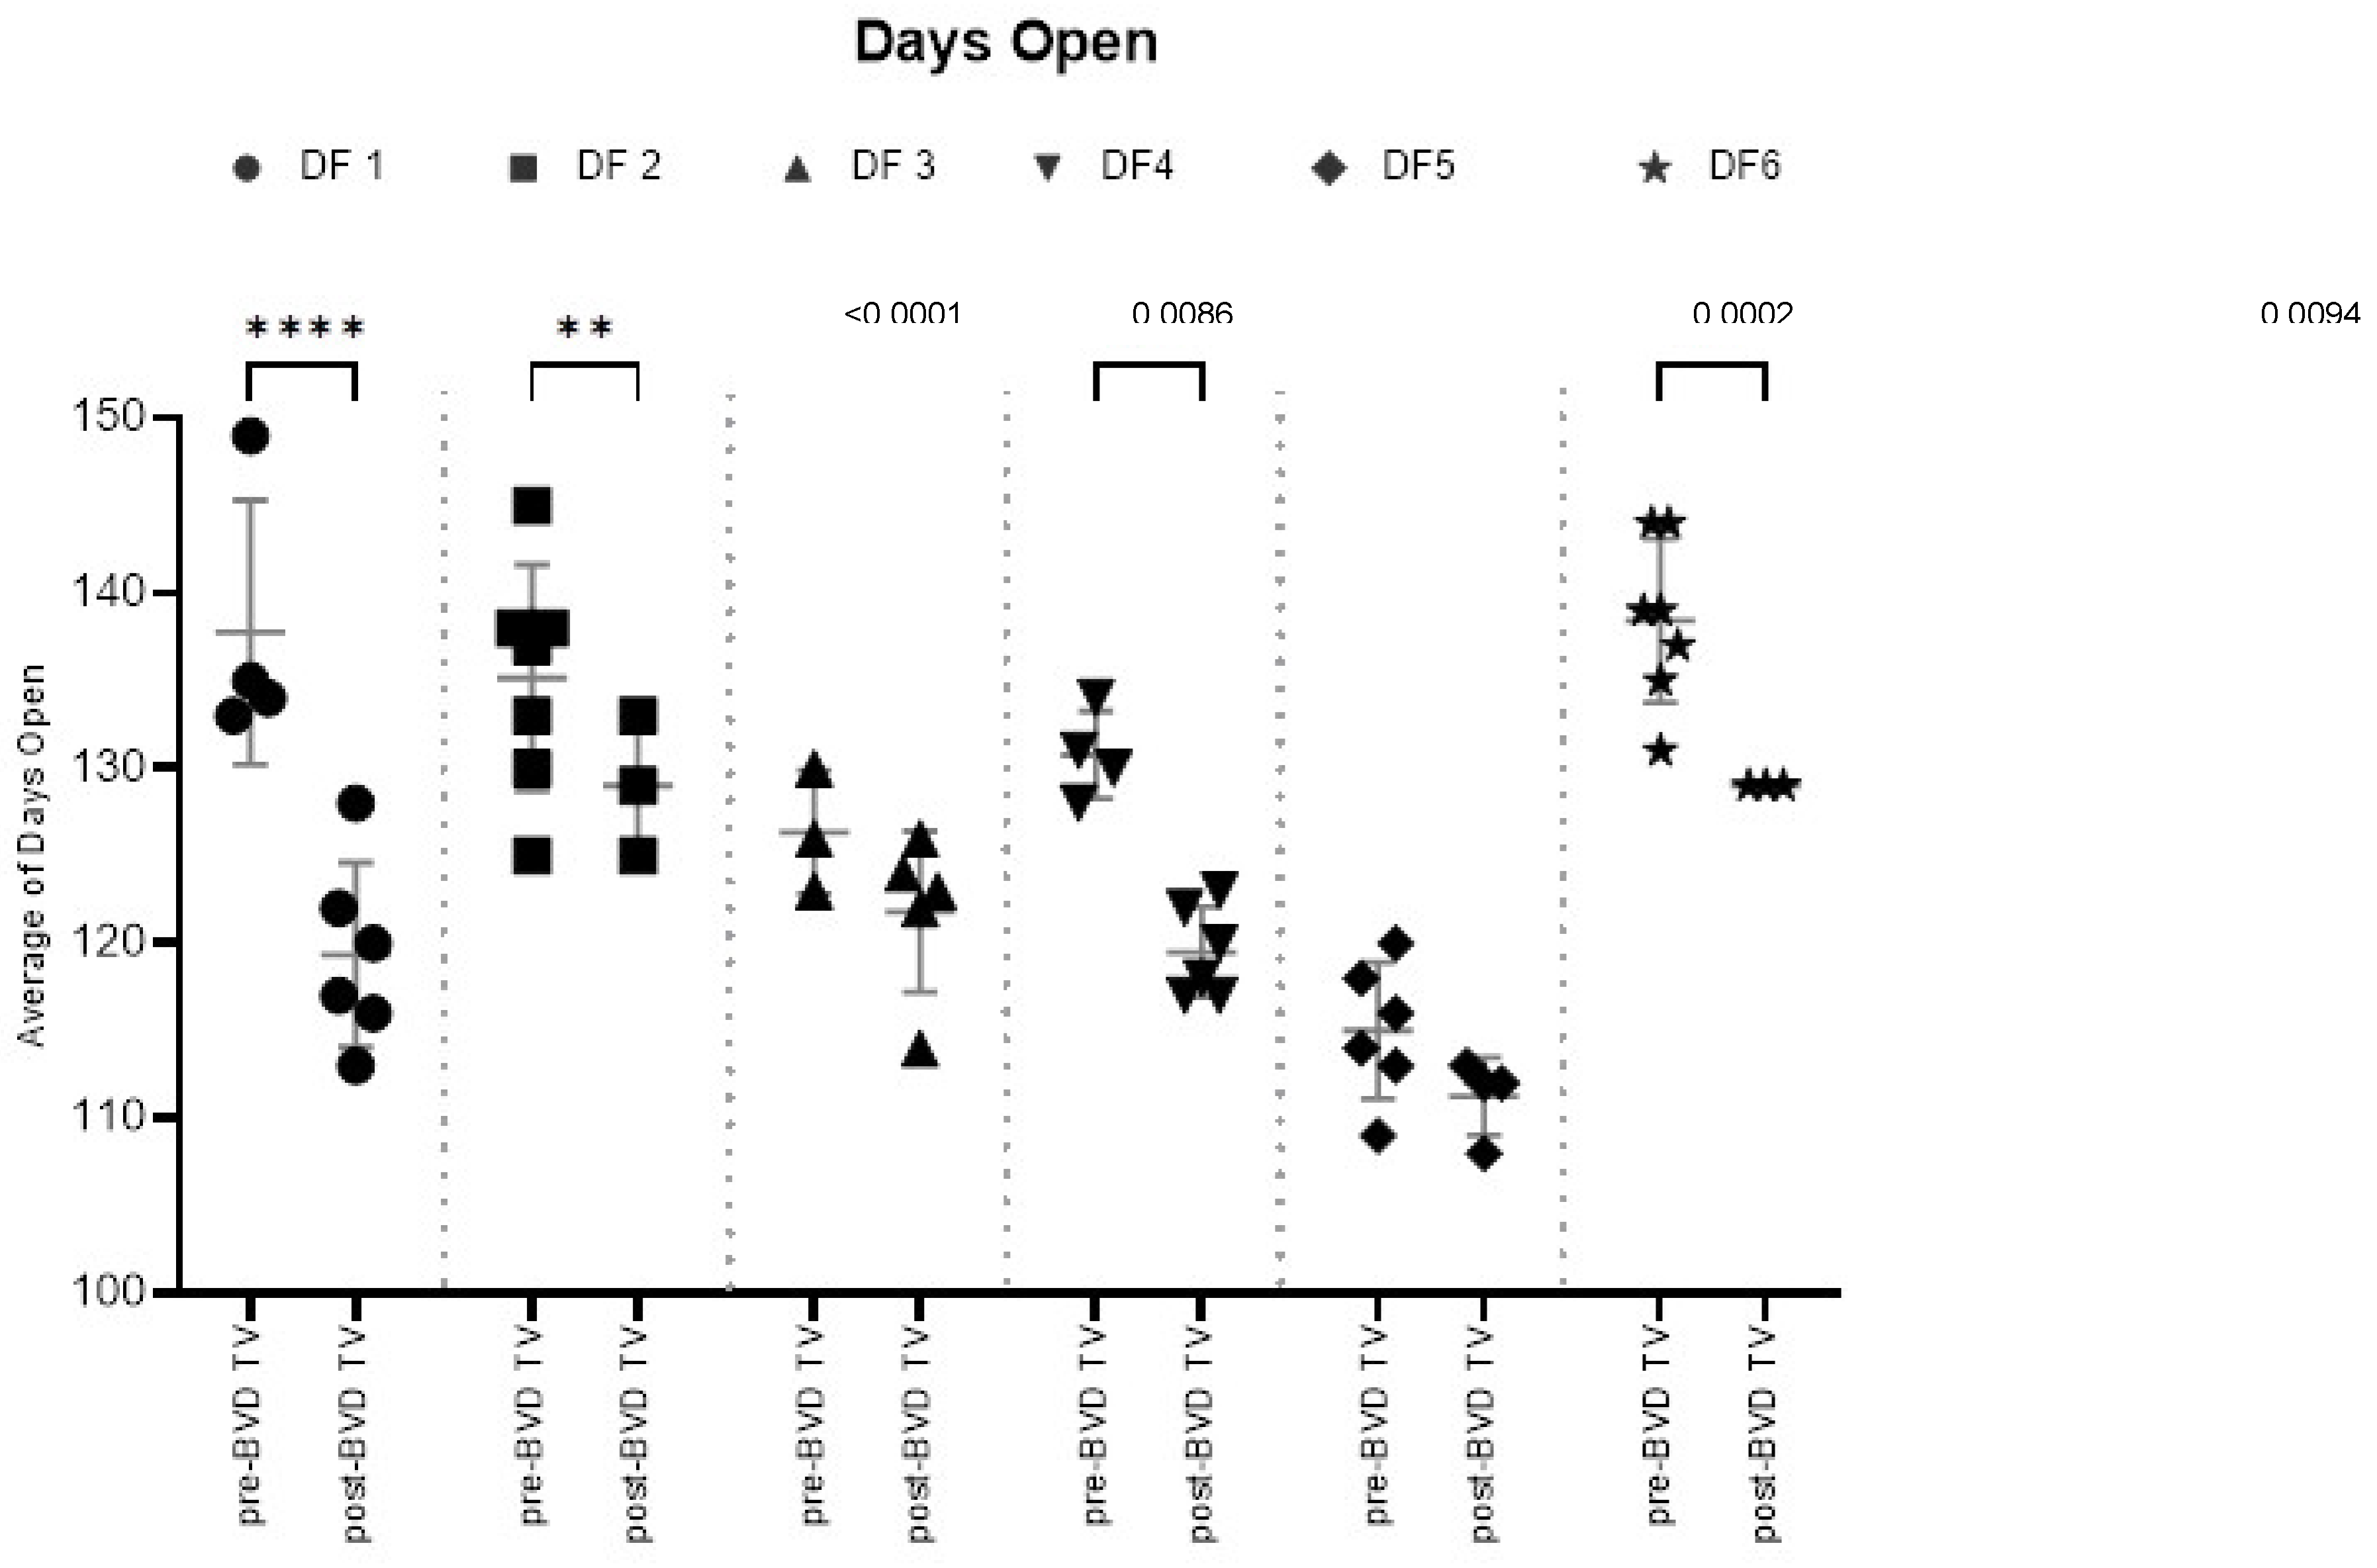
Figure 9.
a: Days open across the six dairy farms before and after the application of the BVD-TV. Each point represents the annual mean of days open of the six farms under study, with lines indicating the overall mean ± standard deviation (pre- and post-BVD TV). Statistically significant differences between groups are indicated (paired Student T Test).
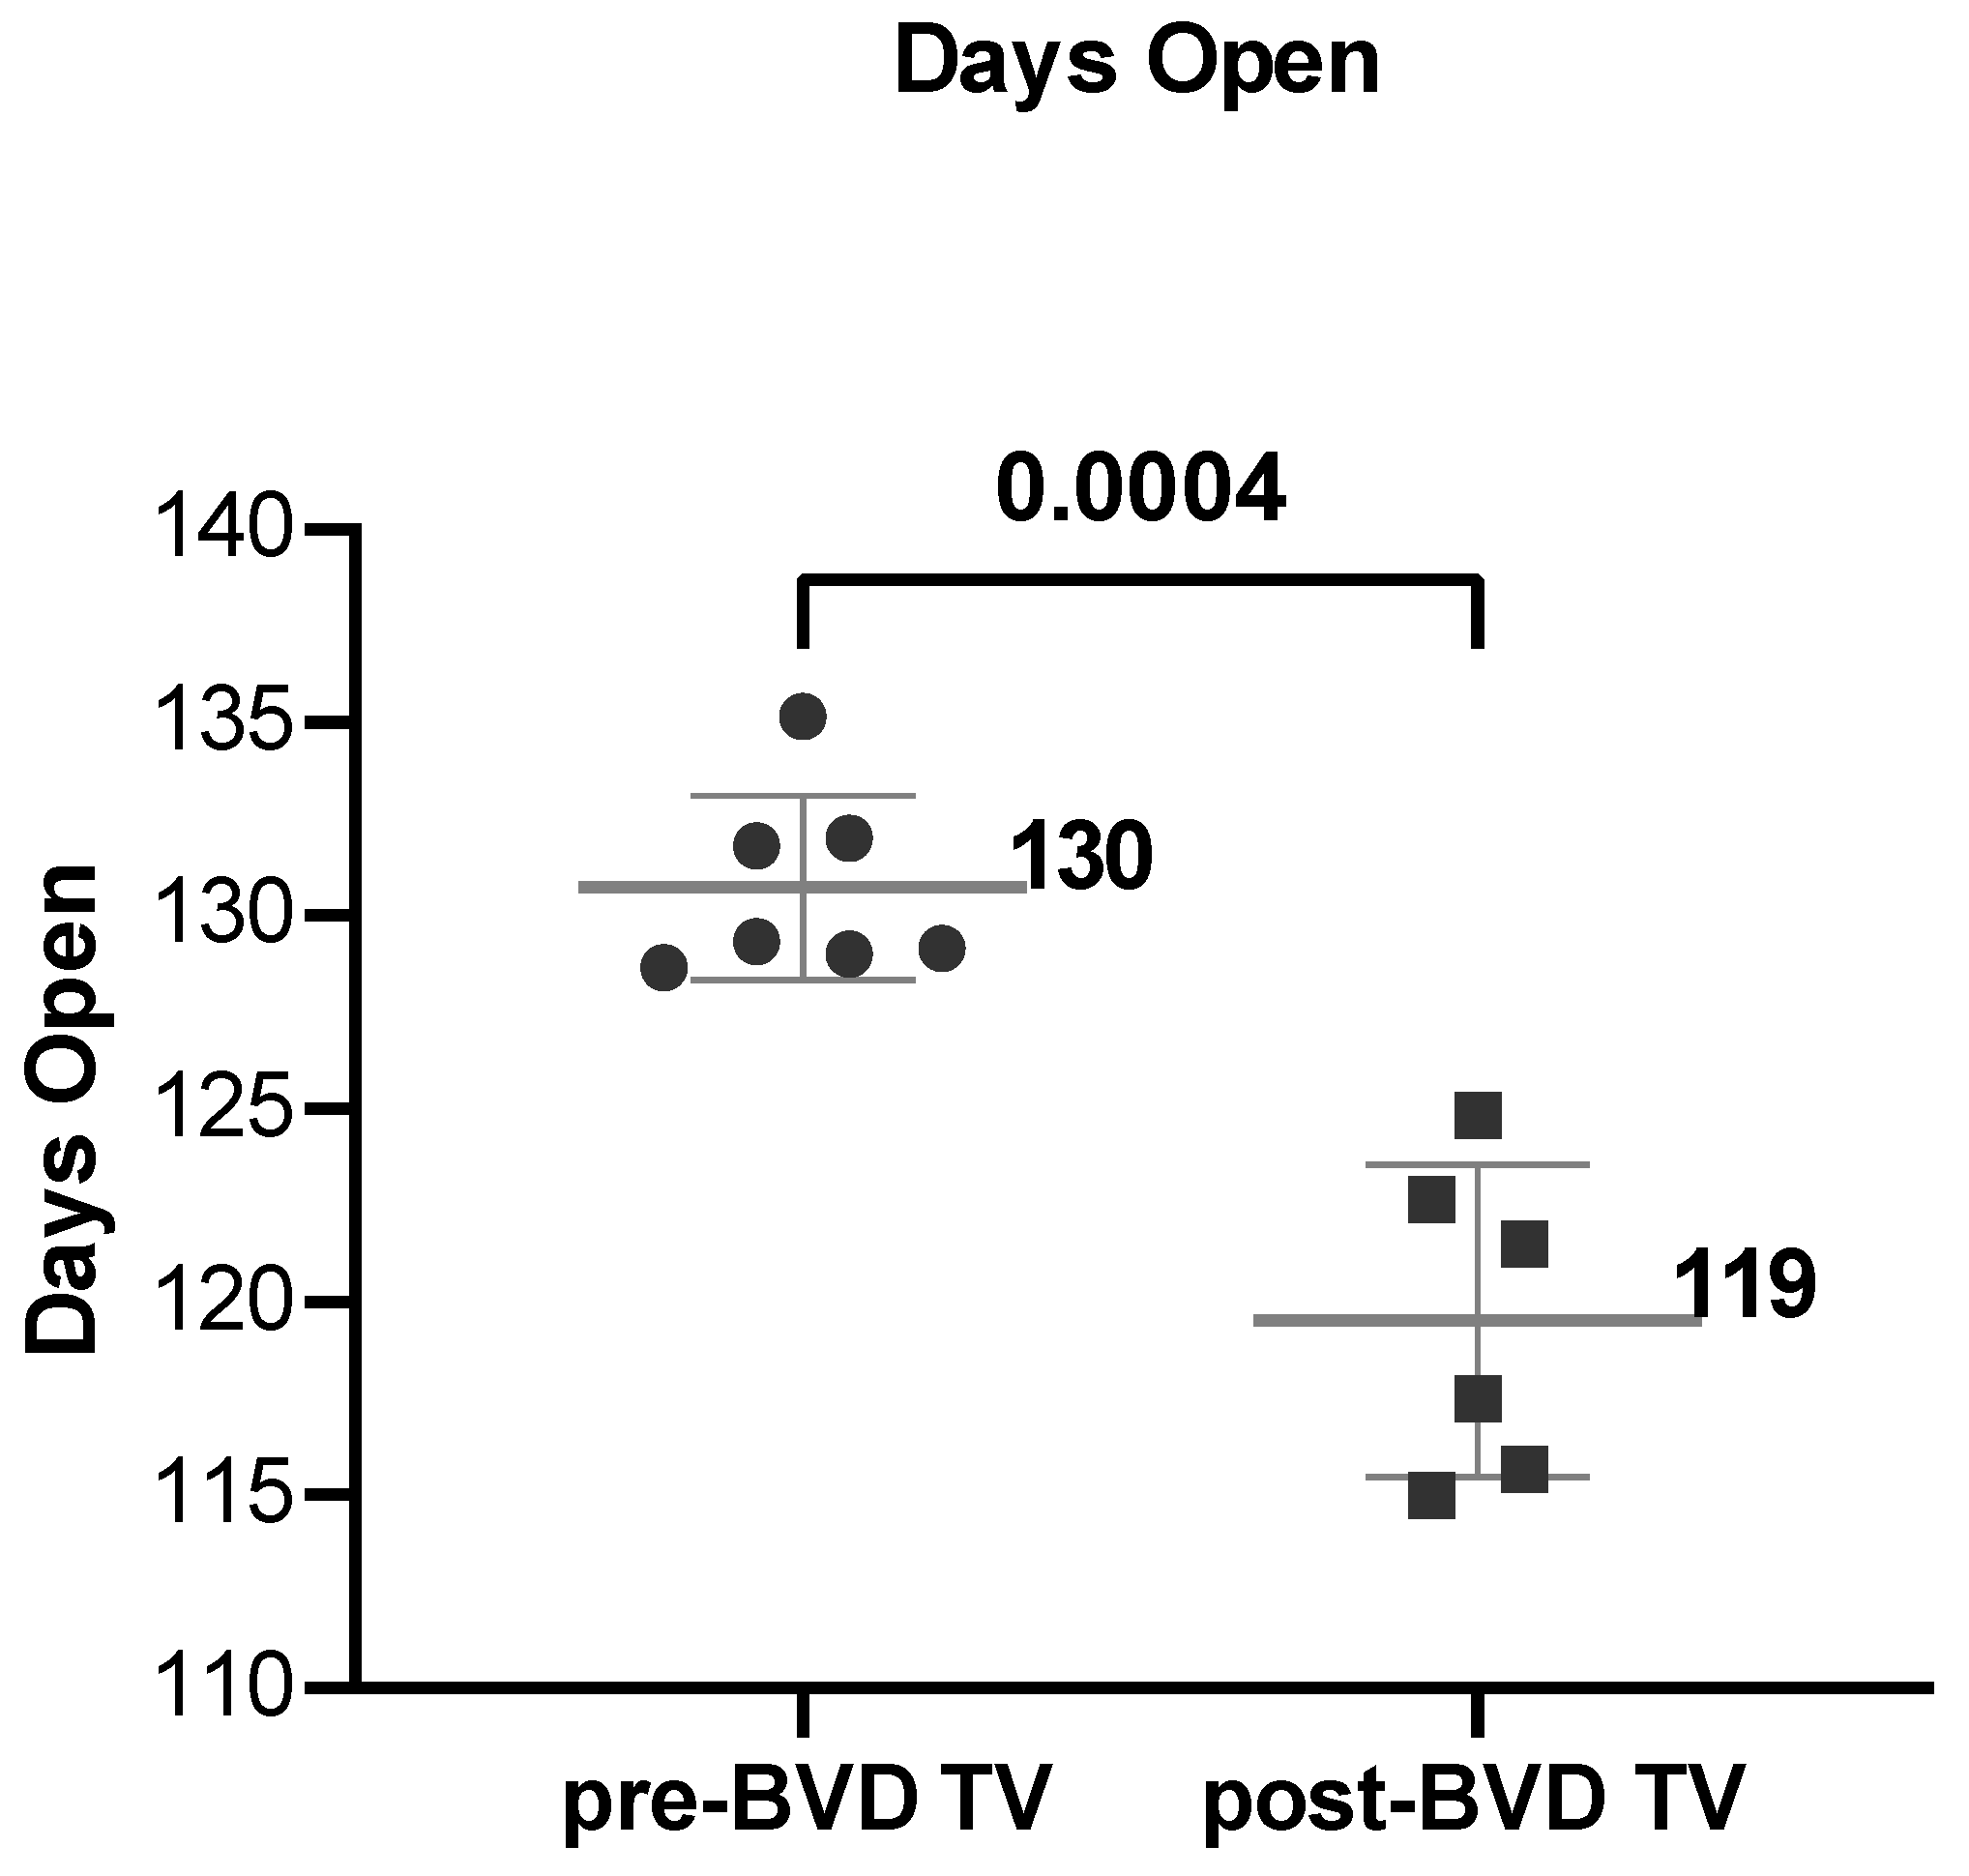
Figure 10.
Rates of Calves born per insemination in six dairy farms (DF 1 – 6) before and after the introduction of the BVD-TV in the vaccination calendar. Each point represents the annual rate of calves born per insemination for each farm, with lines indicating the mean ± standard deviation for each group (pre- and post-BVD TV). Statistically significant differences between groups are indicated (paired Student T Test).
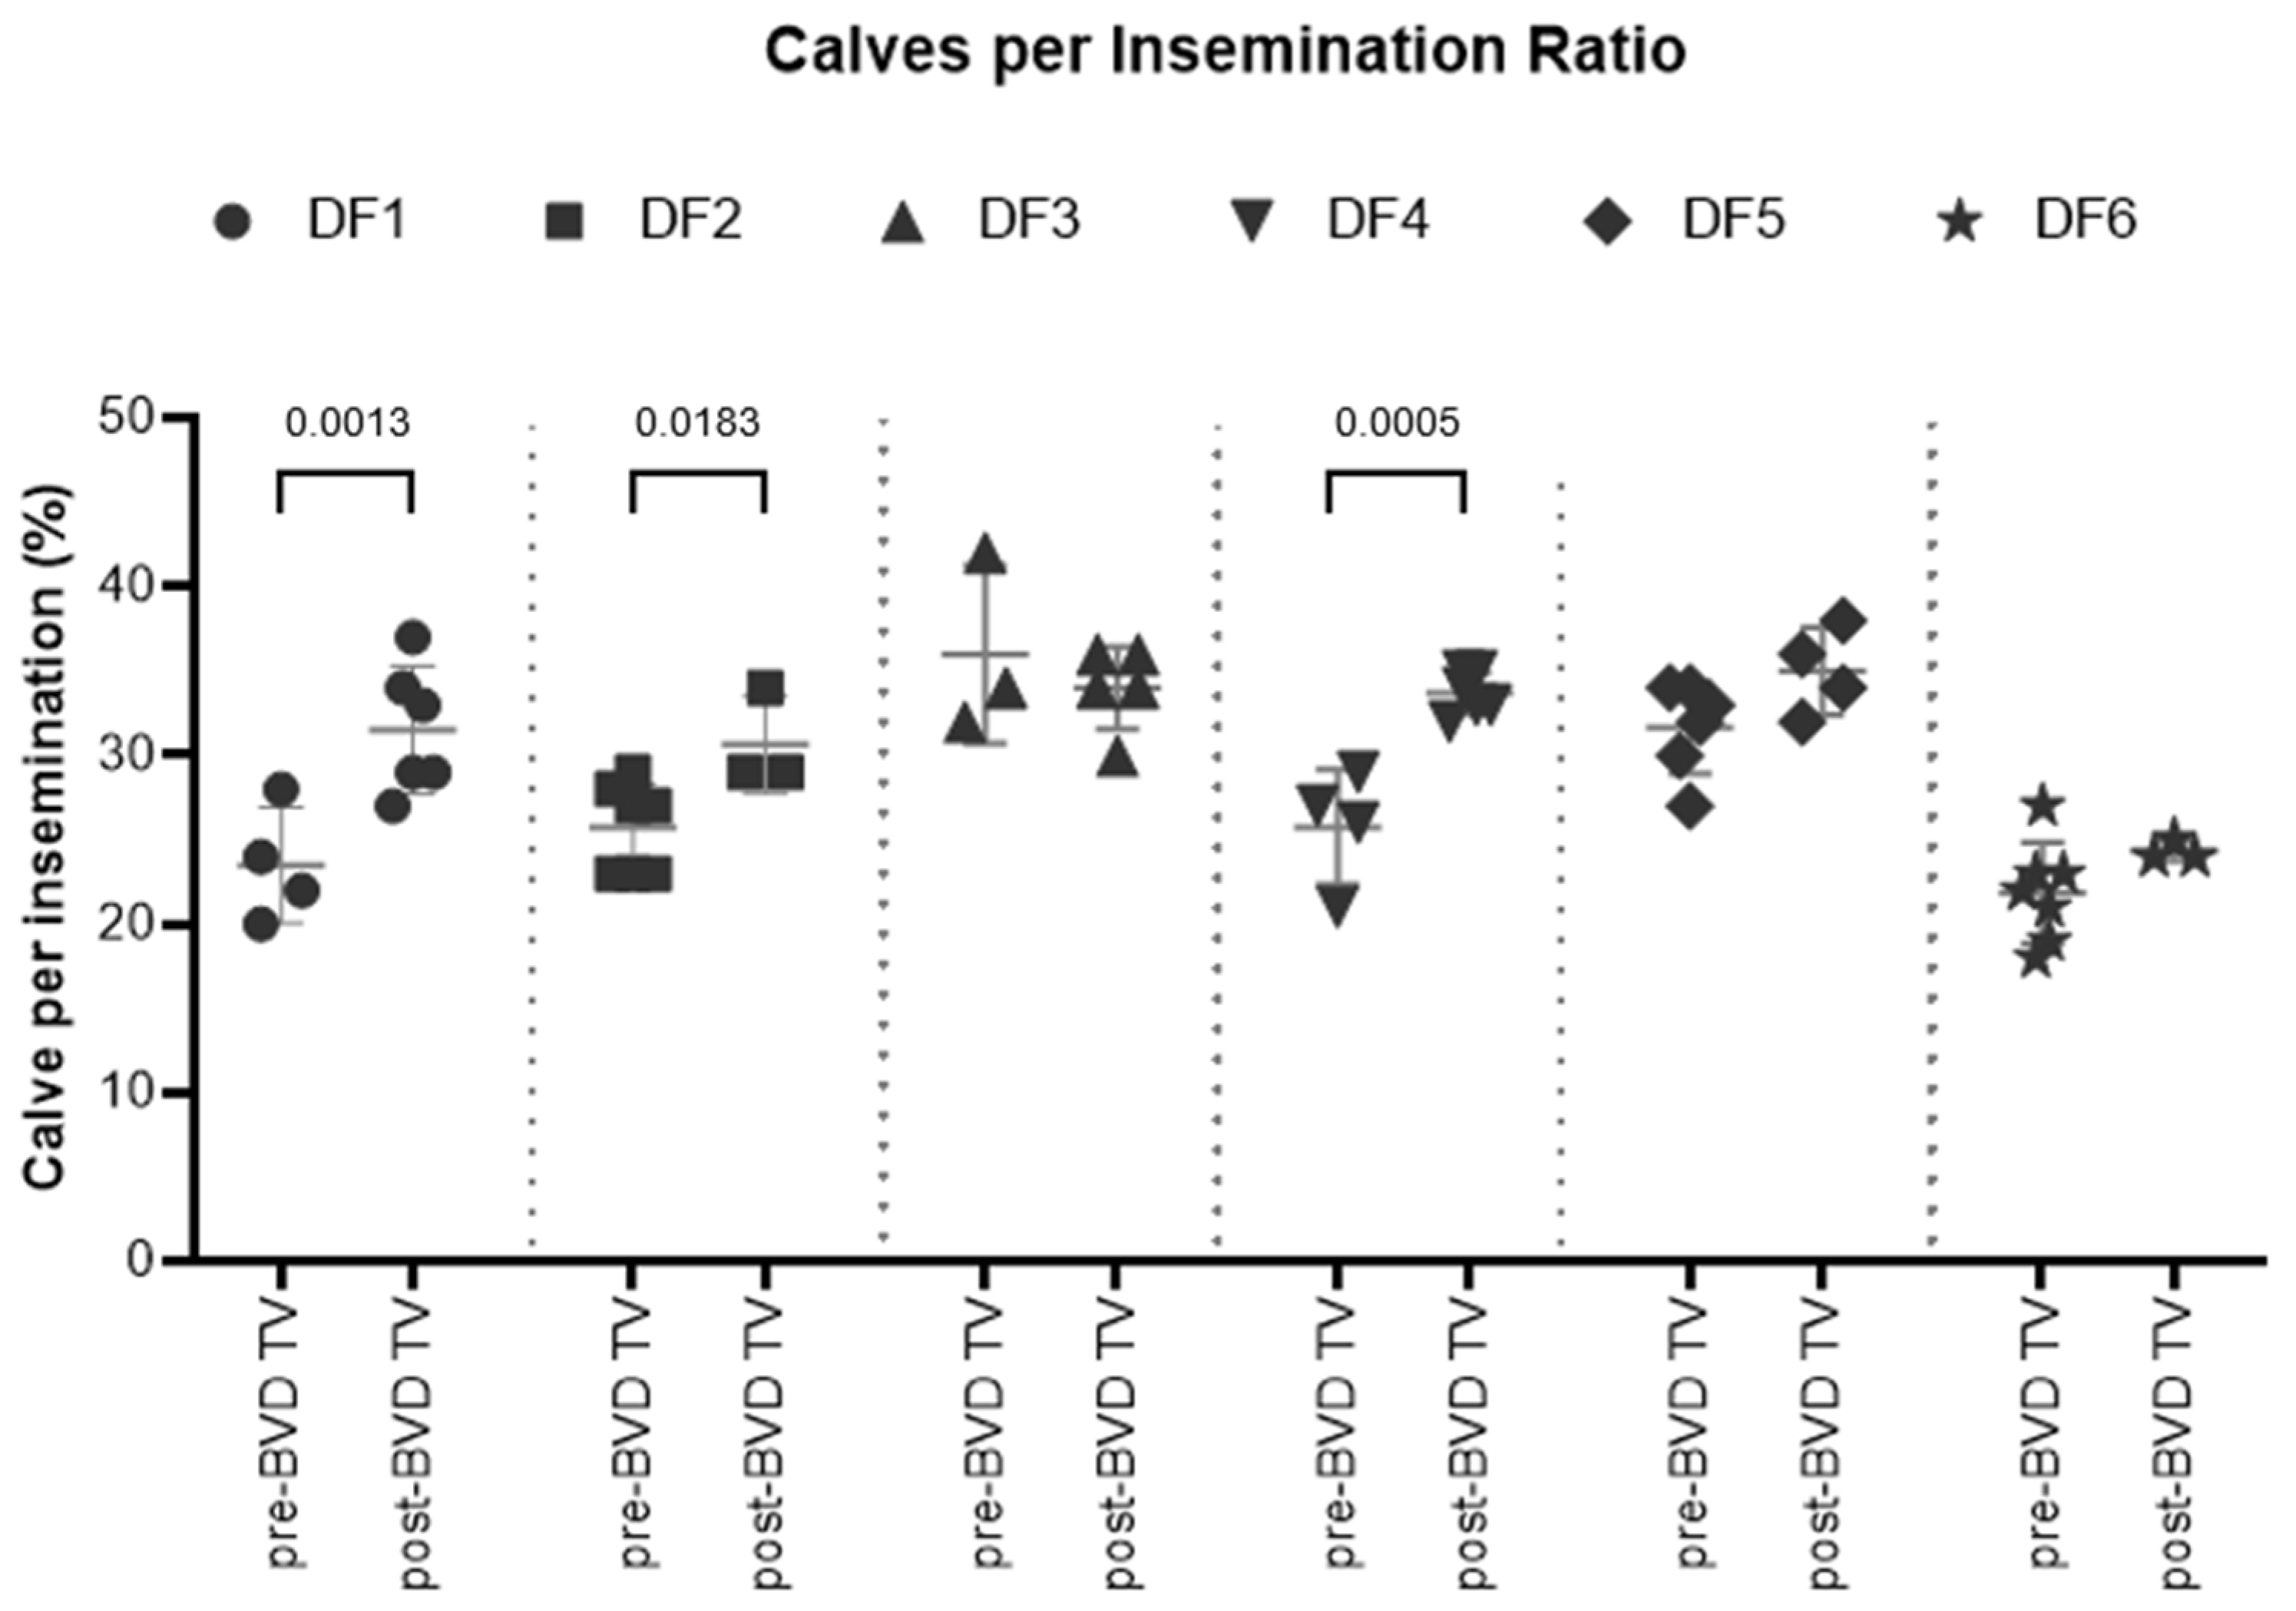
Figure 11.
Rate of calves born per insemination (%) across the six dairy farms before and after the introduction of the BVD-TV. Each point represents the annual rate of calves born per insemination of the six farms with lines indicating the mean ± standard deviation. Statistically significant differences between groups are indicated (paired Student T Test).
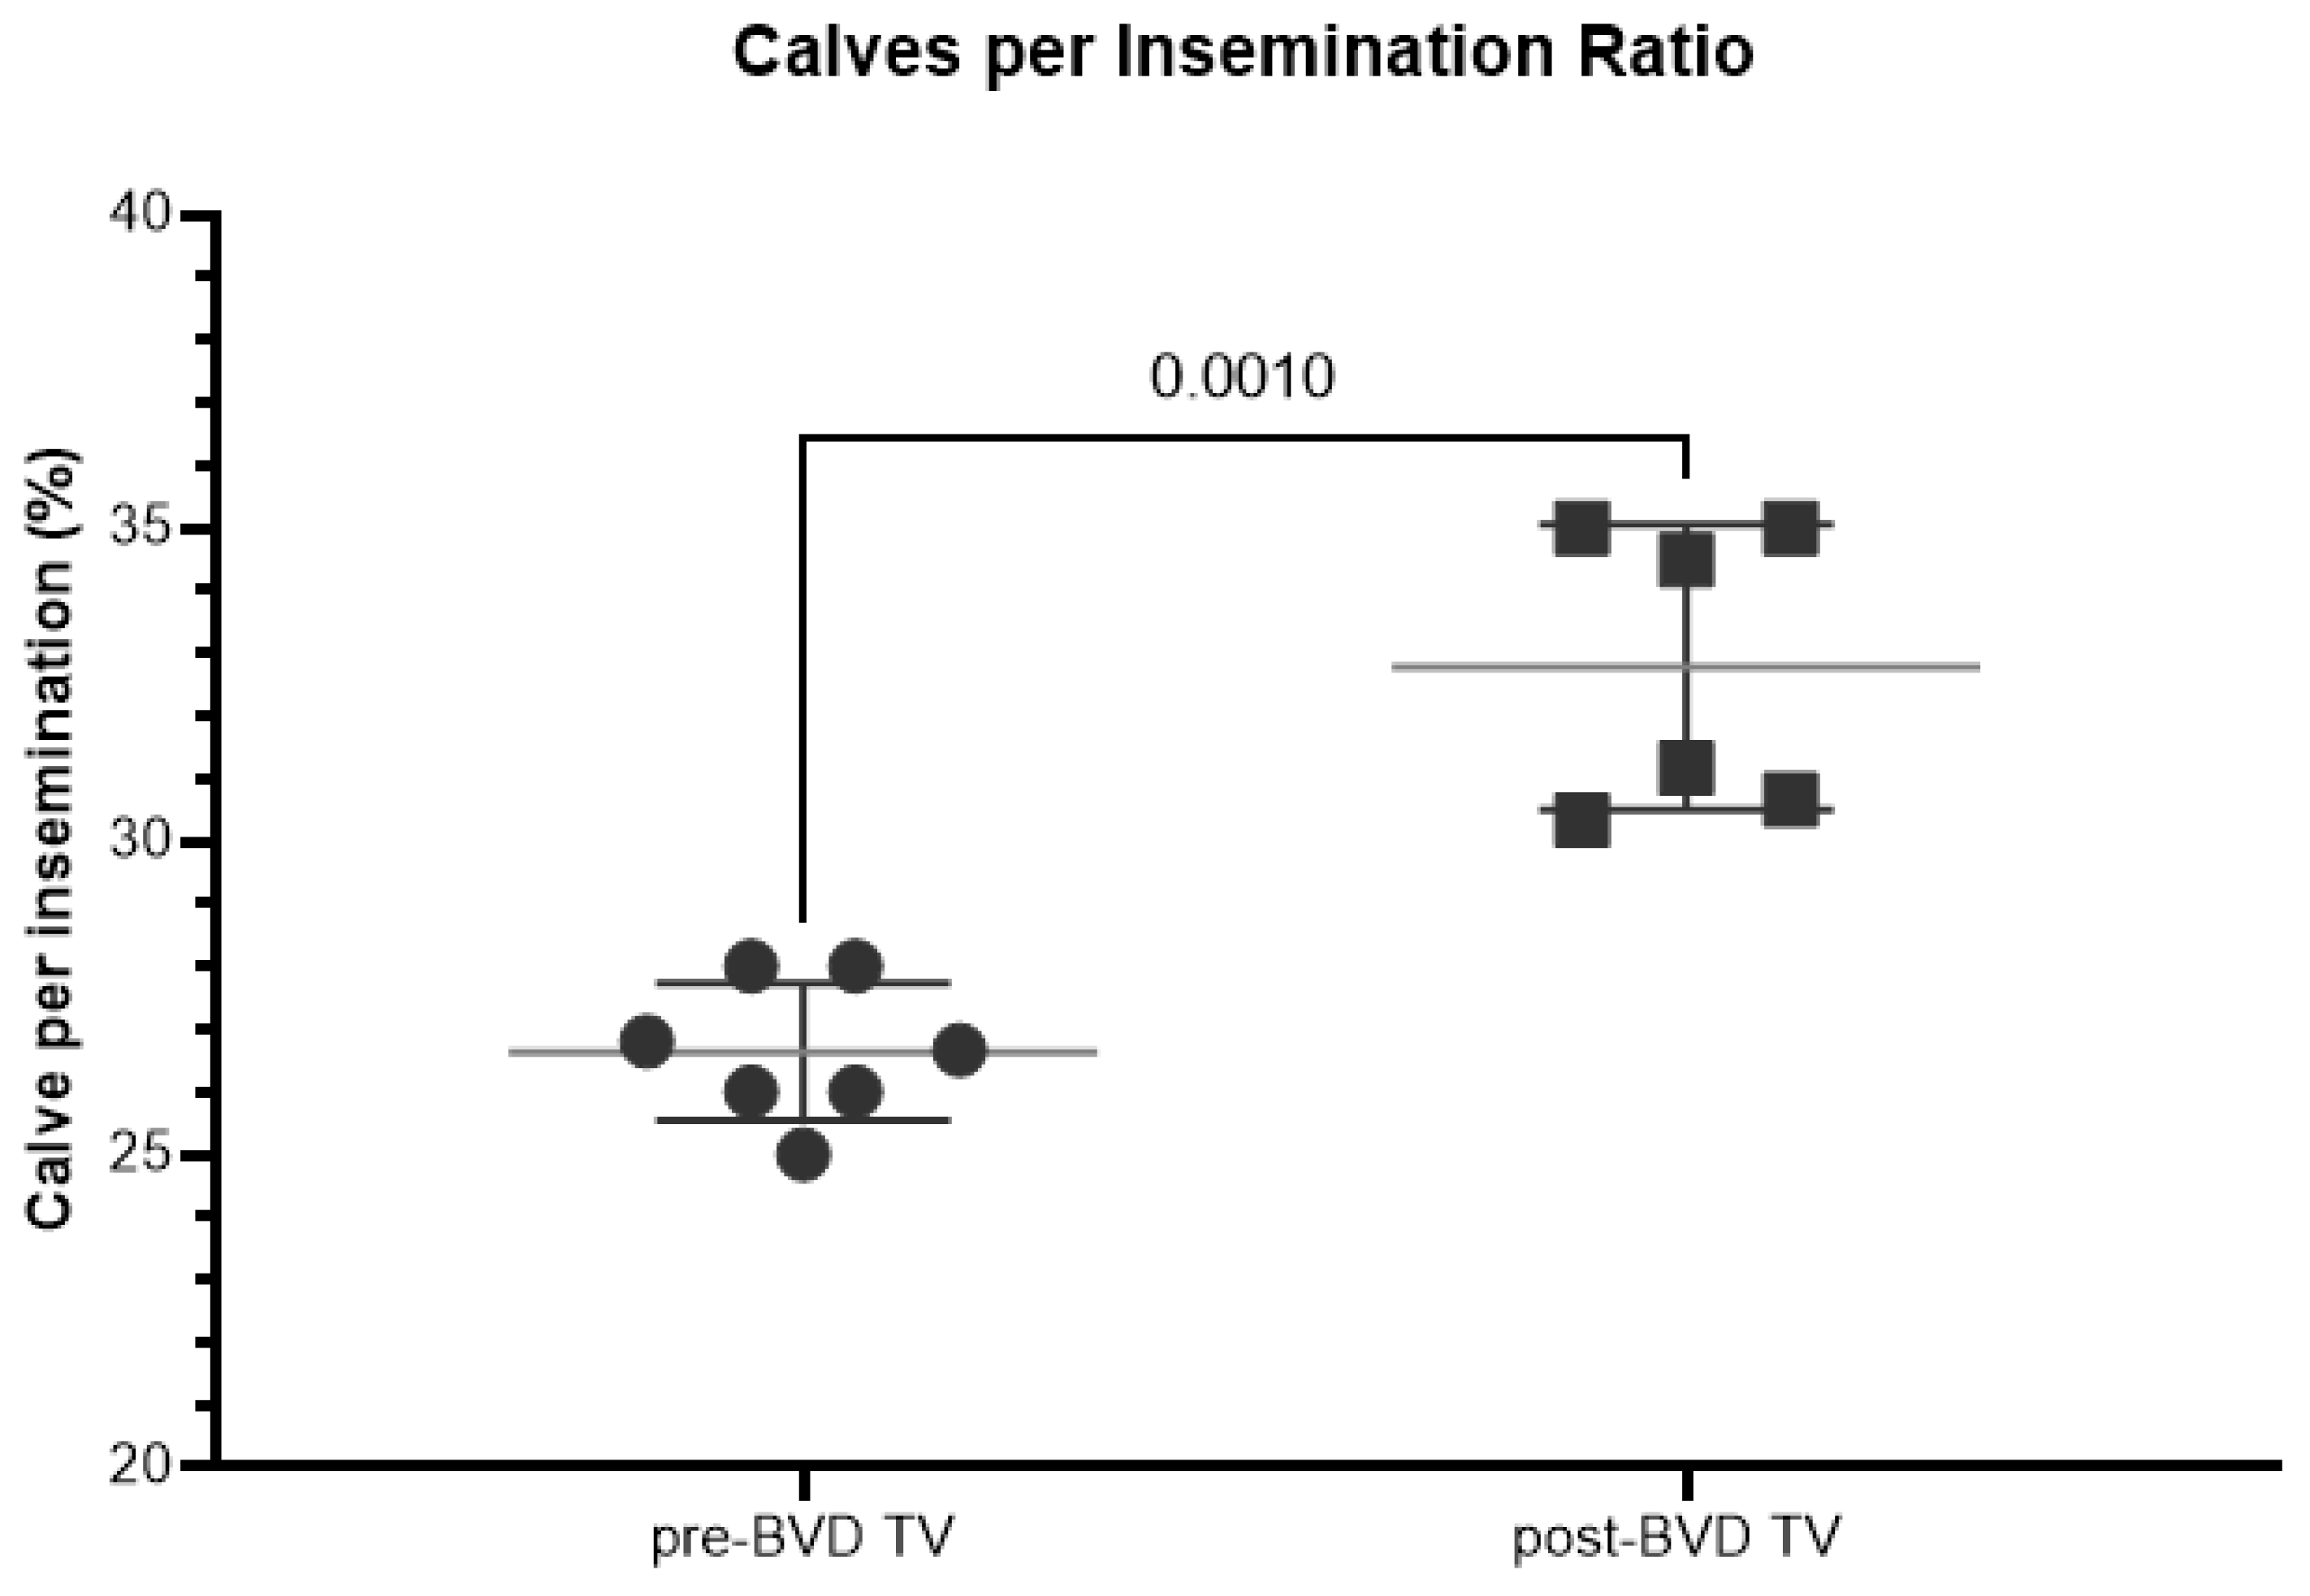
Figure 12.
Gray Bars: Years pre-BVD-TV. Square Bar: year 0. Stripped bars: years’ post-BVD-TV. 12A: Evolution of Abortion rate (bars) and Conception rate (line). 12B: Evolution of Days Open (bars) and Calves born per insemination (line).
Figure 12.
Gray Bars: Years pre-BVD-TV. Square Bar: year 0. Stripped bars: years’ post-BVD-TV. 12A: Evolution of Abortion rate (bars) and Conception rate (line). 12B: Evolution of Days Open (bars) and Calves born per insemination (line).
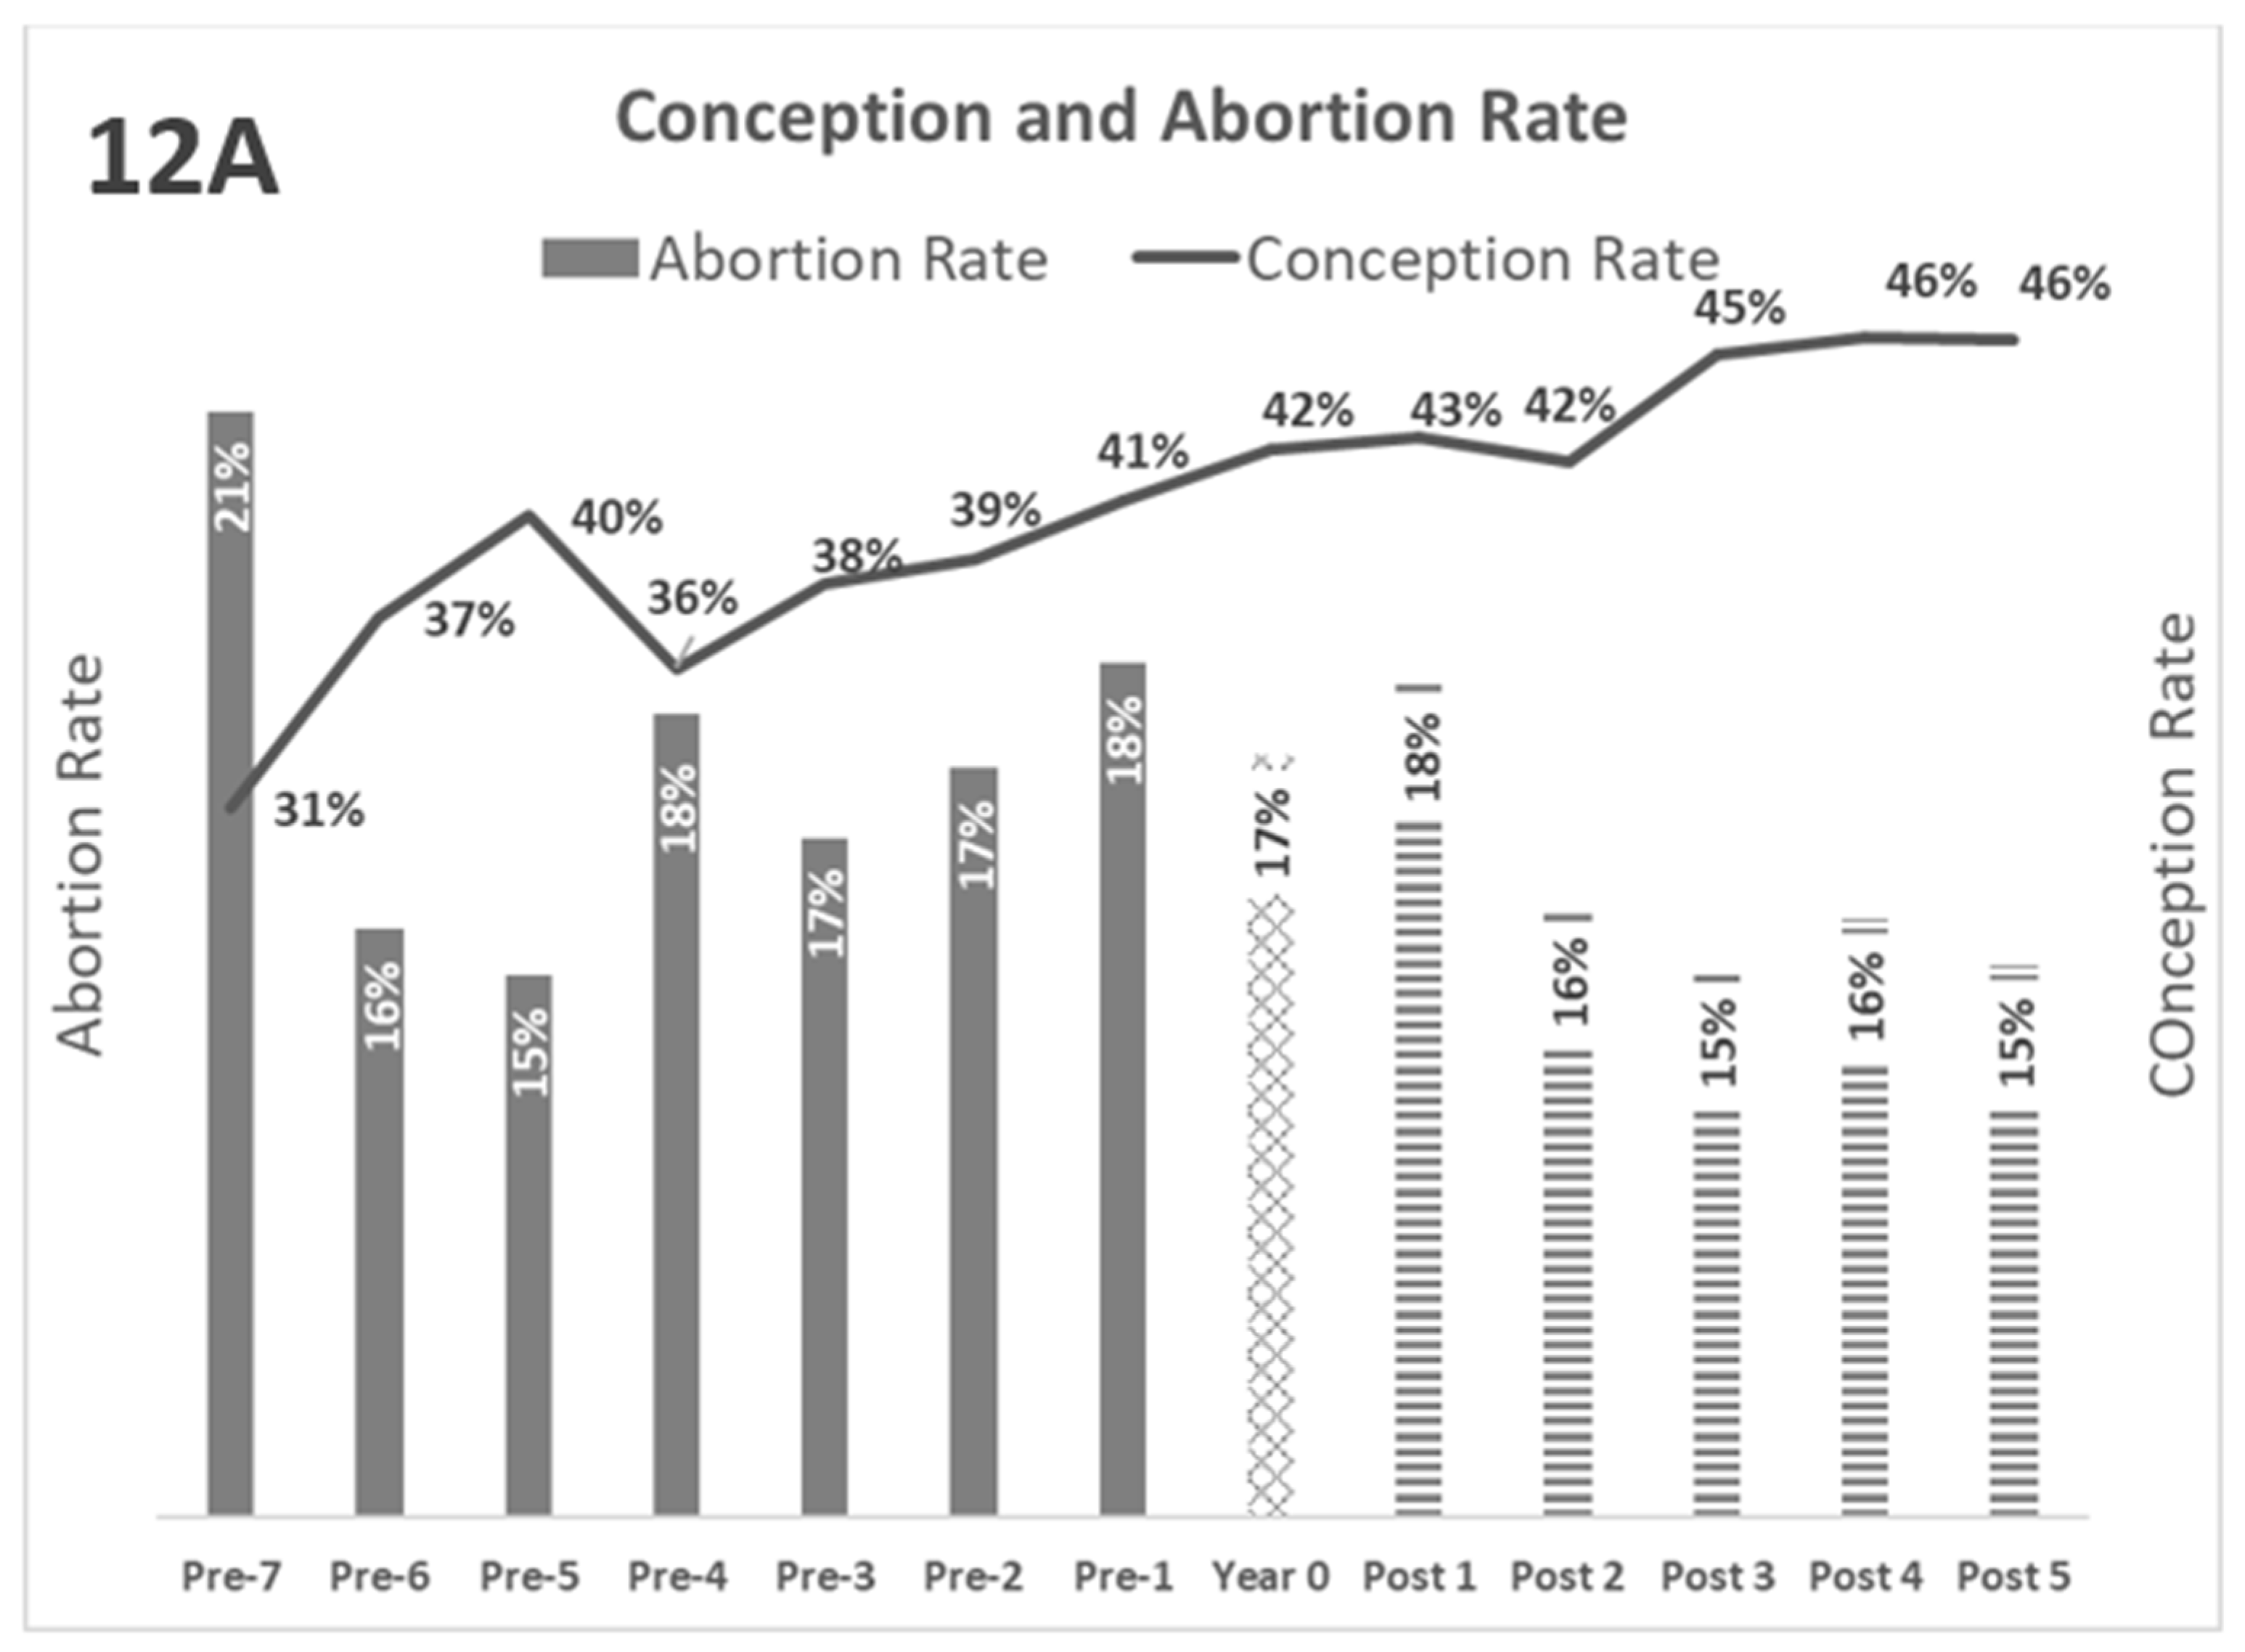
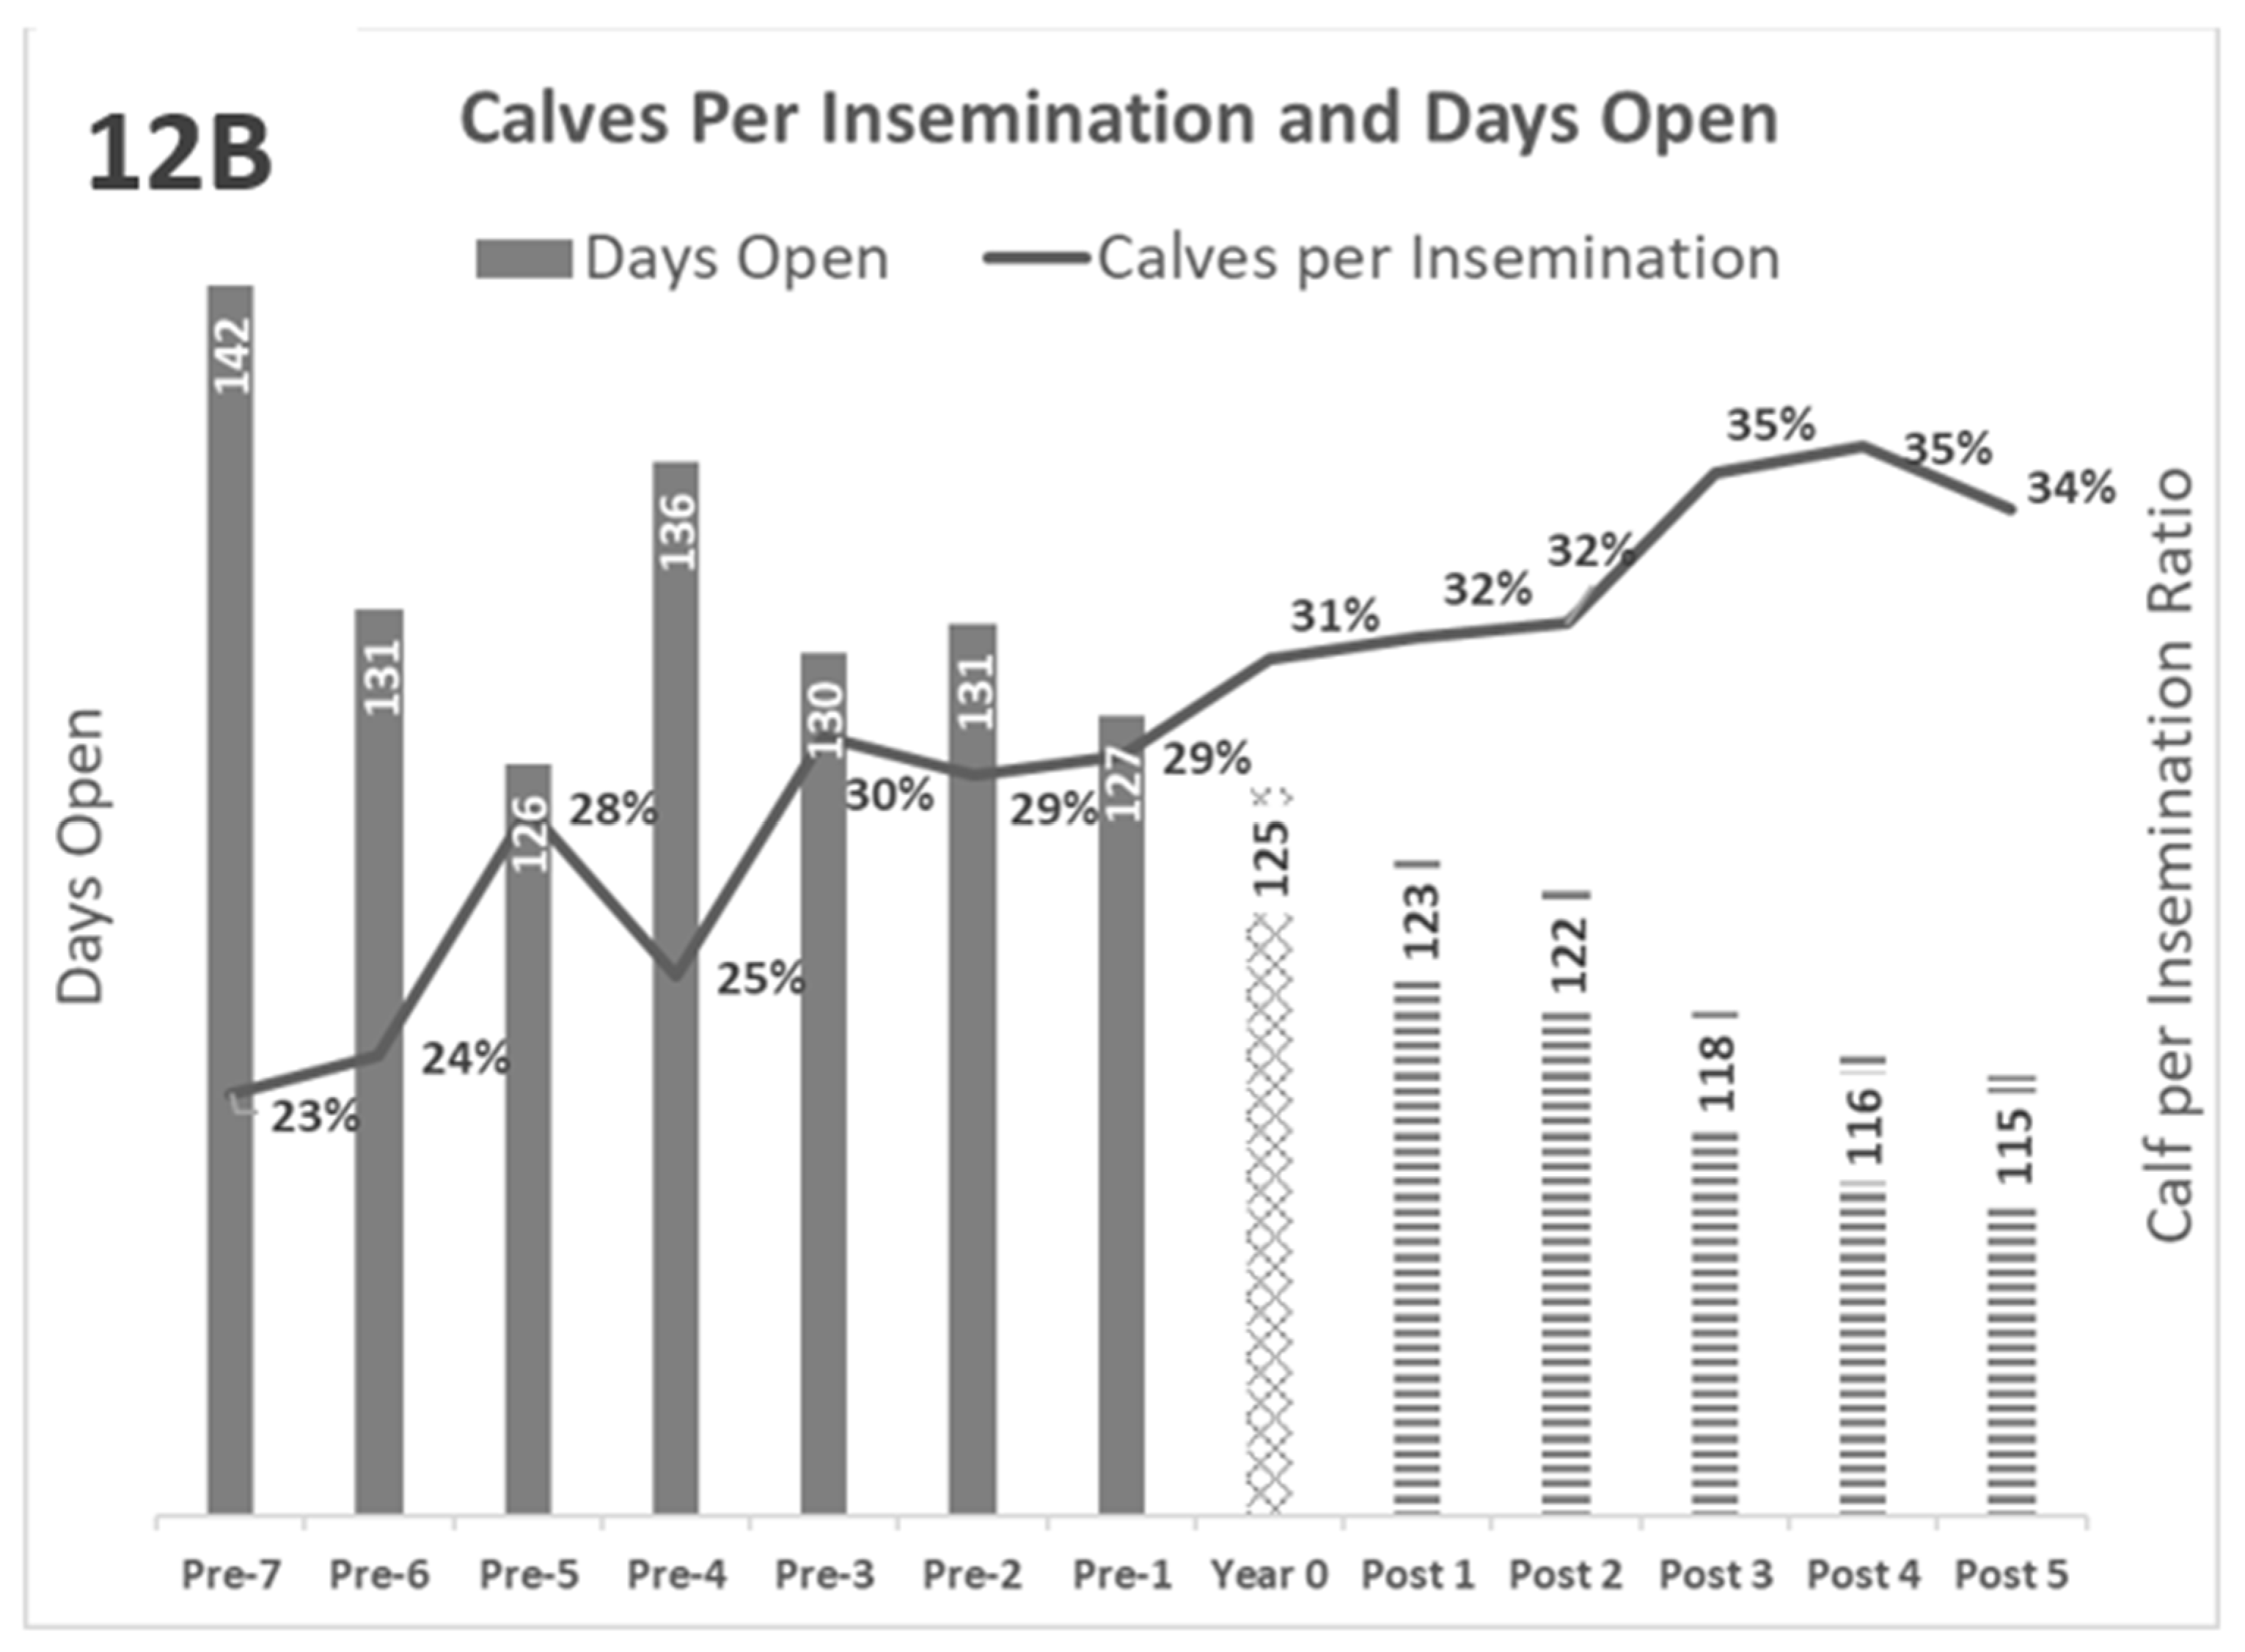
Figure 13.
Neonatal Mortality (%) in six dairy farms (DF 1 – 6) before and after the application of the BVD-TV. Each point represents the annual Neonatal mortality (%) for each farm, with lines indicating the mean ± standard deviation for each group (pre- and post-BVD TV). Statistically significant differences between groups are indicated (paired Student T Test).
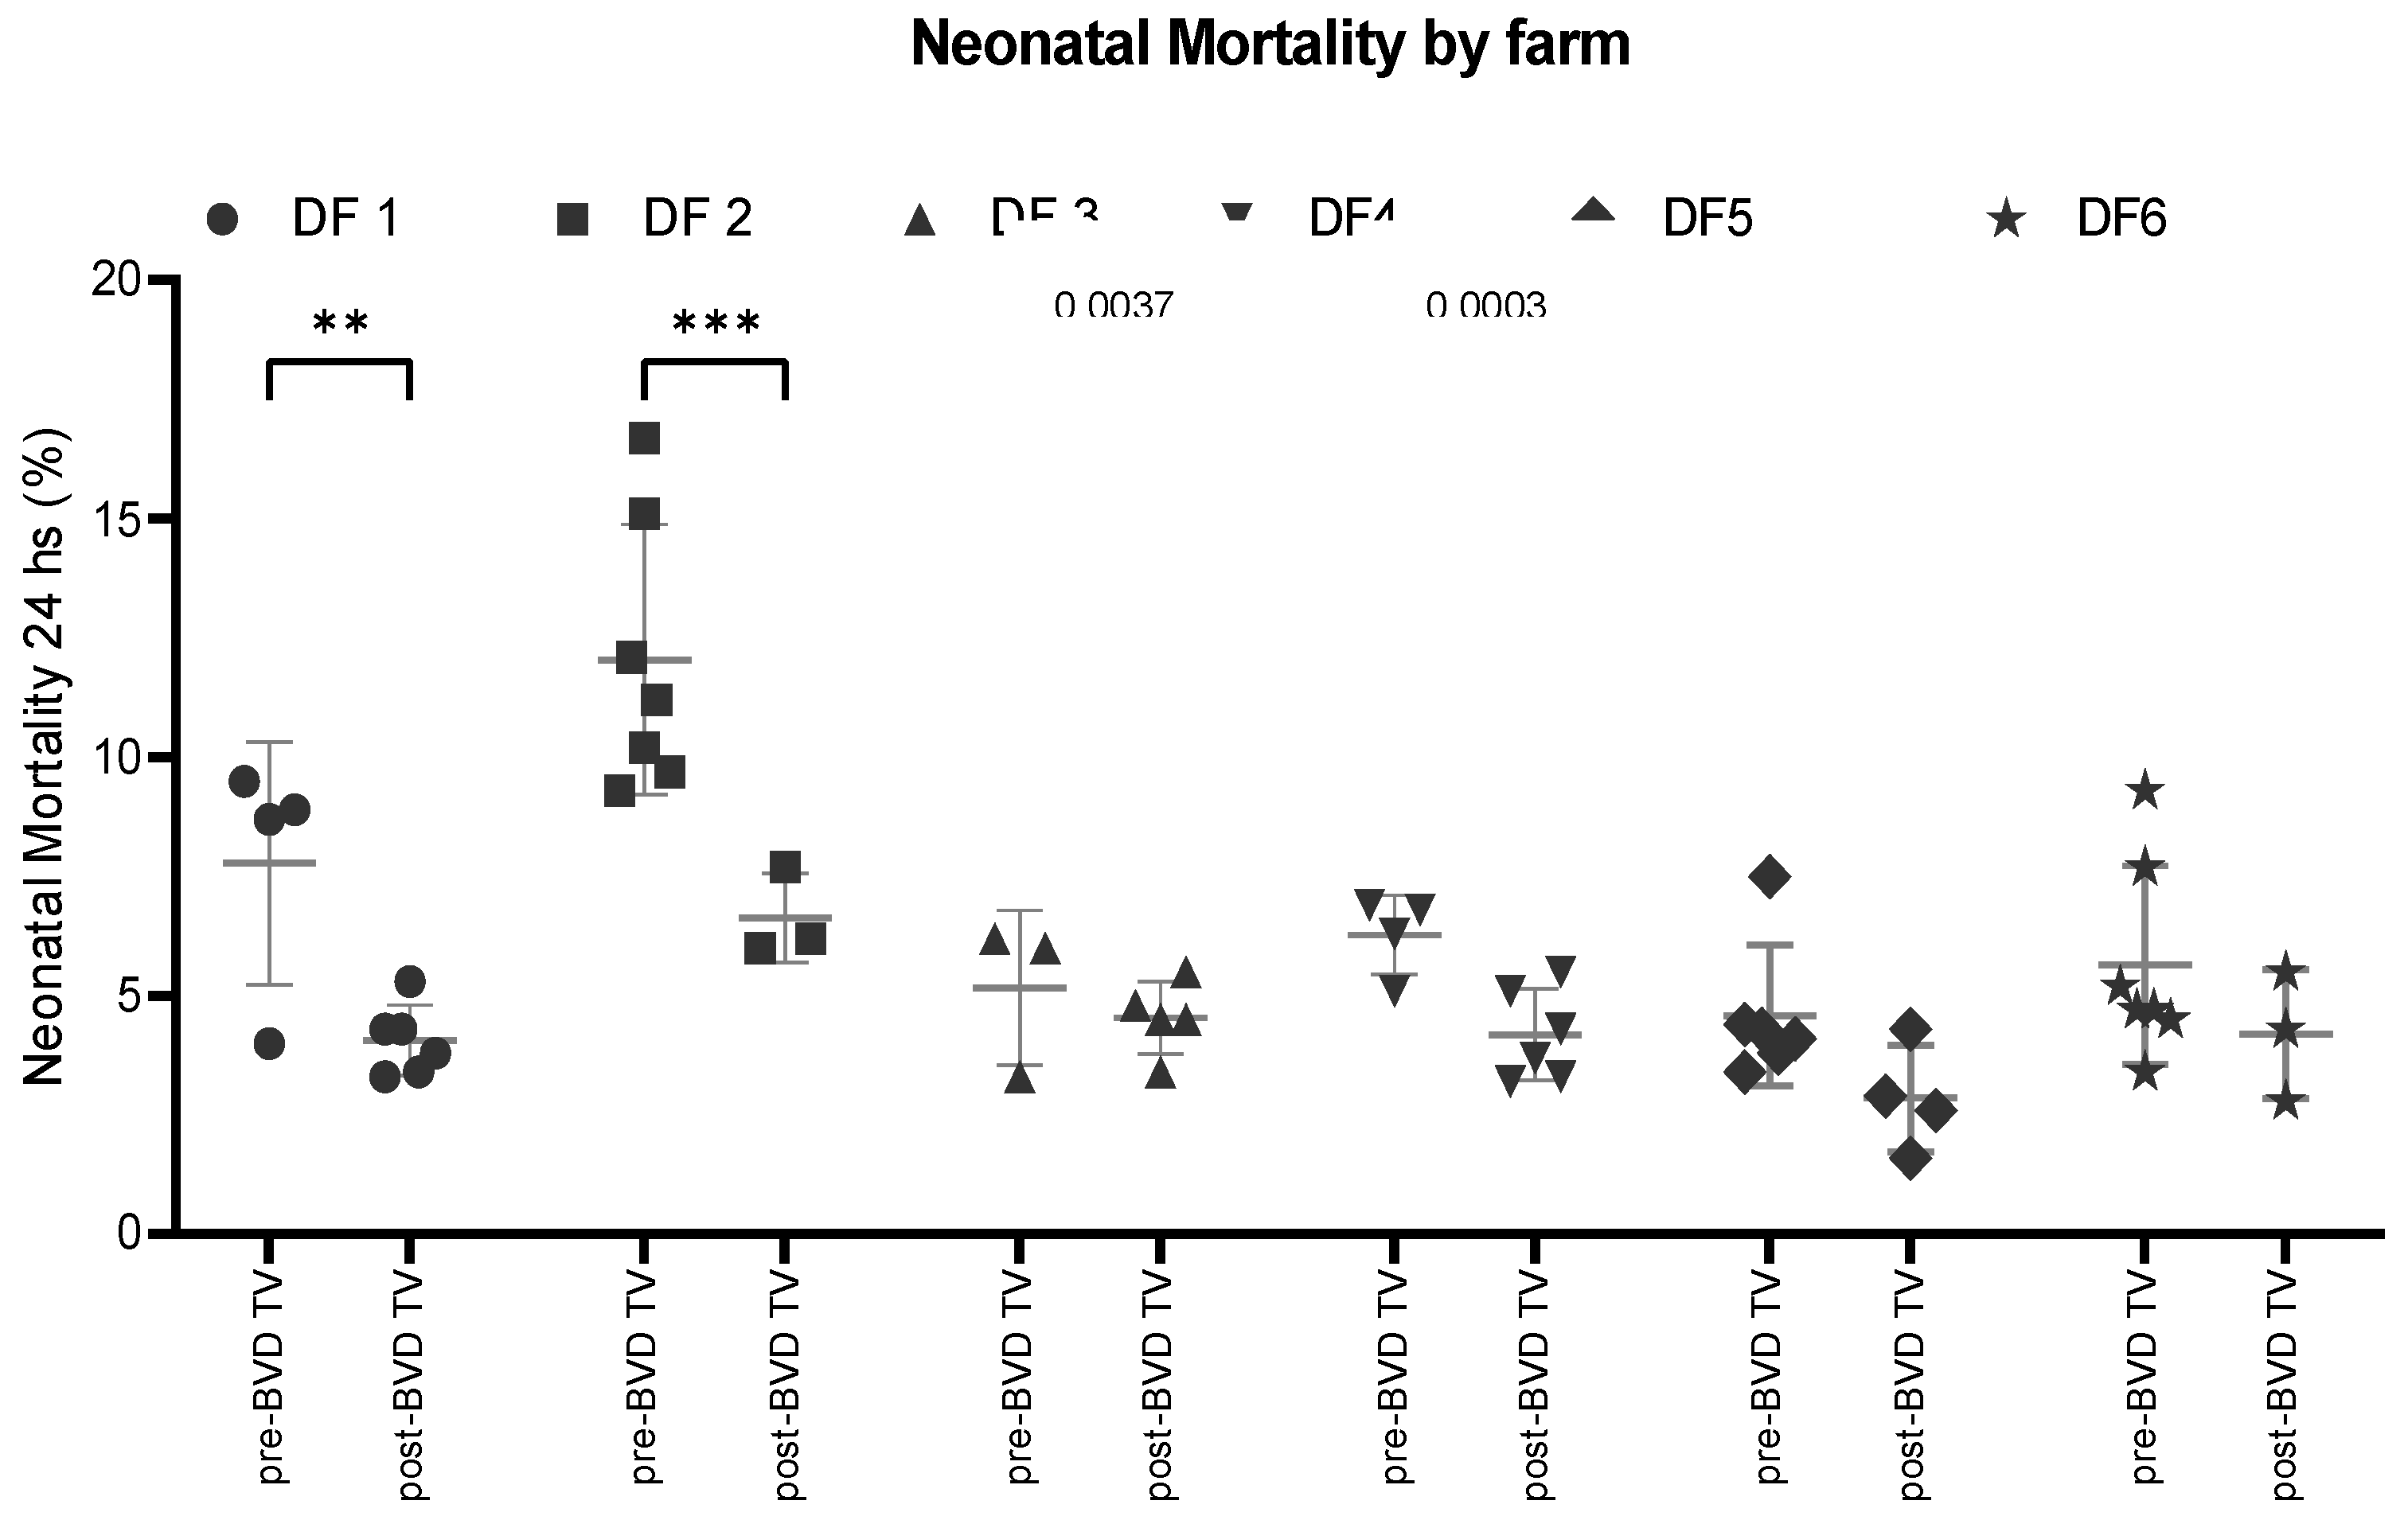
Figure 14.
Neonatal Mortality (%) across the six dairy farms before and after the application of the BVD-TV. Each point represents the annual neonatal mortality of the six farms with lines indicating the mean ± standard deviation. Statistically significant differences between groups are indicated (paired Student T Test).
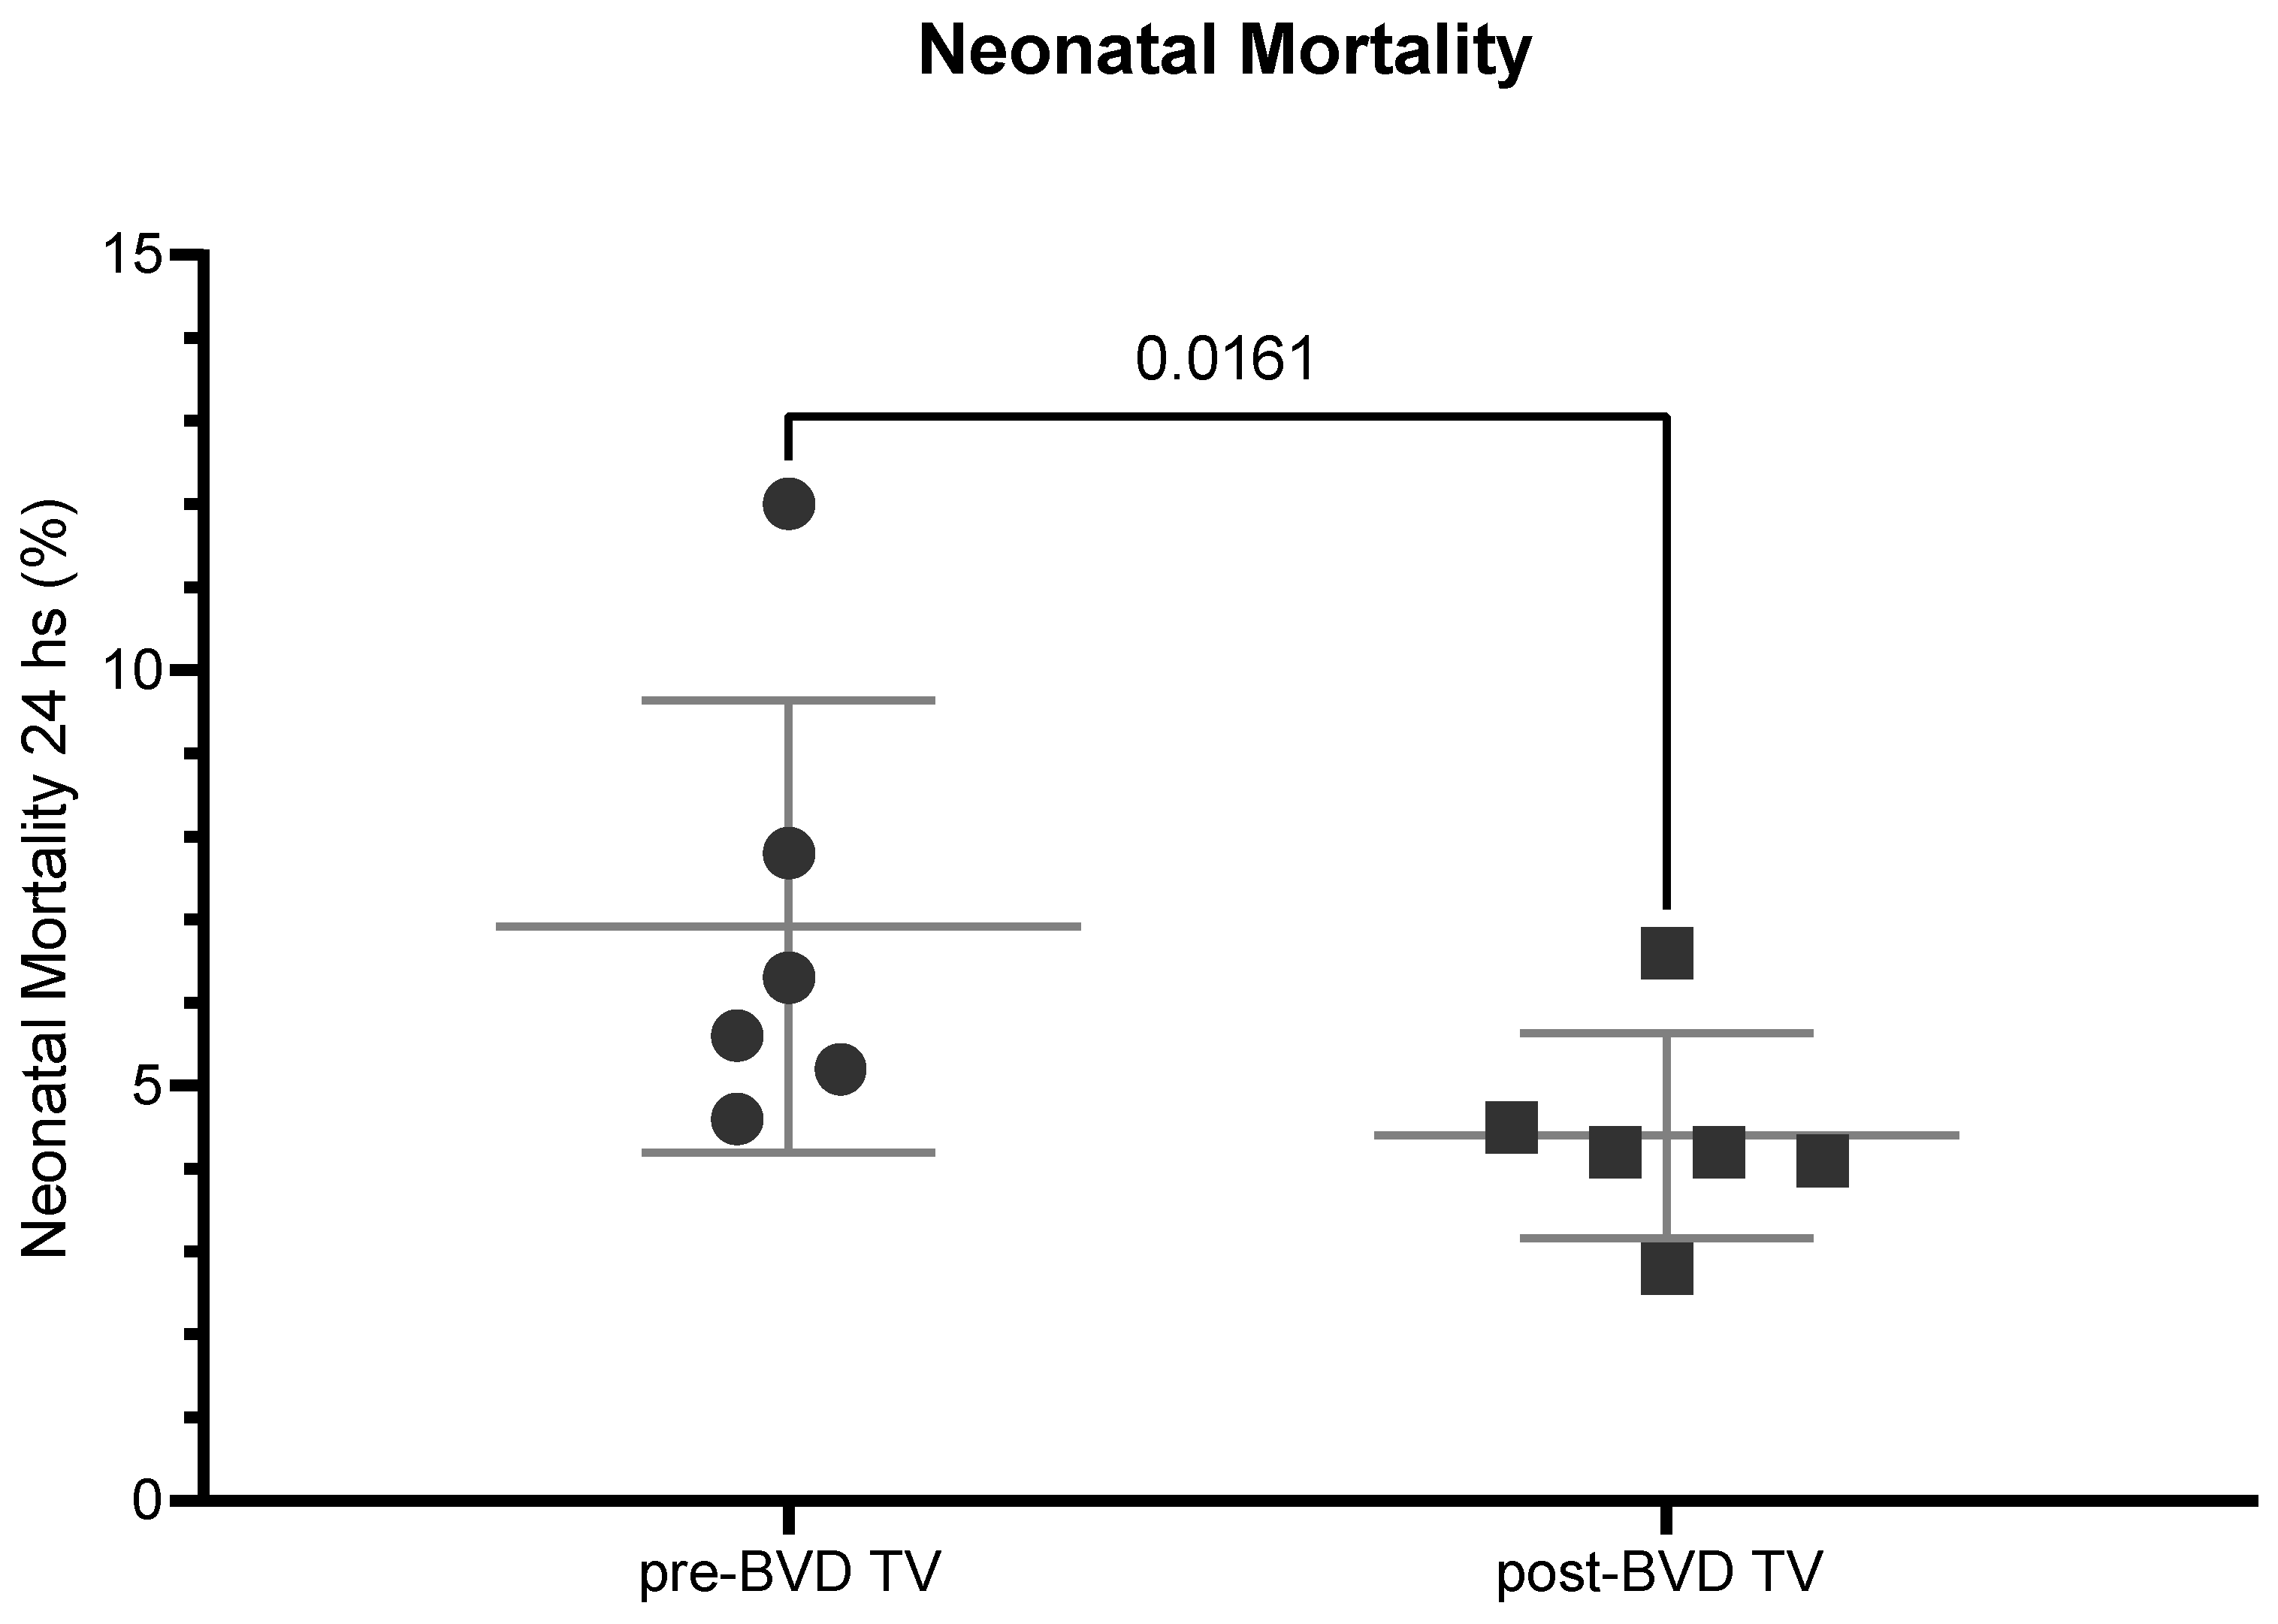
Figure 15.
Overall Mortality (%) in six dairy farms (DF 1 – 6) before and after the application of the BVD-TV. Each point represents the annual Overall mortality (%) for each farm, with lines indicating the mean ± standard deviation for each group (pre- and post-BVD TV). Statistically significant differences between groups are indicated (paired Student T Test).
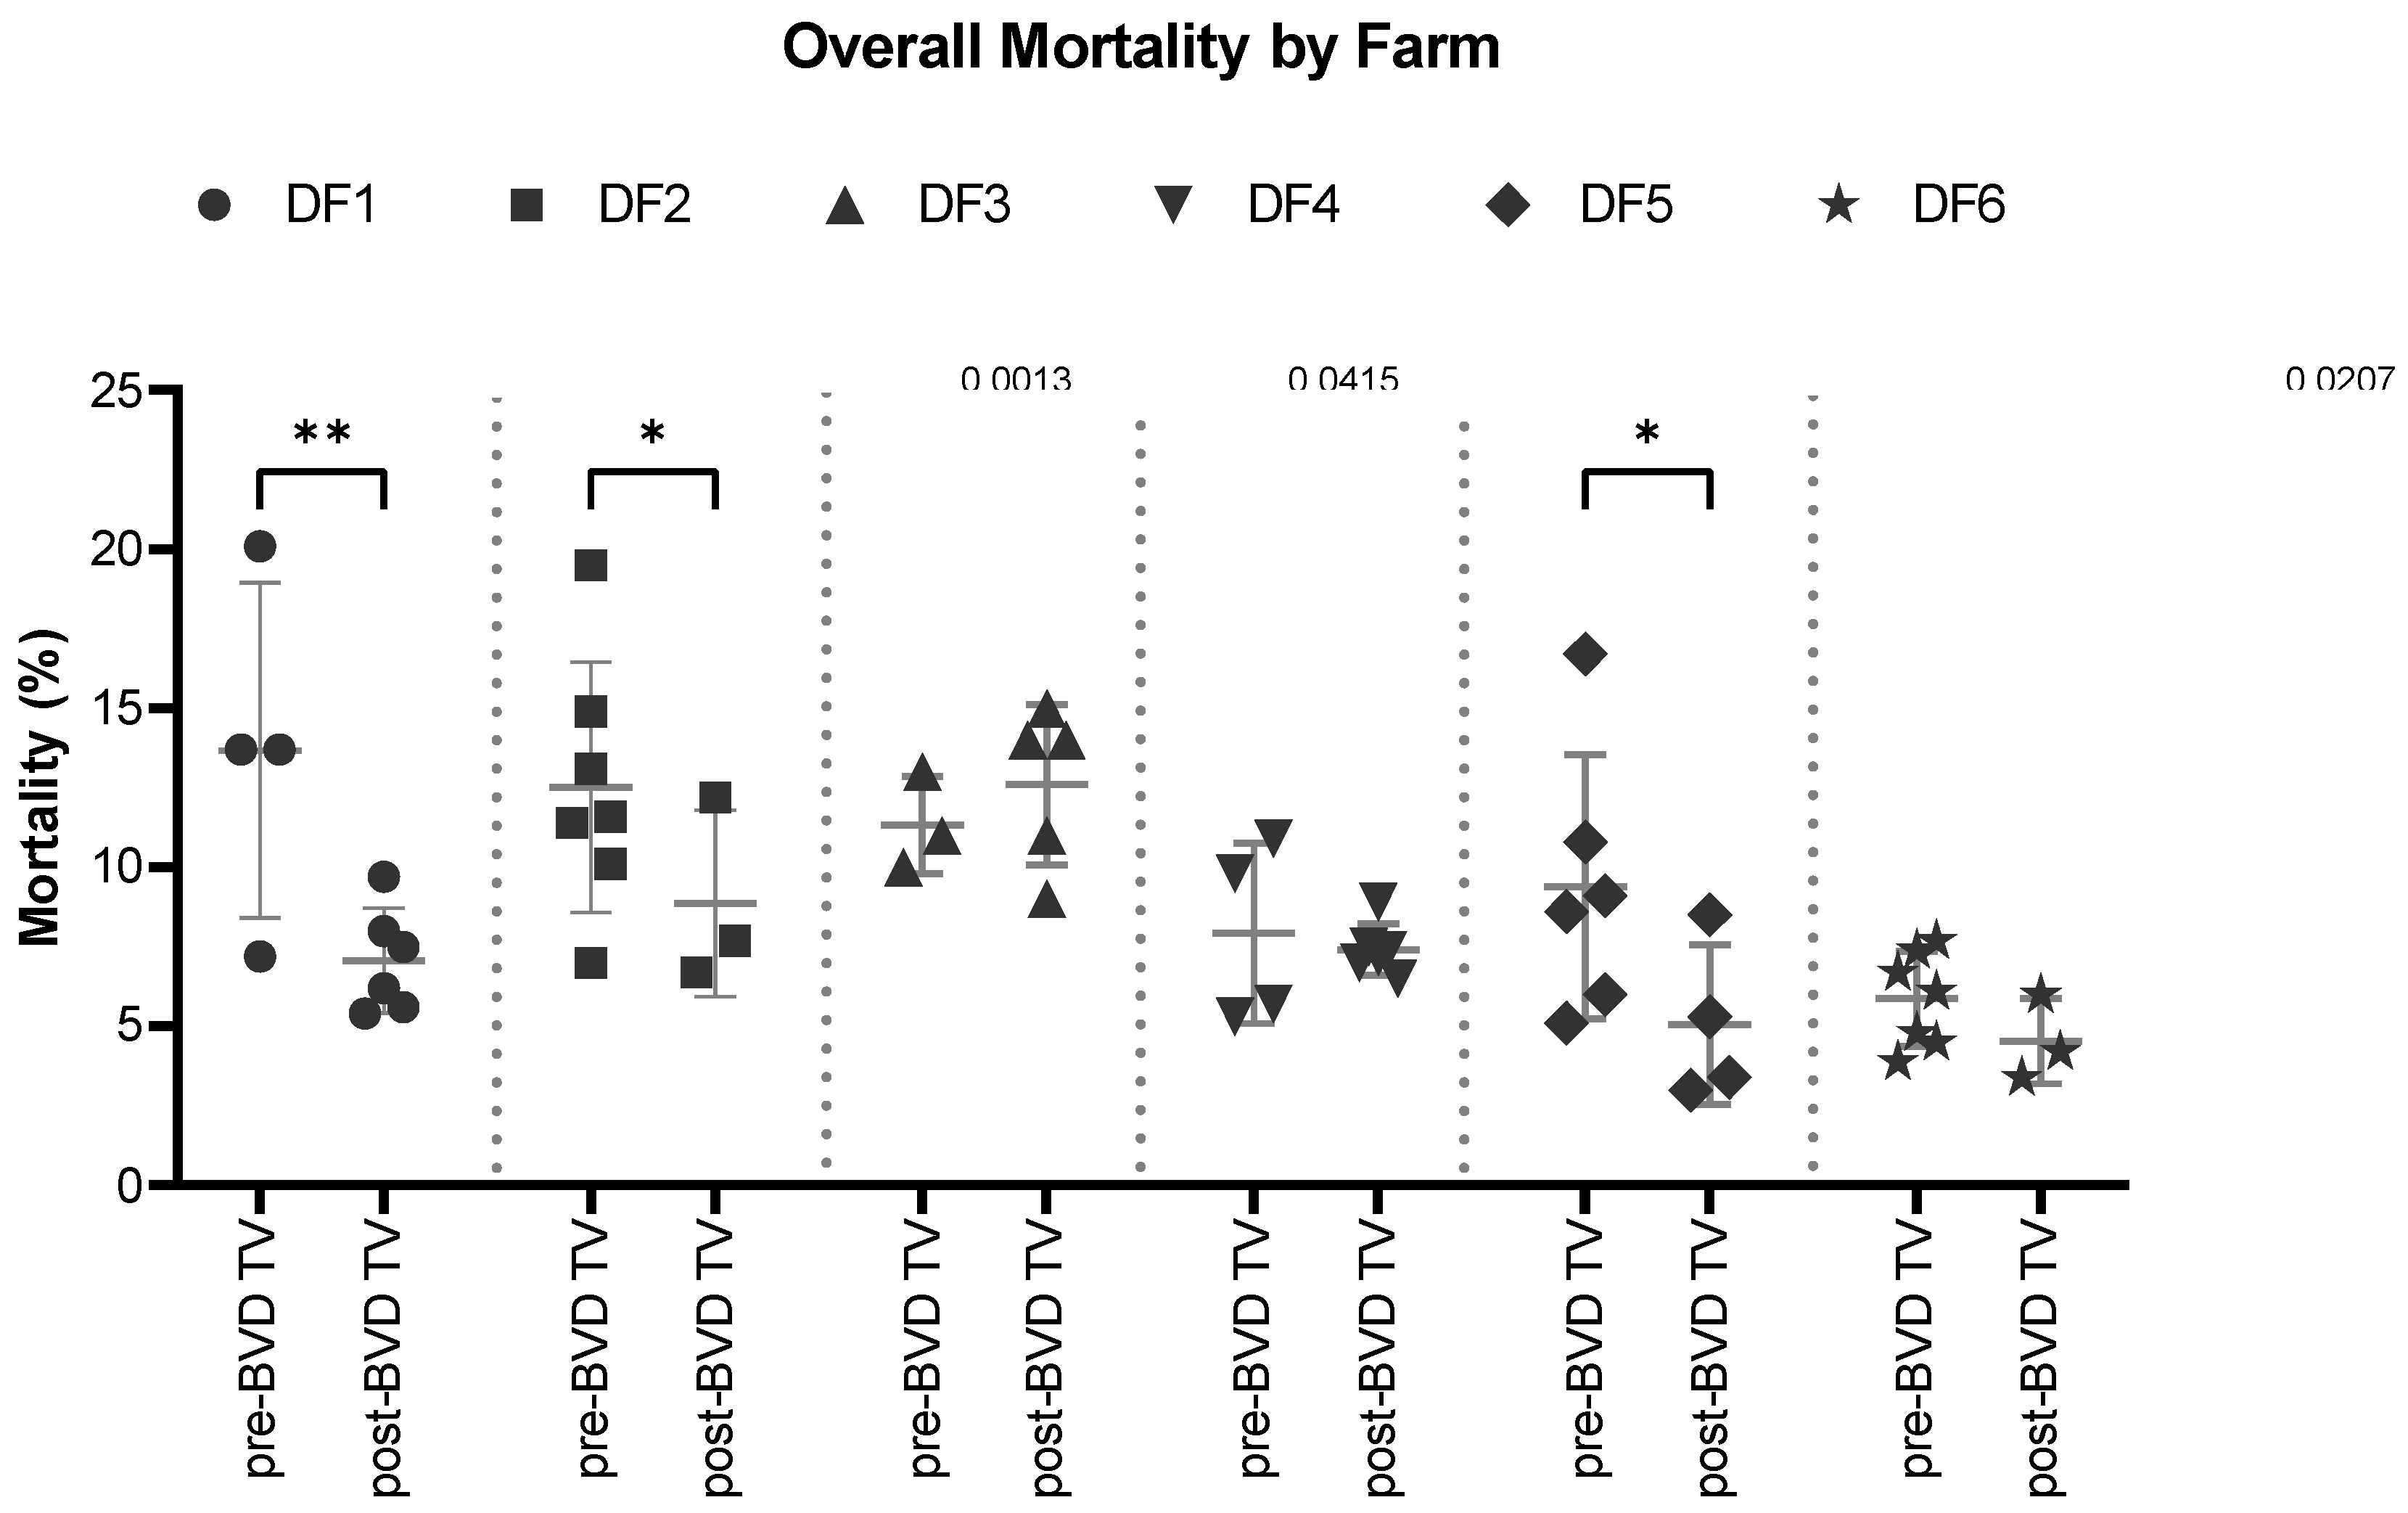
Figure 16.
Overall Mortality (%) across the six dairy farms before and after the application of the BVD-TV. Each point represents the annual Overall mortality of the six farms with lines indicating the mean ± standard deviation. Statistically significant differences between groups are indicated (paired Student T Test).
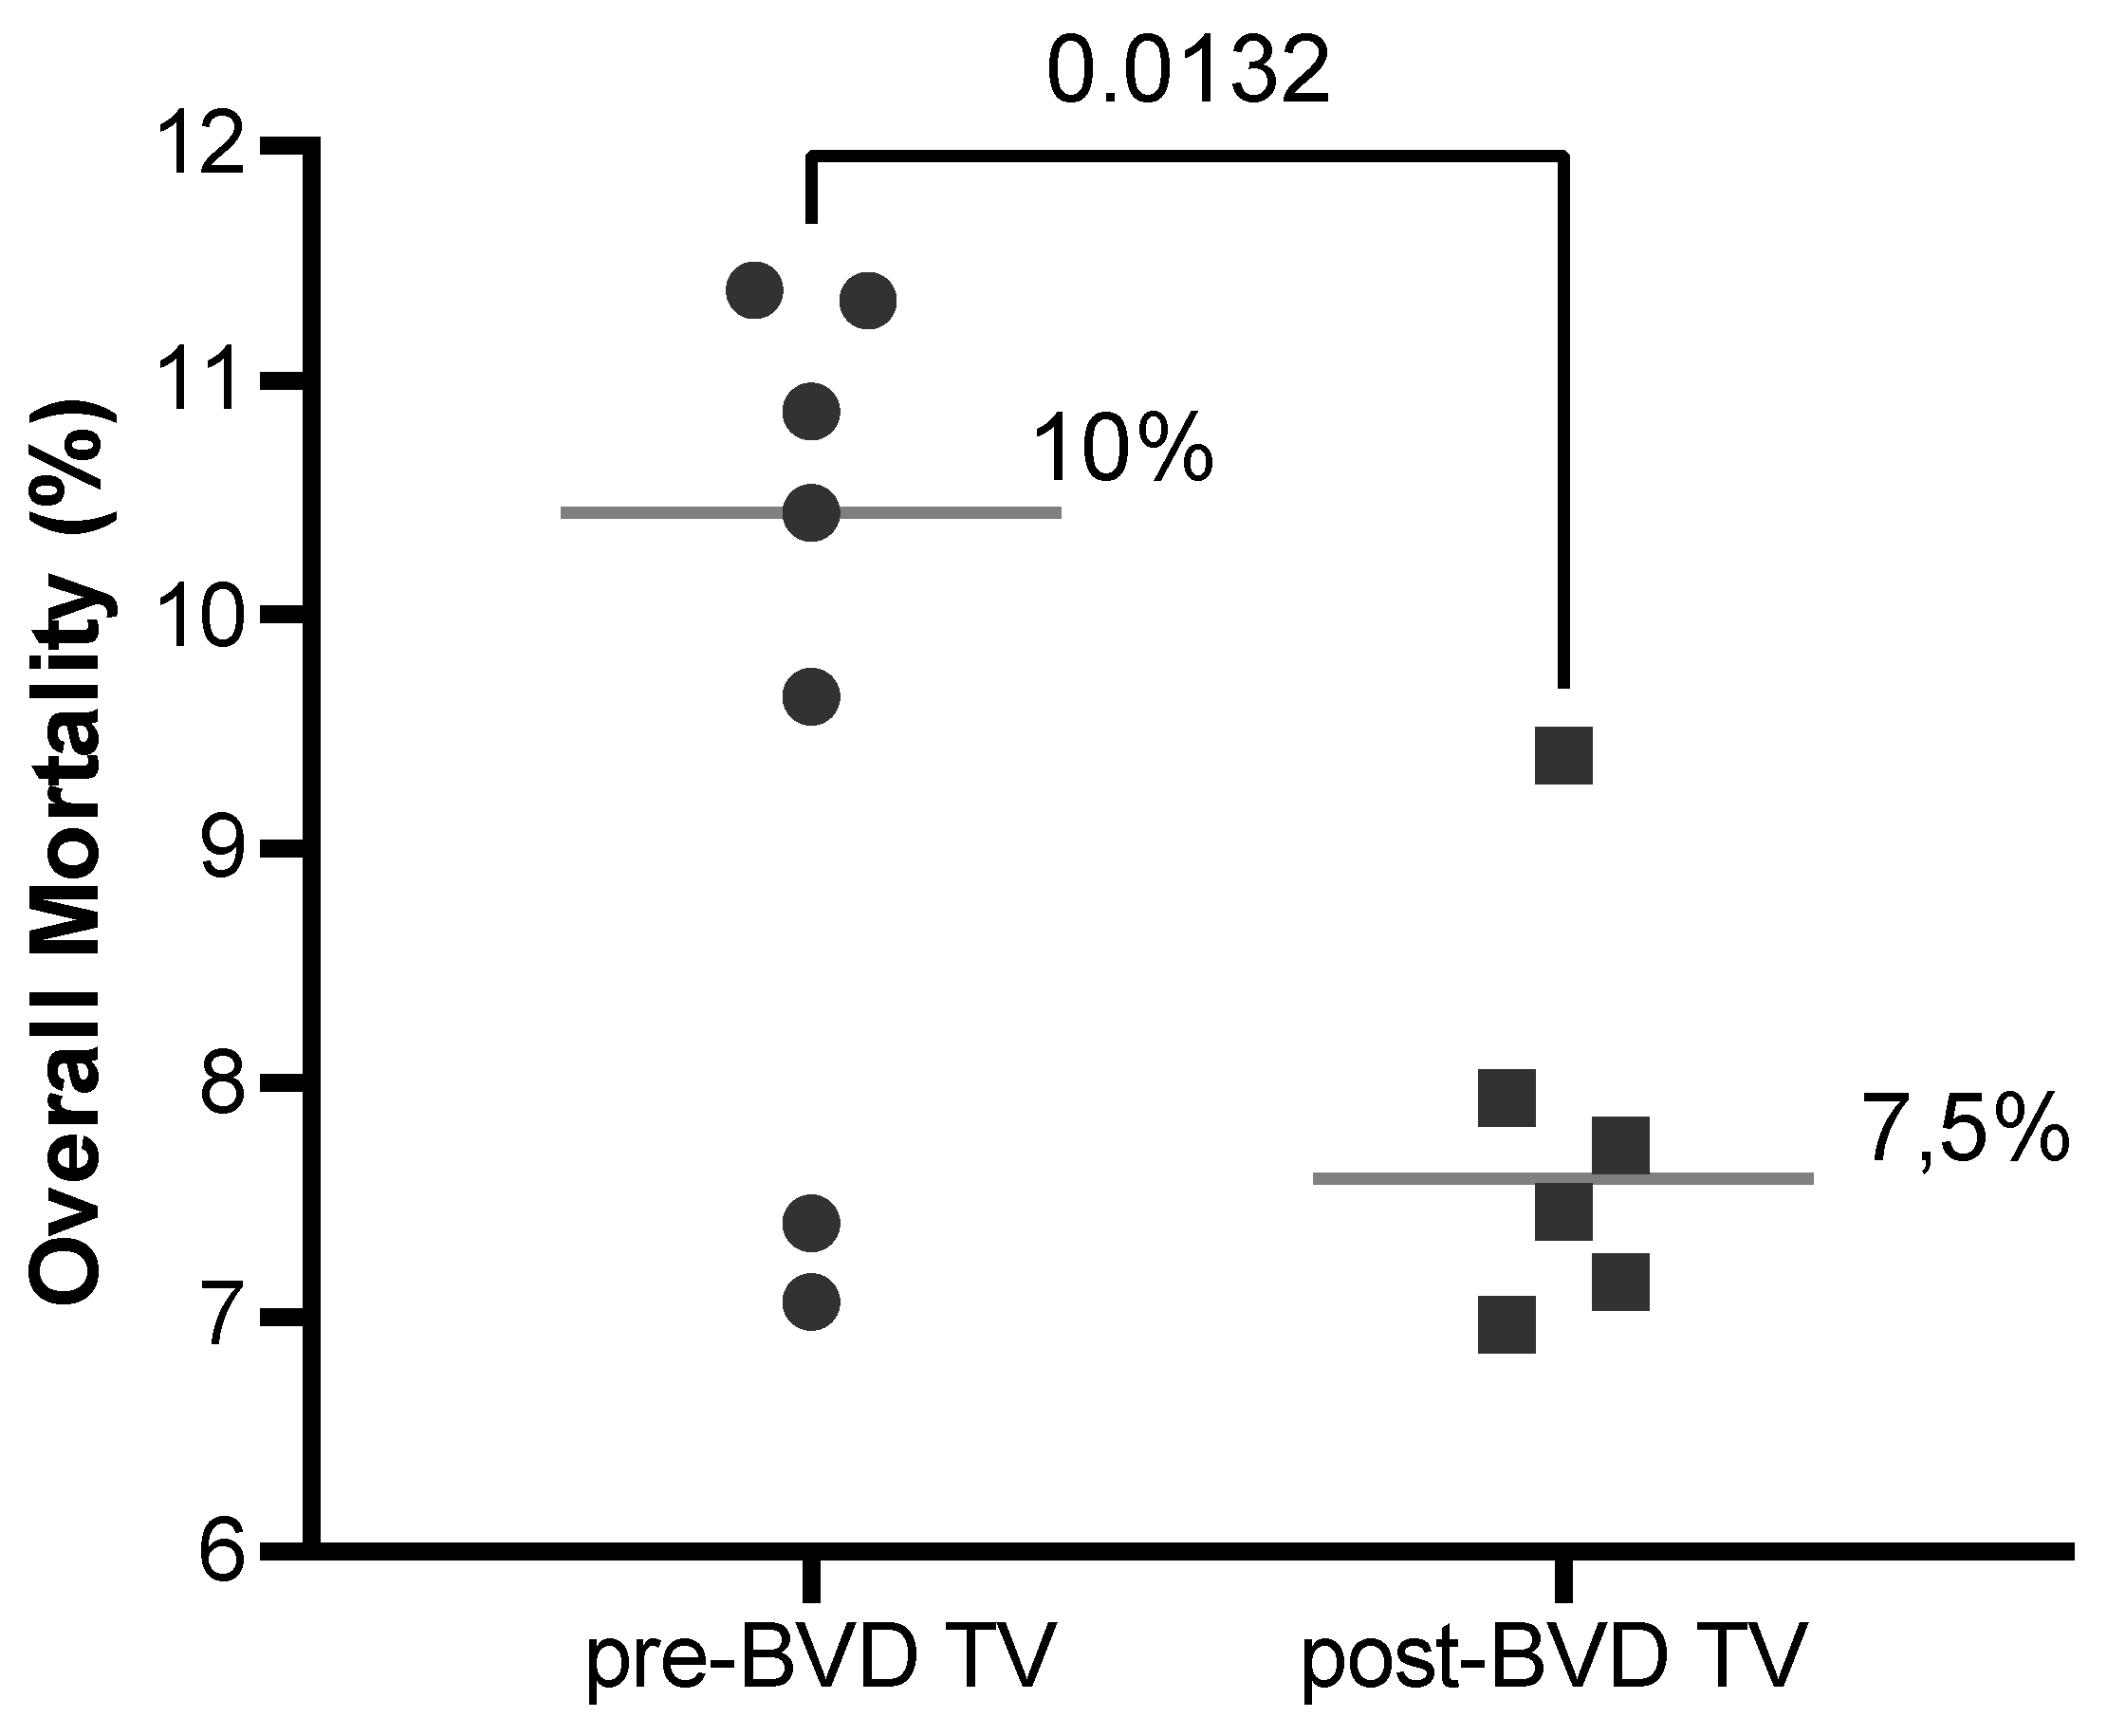
Figure 17.
Gray Bars: Years pre-BVD-TV. Square Bar: year 0. Stripped bars: years’ post-BVD-TV. 17: Evolution of Perinatal (Bars) and Overall (Line) mortality. Results are presented as the average of all the dairy farms for each individual year.
Figure 17.
Gray Bars: Years pre-BVD-TV. Square Bar: year 0. Stripped bars: years’ post-BVD-TV. 17: Evolution of Perinatal (Bars) and Overall (Line) mortality. Results are presented as the average of all the dairy farms for each individual year.
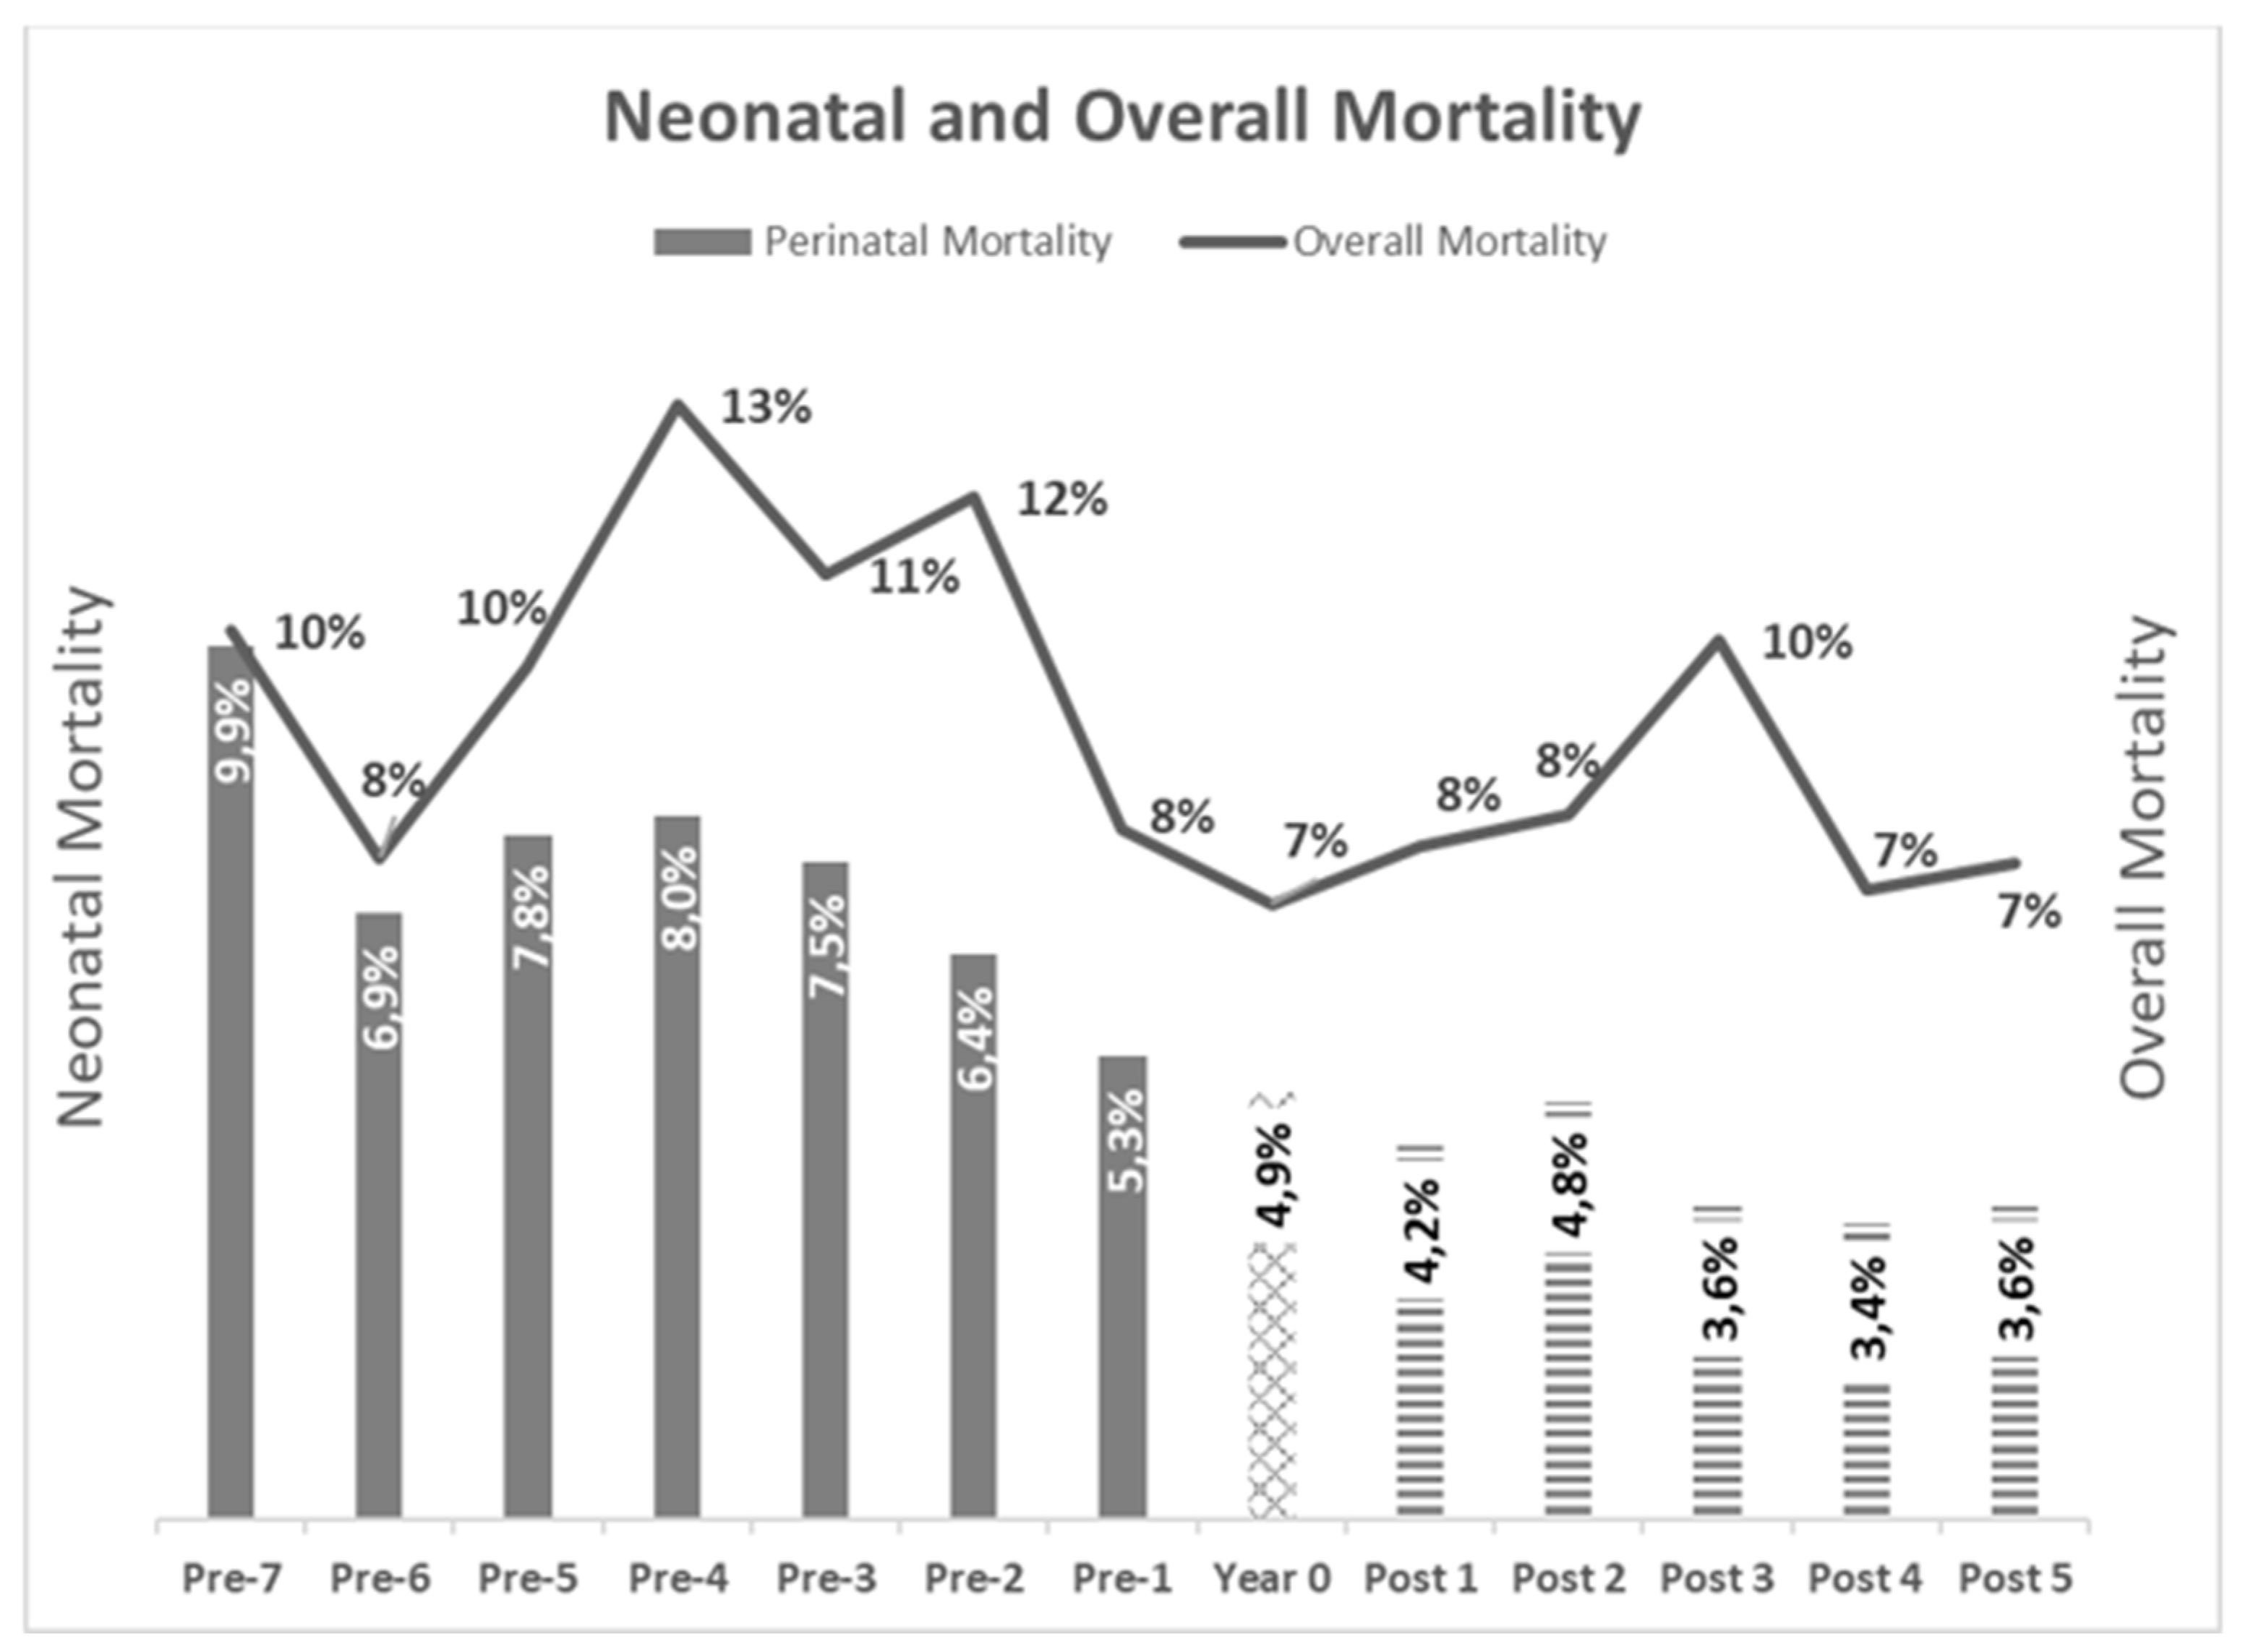
Figure 18.
Milk production average across the six dairy farms before and after the application of the BVD-TV. Each point represents the annual average of daily milk production per cow of the six farms with lines indicating the mean ± standard deviation. Statistically significant differences between groups are indicated.
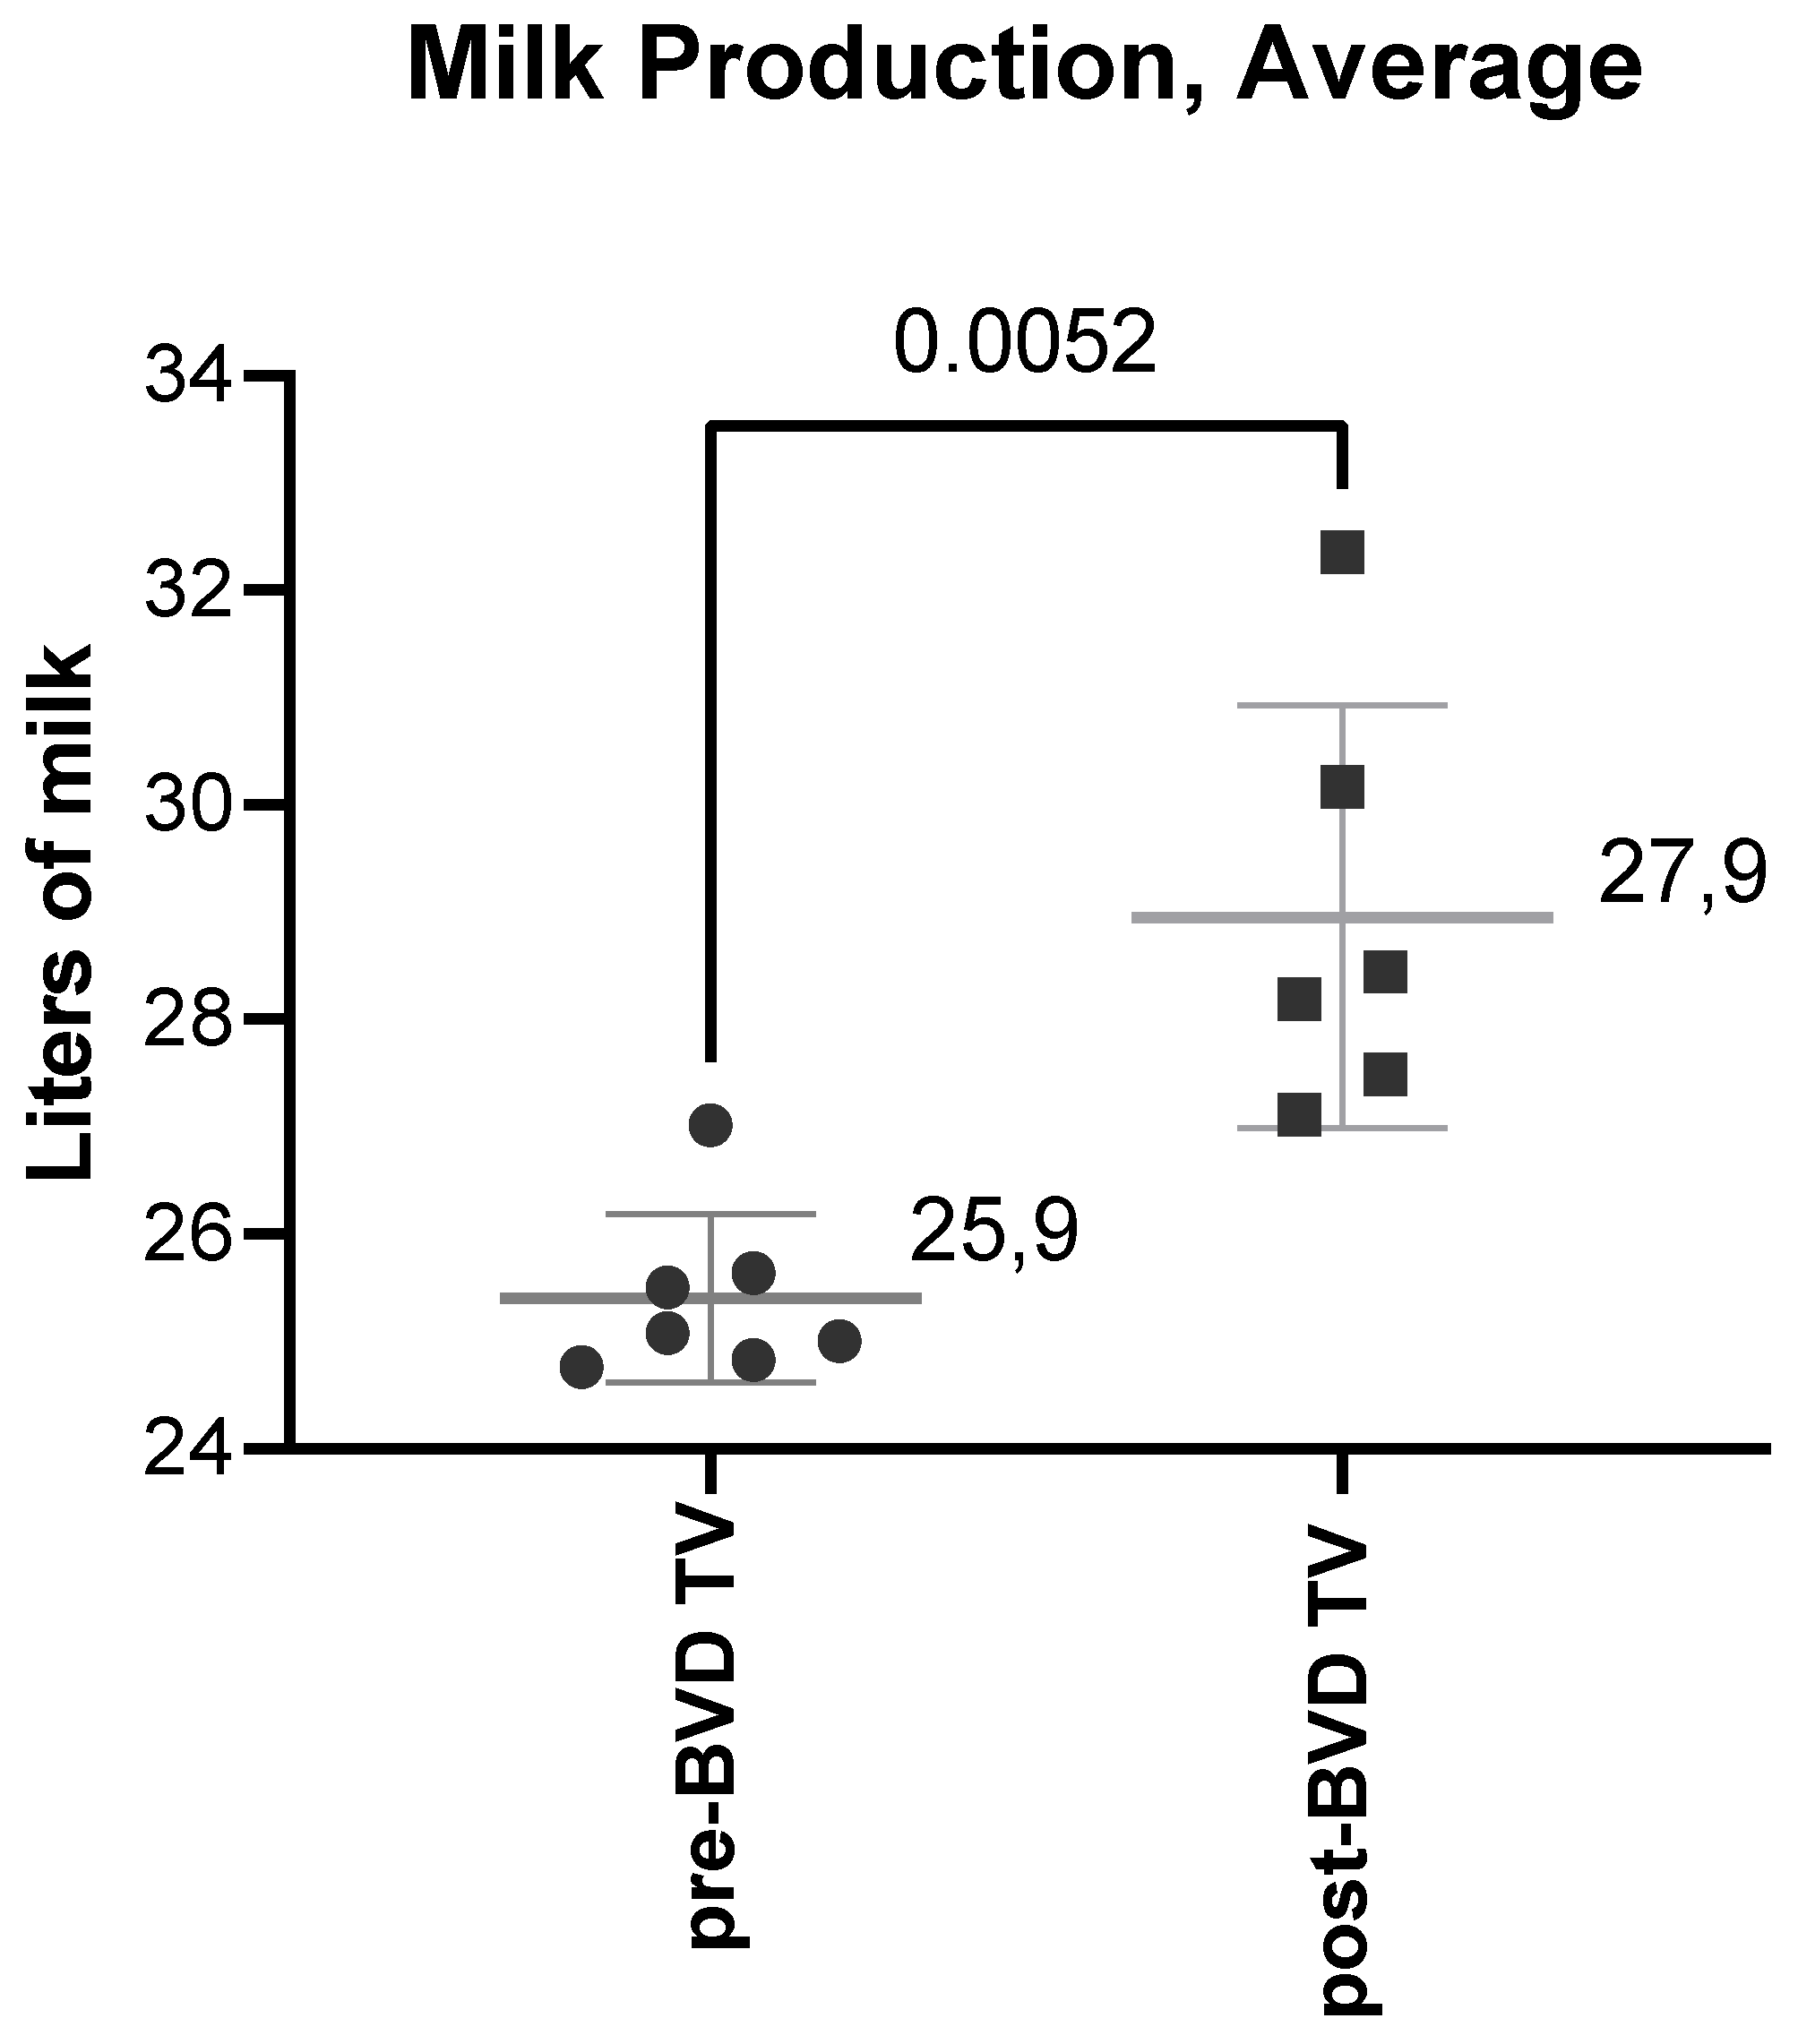
Figure 19.
Gray Bars: Years pre-BVD-TV. Square Bar: year 0. Stripped bars: years’ post-BVD-TV. 19A: Evolution of Perinatal (Bars) and Overall (Line) mortality. 19B Milk production. Results are presented as the average of all the dairy farms for each individual year.
Figure 19.
Gray Bars: Years pre-BVD-TV. Square Bar: year 0. Stripped bars: years’ post-BVD-TV. 19A: Evolution of Perinatal (Bars) and Overall (Line) mortality. 19B Milk production. Results are presented as the average of all the dairy farms for each individual year.
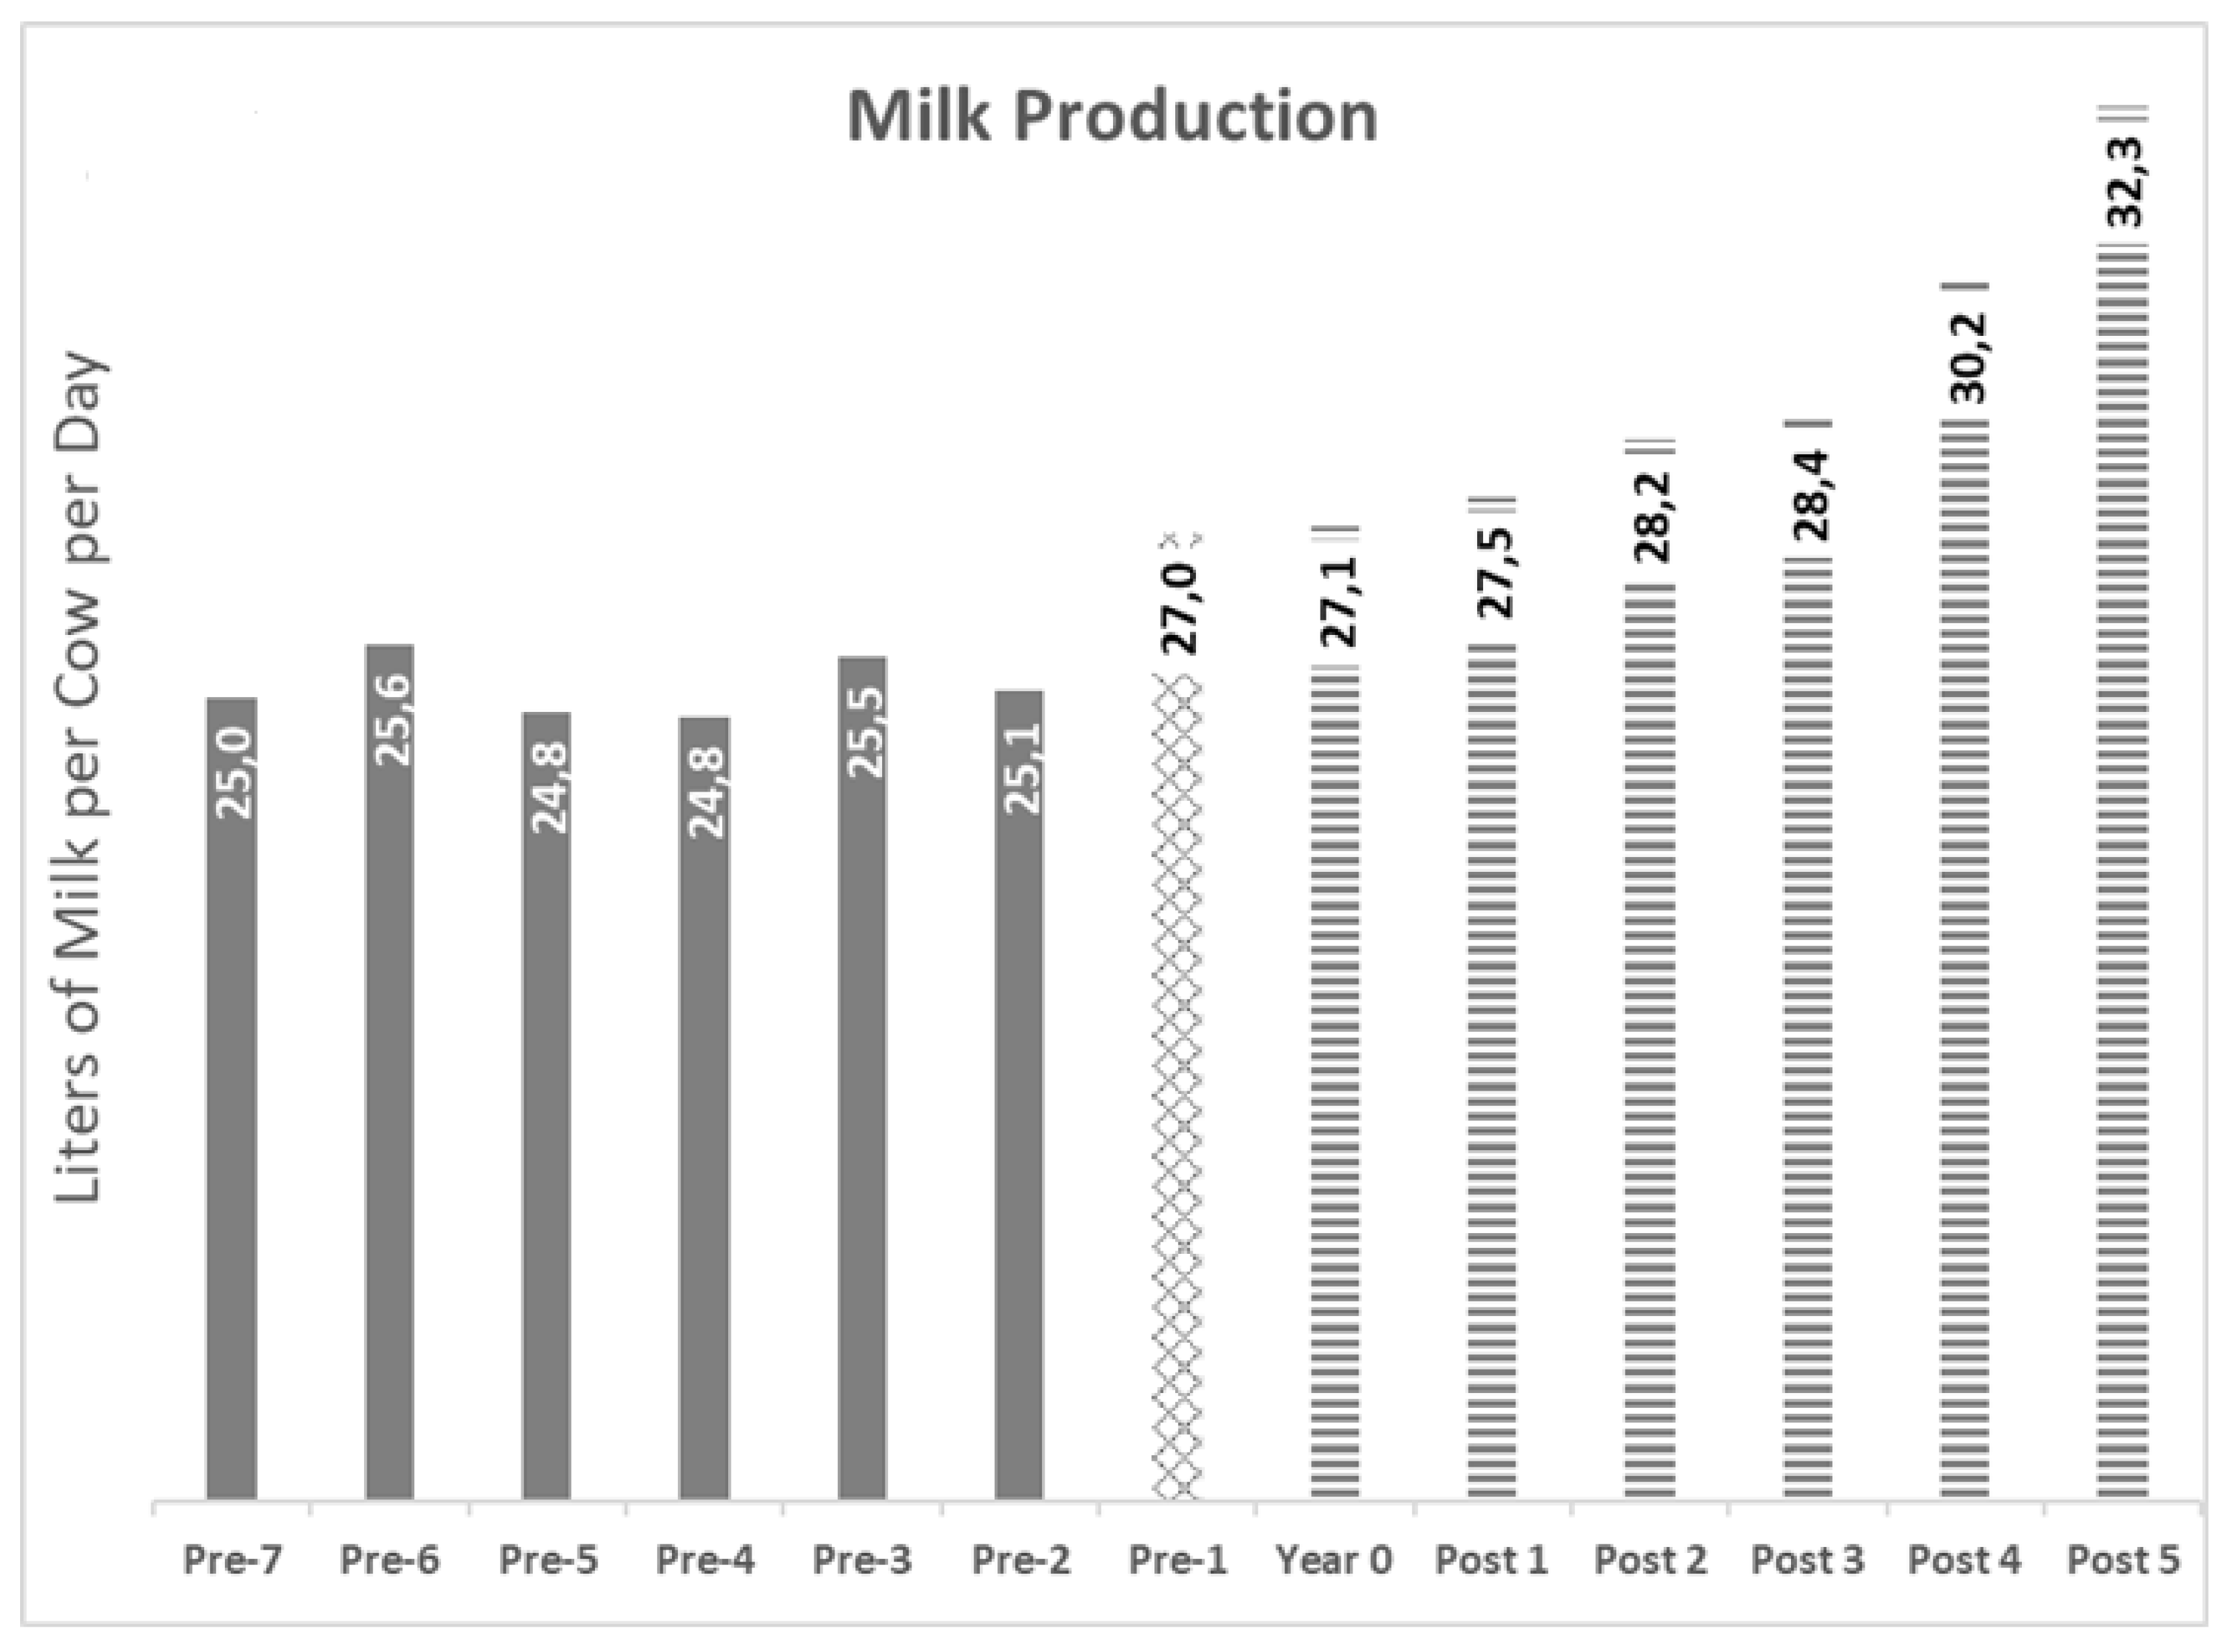

Table 1.
Information of the dairy farms.
| Dairy Farm | Location | Herd Size | Period of Study |
BVD-TV Starting Year |
| 1 | Santa Fe | 1879 | 2014-2023 | 2018 |
| 2 | Santa Fe | 3179 | 2014-2023 | 2018 |
| 3 | Santa Fe | 3831 | 2016-2023 | 2019 |
| 4 | Entre Ríos | 5220 | 2014-2023 | 2020 |
| 5 | Entre Ríos | 2423 | 2014-2023 | 2021 |
| 6 | Buenos Aires | 1410 | 2014-2023 | 2021 |
Table 2.
Parameters evaluated pre & post the introduction of the BVD-TV in 6 dairy farms.
| Conception Rate (N° of Animals) | Abortion Rate (N° of Animals) | Days Open |
Calf Insemination Rate (N° of Animals) |
Neonatal Mortality (N° of Animals) | Overall Mortality (N° of Animals) |
Milk Production (L/cow/day) |
|
| Pre-BVD TV | 39.11% (30612/78275) |
17.84% (5462/30612) | 131 | 29% (22543/78275) | 6% (1440/23983) | 8.98% | 25.85 |
| Post-BVD TV | 43.51%* (36597/84108) | 16.83%* (6161/36597) | 120* | 33%* (26971/82080) | 4%* (1161/28132) | 7.57%* (4866/64276) | 28.19* |
| Difference | +4.4% | -1% | -11 | +4% | -2% | -4% | +2,34 |
| P- Value | <0.0001 | 0.0006 | <0.0001 | <0.0001 | <0.0001 | <0.0001 | 0.0001 |
| OR | 1.20 | 0.93 protective (1.1) |
--- | 1.21 | 0.67 protective (1.6) | 0.89 protective (1.3) | --- |
| IC95 | (1.18;1.22) | (0.89;0.97) | (1.18:1.23) | (0.62;0.73) | (0.79;0.86) |
Table 3.
Milk production.
| Pre-BVD-TV | Post-BVD-TV | Diff | P Value | |
| Dairy Farm 1 | 24.8 | 27.2 | 2.4* | 0.0258 |
| Dairy Farm 2 | 24.9 | 26.2 | 1.3 | 0.2305 |
| Dairy Farm 3 | 25.2 | 26.3 | 1.1 | 0.3121 |
| Dairy Farm 4 | 33.4 | 35.1 | 1.6 | 0.1094 |
| Dairy Farm 5 | 20.3 | 23.9 | 3.6* | 0.0018 |
| Dairy Farm 6 | 26.8 | 28.8 | 2.0 | 0.0779 |
| Average | 25.9 | 27.9 | 2.0 |
Disclaimer/Publisher’s Note: The statements, opinions and data contained in all publications are solely those of the individual author(s) and contributor(s) and not of MDPI and/or the editor(s). MDPI and/or the editor(s) disclaim responsibility for any injury to people or property resulting from any ideas, methods, instructions or products referred to in the content. |
© 2024 by the authors. Licensee MDPI, Basel, Switzerland. This article is an open access article distributed under the terms and conditions of the Creative Commons Attribution (CC BY) license (http://creativecommons.org/licenses/by/4.0/).
Copyright: This open access article is published under a Creative Commons CC BY 4.0 license, which permit the free download, distribution, and reuse, provided that the author and preprint are cited in any reuse.


