
Submitted:
27 November 2024
Posted:
29 November 2024
You are already at the latest version
Abstract
Chemical weed control is a significant agricultural concern, and reliance on a limited range of herbicide action modes has increased resistant weed species, many of which use C4 metabolism. As a result, the identification of novel herbicidal agents with low toxicity targeting C4 plants becomes imperative. An assessment was conducted on the impact of 3-cyanobenzoic acid on the growth and photosynthetic processes of maize (Zea mays), a representative C4 plant, cultivated hydroponically over 14 days. The results showed a significant reduction in plant growth and notable disruptions in gas exchange and chlorophyll a fluorescence due to the application of 3-cyanobenzoic acid, indicating compromised photosynthetic activity. Parameters such as the chlorophyll index, net assimilation (A), stomatal conductance (gs), intercellular CO2 concentration (Ci), maximum effective photochemical efficiency (Fv'/Fm'), photochemical quenching coefficient (qP), quantum yield of photosystem II photochemistry (ϕPSII), and electron transport rate through PSII (ETR) all decreased. The A/PAR curve revealed reductions in the maximum net assimilation rate (Amax) and apparent quantum yield (ϕ), alongside an increased light-compensation point (LCP). Moreover, 3-cyanobenzoic acid significantly decreased the carboxylation rates of RuBisCo (Vcmax) and PEPCase (Vpmax), electron transport rate (J), and mesophilic conductance (gm). Overall, 3-cyanobenzoic acid induced substantial changes in plant growth, carboxylative processes and photochemical activities. The treated plants also exhibited heightened susceptibility to intense light conditions, indicating a significant and potentially adverse impact on their physiological functions. These findings suggest that 3-cyanobenzoic acid or its analogs could be promising for future research targeting photosynthesis.
Keywords:
chlorophyll a fluorescence
; enzyme inhibitor
; gas exchange
; phenolics
; pyruvate O-phosphate dikinase
; weeds
1. Introduction
Agroecosystems, much like any other ecosystem, are greatly influenced by their surrounding environment and climate, which in turn impacts the various living organisms within them. Since the primary goal of an agroecosystem is to meet specific human needs, not all organisms within it are desirable. For instance, pests, diseases, and weeds are typically unwelcome. Weeds present a significant challenge due to their rapid growth, the ability to absorb resources, and the interception of sunlight, all of which can disrupt the agroecosystem. Their resilience disrupts agroecosystems by depleting essential resources such as water and nutrients, ultimately reducing crop yields [1,2,3].
Herbicides are a primary tool for weed control, but their repeated use often leads to the emergence of resistant weed biotypes. These resilient weeds not only survive but thrive, dominating plant populations and creating new challenges [4,5]. Currently, there are 533 documented cases of herbicide-resistant weeds worldwide, involving 273 species (156 dicots and 117 monocots). These resistant weeds have evolved to survive against 21 out of 31 known herbicide sites of action and 168 different herbicides, impacting 101 crops in 72 countries. Some species have developed resistance to up to seven herbicide sites of action, highlighting the significant challenge posed by resistant weeds in the Poaceae family, which contains 92 resistant species — double that of the second most affected family, Asteraceae [6].
C4 plants, such as maize (Zea mays), sugarcane (Saccharum officinarum), millet (Pennisetum glaucum), and sorghum (Sorghum bicolor), efficiently absorb and use atmospheric CO2 through specialized photosynthetic pathways involving mesophyll and bundle sheath cells [7]. This process results in higher growth rates and greater biomass accumulation, particularly in high-temperature and high-light environments, giving C4 plants a competitive edge over crops [4]. The carbon fixation process in C4 plants is eased by the enzyme phosphoenolpyruvate carboxylase (PEPCase), which concentrates CO2, enhances the carboxylative activity of RuBisCo and minimizes photorespiration [8]. Apart from these agriculturally productive plant species, many of the most noxious weeds are C4 plants [9]. Notably, 14 of the 18 most noxious weed species are C4 plants [10]. Due to the inevitable emergence of resistant weeds and the competitive advantages of C4 plants, coupled with the lack of new herbicides with unique modes of action since 1980 [11,12], there is an urgent need to develop more effective, selective, and environmentally friendly herbicides.
Our research team is dedicated to identifying and evaluating novel herbicides with innovative modes of action. We utilize a combination of in silico, in vitro, and in vivo approaches to assess the effectiveness of enzyme inhibitors with potential herbicidal activity [13,14]. Targeting enzymes essential for the C4 photosynthesis, such as pyruvate O-phosphate dikinase (PPDK), could be one promising strategy to develop herbicide [15,16]. Inhibiting PPDK, a crucial enzyme in mesophyll cells, has been shown to reduce photosynthetic activity, potentially providing a method for controlling C4 weeds [17,18,19]. Enzymatic inhibitors, which downregulate target enzymes, play a critical role in controlling plant metabolism. Because PPDK is essential for C4 plants to assimilate CO2 through photosynthesis, we evaluate selective inhibitors of this enzyme as potential candidates for new herbicides. We have already tested a few compounds, selected from a virtual library and anchored to the PPDK active site of Digitaria sanguinalis, to develop specific PPDK inhibitors. Using virtual screening and drug repositioning approaches, we found eight promising chemicals (bromoacetic, bromopyruvic, 2-bromobutyric, 2-bromopropionic, and 3-cyanobenzoic acids) as potential PPDK inhibitors. Among these, bromoacetic acid showed a dose-dependent inhibition of PPDK activity in maize, significantly affecting gas exchange and reducing the photosynthetic rate [20]. These findings laid the groundwork for further exploration of PPDK inhibitors.
More recently, we found that 3-cyanobenzoic acid not only inhibited maize seedling growth but also triggered oxidative stress, increasing reactive oxygen species (ROS) production [21]. This compound is like certain O-group herbicides that mimic auxin and inhibit microtubule assembly [22,23]. Based on our earlier findings, we postulated that the adverse impacts of 3-cyanobenzoic acid extend beyond root damage and that this compound could potentially serve as a targeted herbicide for C4 plants. Thus, we assessed the impact of 3-cyanobenzoic acid on maize photosynthesis. Maize was selected as a model plant for its C4 metabolism and ease of cultivation. To evaluate enzyme activity and photochemical efficiency, we measured intercellular CO₂ concentration (Ci) and constructed irradiance light curves. Chlorophyll a fluorescence emission, a noninvasive and quantitative method, was used to monitor changes in photosynthetic processes. From the fluorescence data, we calculated key parameters such as photochemical yield, electron transport ability, and energy dissipation. Additionally, we generated OJIP curves and conducted the JIP fluorescence test, which provided insights into energy flow through reaction centers and photosystems, offering a comprehensive view of the compound’s impact on plant photosynthetic performance.
2. Materials and Methods
The maize (Zea mays L. cv. IPR-164) seeds were cleaned by soaking in a 2% sodium hypochlorite for three minutes, followed by thorough rinsing with deionized water to ensure cleanliness. The seeds were then evenly spread on pre-moistened germination paper (Germitest® CEL-060) and covered with another sheet, rolled up, and kept in the dark at 25 °C for three days to promote germination. Germinated seedlings with radicle lengths between 5 and 6 cm were randomly selected and grouped into sets of 12, then transferred to hydroponic systems. These seedlings were placed in Styrofoam trays and placed in glass containers filled with 200 mL of ¼ strength nutrient solution at pH 6.0 [24], which contained either 0 (control), 0.5 or 1.0 mM of 3-cyanobenzoic acid (Sigma–Aldrich, St. Louis, MO, USA). The seedlings were grown under controlled conditions with a 12-h light/12-h dark photoperiod at 25 °C and an irradiance of 300 μmol photons m−2 s−1. The nutrient solution was replaced every other day to maintain optimal growth conditions. On the 14th day (V2 stage) entire plants were carefully harvested for biometric measurements, while the second fully expanded leaf was sampled for further biochemical and physiological analyses.
2.1. Biometric Measurements
Plant height was determined by measuring the distance from the point of seed attachment to the culm up to the base of the last fully developed leaf and the main root. Stem diameter was precisely measured at the first internode using a digital caliper. Fresh biomass of shoots and roots was assessed through gravimetric analysis. Leaf area estimation was performed using the Easy Leaf Area Free 1.02 software for mobile devices [25]. These measurements ensured consistency and accuracy, with a total of 18 plants evaluated per treatment.
2.2. SPAD Index, Chlorophyll a Fluorescence, and Gas Exchange
Chlorophyll content was measured using a SPAD-502 meter (Konica Minolta®, Ramsey, NJ, USA). Chlorophyll a fluorescence parameters were assessed with a pulse-amplitude modulated fluorometer (PAM) integrated into the LI-6800 portable photosynthesis system (Li-Cor®, Lincoln, NE, USA). Measurements were conducted in the middle region of the last fully expanded leaf, previously dark-adapted for 10 h to fully oxidize photosystem II (PSII), ensuring optimal data accuracy [26]. Key fluorescence parameters were recorded, including minimal fluorescence intensity (F0), observed in the absence of light when PSII reaction centers were fully open, and maximal fluorescence intensity (Fm), elicited under a high-intensity multiphase flash of 8000 µmol m⁻² s⁻¹ when PSII centers were fully closed. After that, the maximum photochemical efficiency (Fm - F0/Fm) of the plants was calculated [27]. A total of eighteen plants were evaluated for each treatment.
Next measurements focused on light-adapted leaf regions under controlled conditions (irradiance of 1400 μmol m⁻² s⁻¹ and CO₂ concentration of 400 µmol mol⁻¹) to achieve complete photosynthetic induction. Using the PAM fluorometer and the LI-6800 infrared gas analyzer (IRGA, Li-Cor®), fluorescence and gas exchange parameters were recorded. Variables such as net assimilation (A), stomatal conductance (gs), maximum quantum yield of PSII photochemistry (Fv'/Fm'), effective quantum yield of PSII photochemistry (ϕPSII), electron transport rate (ETR), photochemical quenching coefficient (qP) and non-photochemical quenching (NPQ) were recorded. The measurements were performed at 27 °C, relative humidity of 60%; air flow of 700 µmol–1; CO2 concentration of 400 µmol-1; photosynthetically active radiation (PAR) of 1400 µmol m–2 s–1, and multiphase saturating light flash of 8000 µmol m–2 s–1. Values were recorded from duplicated points obtained when constructing light curves and A/Ci curves, which are explained in detail in the following sections. The values were recorded point by point with adaptation times ranging from 60 to 120 s after changing the parameters associated with the curve (light or CO2), indicating the steady state of the leaf area when the instantaneous rate of change of water, CO2 concentration, and chlorophyll a fluorescence was varied in the recorded less than one in the device sample chamber. A total of 22 plants were evaluated per treatment, ensuring high reproducibility and reliability of the results.
2.3. Net Assimilation Curves in Response to Changes in Photosynthetically Active Radiation (A/PAR)
Plants were light-adapted under controlled conditions (1400 μmol m⁻² s⁻¹ irradiance and a fixed CO₂ concentration of 400 µmol mol⁻¹ within the sample chamber) until full photosynthetic induction was achieved. Other environmental parameters were maintained as previously described to ensure consistency. The net assimilation rate (A) curve was generated by systematically recording photosynthetically active radiation (PAR) values at a series of pre-defined intervals using the LI-6800 IRGA. Measurements at each PAR level were taken over 60 to 120 s, allowing the plants to reach a stable photosynthetic state before data collection. PAR levels ranged from 2000 to 0 μmol photons m⁻² s⁻¹, following a descending sequence of 2000, 1800, 1600, 1400, 1200, 1000, 800, 600, 400, 200, 175, 150, 125, 100, 75, 50, 25, and 0 μmol photons m⁻² s⁻¹. This comprehensive range ensured an accurate representation of the light response curve. Measurements were taken from four plants per treatment.
The resulting A/PAR curve was well-suited to the light range of 0 to 2000 μmol m⁻² s⁻¹, with particular emphasis on the linear phase observed between 0 and 175 μmol m⁻² s⁻¹. Key parameters derived from the curve included the maximum net assimilation rate (Amax), apparent quantum yield (ϕ), light-compensation point (LCP), and dark respiration rate (RD). These parameters were calculated using a Microsoft® Excel-based tool developed by Lobo et al. [28], ensuring precision in data analysis and parameter estimation.
2.4. Net Assimilation Curves in Response to Changes in Intercellular CO2 Concentration (A/Ci)
Like the A/PAR curve measurements, acclimatization of the plants to light intensity at 1400 µmol m⁻² s⁻¹ was ensured prior to data collection. The recording time was standardized to capture the steady-state photosynthetic responses of the plants. During the experiment, the light intensity was maintained at a constant PAR of 1400 µmol m⁻² s⁻¹, while the concentration of available CO₂ was systematically varied. The measurements began at a CO₂ concentration of 400 µmol mol⁻¹, progressively decreasing in steps without reaching zero. Following this, CO₂ levels were increased in the sequence: 400, 200, 25, 50, 75, 100, 125, 150, 175, 200, 225, 250, 270, 300, 325, 350, 400, 400, 500, 600, 700, 800, 1000, 1200, 1400, 1600, 1800, and 2000 µmol mol⁻¹. This method ensured comprehensive profiling of photosynthetic responses at varying CO₂ concentrations. Measurements were performed on six plants per treatment, providing robust and replicable data [8,29]. To analyze the results, spreadsheets developed by Zhou et al. [8] were used to fit assimilation curves based on the concentration of intercellular CO₂, tailored specifically for C4 plants. From these fitted curves, key photosynthetic parameters were derived, including the maximum RuBisCo carboxylation rate (Vcmax), maximum PEPCase carboxylation rate (Vpmax), photosynthetic electron transport rate (J), and mesophilic conductance (gm).
2.5. Transient Responses of the Chlorophyll a Fluorescence (OJIP Curve) and Derived Parameters (JIP Test)
Fast fluorescence kinetics were measured using the inductive flash feature of the LI-6800 IRGA PAM fluorometer in plants that had been dark-adapted for 10 h to ensure fully open PSII reaction centers. Fluorescence emissions were recorded at millisecond intervals for one second, capturing the rapid changes associated with the OJIP transient. Data from 18 plants per treatment were collected to produce OJIP curves, with time converted to a logarithmic scale, showcasing different stages between O (F0) and P (FM) phases. The photochemical phase (O–J) reflects the reduction of the primary quinone acceptor (QA), while the thermal phase (J–I) corresponds to electron transfer between QA and the secondary quinone acceptor (QB). The I–P phase represents fluorescence emissions driven by the pool of oxidized plastoquinone molecules [30,31,32]. This detailed division of phases enables a comprehensive understanding of electron transport dynamics within the photosynthetic apparatus.
Fluorescence data were analyzed using the JIP test, which translates the OJIP curves into specific energy fluxes and parameters indicative of photosynthetic efficiency. Key energy fluxes included absorption per reaction center (ABS/RC), trapped energy per reaction center (TR0/RC), electron transport flux per reaction center (ET0/RC), dissipated energy per reaction center (DI0/RC), and the density of active PSII reaction centers per cross-section (RC/CS). These metrics provided insights into energy dynamics and the operational efficiency of PSII. The maximum quantum yield of primary photochemistry (TR0/ABS), quantum yield for electron transport from QA to QB (ET0/ABS), and the probability that a trapped exciton moves an electron into the electron transport chain beyond QA– (ET0/TR0) were also assessed. Two critical performance indices, PIABS and PITOTAL were derived. PIABS quantifies the conservation of absorbed energy from PSII up to QB reduction, while PITOTAL is an indicator of the conservation of energy absorbed by the PSII until the decline in the final PSI acceptors) [30,31,32]. Together, these indices provide an integrated evaluation of the energy conservation ability within the photosynthetic electron transport chain, offering a robust framework for assessing plant photosynthetic performance under varying treatments.
2.6. Statistical Analysis
The experimental design used was completely randomized, and the data were submitted to one-way analysis of variance (ANOVA). Significant differences were then compared using Dunnett's test at both 5% and 1% levels of significance. Data from the A/PAR and A/Ci curves were adjusted using Microsoft® Excel spreadsheet provided by Lobo et al. [28] and Zhou et al. [8]. Furthermore, parameters derived from the JIP test were calculated using data from chlorophyll a transient curve, normalized, and subjected to the same tests. All statistical analyses were performed using GraphPad Prism® program, version 8 (La Jolla, CA, USA).
3. Results
3.1. Effects on Biometric Measurements
Treatment with 3-cyanobenzoic acid significantly inhibited maize growth (Table 1). At 1.0 mM, plant height decreased by 20.3%. The leaf area was reduced by 21.4% at 0.5 mM and by 42% at 1.0 mM, while the culm diameter decreased by 26.5% at 0.5 mM and 34.9% at 1.0 mM. Shoot fresh biomass saw a 45.9% decrease at 1.0 mM compared to the control. Root length also showed significant reductions, with a 45.5% decrease at 0.5 mM and a striking 65.7% decrease at 1.0 mM. Moreover, fresh root biomass decreased by 62.9% at 1.0 mM. These decreases are illustrated in Figure 1. These substantial decreases underscore the significant impact of 3-cyanobenzoic acid on various growth parameters of maize.
3.2. Effects on SPAD Index, Chlorophyll a Fluorescence and Gas Exchange
Maize plants grown with 3-cyanobenzoic acid for 14 d exhibited mild chlorosis. The total chlorophyll content, as indicated by the SPAD index in the second fully expanded leaf, decreased by 19.3% at 1.0 mM (Figure 2A). Fv/Fm values remained unchanged (Figure 2B).
Under full photosynthetic conditions (1400 μmol m–2 s–1 irradiance and 400 µmol mol–1 CO2), several key parameters were significantly reduced compared to the controls. The A (Figure 2C) decreased by 23% to 0.5 mM and 56.7% to 1.0 mM. Similarly, gs showed a marked reduction, decreasing by 32.8% at 0.5 mM and 68.2% at 1.0 mM (Figure 2D). The Ci also decreased by 21.4% at 0.5 mM and 44% at 1.0 mM (Figure 2E). In addition, the Fv'/Fm' decreased by 24.8% at 1.0 mM (Figure 2F). While NPQ (Figure 2G) remained stable, qP (Figure 2H) decreased by 10.9% at 0.5 mM and 39.3% at 1.0 mM.
3.3. Effects on A/PAR Curve and Derived Parameters
Significant changes were seen in the A versus PAR (Figure 4). At 0.5 mM, A levels were already lower than those of the control. At 1.0 mM, the decline in A was more pronounced at higher PAR levels and in the slope of the first linear phase.
3.4. Effects on A/Ci Curve and Derived Parameters
To differentiate the effects of CO2 diffusion through the stomata, the A versus Ci curve was analyzed to derive key parameters, including Vcmax, Vpmax, J, and gm. The impact of 3-cyanobenzoic acid was clear at even low CO2 concentrations and became more pronounced at higher concentrations (Figure 6).
3.5. Effects on Chlorophyll a Transient Curve and Derived Parameters
No significant changes were seen in the OJIP curve (Figure 8).
Finally, a noteworthy reduction was seen in RC/CS, which decreased by 25.8% at 0.5 mM (Figure 9).
4. Discussion
Treatment with 3-cyanobenzoic acid resulted in a significant reduction in both foliar and root growth, as well as in key photosynthetic, photochemical, and carboxylative parameters in maize plants grown hydroponically for 14 days. These findings suggest that the compound impairs multiple aspects of plant development and function. Further steps aim to understand the reasons behind these declines and identify primary targets.
Our earlier study demonstrated significant damage to root growth and development in maize seedlings exposed to 3-cyanobenzoic acid for four days. This included reduced root length and biomass, a decrease in secondary roots, increased root respiration, heightened antioxidant activity, and elevated ROS production. While the mitochondrial respiratory chain was not directly affected, the observed damage was linked to membrane destabilization, deficiencies in nutrient and water absorption, and hormonal imbalances [21]. These effects are consistent with those observed in other plants exposed to monophenols, such as cinnamic and benzoic acids. Upon absorption, these acids undergo deprotonation, leading to the dissipation of the proton gradient and membrane depolarization. This cascade of events triggers an increase in ROS production and antioxidant activity, disrupting ion transport, nutrient absorption, and water balance [33,34,35,36]. Additionally, these disturbances extend to hormonal imbalances, stomatal closure, reduced chlorophyll content, diminished RuBisCo activity, and damage to photosynthetic reaction centers and electron transport chains [36].
Maize plants grown for 14 days exhibited damage like that observed in seedlings [21], suggesting an acclimatization response to unfavorable conditions. However, it is essential to determine whether the observed effects are solely due to continuous root damage or if there are also direct impacts on the aerial parts of the plant, including photosynthesis. Regardless of light intensity or CO2 supply, a clear reduction in net photosynthesis was observed. The negative correlation between compound concentration and photosynthetic performance – reflecting a trade-off between defense mechanisms and growth – is expected [37,38]. Consequently, the decrease in photosynthesis cannot be attributed solely to energy partitioning. A more comprehensive understanding of the underlying mechanisms requires the identification and integration of additional relevant parameters.
Various simple phenolics have been shown to impact photosynthetic parameters, with stomatal closure being one of the most common effects [34,39,40,41]. Typically, an increase in Ci is accompanied by a reduction in gs, signaling a decrease in the efficiency of carboxylation cycles. This has been demonstrated in soybean plants exposed to L-DOPA [42] and in poplar seedlings exposed to a phenolic mixture [41]. However, alternative patterns can also emerge. In cases of photosynthesis limitation due to stomatal closure, a decrease in gs is often paired with a reduction in Ci [36]. Similar findings were observed in cucumber treated with cinnamic and benzoic acid derivatives [39]. As evidenced in the present study, this pattern suggests that the damage to diffusion processes is more severe than the impairment of the carboxylative systems (such as the C4 cycle, Hatch-Slack pathway, and C3 Calvin-Benson cycle). This observation, per se, provides a strong rationale for the noted decrease in Ci, emphasizing the greater impact on stomatal function and CO2 diffusion.
Stomatal closure likely explains much of the observed reductions in photosynthetic parameters. By limiting CO2 availability within the leaf, this closure, combined with a decrease in gm, results in a substrate shortage for key enzymes such as PEPCase (Vpmax) and RuBisCo (Vcmax). This shortage compromises their carboxylative activities, which accounts for the observed declines in photosynthetic efficiency. Alternatively, 3-cyanobenzoic acid may have exerted a direct inhibitory effect on these enzymes. For instance, Gao et al. [35] showed that salicylic acid reduced RuBisCo activity and disrupted photochemical structures in Chlamydomonas reinhardtii. Similarly, Huang and Bie [43] reported that cinnamic acid decreased RuBisCo activity in Vigna unguiculata without affecting Ci or ϕPSII, suggesting that direct enzyme inhibition could be a contributing factor in the present study.
Maize, a C4 plant, benefits from an efficient CO2 concentration mechanism that provides a distinct advantage over C3 plants. This mechanism is driven by PEPCase, which has a higher carboxylation rate than RuBisCO, enabling more effective CO2 fixation [8]. However, the observed decline in Vpmax was more pronounced than the reduction in Vcmax, suggesting a compromised CO2 concentration mechanism. This impairment is further worsened by the lack of ribulose-1,5-bisphosphate (RuBP), the substrate for RuBisCO, which weakens the carboxylation process. The decreased plateau in the A/Ci curve shows a limitation in RuBP regeneration, a critical process for maintaining efficient photosynthesis [44,45]. RuBP regeneration relies heavily on ATP and NADPH, which are generated through the electron transport chain, as evidenced by the reduced ETR and the decrease in J. These findings underscore the impact of 3-cyanobenzoic acid on maize's photosynthetic machinery, particularly on its ability to regenerate RuBP and sustain efficient carbon fixation.
Photosynthesis involves the capture of light energy and its conversion into chemical energy, processes that are reflected in key parameters such as qP, Fv'/Fm', ϕPSII, and ETR. The observed changes in these parameters show a significant reduction in ATP and NADPH production, suggesting an energy deficit that hampers the plant’s ability to conduct essential metabolic functions. Additionally, the insufficient dissipation of energy impacts the NPQ mechanism, leading to lower ROS production in leaves compared to roots [21]. Several phenolic compounds, including O-methoxybenzoic, benzoic, usnic, salicylic, cinnamic, syringic, and phthalic acids, are known to interfere with antenna complexes, disrupting the function of reaction centers and blocking electron transport between QA and QB. These disruptions reduce photochemical efficiency and increase heat dissipation, as shown in earlier studies [35,36,40,41]. Similarly, photochemical quenching parameters change similarly to A in plants under growth stress, where ATP and NADPH consumption are critical. Variations in carboxylation efficiency, CO2 availability, or carbohydrate export from cells can further influence this consumption, highlighting the complex interdependencies within the photosynthetic process [46].
To evaluate potential structural damage to the photochemical process, chlorophyll a fluorescence is measured in the dark, when the carboxylation cycle is inactive. Key parameters such as Fv/Fm, SPAD index, OJIP curve, and JIP test are critical for this assessment. Fv/Fm reflects the maximum efficiency of photosystem II, indicating the proportion of open reaction centers. The lack of change in Fv/Fm suggests that there was no severe damage to photochemical structures, as the parameter remains stable even with reduced chlorophyll content [26,35]. However, while the unaltered Fv/Fm indicates that 3-cyanobenzoic acid did not severely damage the photochemical machinery, the observed decrease in reaction centers per cross-section (RC/CS) and total chlorophyll levels suggests that some degree of damage may have occurred, potentially affecting overall photosynthetic efficiency.
In their study on the effects of various phenolic compounds on the photosynthesis of C. reinhardtii, Gao et al. [35] found that while benzoic acid did not affect Fv/Fm, it significantly altered chlorophyll and carotenoid levels, as well as the OJIP curve and JIP-test parameters. Specifically, benzoic acid reduced the RC/CS ratio, like 3-cyanobenzoic acid, and affected PIABS, an important indicator of PSII photoinhibition under abiotic stress, while also enhancing the J phase in the OJIP curve. These changes closely resemble those caused by DCMU, a PSII inhibitor that disrupts electron transport between plastoquinones, thereby reducing PSII quantum efficiency by disconnecting smaller antenna molecules and blocking electron flow beyond QA. Based on these observations, it is likely that 3-cyanobenzoic acid induces photochemical damage to PSII reaction centers by interfering with antenna molecules, leading to a reduction in chlorophyll content. This decrease in chlorophyll is a primary effect of phenolic compounds on photosynthesis, likely due to either decreased biosynthesis or increased degradation of chlorophyll [36]. Additionally, carotenoids, which function as accessory pigments in antenna complexes, may also be reduced because of hormonal imbalances, potentially linked to an increase in abscisic acid, a carotenoid-derived hormone [47].
The effects of 3-cyanobenzoic acid on maize seedling roots suggest a disruption in hormonal balance [21]. Abscisic acid (ABA) is known to induce stomatal closure [38,48], but certain phenolic compounds, such as hydroxybenzoic and hydroxycinnamic acids, can counteract this effect. Similarly, 3-cyanobenzoic acid, like 3-hydroxybenzoic acid, exhibits diverse and complex impacts on plant physiology [36,49]. Monosubstituted benzoic acids, like 3-cyanobenzoic acid, can inhibit ethylene synthesis at high concentrations, while some monophenols stimulate auxin degradation [36]. Given these effects, it is plausible to hypothesize that 3-cyanobenzoic acid may contribute to root damage and hinder maize growth and photosynthesis. This could be linked to elevated ABA levels relative to other hormones, which may lead to reduced stomatal conductance and altered carotenoid synthesis. Such changes in hormonal regulation could help explain the observed damage to reaction centers, further impairing the plant’s ability to efficiently capture light and perform photosynthesis.
Lastly, the LCP, which is the minimum irradiance needed to sustain basal metabolism, showed the most significant change [28]. The increase in LCP can be attributed to a combination of reduced carbon assimilation, impaired quantum efficiency, and elevated root respiration [21]. Despite the challenges imposed by 3-cyanobenzoic acid, maize plants exhibited a degree of adaptability, adjusting their metabolic processes to cope with the altered growth conditions. However, in environments with insufficient light, maize plants remain vulnerable, as they are unable to meet the high demands of basal metabolism. At high irradiance, NPQ would likely be inadequate to prevent the formation of ROS in the aerial parts of the maize plants, further exacerbating the stress.
5. Conclusions
The presence of 3-cyanobenzoic acid significantly hampers maize growth by disrupting photosynthetic, photochemical, and carboxylative processes. The primary driver of reduced photosynthesis is root damage, which diminishes both stomatal and mesophyll conductance, thereby limiting CO2 availability for RuBisCO and PEPCase activity. This disruption in CO2 assimilation is compounded by damage to the antenna complexes and reaction centers of photosystem II, likely caused by reduced chlorophyll content and a possible diversion of carotenoids for ABA synthesis, which triggers stomatal closure. While maize plants exhibit some resilience to 3-cyanobenzoic acid, their vulnerability becomes evident under low-light conditions due to the high metabolic costs associated with maintaining basic physiological functions. Under high light conditions, the inadequacy of the photosynthetic machinery leads to increased oxidative stress, further exacerbating growth limitations. These findings highlight the potential of 3-cyanobenzoic acid and its derivatives as herbicide candidates, targeting key photosynthetic pathways. By using advanced screening technologies and studying plant-specific responses, such as those observed in maize, we can develop selective, environmentally sustainable herbicides. Such approaches offer hope for tackling weed resistance and improving agroecosystem productivity.
Author Contributions
Conceptualization, funding acquisition, writing—review and editing, O.F.-F.; conceptualization, funding acquisition, supervision, writing—review and editing, R.M.; investigation, methodology, validation, visualization, writing—draft original, L.H.E.G.; investigation, validation, I.C.C., A.P.S.M., A.C.C., A.P.B. and A.P.F.; data curation, R.P.C. and W.D.d.S. All authors have read and agreed to the published version of the manuscript.
Funding
This research was funded by the Coordination of Higher Education Personnel Improvement – Brazil (CAPES, Finance Code 001), and Araucaria Foundation [grant numbers 013/2017 (PRONEX) and 002/2016].
Data Availability Statement
Data are contained within the article.
Acknowledgments
L.H.E.G., I.C.C., A.P.S.M., A.C.C., and A.P.B. are receiving a scholarship from the CAPES (Finance Code 001). W.D.d.S., R.M. and O.F.-F. are research fellows of the National Council for Scientific and Technological Development (CNPq).
Conflicts of Interest
The authors declare no conflicts of interest.
Abbreviations
The following abbreviations are used in this manuscript:
| A | net assimilation |
| ABS/RC | absorption flux per reaction center at t = 0 or a measure for an average antenna size |
| Amax | net assimilation rate |
| Ci | intercellular CO2 concentration |
| DI0/RC | energy dissipation per reaction center |
| E | transpiration rate |
| ETR | electron transport rate through PSII |
| ET0/ABS | quantum yield for electron transport (at t = 0) from QA to QB |
| ET0/RC | electron transport flux per reaction center at t = 0 |
| ET0/TR0 | probality (at t = 0) of a trapped exciton transfer an electron beyond QA– into the ETR |
| F0 | minimal fluorescence intensity when all the reaction centers of PSII are open |
| Fm | maximum fluorescence intensity when all reaction centers of PSII are closed |
| Fv | variable fluorescence |
| Fv/Fm | maximum quantum yield of PSII photochemistry |
| Fv’/Fm’ | maximum quantum yield of PSII photochemistry in light |
| gm | mesophilic conductance |
| gs | stomatal conductance |
| J | photosynthetic electron transport rate |
| LCP | light-compensation point |
| NPQ | non-photochemical quenching |
| OJIP | chlorophyll a fluorescence transient with O-J-I-P phases |
| PAR | photosynthetically active radiation |
| PEPCase | phosphoenolpyruvate carboxylase |
| PIABS | indicator of the conservation of energy absorbed by PSII until the decrease of the QB |
| PITOTAL | indicator of energy conservation in PSII up to the reduction of final PSI acceptors. |
| PPDK | pyruvate O-phosphate dikinase |
| QA | primary quinone acceptor of PSII |
| QB | secondary quinone acceptor of PSII |
| qP | photochemical quenching coefficient |
| RC/CS | amount of active PSII reaction centers per cross-section |
| RD | dark respiration rate |
| RuBisCo | ribulose-1,5-bisphosphate carboxylase/oxygenase |
| TR0/ABS | maximum quantum yield of primary photochemistry at t = 0 |
| TR0/ABS | quantum efficiency of primary PSII photochemistry |
| TR0/RC | trapped energy flux per reaction center at t = 0 |
| Vcmax | maximum RuBisCo carboxylation rate |
| Vpmax | maximum PEPCase carboxylation rate |
| ϕ | apparent quantum yield |
| ϕPSII | effective quantum yield of PSII photochemistry |
References
- Pitelli, R.A. Competição e controle das plantas daninhas em áreas agrícolas. Piracicaba: IPEF. Série Técnica, 1987. 4, 15 p. http://www.bibliotecaflorestal.ufv.br/handle/123456789/6867.
- Lamego, F.P.; Fleck, N.G.; Bianchi, M.A.; Vidal, R.A. Tolerância à interferência de plantas competidoras e habilidade de supressão por cultivares de soja: I. Resposta de variáveis de crescimento. Planta Daninha 2005, 23, 405–414. [Google Scholar] [CrossRef]
- Kaur, S.; Kaur, R.; Chauhan, B.S. Understanding crop-weed-fertilizer-water interactions and their implications for weed management in agricultural systems. Crop Prot. 2018, 103, 65–72. [Google Scholar] [CrossRef]
- Brighenti, A.M.; Oliveira, M.F. Biologia de Plantas Daninhas. In Biologia e Manejo de Plantas Daninhas; Oliveira Júnior, R., Constantin, J., Inoue, M.H., Eds.; Omnipax: Curitiba, BR, 2011; pp. 1–36. [Google Scholar]
- Perotti, V.E.; Larran, A.S.; Palmieri, V.E.; Martinatto, A.K.; Permingeat, H.R. Herbicide resistant weeds: A call to integrate conventional agricultural practices, molecular biology knowledge and new technologies. Plant Sci. 2020, 290, 10255. [Google Scholar] [CrossRef] [PubMed]
- Heap, I. International Herbicide-Resistant Weed Database. Available online: https://www.weedscience.org/Home.aspx (accessed on 10 November 2024).
- Fan, Y.; Asao, S.; Furbank, R.T.; von Caemmerer, S.; Day, D.A.; Tcherkez, G.; Sage, T.L.; Sage, R.F.; Atkin, O.K. The crucial roles of mitochondria in supporting C4 photosynthesis. New Phytol. 2022, 233, 1083–1096. [Google Scholar] [CrossRef]
- Zhou, H.; Akçay, E.; Helliker, B.R. Estimating C4 photosynthesis parameters by fitting intensive A/Ci curves. Photosynth. Res. 2019, 141, 181–194. [Google Scholar] [CrossRef]
- Elmore, C.; Paul, R. Composite List of C4 Weeds. Weed Sci. 1983, 31, 686–692. [Google Scholar] [CrossRef]
- Rao, V.S. Principles of Weed Science, 2nd ed.; CRC Press: Boca Raton, FL, USA, 2000. [Google Scholar] [CrossRef]
- Jablonkai, I. Molecular Mechanism of Action of Herbicides. In Herbicides—Mechanisms and Mode of Action; Hasaneen, M.N., Ed.; IntechOpen: Rijeka, Croatia, 2011; pp. 1–24. [Google Scholar] [CrossRef]
- Dayan, F.E.; Duke, S.O. Discovery for New Herbicide Sites of Action by Quantification of Plant Primary Metabolite and Enzyme Pools. Engineering, 2020, 6, 509–514. [Google Scholar] [CrossRef]
- Almeida, A.M.; Abrahão, J.; Seixas, F.A.V.; Bueno, P.S.A.; Oliveira, M.A.S.d.; Tomazini, L.F.; Constantin, R.P.; dos Santos, W.D.; Marchiosi, R.; Ferrarese-Filho, O. Unraveling Shikimate Dehydrogenase Inhibition by 6-Nitroquinazoline-2,4-diol and Its Impact on Soybean and Maize Growth. Agronomy 2024, 14, 930. [Google Scholar] [CrossRef]
- Martarello, D.C.I.; Grizza, L.H.E.; Foletto-Felipe, M.d.P.; Mendonça, A.P.d.S.; Constantin, R.P.; Ferro, A.P.; dos Santos, W.D.; Constantin, R.P.; Marchiosi, R.; Ferrarese-Filho, O. S-Benzyl-L cysteine Inhibits Growth and Photosynthesis, and Triggers Oxidative Stress in Ipomoea grandifolia. Agronomy 2024, 14, 1633. [Google Scholar] [CrossRef]
- Doyle, J.; Burnell, J.N.; Haines, D.S.; Llewellyn, L.E.; Motti, C.A.; Tapiolas, D.M. A Rapid Screening Method to Detect Specific Inhibitors of Pyruvate Orthophosphate Dikinase as Leads for C₄ Plant-Selective Herbicides. J. Biomol. Screen. 2005, 10, 10–67. [Google Scholar] [CrossRef]
- Nguyen, G.T.T.; Erlenkamp, G.; Jäck, O.; Küberl, A.; Bott, M.; Fiorani, F.; Gohlke, H.; Groth, G. Chalcone-based selective inhibitors of a C4 plant key enzyme as novel potential herbicides. Sci. Rep. 2016, 6, 27333. [Google Scholar] [CrossRef] [PubMed]
- Haines, D.S.; Burnell, J.N.; Doyle, J.; Llewellyn, L.E.; Motti, C.A.; Tapiolas, D.M. Translation of in vitro inhibition by marine natural products of the C4 acid cycle enzyme pyruvate P(i) dikinase to in vivo C4 plant tissue death. J. Agric. Food Chem. 2005, 53, 53–3856. [Google Scholar] [CrossRef] [PubMed]
- Motti, C.A.; Bourne, D.G.; Burnell, J.N.; Doyle, J.R.; Haines, D.S.; Liptrot, C.H.; Llewellyn. L.E.; Ludke, S.; Muirhead, A.; Tapiolas, D.M. Screening marine fungi for inhibitors of the C4 plant enzyme pyruvate phosphate dikinase: Unguinol as a potential novel herbicide candidate. Appl. Environ. Microbiol. 2007, 73, 1921–1927. [Google Scholar] [CrossRef] [PubMed]
- Minges, A.; Groth, G. Small-molecule inhibition of pyruvate phosphate dikinase targeting the nucleotide binding site. PLoS ONE 2017, 12, e181139. [Google Scholar] [CrossRef]
- Constantin, R.P.; Melo, G.S.R.; Martarello, D.C.I.; Abrahão, J.; dos Santos, W.D.; Ferrarese-Filho, O.; Marchiosi, R. Bromoacetic acid inhibits pyruvate orthophosphate dikinase and reduces photosynthetic activity in maize. Acta Physiol. Plant. 2021, 43, 54. [Google Scholar] [CrossRef]
- Souza, M.C.; Constantin, R.P.; Abrahão, J.; Foletto-Felipe, M.P.; Grizza, L.H.E.; Constantin, R.P.; dos Santos, W.D.; Ferrarese-Filho, O.; Marchiosi, R. Inhibitory Effect of 3-Cyanobenzoic Acid on Initial Growth of Maize Seedlings and Its Biochemical Impacts on Antioxidant and Energy Metabolisms. J. Plant Growth Reg. 2024, 43, 458–472. [Google Scholar] [CrossRef]
- Délye, C.; Jasieniuk, M.; Le Corre, V. Deciphering the evolution of herbicide resistance in weeds. Trends Genet. 2013, 29, 649–658. [Google Scholar] [CrossRef]
- Gupta, P.K. Toxicity of Herbicides. In Veterinary Toxicology - Basic and Clinical Principles, 3rd ed.; Gupta, R.C., Ed.; Academic Press: Cambridge, MA, USA, 2018; pp. 553–567. [Google Scholar] [CrossRef]
- Dong, J.; Wu, F.; Zhang, G. Influence of cadmium on antioxidant capacity and four microelement concentrations in tomato seedlings (Lycopersicon esculentum). Chemosphere 2006, 64, 1659–1666. [Google Scholar] [CrossRef]
- Easlon, H.M.; Bloom, A.J. Easy Leaf Area: Automated Digital Image Analysis for Rapid and Accurate Measurement of Leaf Area. Appl. Plant Sci. 2014, 2, 1400033. [Google Scholar] [CrossRef]
- Murchie, E.H.; Lawson, T. Chlorophyll fluorescence analysis: A guide to good practice and understanding some new applications. J. Exp. Bot. 2013, 64, 3983–3998. [Google Scholar] [CrossRef]
- Loriaux, S.D.; Avenson, T.J.; Welles, J.M.; Mcdermitt, D.K.; Eckles, R.D.; Riensche, B.; Genty, B. Closing in on maximum yield of chlorophyll fluorescence using a single multiphase flash of sub-saturating intensity. Plant Cell Environ. 2013, 36, 1755–1770. [Google Scholar] [CrossRef] [PubMed]
- Lobo, F.A.; De Barros, M.P.; Dalmagro, H.J.; Dalmolin, A.C.; Pereira, W.E.; De Souza, E.C.; Vourlitis, G.L.; Rodríguez Ortíz, C.E. Fitting net photosynthetic light-response curves with Microsoft Excel—A critical look at the models. Photosynthetica 2013, 51, 445–456. [Google Scholar] [CrossRef]
- Bellasio, C.; Beerling, D.J.; Griffiths, H. An Excel tool for deriving key photosynthetic parameters from combined gas exchange and chlorophyll fluorescence: Theory and practice: Descriptive modelling of gas exchange data. Plant Cell Environ. 2016, 39, 1180–1197. [Google Scholar] [CrossRef] [PubMed]
- Strasser, R.J.; Srivastava, A.; Tsimilli-Michael, M. The fluorescence transient as a tool to characterize and screen photosynthetic samples. In Probing Photosynthesis Mechanisms, Regulation and Adaptation; Yunus, M., Pathre, U., Mohanty, P., Eds.; CRC Press: Boca Raton, FL, USA, 2000; pp. 445–483. [Google Scholar]
- Avarseji, Z.; Mohassel, M.H.R.; Nezami, A.; Abbaspoor, M.; Mahallati, N. Dicamba+2, 4-D affects the shape of the Kautsky curves in wild mustard (Sinapis arvensis). Plant Knowledge J. 2012, 1, 41–45. [Google Scholar]
- Banks, J.M. Continuous excitation chlorophyll fluorescence parameters: A review for practitioners. Tree Physiol. 2017, 37, 1128–1136. [Google Scholar] [CrossRef]
- Chipley, J.R. Sodium Benzoate and Benzoic Acid. In Antimicrobials in Food; Davidson, P.M., Taylor, T.M., David, J.R.D., Eds.; CRC Press: Boca Raton, FL, USA, 2020. [Google Scholar] [CrossRef]
- Zhou, Y.; Yu, J. Allelochemicals and photosynthesis. In Allelopathy; Reigosa, M., Pedrol, N., González, L. Eds.; Springer, Dordrecht, The Netherlands, 2006; pp. 127–139. [CrossRef]
- Gao, Y.; Liu, W.; Wang, X.; Yang, L.; Han, S.; Chen, S.; Strasser, R.J.; Valverde, B.E.; Qiang, S. Comparative phytotoxicity of usnic acid, salicylic acid, cinnamic acid and benzoic acid on photosynthetic apparatus of Chlamydomonas reinhardtii. Plant Physiol. Biochem. 2018, 128, 1–12. [Google Scholar] [CrossRef]
- Marchiosi, R.; dos Santos, W.D.; Constantin, R.P.; Lima, R.B.; Soares, A.R.; Finger-Teixeira, A.; Mota, T.R.; Oliveira, D.M.; Foletto-Felipe, M.P.; Abrahão, J.; Ferrarese-Filho, O. Biosynthesis and Metabolic Actions of Simple Phenolic Acids in Plants. Phytochem Rev. 2020. [Google Scholar] [CrossRef]
- Sumbele, S.; Fotelli, M.N.; Nikolopoulos, D.; Tooulakou, G.; Liakoura, V.; Liakopoulos, G.; Bresta, P.; Dotsika, E.; Adams, M.A.; Karabourniotis, G. Photosynthetic capacity is negatively correlated with the concentration of leaf phenolic compounds across a range of different species. AoB Plants 2012. [Google Scholar] [CrossRef]
- Kostidis, G.; Karabourniotis, G. The intraspecific trade-off between photosynthesis and phenolics in selected crop species: A meta-analysis study. Discov. Plants 2024, 1, 29. [Google Scholar] [CrossRef]
- Yu, J.Q.; Ye, S.F.; Zhang, M.F.; Hu, W.H. Effects of root exudates and aqueous root extracts of cucumber (Cucumis sativus) and allelochemicals, on photosynthesis and antioxidant enzymes in cucumber. Biochem. Syst. Ecol. 2003, 31, 129–139. [Google Scholar] [CrossRef]
- Lu, X.F.; Zhang, H.; Lyu, S.S.; Du, G.D.; Wang, X.Q.; Wu, C.H.; Lyu, D.G. Effects of exogenous phenolic acids on photosystem functions and photosynthetic electron transport rate in strawberry leaves. Photosynthetica 2018, 56, 616–622. [Google Scholar] [CrossRef]
- Li, K.; Zhang, T.; Li, H.; Zhang, L.D.; Li, F. Phenolic acids inhibit the photosynthetic productivity of poplar. Photosynthetica 2020, 58, 1210–1216. [Google Scholar] [CrossRef]
- Marchiosi, R.; Bido, G.S.; Böhm, P.A.F.; Soares, A.R.; Silva, H.A.; Ferro, A.P.; Ferrarese, M.L.L.; Ferrarese-Filho, O. Photosynthetic response of soybean to L-DOPA and aqueous extracts of velvet bean. Plant Growth Regul. 2016, 80, 171–182. [Google Scholar] [CrossRef]
- Huang, X.; Bie, Z. Cinnamic acid-inhibited ribulose-1,5-bisphosphate carboxylase activity is mediated through decreased spermine and changes in the ratio of polyamines in cowpea. J. Plant Physiol. 2010, 167, 47–53. [Google Scholar] [CrossRef] [PubMed]
- Evans, J.R.; von Caemmerer, S. Carbon Dioxide Diffusion inside Leaves. Plant Physiol. 1996, 110, 339–346. [Google Scholar] [CrossRef]
- Long, S.P.; Bernacchi, C.J. Gas exchange measurements, what can they tell us about the underlying limitations to photosynthesis? Procedures and sources of error. J. Exp. Bot. 2003, 54, 2393–2401. [Google Scholar] [CrossRef]
- Baker, N.R. Chlorophyll Fluorescence: A Probe of Photosynthesis In Vivo. Ann. Rev. Plant Biol. 2008, 59, 89–113. [Google Scholar] [CrossRef]
- Chauhan, J.; Prathibha, M.; Singh, P.; Choyal, P.; Mishra, U.N.; Saha, D.; Kumar, R.; Anuragi, H.; Pandey, S.; Bose, B.; Mehta, B.; Dey, P.; Dwivedi, K.K.; Gupta, N.K.; Singhal, R.K. Plant photosynthesis under abiotic stresses: Damages, adaptive, and signaling mechanisms. Plant Stress 2023, 10, 100296. [Google Scholar] [CrossRef]
- Holappa, L.D.; Blum, U. Effects of exogenously applied ferulic acid, a potential allelopathic compound, on leaf growth, water utilization, and endogenous abscisic acid levels of tomato, cucumber, and bean. J. Chem. Ecol. 1991, 17, 865–886. [Google Scholar] [CrossRef]
- Purohit, S.; Laloraya, M.M.; Bharti, S. Effect of phenolic compounds on abscisic acid-induced stomatal movement: Structure – activity relationship. Physiol. Plant. 1991, 81, 79–82. [Google Scholar] [CrossRef]
Figure 1.
Hydroponically grown maize plants treated with 3-cyanobenzoic acid for 14 days: 0 mM (A), 0.5 mM (B), and 1.0 mM (C). Scale bars represent 10 cm.
Figure 1.
Hydroponically grown maize plants treated with 3-cyanobenzoic acid for 14 days: 0 mM (A), 0.5 mM (B), and 1.0 mM (C). Scale bars represent 10 cm.
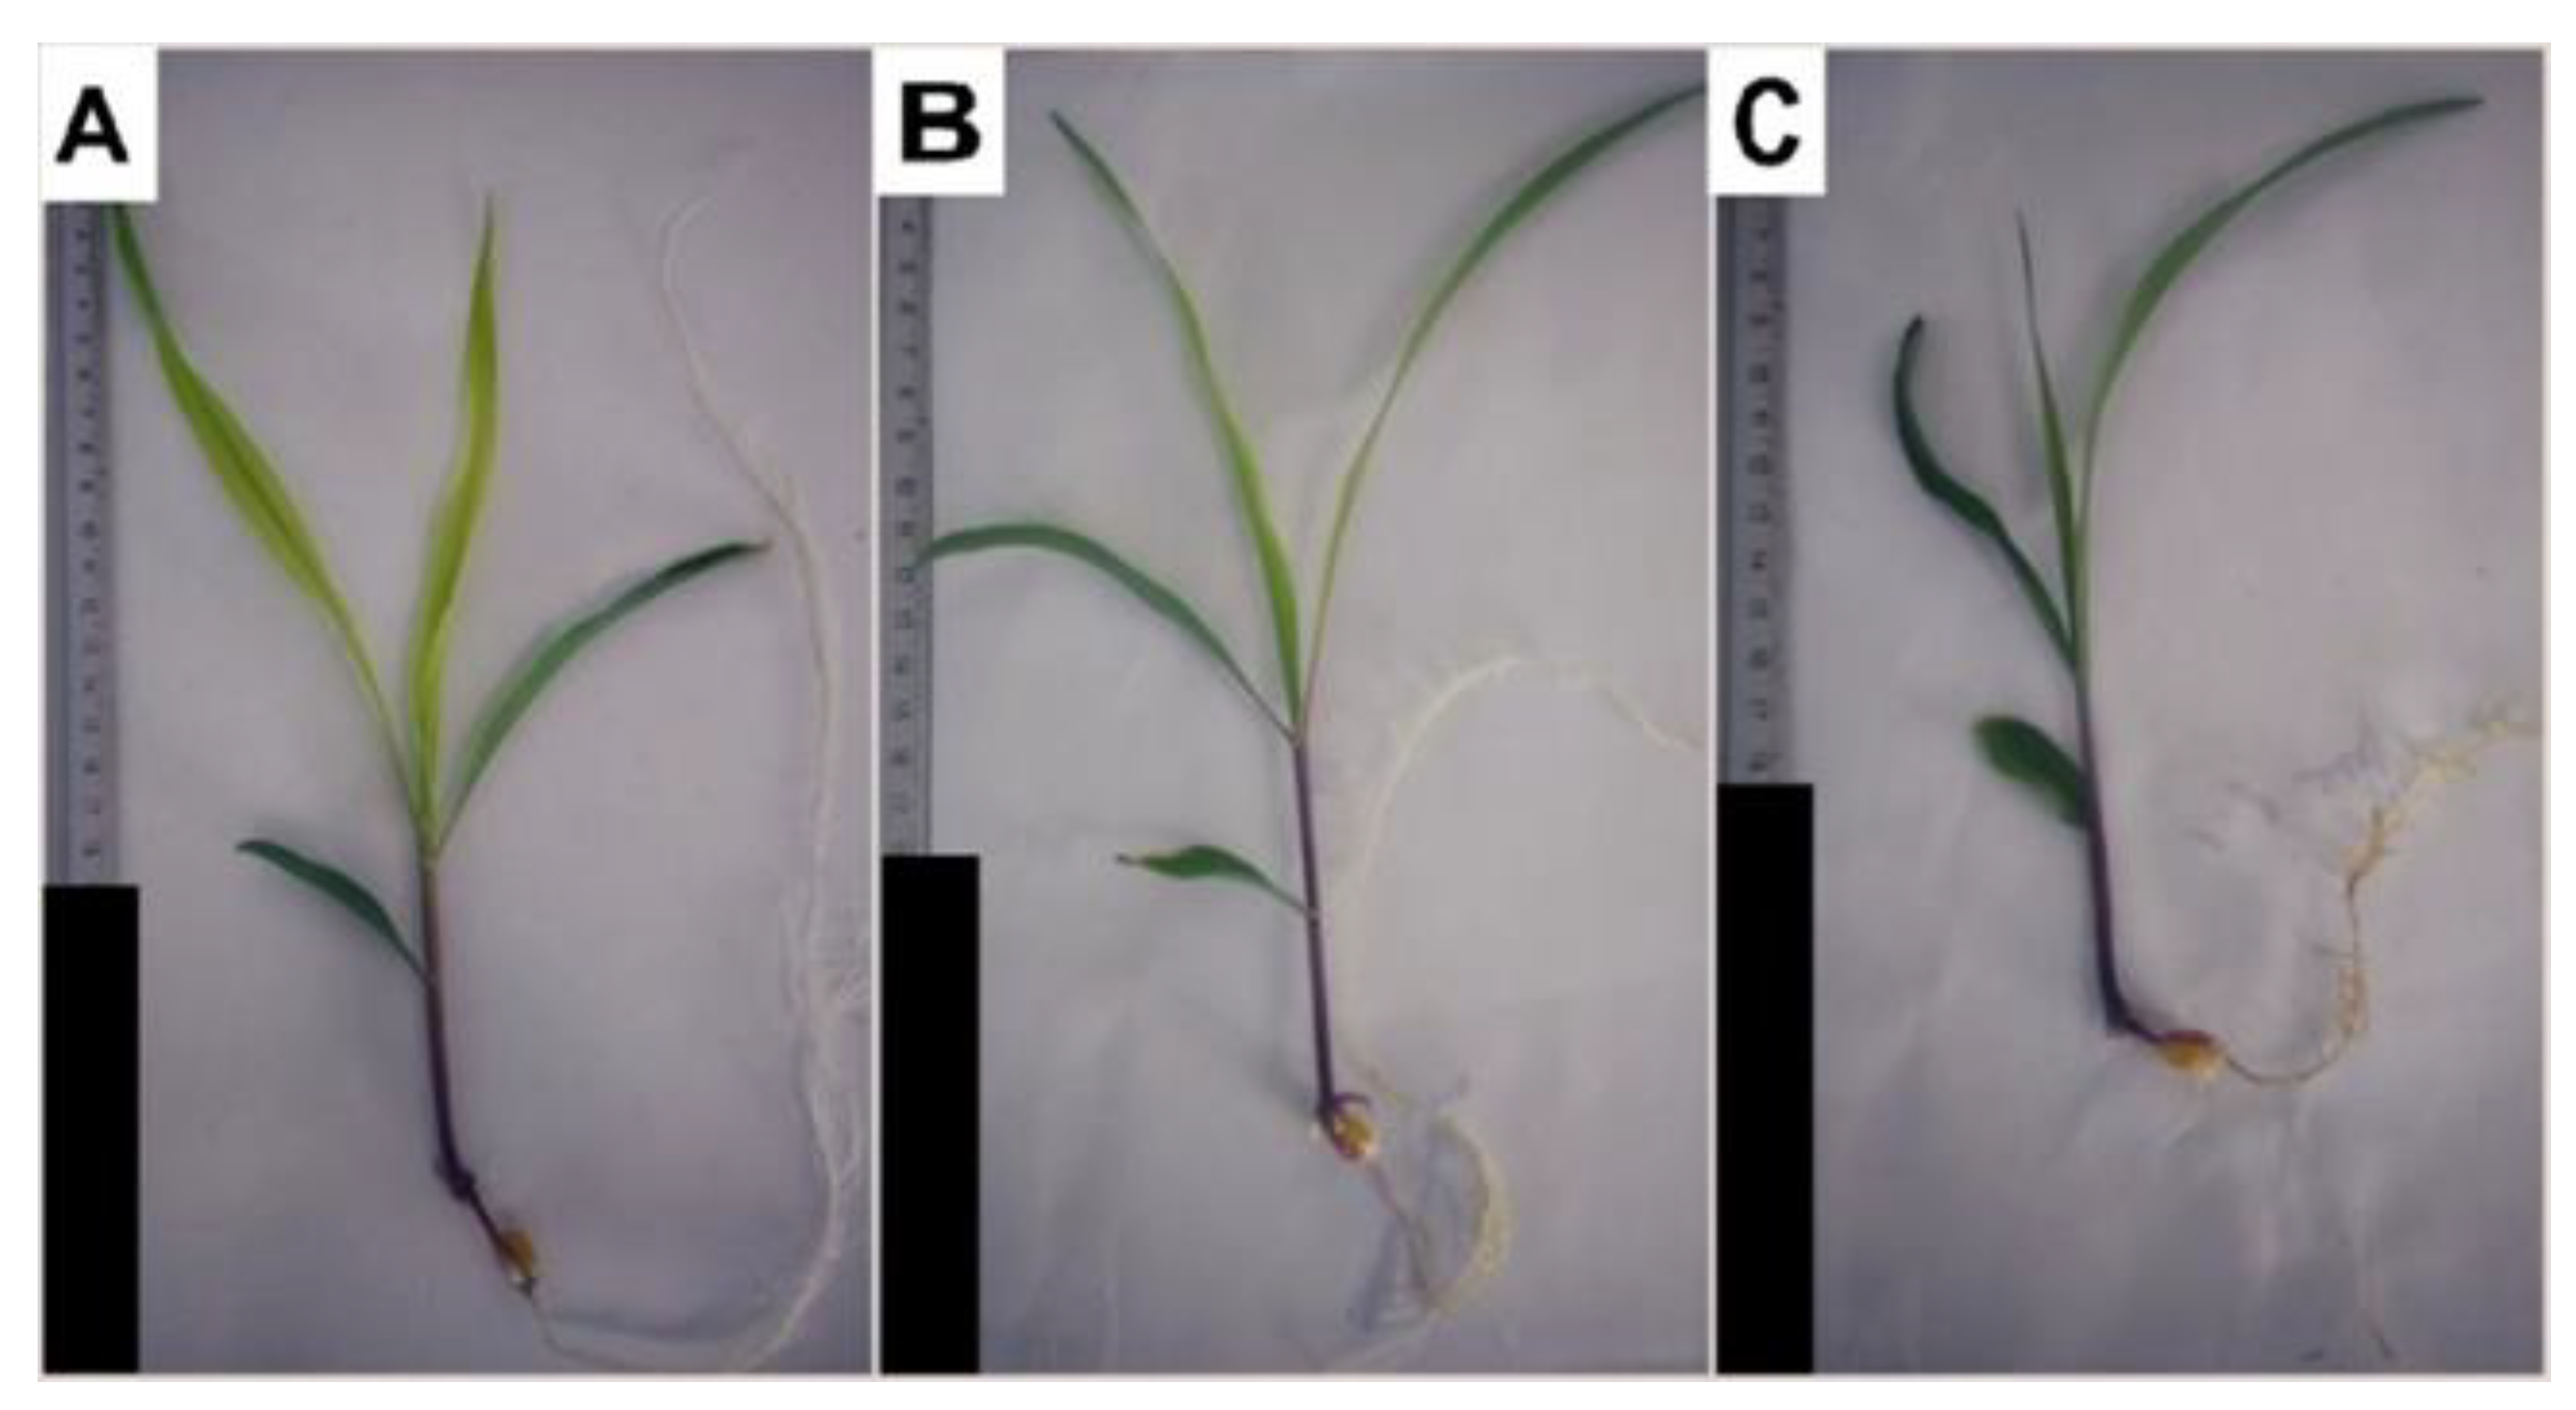
Figure 2.
Effects of 3-cyanobenzoic acid on hydroponically grown maize plants for 14 days. Parameters measured include (A) chlorophyll content (SPAD index), (B) maximum quantum efficiency of PSII photochemistry (Fv/Fm), (C) net assimilation (A), (D) stomatal conductance (gs), (E) intercellular CO2 concentration (Ci), (F) maximum efficiency of PSII (Fv'/Fm'), (G) non-photochemical quenching (NPQ), and (H) photochemical quenching (qP). Means values (n = 16-22 ± SEM) significantly different from the control are marked with * p ≤ 0.05, ** p ≤ 0.01, according to Dunnett's test.
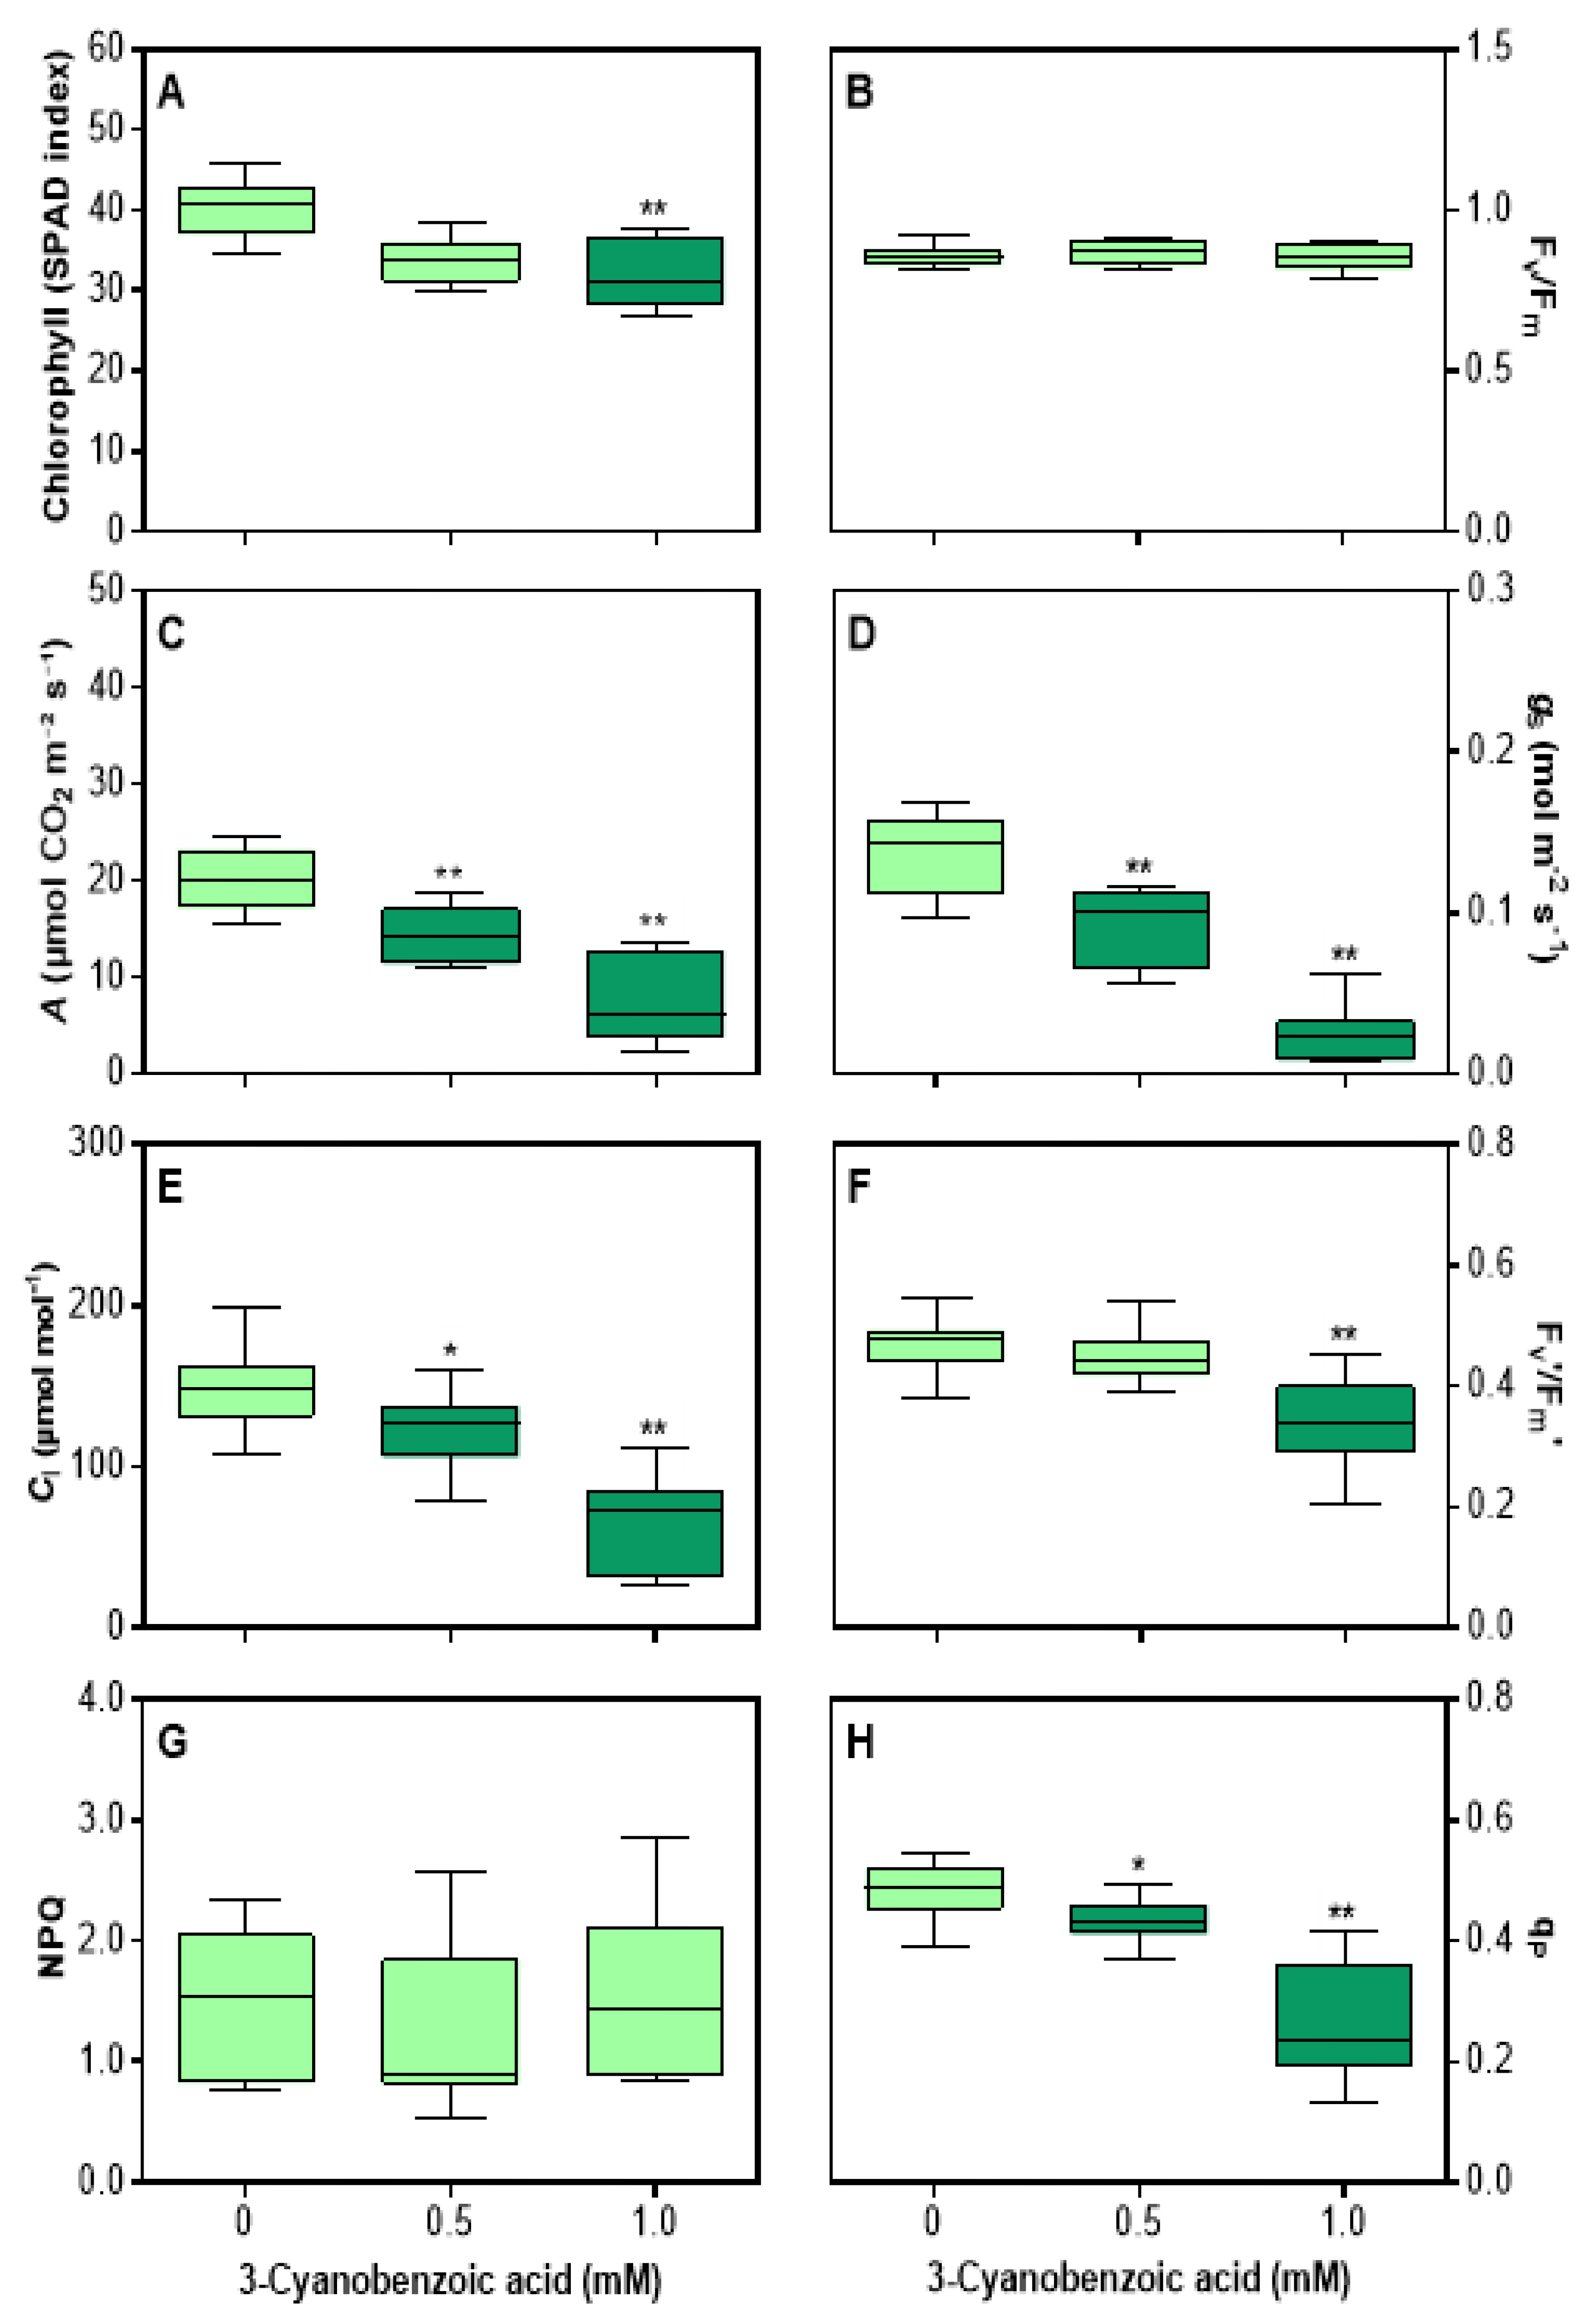
Figure 3.
Effects of 3-cyanobenzoic acid on hydroponically grown maize plants for 14 days on quantum yield of photosystem II photochemistry (ϕPSII) (A) and electron transport rate through PSII (ETR) (B). Means (n = 22 ± SEM) marked with * or ** are statistically different from the control according to Dunnett's test at 5% and 1% significance levels, respectively.
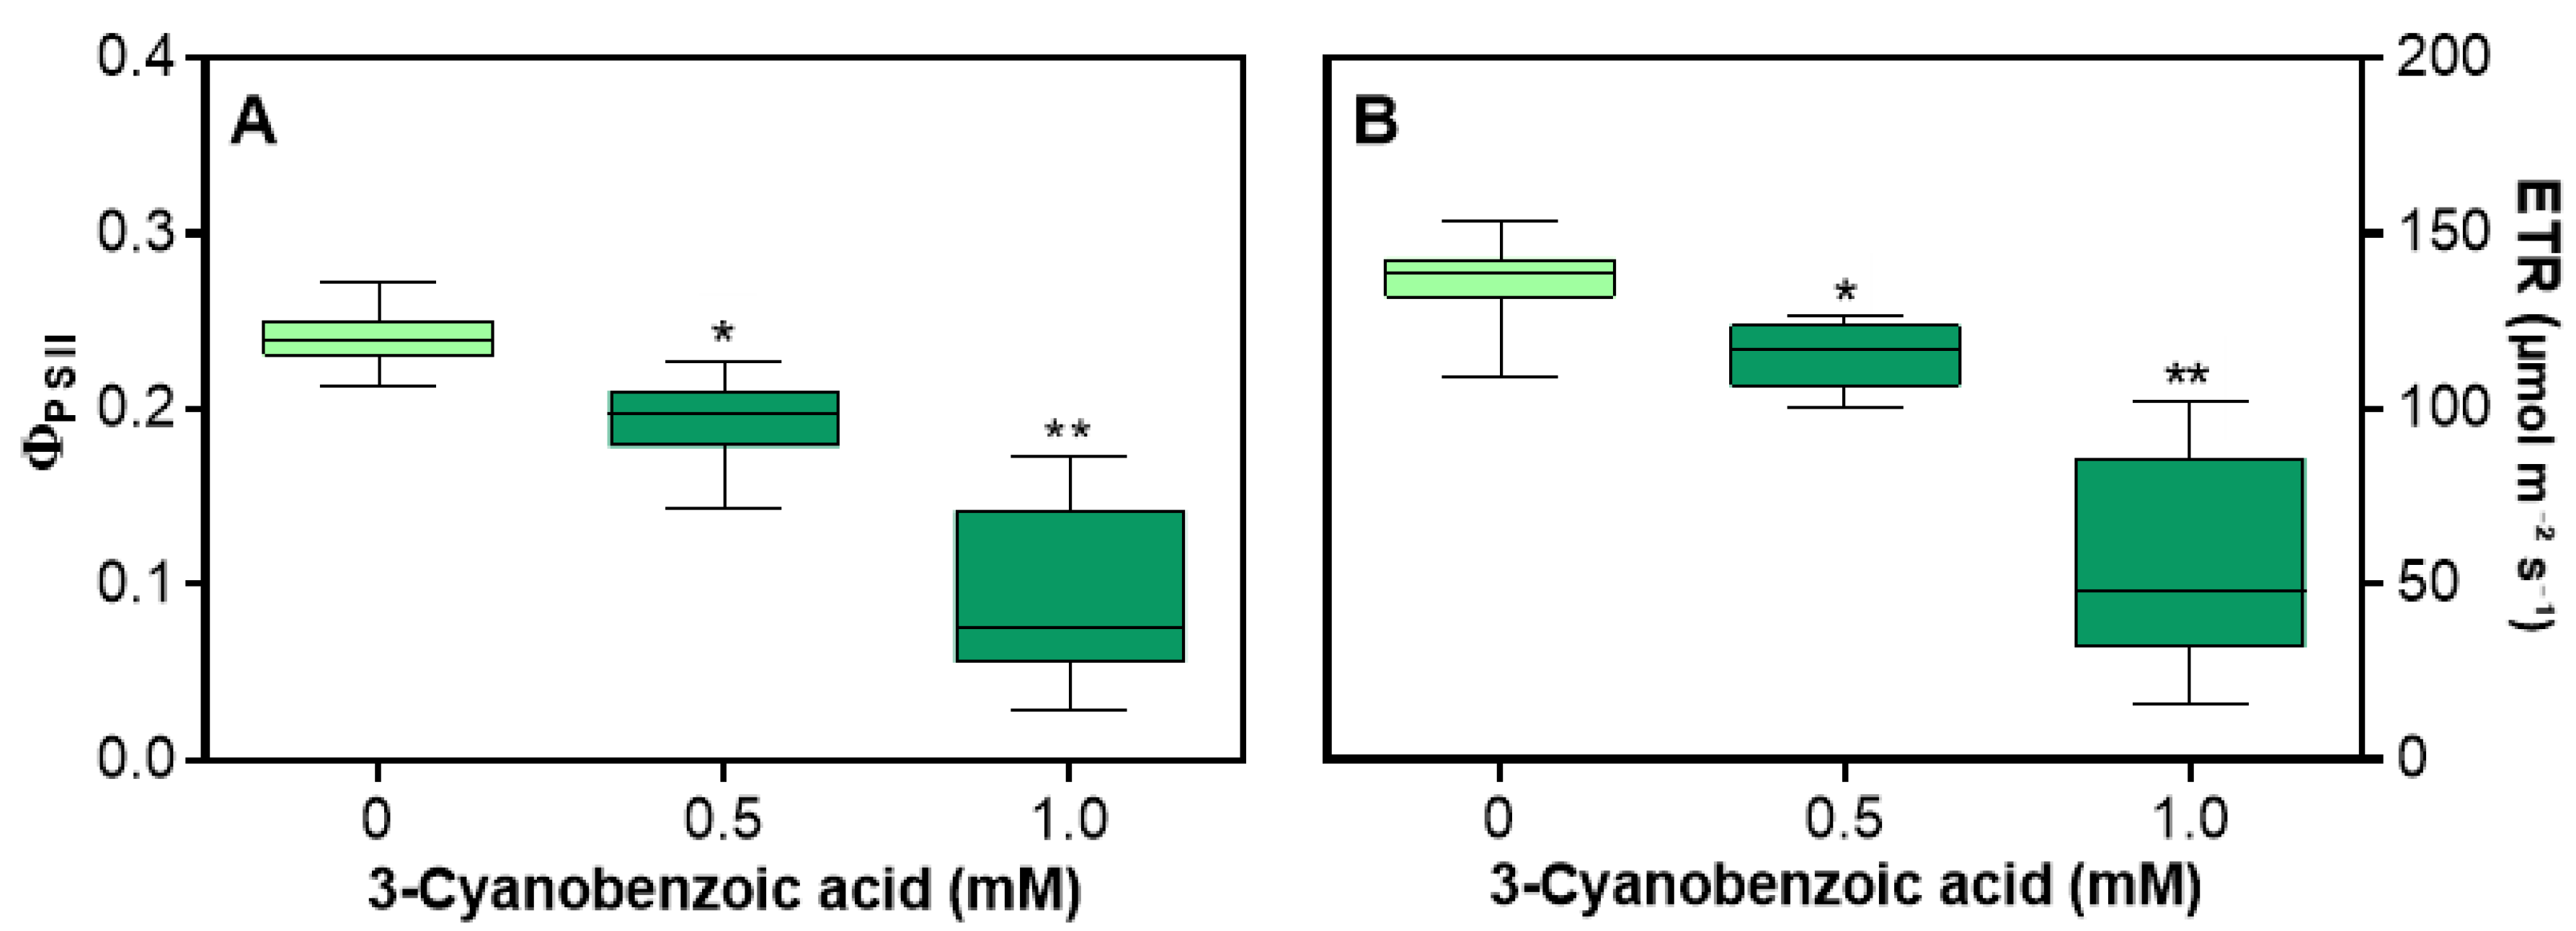
Figure 4.
Average net assimilation (A) curves in response to varying photosynthetically active radiation (PAR) for maize plants grown hydroponically with 3-cyanobenzoic acid for 14 days. The initial linear region of the graph is magnified for clarity. Data are presented as mean values (n = 4).
Figure 4.
Average net assimilation (A) curves in response to varying photosynthetically active radiation (PAR) for maize plants grown hydroponically with 3-cyanobenzoic acid for 14 days. The initial linear region of the graph is magnified for clarity. Data are presented as mean values (n = 4).
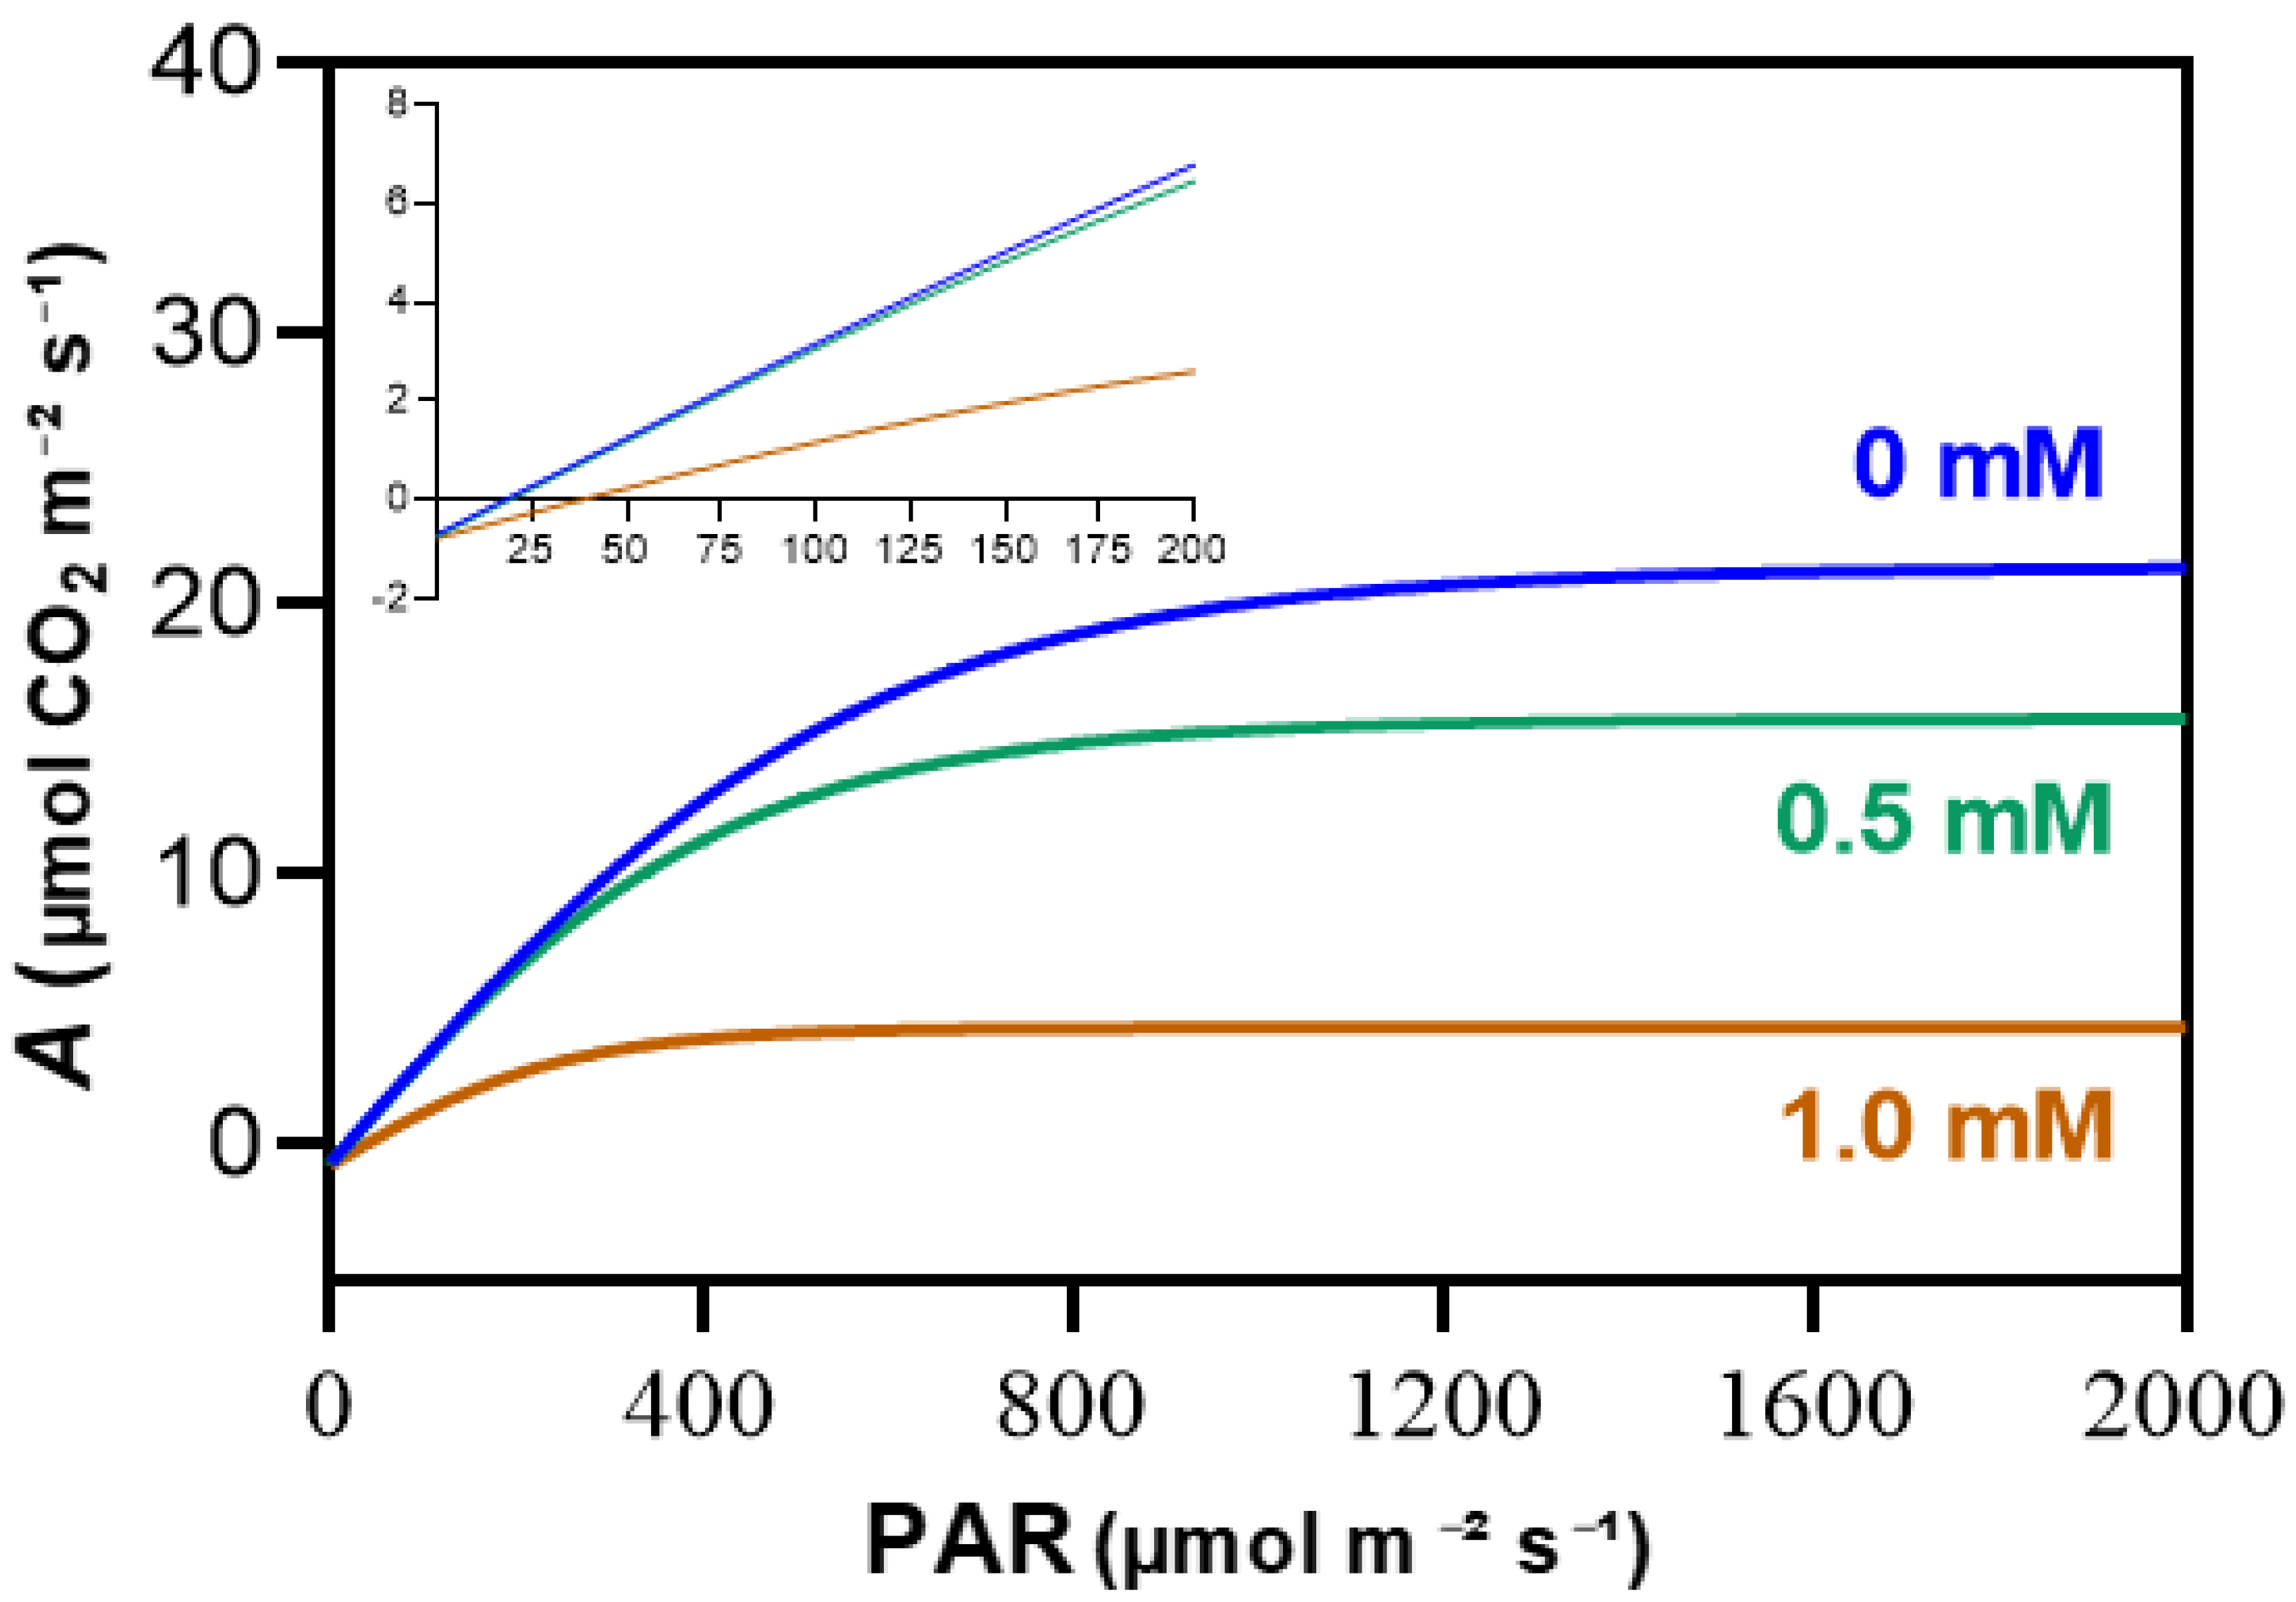
Figure 5.
Effects of 3-cyanobenzoic acid on hydroponically grown maize plants after 14 days, focusing on parameters derived from the A/PAR curve: (A) net assimilation (Amax), (B) apparent quantum yield (ϕ), (C) light-compensation point (LCP), and (D) dark respiration rate (RD). Means values (n = 3-4 ± SEM) significantly different from the control are marked with * p ≤ 0.05, ** p ≤ 0.01, according to Dunnett's test.
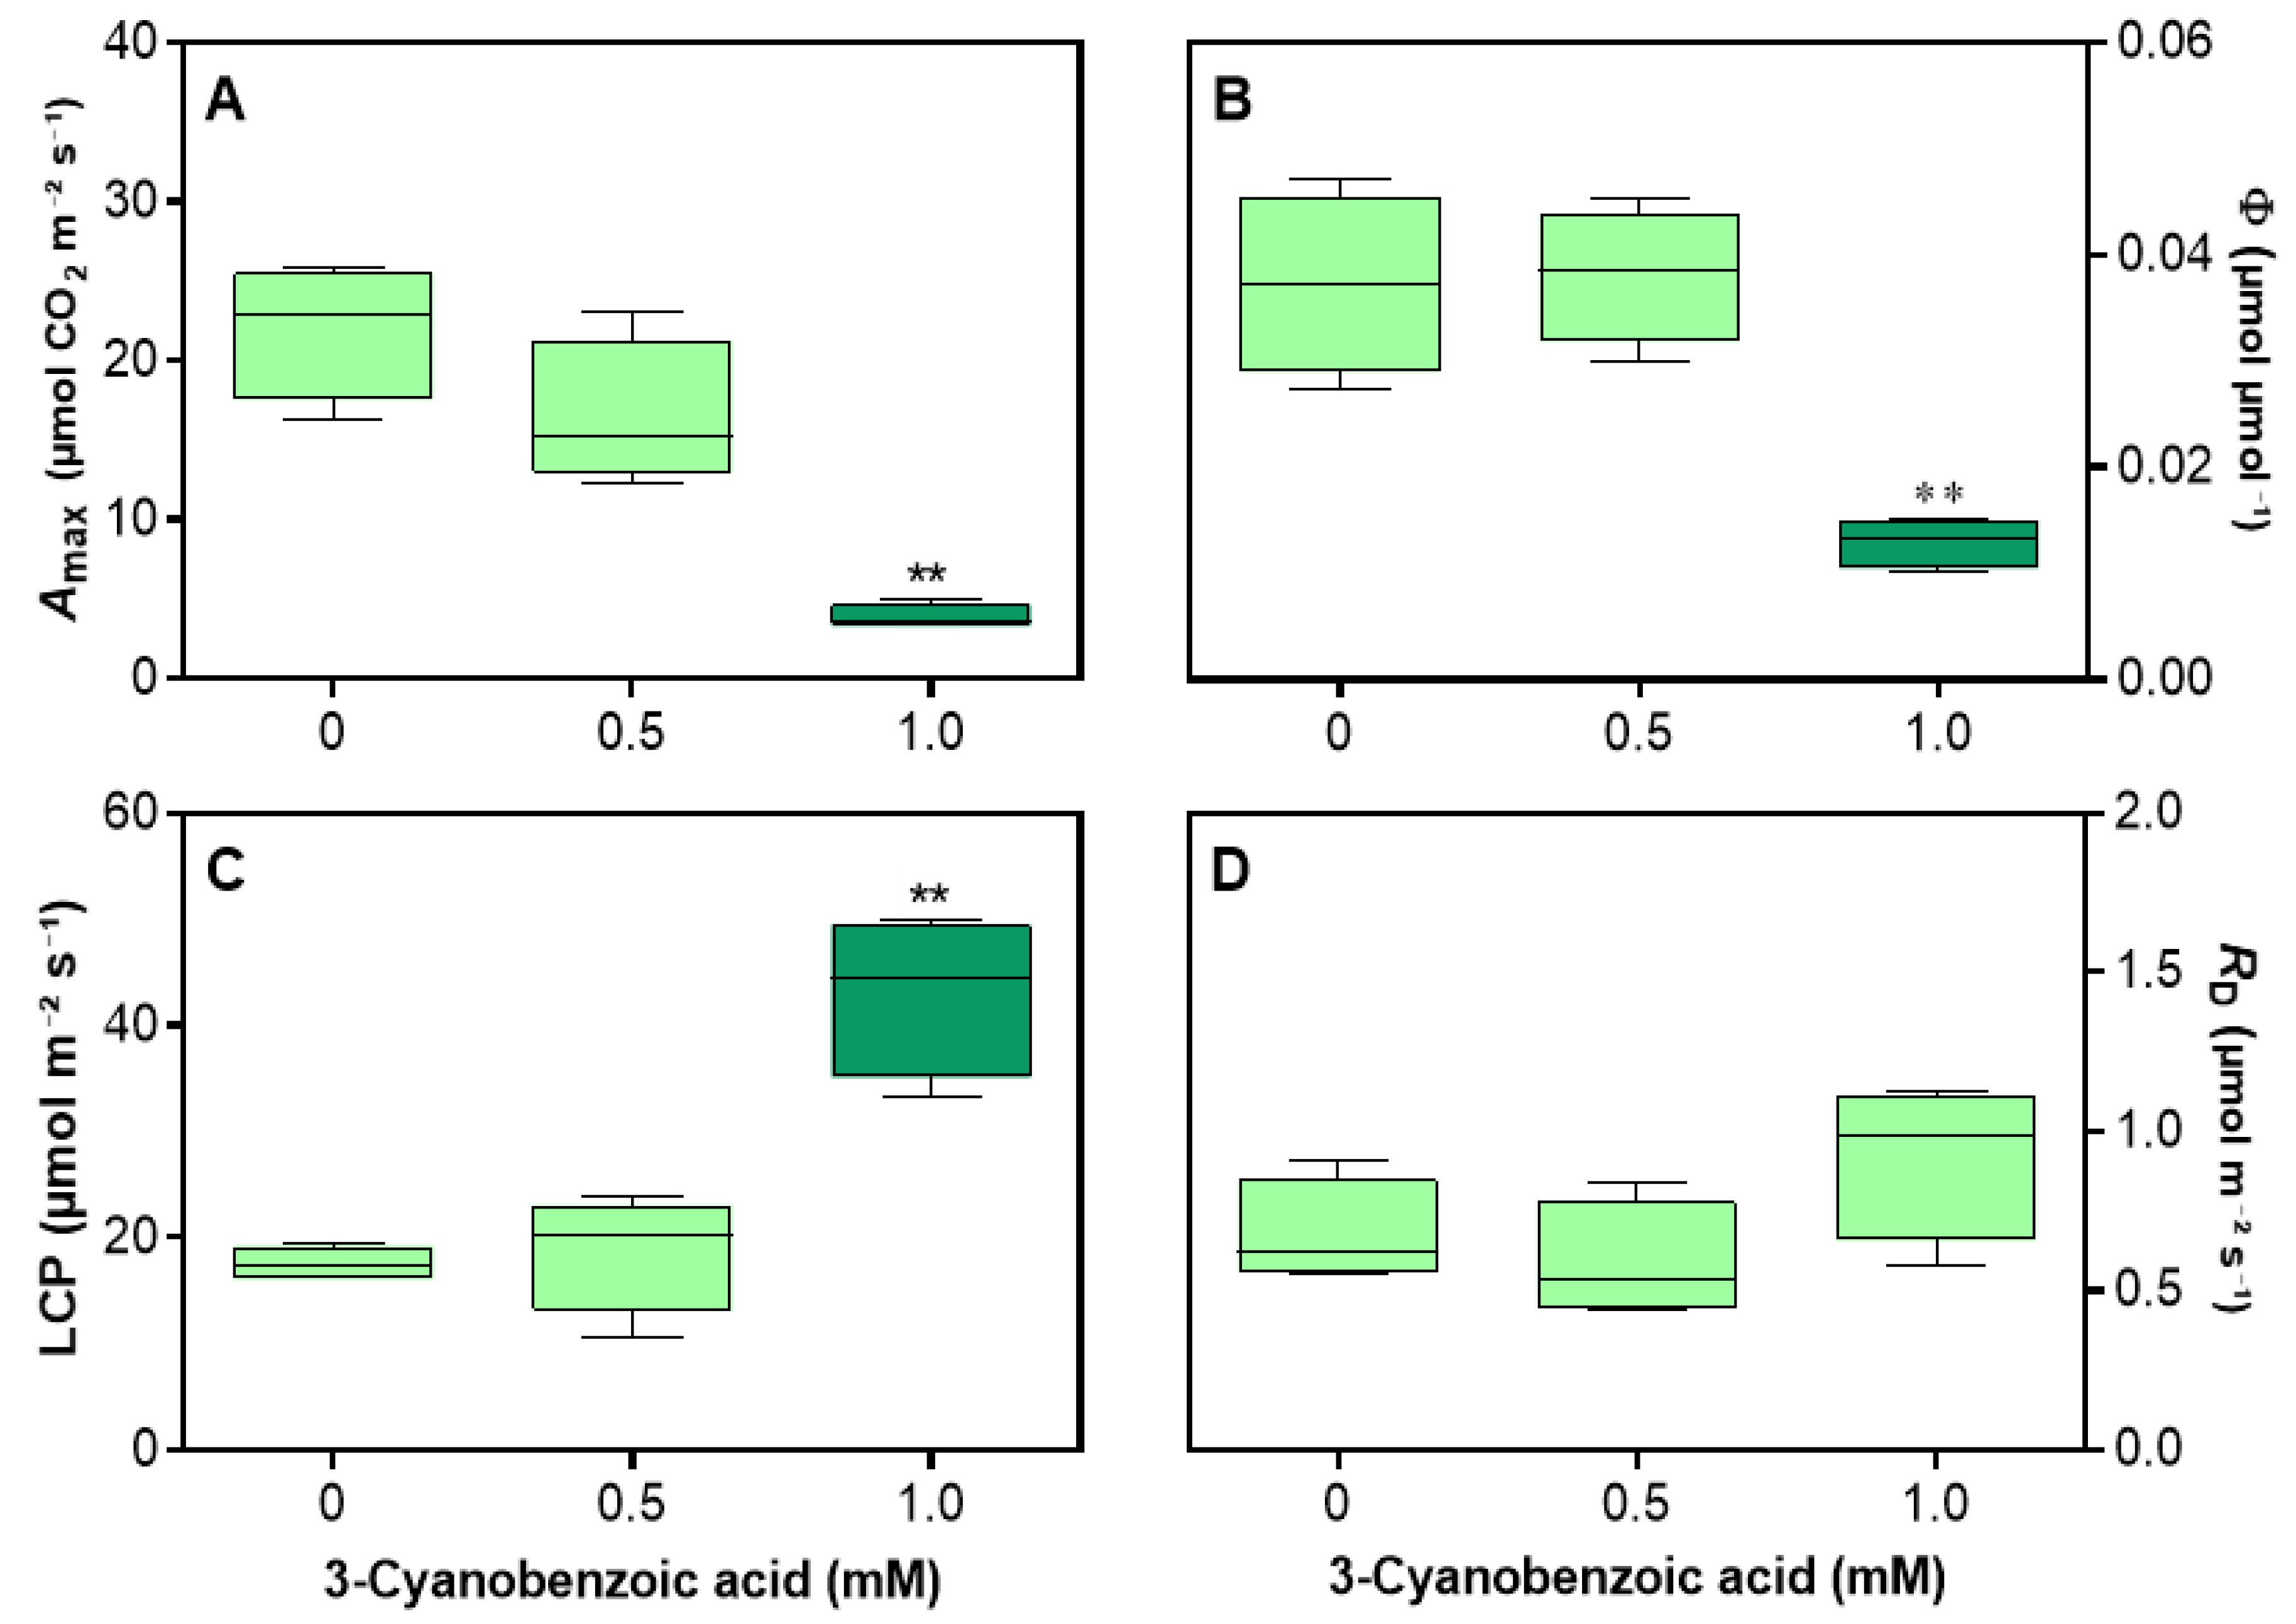
Figure 6.
Figure 6. Average net assimilation (A) curves in response to varying intercellular CO2 concentration (Ci) forma maize plants grown hydroponically with 3-cyanobenzoic acid for 14 days. Data are presented as mean values (n = 4–6).
Figure 6.
Figure 6. Average net assimilation (A) curves in response to varying intercellular CO2 concentration (Ci) forma maize plants grown hydroponically with 3-cyanobenzoic acid for 14 days. Data are presented as mean values (n = 4–6).
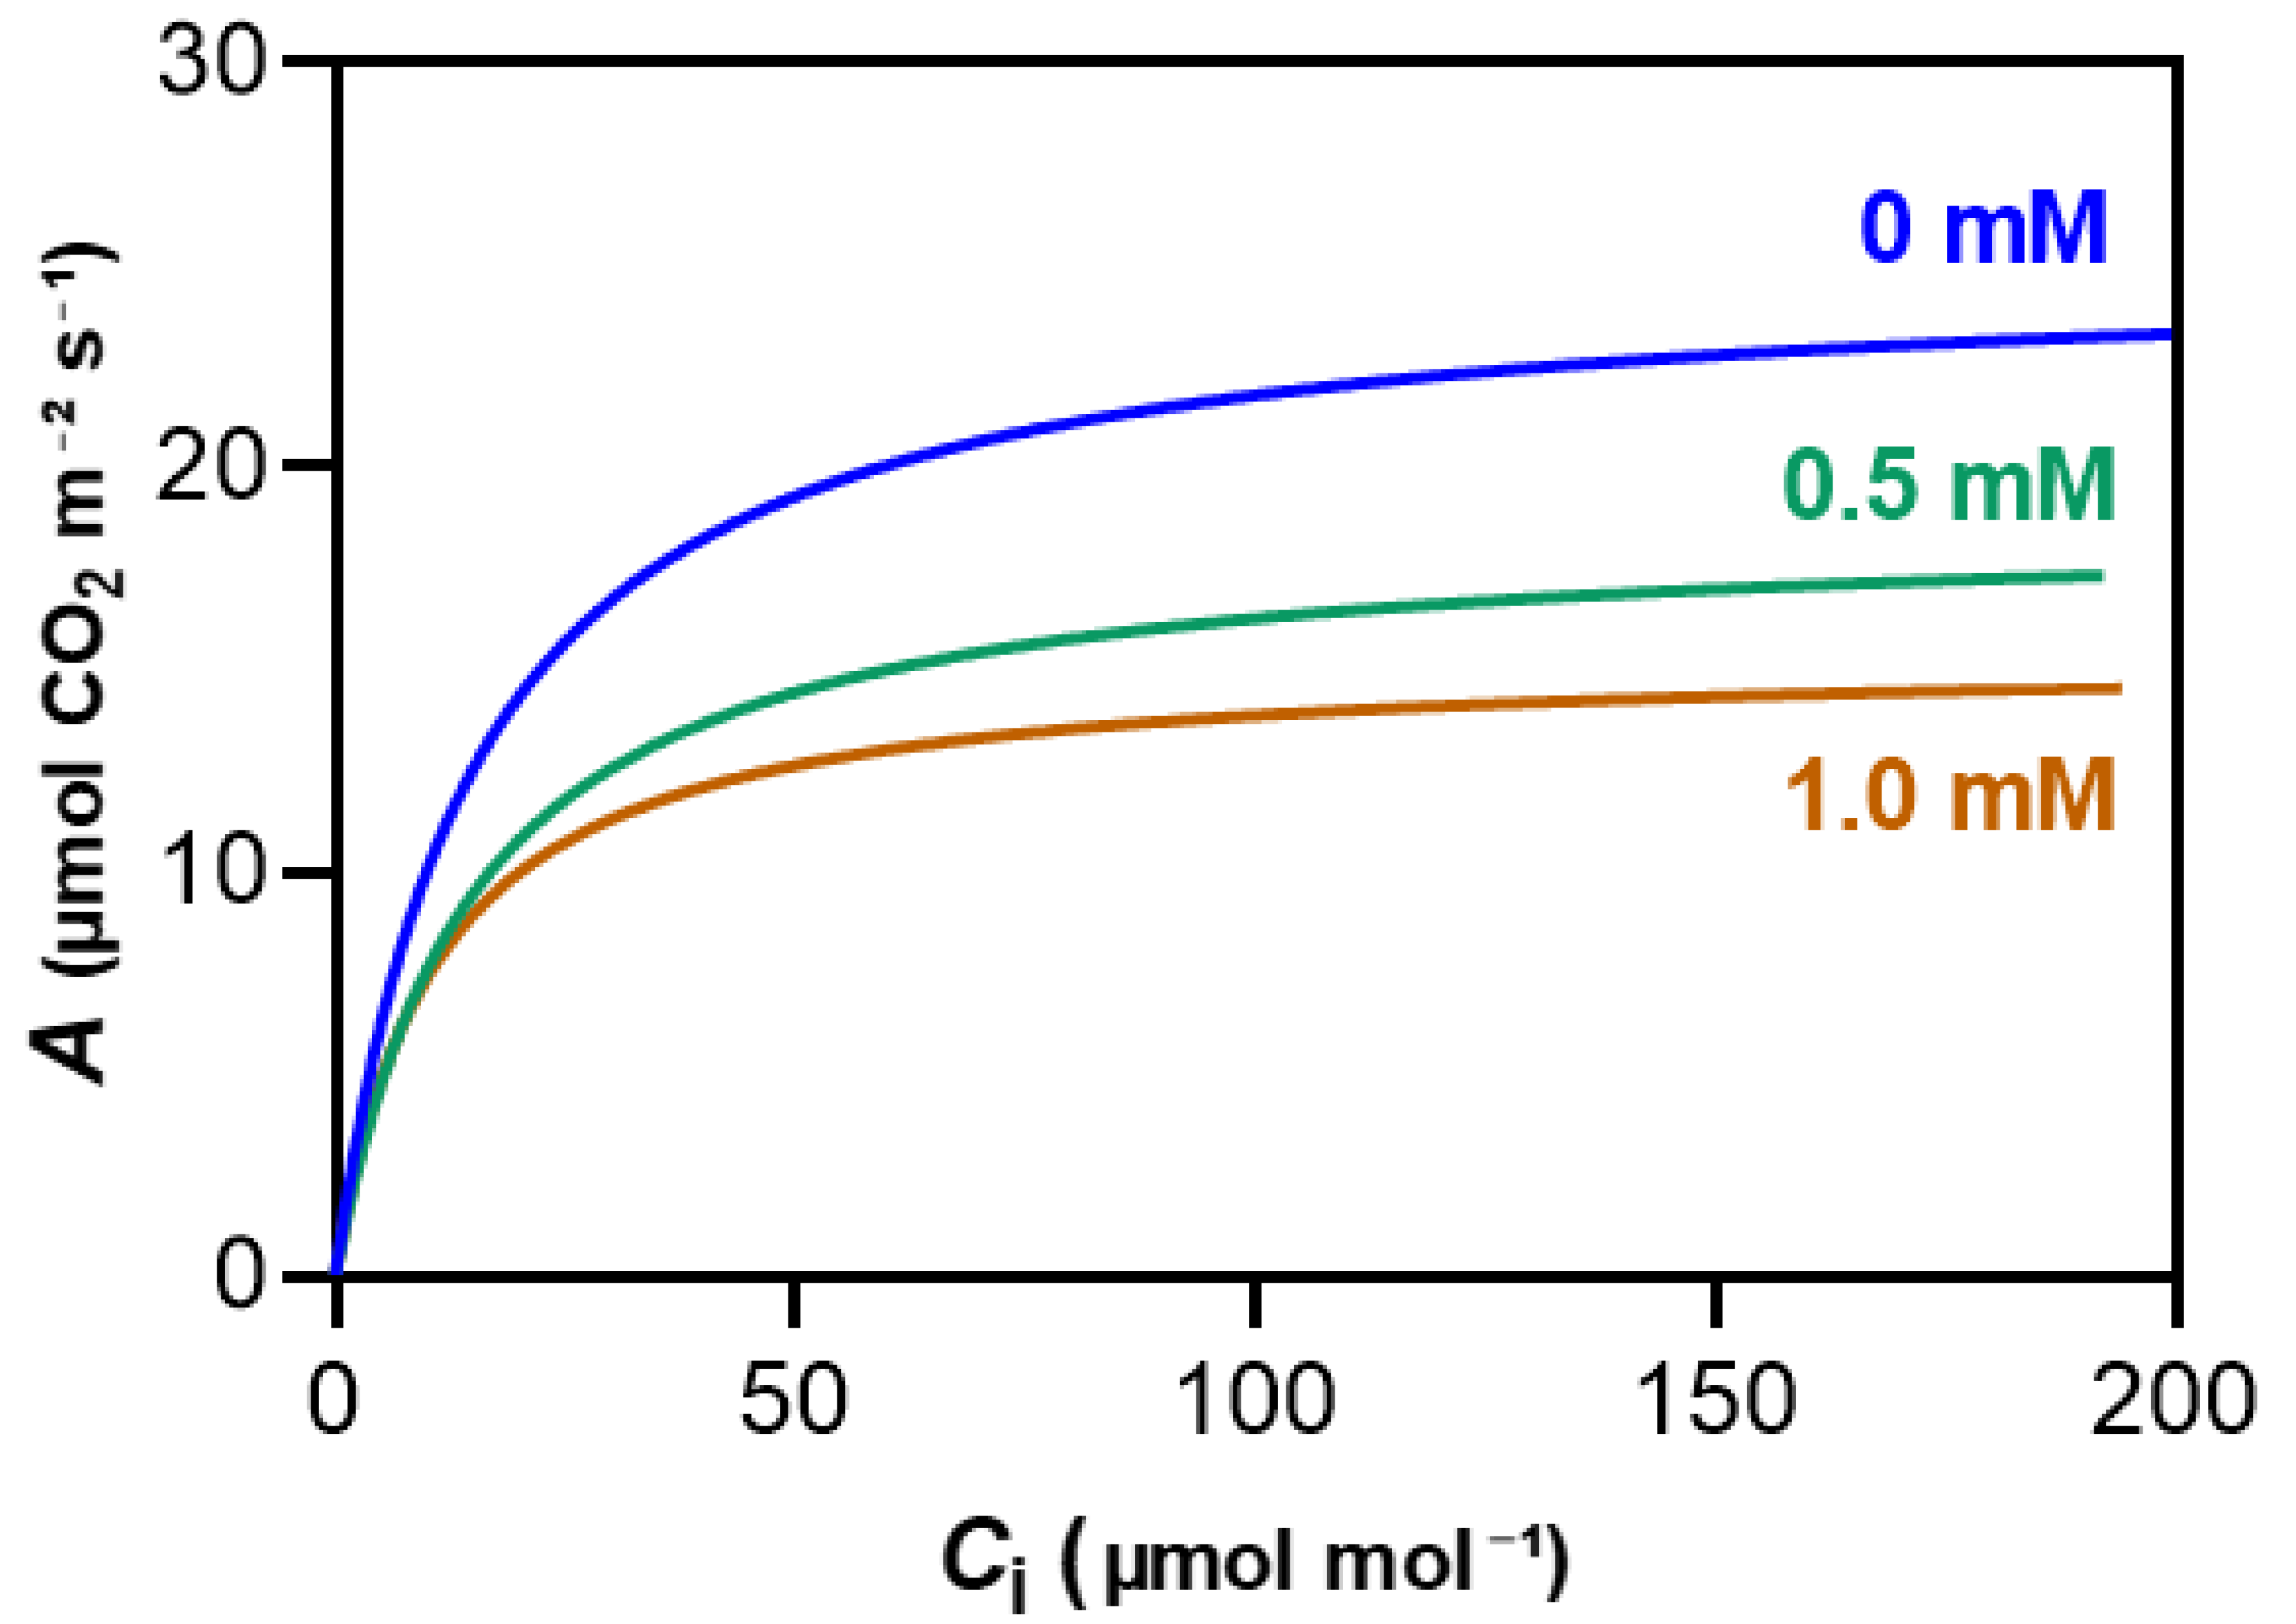
Figure 7.
Effects of 3-cyanobenzoic acid on maize plants grown hydroponically for 14 days, focusing on parameters derived from the A/Ci curve: (A) maximum carboxylation rate of RuBisCO (Vcmax), (B) maximum carboxylation rate of PEPCase (Vpmax), (C) rate of photosynthetic electron transport (J), and (D) mesophyll conductance (gm). Means values (n = 4-6 ± SEM) significantly different from the control are marked with * p ≤ 0.05, ** p ≤ 0.01, according to Dunnett's test.
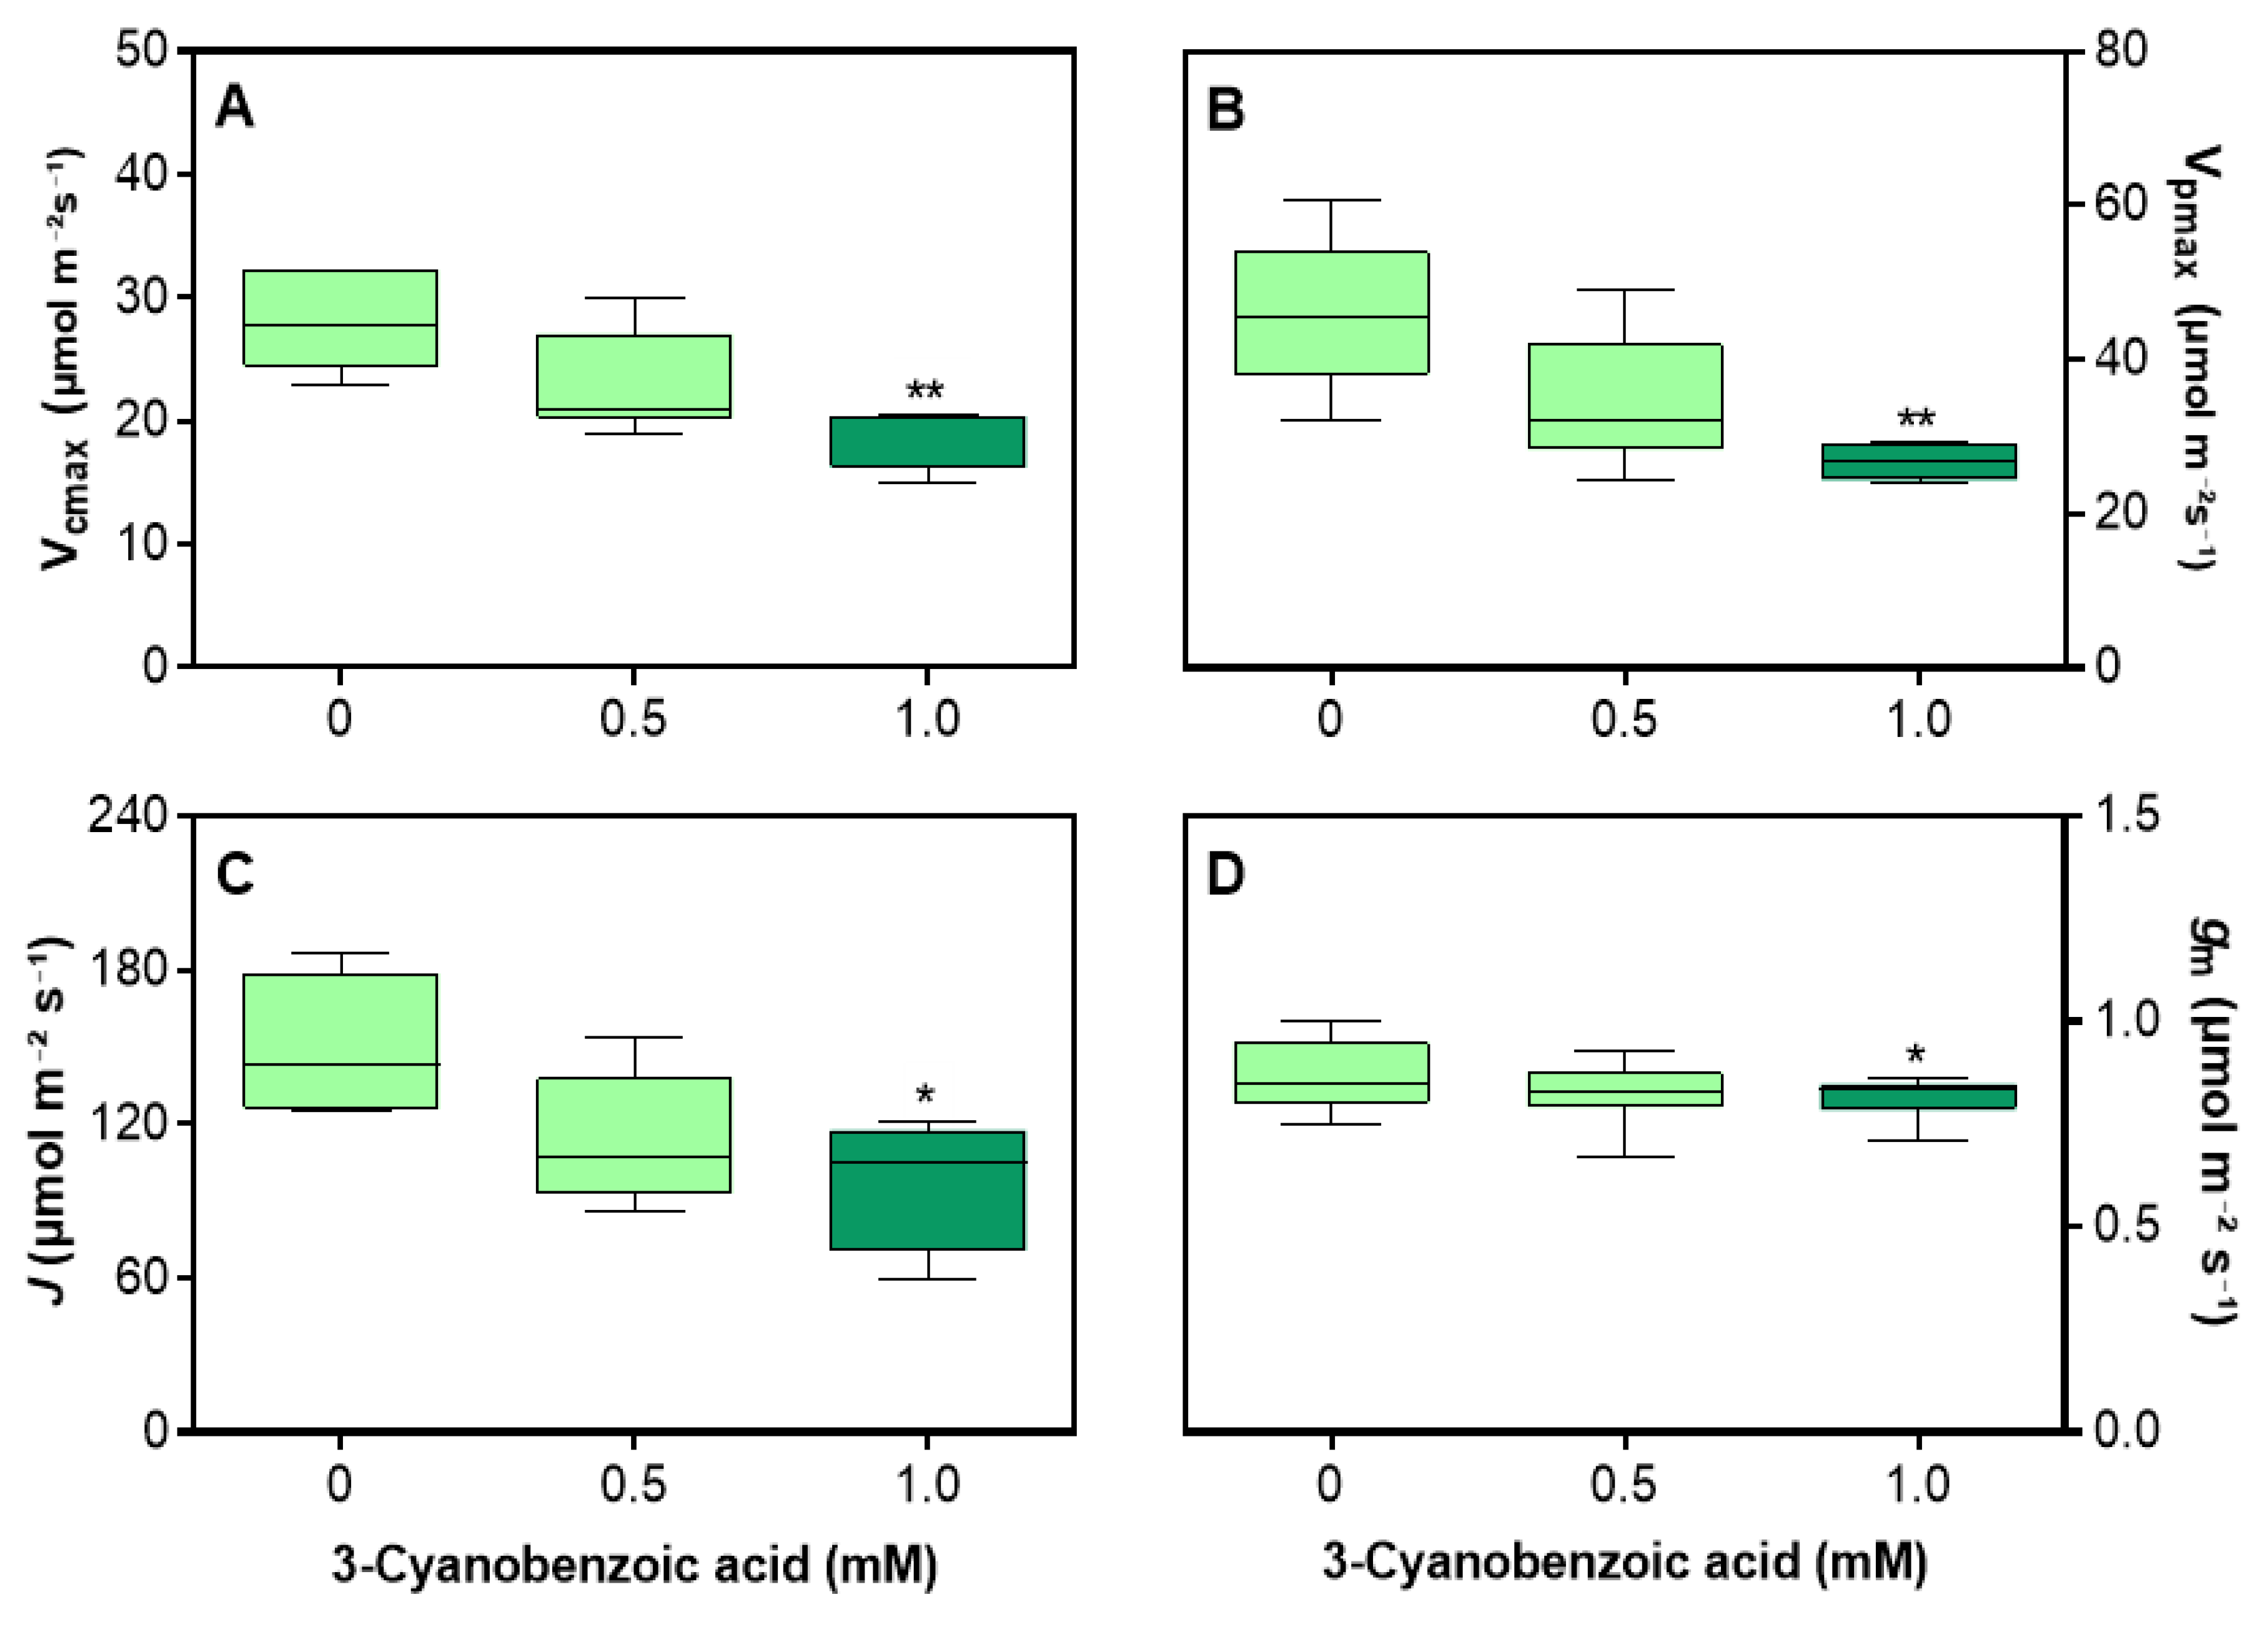
Figure 8.
Chlorophyll a fluorescence OJIP transient curves in maize plants grown hydroponically with 3-cyanobenzoic acid for 14 days. The OJIP curve represents key fluorescence intensities: the minimal fluorescence when all PSII reaction centers are open (O step), the intensity at 0.002 s (J step), the intensity at 0.03 s (I step), and the maximal fluorescence when all PSII reaction centers are closed (P step, at 0.3 s). Data are presented as means (n = 18 ± SEM).
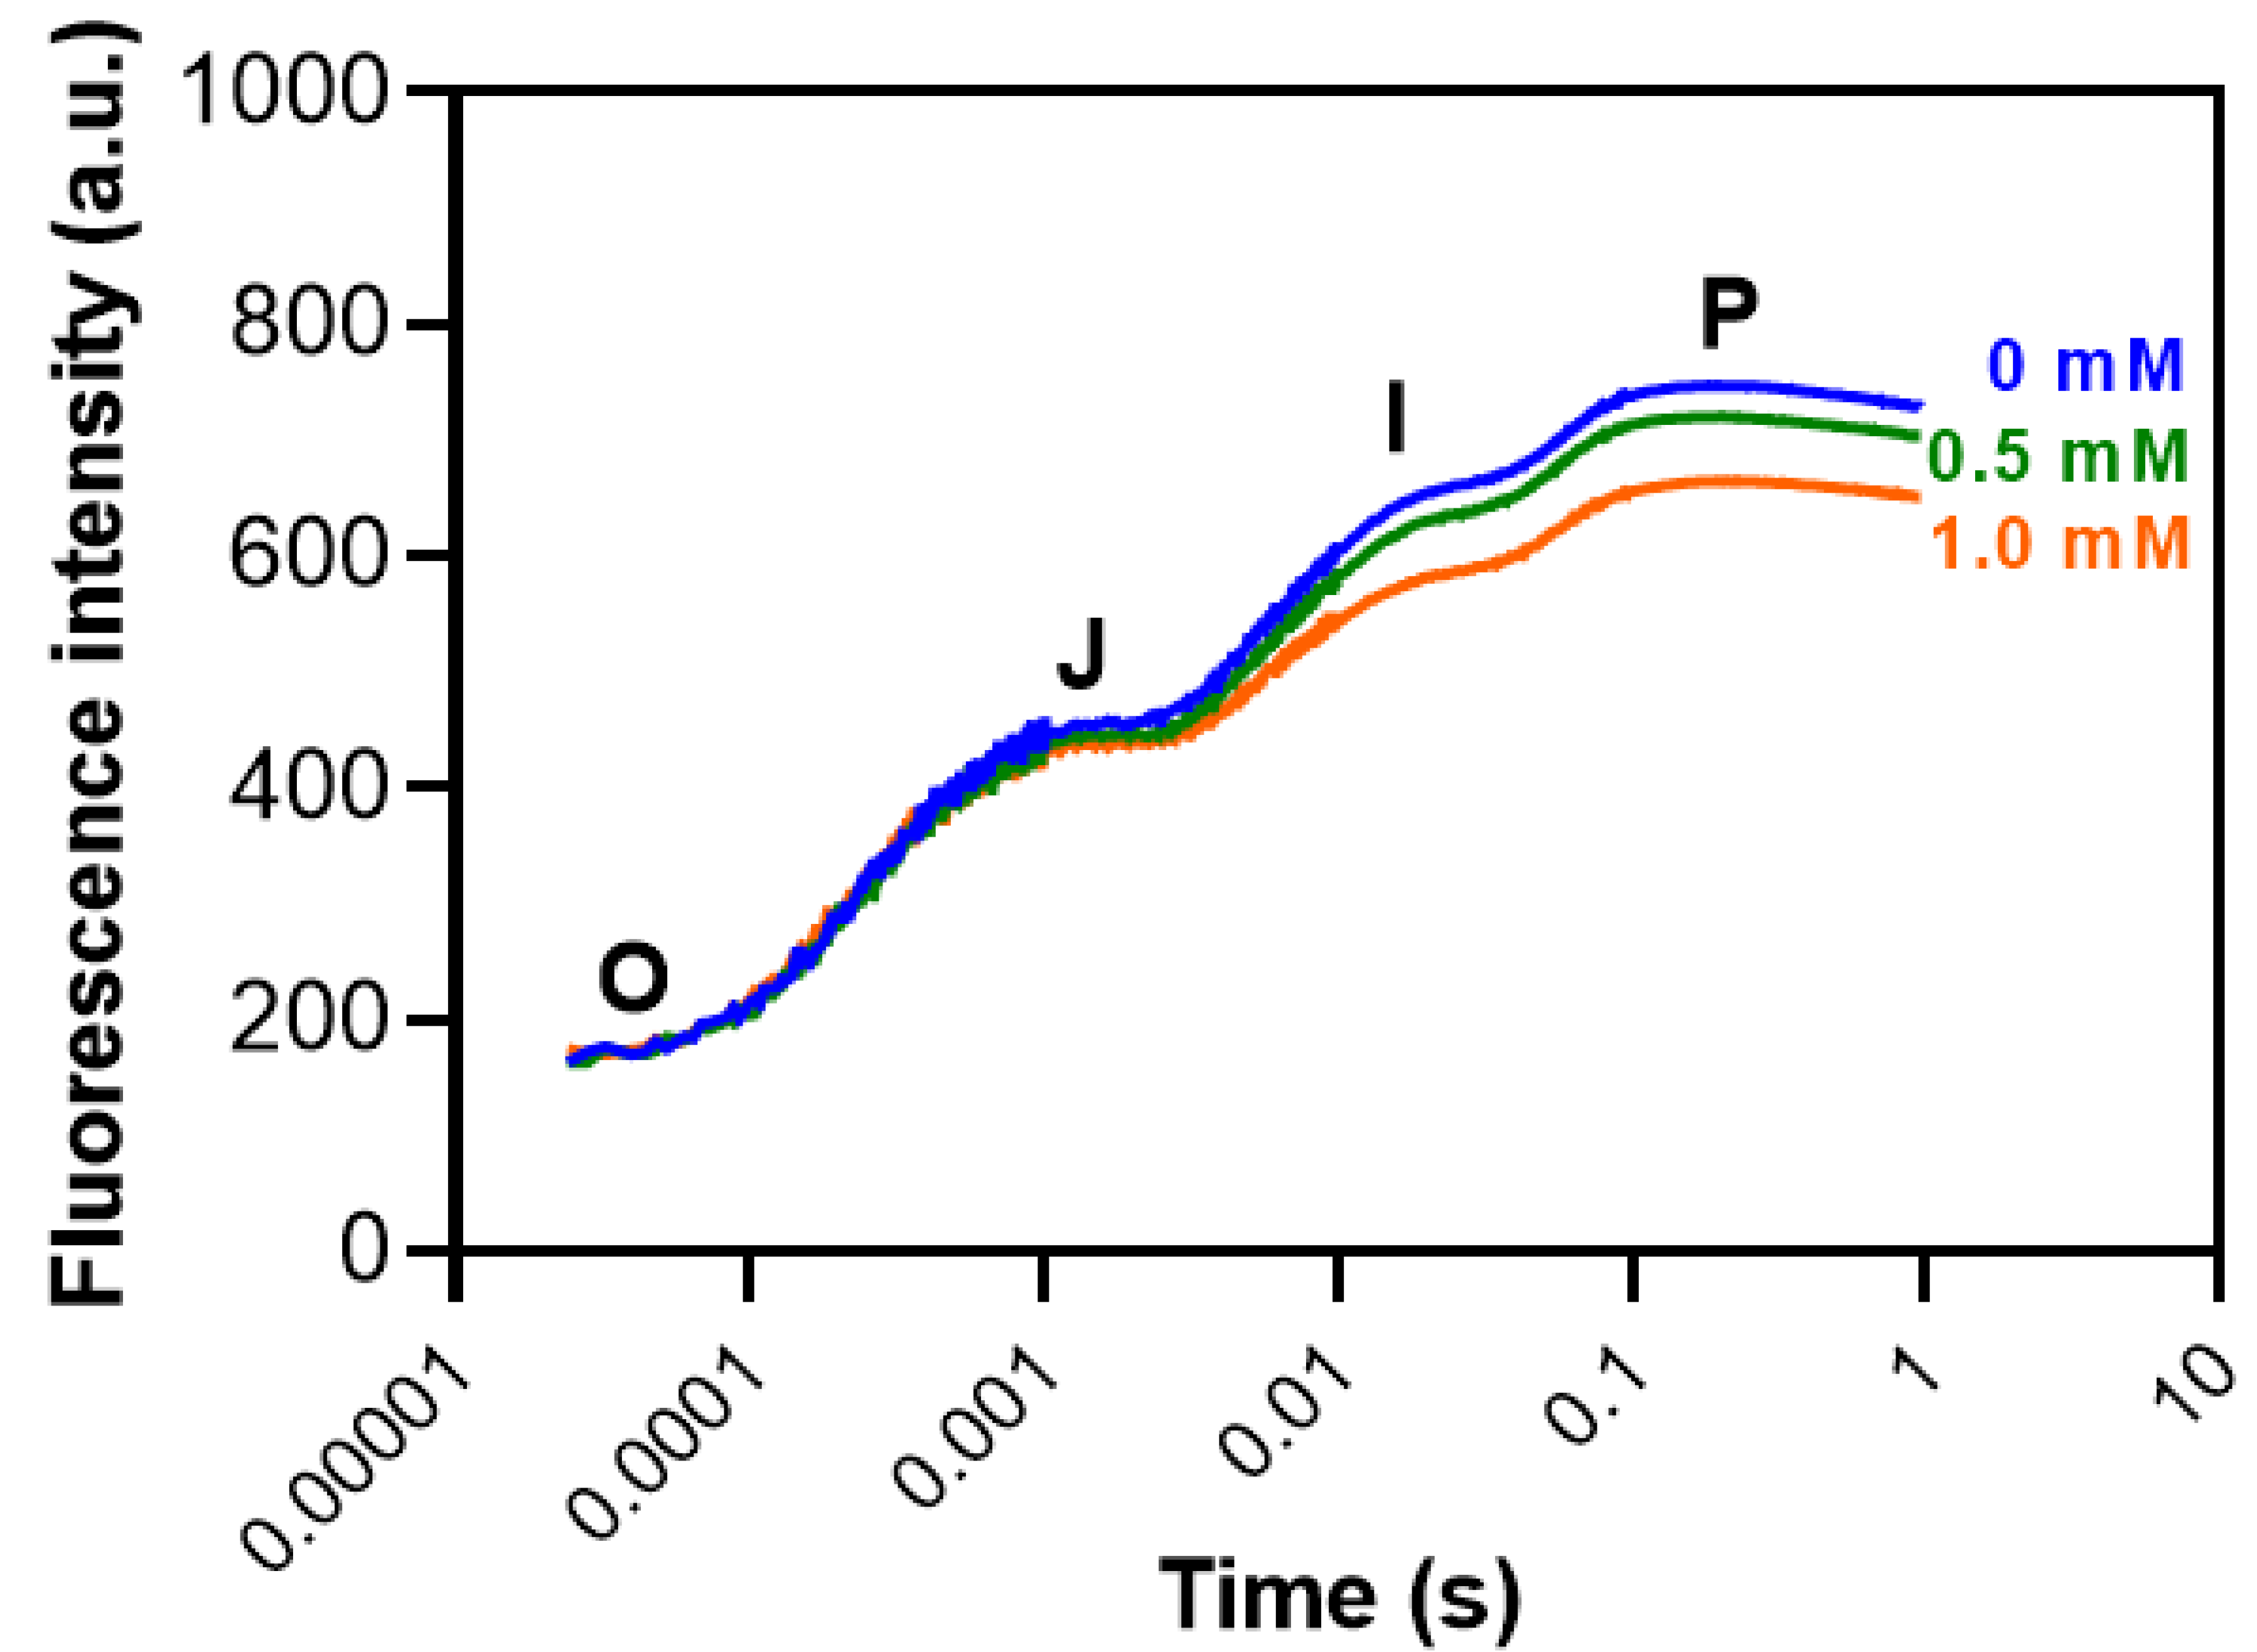
Figure 9.
Effects of 3-cyanobenzoic acid on specific energy flux parameters in hydroponically grown maize plants after 14 days of treatment. Parameters include: absorption flux per reaction center (ABS/RC), energy trapping per reaction center (TR0/RC), electron transport per reaction center (ET0/RC), energy dissipation per reaction center (DI0/RC), reaction center density per cross-sectional area (RC/CS), quantum yield of primary PSII photochemistry (TR0/ABS), efficiency with which a trapped electron is transferred from QA to QB (ET0/TR0), quantum yield of electron transport from QA to QB (ET0/ABS), and performance indices (PIABS and PITotal). Data are presented as means (n = 18 ± SEM).
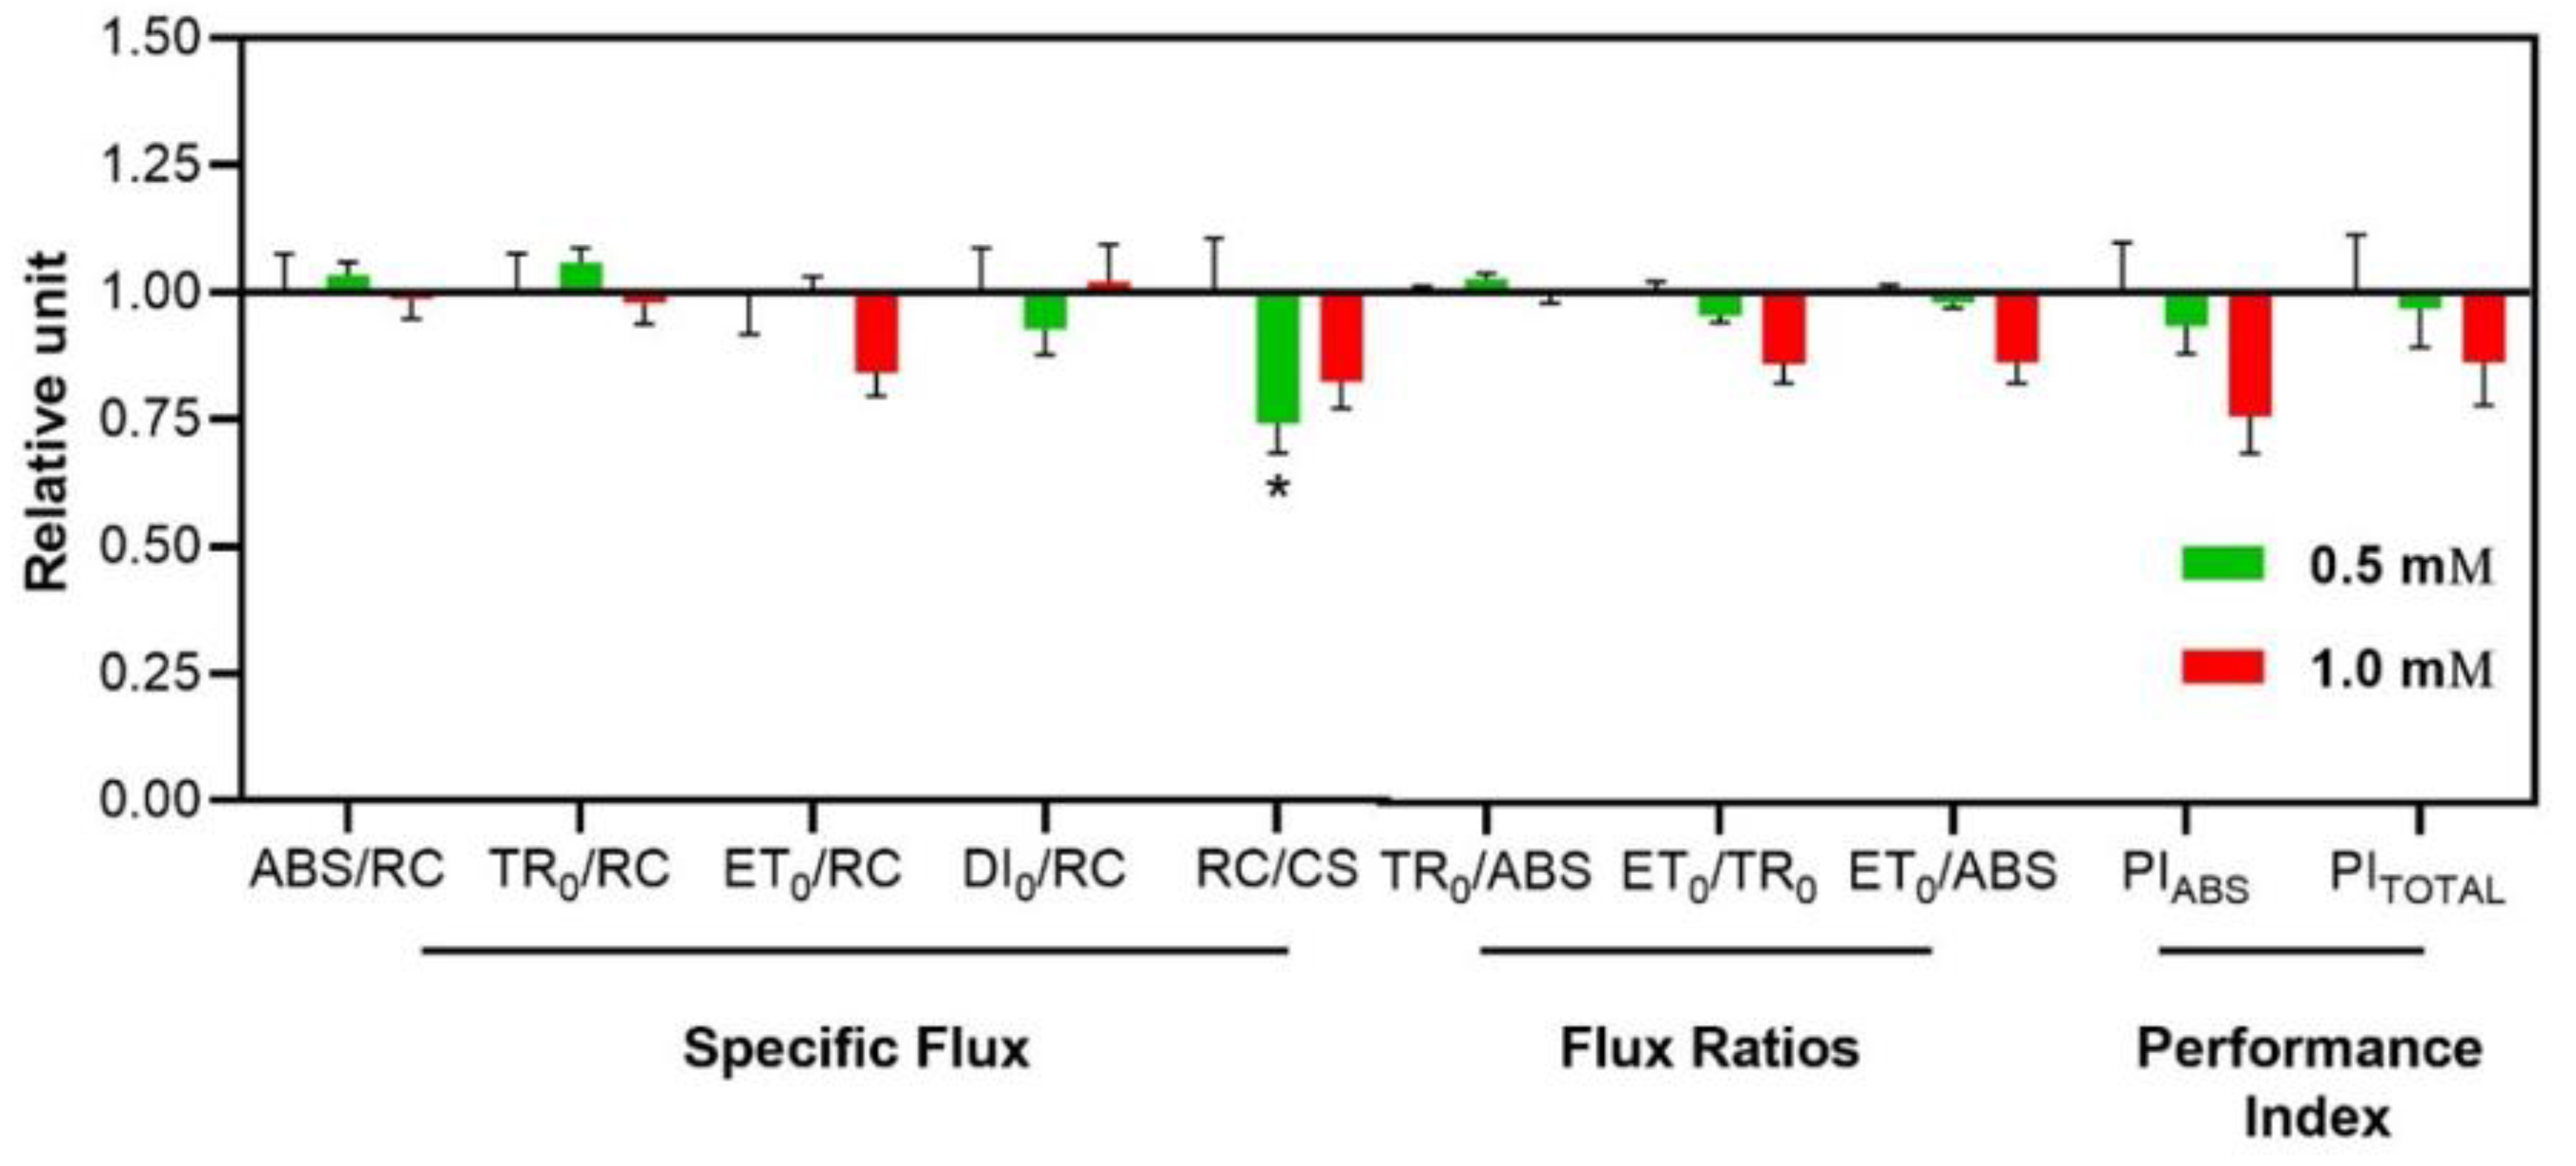

Table 1.
Effects of 3-cyanobenzoic acid on maize plant growth during a 14-day hydroponic cultivation period.
Table 1.
Effects of 3-cyanobenzoic acid on maize plant growth during a 14-day hydroponic cultivation period.
| 3-Cyanobenzoic acid (mM) | |||
|---|---|---|---|
| 0 | 0.5 | 1.0 | |
| Plant height (cm) | 9.51 ± 0.27 | 8.77 ± 0.26 | 7.57 ± 0.20** |
| Shoot fresh weight (g) | 1.11 ± 0.12 | 0.88 ± 0.06 | 0.60 ± 0.05** |
| Leaf area (cm2) | 38.0 ± 2.84 | 29.9 ± 1.71* | 22.0 ± 1.38** |
| Culm diameter (cm) | 3.34 ± 0.19 | 2.46 ± 0.08** | 2.17 ± 0.08** |
| Root length (cm) | 28.7 ± 1.77 | 15.4 ± 0.81** | 9.84 ± 0.47** |
| Root fresh weight (g) | 0.33 ± 0.04 | 0.25 ± 0.02 | 0.12 ± 0.01** |
Means values (n = 18 ± SEM) significantly different from the control are marked with * p ≤ 0.05, ** p ≤ 0.01, according to Dunnett's test.
Disclaimer/Publisher’s Note: The statements, opinions and data contained in all publications are solely those of the individual author(s) and contributor(s) and not of MDPI and/or the editor(s). MDPI and/or the editor(s) disclaim responsibility for any injury to people or property resulting from any ideas, methods, instructions or products referred to in the content. |
© 2024 by the authors. Licensee MDPI, Basel, Switzerland. This article is an open access article distributed under the terms and conditions of the Creative Commons Attribution (CC BY) license (http://creativecommons.org/licenses/by/4.0/).
Copyright: This open access article is published under a Creative Commons CC BY 4.0 license, which permit the free download, distribution, and reuse, provided that the author and preprint are cited in any reuse.


