
Submitted:
11 November 2024
Posted:
13 November 2024
You are already at the latest version
Abstract
The use of herbicides is one of the important factors affecting crop production. High concentrations of herbicides can cause damage not only to weeds but also to the crops by altering physiological processes in plant cells. When plants are exposed to herbicidal stress, they may resist stress by activating antioxidant defense responses or where antioxidant defense is not sufficient, stress resistance can be improved by treatment with various signaling molecules such as salicylic acid (SA). In this study, the effects of salicylic acid in improving the damage caused by the use of herbicide mesosulfuron-methyl + iodosulfuron-methyl in wheat plants is investigated. One day after treatment (DAT) no significant effects were observed by the application of herbicide and salicylic acid on minimal fluorescence (Fo). In general, the value of Fo was increased over time and significant differences between the treatments tested in this work were observed. More specifically, the highest amount of Fo was recorded at herbicide dose of 72 g a.i. ha-1 without salicylic acid 7 DAT, which was 28.48% higher of that recorded in untreated wheat plants. The lowest amount of maximum fluorescence (Fm) and the ratio between variable fluorescence over Fm (Fv/Fm) were recorded at 72 g a.i. ha-1 of herbicidal dose without salicylic acid, 5 DAT. More specifically, 0.5 and 1 mM of SA caused an increase of 9.48 % and 10.12 % in Fm value and 3.40% and 5.58% in Fv/m value, respectively. The content of chlorophyll α, chlorophyll b and total chlorophyll decreased under 36 and 72 g a.i. ha-1 of herbicidal dose in all sampling occasions. The use of SA increased chlorophyll a, chlorophyll b and total chlorophyll in all concentrations and sampling occasions. Likewise, the content of carotenoids was also increased at all stages due to SA presence. The highest content of carotenoids was recorded when the plants exposed at 72 g a.i. ha-1 and had been pre-treated with 1 mM salicylic acid 7 DAT. On the contrary, the lowest amount was obtained under the treatment without herbicide and salicylic acid 3 DAT.
Keywords:
Carotenoid
; Herbicide stress
; Photosynthesis
; Chlorophyll fluorescence
; Chlorophyll content
1. Introduction
Wheat is the third-largest crop, following rice and corn, in total world production [1]. Wheat accounts for 20% of the world’s food calories, with the primary uses being in bread production, foodstuffs, and livestock and fowl feed. Weeds are one of the most important constraints in wheat production as they reduce productivity through competition for resources, excretion of allelopathic substances, increases of harvest cost and also by serving as alternate host for various insects and fungi [2,3]. Several studies indicate that crop losses due to weed competition are greater than those resulting from combined effects of insects and diseases. Yield reduction by the presence of weeds in wheat is ranging between 10 to 65% [4].
Therefore, weed control is necessary to lessen weed-crop competition in favor of the latest, hence minimizing crop production loss. Various practices have been implemented to effectively control weeds such as mechanical, cultural and chemical methods. Chemical weed control, one of the most efficacious choices to fight weeds, is the application of the recommended herbicidal dose at appropriate time and weed growth stage [5,6,7]. Application of pre (PRE) and post (POST) emergence herbicides helps to manifest weed infestation at critical periods and ensure crop’s growth and reduction of yield losses [8,9,10].
Atlantis ® is a selective herbicide for wheat, which provides effective control of many grasses, sedges, and broadleaf weeds [11,12]. It is developed by Bayer (Crop Science, Germany) and consists of two active ingredients: Mesosulfuron-methyl and iodosulfuron-methyl-sodium, which both are inhibitors of acetolactate synthase (ALS) enzyme, that is involved in the biosynthesis of branched-chain amino acids (BCAAs) such as leucine, isoleucine, and valine. ALS-inhibitor herbicides cause phytotoxicity in plants through depletion of the BCAA pool, blocking of DNA synthesis, and blocking of photoassimilate translocation as well as disturbing anaerobic respiration [13]. Primarily, the destruction of chloroplasts and the incapability for photosynthesis is the main effects of the ALS-inhibiting herbicides [14,15,16,17].
In general, the efficacy of herbicides depends on several parameters, such as the herbicide's dosage and application timing [18]. When it is used excessively, especially on sensitive crops, it disrupts biochemical and physiological processes [19] by inhibiting seed germination, reducing shoot and root growth, accelerating oxidative stress [20] or disturbing photosynthetic rate [21]. In addition, some studies have reported that the application of herbicides has a negative influence on plant pigment content through the destruction of chloroplasts and thylakoids [22]. Lowered chlorophyll (a, b and total) contents are known to be responsible for the appearance of chlorosis and yellowing of leaves especially when plants are treated under unfavorable conditions [18].
Chlorophyll fluorescence is a powerful tool in agricultural, environmental, ecological research [23], and also in ecotoxicological studies [24]. Fo and Fv/Fm are critical parameters in assessing the photochemical efficiency of photosystem II (PSII) in photosynthetic organisms. Minimal fluorescence (Fo) represents the minimum fluorescence yield when PSII reaction centers are open (electron transport protein QA is fully oxidised), indicating the baseline level of fluorescence in the absence of any light-induced energy capture. In contrast, Fv/Fm is the ratio of variable fluorescence (Fv) to maximal fluorescence (Fm), reflecting the maximum photochemical efficiency of PSII under optimal conditions. This ratio is widely used to evaluate the health and stress responses of photosynthetic organisms, including corals and marine algae, particularly under environmental stressors like heat or nutrient limitation [25]. Chlorophyll fluorescence signal can be used as a probe for photosynthetic activity [26]. Plant protection treatments, including herbicides, can cause short-term stress in crops. In many cases, herbicidal preparations directly reduce photosynthetic activity or indirectly cause damage to plants, which in turn reduces the efficiency of photosynthesis. Herbicides that directly affect PS-II usually work by inhibiting the transport of electrons in PS-II [27]. Analysis of chlorophyll fluorescence parameters can yield important information on how herbicides interfere with photosystem I and II mechanisms [28,29].
Phytohormones contribute to all aspects of plant responses towards biotic and abiotic stimuli. As a stress-related signaling compound salicylic acid (SA), one of the primary growth regulators in plants, may directly or indirectly affect various metabolically and physiologically based processes [30,31], including photosynthesis [32] and elimination of reactive oxygen species (ROS) [33]. When it is applied exogenously, it may provide protection against various types of stressors; however, above a threshold concentration it may also cause damage [34] exhibit their toxicity through the inhibition of physiological processes in plants following their application. Weed management in most situations has become largely dependent on herbicides because of their high efficacy and relatively low cost compared with other weed-control technologies. However, many farmers apply higher than the recommended herbicide application rates to optimize weed control, inducing physiological changes on crop plants leading to stress reactions. This research was designed to monitor changes in photosynthesis through chlorophyll fluorescence, chlorophyll and carotenoids contents in response to mesosulfuron-methyl + iodosulfuron-methyl applied with or without salicylic acid pretreatment as a regulator to the stress caused by herbicide toxicity at different application rates on wheat leaves.
2. Materials and Methods
2.1. Study Site and Experimental Treatments
A greenhouse study was carried out at the University of Mohaghegh Ardabili, Ardabil city (latitude: 38°12′39″ N, longitude: 48°17′36″ E, altitude: 1377 m a.s.l.), Iran, during 2019–2021. The experiment followed a completely randomized design, with a factorial arrangement using four replicates per treatment. The two treatment factors consisting of (i) SA pre-treatment as a foliar application (0.5 and 1 mM SA solution and a water spray as a control treatment) and (ii) application of different rates of mesosulfuron-methyl + iodosulfuron-methyl (i.e., 4.5, 9, 18, 36, 72 g active ingredient (ai) ha−1 and no application as a control). These herbicide rates were chosen to simulate a full application rate spectrum with rates below and above the recommended dose of 18 g ai ha−1. The herbicide mesosulfuron-methyl + iodosulfuron-methyl (Atlantis OD, 10 g L−1 mesosulfuron-methyl + 2 g L−1 iodosulfuron-methyl + 30 g L−1 mefenpyr-diethyl) was obtained from Bayer CropScience, Persian AG, Tehran, Iran, and SA (Merck-818731, Darm-stadt, Germany) was obtained from Asia Pajoohesh Company, Amol, Iran. Soil collected from an agricultural field, without any pesticide or herbicide application for over a decade, was filled into plastic pots (16 × 15 cm in diameter and height respectively). The seeds of the wheat cultivar Gaskogen's were surface sterilized by soaking them in a 5% sodium hypochlorite solution for 10 minutes before rinsing them with distilled water. The seeds were then placed on moist filter paper in the dark at a temperature of 4 °C for pre-germination before sowning six seeds/pot. Upon germination, six plants per pot were allowed to grow under controlled conditions with alternating day/night temperatures (22 ± 1 °C/15 ± 1 °C) and photoperiod (16/8; light/dark). Regular manual irrigation was supplied to the pots as needed. Using a CO2− pressurized backpack sprayer with 8002v flat fan nozzles, the herbicide was applied on wheat plants at 3 to 4 leaf stage (Zadock Stage 13-14), delivering a spray volume of 150 L ha−1 at 300 kPa pressure. SA was foliar applied using a simple atomizer spray bottle three days prior to herbicide application until the leaf surface was completely wet. Plants were irrigated well 24 h before the SA application, and a light irrigation was given again 24 hours before the herbicide application. After the herbicide application, the standard irrigation routine was reinstated 48 hours later.
Sampling Methodology
To amass adequate leaf tissue samples (2 g fresh weight per sample), multiple leaves were chosen at random from six plants in each pot. The collection was executed 1, 3, 5, and 7 days following herbicide application. After the procurement, the samples were preserved at −80 °C for pigment content evaluation. The sampling dates were chosen based on activity time of the herbicide mesosulfuron-methyl + iodosulfuron-methyl.
2.2. Chlorophyll a Fluorescence
Chlorophyll a fluorescence (ChlF) measurement was conducted using a OS-30p+ portable chlorophyll fluorometer (Opti-Sciences, USA). It was conducted on the leaves kept in darkness using a leaf clip for 30 min at room temperature (25 °C). Then subjected to saturated white light to evaluate the minimum (Fo) and maximum (Fm) fluorescence and the quantum efficacy of the photosystem II (Fv/Fm). The measurements were performed on the fully mature leaves at 1, 3, 5, and 7 days after herbicide application.
2.3. Chlorophyll and Carotenoids Content
The Lichtenthaler, method (1983) was used for the determination of chlorophyll a, b, (a+b) and carotenoids content. About 30 mg of fresh leaf material was ground in a pre-cooled pestle and mortar using 5 mL of 80% (v/v) acetone. The homogenate was centrifuged at 5000× g for 10 minutes. To compensate for possible losses through evaporation, the resulting supernatants were diluted to 5 mL with 80% acetone. The absorbance was monitored at the wavelengths of 460, 645, and 663 nm using a UV-visible spectrophotometer. Finally, the chlorophyll and carotenoid contents were calculated in terms of mg/g fresh weight.
2.4. Statistical Analysis
Results of the dependent variables reported in this study are the means of four replicates for each treatment with ± standard deviation. The differences between the mean values of different herbicide rates and of each rate of herbicide under different concentrations of SA were determined according to the Duncan’s and Independent Samples t-tests, respectively, using the software SPSS 18.0 (SPSS Inc., Chicago, IL, USA).
3. Results
3.1. Chlorophyll a Content
The results of the average comparison of different rates of herbicide without considering the effect of SA (Figure 1) showed that the amount of chlorophyll a decreased with increase of herbicide dose especially at 36 and 72 g ai ha-1 in all sampling dates. However, SA increased chlorophyll a content in some herbicide dosages and sampling dates. The highest level of chlorophyll a (2.360 mg g-1 fresh weight) obtained in 4.5 g ai ha-1 and pre-treatment with 1 mM SA at 1 DAT and the lowest level (1.33 mg g-1 fresh weight) obtained in 72 g ai ha-1 without spraying SA at 7 DAT.
3.2. Chlorophyll b Content
Means comparison at different rates of herbicide without using SA (Figure 2) showed that chlorophyll b content was reduced by herbicide application in all instances especially when plants treated with 36 and 72 g ai ha-1 in all sampling dates, especially at 7 DAT. The use of SA increased the chlorophyll b content independently of the herbicide dose or sampling date. The highest amount (0.938 mg g-1 fresh weight) was recorded under the treatment of 4.5 g ai ha-1 and pre-treatment with 0.5 mM SA 5 DAT, whereas the lowest amount (0.324 mg g-1 fresh weight) in herbicide rate of 72 g ai ha-1, 7 DAT.
3.3. Total Chlorophyll
The results of means comparison at different concentrations of herbicide without using SA (Figure 3) showed that the amount of total chlorophyll was reduced especially in 36 and 72 g ai ha-1 in all sampling dates. On the contrary, the use of SA increased the amount of total chlorophyll in some dosages and sampling dates. The highest amount (3.090 mg g-1 fresh weight) was obtained under the treatment without herbicide and pre-treatment with 1 mM SA 3 DAT, and the lowest amount (1.655 mg g-1 fresh weight) was obtained in herbicide application rate of 72 g ai ha-1, 7 DAT.
3.4. Carotenoid Content
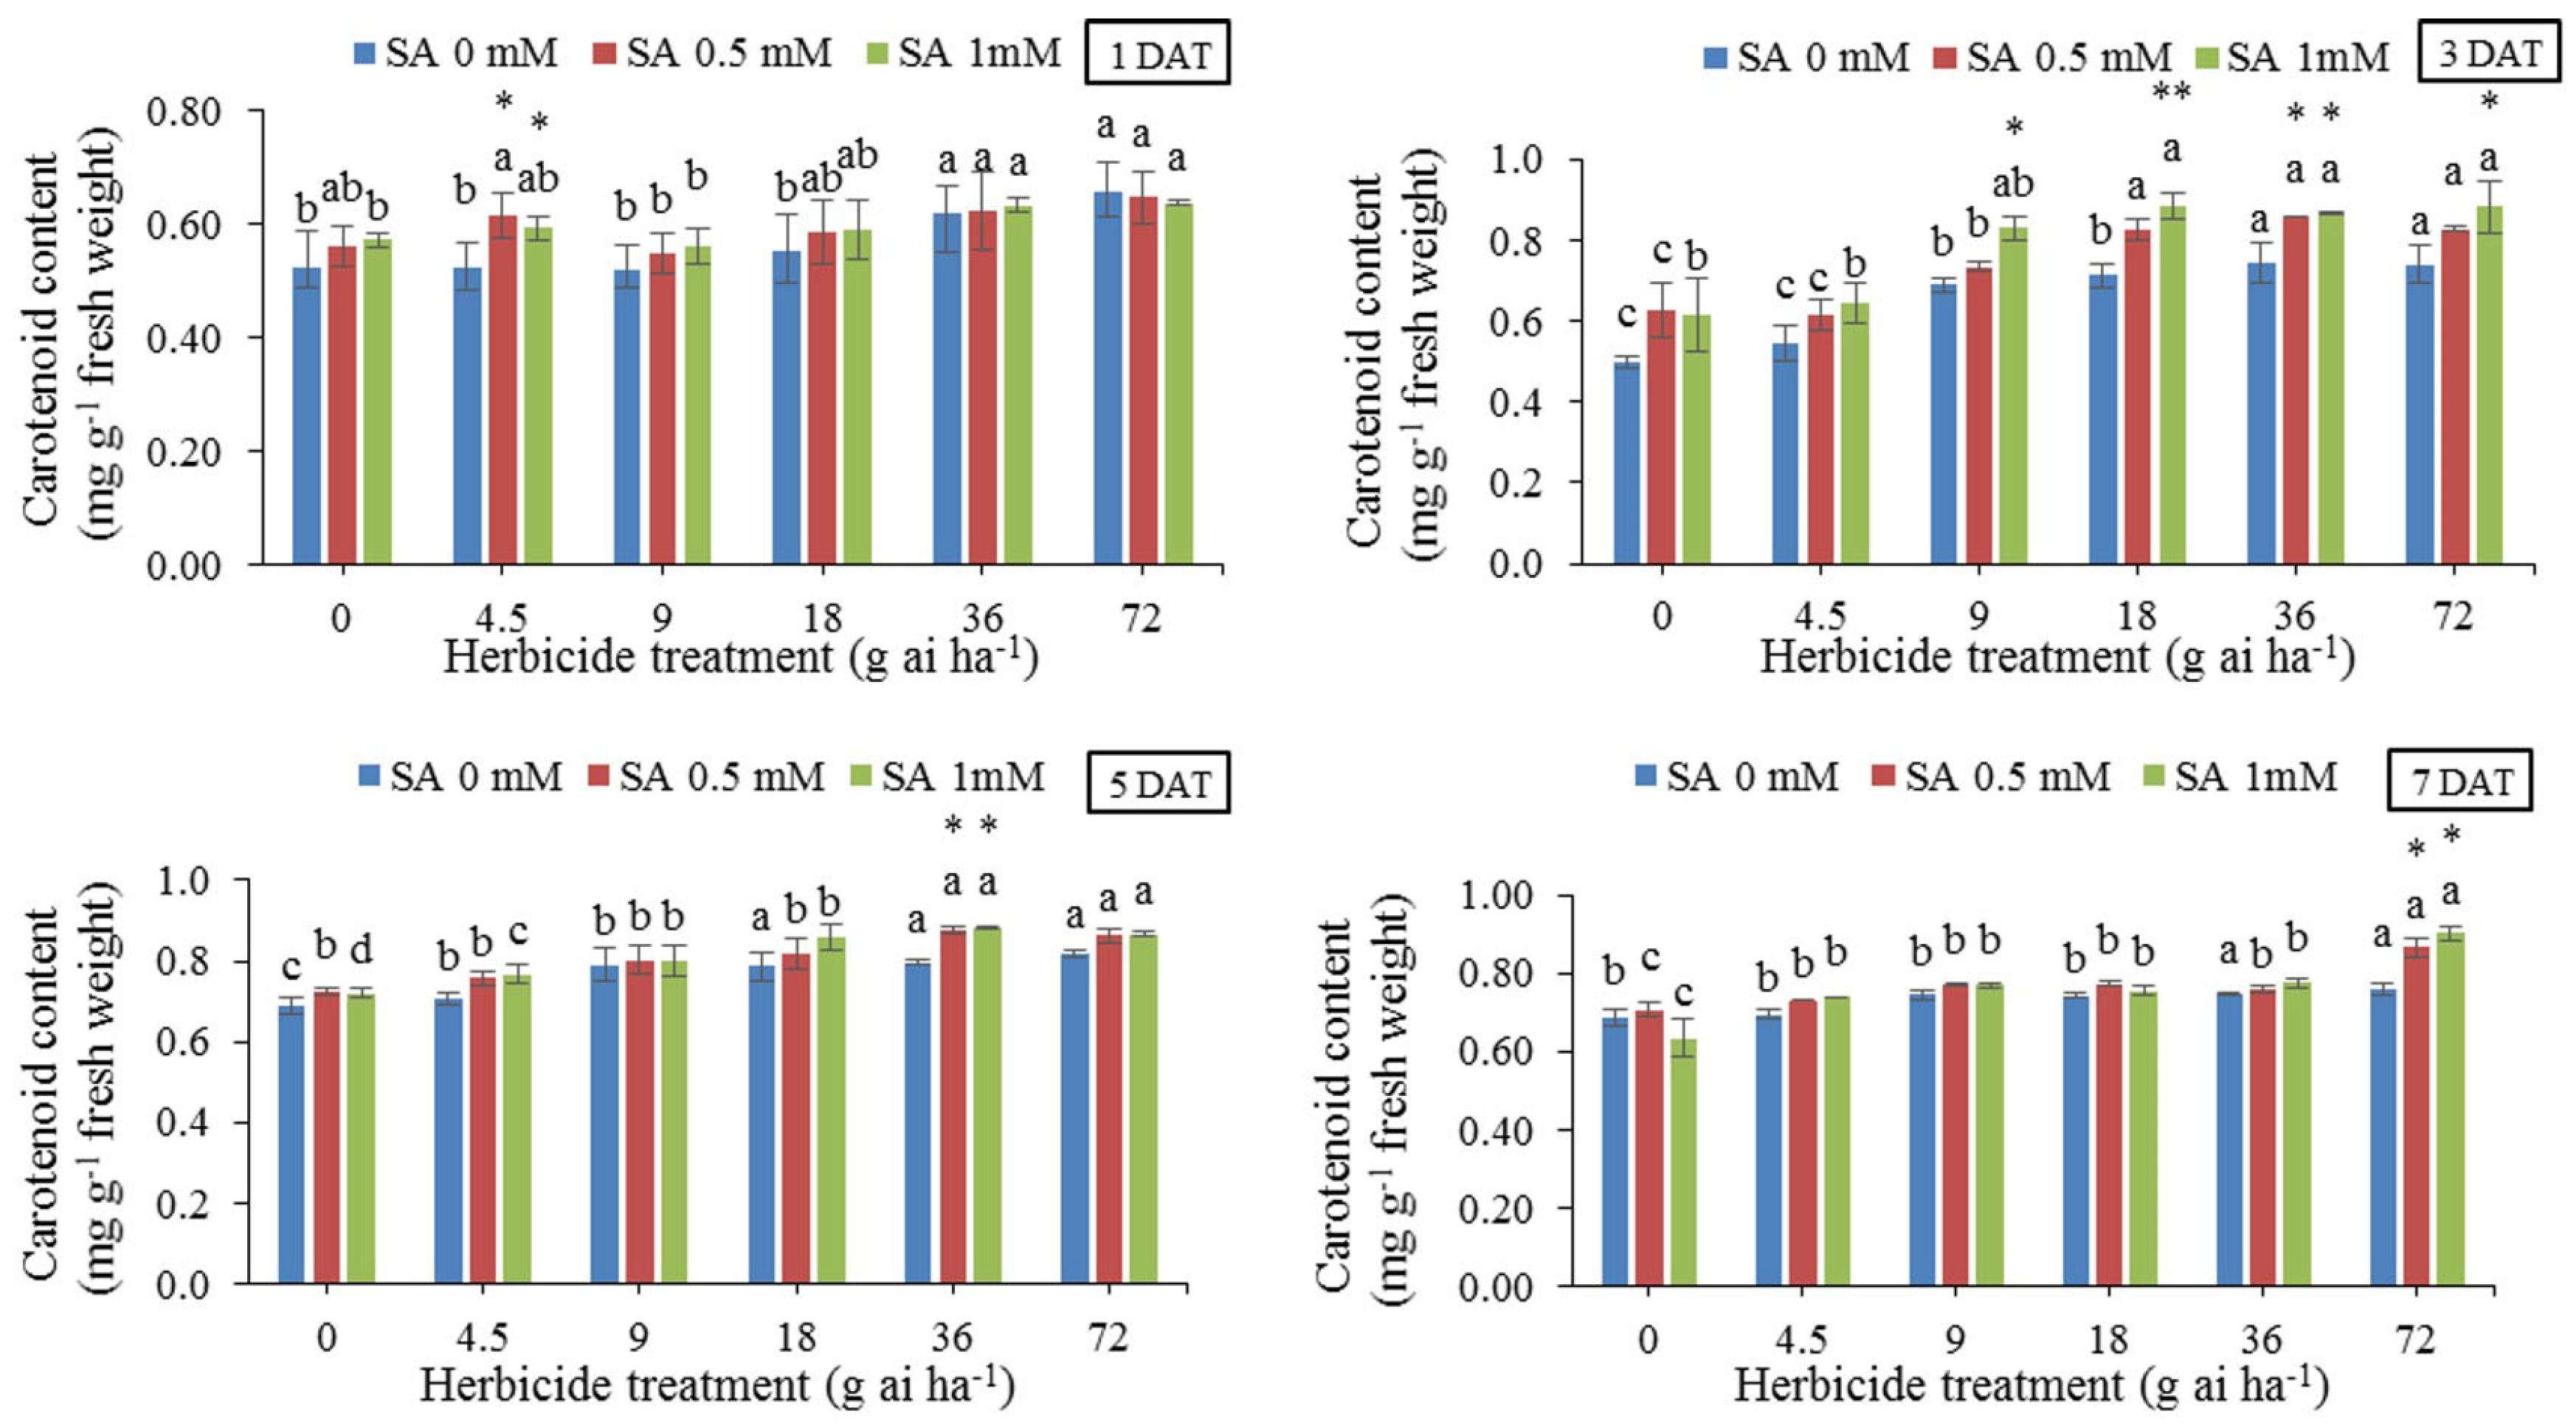
The results of means comparison at different concentrations of herbicide without the use of SA (Figure 4) showed that the carotenoid content increased in all sampling occasions. The use of SA increased the amount of carotenoid in almost all concentrations and stages. The highest content (0.901 mg g-1 fresh weight) was obtained in 72 g ai ha-1 and pre-treatment with 1 mM SA at 7 DAT, and the lowest content (0.501 mg g-1 fresh weight) was obtained under the treatment without herbicide and salicylic acid 3 DAT. The application of SA increased carotenoid content by 23% compared to the untreated control without SA at 7 DAT.
3.5. Minimal Fluorescence (Fo)
The amount of minimal fluorescence (Fo) in all herbicide treatments without SA spraying had a relatively similar increasing trend at third, fifth and seventh days. On the first day, herbicide and SA treatments did not have a significant effect on the Fo, in some herbicide concentrations, salicylic acid caused a significant decrease in the amount of Fo. Over time, the minimal fluorescence values increased progressively and Fo differences between the treatments became distinctively significant. In particular, the highest value of Fo, i.e., 251 was recorded at 72 g of herbicide ai ha-1 without the use of SA at 7 DAT, which was 28.48% higher than the treatment without herbicide and SA. While pretreatment with 0.5 and 1 mM SA decreased Fo value by 2.78 and 5.57%, respectively. The greatest effect of salicylic acid on Fo was observed 3 and 5 DAT. 5 DAT, pretreatment with 1 mM SA before the application of 72 g ai h-1 reduced by 14%.
3.6. Maximal Fluorescence (Fm)
Results showed that there was no significant difference in the maximal fluorescence (Fm) in the first day after treatment between herbicide treatments and SA concentration. However, from the third day onwards, there were changes in the Fm recordings. The highest values of Fm, i.e., 1048 and 1061 were recorded, in the treatment without herbicide whit 0.5 and 1 mM SA at 3 DAT respectively. The lowest amount i.e., 605.75 was in herbicide application rate of 72 g ai h-1 without SA, 5 DAT, which was 30.65% higher than the treatment without herbicide and SA. For the application rate of 72 g ai h-1, Fm was 605.75, whereas applying 0.5 and 1 mM SA increased its amount by 9.48 and 10.12%, respectively.
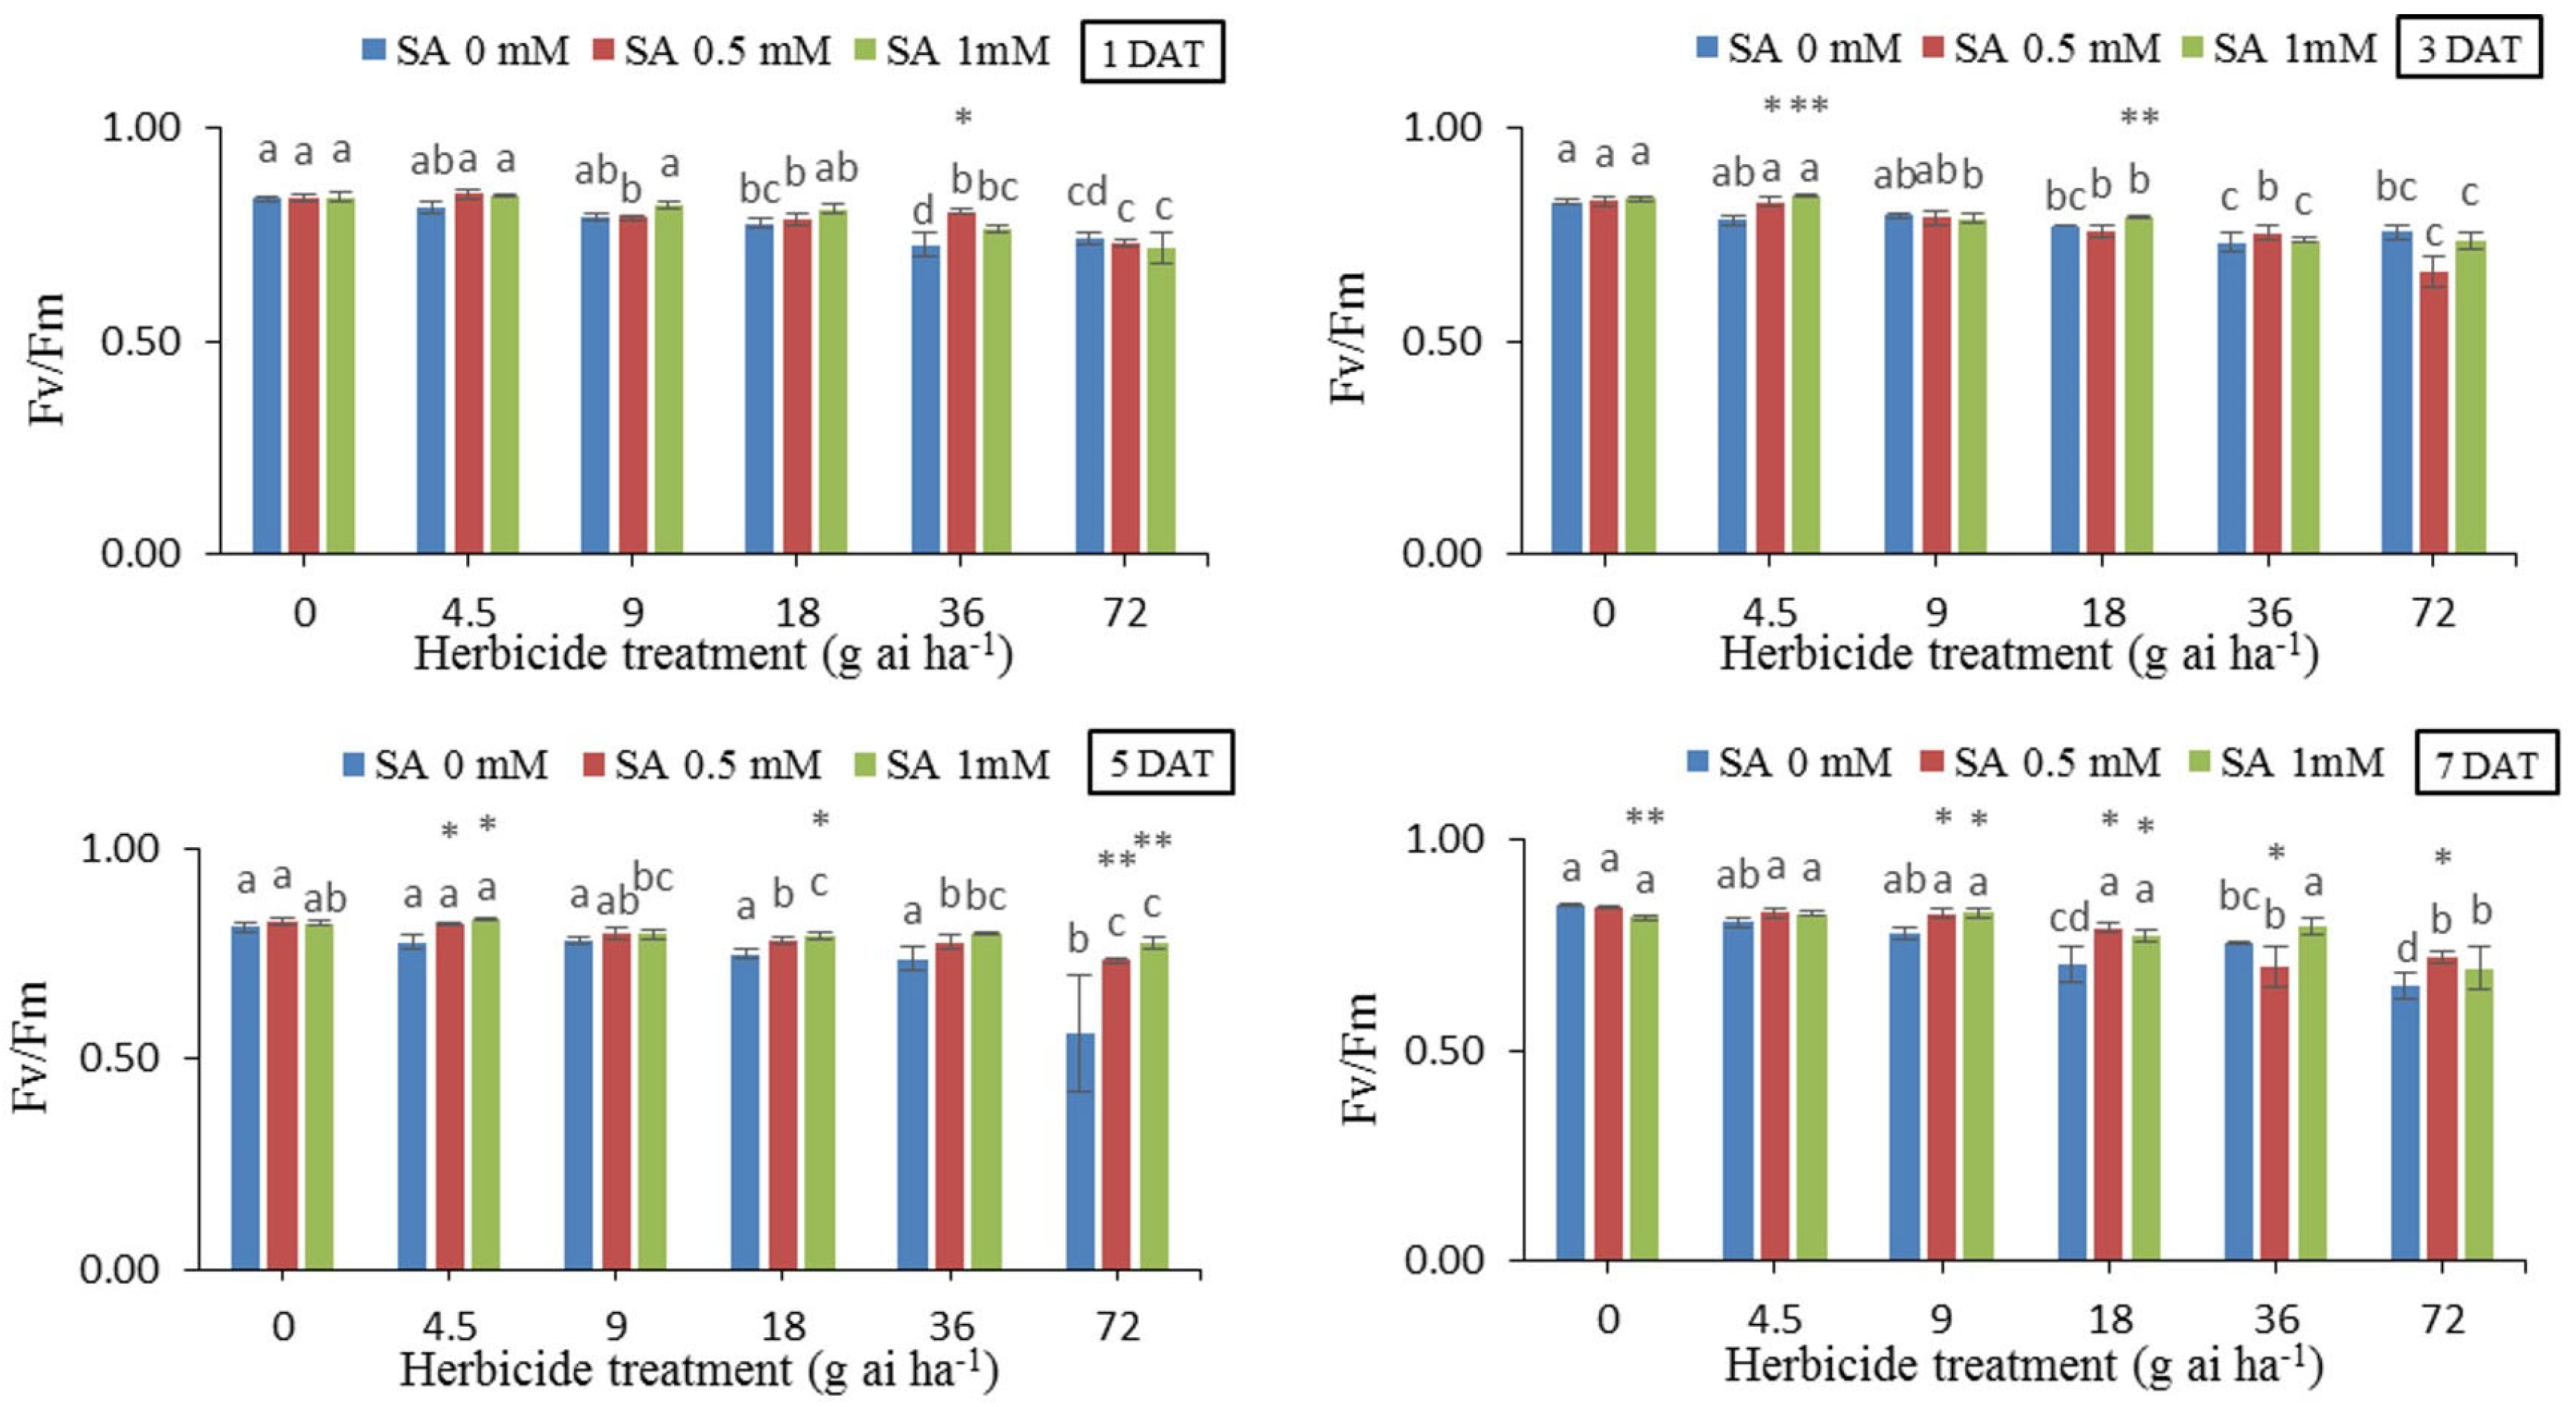
3.7. Quantum Performance (Fv/Fm)
Changes in quantum performance (Fv/Fm) (Figure 7) revealed a downward trend in all herbicide treatments without SA use in all sampling occasions, so that the decrease in quantum performance in 36 and 72 g ai h-1 application rates were recorded at maximum values compared to other herbicide application rates. The lowest values of quantum performance (0.562) were in 72 g ai h-1 without SA at 5 DAT, which showed a 30% decrease compared to the untreated controls (without herbicide and SA application). Quantum performance at 72 g ai h-1, recorded at 0.562 whereas SA applications at 0.5 and 1 mM increased Fv/Fm ratio by 23% and 27%, respectively.
4. Discussion
High concentrations of herbicides have been reported to damage not only weeds but also crops through alterations of metabolic and physiological processes in plant cells [35]. Induction of oxidative stress is one of the known effects of herbicides [36]. According to Caverzan [19], members of the ALS-inhibiting herbicides can also cause the production of oxygen free radicals (ROS) as a result of oxidative stress. In addition, ROS accumulation is known as the main cause of oxidative stress and subsequent damage to cells and cell organelles in plants [37]. In our previous article [38], the results showed that the amount of antioxidant enzymes, proline, malondialdehyde and hydrogen peroxide changed as a result of the use of doses higher than the recommended dose, and the use of salicylic acid to some extent improved the level of stress.
Barbagallo et al., [39] reported that fluorescence induction parameters can also be used to determine the metabolism of some herbicides that are not directly effective on photosynthesis. Sulfonylurea herbicides may also damage the photosynthetic apparatus [40] because plant ALS proteins are located in plastids and chloroplasts [41]. Consequently, the application of tribenuron methyl affected the rate of photosynthesis and chlorophyll content [15].
Exposure of rice to the herbicide imazathapyr damaged lipid membranes and affected the expression of genes involved in photosynthesis and sugar metabolism [14,17]. The results of Sun et al., [17] showed that in plants treated with imazathapyr, the PSII system was severely damaged, and the expression of many genes related to photosynthesis decreased. It seems that the destruction of chloroplasts and the inability to photosynthesize are the main effects of tribneurone methyl and other ALS inhibitors [14,16,17]. Research has shown that many inhibitors of metabolic activity do not only directly affect photosynthesis processes, but they can cause changes in chlorophyll fluorescence [42,43]. Parameters such as Fm, Fv/Fm are known as representative chlorophyll fluorescence parameters for investigating the effects of herbicides with different modes of action [21].
In this research, the parameters related to chlorophyll fluorescence were affected in wheat. Hence, Fm and Fv/Fm parameters decreased, and Fo enhanced by increasing herbicide dosages from the recommended concentration (Figure 5, Figure 6 and Figure 7). Exogenous SA treatment had positive effect on increasing adaptation ability of wheat against unsuitable conditions. Also due to the fact that wheat has the ability to metabolize herbicide and, using SA can partially cause recovery in wheat.
Figure 5.
Changes in Fo in the leaf tissues of wheat at 1, 3, 5, and 7 DAT at different herbicide application rates. Vertical bars represent the mean ± SD (n = 4). Bars with different letters are significantly (p ±0.05) different according to the Duncan’s test. Asterisks indicate significant differences between herbicide application alone and herbicide with each concentration of SA, based on Independent Samples t-test.
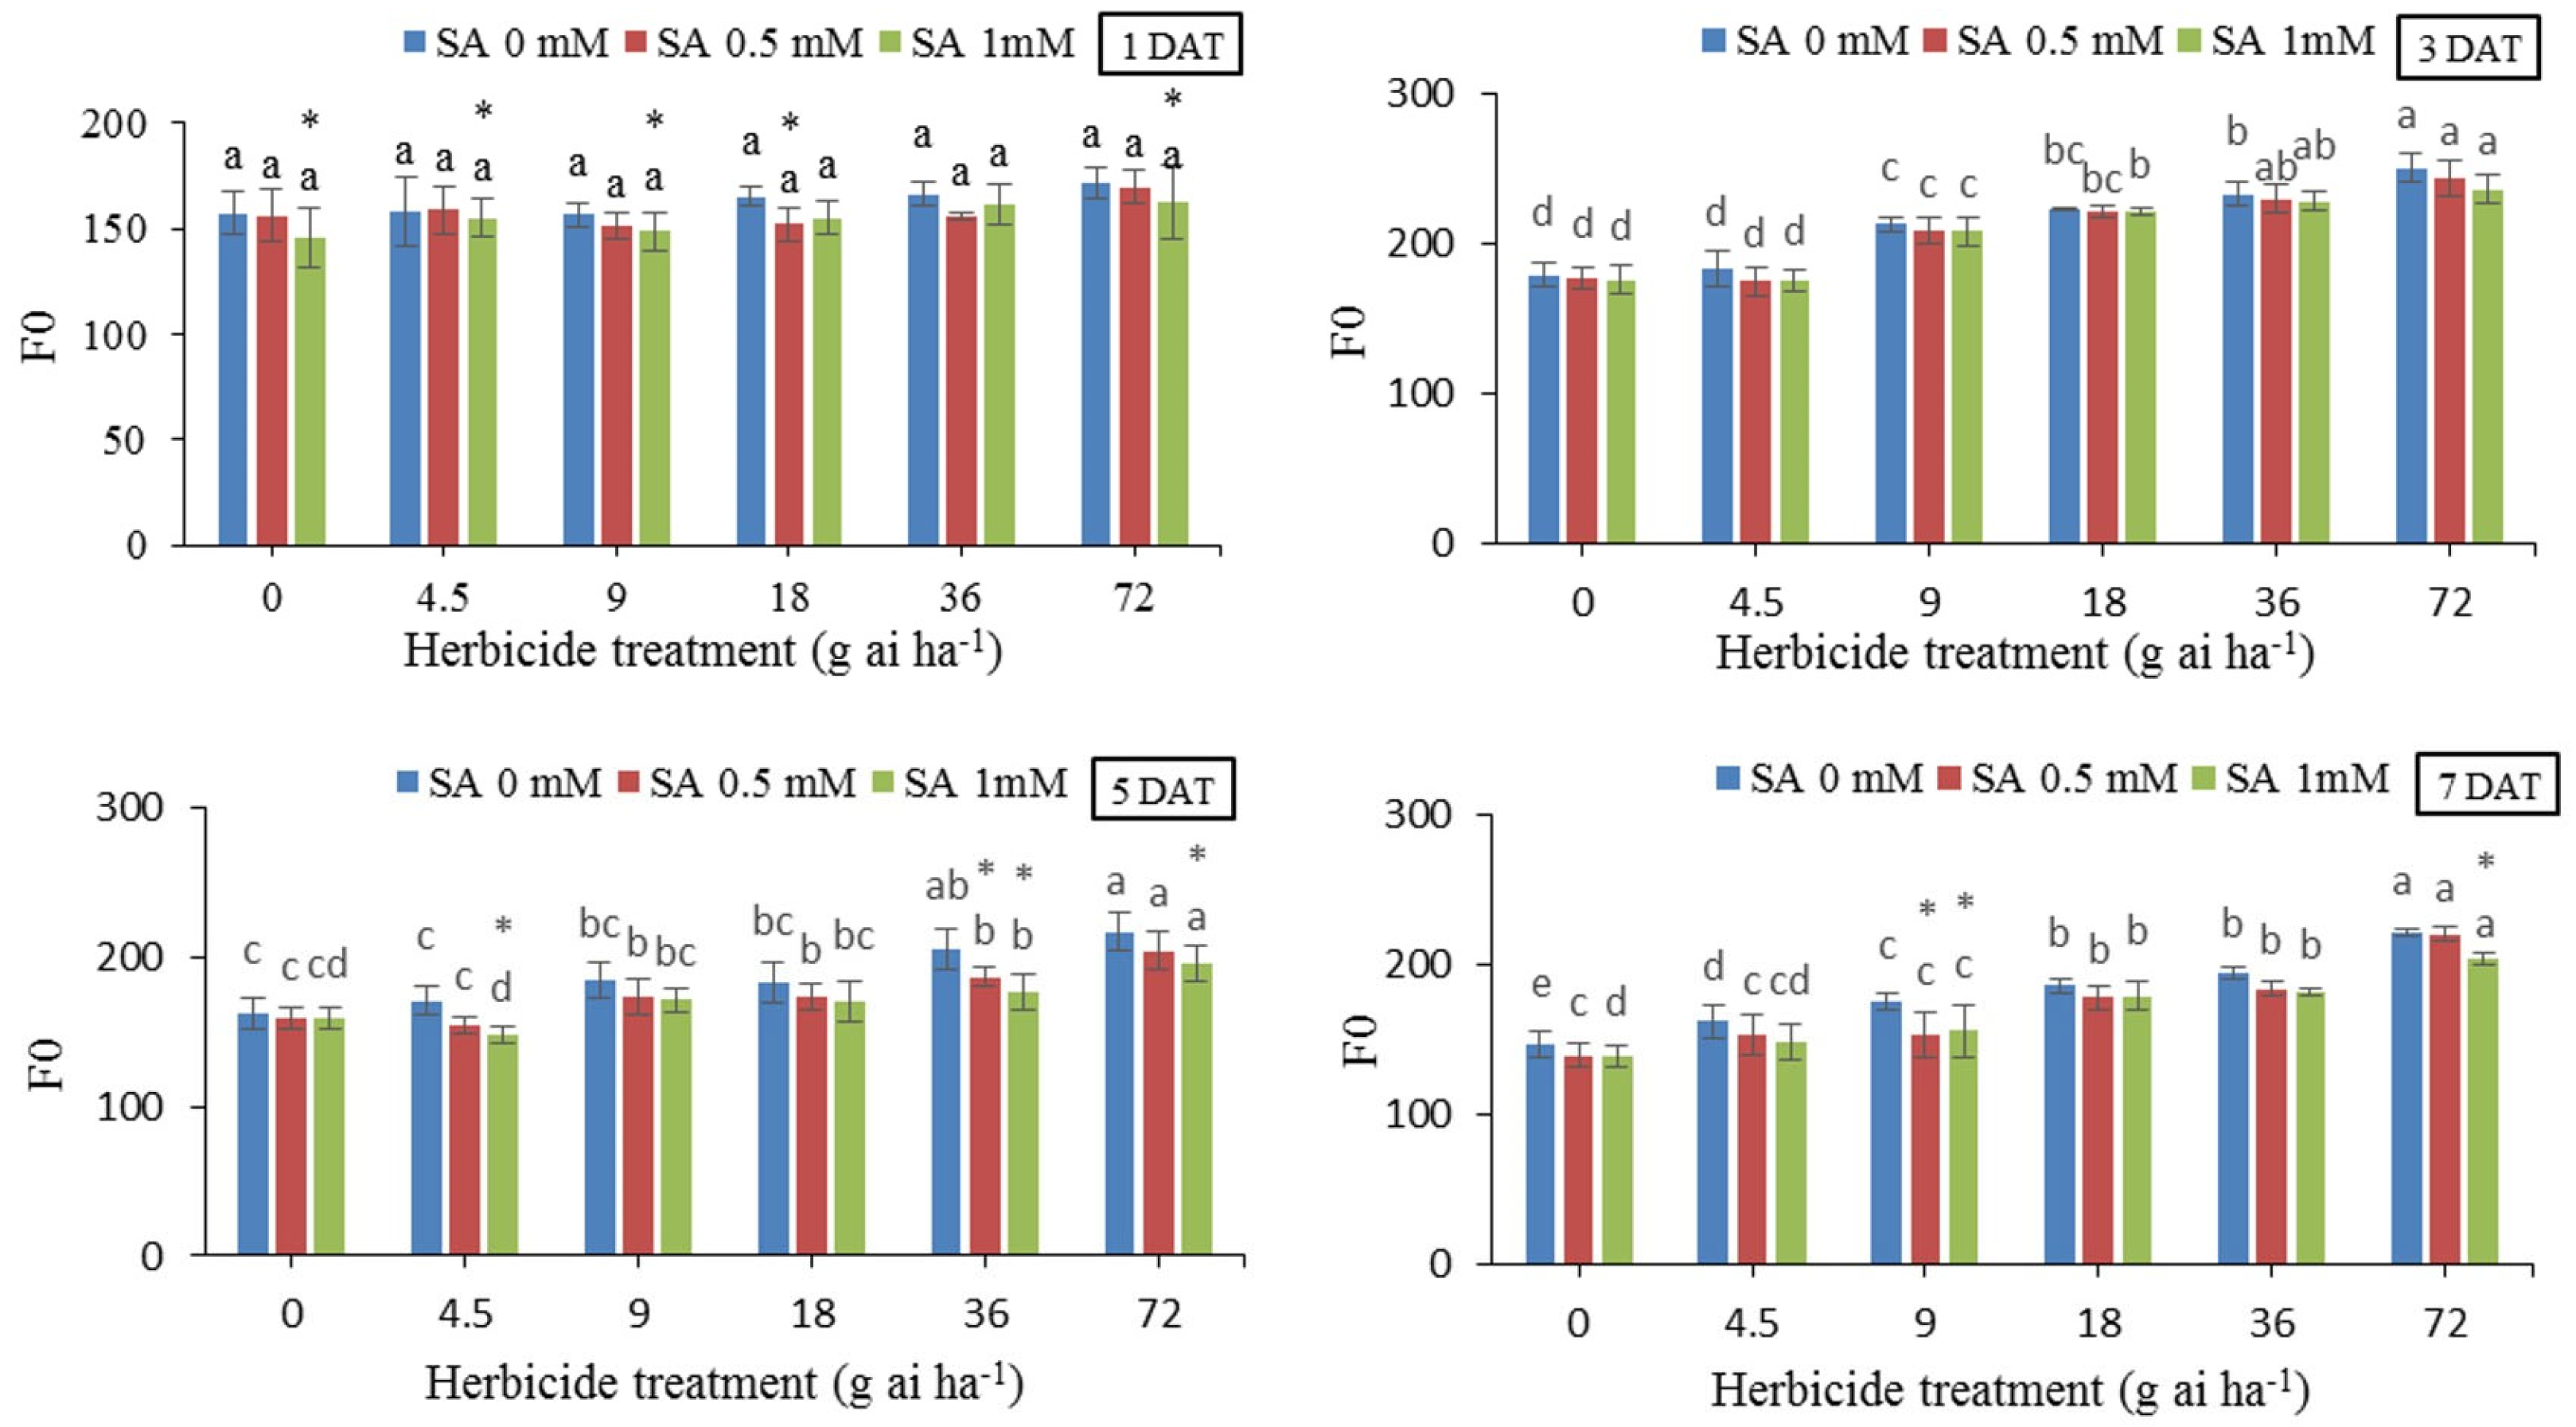
Figure 6.
Changes in Fm in the leaf tissues of wheat at 1, 3, 5, and 7 DAT at different herbicide application rates. Vertical bars represent the mean ± SD (n = 4). Bars with different letters are significantly (p ±0.05) different according to the Duncan’s test. Asterisks indicate significant differences between herbicide application alone and herbicide with each concentration of SA, based on Independent Samples t-test.
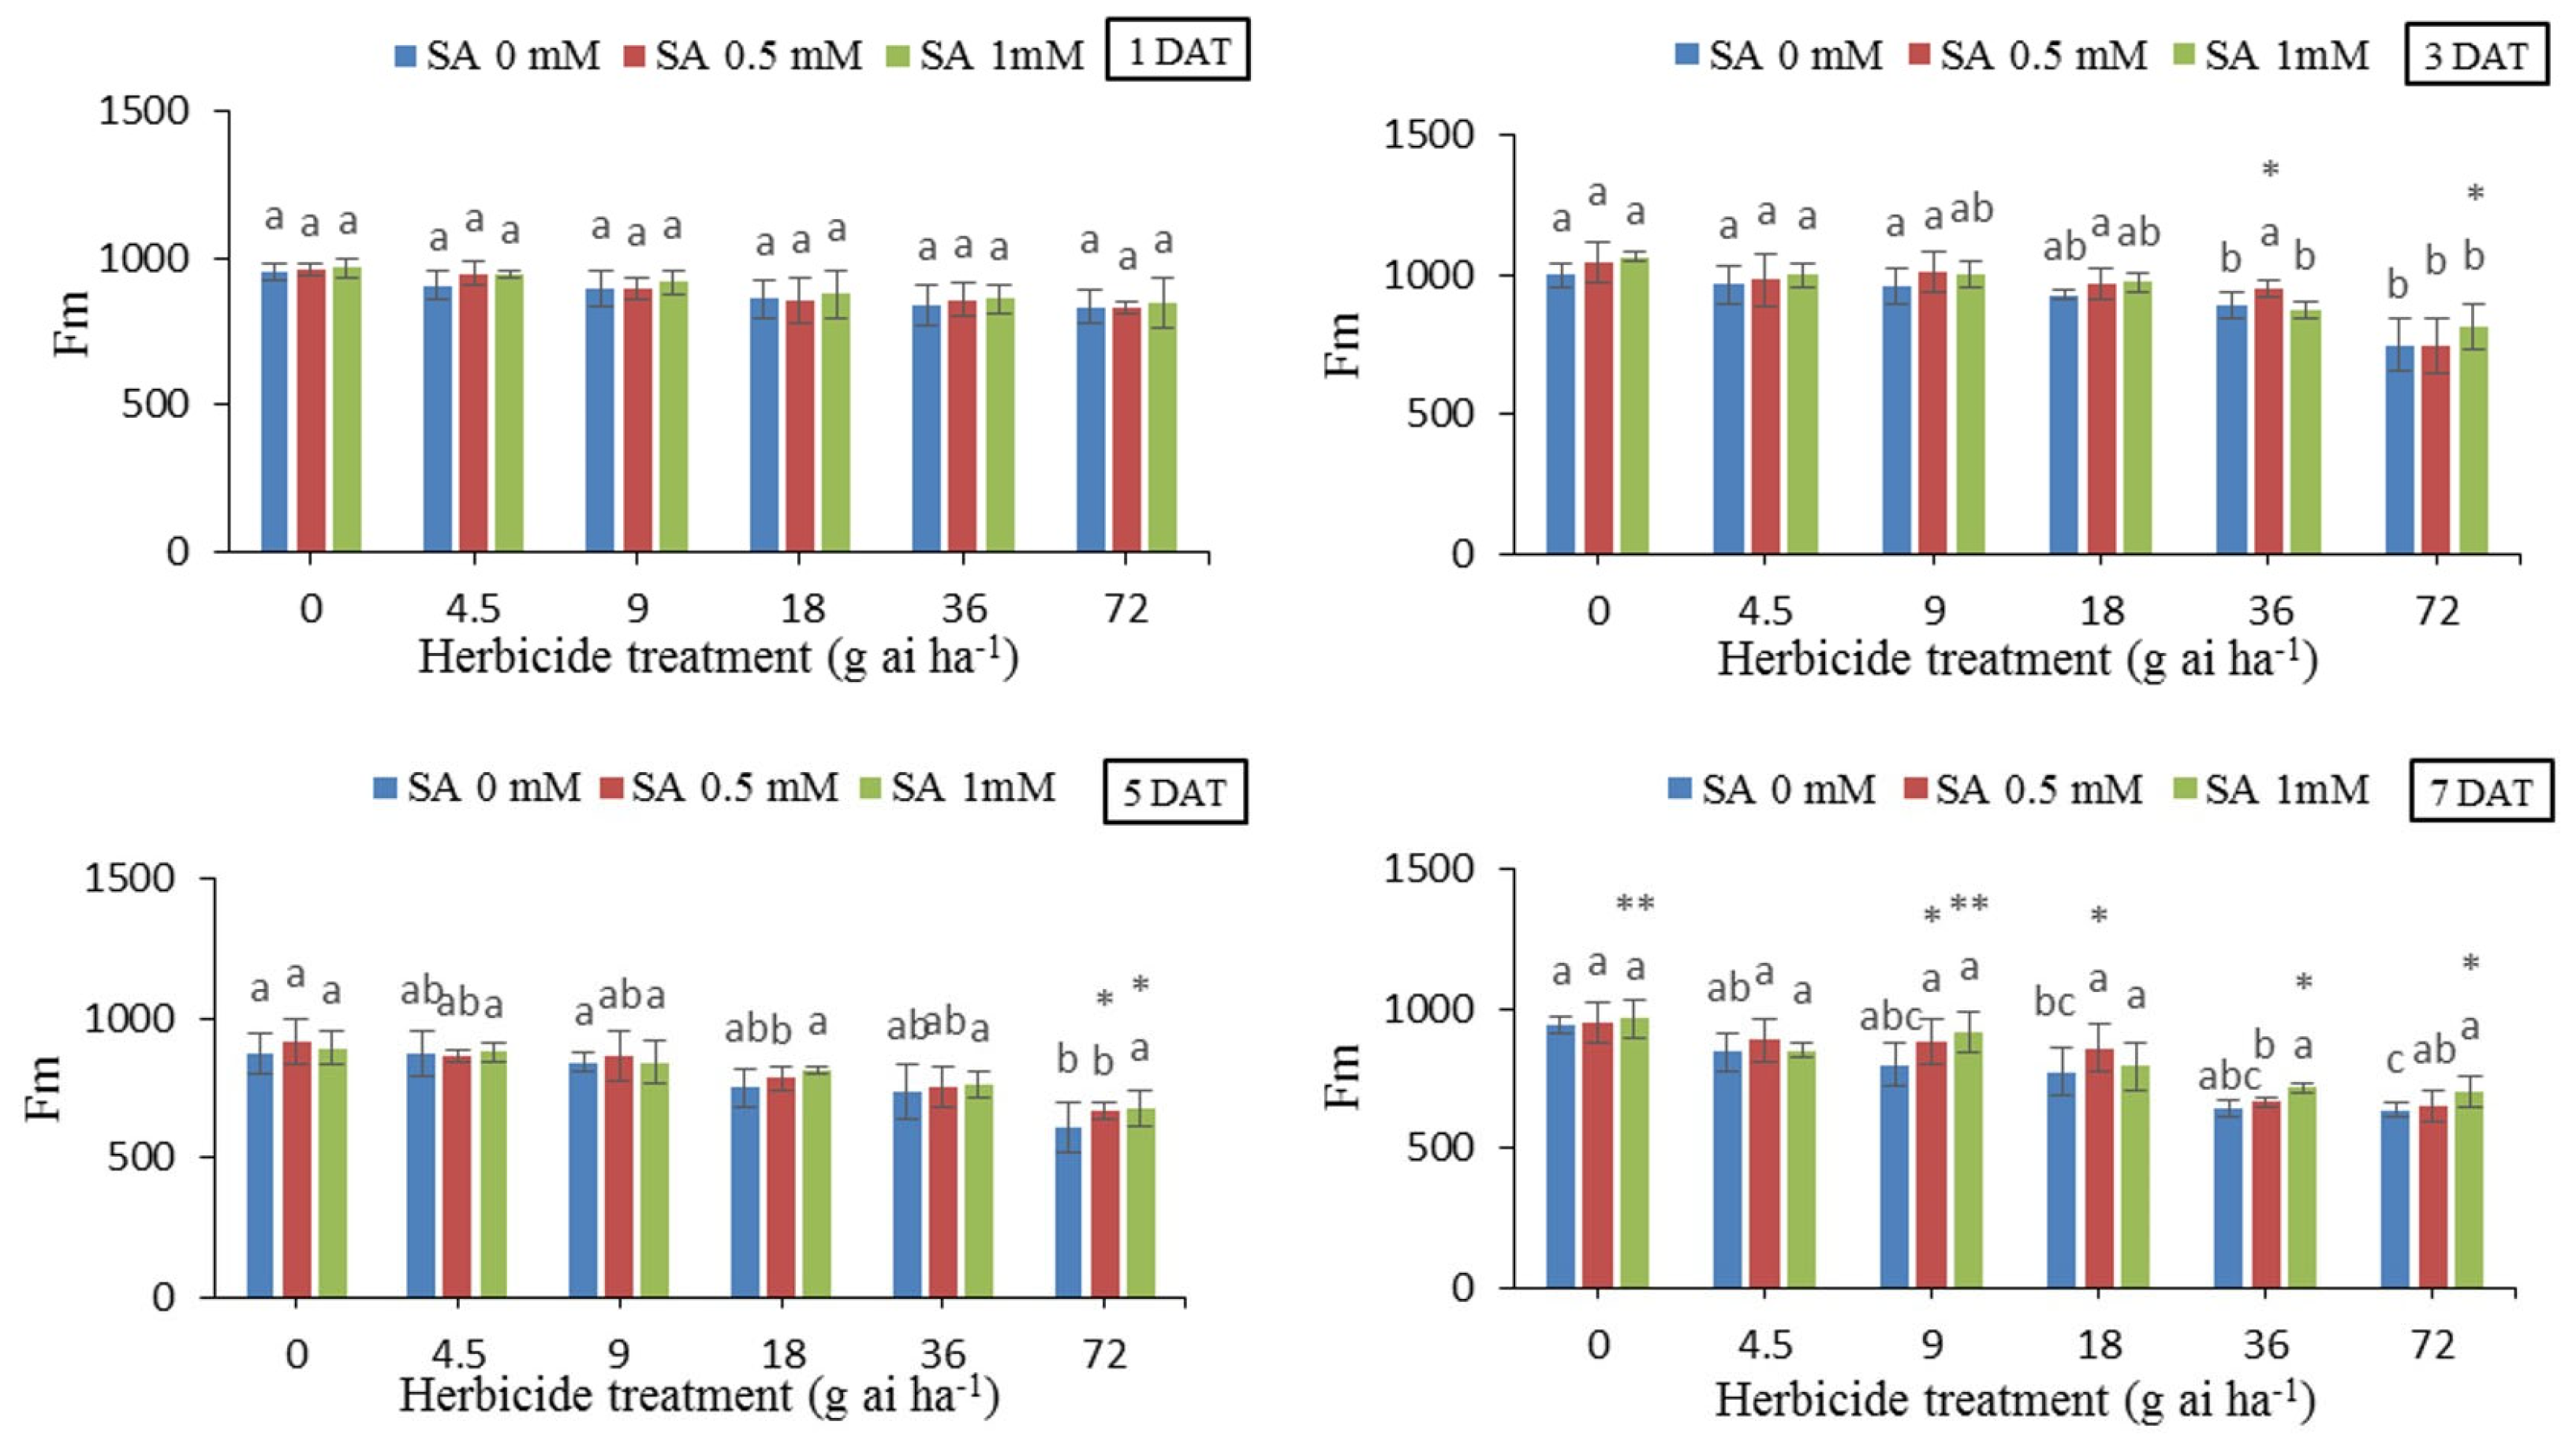
Figure 7.
Changes in Fv/Fm in the leaf tissues of wheat at 1, 3, 5, and 7 DAT at different herbicide application rates. Vertical bars represent the mean ± SD (n = 4). Bars with different letters are significantly (p ±0.05) different according to the Duncan’s test. Asterisks indicate significant differences between herbicide application alone and herbicide with each concentration of SA, based on Independent Samples t-test.
In fact, chlorophyll fluorescence analysis can determine the extent of damage caused to the plants before visual damage or any other common measurement method such as wet and dry weight occurs [44]. By measuring chlorophyll fluorescence succeeded in early detection of herbicide phytotoxicity in weeds and crops [45].
The increase in Fo indicates damage to the photosystem II electron transfer chain due to the reduction of the capacity of electron acceptor protein QA and its incomplete oxidation due to the slow flow of electrons along the path of photosystem II and in general leads to the inactivation of photosystem II [46]. In the present experiment, the amount of fluorescence increased by increasing herbicide dose, so that the maximum amount was obtained in the 72 g ai h-1 dose in the seventh stage, which was partially reduced by the use of salicylic acid (Figure 5).
The sharp decrease in Fm in high doses of herbicide compared to the control can be caused by the decrease in the activity of photosystem II due to the destruction of the photosynthetic system. Therefore, the decrease in Fm can be related to the decrease in the activity of the water-decomposing enzyme and the electron transfer cycle around or inside photosystem II [47]. In fact, the lower Fv/Fm indicates the lower efficiency of photosystem II. Therefore, through the adverse effects it has on carbon stabilization, the stress has caused a decrease in the electron acceptance and transfer capacity, as a result, the system quickly reached the maximum fluorescence (Fm), which will result in a decrease in the amount of variable fluorescence (Fv), so the photochemical efficiency Photosystem II, which is expressed as Fv/Fm ratio, decreases under stress [48]. In fact, the decrease in the Fv/Fm ratio is due to an increase in F0 or a decrease in Fm or both. The results of our experiment also indicated a decrease in Fm and Fv/Fm values in doses higher than the recommended dose, and the use of salicylic acid almost decreased the negetive effect of herbicide on those parameters (Figure 6 and Figure 7).
Therefore, by examining the changes in the fluorescence of chlorophyll a, it is possible to study the effects of herbicides with different mechanisms of action [39]. The application of Imazmax herbicide in sunflower (with the mechanism of inhibiting the activity of acetohydroxy acid synthase (AHAS)), although the photosynthetic system is not the main target of this herbicide, affected the fluorescence parameters of chlorophyll a [49].
It has also been reported in other studies that the use of Asulam, Bifenox, Tofordi, glyphosate, diclofop methyl, imazapir, dicamba + Tofordi and cetoxydim herbicides, despite not having a direct effect on photosynthesis, had an effect on chlorophyll fluorescence [50,51]. In another study, a decrease in the Fv/Fm ratio was observed as a result of the use of the herbicide cetoxydim (ACCase inhibitor) on oats [50].
The chlorophyll content of plants is sensitive to oxidative changes caused by stress, and therefore changes in chlorophyll levels are observed in stressed plants [52,53]. If detoxification of ROS does not take place, serious damage is done to chlorophylls, proteins, membrane lipids and nuclear acids [54].
Treating the plant with salicylic acid increased the pigments contents, which is probably due to the effect of salicylic acid on reducing the production of free radicals, which prevents the destruction of chlorophyll. The research of Khan et al. [55] showed that the use of salicylic acid led to an increase in CO2 fixation, which is probably due to the effect of salicylic acid in various photosynthetic processes, which includes increasing photosynthetic pigments and carotenoids, increasing concentration and activity. A number of plant studies have indicated the role of salicylic acid in enhancing the photosynthetic pigment content and photosynthesis in different crops [56]. This increase might result from improving the effect of SA on growth and metabolism of plants under stress. Because chlorophyllase enzyme increases under stress conditions and chlorophyll destruction might be related with chlorophyllase enzyme [57,58]. El-Tayeb [59] attributed the reduction of chlorophyll in stress conditions to the photooxidation of chlorophylls, their reaction with single oxygen, the destruction of the precursors of chlorophyll synthesis, the inhibition of the biosynthesis of new chlorophylls, and the activation of decomposition enzymes. attributed to chlorophyll including chlorophyllase.
Tambussi et. al. [60] attributed the decrease in chlorophyll concentration under stress conditions to more activity of chlorophyllase, peroxidase and phenolic compounds. Our study showed that for the plants treated with herbicide, compared to the control, the total chlorophyll content decreased for the groups that were not pretreated with SA and increased for the groups treated with SA (Figure 3). In plants not treated with SA, the reason for the reduction of total chlorophyll content in the treated groups of Atlantis may be the oxidative stress caused by the herbicide.
The lack of change in the content of chlorophyll pigments at lower concentrations indicates protective processes (such as antioxidants) that have protected the photosynthetic system. Carotenoids are among the non-enzymatic antioxidant compounds that can play a role in reducing the superoxide ion and reducing the formation of hydroxyl radicals [61]. Carotenoids have a protective mechanism against oxidative damage and protect chlorophyll from photooxidation [62]. According to the results of this study, it was reported in the research of Shahrtash et al. [63], that paraquat herbicide treatment in corn seedlings reduced the chlorophyll content by 49.3% compared to the control, and pretreatment of the corn seedlings with salicylic acid solution improved the conditions. Ananieva et al., [64] also investigated the photosynthetic system of barley seedlings under pre-treatment with salicylic acid and treatment with paraquat herbicide. It was evident that the use of salicylic acid protects the plant from the stress caused by herbicide and prevented the reduction of chlorophyll content.
Carotenoids and chlorophylls were reduced in leaves treated with isoproteuron herbicide and this effect was partially reduced by external application of salicylic acid. The consequences of chlorophyll reduction by isoproteuron may be due to the destruction of existing pigments and the prevention of the synthesis of new pigments [65]. Our study showed that herbicide treatment in both pre-treated and non-treated SA, increased carotenoid content in plants compared to the control. The carotenoid content increased proportionally with the increase in herbicide concentration, and the highest carotenoid content was found in 72 g ai h-1 whit SA pre-treated and non-treated plants. In addition, the highest carotenoid content was on the DAT for the groups treated with Atlantis (Figure 4). This increase in carotenoid content may be related to the resistance of the plant to herbicide.
5. Conclusions
To conclude, dosages higher than the recommended dose of mesosulfuron-methyl + iodosulfuron-methyl can affect photosynthetic activity in wheat leaves. The present results provide knowledge about the use of SA in protecting wheat leaves against damage caused by the use of mesosulfuron-methyl + iodosulfuron-methyl. The role of SA in detoxification of herbicide may be through the regulation of physiological activity and management of the photosynthetic system. For this purpose, increasing plant tolerance to biotic or abiotic stress conditions by activating the stress-response signaling pathway in plants is a powerful tool and a promising approach.
Author Contributions
Conceptualization, S.A.K. and M.T.A.; literature review, S.A.K.; data collection, S.A.K.; data analysis, S.A.K. and M.T.A.; data interpretation, S.A.K., M.T.A. and N.E.K.; writing manuscript, S.A.K., M.T.A; Writing and editing manuscript, N.E.K.
Funding
This research was funded by the University of Mohaghegh Ardabili.
Data Availability Statement
All the essential data are included within the manuscript. Raw data can be made available by the corresponding author(s) upon request.
Acknowledgments
The authors acknowledge the award of a scholarship to Seyedeh Asieh Khatami by the Faculty of Agriculture and Natural Resources, University of Mohaghegh Ardabili, Iran.
Conflicts of Interest
The authors declare no conflict of interest.
References
- Shewry, P.R.; Hey, S.J. The Contribution of Wheat to Human Diet and Health. Food Energy Secur. 2015, 4, 178–202. [Google Scholar] [CrossRef] [PubMed]
- Abbas, S.H.; Saleem, M.; Maqsood, M.M.; Mujahid, M.Y.; ul Hassan, M.; Saleem, R. Weed density and grain yield of wheat as affected by spatial arrangements and weeding techniques under rainfed conditions of pothowar. J. Agric. Sci. 2009, 46, 242–247. [Google Scholar]
- Hossain, M.M.; Begum, M. Soil Weed Seed Bank: Importance and Management for Sustainable Crop Production—A Review. J. Bangladesh Agric. Univ. 2015, 13, 221–228. [Google Scholar] [CrossRef]
- Ayana, B. Wheat Production as Affected by Weed Diversity and Other Crop Management Practices in Ethiopia. International J. Res. Stud. Agric. Sci. (IJRSAS) 2020, 6, 14–21. [Google Scholar] [CrossRef]
- Nakka, S.; Jugulam, M.; Peterson, D.; Asif, M. Herbicide Resistance: Development of Wheat Production Systems and Current Status of Resistant Weeds in Wheat Cropping Systems. Crop J. 2019, 7, 750–760. [Google Scholar] [CrossRef]
- Grewal, S.K.; Gill, R.K.; Virk, H.K.; Bhardwag, R.D. Effect of Herbicide Stress on Synchronization of Carbon and Nitrogen Metabolism in Lentil (Lens Culinaris Medik.). Plant Physiol. Biochem. 2023, 196, 402–414. [Google Scholar] [CrossRef]
- Khatami, S.; Alebrahim, M.; Weed, R. The Effect of Rimsulfuron Application Time and Dose on Weed Control and Potato (Solanum Tuberosum) Tuber Yield. Iran. J. weed Sci. 2017, 12, 185–198. [Google Scholar]
- Todorova, D.; Aleksandrov, V.; Anev, S.; Sergiev, I. Photosynthesis Alterations in Wheat Plants Induced by Herbicide, Soil Drought or Flooding. Agronomy 2022, 12, 390. [Google Scholar] [CrossRef]
- Rathika, S.; Udhaya, A.; Ramesh, T.; Shanmugapriya, P. Weed Management Strategies in Green Gram: A Review. The Pharma Innov. Journal 2023, 12, 5574–5580. [Google Scholar]
- Alebrahim, M.T.; Kalkhoran, E.S.; Majd, R.; Khatami, S.A. Effects of Adjuvants on the Effectiveness and Rainfastness of Rimsulfuron in Potato. Hell. Plant Prot. J. 2023, 17, 35–48. [Google Scholar] [CrossRef]
- Green, J.M. Review of Glyphosate and ALS-Inhibiting Herbicide Crop Resistance and Resistant Weed Management. Weed Technol. 2007, 21, 547–558. [Google Scholar] [CrossRef]
- Tranel, P.; Wright, T. Resistance of Weeds to ALS-Inhibiting Herbicides: What Have We Learned? Weed Sci. 2002, 50, 700–712. [Google Scholar] [CrossRef]
- Zhou, Q.; Liu, W.; Zhang, Y.; Liu, K. Action Mechanisms of Acetolactate Synthase-Inhibiting Herbicides. Pest Biochem. Physiol 2007, 89, 89–96. [Google Scholar] [CrossRef]
- Qian, H.; Wang, R.; Hu, H.; Lu, T.; Chen, X.; Ye, H.; Liu, W.; Fu, Z. Enantioselective Phytotoxicity of the Herbicide Imazethapyr and Its Effect on Rice Physiology and Gene Transcription. Environ. Sci. Technol. 2011, 45, 7036–7043. [Google Scholar] [CrossRef] [PubMed]
- Liu, X.Q.; Yu, C.Y.; Dong, J.G.; Hu, S.W.; Xu, A.X. Acetolactate Synthase-Inhibiting Gametocide Amidosulfuron Causes Chloroplast Destruction, Tissue Autophagy, and Elevation of Ethylene Release in Rapeseed. Front. Plant Sci. 2017, 8, 280179. [Google Scholar] [CrossRef]
- Baek, D.; Pathange, P.; Chung, J.S.; Jiang, J.; Gao, L.; Oikawa, A.; Hirai, M.Y.; Saito, K.; Pare, P.W.; Shi, H. A Stress-inducible Sulphotransferase Sulphonates Salicylic Acid and Confers Pathogen Resistance in Arabidopsis. Plant, Cell & Environment 2010, 33, 1383–1392. [Google Scholar] [CrossRef]
- Sun, C.; Chen, S.; Jin, Y.; Song, H.; Ruan, S.; Fu, Z.; Asad, M.A.U.; Qian, H. Effects of the Herbicide Imazethapyr on Photosynthesis in PGR5- and NDH-Deficient Arabidopsis Thaliana at the Biochemical, Transcriptomic, and Proteomic Levels. J. Agric. Food Chem. 2016, 64, 4497–4504. [Google Scholar] [CrossRef] [PubMed]
- Fayez, K.A. Action of Photosynthetic Diuron Herbicide on Cell Organelles and Biochemical Constituents of the Leaves of Two Soybean Cultivars. Pestic. Biochem. Physiol. 2000, 66, 105–115. [Google Scholar] [CrossRef]
- Caverzan, A.; Piasecki, C.; Chavarria, G.; Stewart, C.N.; Vargas, L. Defenses Against ROS in Crops and Weeds: The Effects of Interference and Herbicides. Int. J. Mol. Sci. 2019, 20, 1086. [Google Scholar] [CrossRef]
- Halliwell, B. Reactive Species and Antioxidants. Redox Biology Is a Fundamental Theme of Aerobic Life. Plant Physiol. 2006, 141, 312–322. [Google Scholar] [CrossRef]
- Christensen, M.G.; Teicher, H.B.; Streibig, J.C. Linking Fluorescence Induction Curve and Biomass in Herbicide Screening. Pest Manag. Sci. 2003, 59, 1303–1310. [Google Scholar] [CrossRef] [PubMed]
- Nielsen, L.W.; Dahllöf, I. Direct and Indirect Effects of the Herbicides Glyphosate, Bentazone and MCPA on Eelgrass (Zostera Marina). Aquatic Toxicol. 2007, 82, 47–54. [Google Scholar] [CrossRef] [PubMed]
- Gottardini, E.; Cristofori, A.; Cristofolini, F.; Nali, C.; Pellegrini, E.; Bussotti, F.; Ferretti, M. Chlorophyll-Related Indicators Are Linked to Visible Ozone Symptoms: Evidence from a Field Study on Native Viburnum Lantana L. Plants in Northern Italy. Ecological Indic. 2014, 39, 65–74. [Google Scholar] [CrossRef]
- Juneau, P.; Qiu, B.; Deblois, C.P. Use of Chlorophyll Fluorescence as a Tool for Determination of Herbicide Toxic Effect: Review. Toxicol. Environ. Chem. 2007, 89, 609–625. [Google Scholar] [CrossRef]
- Tan, L.; Xu, W.; He, X.; Wang, J. The Feasibility of Fv/Fm on Judging Nutrient Limitation of Marine Algae through Indoor Simulation and in Situ Experiment. Estuarine, Coast. Shelf Sci. 2019, 229. [Google Scholar] [CrossRef]
- Kalaji, H.M.; Schansker, G.; Brestic, M.; Bussotti, F.; Calatayud, A.; Ferroni, L.; Goltsev, V.; Guidi, L.; Jajoo, A.; Li, P.; et al. Frequently Asked Questions about Chlorophyll Fluorescence, the Sequel. Photosynth. Res. 2016, 132, 13–66. [Google Scholar] [CrossRef]
- Kaiser, Y.I.; Menegat, A.; Gerhards, R. Chlorophyll Fluorescence Imaging: A New Method for Rapid Detection of Herbicide Resistance in Alopecurus Myosuroides. Weed Res. 2013, 53, 399–406. [Google Scholar] [CrossRef]
- Dayan, F.E.; Zaccaro, M.L.D.M. Chlorophyll Fluorescence as a Marker for Herbicide Mechanisms of Action. Pestic. Biochem. Physiol. 2012, 102, 189–197. [Google Scholar] [CrossRef]
- Korres, N.E.; Froud-Williams, R.J.; Moss, S.R. Chlorophyll Fluorescence Technique as a Rapid Diagnostic Test of the Effects of the Photosynthetic Inhibitor Chlorotoluron on Two Winter Wheat Cultivars. Ann. Appl. Biol. 2003, 143, 53–56. [Google Scholar] [CrossRef]
- Arif, Y.; Sami, F.; Siddiqui, H.; Bajguz, A.; Hayat, S. Salicylic Acid in Relation to Other Phytohormones in Plant: A Study towards Physiology and Signal Transduction under Challenging Environment. Environmental Exp. Bot. 2020, 175, 104040. [Google Scholar] [CrossRef]
- Ghassemi-Golezani, K.; Solhi-Khajemarjan, R. Changes in Growth and Essential Oil Content of Dill (Anethum Graveolens) Organs under Drought Stress in Response to Salicylic Acid. J. Plant Physiol. Breeding 2021, 11, 33–47. [Google Scholar] [CrossRef]
- Tang, Y.; Sun, X.; Wen, T.; Liu, M.; Yang, M.; Chen, X. Implications of Terminal Oxidase Function in Regulation of Salicylic Acid on Soybean Seedling Photosynthetic Performance under Water Stress. Plant Physiol. Biochem. 2017, 112, 19–28. [Google Scholar] [CrossRef] [PubMed]
- Li, Q.; Wang, G.; Wang, Y.; Yang, D.; Guan, C.; Ji, J. Foliar Application of Salicylic Acid Alleviate the Cadmium Toxicity by Modulation the Reactive Oxygen Species in Potato. Ecotoxicology Environ. Safety 2019, 172, 317–325. [Google Scholar] [CrossRef] [PubMed]
- Janda, T.; Gondor, O.K.; Yordanova, R.; Szalai, G.; Pál, M. Salicylic Acid and Photosynthesis: Signalling and Effects. Acta Physiol. Plant. 2014, 36, 2537–2546. [Google Scholar] [CrossRef]
- Jiang, L.; Yang, H. Prometryne-Induced Oxidative Stress and Impact on Antioxidant Enzymes in Wheat. Ecotoxicol. Environ. Saf. 2009, 72, 1687–1693. [Google Scholar] [CrossRef]
- Song, N.H.; Le Yin, X.; Chen, G.F.; Yang, H. Biological Responses of Wheat (Triticum Aestivum) Plants to the Herbicide Chlorotoluron in Soils. Chemosphere 2007, 68, 1779–1787. [Google Scholar] [CrossRef]
- Xu, S.; Li, J.; Zhang, X.; Wei, H.; Cui, L. Effects of Heat Acclimation Pretreatment on Changes of Membrane Lipid Peroxidation, Antioxidant Metabolites, and Ultrastructure of Chloroplasts in Two Cool-Season. Environ. Exp. Bot. 2006, 56, 274–285. [Google Scholar] [CrossRef]
- Khatami, S.A.; Barmaki, M.; Alebrahim, M.T.; Bajwa, A.A. Salicylic Acid Pre-Treatment Reduces the Physiological Damage Caused by the Herbicide Mesosulfuron-Methyl+ Iodosulfuron-Methyl in Wheat (Triticum aestivum). Agronomy 2022, 12, 3053. [Google Scholar] [CrossRef]
- Barbagallo, R.P.; Oxborough, K.; Pallett, K.E.; Baker, N.R. Rapid, Noninvasive Screening for Perturbations of Metabolism and Plant Growth Using Chlorophyll Fluorescence Imaging. Plant Physiol. 2003, 132, 485–493. [Google Scholar] [CrossRef]
- Saja, D.; Rys, M.; Stawoska, I.; Skoczowski, A. Metabolic Response of Cornflower (Centaurea Cyanus L.) Exposed to Tribenuron-Methyl: One of the Active Substances of Sulfonylurea Herbicides. Acta Physiol. Plant. 2016, 38. [Google Scholar] [CrossRef]
- Shimizu, M.; Goto, M.; Hanai, M.; Shimizu, T.; Izawa, N.; Kanamoto, H.; Tomizawa, I.K.; Yokota, I.; Kobayashi, H. Tolerance to Herbicides by Mutated Acetolactate Synthase Genes Integrated into the Chloroplast Genome of Tobacco. Plant Physiol. 2008, 147, 1976–1983. [Google Scholar] [CrossRef] [PubMed]
- Theodoulou, F.L.; Clark, I.M.; He, X.L.; Pallett, K.E.; Cole, D.J.; Hallahan, D.L. Co-Induction of Glutathione-S-Transferases and Multidrug Resistance Associated Protein by Xenobiotics in Wheat. Pest Manag. Sci. 2003, 59, 202–214. [Google Scholar] [CrossRef] [PubMed]
- Khatami, S.A.; Alebrahim, M.T.; Barmaki, M. Effect of Mesosulfuron Methyl + Iodosulfuron Methyl Herbicide in Combination with Salicylic Acid on Wild Oat (Avena Fatua). Iran. J. Weed Sci. 2023, 19, 25–39. [Google Scholar] [CrossRef]
- Fai, P.B.; Grant, A.; Reid, B. Chlorophyll a Fluorescence as a Biomarker for Rapid Toxicity Assessment. Environ. Toxicol. Chem. 2007, 26, 1520–1531. [Google Scholar] [CrossRef] [PubMed]
- Riethmuller-Haage, I.; Bastiaans, L.; Kropff, M.J.; Harbinson, J.; Kempenaar, C. Can Photosynthesis-Related Parameters Be Used to Establish the Activity of Acetolactate Synthase–Inhibiting Herbicides on Weeds? Weed Sci. 2006, 54, 974–982. [Google Scholar] [CrossRef]
- Ralph Falqueto, A.; Alves da Silva Júnior, R.; Thiago Gaudio Gomes, M.; Paulo Rodrigues Martins, J.; Moura Silva, D.; Luiz Partelli, F. Effects of Drought Stress on Chlorophyll a Fluorescence in Two Rubber Tree Clones. Scientia Hortic. 2017, 224, 238–243. [Google Scholar] [CrossRef]
- Zlatev, Z. Drought-Induced Changes in Chlorophyll Fluorescence of Young Wheat Plants. Biotechnology Biotechnol. Equipment 2009, 23, 438–441. [Google Scholar] [CrossRef]
- Ma, B.L.; Morrison, M.J.; Voldeng, H.D. Leaf Greenness and Photosynthetic Rates in Soybean. Crop Sci. 1995, 35, 1411–1414. [Google Scholar] [CrossRef]
- Balabanova, D.A.; Paunov, M.; Goltsev, V.; Cuypers, A.; Vangronsveld, J.; Vassilev, A. Photosynthetic Performance of the Imidazolinone Resistant Sunflower Exposed to Single and Combined Treatment by the Herbicide Imazamox and an Amino Acid Extract. Front. Plant Sci. 2016, 7. [Google Scholar] [CrossRef]
- Hammami, H.; Hassan, M.; Mohassel, R.; Parsa, M.; Bannayan-Aval, M.; Zand, E. Behavior of Sethoxydim Alone or in Combination with Turnip Oils on Chlorophyll Fluorescence Parameter. Notulae Sci. Biol. 2014, 6, 112–118. [Google Scholar] [CrossRef]
- Avarseji, Z.; Rashed Mohssel, M.H.; Nezami, A.; Abbaspoor, M.; Mahallati, M.N. Dicamba+ 2,4-D Affects the Shape of the Kautsky Curves in Wild Mustard (Sinapis Arvensis). Plant Knowl. Journal 2012, 1, 41–45. [Google Scholar]
- Sen, G.; Eryilmaz, I.E.; Ozakca, D. The Effect of Aluminium-Stress and Exogenous Spermidine on Chlorophyll Degradation, Glutathione Reductase Activity and the Photosystem II D1 Protein Gene (PsbA) transcript level in lichen Xanthoria parietina. Elsevier. Phytochemistry 2014, 98, 54–59. [Google Scholar] [CrossRef] [PubMed]
- Sivaci, A.; Kaya, A.; Duman, S. Effects of Ascorbic Acid on Some Physiological Changes of Pepino (Solanum Muricatum Ait.) under Chilling Stress. Acta Biol. Hungarica 2014, 65, 305–318. [Google Scholar] [CrossRef] [PubMed]
- Alscher, R.G.; Erturk, N.; Heath, L.S. Role of Superoxide Dismutases (SODs) in Controlling Oxidative Stress in Plants. Journal Exp. Bot. 2002, 53, 131–134. [Google Scholar] [CrossRef]
- Khan, W.; Prithiviraj, B.; Smith, D.L. Photosynthetic Responses of Corn and Soybean to Foliar Application of Salicylates. J. plant physiol. 2003, 160, 485–492. [Google Scholar] [CrossRef]
- Khodary, S.E.A. Effect of Salicylic Acid on the Growth, Photosynthesis and Carbohydrate Metabolism in Salt Stressed Maize Plants. Int. J. Agric. Biol. 2004, 6, 5–8. [Google Scholar]
- Sakuraba, Y.; Kim, D.; Kim, Y.S.; Hörtensteiner, S.; Paek, N.C. Arabidopsis Staygreen-Like (SGRL) Promotes Abiotic Stress-Induced Leaf Yellowing during Vegetative Growth. FEBS Lett. 2014, 588, 3830–3837. [Google Scholar] [CrossRef]
- Kaya, A.; Yigit, E. The Physiological and Biochemical Effects of Salicylic Acid on Sunflowers (Helianthus Annuus) Exposed to Flurochloridone. Ecotoxicology Environ. Safety 2014, 106, 232–238. [Google Scholar] [CrossRef]
- El-Tayeb, M.A. Response of Barley Grains to the Interactive e. Ect of Salinity and Salicylic Acid. Plant Growth Regul. 2005, 45, 215–224. [Google Scholar] [CrossRef]
- Tambussi, E.A.; Bartoli, C.G.; Beltrano, J.; Guiamet, J.J.; Araus, J.L. Oxidative Damage to Thylakoid Proteins in Water-Stressed Leaves of Wheat (Triticum Aestivum). Physiol. Plant. 2000, 108, 398–404. [Google Scholar] [CrossRef]
- Candan, N.; Tarhan, L. Changes in Chlorophyll-Carotenoid Contents, Antioxidant Enzyme Activities and Lipid Peroxidation Levels in Zn-Stressed Mentha Pulegium. Turkish J. Chem. 2003, 27, 21–30. [Google Scholar]
- Li, Y.; Zhao, H.; Duan, B.; Korpelainen, H.; Li, C. Effect of Drought and ABA on Growth, Photosynthesis and Antioxidant System of Cotinus Coggygria Seedlings under Two Different Light Conditions. Environmental Exp. Bot. 2011, 71, 107–113. [Google Scholar] [CrossRef]
- Shahrtash, M.; Mohsenzadeh, S.; Mohabatkar, H. Salicylic Acid Alleviates Paraquat Oxidative Damage in maize seedling. Asian J. Exp. Biol. Sci. 2011, 2, 377–382. [Google Scholar]
- Ananieva, E.A.; Alexieva, V.S.; Popova, L.P. Treatment with Salicylic Acid Decreases the Effects of Paraquat on Photosynthesis. J. Plant Physiol. 2002, 159, 685–693. [Google Scholar] [CrossRef]
- Singh, H.; Singh, N.B.; Singh, A.; Hussain, I.; Yadav, V. Physiological and Biochemical Effects of Salicylic Acid on Pisum Sativum Exposed to Isoproturon. Arch. Agron. Soil Sci. 2016, 62, 1425–1436. [Google Scholar] [CrossRef]
Figure 1.
Changes in Chlorophyll a content in the leaf tissues of wheat at 1, 3, 5, and 7 DAT at different herbicide application rates. Vertical bars represent the mean ± SD (n = 4). Bars with different letters are significantly (p ±0.05) different according to the Duncan’s test. Asterisks indicate significant differences between herbicide application alone and herbicide with each concentration of SA, based on Independent Samples t-test.
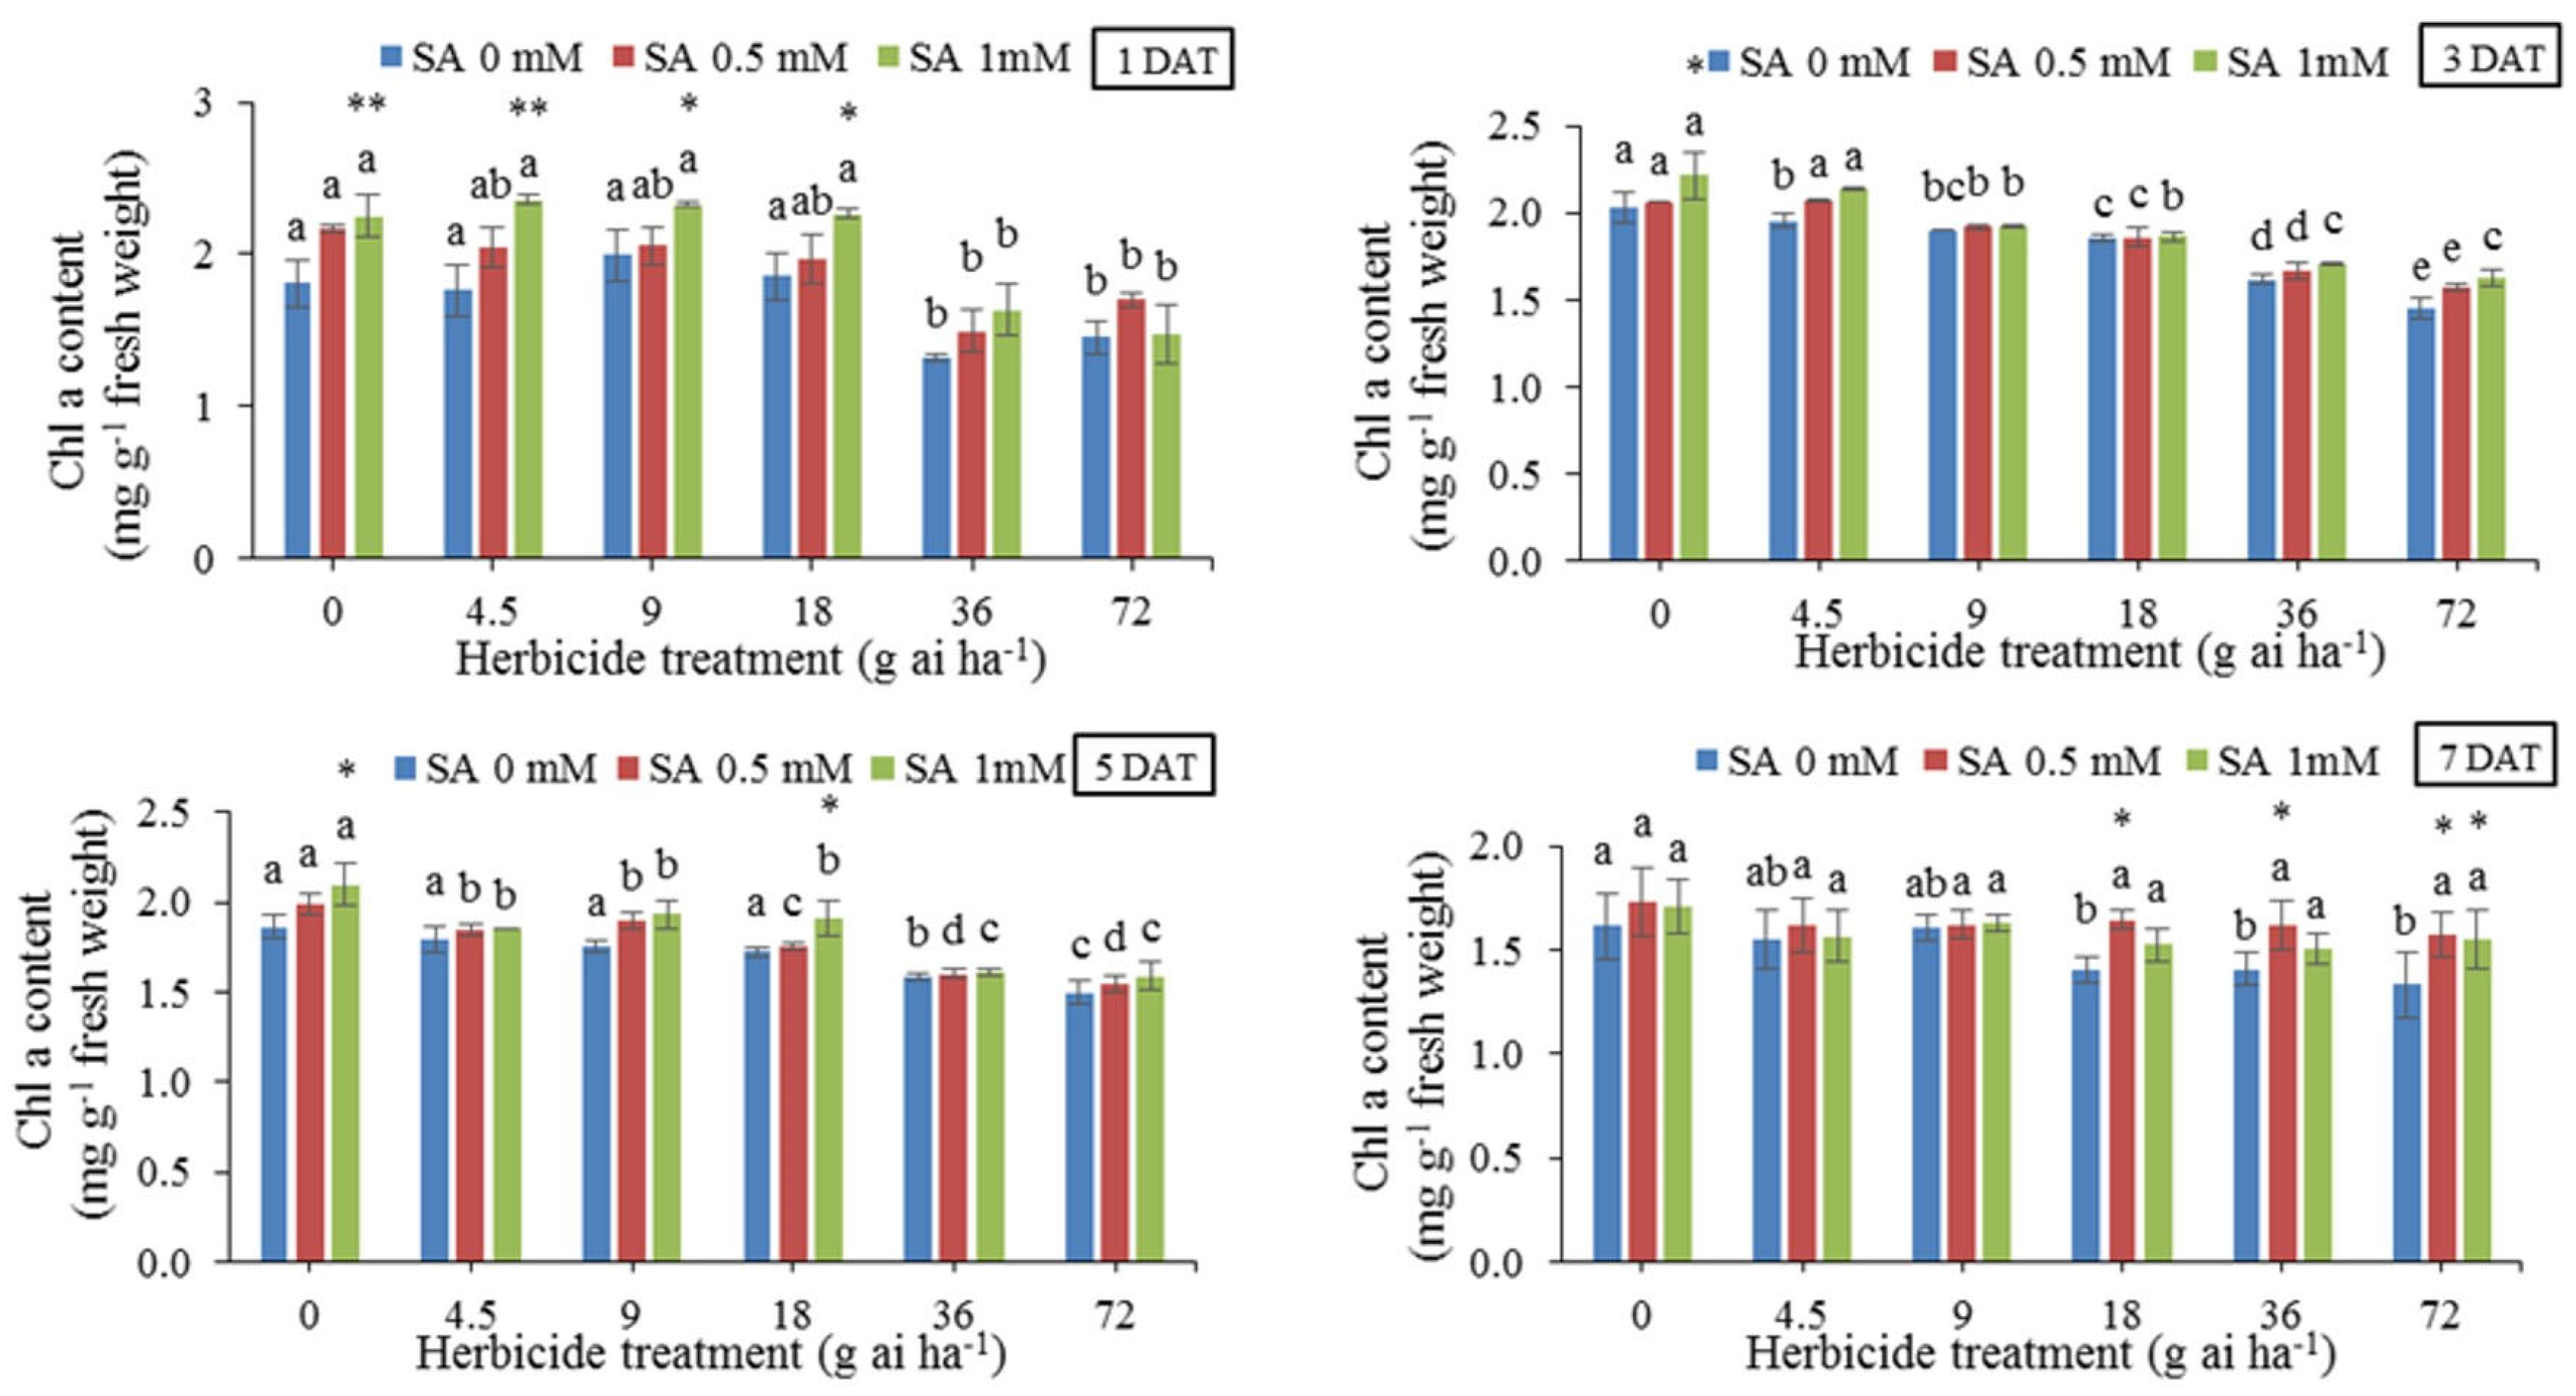
Figure 2.
Changes in Chlorophyll b content in the leaf tissues of wheat at 1, 3, 5, and 7 DAT at different herbicide application rates. Vertical bars represent the mean ± SD (n = 4). Bars with different letters are significantly (p ±0.05) different according to the Duncan’s test. Asterisks indicate significant differences between herbicide application alone and herbicide with each concentration of SA, based on Independent Samples t-test.
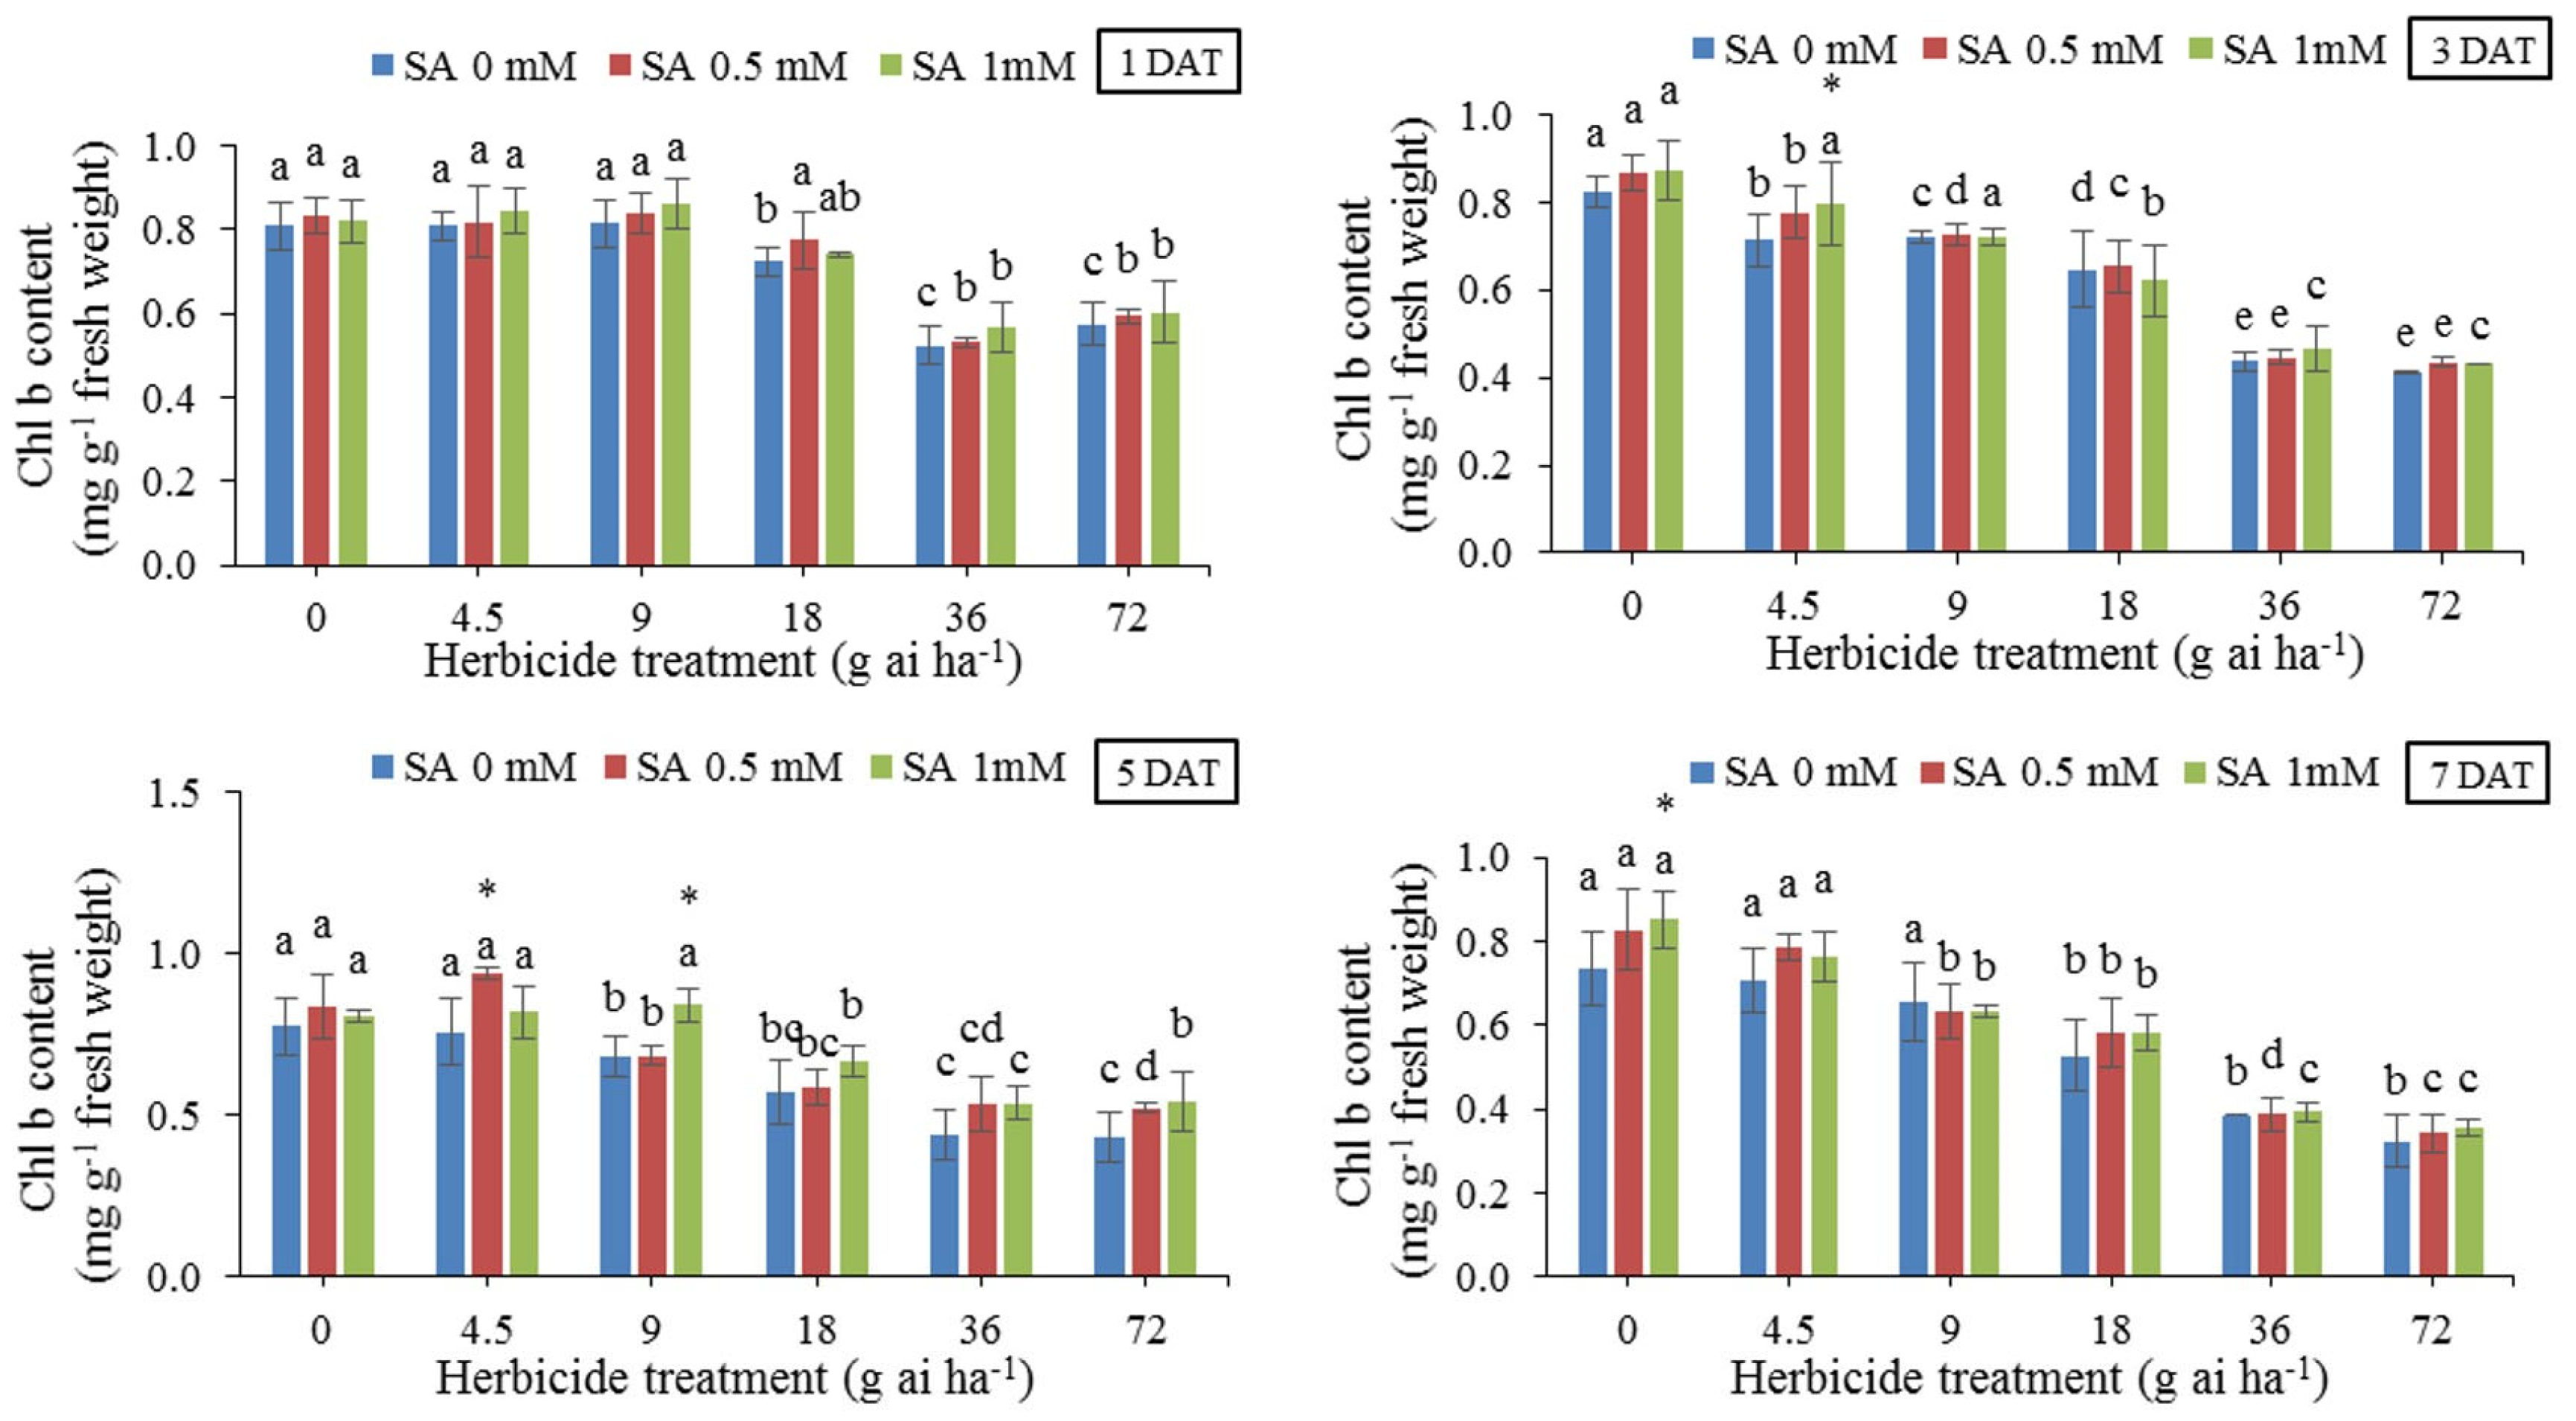
Figure 3.
Changes in Total Chlorophyll in the leaf tissues of wheat at 1, 3, 5, and 7 DAT at different herbicide application rates. Vertical bars represent the mean ± SD (n = 4). Bars with different letters are significantly (p ±0.05) different according to the Duncan’s test. Asterisks indicate significant differences between herbicide application alone and herbicide with each concentration of SA, based on Independent Samples t-test.
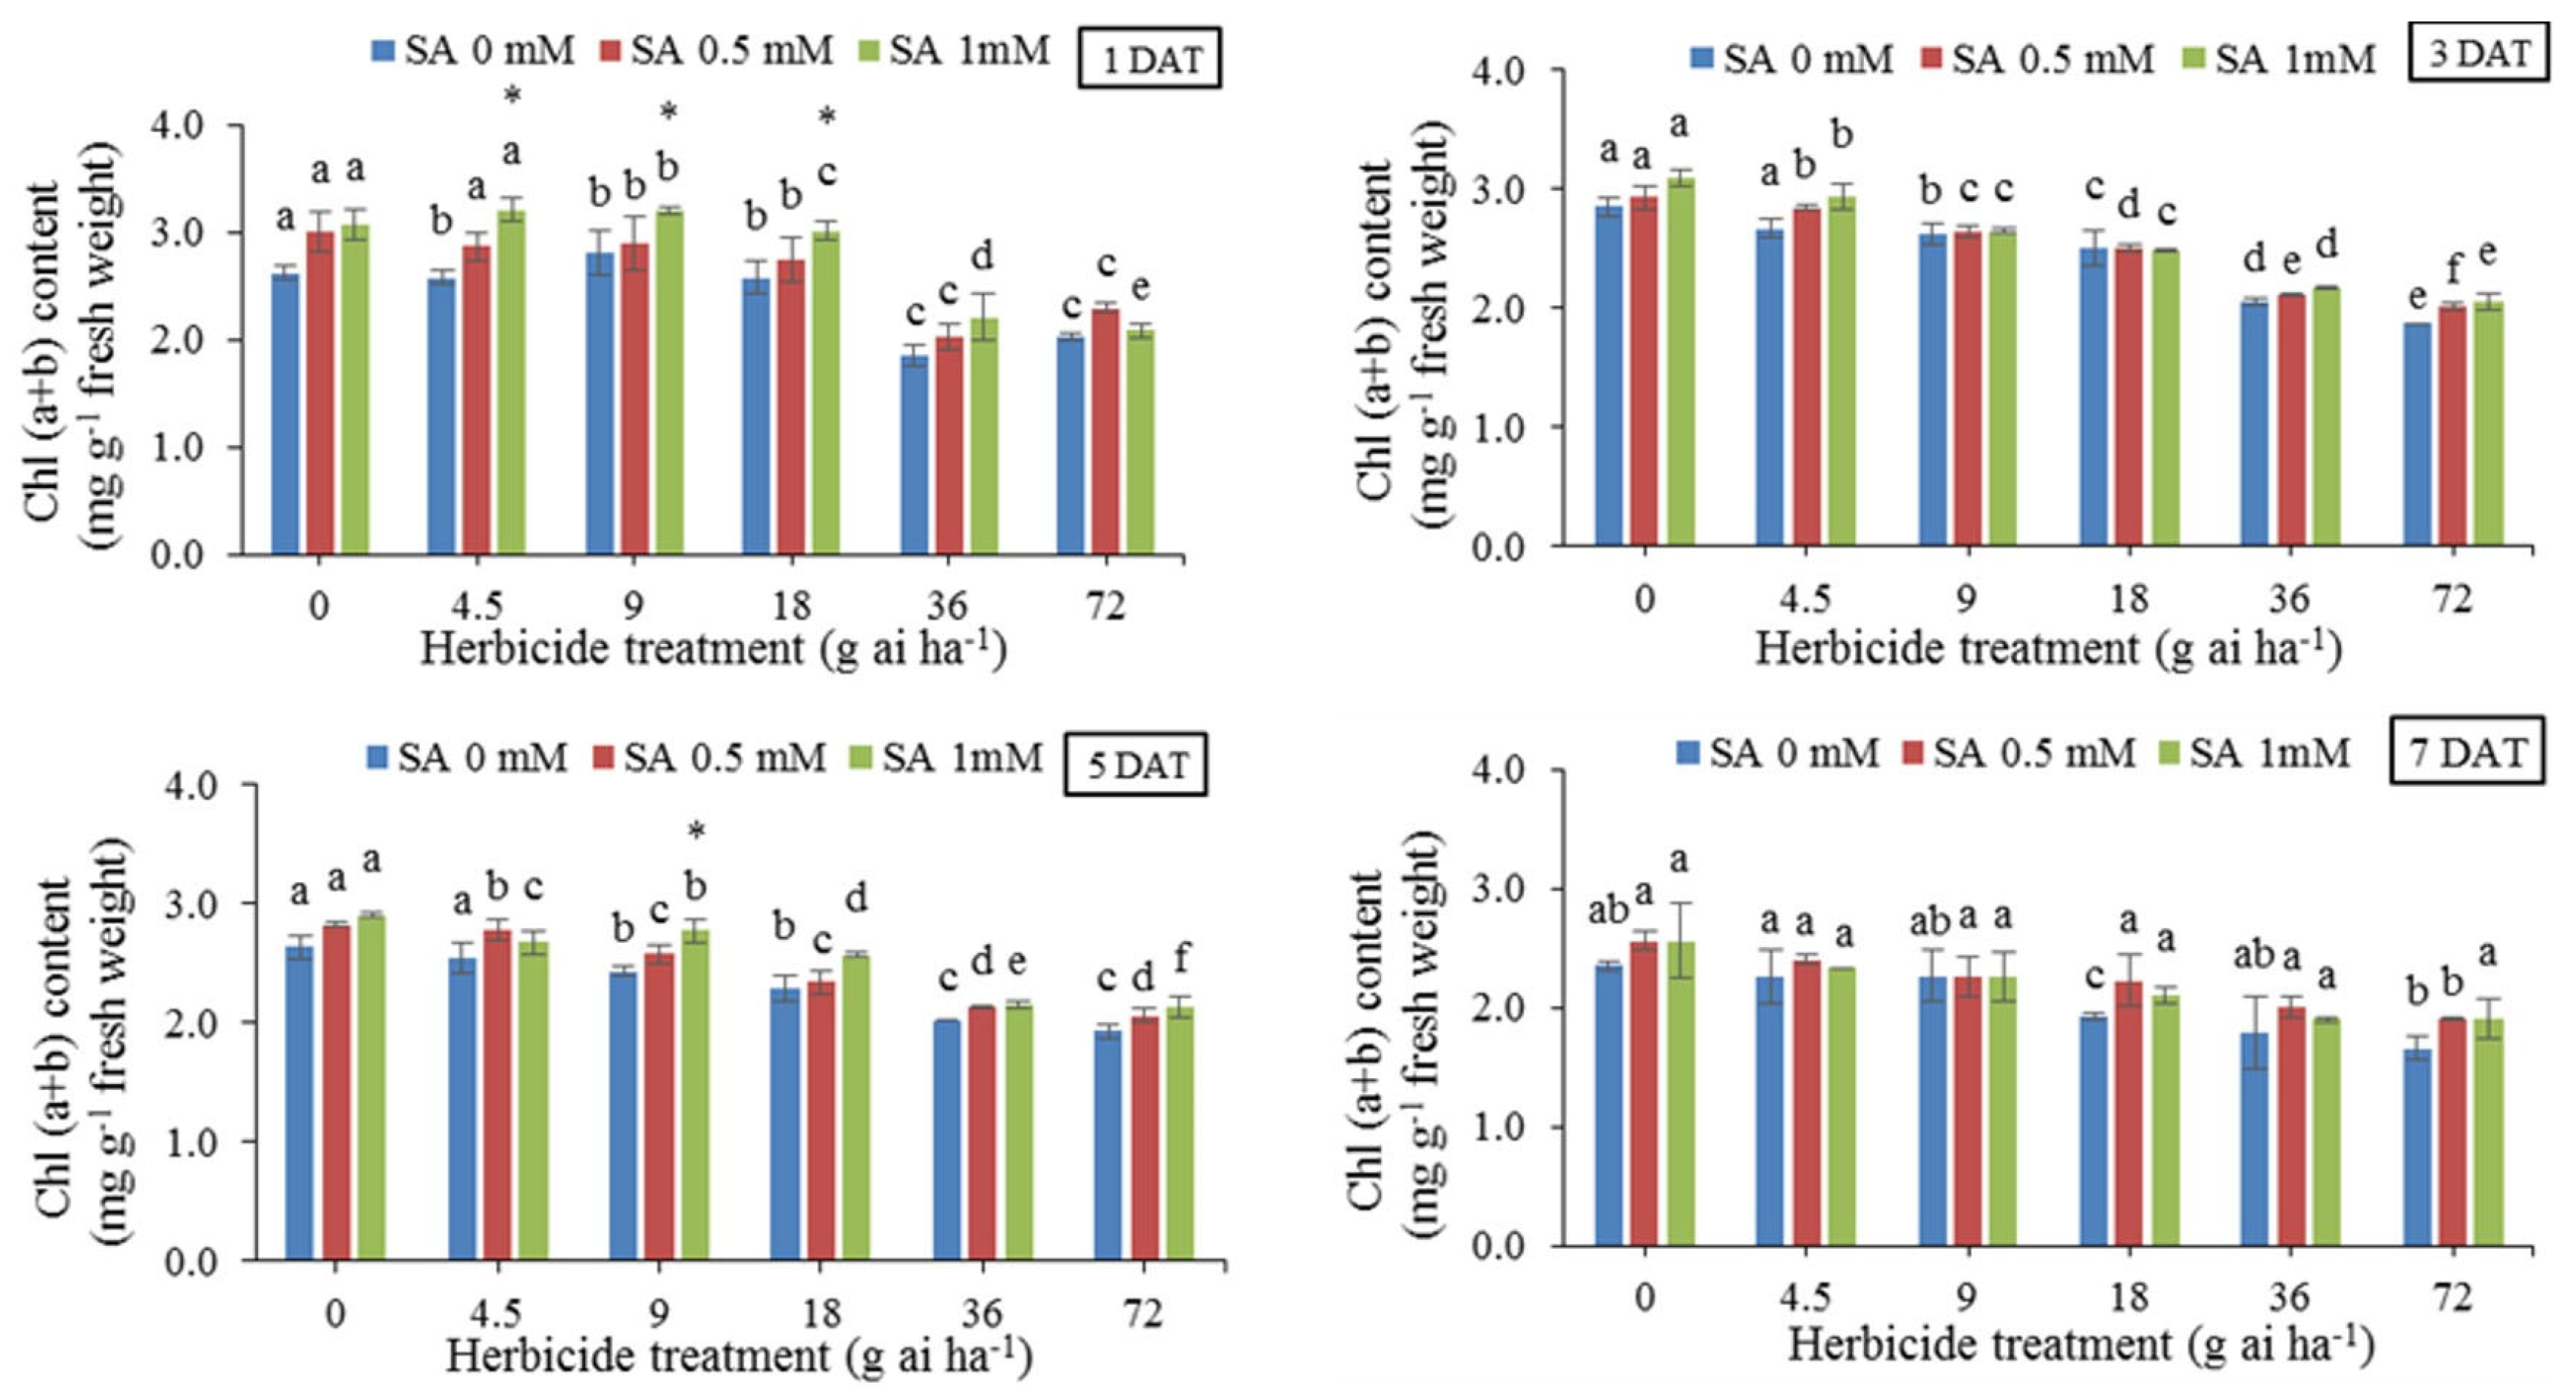
Figure 4.
Changes in Carotenoid content in the leaf tissues of wheat at 1, 3, 5, and 7 DAT at different herbicide application rates. Vertical bars represent the mean ± SD (n = 4). Bars with different letters are significantly (p ±0.05) different according to the Duncan’s test. Asterisks indicate significant differences between herbicide application alone and herbicide with each concentration of SA, based on Independent Samples t-test.
Disclaimer/Publisher’s Note: The statements, opinions and data contained in all publications are solely those of the individual author(s) and contributor(s) and not of MDPI and/or the editor(s). MDPI and/or the editor(s) disclaim responsibility for any injury to people or property resulting from any ideas, methods, instructions or products referred to in the content. |
© 2024 by the authors. Licensee MDPI, Basel, Switzerland. This article is an open access article distributed under the terms and conditions of the Creative Commons Attribution (CC BY) license (http://creativecommons.org/licenses/by/4.0/).
Copyright: This open access article is published under a Creative Commons CC BY 4.0 license, which permit the free download, distribution, and reuse, provided that the author and preprint are cited in any reuse.


