
Submitted:
19 November 2024
Posted:
21 November 2024
You are already at the latest version
Abstract
Cellulose microgel beads fabricated using the dropping technique suffer from structural irregularity and mechanical variability. This limits their translation to biomedical applications that are sensitive to variations in material properties. Ionic salts are often uncontrolled by-products of this technique, despite the known effects of ionic salts on cellulose assembly. In this study, the coagulation behavior of cellulose/salt solutions was explored as a way to combat these challenges. An ionic salt (NaCl) was added to a cellulose solution (cellulose/NaOH/urea) prior to coagulation in a hydrochloric acid bath. Quantification of the bead geometry and characterization of the pore architecture revealed that balancing the introduction of salt with the resultant solution viscosity is more effective at reducing structural variability and diffusion limitations than other pre-gelling techniques like thermal gelation. 3-D visualization of the internal pore structure of neat cellulose, thermo-gel, and salt-gel beads revealed that adding salt to the solution is the most effective way to achieve three-dimensional structural uniformity throughout the bead. Coupled with nanoindentation, we confirmed that the salt produced during coagulation plays a critical role in mechanical variability, and that adding salt to the solution before dropping into the coagulation bath completely screens this effect – leading to uniform microgel beads with reproducible mechanical properties.
Keywords:
cellulose beads
; self-assembly
; hydrogels
; microgels
1. Introduction
Cellulose displays a diverse array of material properties in nature, including texture, mechanical response, and transport of water and other small molecules [1,2,3]. These unique attributes are driven by its hierarchical self-assembly, where individual cellulose chains interact and assemble across length-scales to form fibers, bundles, and macroscopic materials [4,5]. Inspired by properties observed in nature, researchers have used cellulose to design and fabricate gels and composites for many applications that span fields of polymer science, engineering, and even sensor technology [4,6,7]. Cellulose is also biocompatible, biodegradable, bio-absorptive, and has low toxicity [8]. Therefore, cellulose and its derivatives have become critical matrix materials for biomedical applications such as drug delivery [8]. Specifically, oral delivery is a key area of interest because the human body does not readily digest cellulose, creating an opportunity to design drug delivery platforms that will remain stable and provide sustained drug release in the gastrointestinal tract [9].
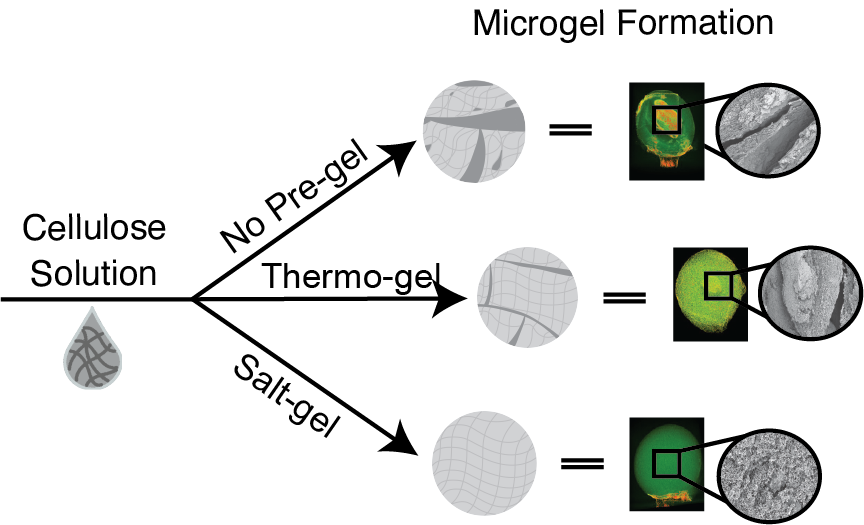
Cellulose microgels are typically formed using the dropping technique, where a cellulose solution is extruded dropwise from a syringe to a coagulation bath that causes cellulose to self-assemble and form porous spheres called microgels or beads [10]. Cellulose with concentrations up to 2 wt% can be fully dissolved in 8 wt% NaOH/urea solutions at low temperatures (-10 [11,12]. Even at 2 wt%, cellulose chains assemble into rod-like fibrillar structures in solution [13,14,15,16,17]. In the dropping technique, the solution of cellulose, sodium hydroxide (NaOH), and urea is dropped into a beaker containing hydrochloric acid (HCl) [10,18,19]. The neutralization of NaOH decreases the solubility of the cellulose, leading to coagulation and microgel bead formation. As the cellulose concentration increases, the aggregate size increases along with the rate of coagulation. After coagulation, the beads are washed, neutralized and either freeze-dried or stored in water. While the methodology is straightforward, the resultant material properties are complex. Numerous experimental factors can negatively impact the properties of the microgels, including dropping height, needle gauge size, the composition and temperature of the coagulation bath, and the concentration and temperature of the cellulose solution [10,20,21]. Even after optimizing these factors, cellulose microgels exhibit high variability in mechanical properties and do not survive in vitro digestion processes [22,23,24].
One way to fabricate cellulose beads with a homogenous structure, higher network density, and improved mechanical properties using the dropping technique is thermal gelation [10,25]. If the temperature is gradually increased, the cellulose solubility decreases, leading to gel formation. When used in conjunction with the dropping technique, thermal gelation stabilizes the cellulose beads due to increased solution viscosity and helps maximize the rate of coagulation [26]. The physical crosslinking helps limit the movement of polymer chains in the solution as the droplet is introduced to the coagulation bath [25,27]. Thermal gelation times are also dependent on the cellulose concentration, where higher concentration decreases the gelation time [10]. While thermal gelation improves geometric features like circularity, the variability of the pore structure and material properties persists. Thus, more than gel pre-assembly is needed to overcome these material design challenges.
The driving force behind the formation of cellulose beads via the dropping technique is the neutralization of the base solvent (NaOH) with an acidic bath (HCl) [19]. This neutralization causes the cellulose in the droplet to aggregate and self-assemble, leading to spherical microgels. An overlooked feature of this process is the production of salt, specifically sodium chloride (NaCl), from the neutralization reaction:
NaCl and other ionic salts are known to influence the hydration and assembly of cellulose, where an increase in salt concentration causes the cellulose to form a gel even in NaOH solutions [28,29]. This phenomenon is known as the "salting out” effect and is demonstrated by cellulose nanofibers (CNF), cellulose nanocrystals (CNC), and other biopolymers like proteins [28,29]. Recently, Arola et al. used experimental and computational techniques to reveal that ionic salts create bridges between cellulose nanofibers, allowing for stronger, more ordered contacts to form between fibrils [30]. In their study, small deformation oscillatory rheology revealed that CNF suspensions with low NaCl concentrations (0.25-1mM) take longer to recover from stress, while cellulose suspensions with higher NaCl concentrations (above 2 mM) form highly elastic networks that quickly recover from stress [30]. Overall, Arola et al. concluded that even trace amounts of NaCl significantly influence the self-assembly of CNF and the stress response of the resultant material and plays a critical role in the mechanical variability observed frequently in the literature [30]. CNCs suspended in solution form a heterogenous mixture where they retain their macroscopic structure and can form larger clusters due to interparticle attractions and hydrogen bonding between the charged groups on the surface of the CNC and water [31]. CNCs display higher surface area, modulus, and negative surface charge, and a rod-like crystalline structure compared to CNFs [32]. Cao et al. investigated the aggregation kinetics for CNC suspensions containing monovalent, divalent, and trivalent salts [33]. At NaCl concentrations above 153 mM, rapid assembly occurs and causes instability in the colloidal suspensions of CNCs [33].
The prior literature focuses only on CNF and CNC suspensions, but the dropping technique involves a cellulose solution, where cellulose molecules are dissolved in aqueous solutions of NaOH and urea. With the addition of salt, the viscosity of the CNC suspension increases drastically due to an increase in aggregation, leading to a significant decrease in the zeta potential [34]. In contrast, when CNF are fully dissolved in NaOH/urea solutions, the cellulose chains are freed from the fibrillar structure through the breakage of hydrogen bonds in the crystalline regions, resulting in a homogenous mixture of the smaller cellulose clusters distributed throughout the NaOH solution [35,36]. Increasing the salt concentration can then cause the dissolved cellulose to forms larger aggregates and form gel networks [28,29,37,38]. During the dropping technique, the salt concentration varies rapidly as the neutralization reaction proceeds. Thus, we hypothesize that the salt fluctuations are causing significant changes in aggregation behavior and kinetics, leading to non-uniform internal bead structures and gel networks.
In this work, we explored the addition of salt to cellulose solutions prior to dropping as a tool to tune the micro and macro structure of cellulose microgels. Our goal was to achieve structural uniformity and reduce variability in mechanical properties for microgels fabricated using the dropping technique. To address the instability caused by the salt produced during coagulation in an HCl bath, we added salt to the cellulose solutions to overcome the rapid aggregation that leads to colloidal instability in cellulose solutions. We also compared salt addition to physical methods of aggregation (thermo-gel) to decouple cellulose aggregation caused by the increase in temperature of the coagulation bath from the aggregation caused by ionic salt formation. We show that thermal gelation is not sufficient to overcome the structural irregularities caused by salt formation and that balancing solution viscosity with the addition of salt is highly effective at achieving structural uniformity and reproducible mechanical properties. Additionally, we provide a critical 3-dimensional viewpoint of the effects of salt on the internal structure of cellulose microgel beads.
2. Materials and Methods
2.1. Materials
Fibrous cotton linter pulp cellulose, hydrochloric acid (ACS reagent, 37%), urea, sodium chloride, sodium hydroxide (ACS reagent, > 97%) pellets, pepsin, potassium dihydrogen phosphate, and trypsin were purchased from Millipore Sigma.
2.2. Fabrication of Neat (Control) Cellulose Solutions
Cotton linter pulp was dissolved in a solution of 7 wt% NaOH, 12 wt% urea, and 81 wt% water to obtain an overall solution of 5 wt% cellulose. The solution was transferred to a jacketed beaker connected to a chiller at -10C and allowed to stir until a transparent solution was observed. The solutions were degassed by centrifugation at -10C and 8000 rpm.
2.3. Fabrication of Salt-gel Solutions
Salt pre-gelled (salt-gel) solutions were formed following the same procedure as the neat cellulose solutions with the following modification: NaCl (0.5 wt% (111 mM), 1 wt% (225 mM), 2 wt% (449 mM), and 3 wt% (673 mM)) was added to the solution and stirred until fully dissolved before adding cellulose. The solution was transferred to a jacketed beaker connected to a chiller at -10C and allowed to stir until a transparent solution was observed. The solutions were degassed by centrifugation at -10C and 8000 rpm.
2.4. Fabrication of Thermo-gel Solutions
Thermally pre-gelled (thermo-gel) solutions were formed following the same procedure as the neat cellulose solutions. After degassing, the centrifuge tube is removed and placed in a water bath with the liquid level in the centrifuge tube completely submerged under the water level of the water bath. The bath temperature was set to 25°C, 45°C, or 65°C. Each trial was conducted in triplicate.
2.5. Heat Transfer Modeling for Thermo-gel Solutions
To minimize structural variability caused by heat transfer, Python was used to predict the temperature profile within the centrifuge tube as a function of bath temperature. These computational results were used to determine the water bath temperatures used to fabricate thermo-gels and were validated experimentally. For this model, the initial temperature of the cellulose solution is set to -10C, and heat transfer was modelled as a function of the temperature of the water medium.
To solve the heat equation in cylindrical coordinates, the heat transfer was considered only in the radial (r) direction [39].
The initial condition is that the temperature of the cellulose solution is -10C. The first boundary condition is for the outer surface of the centrifuge tube, which is in contact with the water medium, and the conductive heat flux is equal to that of water. The second boundary condition is that, at the center of the tube (), the temperature gradient over time is finite.
2.6. Microgel Formation via the Dropping Technique
5 mL of cellulose solution (neat, salt-gel, or thermo-gel) was loaded into a syringe and dropped at a flowrate of 0.2 mL/min from a horizontally-oriented 30-gauge needle at a dropping height of 1 cm from a 2 M HCl coagulation bath (Figure 1). The 2 M HCl coagulation bath was held at with constant stirring of 100 rpm to prevent the beads from settling at the bottom of the beaker and to ensure uniform concentration throughout the coagulation bath. Once all of the cellulose solution was added to the bath, the cellulose beads were continuously stirred at 100 rpm for 2 hours. The beads were washed with a total of 600 mL of deionized water (200 mL, 3x). After the last wash, a 0.1 M NaOH solution was added dropwise to the DI water bath containing the rinsed beads until a neutral pH was obtained. The beads were removed from the bath and placed in a centrifuge tube with fresh DI water. The centrifuge tube was placed in an incubated shaker at 25C and an agitation rate of 100 rpm for 24 hours to allow the microgels to equilibrate. Finally, the beads were flash frozen with liquid nitrogen and freeze-dried using a LabConco FreeZone Freeze-Dryer.
2.7. Determination of Viscosity
Approximately 10 mL of cellulose/NaOH/urea solution was placed in a Ubbelohde viscometer, and the time was recorded for the solution to move from one specified point to the another. The viscosity can be calculated using Equation 4
where is the viscosity of the solution in cP, is the Ubbelohde viscometer specific constant, is density in g/cm3, and is time in seconds [42].
2.8. Determination of Particle Size, Electrophoretic Mobility (EPM), and Zeta Potential
Particle size and electrophoretic mobility were measured using dynamic light scattering (DLS) via a Malvern Zetasizer Nano ZS. Zeta potential was then calculated using the Smoluchowski model shown in Equation 5
where is the viscosity of the solution in cP, is the electrophoretic mobility in mcm/Vs, is the dielectric constant for a cellulose/sodium hydroxide/urea/water mixture (68.03), is the permittivity of free space (8.85 x 10⁻¹² C2/Jm) [33,43,44].
2.9. Microgel Size and Shape Characterization
Image J was used to measure the diameter of the selected cellulose beads and calculate the volume, area, and perimeter [45]. The circularity of the beads was quantified using Equation 6,
where is the circularity, is the area, and is the perimeter [46]. The resulting size and circularity distributions were fitted to a normal distribution and statistical analysis was used to determine statistical significance.
2.10. Scanning Electron Microscopy (SEM)
The microstructure of neat cellulose, salt-gel, and thermo-gel beads were analysed using a ThermoFisher Scientific Phenom ProX Desktop Electron Microscope with a voltage of 5 kV and a magnification of 2000X or 15000X. Both surface and cross-sectional images were taken. The beads were sputter coated with gold using a Q150T ES Plus Electron Microscopy Sciences Sputter Coater prior to analysis.
2.11. Energy-Dispersive X-ray Spectroscopy (EDS)
Energy-Dispersive X-ray Spectroscopy (EDS) analysis was performed on neat cellulose and salt-gel beads using an INCA X-Stream 2 Energy-Dispersive X-ray Spectrometer in combination with a ZEISS EVO50 Scanning Electron Microscope with a voltage of 5 kV. Neat cellulose and salt-gel beads were examined both prior to and after washing to determine the elemental make-up in each sample. Analysis was performed on both the surface and cross-section of the beads to determine if salt was present after fabrication and neutralization (Table S3).
2.123. D X-ray Computer Tomography (Nano-CT)
Mounted cellulose beads were mounted on toothpicks and scanned with an air filter in a ZEISS Xradia Versa 3D X-ray Computed Tomography (CT) Scanner with a 4X objective. 801 projections were taken as the sample rotated 360 degrees. To increase imagine quality, the binning was set to 8 and the exposure time was set to 0.5 s. A voltage of 50 kV and power of 2 W was used throughout the duration of scanning. At the conclusion of scanning, the 2D projected images were transferred to the ZEISS Scout and Scan Control System software for reconstruction. 360-degree rotations of the 3-D reconstructions were created using FIJI [47].
2.13. Determination of Droplet Volume
The volume extruded from a syringe and dropped into the HCl coagulation bath was determined by dropping 5 mL of cellulose solution into a 10 mL graduated cylinder. During dropping, the total number of droplets was recorded. Therefore, to determine the volume of a droplet, the overall volume collected in the graduated cylinder was divided by the total number of droplets.
2.14. Simulated Gastrointestinal Tract Environment for Cellulose Beads
Cellulose beads were tested in a simulated gastrointestinal tract environment to understand the swelling and mechanical properties of the beads. Simulated gastric fluid (SGF) was prepared by dissolving 4.5 g of sodium chloride and 1.6 g of pepsin in 500 mL of water [24]. Simulated intestinal fluid (SIF) was prepared by dissolving 3.4 g of potassium dihydrogen phosphate and 5 g of trypsin in 500 mL of water [24]. Cellulose beads were first placed in SGF incubated at 37ºC for 2 hours with an 80-rpm agitation. At the conclusion of the two hours, the beads were removed from the SGF and then placed in SIF for 6 hours at 37ºC with an 80-rpm agitation [37,38].
2.15. Mechanical Testing
The mechanical properties of neat cellulose, salt-gel, and thermo-gel beads were measured using the FEMTO Tools® Micromechanical Testing and Assembly System after undergoing the simulated gastrointestinal tract. To mechanically test the beads in the simulated gastrointestinal tract, 15 cellulose beads were first placed in SGF incubated at 37ºC for 2 hours with an 80-rpm agitation. At the conclusion of the two hours, the beads were tested via nanoindentation. Then, the beads were incubated in SIF for 6 hours at 37ºC with an 80-rpm agitation prior to undergoing nanoindentation. The Young’s modulus was determined using nanoindentation with a spherical ruby tip probe. Force versus displacement curves were fit to the Oliver-Pharr model to determine the Young’s modulus [48]. First, the data was fit to a power law expression (Equation 7) using linear regression to determine the fitting parameters,
where is the force, is the displacement, and are fitting parameters, and is the final unloading displacement. Next, the derivative of Equation 7 was taken to determine the stiffness of the unloading curve (Equation 8),
where is the stiffness, is the maximum displacement, and and are fitting parameters. The calculated stiffness from Equation 8 is then used to determine the contact depth (Equation 9),
where is the contact depth, is the punch geometry fitting parameter based on the probe, and is the maximum load. Since a spherical ruby tip probe is used, the punch geometry fitting parameter is 0.75. The contact area for a spherical probe is calculated using Equation 10,
where is the contact area and is the radius of the tip of the probe. The radius of the spherical tip ruby probe used was 125 µm. Next, the reduced elastic modulus is calculated using Equation 11,
where is the reduced elastic modulus and is a fitting parameter based on geometry equal to 1 for spherical tips. Finally, the reduced elastic modulus is used to calculate the Young’s modulus (Equation 12),
where is the Young’s modulus and is the Poisson’s ratio for cellulose [48].
2.16. Swelling Experiments for Cellulose Beads in a Simulated Gastrointestinal Tract Environment
Prior to incubating beads in SGF and SIF, images of fifteen neat cellulose, thermo-gel, and salt-gel beads were taken and analysed using ImageJ to determine the volume. The beads were then incubated in SGF at 37ºC for two hours with an 80-rpm agitation. At the completion of two hours, the beads were removed, and images were taken to determine the volume of the beads using ImageJ. After imaging, the beads were placed in SIF and incubated for six hours at 37ºC with an 80-rpm agitation. At the conclusion of six hours, the beads were removed, and images were taken to determine the volume. Using the initial and final volumes of the beads measured using Image J, the volume-swelling ratio was determined using Equation 13
where is the volume-swelling ratio, is the initial volume before subjecting the beads to the simulated gastrointestinal tract, and is the final volume after incubation [49,50].
3. Results and Discussion
3.1. Effect of Thermal Gelation on Cellulose Solutions
Thermal gelation of the cellulose solutions was used to decouple the effects of added salt from the effects of the increased temperature of the coagulation bath. Thermally driven gelation for a cellulose/urea/sodium hydroxide solution occurs between 10 to 65C [21]. By simply elevating the temperature of the solution from -10C to above 10C, we can increase the hydrophobic interactions of the cellulose fibers prior to coagulation and compare the strength of hydrophobic contacts to those formed by adding salt.
For this study, a model was used to predict the temperature distribution within the cellulose solution contained in a centrifuge tube. This computational approach helped to determine an ideal bath temperature that would minimize thermal gradients and reduce variability in assembly due to thermal fluctuations. The computational results were compared to experimental measurements, with a focus on the temperature profile over time of the cellulose solution at different bath temperatures (25°C, 45°C, and 65°C). The minimum water bath temperature was set to the temperature of the HCl coagulation bath (25°C) that would be used to form the microgel beads. The initial temperature of the cellulose solution was set to -10°C to match the experimental solution fabrication conditions. The heat transfer was modelled within the cylindrical coordinate system as a function of radius (r) and time.
Heat maps were used to visualize the radial temperature variation from the center (r=0m) to the surface (r=0.0075m) of the tube over time for each water bath temperature (Figure 2(a)). The heat map employs a color gradient from blue to yellow as a function of the temperature for each radial position over time. For all bath temperatures, the initial temperature of cellulose solution at the center of the tube (r=0) is -10C. As expected, a radial temperature gradient was observed and reached its maximum at the surface of the tube (r=0.0075m), where the temperature matched that of the surrounding water bath. As time progressed, the temperature gradient between each radial point decreased. Notably, the cellulose solution in the 25°C bath displayed lower thermal gradients as a function of radial distance and reached thermal equilibrium faster than the 45°C, and 65°C baths, with all bath temperatures reaching thermal equilibrium within 5-10 minutes. This indicates that a 25°C bath is less likely to cause thermal stress or variations in cellulose assembly and will potentially produce a more uniform thermo-gel solution.
The computational model was validated with experimental data, as shown in Figure 2(b)). Sealed centrifuge tubes (15mL, r=0.0075m) containing -10°C neat cellulose solutions were placed in a water bath with a set temperature of 25°C, 45°C, or 65°C. The temperature of the cellulose solution was measured over time. As shown in Figure 2(b)), most of the heat transfer in the centrifuge tube occurred within the first five minutes. After ten minutes in the water bath, all the cellulose solutions began to approach thermal equilibrium, which is consistent with the model’s predictions.
After 30 minutes, the centrifuge tubes were removed from the water bath and visually inspected for changes in color or transparency (Figure 2(c)). Changes in color, particularly to yellow, indicate decomposition and denaturation from chemical, photo, or thermal stress [51,52]. Changes in transparency indicate precipitation of cellulose from solution. The neat cellulose solution is transparent and colorless at -10C. The cellulose solution that was placed in the 25C bath remained transparent, but slight yellowing of the solution was observed after 30 minutes. For the 45C and 65C bath temperatures, the cellulose solutions display a distinct a yellow tint, and the 65C system became significantly less transparent. Therefore, the higher bath temperatures cause decomposition and/or precipitation of cellulose from solution and are not feasible for forming thermo-gels. Even the 25C system exhibited signs of thermal stress, indicating that using salt could be an advantageous way to prevent damage to the cellulose solution when using a pre-gelling approach to form uniform microgels.
3.2. Effect of Added Salt on Cellulose Solutions
Dropping a dissolved CNF/NaOH/Urea/Water solution into an HCl coagulation bath naturally makes saltwater, via the previously described neutralization reaction between NaOH and HCl:
We hypothesized that the addition of salt to the cellulose solution prior to dropping could screen the rapid, variable aggregation caused by the NaCl produced during the neutralization reaction of NaOH and HCl – effectively pre-assembling the cellulose molecules with salt. We measured the zeta potential, calculated using Smoluchowski’s model (Eqn. 5), and the intrinsic viscosity as a function of salt concentration to quantify and compare the salt-induced aggregation of a CNF suspension (CNF suspended in DI Water), a NaOH/urea aqueous solution, and a CNF solution (CNF dissolved in a NaOH/Urea aqueous solution) (Figure 3 and Table S1). Increasing the salt concentration did not increase the zeta potential or the viscosity of the CNF suspension or of the NaOH/Urea solution, which lead us to conclude that any electrostatic interactions in those systems were negligible. For the CNF solution, the zeta potential decreased and the viscosity increased significantly with increasing salt concentration. The CNF suspension in NaOH/Urea solution also showed slight decreases in zeta potential – indicating that the driving force for coagulation is related to the interactions between the CNF and the NaOH/Urea solution. The observed aggregation of dissolved CNF caused by increased salt concentration is likely due to the displacement of the hydroxyl ions that interrupt the hydrogen bonds between cellulose molecules. The “common ion effect” whereby excess Na+ ions introduced to the solution via the addition of salt disrupt the equilibrium concentration of the existing OH- ions, could explain the displacement of OH- from cellulose molecules [53]. Additionally, water has strong interactions with salt but tenuous interactions with cellulose, and the higher concentrations of salt could cause dewetting of the cellulose in preference for salt and disrupt the architecture of the salt bridges described by Arola et al [30].
By calculating the volume of each individual droplet, we determined that the NaCl concentration produced in a single droplet is ~2100 mM. Thus, when droplets of the cellulose solution are added to the coagulation bath, the neutralization reaction causes significant, variable fluctuations in the salt concentration in the droplet, which causes rapid flocculation as it forms the microgel – leading to significant variability in self-assembly and microstructure. To counteract the fluctuations in salt concentration, different salt concentrations (0.5, 1, 2, and 3 wt%) were added to neat cellulose solutions prior to dropping in the coagulation bath. The weight fractions represent salt concentrations of 112, 225, 449, and 673 mM, respectively.
We also hypothesized that the increase in viscosity of the CNF solution as a function of salt concentration would be beneficial for bead formation. If the salt concentration is high enough in the droplet, the cellulose molecules can form a uniform, elastic, percolated network that can quickly recover from the shear forces of being extruded from the syringe into the coagulation bath (decreasing tail formation). As the salt concentration increases, the viscosity and elasticity of the salt-gel solution increases to an upper bound where the solution becomes a rigid gel that can no longer be extruded through the syringe [30,54]. The addition of salt also allows for larger channels to form in the hydrogel network and increased water transport compared to hydrogels with lower concentrations of salt or solutions without salt [55]. All of the salt concentrations except for 3 wt% formed salt-gel solutions that could still be extruded through the syringe. Thus, we proceeded to form microgels from neat cellulose solutions, thermo-gel solutions, and salt-gel solutions with salt concentrations of 112, 225, and 449 mM, or 0.5, 1, and 2 wt%, respectively.
3.3. Effect of Thermal and Salt Gelation on Cellulose Bead Geometry
Neat cellulose control beads were fabricated using the dropping technique. 42% of the neat cellulose beads displayed tail formation, where the coagulated beads have a tear-drop geometry rather than a spherical geometry (Figure 4(a)). The diameter and circularity were used to quantify differences in bead geometry. Neat cellulose beads had an average diameter of 2.60 + 0.24 mm and a circularity of 0.80 + 0.10, where perfect spheres would have a circularity value of 1 (Figure 4). In previous work, neat cellulose beads had an average diameter of ~2-3 mm and ranged in circularity from ~0.68 to 0.90 [10]. However, no one has quantified the percentage of beads displaying tail formation. Instead, they correlated the change in circularity to fewer beads with tails being formed [10,56,57]. To increase circularity and decrease tail formation, the coagulation bath properties, such as temperature and concentration, and dropping height were adjusted. This work presents a new approach, screening ionic salt-induced aggregation in the cellulose solution, to improve bead size, shape, and reduce tail formation.
Thermo-gel solutions were fabricated by placing the degassed cellulose solutions in a 25C water bath for 30 minutes and immediately extruding the solution dropwise into a 2 M HCl coagulation bath. The percentage of tail formation for thermo-gel cellulose beads decreased to 27%, compared to the neat cellulose solution (Figure 4(a)). Thermo-gel cellulose beads had an average diameter of 2.19 + 0.06 mm and a circularity of 0.88 + 0.02 (Figure 4(b-c)). Thus, the thermo-gel cellulose beads had a lower diameter than the neat cellulose beads and only a slight increase in circularity.
The 0.5 wt% salt-gel beads displayed similar results to the neat cellulose beads, where 43% of the beads exhibited tail formation and the diameter and circularity values were 2.20 + 0.17 mm and 0.87 + 0.07, respectively. Cellulose solutions formed using lower salt concentrations have weaker contacts between cellulose fibers and are not able to recover from deformation or shear like the cellulose solutions formed using higher salt-concentrations.30 When beads are dropped using lower concentration salt-gel or neat cellulose solutions, the droplet is unable to recover from the tear drop conformation caused by shear forces before coagulation occurs, causing tail formation. Therefore, the data indicates that the salt concentration of 0.5 wt% does not provide the solution elasticity needed to decrease tail formation.
Adding 1 wt% NaCl into the cellulose solution decreased the number of tails observed in the beads to 18%. A higher circularity (0.91 + 0.04) and smaller bead diameter (2.19 + 0.10 mm) was also observed. Salt-gel solutions with higher salt concentrations can form more spherical beads due to the network elasticity imparted by the percolated network of salt bridges that improve the contact strength of the cellulose fibers. This enables the droplet to quickly recover from the shear forces of the syringe needle before coagulation locks in the teardrop structure – effectively reducing tail formation. The 2 wt% salt-gel beads gave better results compared to the neat cellulose beads and 0.5 wt% salt-gel beads (diameter = 2.36 + 0.22 mm, circularity = 0.91 + 0.07). However, the 2 wt% salt-gel beads had higher variability in diameter than the 1 wt% salt-gel beads, with no significant improvements to the circularity. Additionally, the 2 wt% salt beads had more tail formation (23% compared to 18%). At 2 wt%, the solution may be oversaturated with salt, leading to concentration gradients in the gel network that would increase variability [30]. The 1 wt% and 2 wt% salt-gel beads had a concentration of 225 and 449 mM, respectively, and had higher viscosities than the 0.5wt% gel. At these higher NaCl concentrations, the rapid aggregation occurs and the viscosity of the solution is beneficial to bead formation. When comparing the salt-gel beads to the thermo-gel beads, salt-gel beads had less variability in both the circularity and diameter. Salt-gel beads also had higher circularity values and lower diameter values. Thermo-gel beads have increases in viscosity due to thermal gelation, but the lack the salt concentration needed to screen rapid aggregation. Thus, both salt-screening and solution viscosity are important parameters to reduce variability for the dropping technique. Therefore, 1 wt% was determined to be the optimal salt concentration to add to the neat cellulose solutions to reduce tail formation and decrease variability in macroscopic features like bead diameter.
3.4. Effect of Thermal and Salt Gelation on the 3-D Structure
A salt concentration of 1 wt% was determined to be the optimal salt concentration to add to the neat cellulose solutions to reduce tail formation and decrease variability in macroscopic features like bead diameter. Scanning electron microscopy (SEM) was used to examine the internal pore structure of the microgels (Figure 5(a-f)). SEM images of the surface pore structure and high magnification images of the cross-section (15000X) are provided in Figures S1 and S2. For the neat cellulose and thermo-gel beads, a smaller pore architecture was observed. In comparison, salt-gel beads displayed a larger pore architecture, which indicates an easier diffusion pathway through the cellulose network. This is expected due to the restructuring and expansion of the hydration layers on cellulose fiber networks caused by the salt ions [30]. Techniques like scanning electron microscopy can provide visualization of the pore structure, but it is difficult to completely capture the internal structure of the bead due to the limited field of view. Therefore, we sought to use a non-destructive, 3-D imaging technique to visualize the interior of the beads post-fabrication.
X-ray nano-computed tomography (nano-CT) is a 3-D X-ray imaging technique that can non-destructively scan an object and use the density distribution to visualize internal structures. Each scan creates an image slice that can be reconstructed to show the 3-D object without damaging the sample, providing a unique opportunity to visualize undisturbed internal architectures. Beads fabricated from neat cellulose, thermo-gel, and salt-gel solutions were stained, flash frozen with liquid nitrogen and freeze dried then imaged via nano-CT to visualize their internal structure (Figure 5(d-f)). 3-D reconstruction of the nano-CT scans showed that the neat cellulose beads displayed non-uniformity throughout (Figure 5(d)). Throughout the bead, there are non-uniform clusters of cellulose fibers along with significant voids caused by the disconnectivity of the fiber assemblies. Additionally, the center of the bead appears to be highly ordered and much more densely packed than the surrounding shell. We hypothesize that, upon entering the coagulation bath, an initial shell is formed with the pore architecture shown in Figure 5(a). Following the formation of the shell, diffusion slows due to the formation of the gel network – causing increases in local salt concentrations as the neutralization reaction proceeds. This effect would have the most drastic consequences at the center of the bead, where the NaCl produced would be present in the highest concentration due to slow diffusion from the center of the bead back through the shell.
This hypothesis is further supported by the 3-D reconstruction of the thermo-gel beads (Figure 5(e)). Thermo-gel beads display more structural uniformity, with a clearly interconnected gel network throughout most of the bead. However, thermo-gel beads are still subject to the salt fluctuations caused by the neutralization reaction. Though smaller in scale than the neat cellulose bead, the center of the thermo-gel bead shows a clear change in structure. As with the neat cellulose beads, the diffusion limitations are much higher at the center of the bead, leading to higher salt concentrations and changes in the assembly and microstructure. Therefore, thermally gelling the cellulose solution can improve uniformity only to the extent that it can overcome the influence of salt produced by the neutralization reaction.
Elemental analysis of the surface and cross-section of salt-gel beads confirmed that no salt remained in the beads after neutralization (Table S2 and Figure S3). Excitingly, the 1 wt% salt-gel beads showed uniformity throughout the 3-D reconstruction (Figure 5(f)). A highly uniform bead is produced with no observable changes in the fiber network architecture. We concluded that adding NaCl to the cellulose solution prior to coagulation increases elasticity of the cellulose network and successfully screens the effects of the salt produced from the neutralization reaction (Figure 6). A balance of solution viscosity and salt-screening prevents the non-uniform aggregation and coagulation of the dissolved cellulose. Ultimately, this helps reduce the variability in structure from the molecular scale to the macroscale caused by the fluctuations in salt concentration from the dropping technique. This phenomenon is also evidenced by Figure 5(d-e) in terms of variability in circularity and diameter for cellulose solutions with varying salt concentrations and in the nano-CT of 0.5 wt% and 2 wt% beads (Figure S4). As seen in Figure S4(a-b), the 0.5 wt% salt-gel beads displayed internal structures that varied from uniform to non-uniform with tails, explaining the higher variability in the bead geometry compared to the other salt-gel beads. However, when the salt concentration was increased using 1 or 2 wt% salt-gel beads, the variability was significantly decreased. The 2 wt% salt-gel beads show uniformity throughout; however, the internal structure is much more dense, indicating a more rigid bead.
3.5. Proof of Concept: Mechanical Stability and Swelling Properties of Cellulose Beads in a Simulated Gastrointestinal Tract (SIT)
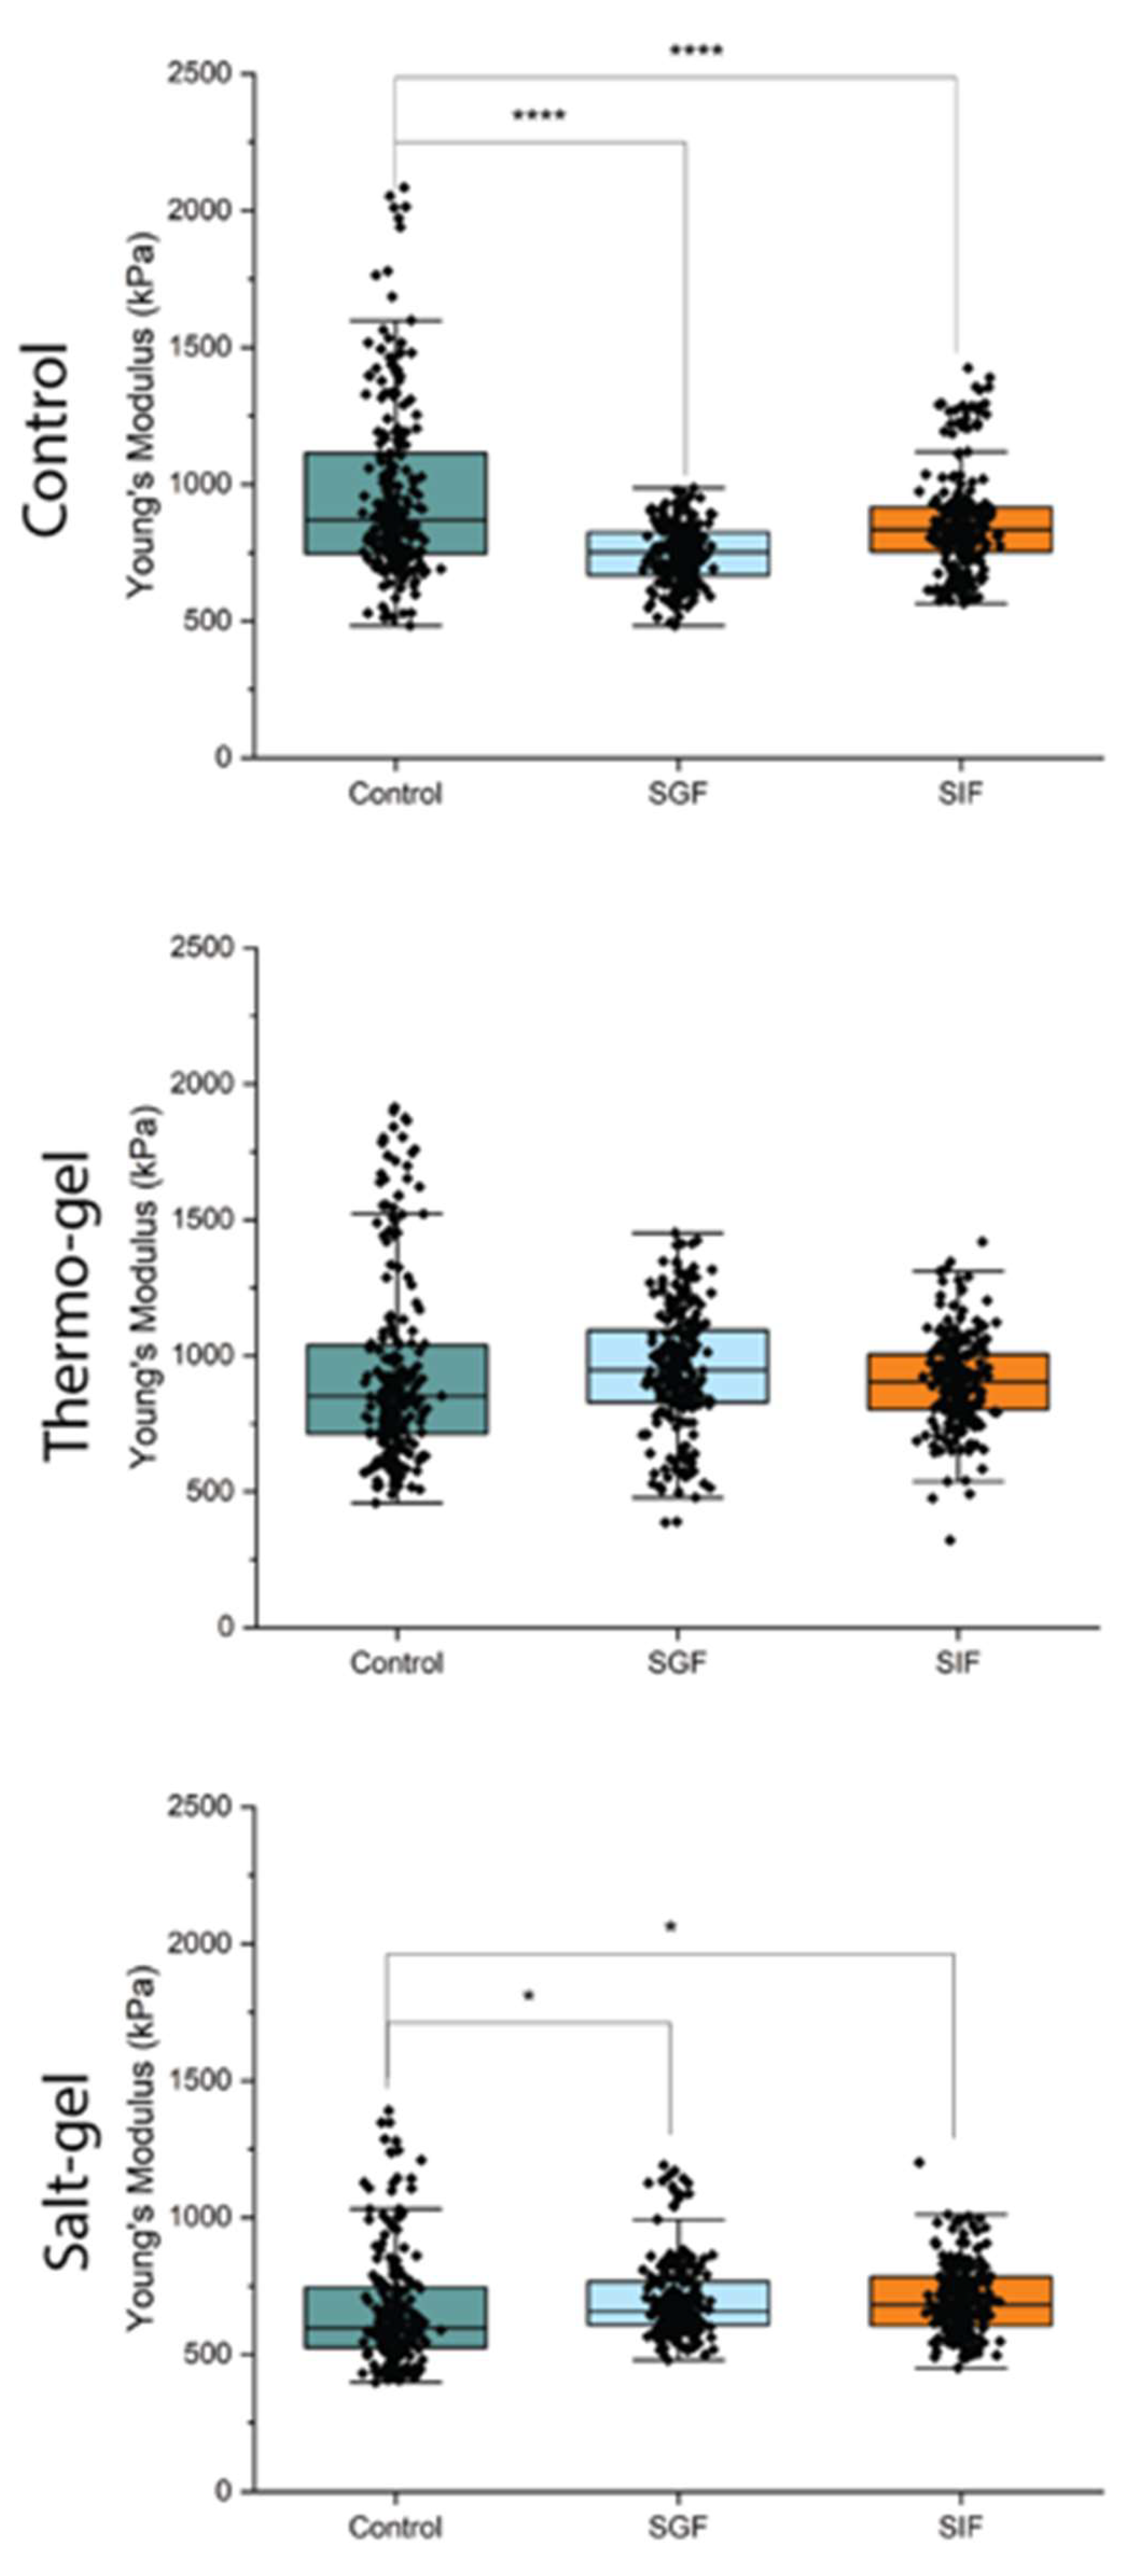
Cellulose beads are of significant interest for use in drug delivery applications due to their nondigestible properties in the gastrointestinal tract (GIT), making them a promising material platform for sustained drug release [9]. As proof of concept for the improvements to the cellulose bead material properties for GIT applications through the addition of salt, mechanical testing and swelling studies were performed in simulated GIT fluids. The mechanical properties of hydrated neat cellulose, thermo-gel, and salt-gel beads were examined to portray the effects of the 3-D architecture on mechanical variability. Nanoindentation was performed on hydrated, as fabricated beads and force vs. displacement data was fit to the Oliver-Pharr model using MATLAB® to determine the Young’s modulus (Figure 7 and Figure S5). As proof of concept for using these cellulose beads for oral drug delivery applications, the beads were tested in a control (water) and a simulated gastrointestinal tract environment (SGF and SIF). The neat cellulose beads displayed the highest variability in mechanics with an average Young’s modulus of 966 + 318 kPa in the control environment. As the beads underwent the simulated gastrointestinal tract, there was a statistically significant decrease in mechanics with a Young’s modulus of 747 + 106 kPa in the SGF and 861 + 188 kPa in the SIF. This result is comparable to mechanical testing results for cellulose beads reported in the literature (Young’s modulus = 450 kPa) [58]. The thermo-gel beads displayed a similar Young’s modulus of 941 + 364 kPa in the control environment but, unlike the neat cellulose beads, retained similar Young’s moduli values in the simulated gastrointestinal tract with a Young’s modulus of 952 + 224 kPa in SGF and 906 + 165 kPa in SIF. The salt-gel cellulose beads displayed significantly lower variability in Young’s moduli with values of 662 + 213 kPa in the control environment, 699 + 142 kPa in the SGF environment, and 700 + 127 kPa in the SIF environment, respectively. Coupled with the 3-D reconstruction data, we can confirm that the notorious variations in mechanical properties exhibited by cellulose beads fabricated using the dropping technique are largely due to the structural variability caused by the salt fluctuations produced during coagulation. As seen in the control environment (water), neat cellulose and thermo-gel beads displayed similar results with high variability. On the other hand, salt-gel beads displayed lower Young’s moduli as well as lower variability; therefore, adding salt to the cellulose solution is a simple but very effective way to reduce variability by increasing structural uniformity and network elasticity throughout the solution before coagulation. The uniformity and elasticity, coupled with the screening of salt fluctuations, ultimately controls the macro- and microstructure of the coagulated beads (i.e., size, tails, and porosity) leading to reproducible mechanical properties. Even though salt-gel beads displayed the least variability in mechanical properties, statistically significant variability was present. In future work, the dropping procedure will be optimized using various salt and bath concentrations to better tune the coagulation process and further decrease variability.
In addition to mechanical testing, swelling studies were performed on neat cellulose, thermo-gel, and salt-gel beads in water (control), SGF, and SIF at 37ºC to examine the effect of the salt concentration on bead size and shrinking/swelling in different environments (Table S3). All three bead platforms incubated in SGF displayed shrinkage after 2 hours (0.77 + 0.52 (neat cellulose), 0.93 + 0.50 (thermo-gel), 0.77 + 0.16 (salt-gel)). The observed shrinkage in SGF agrees with previously reported values in the literature for cellulose nanofiber beads that have not undergone surface modification and can be explained by weak electrostatic interactions on the surface, as well as the introduction of hydrogen bonds between the carboxyl groups [24,59]. After incubation in SGF for two hours, the beads were placed in SIF for 6 hours. All three bead platforms displayed swelling in the SIF environment compared to the SGF environment. Neat cellulose beads had a swelling ratio of 1.08 + 0.27, compared to themo-gel beads at 1.02 + 0.68 and salt-gel beads at 1.05 + 0.11. The observed swelling in SIF also agrees with previously reported values [24]. Swelling in SIF is attributed to the presence of large electrostic repulsive forces that break the hydrogen bonds found in the beads [24,59]. Based on the swelling studies, neat and thermo-gel beads exhibit higher variability compared to the salt-gel beads. Swelling studies coupled with mechanical testing confirms that the variability in material performans can be attributed to structural variations caused by salt concentration fluctuations from the neutralization reaction. Therefore, a facile, effective way to reduce structural variability while increasing structural uniformity is to add salt to the cellulose solution prior to coagulation. In terms of drug delivery applications, structural and mechanical uniformity are important features that influence mass transport properties and diffusion [60]. For delivery to the GIT, the beads must be able to release the drug in a desired GIT environment. For example, if the therapeutic needs to be delivered to the intestines, they need to be able to survive both the gastic tract (pH ~ 1.5) and the intestinal tract (pH ~ 7.5) without releasing the loaded drug prematurely or the material degrading. The salt-gel beads would be more beneficial in this application due to their shrinkage in the intestinal fluid with lower variablibility than the neat cellulose beads, and their expansion in the intestinal tract to facilitate diffusion – also with lower variability thant the neat ellulose and thermo-gel beads. In the future, drug loading and release studies will be used to examine the advantages of a uniform 3-D architecture beyond reducing mechanical variability. The scientific relevance of examining diffusion through the beads also extends beyond drug delivery to other applications such as water treatment and remediation [61,62].
4. Conclusions
The dropping technique often used to form cellulose microgels causes high concentrations of residual salt to form due to the neutralization reaction of NaOH and HCl. The residual salt leads to structural variability in the microgel beads during coagulation, causing significant variability in mechanical properties. Previously used thermal gelation techniques provide some benefit to structural uniformity, due to increased solution elasticity but are sensitive to thermal stress and the production of residual salt during coagulation.
Adding salt to neat cellulose solutions effectively improves structural uniformity and drastically reduces variability in mechanical properties compared to neat cellulose solutions and thermo-gel solutions. Specifically, NaCl creates elastic, self-assembled cellulose networks in solution with larger pore architectures that easily recover from shear stress and reduce diffusion limitations during coagulation. Additionally, adding 1 wt% NaCl in the salt-gel solution effectively screens the aggregation effects of the salt produced by the neutralization reaction. The screening effect is a function of NaCl concentration, but the overall improvement to 3-D uniformity is a balance between salt-screening and solution viscosity. Overall, adding salt to cellulose/NaOH solutions is a facile and effective tool to reduce variability in structural and mechanical properties of cellulose microgel beads formed using the dropping technique.
Supplementary Materials
The following supporting information can be downloaded at the website of this paper posted on Preprints.org.
Author Contributions
Conceptualization, S.L.M.A.; Methodology, M.T.G., S.A.S.E., A.P.Y., and S.L.M.A.; Software, M.T.G., S.A.S.E., and L.T.M.; Validation, M.T.G., S.A.S.E., A.P.Y., L.T.M., and S.L.M.A.; Formal Analysis, M.T.G. and S.A.S.E.; Investigation, M.T.G., S.A.S.E., and S.L.M.A.; Writing – Original Draft, M.T.G., S.A.S.E., A.P.Y., and S.L.M.A.; Writing – Review and Editing, M.T.G. and S.L.M.A.; Supervision, S.L.M.A.; Funding Acquisition, S.L.M.A.
Data Availability Statement
The data supporting this article have been included as part of the Supplementary Information.
Acknowledgments
M.T.G., S.A.S.E., A.P.Y., L.T.M., and S.L.M.A. would like to thank Samuel Ginn College of Engineering, the Department of Chemical Engineering, and the OVPR Office of Sponsored Programs (RSP Pilot 2) at Auburn University for funding and support of this project. M.T.G. and S.L.M.A. would like to thank Kris Van de Voorde for his assistance with graphic design. M.T.G. and S.L.M.A. would like to acknowledge Dr. Michael Miller at the Research Instrumentation Facility for his assistance in training and use of the Energy-Dispersive X-ray Spectroscopy located in the Auburn University Harrison School of Pharmacy. M.T.G. and S.L.M.A. would like to acknowledge Dr. Allan David and Kate Handel for access to their lab’s ZetaSizer. This work was supported by the facilities in the Auburn University Center for Polymers and Advanced Composites (CPAC). We would like to thank Dr. Ramsis Farag and Dr. Lauren Beckingham for their assistance with Nano-CT. We would like to thank the Auburn University OVPR Research Support Program for funding and support of this project.
Conflicts of Interest
The authors declare that the research was conducted in the absence of any commercial or financial relationships that could be construed as a potential conflict of interest.
References
- Tredenick, E. C. & Farquhar, G. D. Dynamics of Moisture Transport in Plant Cuticles: The Role of Cellulose. Nature Co 2021, 12, 2–9. [Google Scholar]
- Alberts, Bruce; Raff, Martin; Lewis, Julian; Walter, Peter; Roberts, Keith; Johnson, A. Molecular Biology of the Cell. (Garland Science, New York, 2002).
- Gibson, L. J. The hierarchical structure and mechanics of plant materials. J R Soc Interface 2012, 9, 2749–2766. [Google Scholar] [CrossRef] [PubMed]
- Fredricks, J. L.; et al. Hierarchical biopolymer-based materials and composites. Journal of Polymer Science 2023, 2585–2632. [Google Scholar] [CrossRef]
- Fratzl, P. & Weinkamer, R. Nature’s hierarchical materials. Prog Mater Sci 2007, 52, 1263–1334. [Google Scholar]
- Kundu, R. , Mahada, P., Chhirang, B. & Das, B. Cellulose hydrogels: Green and sustainable soft biomaterials. Current Research in Green and Sustainable Chemistry 2022, 5, 100252. [Google Scholar] [CrossRef]
- McNamara, J. , Morgan, J. L. W. & Zimmer, J. A Molecular Description of Cellulose Biosynthesis. Physiol Behav 2018, 176, 139–148. [Google Scholar] [CrossRef]
- Nie, G.; et al. Cellulose-based hydrogel beads: Preparation and characterization. Carbohydrate Polymer Technologies and Applications 2021, 2, 100074. [Google Scholar] [CrossRef]
- Fujimori, S. Humans have intestinal bacteria that degrade the plant cell walls in herbivores. World J Gastroenterol 2021, 27, 7784–7791. [Google Scholar] [CrossRef]
- Trygg, J. , Fardim, P., Gericke, M., Mäkilä, E. & Salonen, J. Physicochemical design of the morphology and ultrastructure of cellulose beads. Carbohydr Polym 2013, 93, 291–299. [Google Scholar] [CrossRef]
- Budtova, T. & Navard, P. Cellulose in NaOH–water based solvents: a review. Cellulose 2016, 23, 5–55. [Google Scholar] [CrossRef]
- Martin-Bertelsen, B.; et al. Revisiting the dissolution of cellulose in NaOH as ‘Seen’ by X-rays. Polymers (Basel) 2020, 12, 1–15. [Google Scholar] [CrossRef]
- Lu, A. , Liu, Y., Zhang, L. & Potthast, A. Investigation on metastable solution of cellulose dissolved in NaOH/urea aqueous system at low temperature. Journal of Physical Chemistry B 2011, 115, 12801–12808. [Google Scholar] [CrossRef] [PubMed]
- Qin, X. , Lu, A., Cai, J. & Zhang, L. Stability of inclusion complex formed by cellulose in NaOH/urea aqueous solution at low temperature. Carbohydr Polym 2013, 92, 1315–1320. [Google Scholar] [CrossRef] [PubMed]
- Zhou, J. & Zhang, L. Solubility of Cellulose in NaOH/Urea Aqueous Solution. Polymer Journal 2000 32:10 2000, 32, 866–870. [Google Scholar] [CrossRef]
- Zhou, J. , Zhang, L. & Cai, J. Behavior of cellulose in NaOH/Urea aqueous solution characterized by light scattering and viscometry. J Polym Sci B Polym Phys 2004, 42, 347–353. [Google Scholar] [CrossRef]
- Qi, H. , Chang, C. & Zhang, L. Effects of temperature and molecular weight on dissolution of cellulose in NaOH/urea aqueous solution. Cellulose 2008, 15, 779–787. [Google Scholar] [CrossRef]
- Xia, Y. A Facile Way for Preparation of Cellulose Beads With High Homogeneity, Low Crystallinity, and Tunable - Internal Structure. Res Sq 2021, 1–8. [Google Scholar]
- Kamal Mohamed, S. M. , Ganesan, K., Milow, B. & Ratke, L. The effect of zinc oxide (ZnO) addition on the physical and morphological properties of cellulose aerogel beads. RSC Adv 2015, 5, 90193–90201. [Google Scholar] [CrossRef]
- Li, H.; et al. Macro- And Microstructural Evolution during Drying of Regenerated Cellulose Beads. ACS Nano 2020, 14, 6774–6784. [Google Scholar] [CrossRef]
- Cai, J. & Zhang, L. Unique gelation behavior of cellulose in NaOH/urea aqueous solution. Biomacromolecules 2006, 7, 183–189. [Google Scholar] [CrossRef]
- Li, H. , Mystek, K., Wågberg, L. & Pettersson, T. Development of mechanical properties of regenerated cellulose beads during drying as investigated by atomic force microscopy. Soft Matter 2020, 16, 6457–6462. [Google Scholar] [CrossRef]
- Xie, F. , De Wever, P., Fardim, P. & Van Den Mooter, G. Tempo-oxidized cellulose beads as potential Ph-responsive carriers for site-specific drug delivery in the gastrointestinal tract. Molecules 2021, 26, 1–14. [Google Scholar]
- Zhang, H.; et al. A pH-Responsive Gel Macrosphere Based on Sodium Alginate and Cellulose Nanofiber for Potential Intestinal Delivery of Probiotics. ACS Sustain Chem Eng 2018, 6, 13924–13931. [Google Scholar]
- Liang, S. , Zhang, L., Li, Y. & Xu, J. Fabrication and properties of cellulose hydrated membrane with unique structure. Macromol Chem Phys 2007, 208, 594–602. [Google Scholar] [CrossRef]
- Schroeter, B.; et al. Cellulose aerogel particles: control of particle and textural properties in jet cutting process. Cellulose 2021, 28, 223–239. [Google Scholar] [CrossRef]
- Gao, J. , Haidar, G., Lu, X. & Hu, Z. Self-association of hydroxypropylcellulose in water. Macromolecules 2001, 34, 2242–2247. [Google Scholar] [CrossRef]
- Wang, M.; et al. Salting-out effect promoting highly efficient ambient ammonia synthesis. Nat Commun 2021, 12, 1–10. [Google Scholar] [CrossRef] [PubMed]
- Nishida, K.; et al. Salting-out and salting-in effects of amphiphilic salt on cloud point of aqueous methylcellulose. Process Biochemistry 2017, 59, 52–57. [Google Scholar] [CrossRef]
- Arola, S.; et al. On the mechanism for the highly sensitive response of cellulose nanofiber hydrogels to the presence of ionic solutes. Cellulose 2022, 29, 6109–6121. [Google Scholar] [CrossRef]
- Kádár, R. , Spirk, S. & Nypelö, T. Cellulose Nanocrystal Liquid Crystal Phases: Progress and Challenges in Characterization Using Rheology Coupled to Optics, Scattering, and Spectroscopy. ACS Nano 2021, 15, 7931–7945. [Google Scholar] [CrossRef]
- George, J. & Sabapathi, S. N. Cellulose nanocrystals: Synthesis, functional properties, and applications. Nanotechnol Sci Appl 2015, 8, 45–54. [Google Scholar] [PubMed]
- Cao, T. & Elimelech, M. Colloidal stability of cellulose nanocrystals in aqueous solutions containing monovalent, divalent, and trivalent inorganic salts. J Colloid Interface Sci 2021, 584, 456–463. [Google Scholar] [PubMed]
- Zhong, L. , Fu, S., Peng, X., Zhan, H. & Sun, R. Colloidal stability of negatively charged cellulose nanocrystalline in aqueous systems. Carbohydr Polym 2012, 90, 644–649. [Google Scholar] [PubMed]
- Acharya, S.; et al. Utilization of cellulose to its full potential: A review on cellulose dissolution, regeneration, and applications. Polymers (Basel) 2021, 13. [Google Scholar] [CrossRef]
- Väisänen, S.; et al. Cellulose dissolution in aqueous NaOH–ZnO: cellulose reactivity and the role of ZnO. Cellulose 2021, 28, 1267–1281. [Google Scholar] [CrossRef]
- Phan-Xuan, T.; et al. Aggregation behavior of aqueous cellulose nanocrystals: the effect of inorganic salts. Cellulose 2016, 23, 3653–3663. [Google Scholar] [CrossRef]
- Gubitosi, M.; et al. Stable, metastable and unstable cellulose solutions. R Soc Open Sci 2017, 4. [Google Scholar] [CrossRef]
- Bird, R. B., Stewart, W. E., & Lightfoot, E. N. Transport Phenomena. John Wiley & Sons. 266–450 (2001).
- Theodoulidis, T. , Skarlatos, A. & Tytko, G. Computation of Eigenvalues and Eigenfunctions in the Solution of Eddy Current Problems. Sensors 2023, 23, 1–10. [Google Scholar] [CrossRef]
- Esterhazy, S.; et al. Scalable numerical approach for the steady-state ab initio laser theory. Phys Rev A 2014, 90, 1–15. [Google Scholar] [CrossRef]
- Garnett, M. T. , Senthil Kumar, H. K., Beckingham, B. S. & Alexander, S. L. M. Extraction of cellulose from restaurant food waste. RSC Sustainability 2024, 2, 170–178. [Google Scholar] [CrossRef]
- Zhang, Z. , Tompsett, G. A., Granados-Focil, S., Lambert, C. R. & Timko, M. T. Rational design of solid-acid catalysts for cellulose hydrolysis using colloidal theory. Physical Chemistry Chemical Physics 2021, 23, 10236–10243. [Google Scholar] [PubMed]
- Sze, A. , Erickson, D., Ren, L. & Li, D. Zeta-potential measurement using the Smoluchowski equation and the slope of the current-time relationship in electroosmotic flow. J Colloid Interface Sci 2003, 261, 402–410. [Google Scholar] [PubMed]
- Schneider, C. A. , Rasband, W. S. & Eliceiri, K. W. NIH Image to ImageJ: 25 years of Image Analysis HHS Public Access. Nat Methods 2012, 9, 671–675. [Google Scholar] [PubMed]
- Olson, E. Particle Shape Factors and their use in Image Analysis – Part I: Theory. Particle Technology 2011, 1–18. [Google Scholar]
- Schindelin, J.; et al. Fiji - an Open platform for biological image analysis. Nat Methods 2009, 9, 1–15. [Google Scholar] [CrossRef]
- Oliver, W. C. , Pharr, G. M. & Introduction, I. An improved technique for determining hardness and elastic modulus using load and displacement sensing indentation experiments. J. Mater. Res. 1992, 7, 1564–1583. [Google Scholar]
- Losi, E.; et al. Investigation of the swelling behavior of dome matrix drug delivery modules by high-resolution x-ray computed tomography. J Drug Deliv Sci Technol 2013, 23, 165–170. [Google Scholar] [CrossRef]
- Ishrat, U. & Rafiuddin. Synthesis, characterization and electrical properties of Titanium molybdate composite membrane. Desalination 2012, 286, 8–15. [Google Scholar]
- Matsuo, M. , Umemura, K. & Kawai, S. Kinetic analysis of color changes in cellulose during heat treatment. Journal of Wood Science 2012, 58, 113–119. [Google Scholar] [CrossRef]
- Ahn, K.; et al. Yellowing and brightness reversion of celluloses: CO or COOH, who is the culprit? Cellulose 2019, 26, 429–444. [Google Scholar] [CrossRef]
- Li, P.; et al. Common-Ion Effect Triggered Highly Sustained Seawater Electrolysis with Additional NaCl Production. Research 2020, 2020. [Google Scholar] [CrossRef] [PubMed]
- Pääkko, M.; et al. Enzymatic hydrolysis combined with mechanical shearing and high-pressure homogenization for nanoscale cellulose fibrils and strong gels. Biomacromolecules 2007, 8, 1934–1941. [Google Scholar] [CrossRef] [PubMed]
- Sim, K. , Lee, J., Lee, H. & Youn, H. J. Flocculation behavior of cellulose nanofibrils under different salt conditions and its impact on network strength and dewatering ability. Cellulose 2015, 22, 3689–3700. [Google Scholar] [CrossRef]
- Gericke, M. , Trygg, J. & Fardim, P. Functional cellulose beads: Preparation, characterization, and applications. Chem Rev 2013, 113, 4812–4836. [Google Scholar] [PubMed]
- Blachechen, L. S. , Fardim, P. & Petri, D. F. S. Multifunctional cellulose beads and their interaction with gram positive bacteria. Biomacromolecules 2014, 15, 3440–3448. [Google Scholar] [PubMed]
- Li, H. , Mystek, K., Wågberg, L. & Pettersson, T. Development of mechanical properties of regenerated cellulose beads during drying as investigated by atomic force microscopy. Soft Matter 2020, 16, 6457–6462. [Google Scholar] [CrossRef]
- Bannikova, A. , Rasumova, L., Evteev, A., Evdokimov, I. & Kasapis, S. Protein-loaded sodium alginate and carboxymethyl cellulose beads for controlled release under simulated gastrointestinal conditions. Int J Food Sci Technol 2017, 52, 2171–2179. [Google Scholar]
- O’Connor, S. M. & Gehrke, S. H. Particle size distribution analysis as a characterization method for gel particles produced in suspension reactors. Polymer (Guildf) 2001, 42, 1541–1546. [Google Scholar]
- Abdelhamid, H. N. & Mathew, A. P. Cellulose-Based Materials for Water Remediation: Adsorption, Catalysis, and Antifouling. Frontiers in Chemical Engineering 2021, 3, 1–23. [Google Scholar]
- Karlsson, R. M. P. , Larsson, P. T., Pettersson, T. & Wågberg, L. Swelling of Cellulose-Based Fibrillar and Polymeric Networks Driven by Ion-Induced Osmotic Pressure. Langmuir 2020, 36, 12261–12271. [Google Scholar] [CrossRef]
Figure 1.
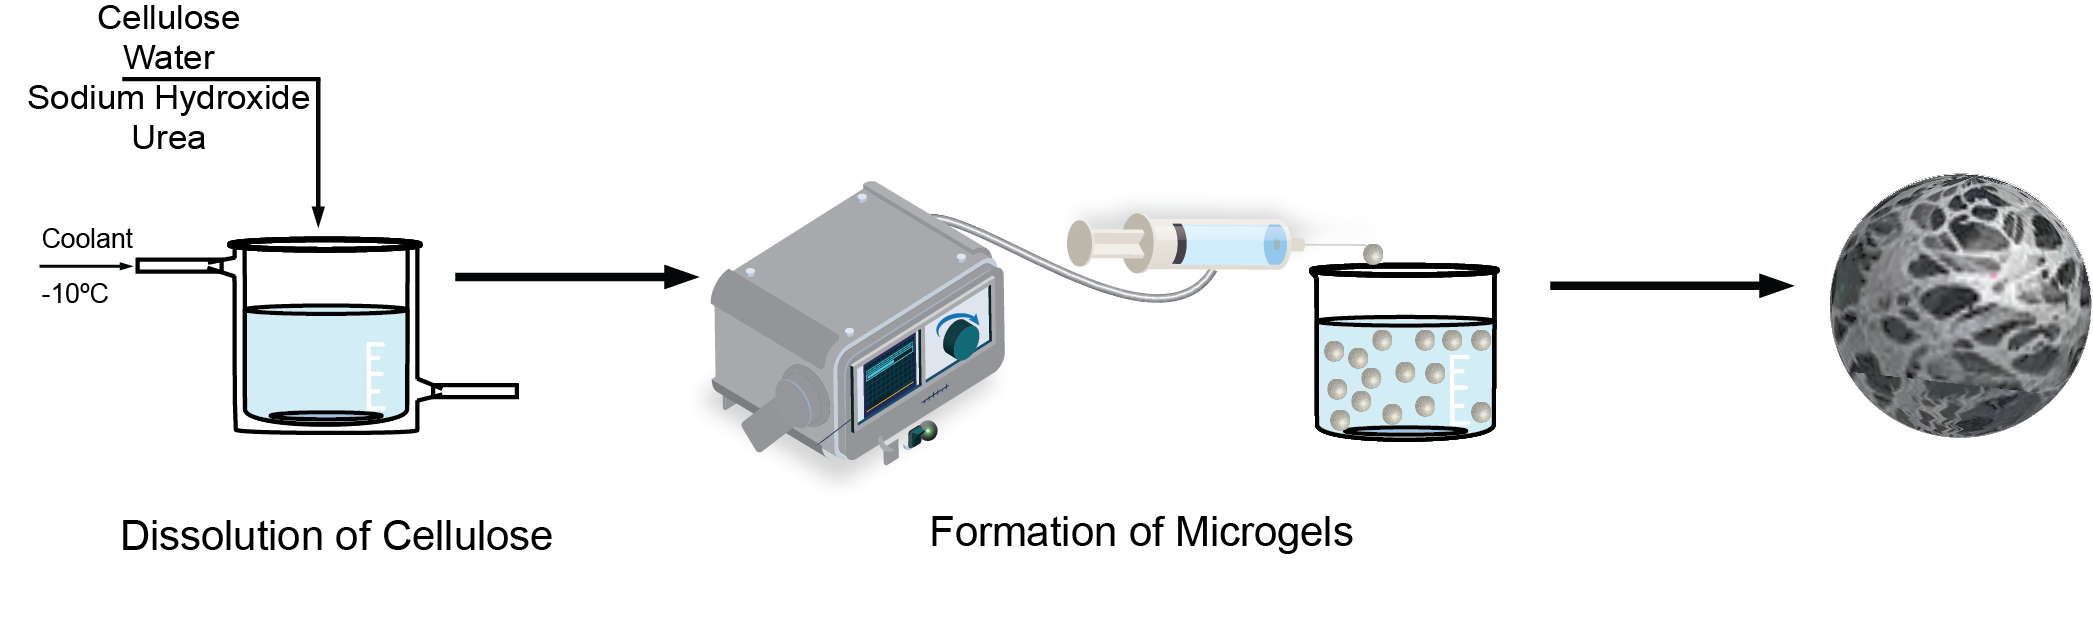
Figure 2.
a) Computational heat maps were used to predict thermal gradients present in cellulose solutions over time as a function of bath temperature. A 25ºC water bath resulted in the lowest thermal gradient as a function of radial distance and time, indicating the least amount of thermal stress. b) Experimental temperature vs. time data was used to validate the model (r = 0.00 m) and determine the time to reach thermal equilibrium for water bath temperatures of 25, 45, and 65ºC. (c-e) Solutions were visually examined for signs of thermal stress (transition from colorless to yellow) and precipitation (transition from transparent to opaque). Signs of thermal stress increased as a function of bath temperature, with the 25ºC water bath (c)) showing the least signs of thermal stress after 30 minutes compared to the 45ºC (d)) and 65ºC (e)) water baths.
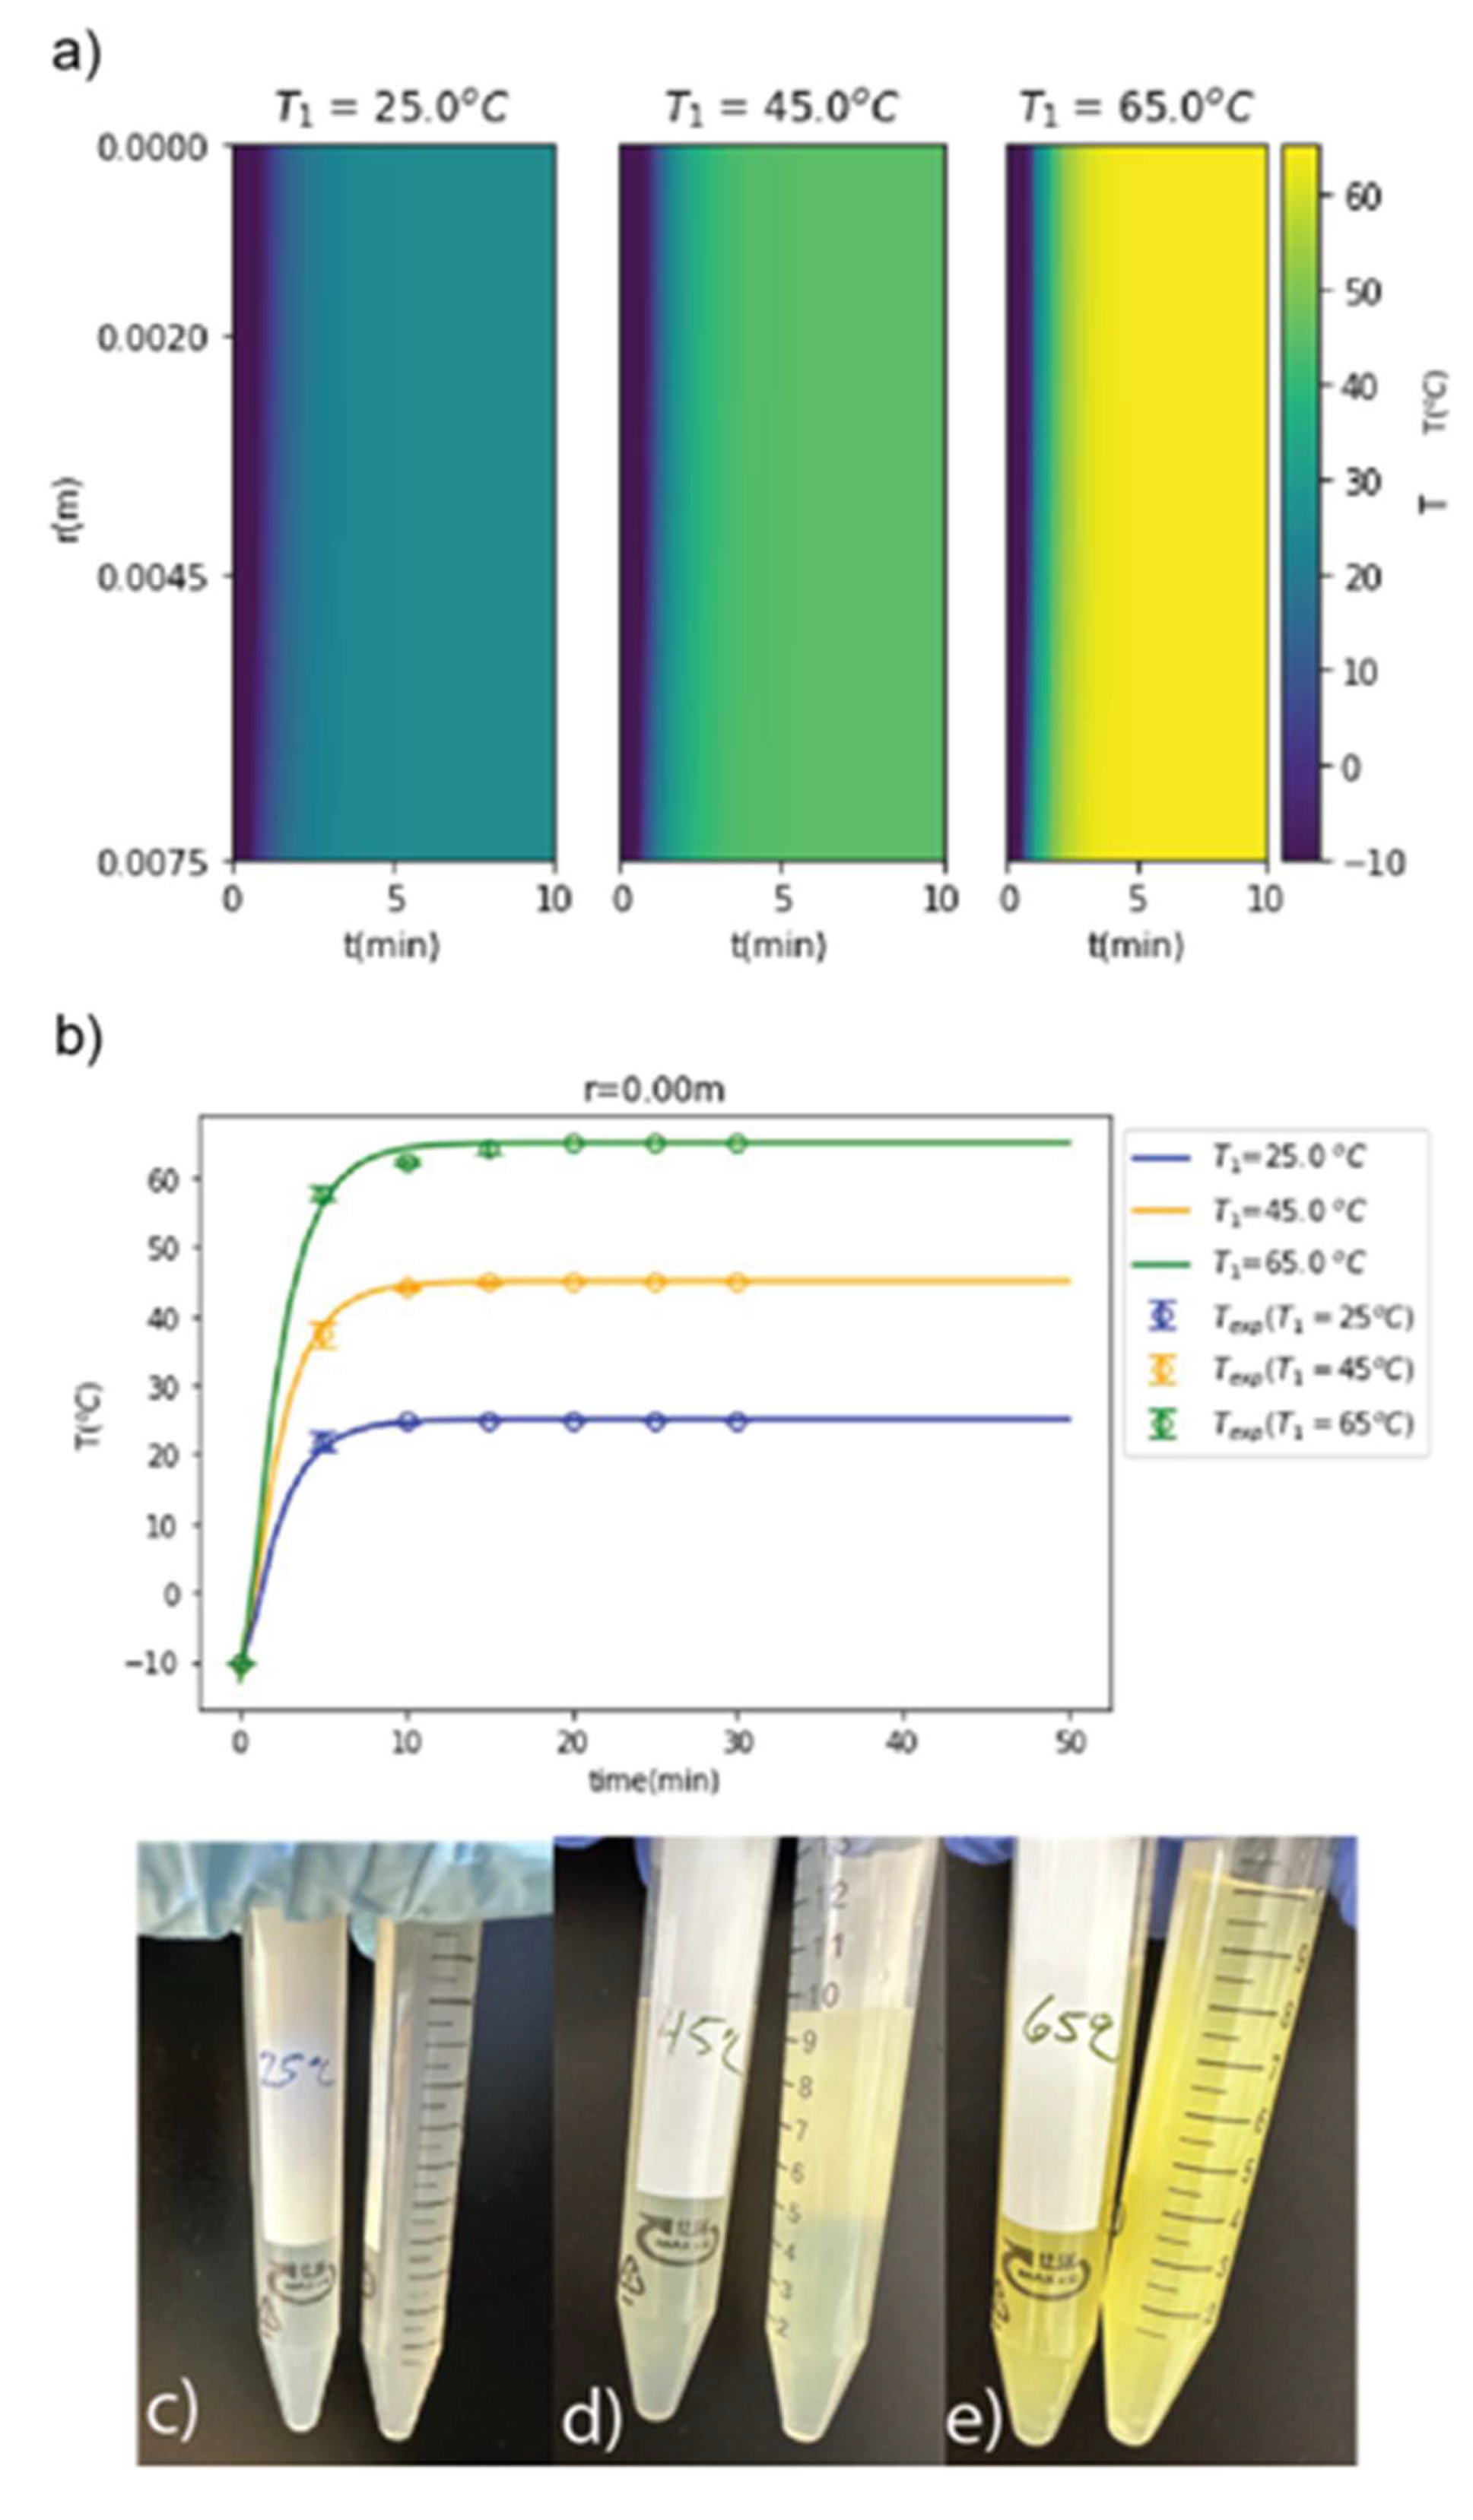
Figure 3.
As the salt concentration was increased for the CNF solution, the zeta potential decreased while the viscosity increased. In contrast, the NaOH/Urea solution and the CNF suspension in DI Water displayed negligible changes in zeta potential and viscosity as salt concentration was increased. The CNF suspension in NaOH/Urea solution showed slight decreases in zeta potential – indicating that the driving force for coagulation is related to the interactions between the CNF and the NaOH/Urea solution.
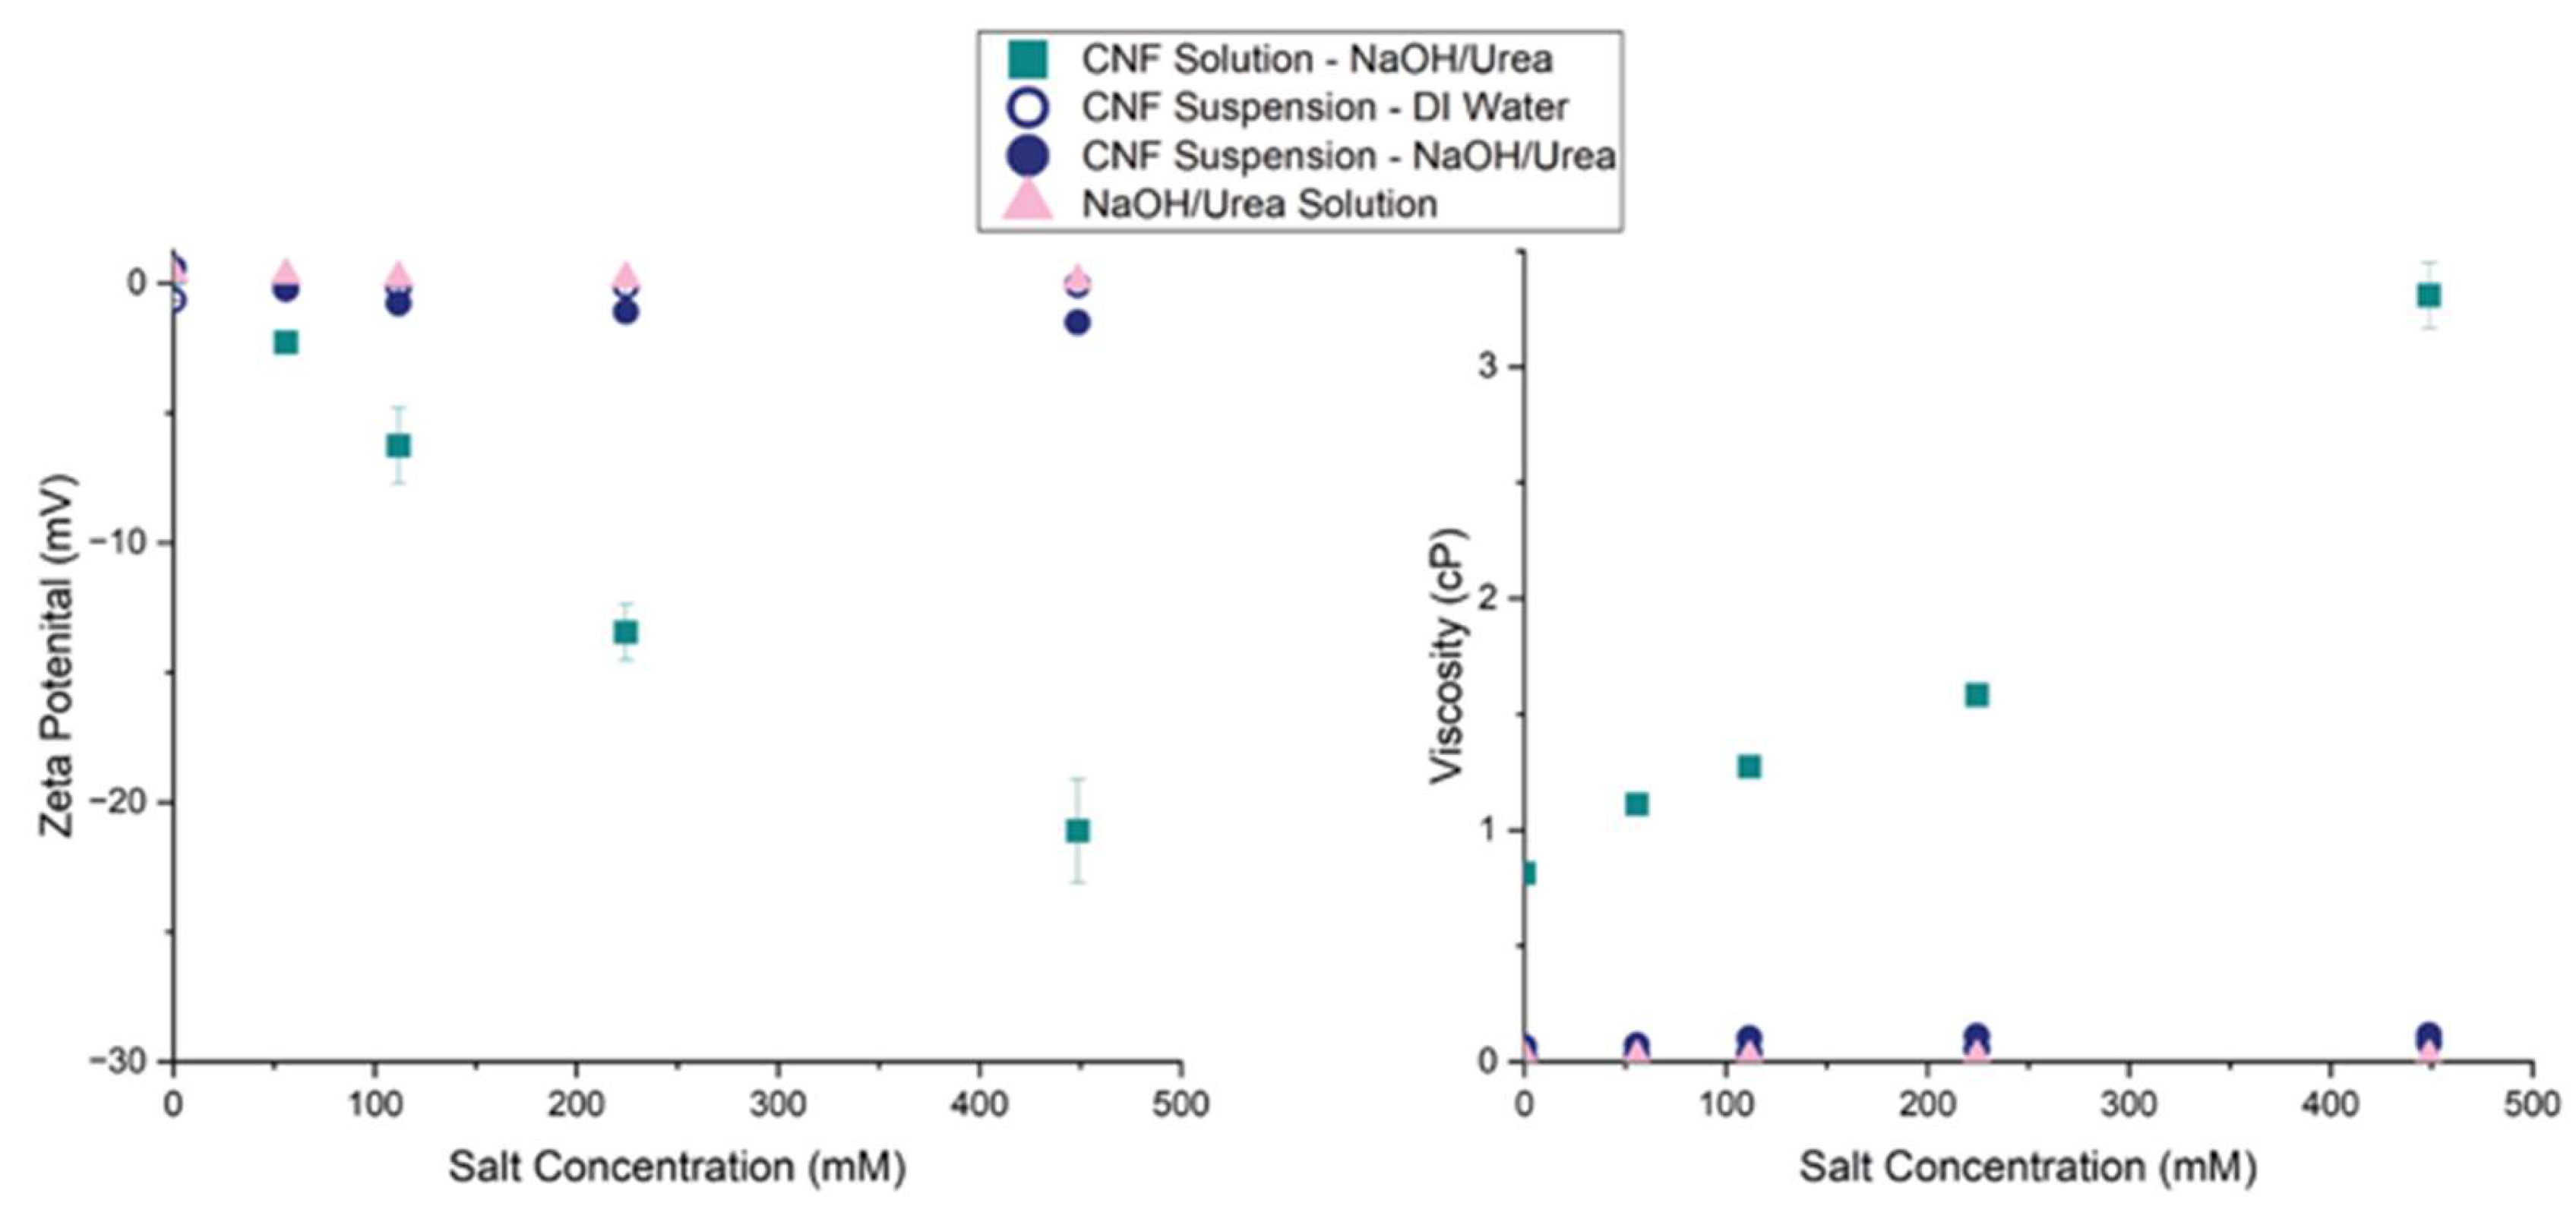
Figure 4.
(a) Neat cellulose, thermo-gel, and salt-gel beads were examined for tail formation using ImageJ. Salt-gel beads had the lowest degree of tail formation compared to neat cellulose and thermo-gel beads. (b-c) The circularity of the thermo-gel beads slightly increased compared to the neat cellulose beads and had lower variability. The diameter of the thermo-gel beads was lower than the neat cellulose beads. (d-e) Salt-gel beads with a salt concentration of 0.5 wt% did not improve bead geometry, while 1 and 2 wt% salt increased circularity and decreased variability compared to both neat cellulose and thermo-gel beads. * p < 0.05, ** p < 0.01, *** p < 0.001, **** p < 0.0001, and no * = not significant.
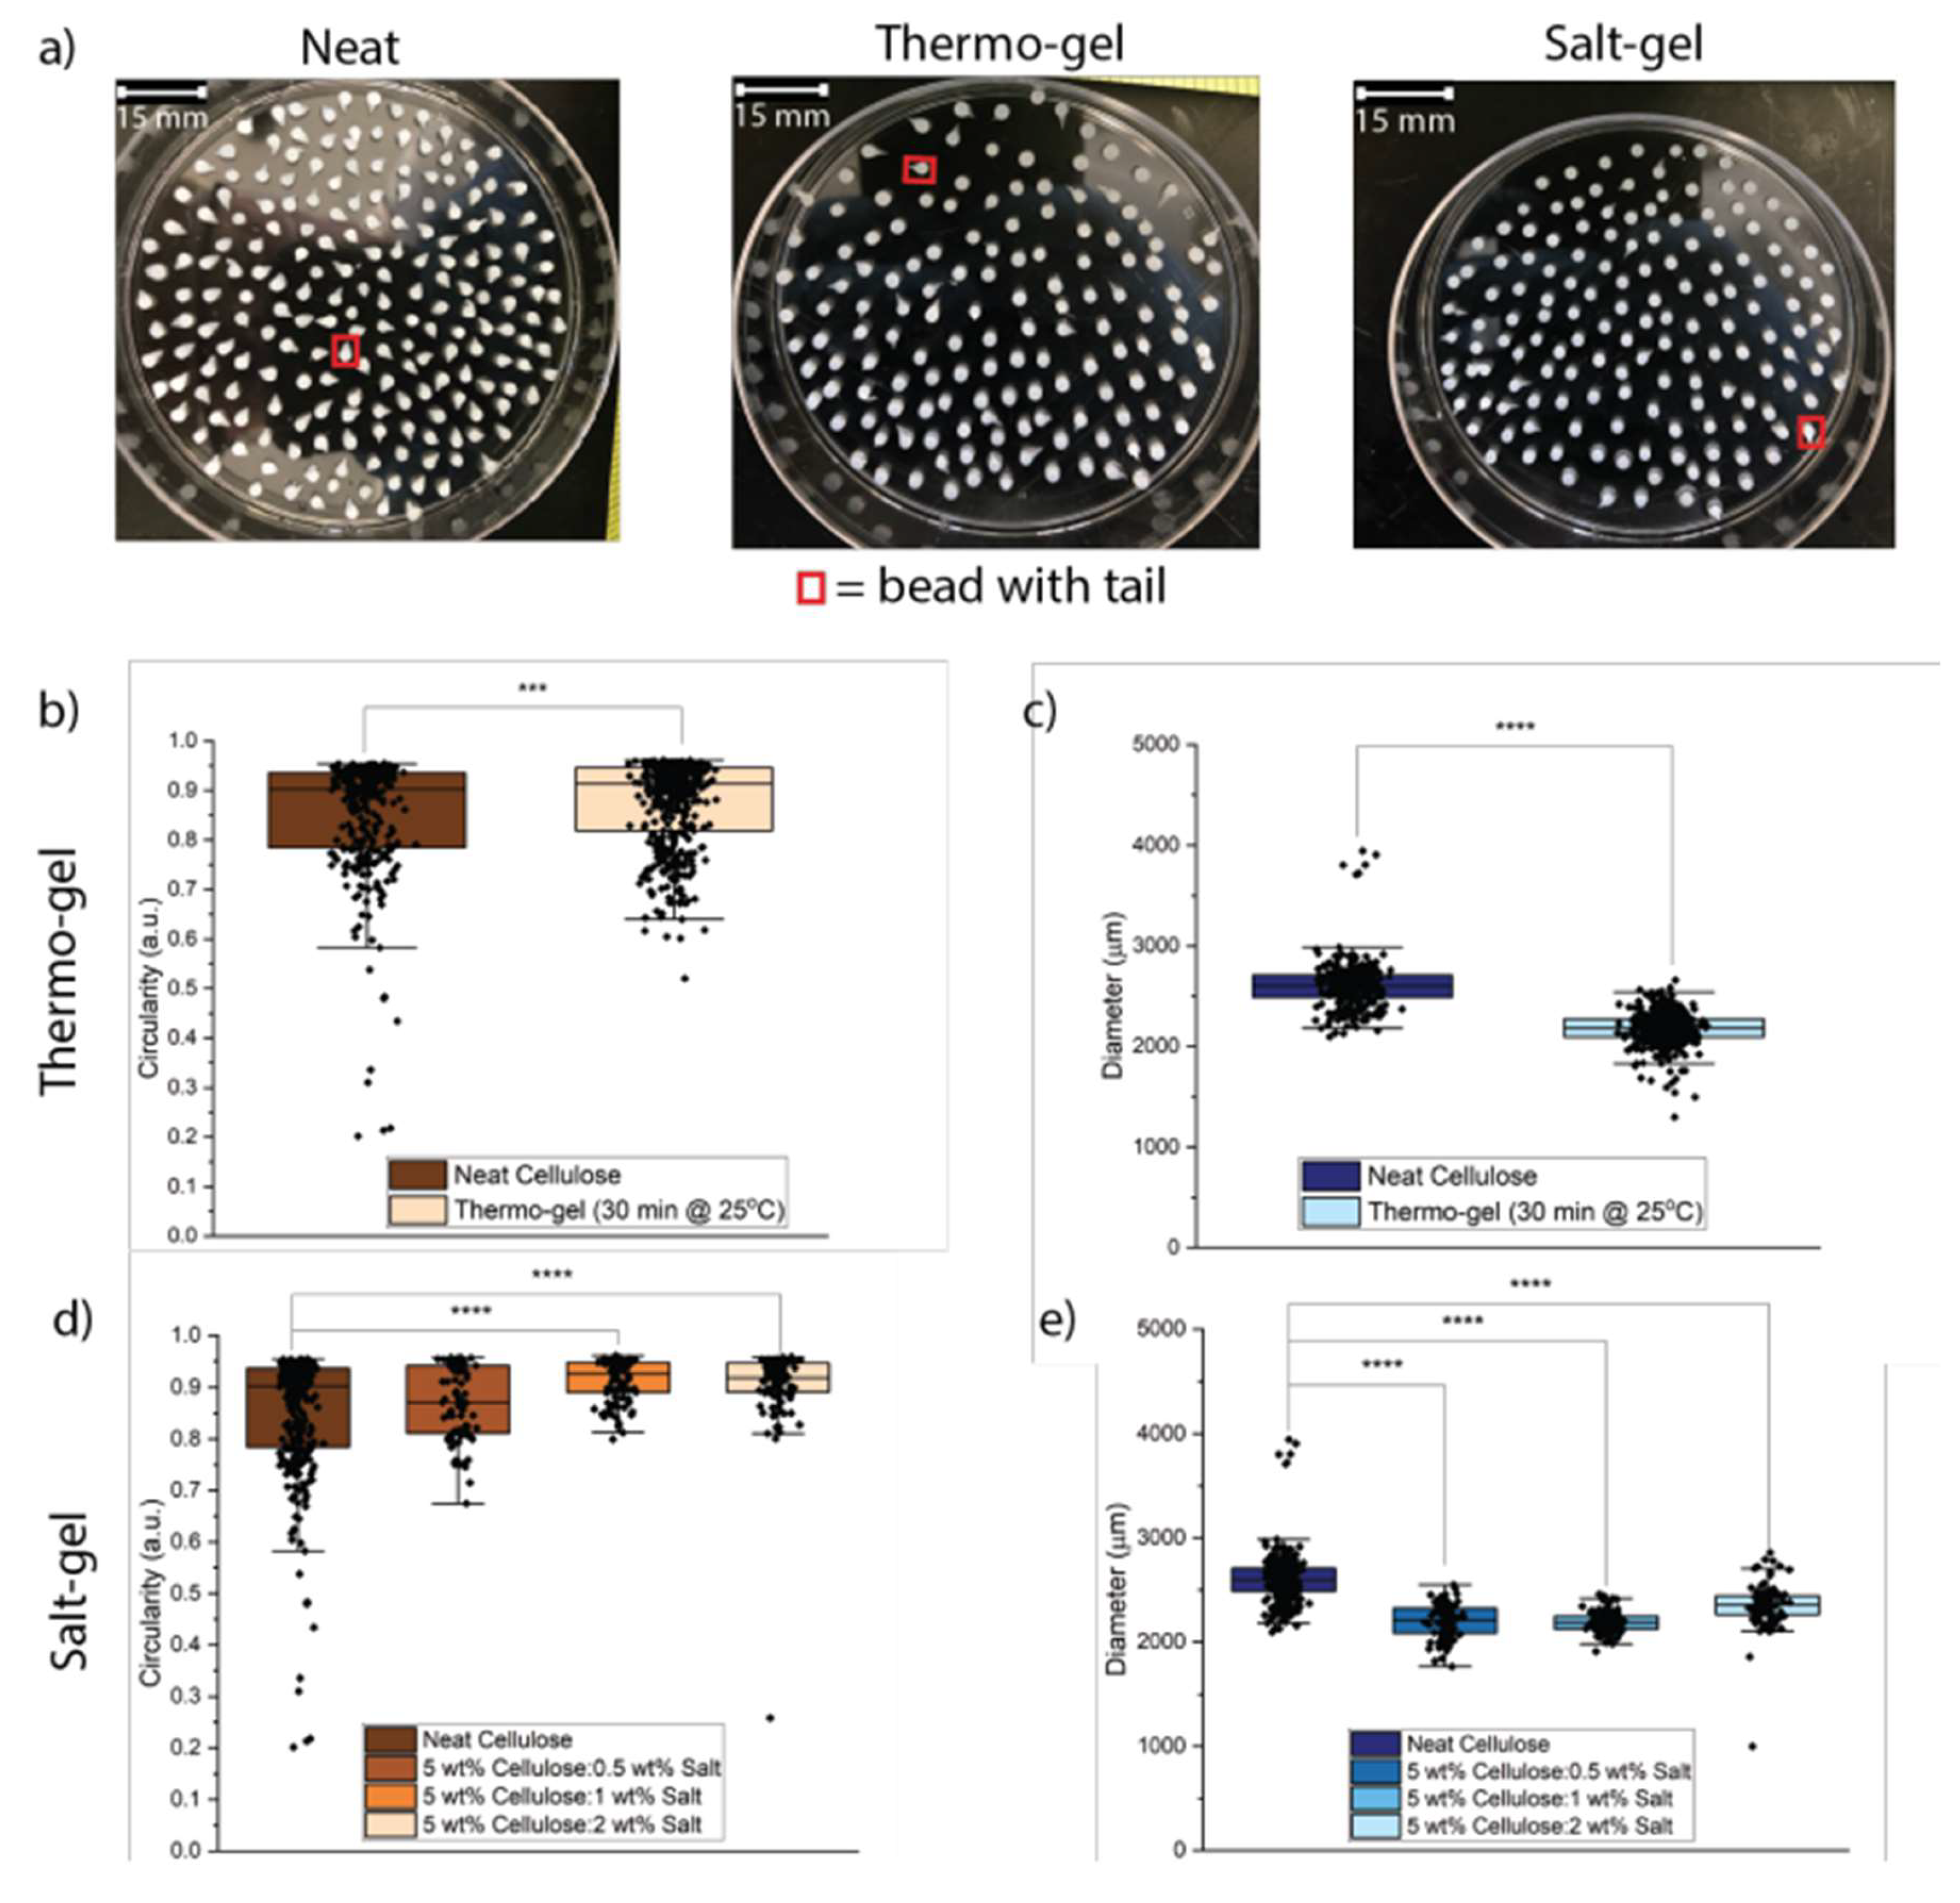
Figure 5.
(a-c) Cross-sectional SEM images were taken of (a) neat (no pre-gel), (b) thermo-gel, and (c) salt-gel beads. SEM revealed that neat and thermo-gel beads had a tighter cellulose network that limited the diffusion of salt, while salt-gel beads had a larger network that allowed salt to diffuse and improve uniformity throughout the network. All scale bars = 80 µm corresponding to 2000X magnification. (d-f) 3-D nano-CT scans were taken of (d) neat (no pre-gel) cellulose, (e) thermo-gel, and (f) salt-gel beads fabricated in a 2M HCl coagulation bath. Nano-CT revealed that adding salt into the solution generated a uniform network structure throughout the bead. Access to 360 rotations for each bead are available in the supplementary information.
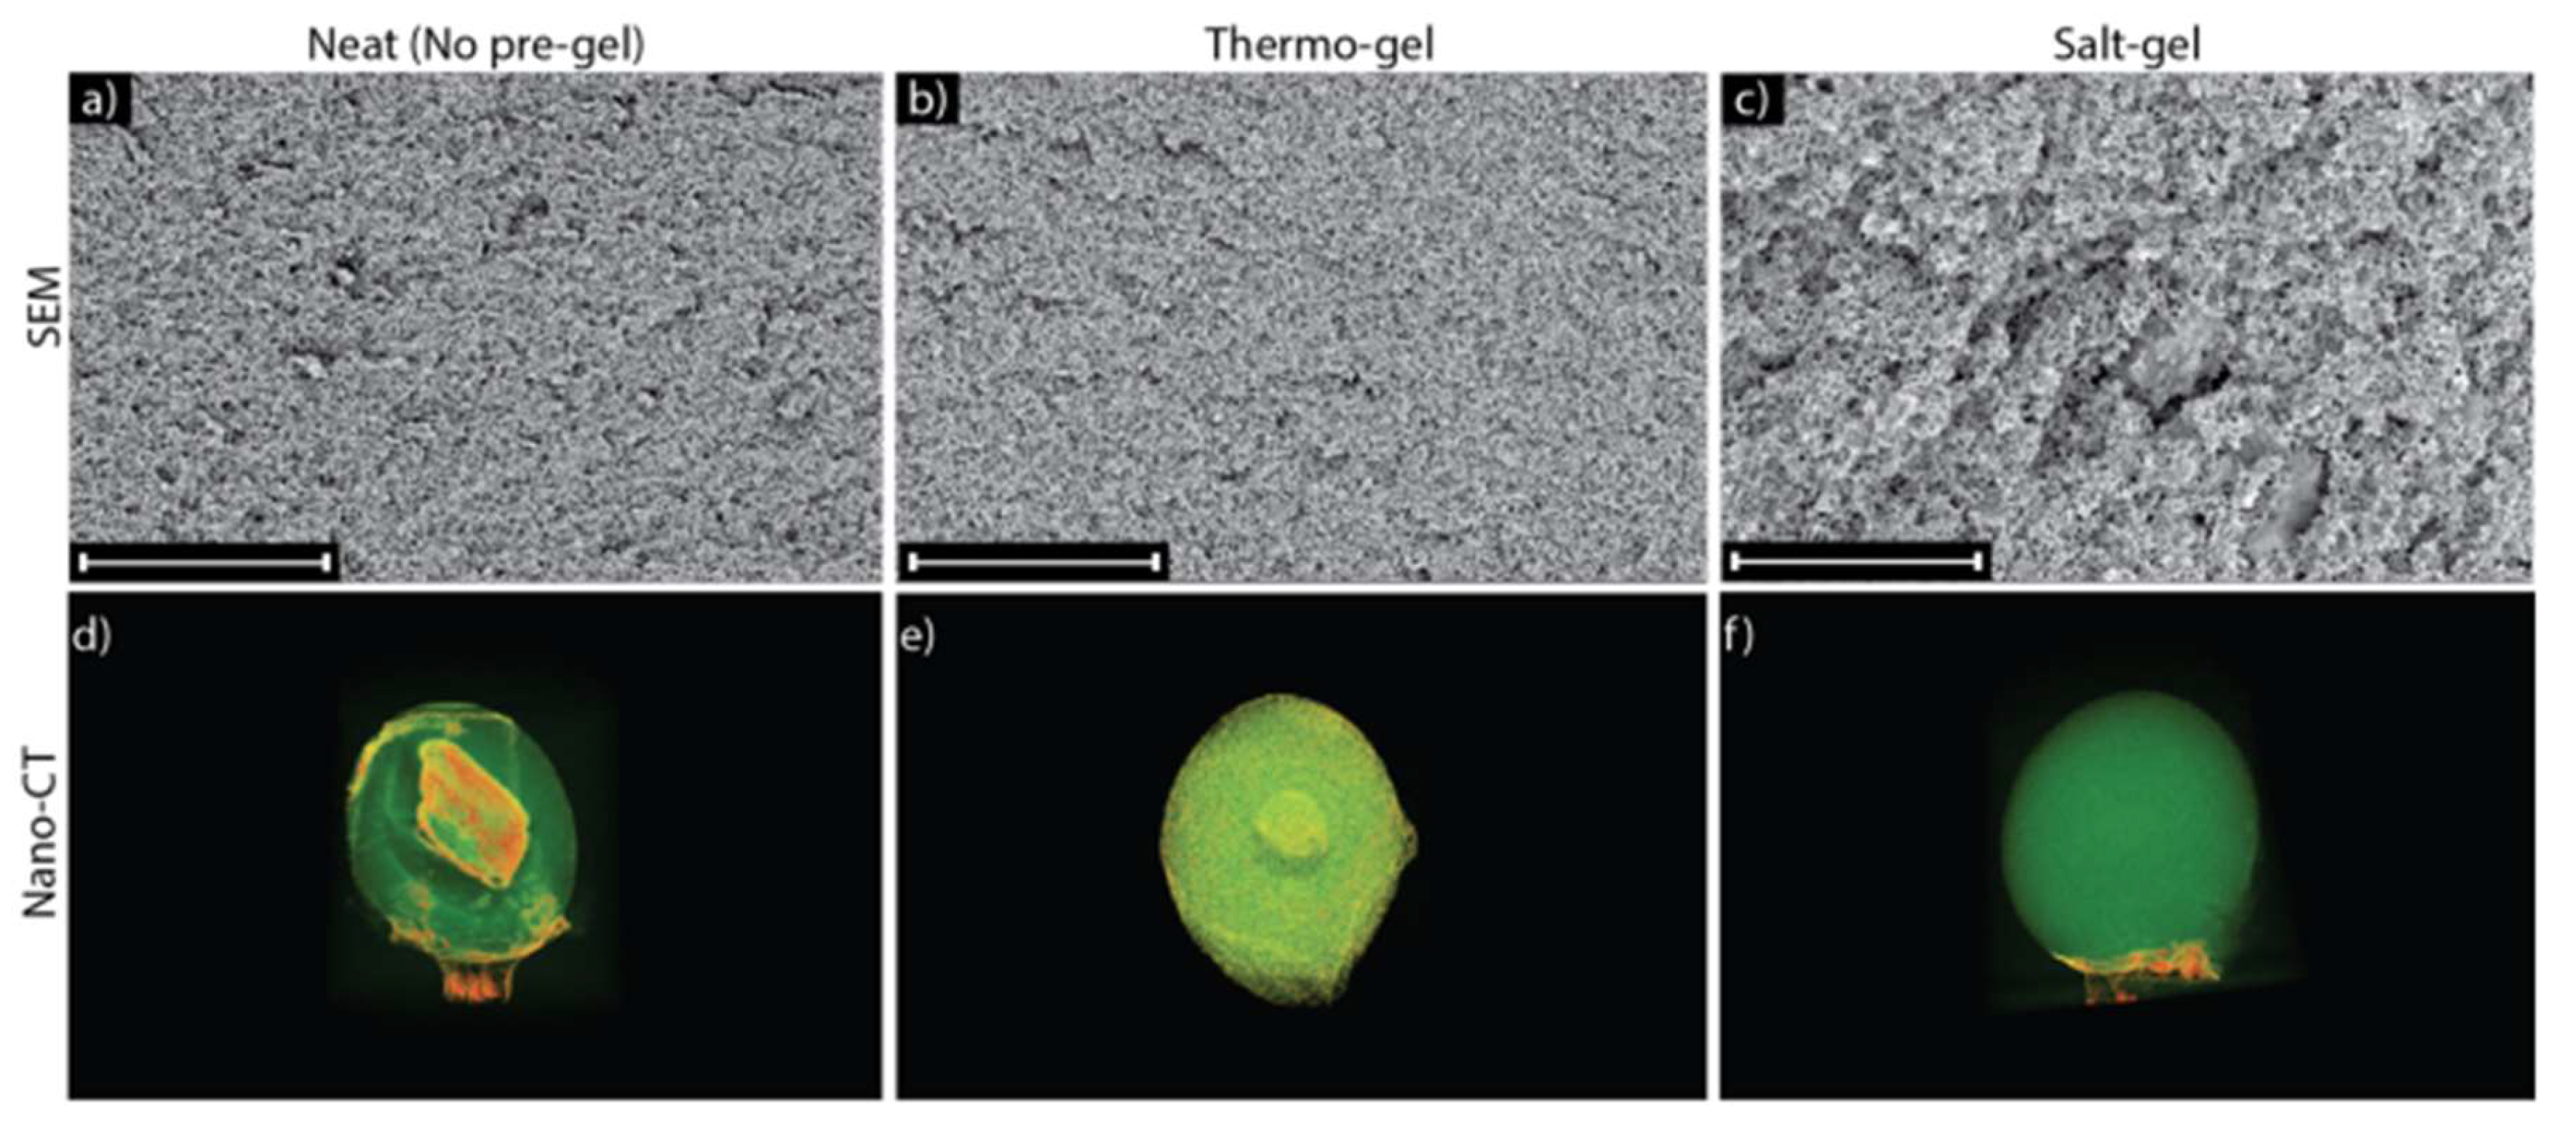
Figure 6.
Increasing the concentration of salt into solution prior to coagulation effectively screens the salt produced from the neutralization reaction and provides elasticity to the cellulose network. Neat and thermo-gel solutions have salt concentrations that causes competition between cellulose chains during aggregation due to no salt screening effects. In contrast, introducing salt into solution helps avoid this problem and leads to more uniform beads with less structural variability.
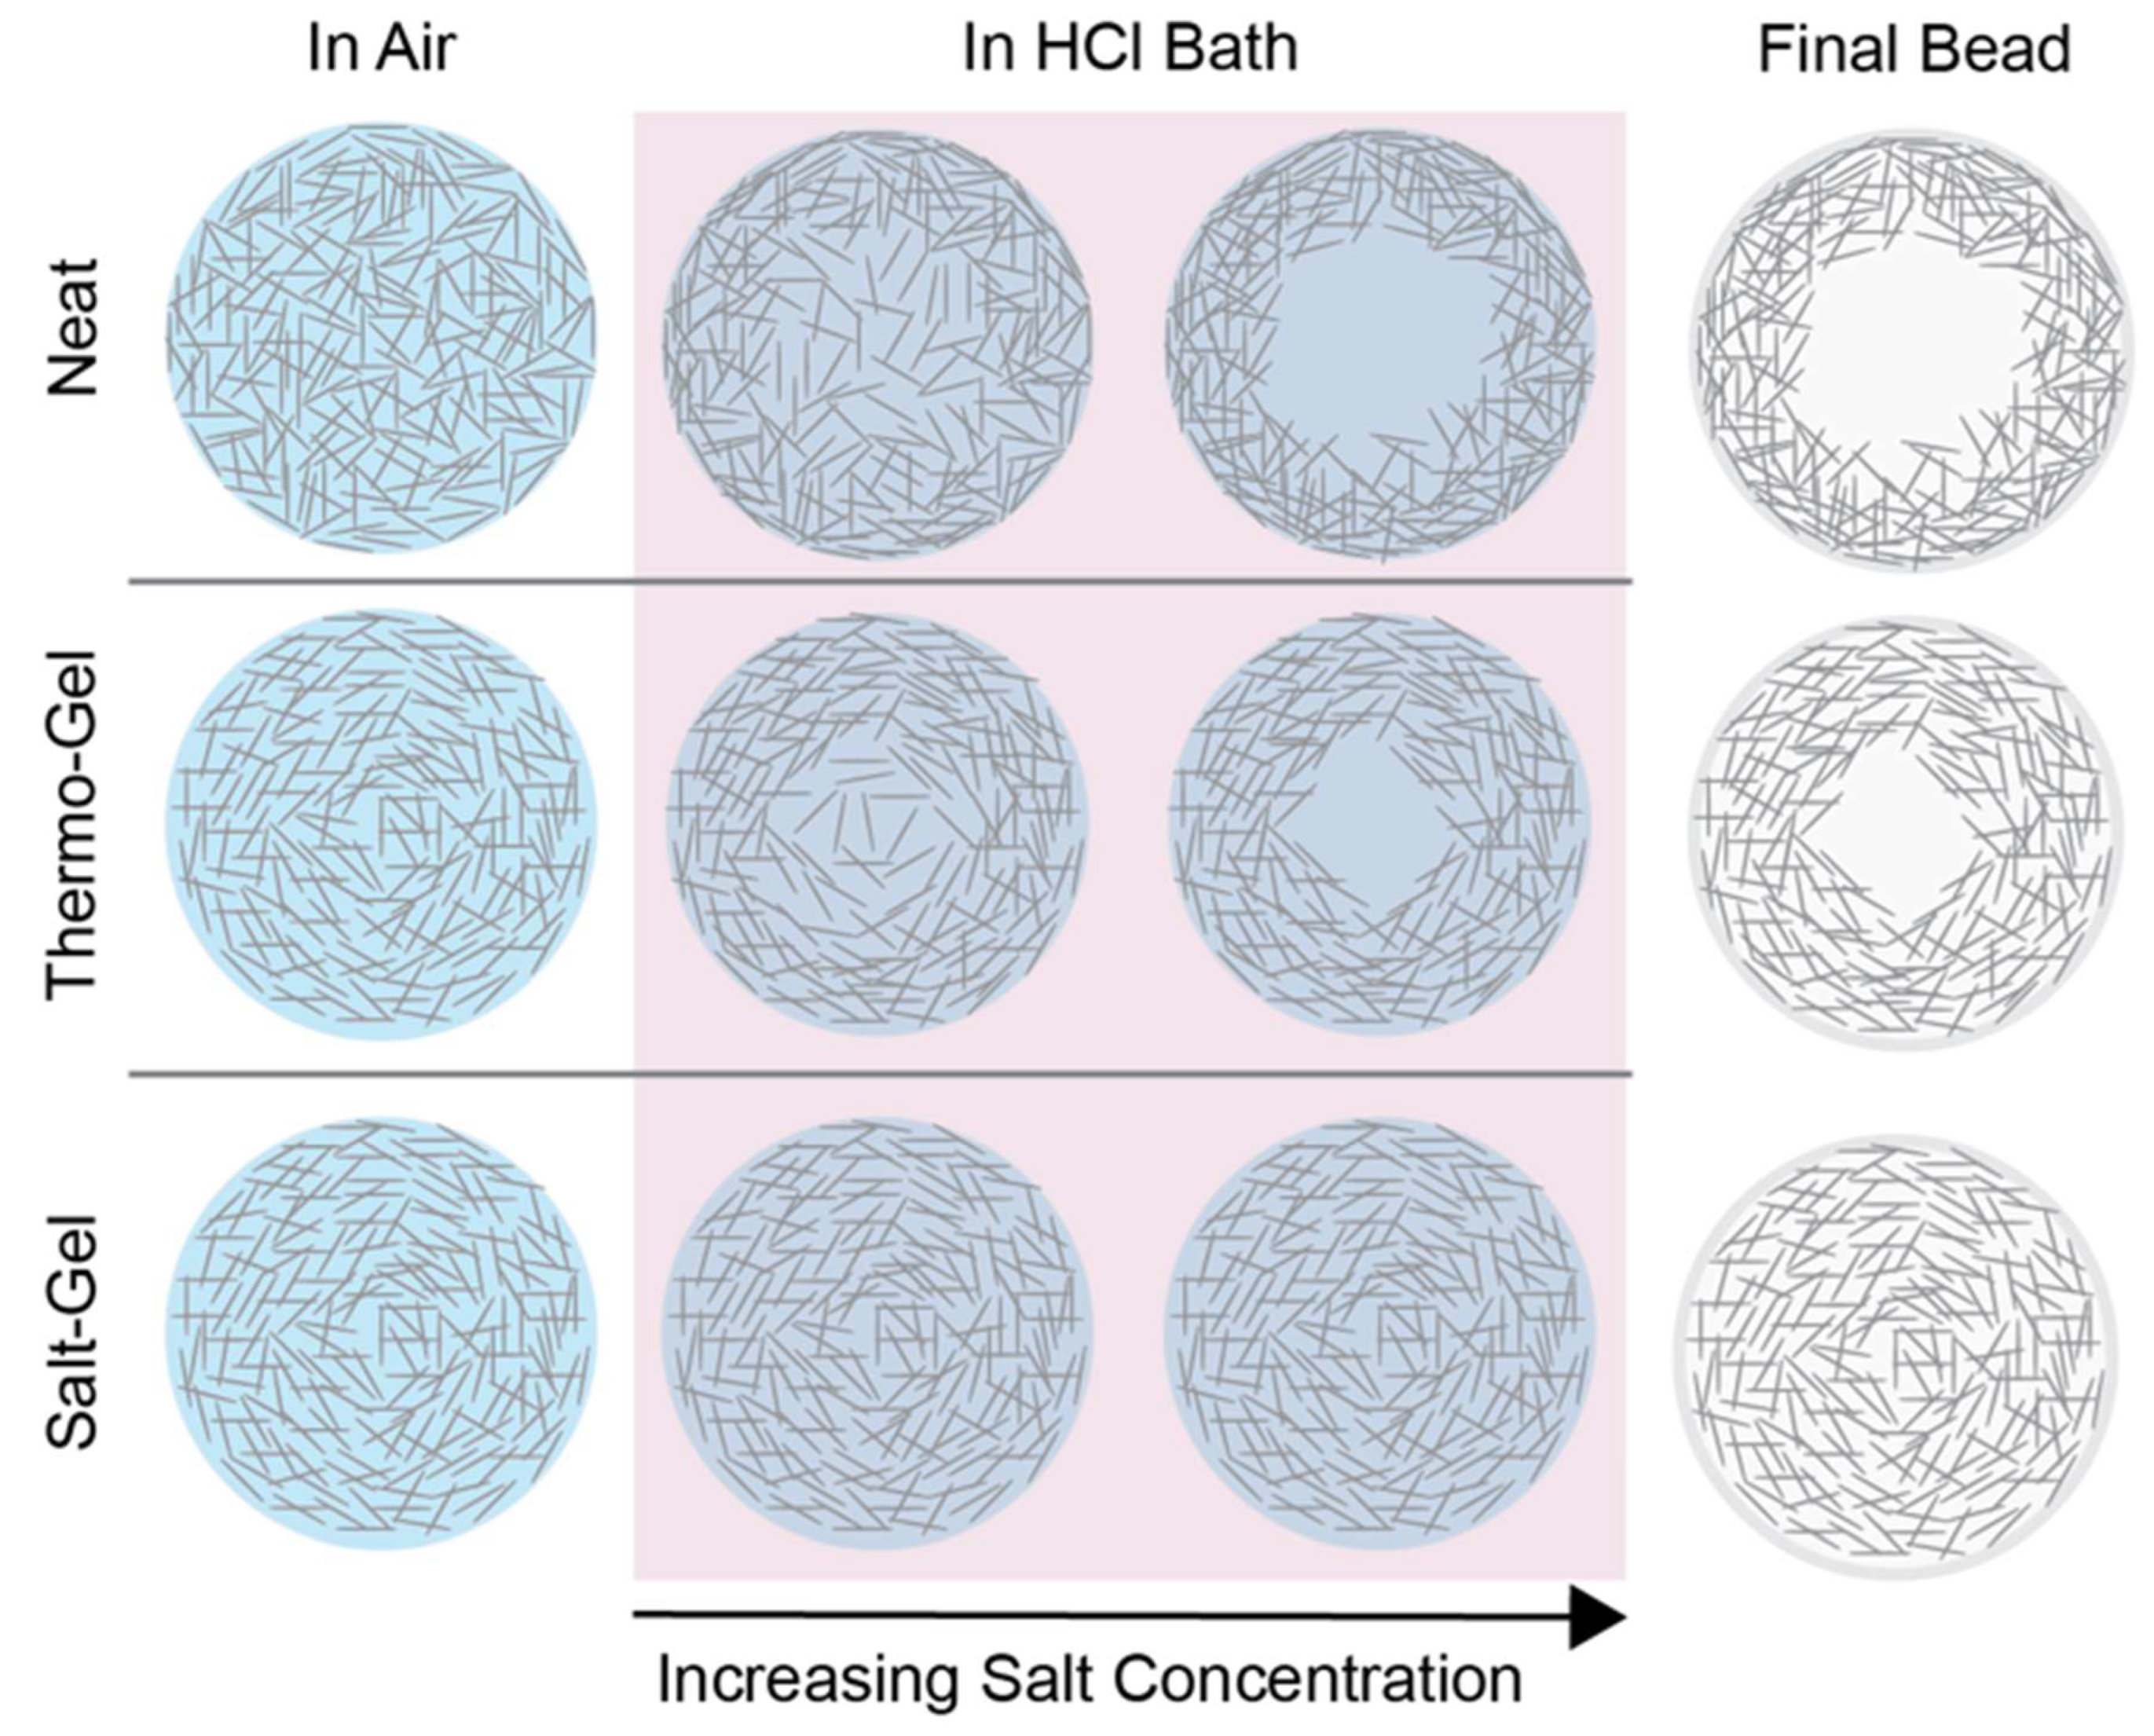
Figure 7.
Nanoindentation was performed on neat cellulose, thermo-gel, and salt-gel beads in a (a) control (water), (b) simulated gastric fluid (SGF), and (c) simulated intestinal fluid (SIF) environment. Overall, salt-gel beads displayed lowest variability and lowest Young’s modulus compared to both thermo-gel and neat cellulose beads. * p < 0.05, ** p < 0.01, *** p < 0.001, **** p < 0.0001, and no * = not significant.
Disclaimer/Publisher’s Note: The statements, opinions and data contained in all publications are solely those of the individual author(s) and contributor(s) and not of MDPI and/or the editor(s). MDPI and/or the editor(s) disclaim responsibility for any injury to people or property resulting from any ideas, methods, instructions or products referred to in the content. |
© 2024 by the authors. Licensee MDPI, Basel, Switzerland. This article is an open access article distributed under the terms and conditions of the Creative Commons Attribution (CC BY) license (http://creativecommons.org/licenses/by/4.0/).
Copyright: This open access article is published under a Creative Commons CC BY 4.0 license, which permit the free download, distribution, and reuse, provided that the author and preprint are cited in any reuse.


