
Submitted:
17 May 2024
Posted:
23 May 2024
You are already at the latest version
Abstract
Recently, microfluidics deformability cytometry has emerged as a powerful tool for high throughput mechanical phenotyping of large populations of cells. These methods characterize cells by their mechanical fingerprints through exerting hydrodynamic forces and monitoring the resulting deformation. These devices have shown great promise for label free cytometry, yet there is a critical need to improve their accuracy and reconcile any discrepancies with other methods, such as atomic force microscopy. In this study, we employ computational fluid dynamics simulations and uncover how the elasticity of frequently used carrier fluids such as methyl-cellulose dissolved in phosphate-buffered saline is significantly influential to the resulting cellular deformation. We conducted CFD simulations that are conventionally used within the deformability cytometry field, which neglect fluid elasticity. Subsequently, we incorporated a more comprehensive model that simulates the viscoelastic nature of the carrier fluid. A comparison of the predicted stresses between these two approaches underscores the significance of the emerging elastic stresses in addition to the well-recognized viscous stresses along the channel. Furthermore, we utilize a two-phase flow model to predict the deformation of a promyelocyte (i.e. HL-60 cell type) within a hydrodynamic constriction channel. The obtained results highlight a substantial impact of the elasticity of carrier fluid on cellular deformation and raise questions about the accuracy of mechanical property estimates derived by neglecting elastic stresses.
Keywords:
Deformability Cytometry
; Microfluidics
; Elasticity
; Carrier Fluid
1. Introduction
Single-cell, high-throughput analyses generally involve labeling of molecular biomarkers with exogenous fluorophores, many protocols of which require cell preparation, calibration, and standardization protocols before clinical diagnosis. Accordingly, emerging technologies are now focusing on how mechanical properties, akin to cellular antigens and proteins, are reporters of cellular function and disease. Notably, alterations in cellular mechanical properties have for decades been correlated to cellular function owing to the characterization of cytoskeletal and nuclear organization [1,2]. In general, mechanical traits, often dubbed “mechanical biomarkers,” encompass the deformability of cells when subjected to external loads. Comparable to the intrinsic properties such as gene and protein expression, these mechanical biomarkers contribute to the phenotyping of cell populations. Several studies have established connections between alteration in cellular mechanical properties and various processes, including cell cycle progression [3], cancer malignancy [4,5,6], leukocyte activation [7,8], and stem cell differentiation [9,10]. Hence, by assessing cell mechanics, the requirement for external markers such as fluorescent dyes is eliminated, making it a compelling and noninvasive biomarker for cell identification.
Conventional methodologies for mechanical phenotyping of cells include optical stretching [11], atomic force microscopy [12], micropipette aspiration [13], and parallel plate rheology [14]. Such methods evaluate the response of the cell under the applied forces and estimate the mechanical properties of the cells such as stiffness and viscous modulus. Despite their reliable results, these approaches suffer from a considerable drawback, which is low throughput, thus limiting their applicability for characterizing large populations of cells.
Accordingly, microfluidically-driven cellular deformation approaches have become prominent owing to their high-throughput capabilities. In general, there are two main types of microfluidic deformation methods. The first method—constriction deformable cytometry—involves the use of a constriction channel narrower than the cell size [15,16]. Cells pass through the constriction channel, and their mechanical properties are evaluated based on passage times. The second approach—hydrodynamic forced deformation—employs either a constriction channel slightly larger than the size of cells [3] or a cross-slot channel generating a high extensional flow region [17]. For inducing sufficiently high hydrodynamic forces in the hydrodynamic constriction channel, high viscous fluids are employed [3,18]. However, in the cross-slot channel, mechanical phenotyping can be performed using both high and low viscosity fluids [19,20]. Notably, previous studies indicate that using highly viscous fluids in cross-slot deformation cytometry results in a better characterization of the cells [20]. A commonly used high viscous fluid in such devices is methylcellulose dissolved in phosphate-buffered saline (MC-PBS) [3,18,20]. Due to the biocompatibility of methylcellulose and the capability of increasing the viscosity of carrier fluid, MC-PBS is widely used in both hydrodynamic constriction channels and cross-slot deformation cytometry. Calculation of the exerted hydrodynamic stresses in these devices hinges on the flow field and measured fluid viscosity, considering the fluid as a generalized Newtonian fluid (GNF) with a shear thinning behavior. In fact, it is assumed that the observed deformation of the cell is mainly due to the applied shear stress from MC-PBS [21,22,23]. Nonetheless, MC-PBS is a viscoelastic fluid, and disregarding its elastic properties may lead to significant errors in estimating cell mechanical properties [24]. Since cell stiffness is proportionate to the exerted stresses for a given deformation during experiments; neglecting a portion of exerted stresses could lead to a wrong estimation of cell stiffness. It is worth mentioning that the estimated cell stiffness in hydrodynamic constriction cytometry typically shows discrepancy when compared to the measured results by using AFM [18,25]. It should be mentioned that due to the distinct probing methods and operating conditions, individual methods for measuring the cell’s mechanical properties often yield significantly different results. This disparity was highlighted in a recent work that compared elastic and viscous moduli obtained through an array of methods- atomic force microscopy, magnetic twisting, particle tracking microrheology, parallel-plate rheometry, and optical stretching-for the same cell line maintained in the standardized condition [26]. The resulting values exhibited a range spanning two orders of magnitude for elastic modulus and three orders of magnitude for viscous modulus. These disparities are attributed to the differences in the applied stress and strain rates, probe size, probing lengths scale and time scale, and whether cells are attached to a surface or suspended in a fluid [25]. Hence, it is imperative to comprehend the temporal and spatial distribution of stress/strain applied to the cells in each method.
To investigate the significance of incorporating the complete viscoelastic behavior of the MC-PBS solution, we conduct computational fluid dynamics (CFD) simulations of single-phase MC-PBS flow within a microchannel with dimensions similar to those used in hydrodynamic constriction cytometry. In parallel, simulations are conducted for MC-PBS flow utilizing a GNF model that accounts for shear thinning behavior but disregards the elasticity of fluid. A comparative analysis of the predicted flow fields employing a viscoelastic model and GNF model is presented. Subsequently, we model the deformation of a deforming particle representing a promyeloblast (i.e., HL-60 cell) navigating through the hydrodynamic constriction microchannel. Two MC-PBS fluid models are employed one incorporating the fluid elasticity and the other excluding it. A comparative evaluation of the flow fields, generated stress, and predicted shape of the suspended cell in these two fluid models elucidates the impact of fluid elasticity on the cell’s deformation within the microchannel.
2. Numerical Method
Numerical simulations were conducted to investigate the behavior of MC-PBS flows within a narrow microchannel, with dimensions typically employed in hydrodynamics constriction deformability cytometry. Two CFD models were employed to predict the flow field of the MC-PBS solution: a simplified GNF model and a viscoelastic fluid model. The GNF approach employs the Carreau-Yasuda model, which accounts for the shear thinning behavior but ignores the elasticity of fluid. In contrast, the viscoelastic fluid model incorporated the linear form of Phan-Thien-Tanner (PTT) model which is suitable for polymer solutions [27]. This model considers both viscous and elastic stresses as well as the shear thinning effect, providing a more comprehensive representation of the fluid behavior [27,28]. The results obtained from these two models will be compared to assess the reliability of employing the GNF approach.
Governing equations of the flow field are fully resolved to predict the velocity, pressure, and stress distributions. The governing equations of isothermal incompressible fluid flow in the laminar regime are as follows:
Equations (1) and (2) are continuity and momentum equations where, u represents the velocity, p is pressure and indicates the stress tensor. In the viscoelastic fluid context, the stress tensor is the sum of solvent stress ) and polymer stress () (Equation (3)). The polymer stress was modeled using PTT model (Equations (4) and (5), where and represent the polymer relaxation time and polymer viscosity and is a material parameter related to its extensional property. Generally, may range from 0 to 1 and a lower value in PTT model corresponds to a higher predicted uniaxial extensional viscosity. In fact, when tends to zero, the PTT model reduces to the well-known Oldroyd-B model. However, contrary to the Oldroyd-B model, the PTT model predicts the shear-thinning behavior of fluid when, . Shear viscosity function in PTT model is obtained by determining appropriate value of [29,30]. On contrary to the viscoelastic models, in the context of GNF approach, the stress tensor includes only the first term on the right hand side of Equation (3), representing shear stress. The total shear viscosity is modeled using Carreau-Yasuda model that follows Equation (6).
where, and are zero shear and infinite shear viscosities. Furthermore, , and are power law index, relaxation time, and Carreau-Yasuda model constant, respectively. CFD simulations were conducted for 0.5% MC-PBS solution. The viscosity of solvent was assumed to be 1 mPa.S. Table 1 shows the parameters used to describe the viscosity of 0.5% MC-PBS solution using the Carreau-Yasuda model [24]. Furthermore, Figure 1 compares the viscosity of 0.5% MC-PBS solution as predicted by the PTT model ( and Carreau-Yasuda model with the experimental measurements. As depicted, the PTT and Carreau-Yasuda models reasonably captured the shear thinning behavior of the fluid observed in experimental data [24].
Numerical modeling was initially conducted to analyze a single-phase flow of 0.5% MC-PBS solution within a 3D square channel. The primary aim was to compare the predicted stresses utilizing Carreua-Yasuda model and the more comprehensive viscoelastic model know as PTT. Additionally, CFD simulations were performed to replicate the deformation of an HL-60 cell suspended in 0.5% MC-PBS solution when passing the channel. To this end, a viscous droplet model was employed which takes into account the apparent cytoplasmic viscosity and membrane tension of cells. We used level set method to model the two-phase flow and track the interface of the primary phase (0.5% MC-PBS solution) flowing in the microchannel and a suspended droplet representing the cell. As such, the following equation was solved in conjunction with Equations (1)–(5):
During the solution, local material properties are updated based on , and smoothed across the interface using a smooth Heaviside function. Furthermore, surface tension force is added on the right hand side of momentum equation and calculated as follows:
where represents the surface tension coefficient, k denotes the interface curvature, n signifies the normal vector and represents the smoothed Dirac delta function centered at the interface. To restore its correct distributions near the interface, a re-distancing problem is solved [31,32,33].
Transport equations were solved by using Finite volume method (FVM) method within TransAT 5.6 code. In CFD model, the pressurevelocity coupling was achieved by using the SIMPLEC algorithm. The spatial derivatives were discretized using a 2nd order hybrid linear/parabolic approximation (HLPA) scheme. For the level set model, we used a 3rd order WENO scheme for re-distancing [34].
3. Results and Discussions
3.1. Flow-Field in the Microchannel Conveying Single-Phase MC-PBS Solution
Numerical simulations were performed to analyze the flow characteristics of 0.5% MC-PBS solution within a microchannel commonly utilized in hydrodynamic constriction deformability cytometry. CFD simulations were initially employed to study the single-phase flow of the carrier fluid, utilizing two rheological models: the Carreua-Yasuda model and PTT model. Figure 2 shows a schematic of the microchannel and the adopted geometry and dimensions in the CFD model. The dimensions of the microchannel and flow rate are identical to those reported experimentally [18]. A uniform grid size of 1 was adopted in CFD simulations.
Figure 3 illustrates the shear rate distribution as predicted by the Carreua-Yasuda model along the width of the channel, corresponding to an average flow velocity of 0.1m/s under fully developed flow conditions. As observed, the predicted shear rates vary from nearly zero at the center of channel to a maximum value of approximately 52000 1/s at the walls.
According to Figure 1, both Carreua-Yasuda and PTT models can reasonably predict the shear viscosity of carrier fluid in the predicted shear range.
Figure 4a,b present contours illustrating the axial velocity within the cross section of the channel, as predicted by the Carreua-Yasuda and PTT models upon reaching fully developed flow conditions. Notably, both models yield remarkably similar velocity distributions, showcasing a peak velocity of approximately 0.19m/s at the channel center. In general, when dealing with shear-thinning fluids, one would anticipate flattened velocity profiles in comparison to their Newtonian counterparts.
Figure 5 provides a more discernible representation of the contrast in axial velocity distribution across the channel width as determined by the PTT and Carreua-Yasuda models. As depicted in this figure, the PTT model predicted a slightly more flattened velocity profile at the center of channel, suggesting a slightly elevated shear-thinning behavior. The discrepancies observed in these velocity profiles could be attributed to the prediction of slightly different viscosities by the PTT and Carreua-Yasuda models, especially at high shear rates as shown in Figure 1.
Figure 6 illustrates the contours of shear stress as predicted by Carreua-Yasuda model at the cross section of the channel under fully developed flow condition. As observed, shear stress is maximum at the walls and gradually decreases to nearly zero when moving towards the center of channel where the velocity gradient is zero. In contrast to the Carreua-Yasuda model, PTT directly account for the contribution of polymers in the stress tensor. That is, the total stress is calculated as a summation of solvent stress and polymer stresses. Figure 7a,b display the contours of polymer shear stress and solvent shear stress as predicted by the PTT model within the channel cross-section. Figure 8 illustrates the predicted total shear stress obtained by the PTT model and Carreua-Yasuda model across the width of the channel. As observed in this figure, there is good agreement between the predicted total shear stresses by the two models, except in regions close to the walls where the PTT model predicts slightly lower shear stresses when compared to the Carreua-Yasuda model. This small difference can be attributed to the accuracy of fitting the experimental shear viscosities by these two models.
Figure 9 shows the contour of normal stress ( at the channel cross section as predicted by the PTT model. This figure clearly shows a significantly high elastic stress in the proximity of the channel walls, gradually diminishing to nearly zero at the channel center. Figure 10 presents the distribution of normal stress ( across the channel width. A comparison of the predicted normal stress ( in Figure 10 with the total shear stress in Figure 8 unequivocally reveals that the normal stress magnitude within the channel is an order of magnitude higher than that of the total shear stress, as predicted by the PTT and Carreua-Yasuda models. Previous studies underscore a substantial influence of such normal stresses on flow fields containing suspended particles. In fact, the observed stress gradients possess the potential to significantly influence the trajectory of suspended particles or induce deformations in the shape of pliable particles navigating through such flow-fields [35,36,37,38,39].
While the Carreua-Yasuda model can reasonably predict the velocity profile and total shear stresses in steady shear flows, it completely neglects the generation of normal stresses. Furthermore, its inability in directly accounting the contribution of polymer chains in the stress tensor can be problematic in unsteady flows and flows with mixed kinematics [40]. Figure 11 shows the distribution of average shear stress at the wall of the channel as we move from the inlet towards the outlet. As seen in Figure 11, the predicted shear stresses by using the Carreua-Yasuda and PTT models in the developing region are different. According to this figure, for a single-phase flow of 0.5% MC-PBS solution in a square channel, the flow reaches fully developed condition within a short length in the entrance region. Hence, overall, using Carreua-Yasuda results in reasonable estimation of shear stress distribution in the channel.
3.2. Numerical Modeling of Cell Deformation in a Hydrodynamic Constriction Channel
The preceding numerical results pertaining to the single-phase flow of 0.5% MC-PBS solution in the microchannel underscore the prevalence of normal stress over shear stress. In this section, we employ the level set model to investigate the impact of carrier fluid’s elasticity on the exerted stress and deformation of suspended particles. In fact, due to the large size of the cells compared to the size of the channel the flow field is substantially altered as the cells move within the channel. Hence, we model the deformation of a suspended viscous particle, representing an HL-60 cell, navigating through a hydrodynamic constriction microchannel using two MC-PBS fluid models- one incorporating elasticity and the other lacking it.
A method employed for modeling cell deformation is the viscous droplet model, wherein the cell is conceptualized as a viscous fluid-filled bag with a constant surface tension. This model takes into account an apparent membrane tension and cytoplasmic viscosity. While not appropriate for all cell types, it has demonstrated reasonable accuracy in describing the deformation of HL-60 cells [41,42,43]. It is crucial to emphasize that the main objective of this study is to explore the significance of the emerging elastic stress surrounding cells in motion within the channel and to investigate whether this elastic stress plays a crucial role in cell deformation compared to viscous stress. Consequently, irrespective of the accuracy of the viscous droplet model in replicating the exact behavior of the HL-60 cells, any discernible differences in deformation predicted by two CFD modelsone including the elastic effect and the other excluding itwould underscore the pivotal role of fluid elasticity in cell deformation.
We model the deformation of an HL-60 cell under an operating condition reported experimentally [18]. In order to reduce the computational cost an axisymmetric CFD model is employed which is compatible with the observed cell shape in the experiments. Hence, the predicted CFD results show the deformation of a single cell flowing in a tube with an identical hydraulic diameter rather than a 3D square channel. The accuracy of the CFD model in predicting the velocity profile of viscoelastic fluid within a circular tube was first validated by comparing the predicted results using the PTT model with an analytical solution [29]. Figure 12 shows the predicted velocity profile for a viscoelastic fluid where the solvent viscosity ratio (, Deborah number (De) and extensibility parameter are 0.1, 6.3 and 0.25, respectively. As observed in Figure 12, there is good agreement between the predicted numerical results and the analytical solution.
Subsequently, CFD simulations were conducted for a two-phase flow of suspended viscous droplet in 0.5% MC-PBS solution and for a mean flow velocity of 0.1m/s. Previous studies revealed that the apparent viscosity of HL-60 cells depends on the imposed shear rate. Using the empirical model proposed by Tsai et al. and considering an average shear rate of 20000 1/S in the channel the apparent viscosity was estimated to be 1.08 Pa.s [44]. Furthermore, the cortical membrane tension and density of HL-60 are 155 pN/ and 1080 Kg/m3, respectively [42,45]. The droplet representing an HL-60 cell was assumed to be initially spherical with a diameter of 14 at the inlet. Simulations were conducted using quad grids with the size of 0.5 The transient simulation was continued until the droplet traveled 300 downstream from the inlet. This distance mirrors the cell’s journey to the measurement point within the lengths of the hydrodynamic constriction channel [18]. Furthermore, adaptive time stepping was employed to ensure that the Courant number remained below 0.25 during the solution.
Figure 13a,b shows the shape of droplets 300mm downstream from the inlet as predicted by the PTT and Carreua-Yasuda models, respectively. A discernible contrast in droplet deformation is evident, with the PTT model indicating greater deformation due to the consideration of the fluid elasticity. Figure 14 depicts a comparison of the shape of the cell predicted in CFD simulations by employing the PTT and Carreua-Yasuda models., Conspicuously, a simplified shear thinning fluid model results in substantially reduced deformation.
Figure 15 shows the distribution of shear stress around the suspended droplets 300 downstream of the inlet as predicted by the PTT (Figure 15a) and Carreua-Yasuda (Figure 15b) models. According to these figures, the maximum shear stress near the droplet in the Carreua-Yasuda model is higher than that predicted by the PTT model. Moreover, the overall predicted distribution of shear stress is significantly different between the two.
Figure 16a,b shows the distribution of axial and radial normal stresses around the suspended droplets. A comparison of these figures with Figure 15a,b indicates that the intensity of the radial component of elastic stress, is less than that of shear stress while the axial component of normal stress, reaches significantly high values around the droplet. According to the present results, the intensity of axial normal stress is significantly higher than that of shear stress around the droplet, which in turn, results in exerting a compressive force and further stretching the deformable particle.
Figure 17a,b shows the distribution of axial velocity around the suspended droplets as predicted by the PTT and Carreua-Yasuda models. As observed in these figures, the PTT model predicts a high-velocity region at the front of the droplet, while the velocity distribution predicted by the Carreua-Yasuda model shows a velocity profile similar to that of fully developed flow. Figure 18a,b shows the distribution of radial velocity around the suspended droplets as predicted by PTT (Figure 18a) and Carreua-Yasuda (Figure 18b) models. According to these figures the radial velocity at the rear and front part of droplet are toward the wall and center of the channel, respectively. Such velocity distributions suggest the formation of a contraction flow regime in the front region of the droplet. Apart from their inability to predict elastic stress and time dependency, GNF models such as Carreua-Yasuda also predict a constant Trouton ratio that is the ratio of extensional viscosity to shear viscosity remains constant at the Newtonian value of 3. Thus, their application for flow-fields with mixed kinematics is more limited [40]. Figure 16a and Figure 17a clearly show an extensional region predicted by the PTT model in the front region of the droplet while Carreua-Yasuda model fails to predict such extensional flow. Moreover, the memory effect inherent in viscoelastic fluids necessitates careful consideration of the minimum distance between two passing cells or the frequency of events. This ensures that the flow-field at a specific point has adequate time to attain the equilibrium condition encountered by the proceeding cell. Without this attention to temporal and spatial dynamics, the observed deformation of distinct cells may not yield reliable results when estimating their mechanical properties or conducting comparative analysis.
4. Conclusions
Demonstrations of the use of uniquely designed microfluic systems for deformability cytometry have accelerated, and many laboratories are seeking translation of these technologies into commercially viable cytometers. The benefit of these cell counters is that they are label-free and the correlation of the mechanical properties of cells with cellular function is found to be consistent and robust. However, while the accurate characterization of cells in these devices hinges on the computational analysis of the exerted stresses on them, the employed models rely on simplified frameworks that only consider viscous stresses and neglect the elasticity of carrier fluids.
Our contribution aims to investigate the influence of the elasticity of commonly used carrier fluid, MC-PBS solution, on cell deformation in hydrodynamic constriction deformability cytometry. A 3D computational analysis was performed for both a conventional shear-thinning fluid model, which neglects fluid elasticity, and a comprehensive viscoelastic model accounting for shear-thinning and elastic properties. The CFD simulations of the single-phase flow of a 0.5% MC-PBS solution indicate that both models yield nearly equivalent distributions of the shear stress and velocity field for fully developed steady shear flow. However, the incorporation of the viscoelastic model reveals a substantial normal stress generation along the channel, contradicting the assumption of zero normal stress in commonly used simple shear-thinning fluid models. Notably, the CFD results indicate that the intensity of predicted normal stress dominates over the shear stress.
Our numerical simulation was extended to predict the transient flow of suspended particles in a 0.5% MC-PBS solution. The model was designed to predict the deformation of a viscous droplet representing an HL-60 cell passing through a hydrodynamic constriction channel. Initially neglecting the fluid elasticity and subsequently considering the complete viscoelastic nature of the carrier fluid, allowed a thorough comparison of the predicted flow fields, stress distributions, and the resulting deformations.
Our CFD results revealed substantial changes in the flow field around moving particles within the channel. Considering the complete viscoelastic behavior of the carrier fluid resulted in slightly different predictions of shear stress distribution around the particles. However, the main difference lay in the prediction of significant normal stresses around the deforming particle, indicating a notable compressive force.
A comparison of the predicted shape of the particles by employing two CFD model models one including the elastic effect and other excluding itunderscores the pivotal role of fluid elasticity in particle deformation.
The predicted flow fields around the moving particle also indicate a mixed shear and extensional flow of the polymer solution, necessitating the use of a CFD model that accounts for the viscoelastic behavior of the fluid. A comparison of the predicted flow fields around the suspended particles using simplified GNF and viscoelastic models revealed substantial differences when elastic stress contributions are considered.
These findings raise compelling questions regarding the accuracy of mechanical property estimates derived from neglecting elastic stresses. The observed discrepancies underscore the importance of accounting for fluid elasticity in deformability cytometry analysis for chips with hydrodynamic constriction channels. The significance here is that many prior demonstrations in the literature have overlooked an essential fluidic property that significantly influences the accuracy of estimated mechanical properties of cells.
Conflicts of Interest
The authors declare no conflicts of interest.
References
- Nematbakhsh, Y., & Lim, C. T. (2015). Cell biomechanics and its applications in human disease diagnosis. Acta Mechanica Sinica, 31, 268-273. [CrossRef]
- Darling, E. M., & Di Carlo, D. (2015). High-throughput assessment of cellular mechanical properties. Annual review of biomedical engineering, 17, 35-62.
- Otto, O., Rosendahl, P., Mietke, A., Golfier, S., Herold, C., Klaue, D., ... & Guck, J. (2015). Real-time deformability cytometry: on-the-fly cell mechanical phenotyping. Nature methods, 12(3), 199-202. [CrossRef]
- Guck, J., Schinkinger, S., Lincoln, B., Wottawah, F., Ebert, S., Romeyke, M., ... & Bilby, C. (2005). Optical deformability as an inherent cell marker for testing malignant transformation and metastatic competence. Biophysical journal, 88(5), 3689-3698.
- Swaminathan, V., Mythreye, K., O’Brien, E. T., Berchuck, A., Blobe, G. C., & Superfine, R. (2011). Mechanical stiffness grades metastatic potential in patient tumor cells and in cancer cell lines. Cancer research, 71(15), 5075-5080. [CrossRef]
- Tse, H. T., Gossett, D. R., Moon, Y. S., Masaeli, M., Sohsman, M., Ying, Y., ... & Di Carlo, D. (2013). Quantitative diagnosis of malignant pleural effusions by single-cell mechanophenotyping. Science translational medicine, 5(212), 212ra163-212ra163. [CrossRef]
- Bufi, N., Saitakis, M., Dogniaux, S., Buschinger, O., Bohineust, A., Richert, A., ... & Asnacios, A. (2015). Human primary immune cells exhibit distinct mechanical properties that are modified by inflammation. Biophysical journal, 108(9), 2181-2190. [CrossRef]
- Bashant, K. R., Vassallo, A., Herold, C., Berner, R., Menschner, L., Subburayalu, J., ... & Toepfner, N. (2019). Real-time deformability cytometry reveals sequential contraction and expansion during neutrophil priming. Journal of leukocyte biology, 105(6), 1143-1153.
- Ekpenyong, A. E., Whyte, G., Chalut, K., Pagliara, S., Lautenschläger, F., Fiddler, C., ... & Guck, J. (2012). Viscoelastic properties of differentiating blood cells are fate-and function-dependent.
- Lin, J., Kim, D., Tse, H. T., Tseng, P., Peng, L., Dhar, M., ... & Di Carlo, D. (2017). High-throughput physical phenotyping of cell differentiation. Microsystems & nanoengineering, 3(1), 1-7. [CrossRef]
- Guck, J., Ananthakrishnan, R., Mahmood, H., Moon, T. J., Cunningham, C. C., & Käs, J. (2001). The optical stretcher: a novel laser tool to micromanipulate cells. Biophysical journal, 81(2), 767-784. [CrossRef]
- Radmacher, M. (2007). Studying the mechanics of cellular processes by atomic force microscopy. Methods in cell biology, 83, 347-372.
- Hochmuth, R. M. (2000). Micropipette aspiration of living cells. Journal of biomechanics, 33(1), 15-22. [CrossRef]
- Thoumine, O., Ott, A., Cardoso, O., & Meister, J. J. (1999). Microplates: a new tool for manipulation and mechanical perturbation of individual cells. Journal of biochemical and biophysical methods, 39(1-2), 47-62. [CrossRef]
- Lange, J. R., Steinwachs, J., Kolb, T., Lautscham, L. A., Harder, I., Whyte, G., & Fabry, B. (2015). Microconstriction arrays for high-throughput quantitative measurements of cell mechanical properties. Biophysical journal, 109(1), 26-34. [CrossRef]
- Nyberg, K. D., Hu, K. H., Kleinman, S. H., Khismatullin, D. B., Butte, M. J., & Rowat, A. C. (2017). Quantitative deformability cytometry: rapid, calibrated measurements of cell mechanical properties. Biophysical journal, 113(7), 1574-1584. [CrossRef]
- Gossett, D. R., Tse, H. T., Lee, S. A., Ying, Y., Lindgren, A. G., Yang, O. O., ... & Di Carlo, D. (2012). Hydrodynamic stretching of single cells for large population mechanical phenotyping. Proceedings of the National Academy of Sciences, 109(20), 7630-7635. [CrossRef]
- Urbanska, M., Muñoz, H. E., Shaw Bagnall, J., Otto, O., Manalis, S. R., Di Carlo, D., & Guck, J. (2020). A comparison of microfluidic methods for high-throughput cell deformability measurements. Nature methods, 17(6), 587-593. [CrossRef]
- Guillou, L., Dahl, J. B., Lin, J. M. G., Barakat, A. I., Husson, J., Muller, S. J., & Kumar, S. (2016). Measuring cell viscoelastic properties using a microfluidic extensional flow device. Biophysical journal, 111(9), 2039-2050. [CrossRef]
- Armistead, F. J., De Pablo, J. G., Gadêlha, H., Peyman, S. A., & Evans, S. D. (2019). Cells under stress: an inertial-shear microfluidic determination of cell behavior. Biophysical Journal, 116(6), 1127-1135. [CrossRef]
- Mietke, A., Otto, O., Girardo, S., Rosendahl, P., Taubenberger, A., Golfier, S., ... & Fischer-Friedrich, E. (2015). Extracting cell stiffness from real-time deformability cytometry: theory and experiment. Biophysical journal, 109(10), 2023-2036. [CrossRef]
- Mokbel, M., Mokbel, D., Mietke, A., Traber, N., Girardo, S., Otto, O., ... & Aland, S. (2017). Numerical simulation of real-time deformability cytometry to extract cell mechanical properties. ACS Biomaterials Science & Engineering, 3(11), 2962-2973. [CrossRef]
- Wang, Z., Lu, R., Wang, W., Tian, F. B., Feng, J. J., & Sui, Y. (2023). A computational model for the transit of a cancer cell through a constricted microchannel. Biomechanics and Modeling in Mechanobiology, 1-15. [CrossRef]
- Büyükurgancı, B., Basu, S. K., Neuner, M., Guck, J., Wierschem, A., & Reichel, F. (2023). Shear rheology of methyl cellulose based solutions for cell mechanical measurements at high shear rates. Soft Matter, 19(9), 1739-1748. [CrossRef]
- Urbanska, M. (2022). Single-cell mechanical phenotyping across timescales and cell state transitions.
- Wu, P. H., Aroush, D. R. B., Asnacios, A., Chen, W. C., Dokukin, M. E., Doss, B. L., ... & Wirtz, D. (2018). A comparison of methods to assess cell mechanical properties. Nature methods, 15(7), 491-498. [CrossRef]
- Thien, N. P., & Tanner, R. I. (1977). A new constitutive equation derived from network theory. Journal of Non-Newtonian Fluid Mechanics, 2(4), 353-365. [CrossRef]
- Alves, M. A., Oliveira, P. J., & Pinho, F. T. (2021). Numerical methods for viscoelastic fluid flows. Annual Review of Fluid Mechanics, 53, 509-541. [CrossRef]
- Cruz, D. O. A., Pinho, F., & Oliveira, P. J. (2005). Analytical solutions for fully developed laminar flow of some viscoelastic liquids with a Newtonian solvent contribution. Journal of non-newtonian fluid mechanics, 132(1-3), 28-35. [CrossRef]
- Azaiez, J., Guénette, R., & Ait-Kadi, A. (1996). Numerical simulation of viscoelastic flows through a planar contraction. Journal of non-newtonian fluid mechanics, 62(2-3), 253-277. [CrossRef]
- Lizarraga-Garcia, E., Buongiorno, J., Al-Safran, E., & Lakehal, D. (2017). A broadly-applicable unified closure relation for Taylor bubble rise velocity in pipes with stagnant liquid. International journal of multiphase flow, 89, 345-358. [CrossRef]
- Caviezel, D., Narayanan, C., & Lakehal, D. (2008). Adherence and bouncing of liquid droplets impacting on dry surfaces. Microfluidics and Nanofluidics, 5, 469-478. [CrossRef]
- Lakehal, D., Larrignon, G., & Narayanan, C. (2008). Computational heat transfer and two-phase flow topology in miniature tubes. Microfluidics and nanofluidics, 4(4), 261-271. [CrossRef]
- Lakehal, D., Meier, M., & Fulgosi, M. (2002). Interface tracking towards the direct simulation of heat and mass transfer in multiphase flows. International Journal of Heat and Fluid Flow, 23(3), 242-257. [CrossRef]
- Suzuki, T., Kalyan, S., Berlinicke, C., Yoseph, S., Zack, D. J., & Hur, S. C. (2023). Deciphering viscoelastic cell manipulation in rectangular microchannels. Physics of Fluids, 35(10). [CrossRef]
- Pouraria, H., Foudazi, R., & Houston, J. P. (2023). Exploitation of elasto-inertial fluid flow for the separation of nano-sized particles: simulating the isolation of extracellular vesicles. Cytometry Part A. [CrossRef]
- Poryles, R., & Zenit, R. (2018). Encapsulation of droplets using cusp formation behind a drop rising in a non-Newtonian fluid. Fluids, 3(3), 54. [CrossRef]
- Ohta, M., Kobayashi, N., Shigekane, Y., Yoshida, Y., & Iwata, S. (2015). The dynamic motion of single bubbles with unique shapes rising freely in hydrophobically modified alkali-soluble emulsion polymer solutions. Journal of Rheology, 59(2), 303-316. [CrossRef]
- Esposito, G., Dimakopoulos, Y., & Tsamopoulos, J. (2023). Buoyancy driven flow of a viscous drop in viscoelastic materials. Journal of Non-Newtonian Fluid Mechanics, 321, 105124. [CrossRef]
- Poole, R. J. (2023). Inelastic and flow-type parameter models for non-Newtonian fluids. Journal of Non-Newtonian Fluid Mechanics, 105106. [CrossRef]
- Mirzaaghaian, A., Ramiar, A., Ranjbar, A. A., & Warkiani, M. E. (2020). Application of level-set method in simulation of normal and cancer cells deformability within a microfluidic device. Journal of biomechanics, 112, 110066. [CrossRef]
- Nooranidoost, M., & Kumar, R. (2020). Improving viability of leukemia cells by tailoring shell fluid rheology in constricted microcapillary. Scientific Reports, 10(1), 11570. [CrossRef]
- Hochmuth, R. M. (2000). Micropipette aspiration of living cells. Journal of biomechanics, 33(1), 15-22. [CrossRef]
- Tsai, M. A., Waugh, R. E., & Keng, P. C. (1996). Cell cycle-dependence of HL-60 cell deformability. Biophysical journal, 70(4), 2023-2029. [CrossRef]
- Rosenbluth, M. J., Lam, W. A., & Fletcher, D. A. (2006). Force microscopy of nonadherent cells: a comparison of leukemia cell deformability. Biophysical journal, 90(8), 2994-3003. [CrossRef]
Figure 1.
Experimental shear viscosity vs PTT and Carreau-Yasuda models.
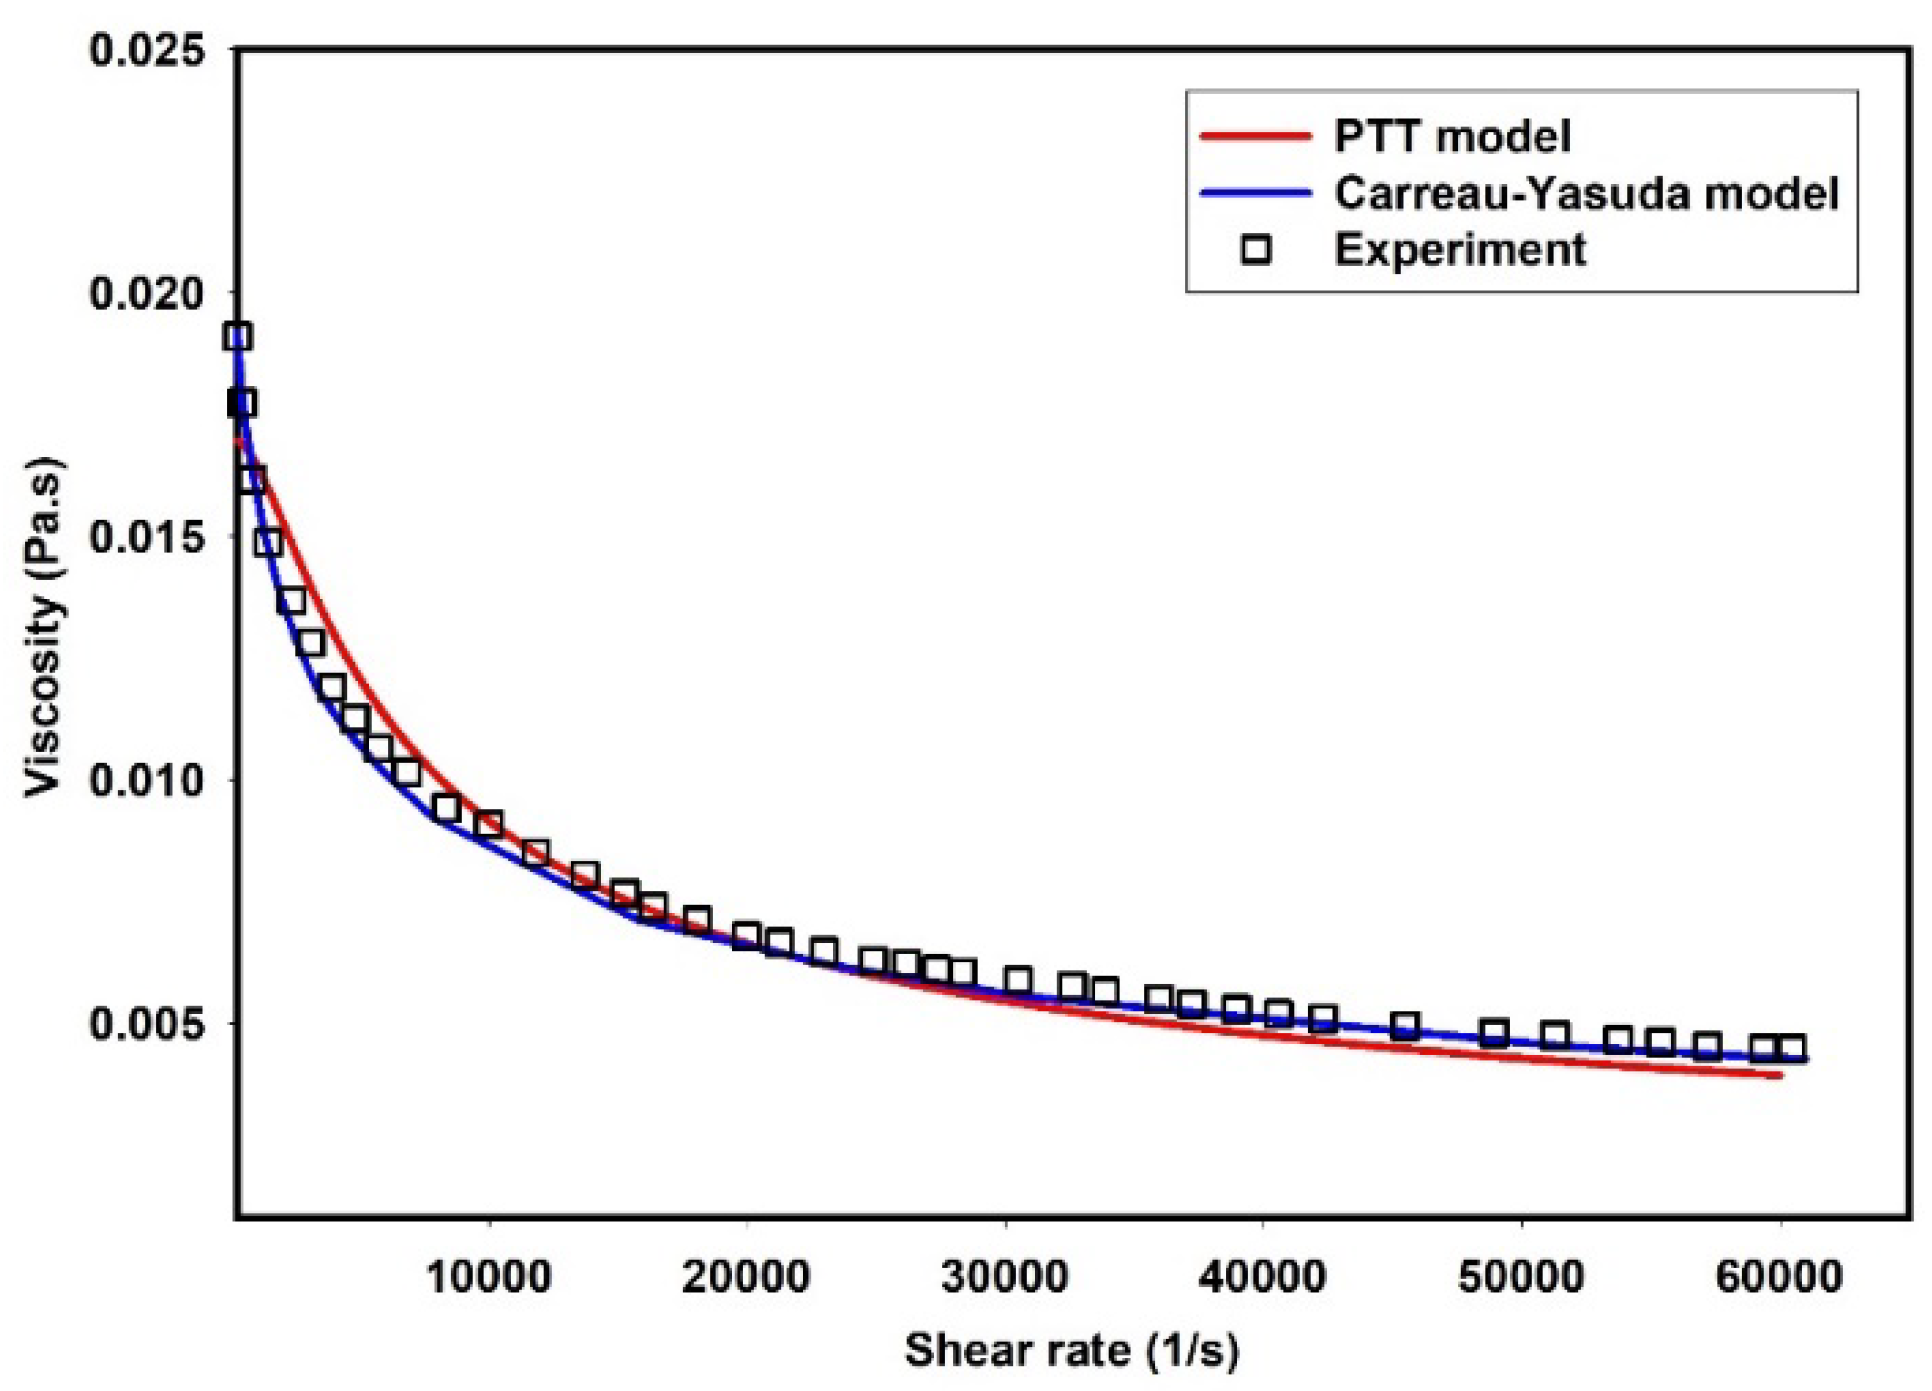
Figure 2.
A schematic of typical microchannel geometry in hydrodynamic constriction deformability cytometry (a) and the adopted 3D grid in the CFD model (b).
Figure 2.
A schematic of typical microchannel geometry in hydrodynamic constriction deformability cytometry (a) and the adopted 3D grid in the CFD model (b).
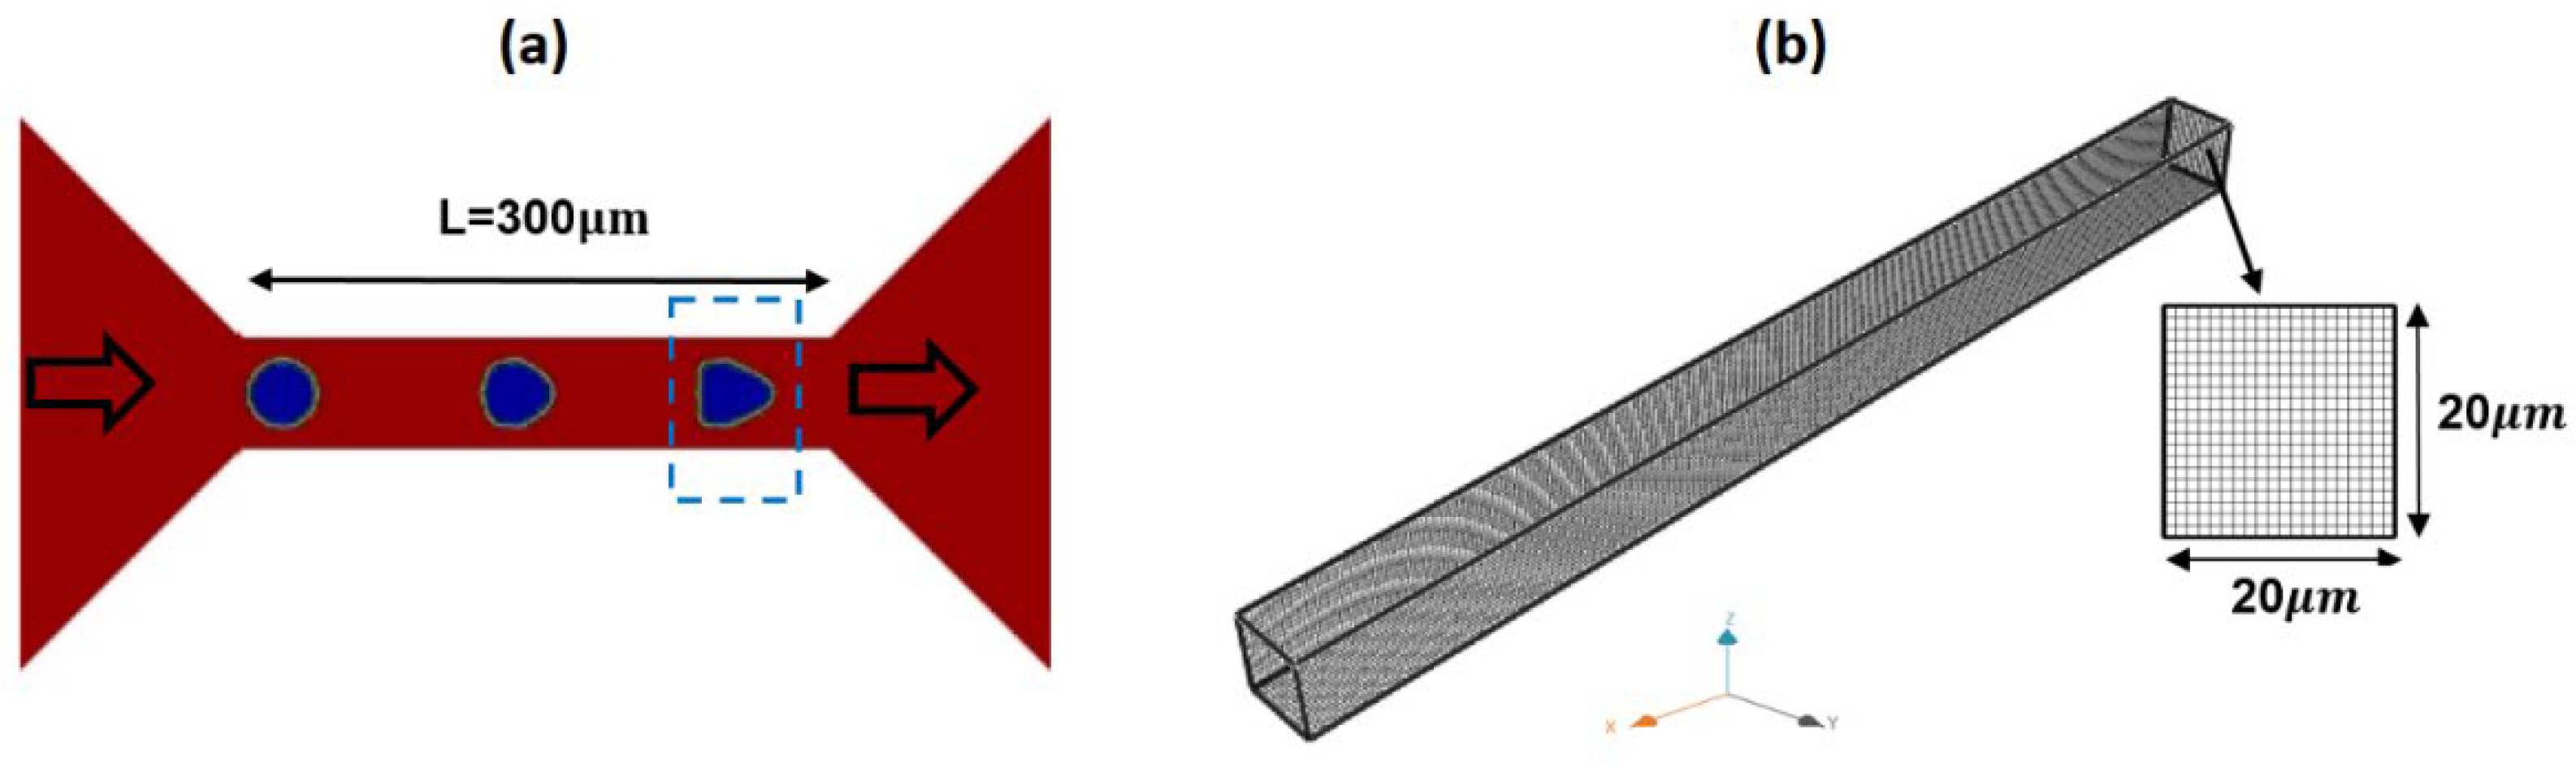
Figure 3.
Shear rate distribution across the width of channel as predicted by Carreau-Yasuda model.
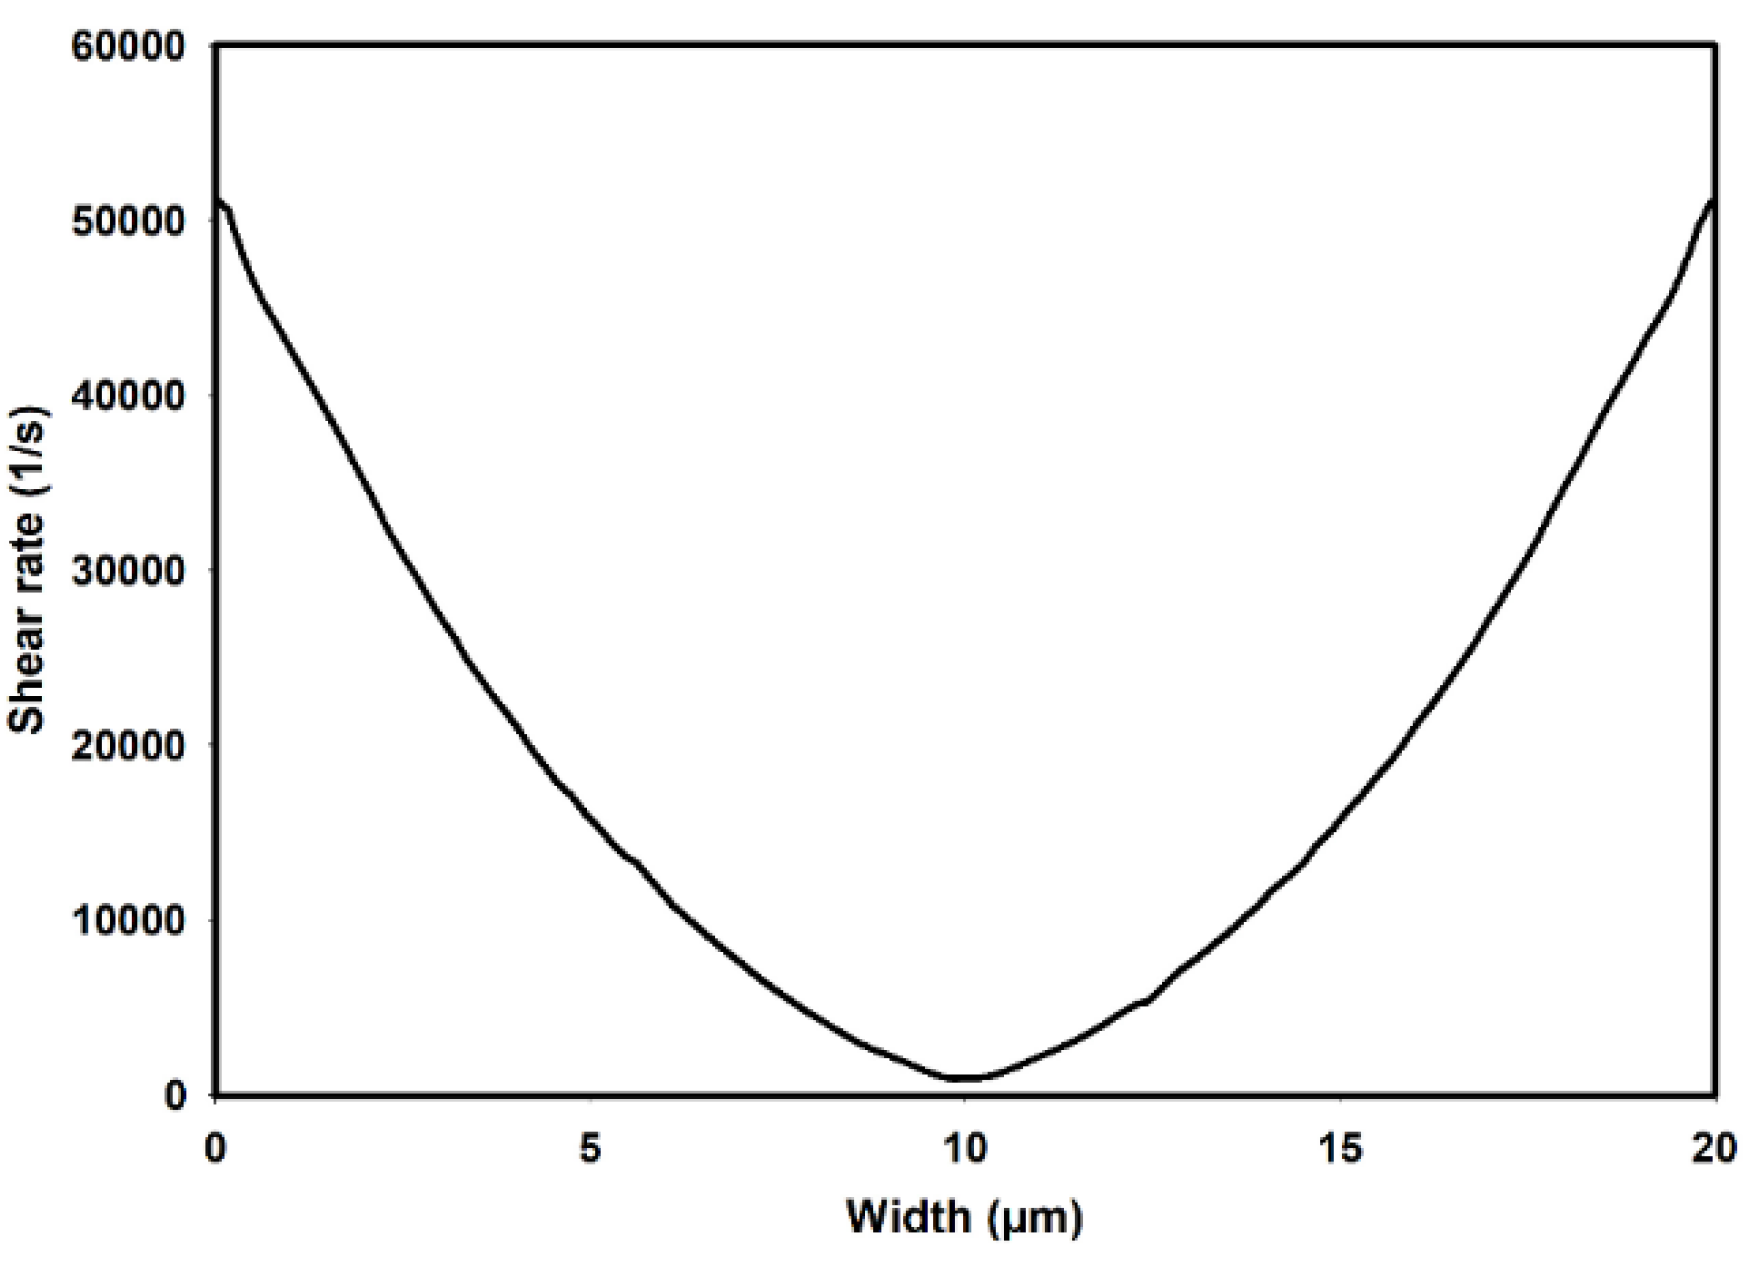
Figure 4.
Distribution of axial velocity as predicted by (a) PTT model and (b) Carreau-Yasuda model.
Figure 4.
Distribution of axial velocity as predicted by (a) PTT model and (b) Carreau-Yasuda model.
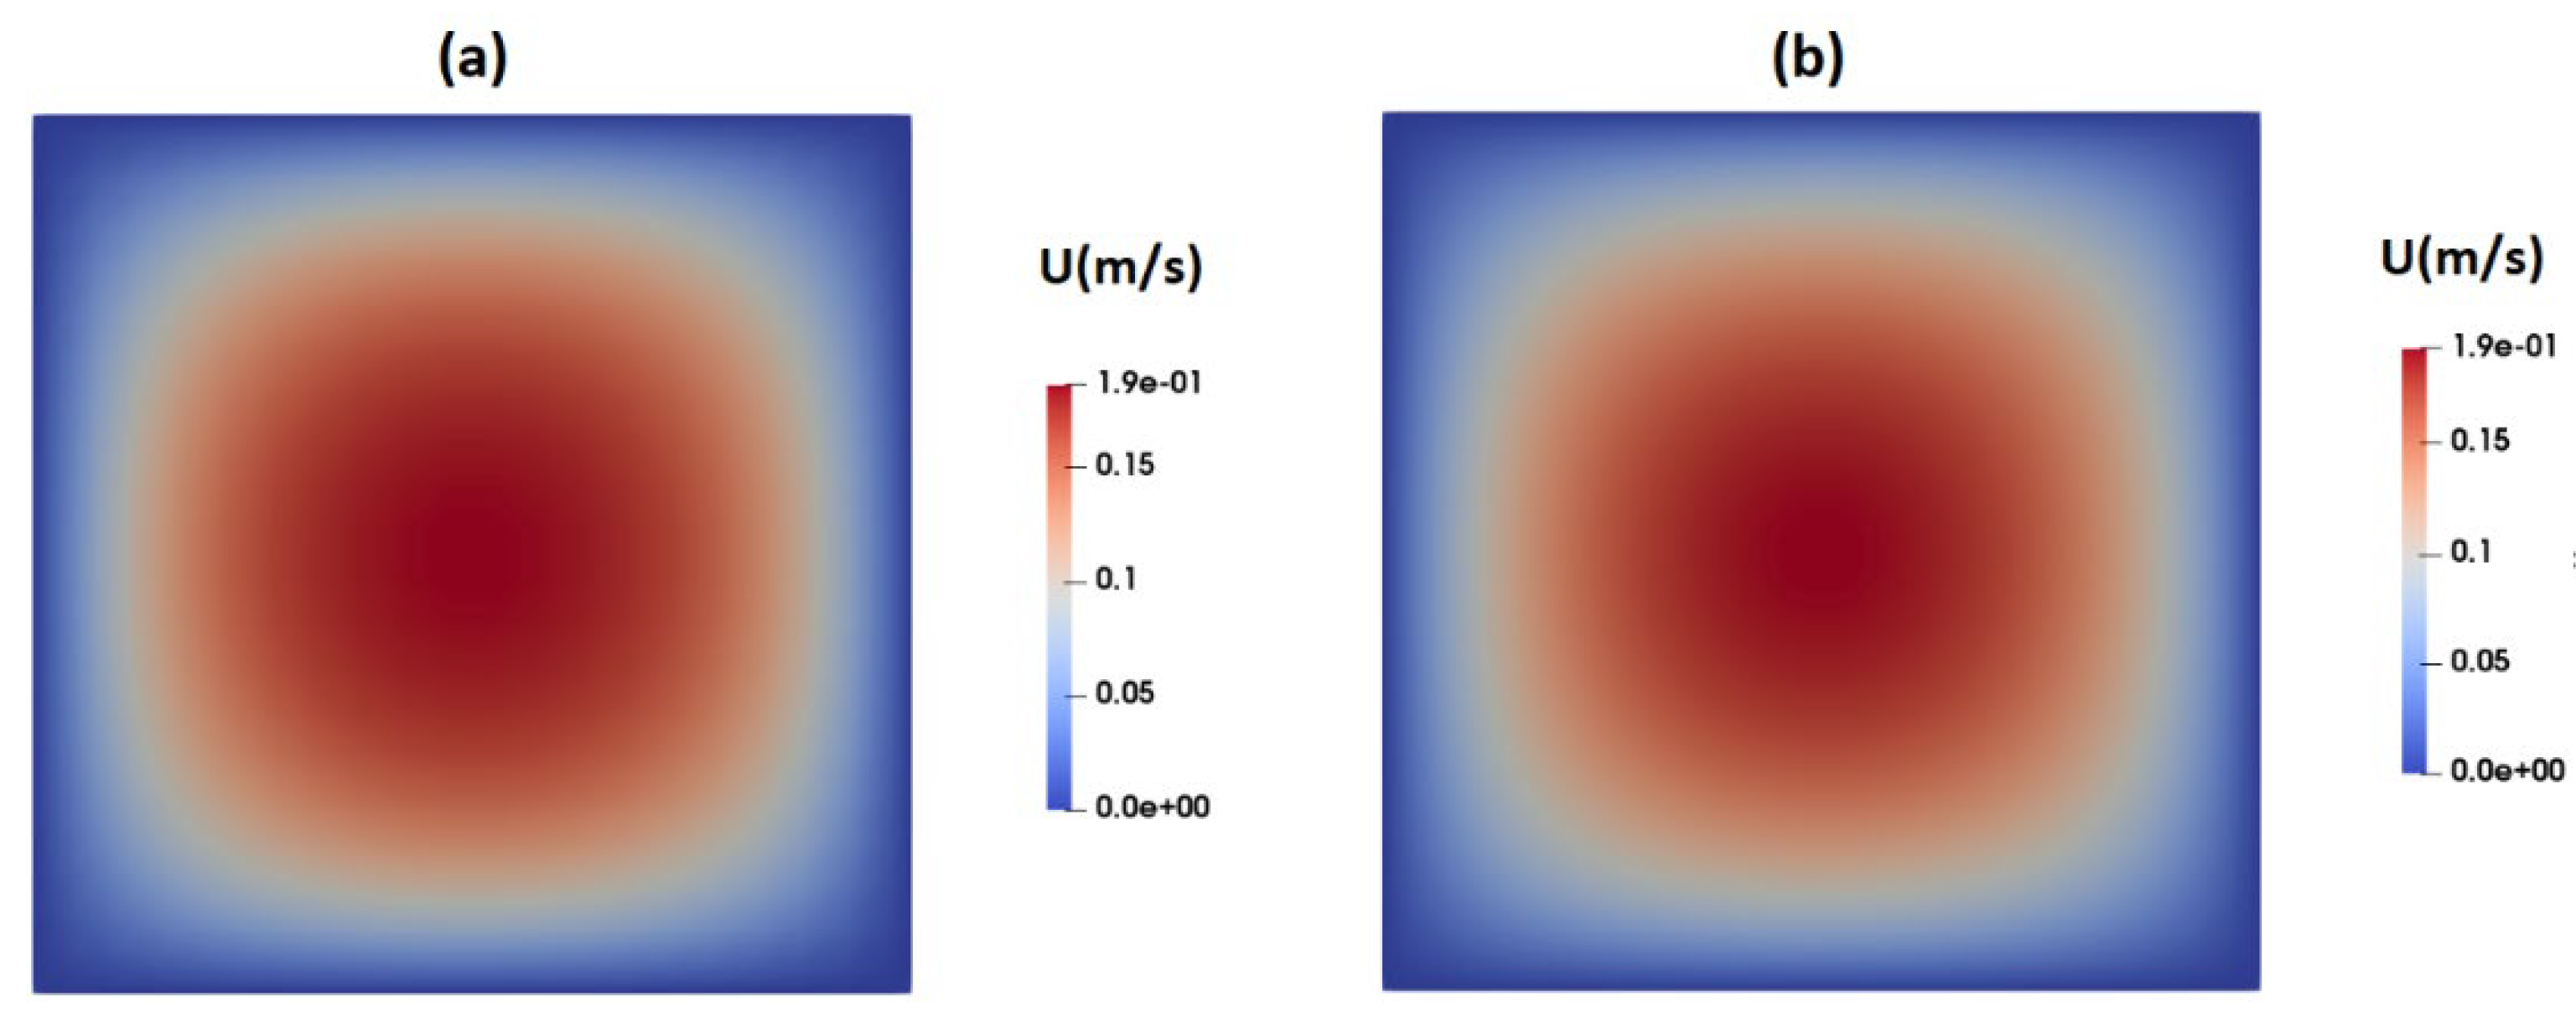
Figure 5.
Velocity distribution across the width of channel.
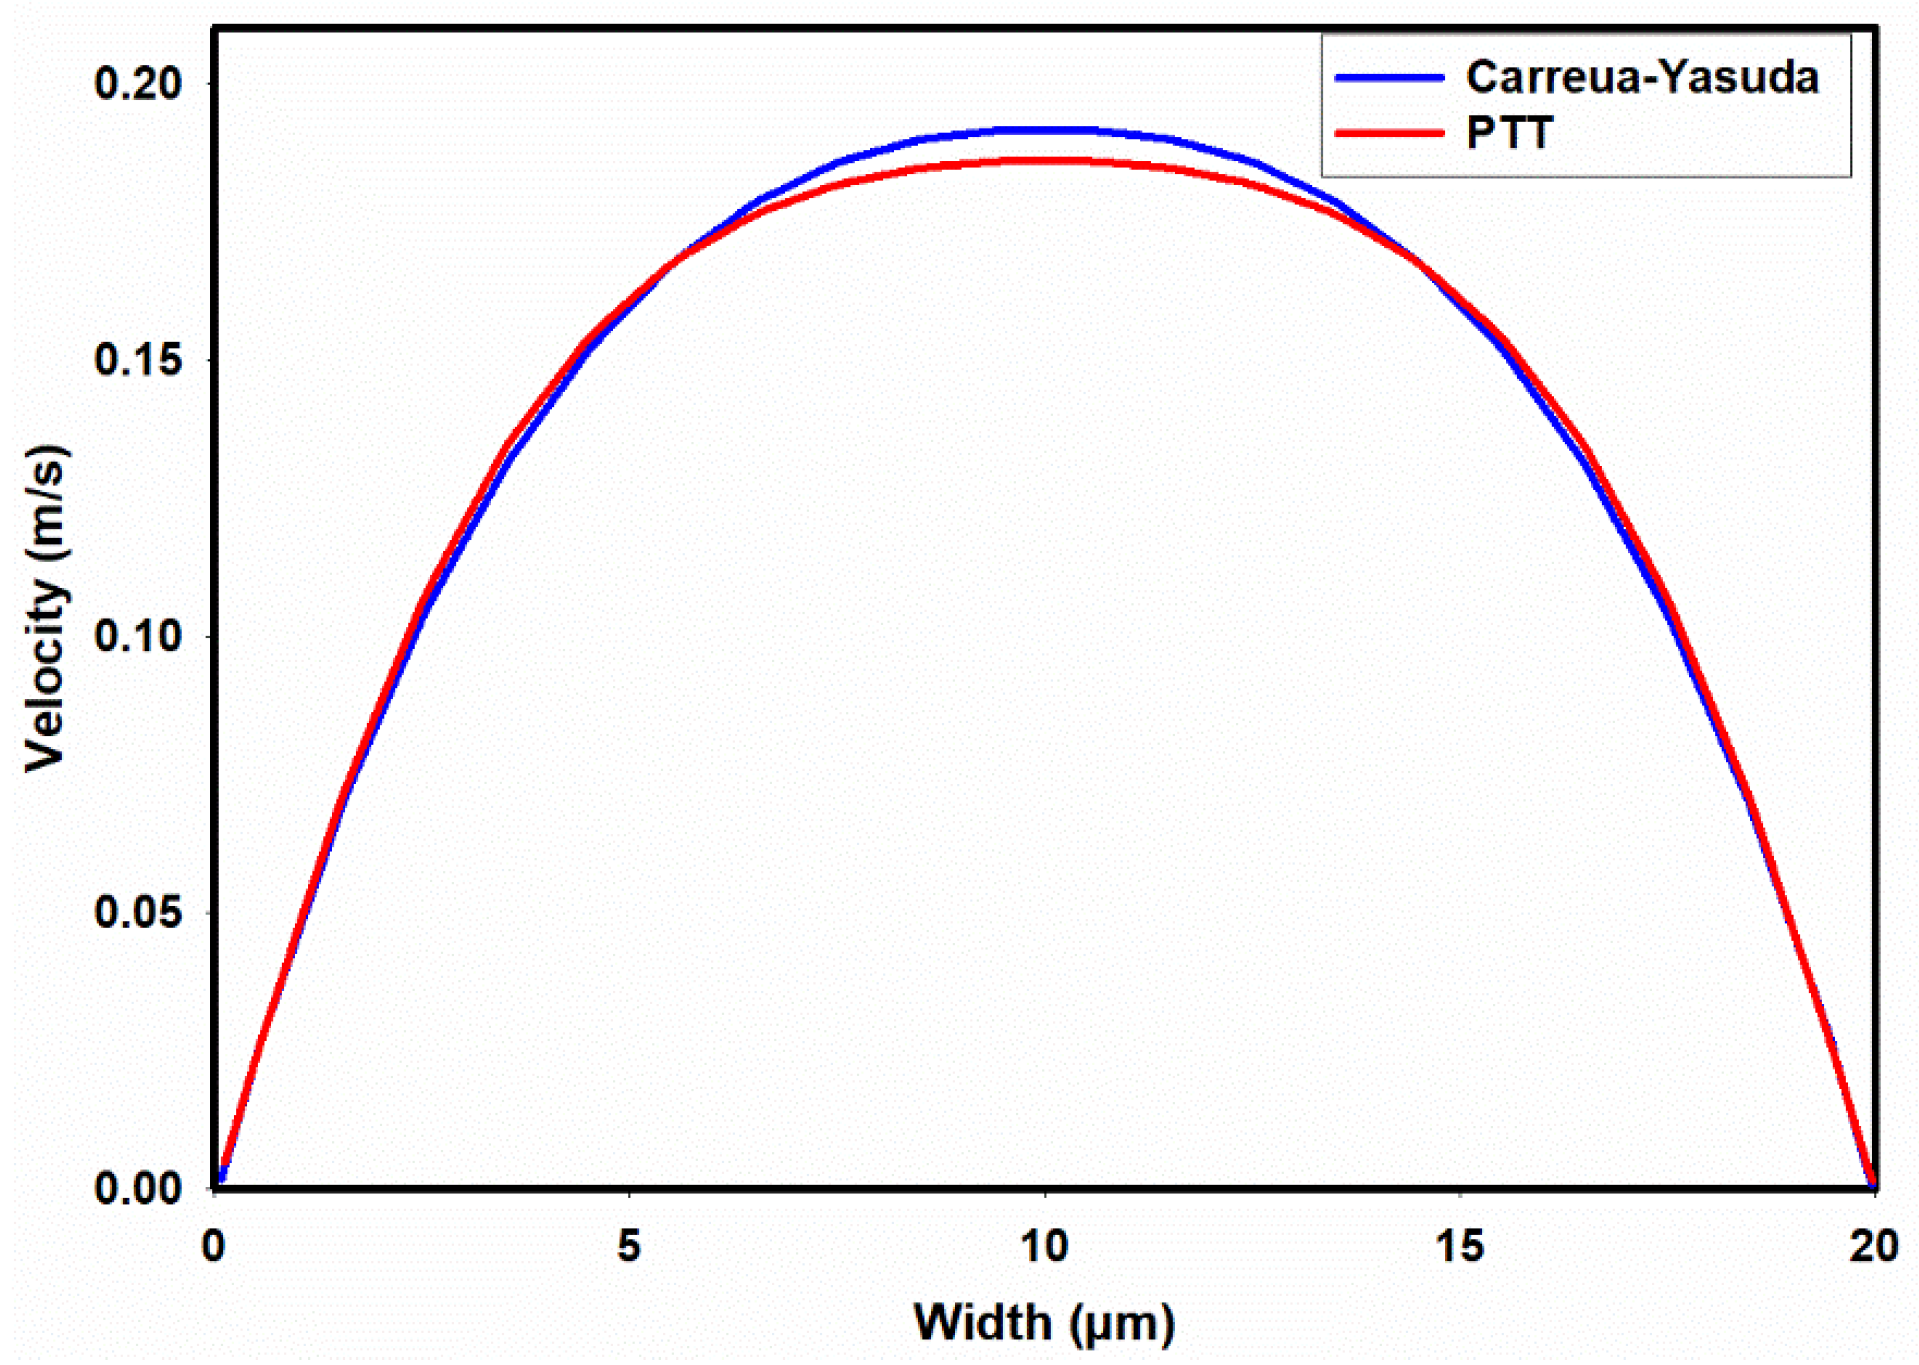
Figure 6.
Contours of shear stress at the channel cross section as predicted by the Carreau-Yasuda model.
Figure 6.
Contours of shear stress at the channel cross section as predicted by the Carreau-Yasuda model.
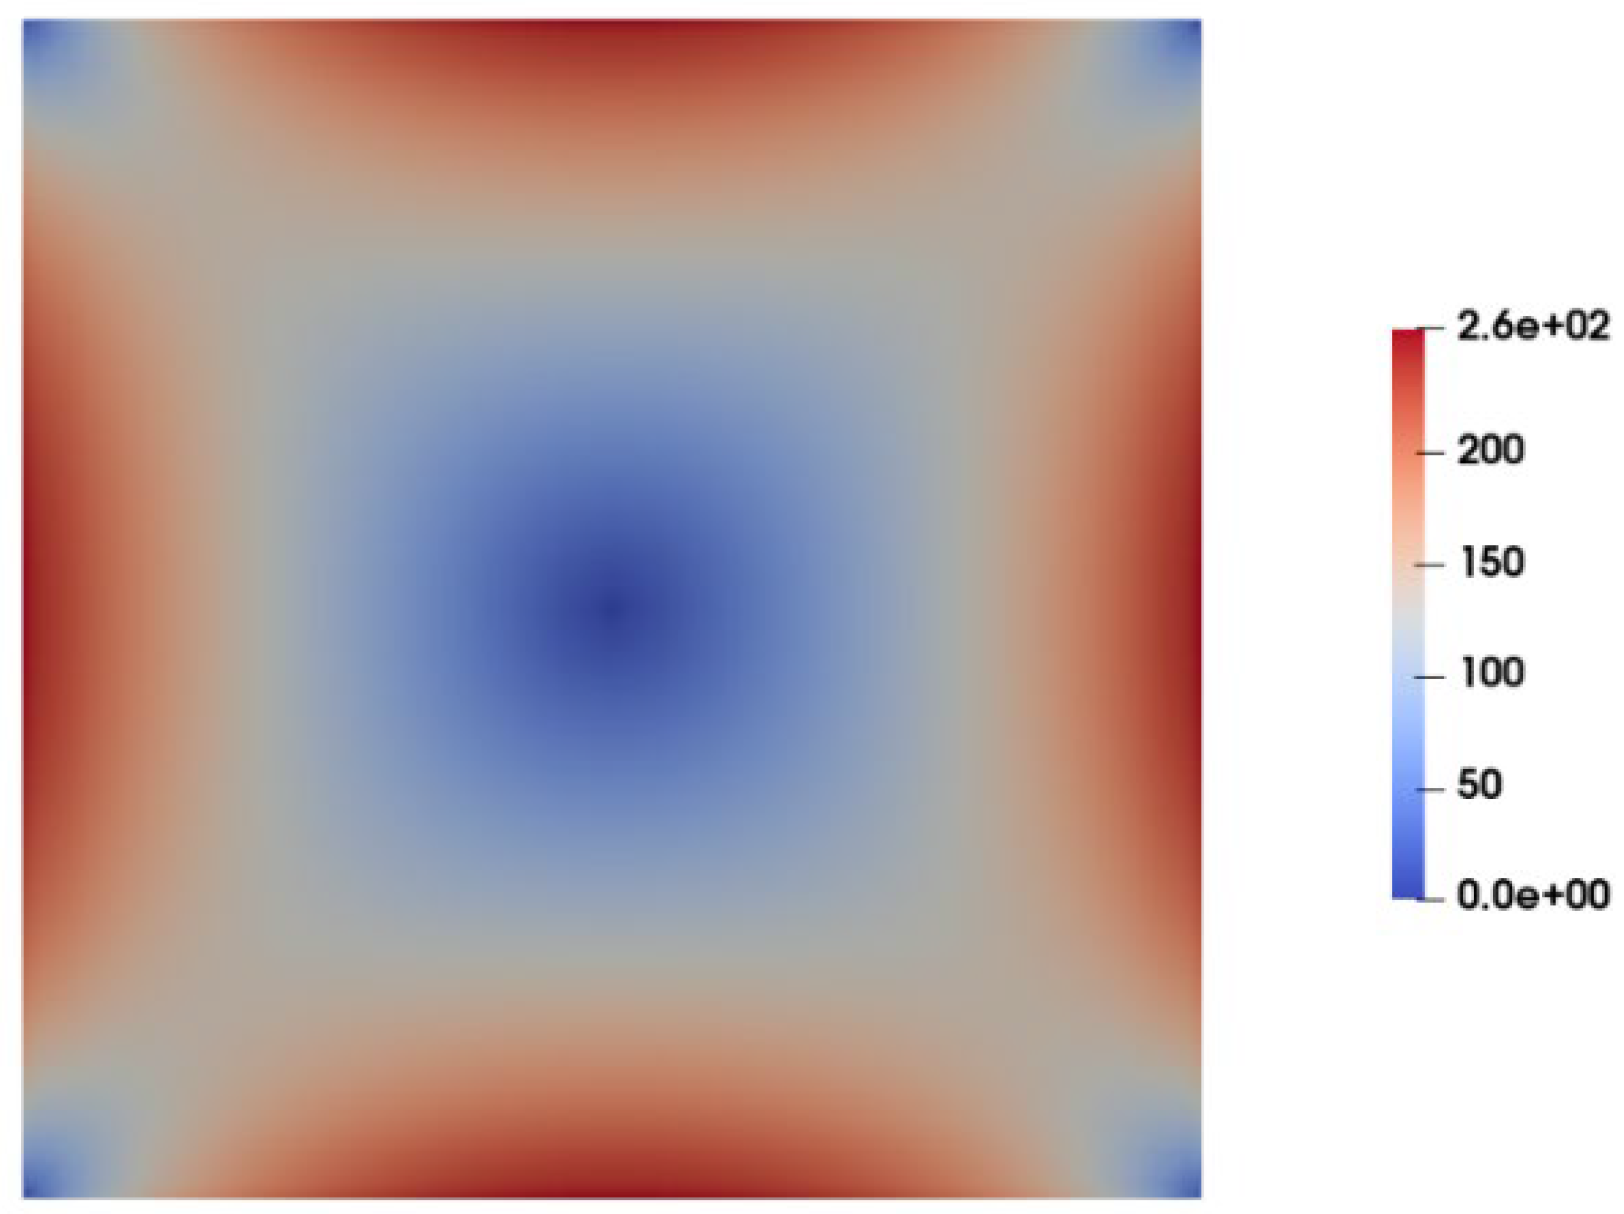
Figure 7.
Contours of shear stress at the channel cross section as predicted by the PTT model (a) polymer shear stress, (b) solvent shear stress.
Figure 7.
Contours of shear stress at the channel cross section as predicted by the PTT model (a) polymer shear stress, (b) solvent shear stress.
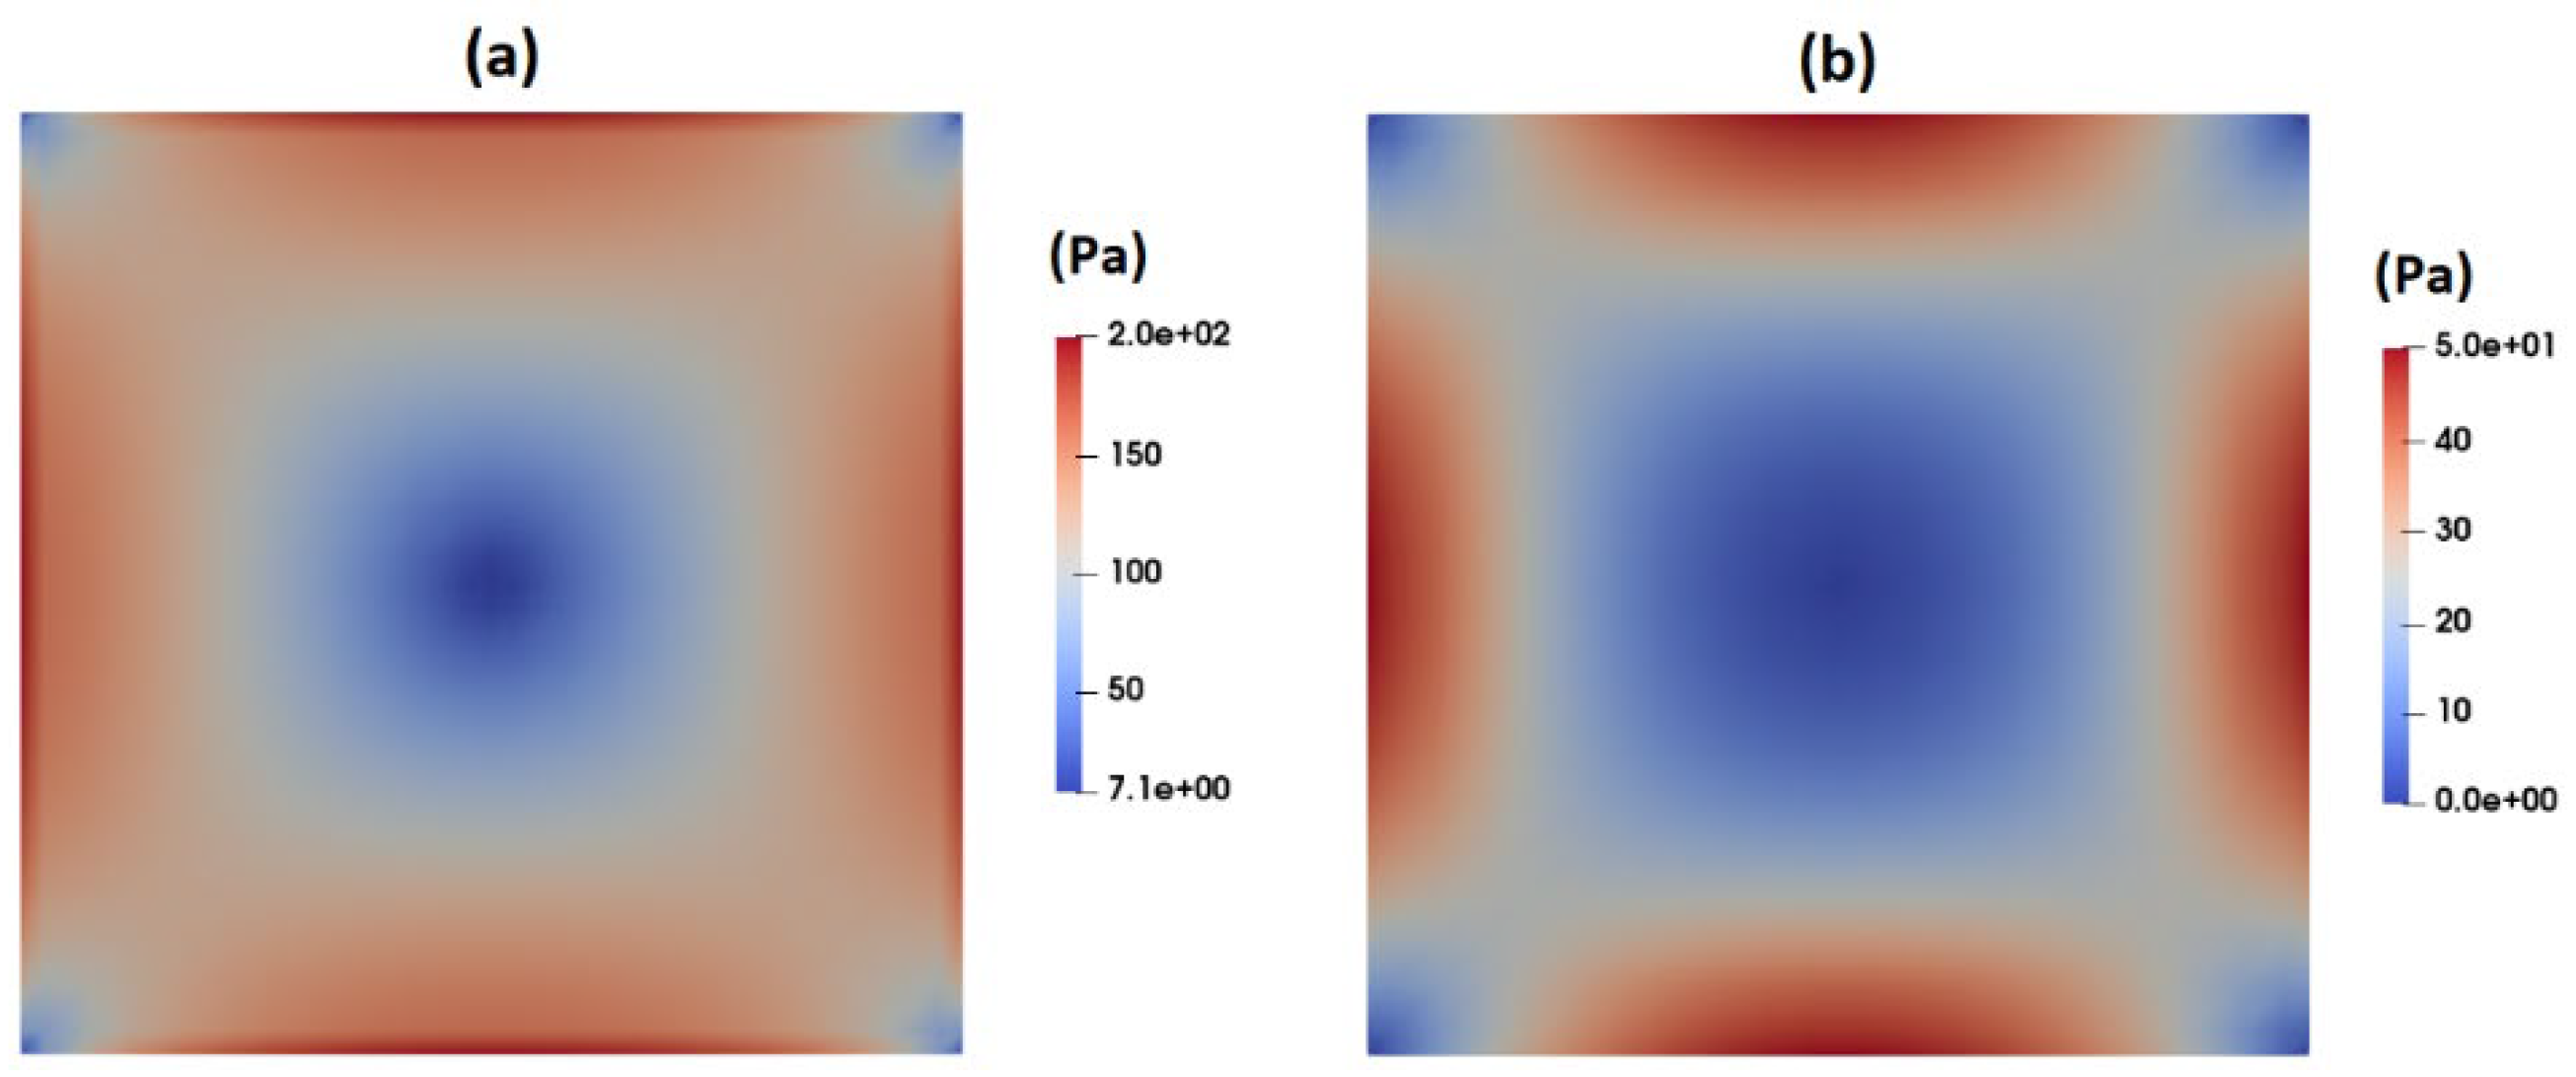
Figure 8.
Distribution of total shear stress ( across the width of channel as predicted by the PTT and Carreau-Yasuda models.
Figure 8.
Distribution of total shear stress ( across the width of channel as predicted by the PTT and Carreau-Yasuda models.
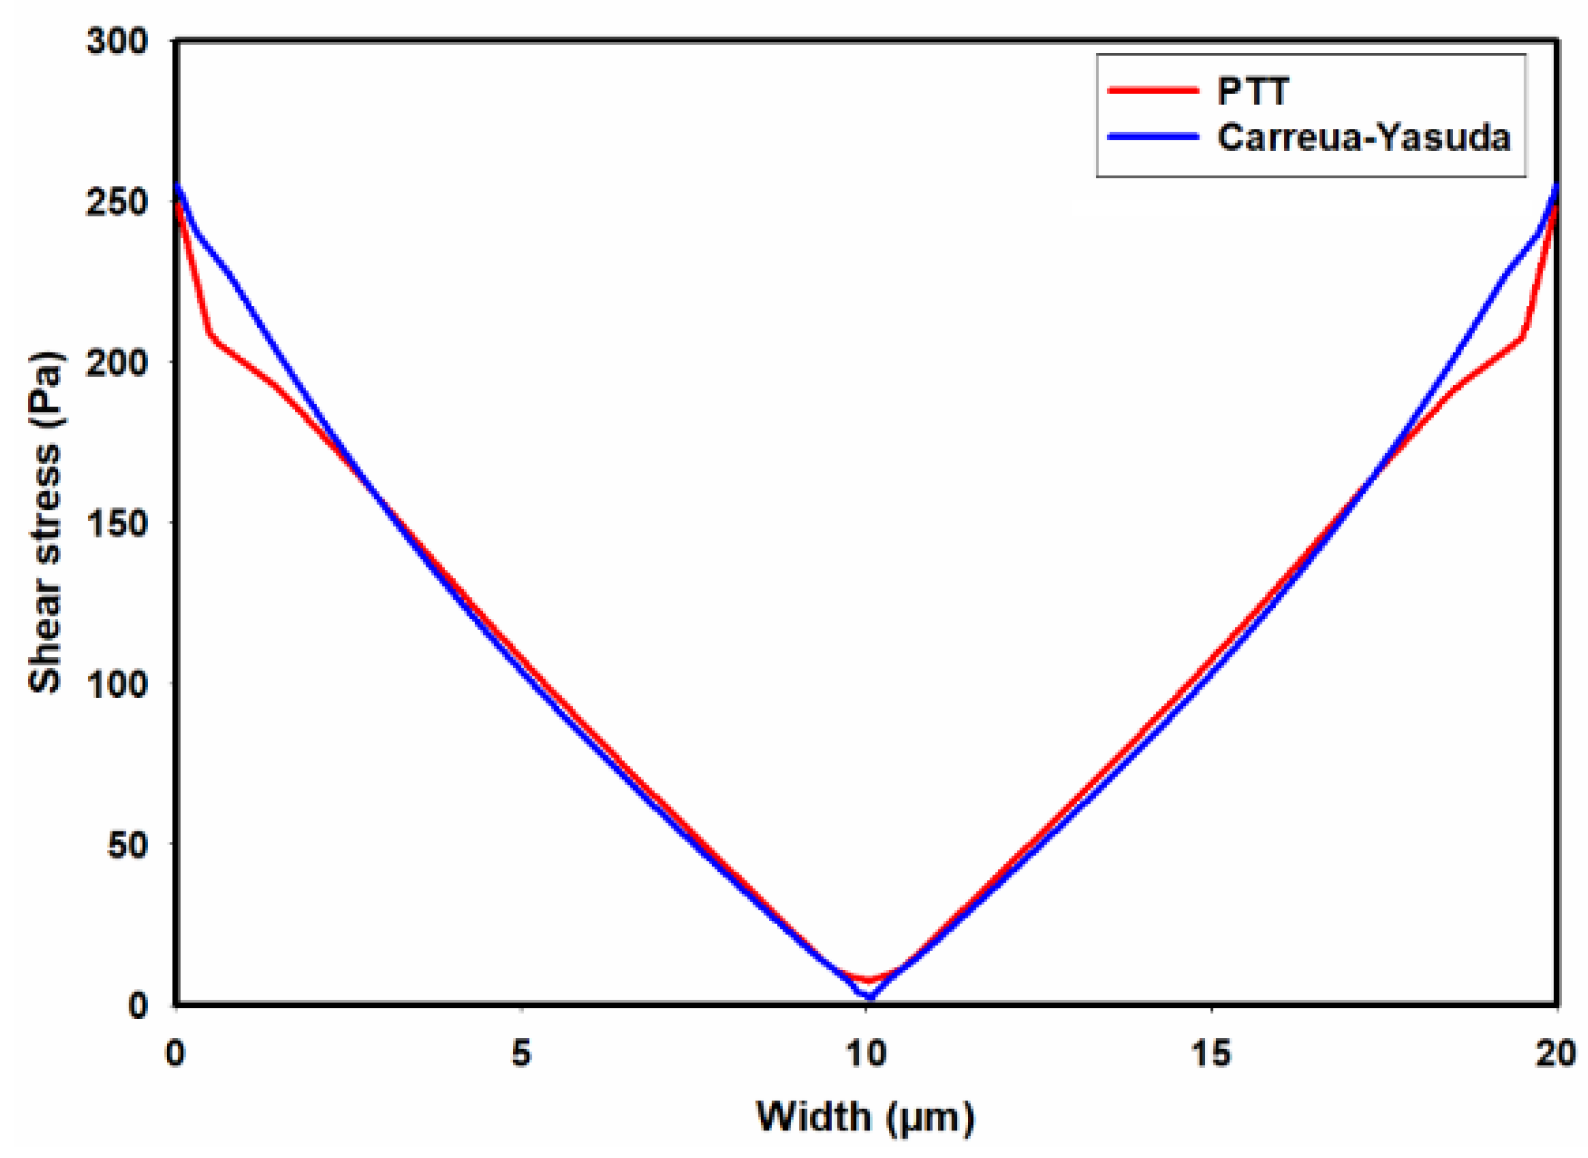
Figure 9.
Distribution of normal stress ( at the channel cross section as predicted by the PTT model.
Figure 9.
Distribution of normal stress ( at the channel cross section as predicted by the PTT model.
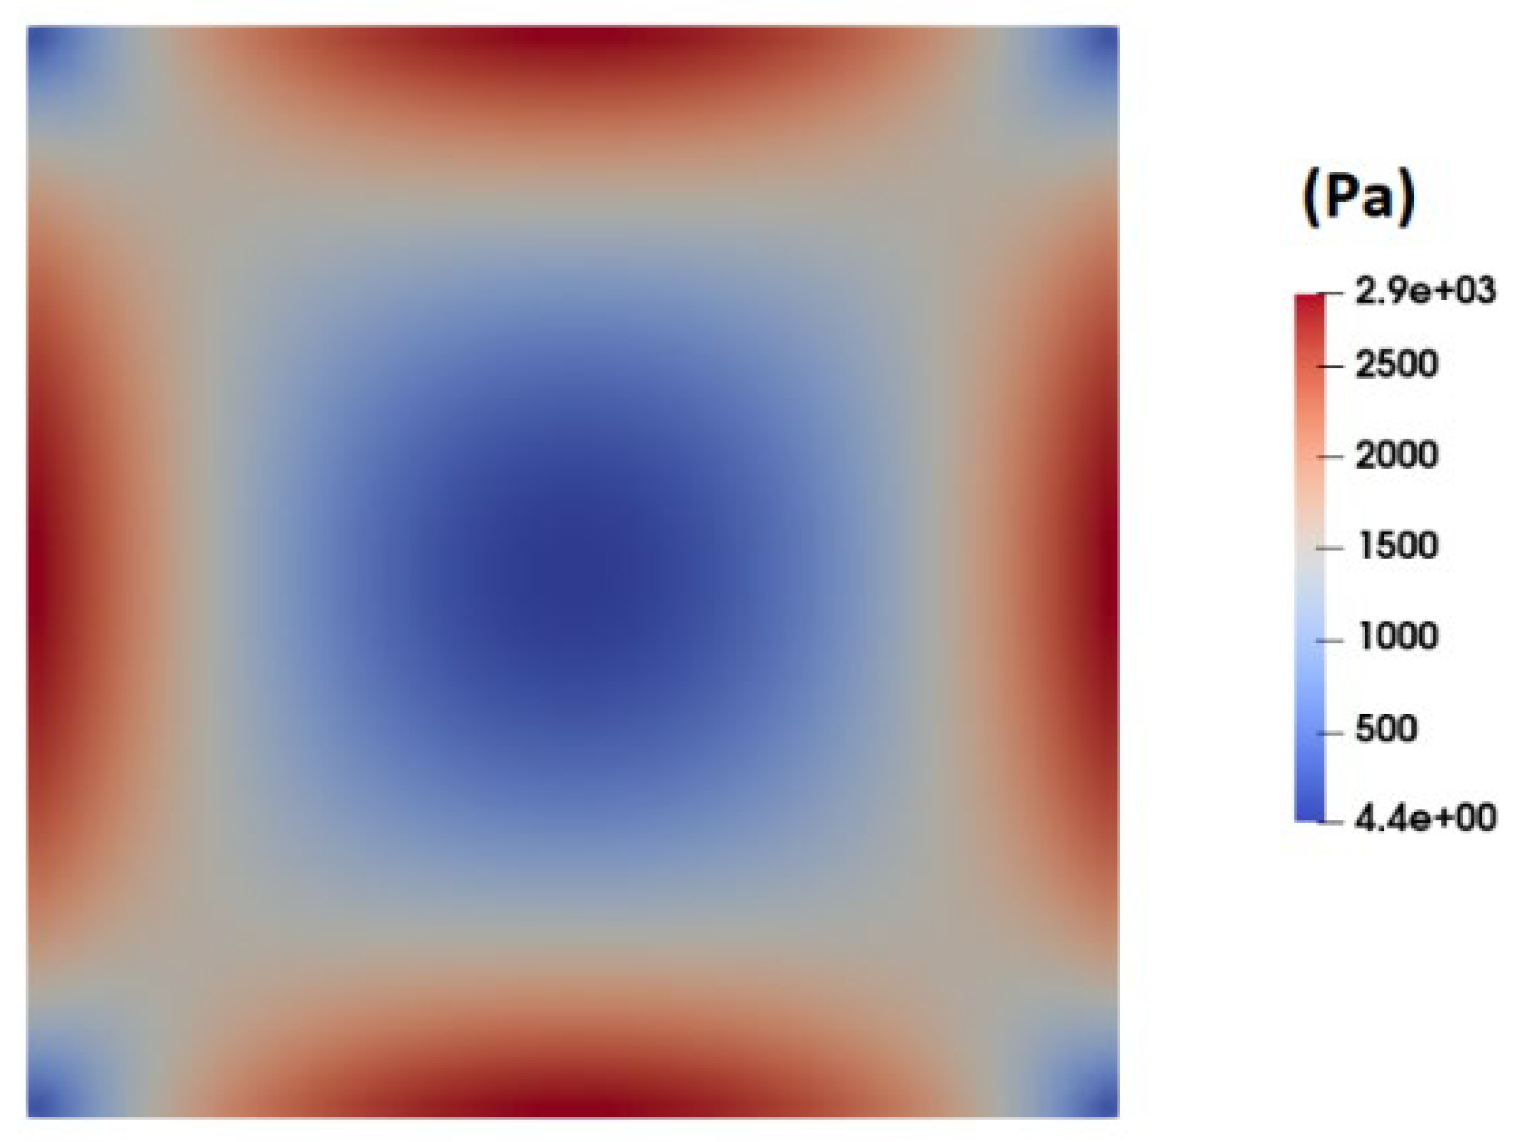
Figure 10.
Distribution of normal stress ( across the width of the channel as predicted by the PTT model.
Figure 10.
Distribution of normal stress ( across the width of the channel as predicted by the PTT model.
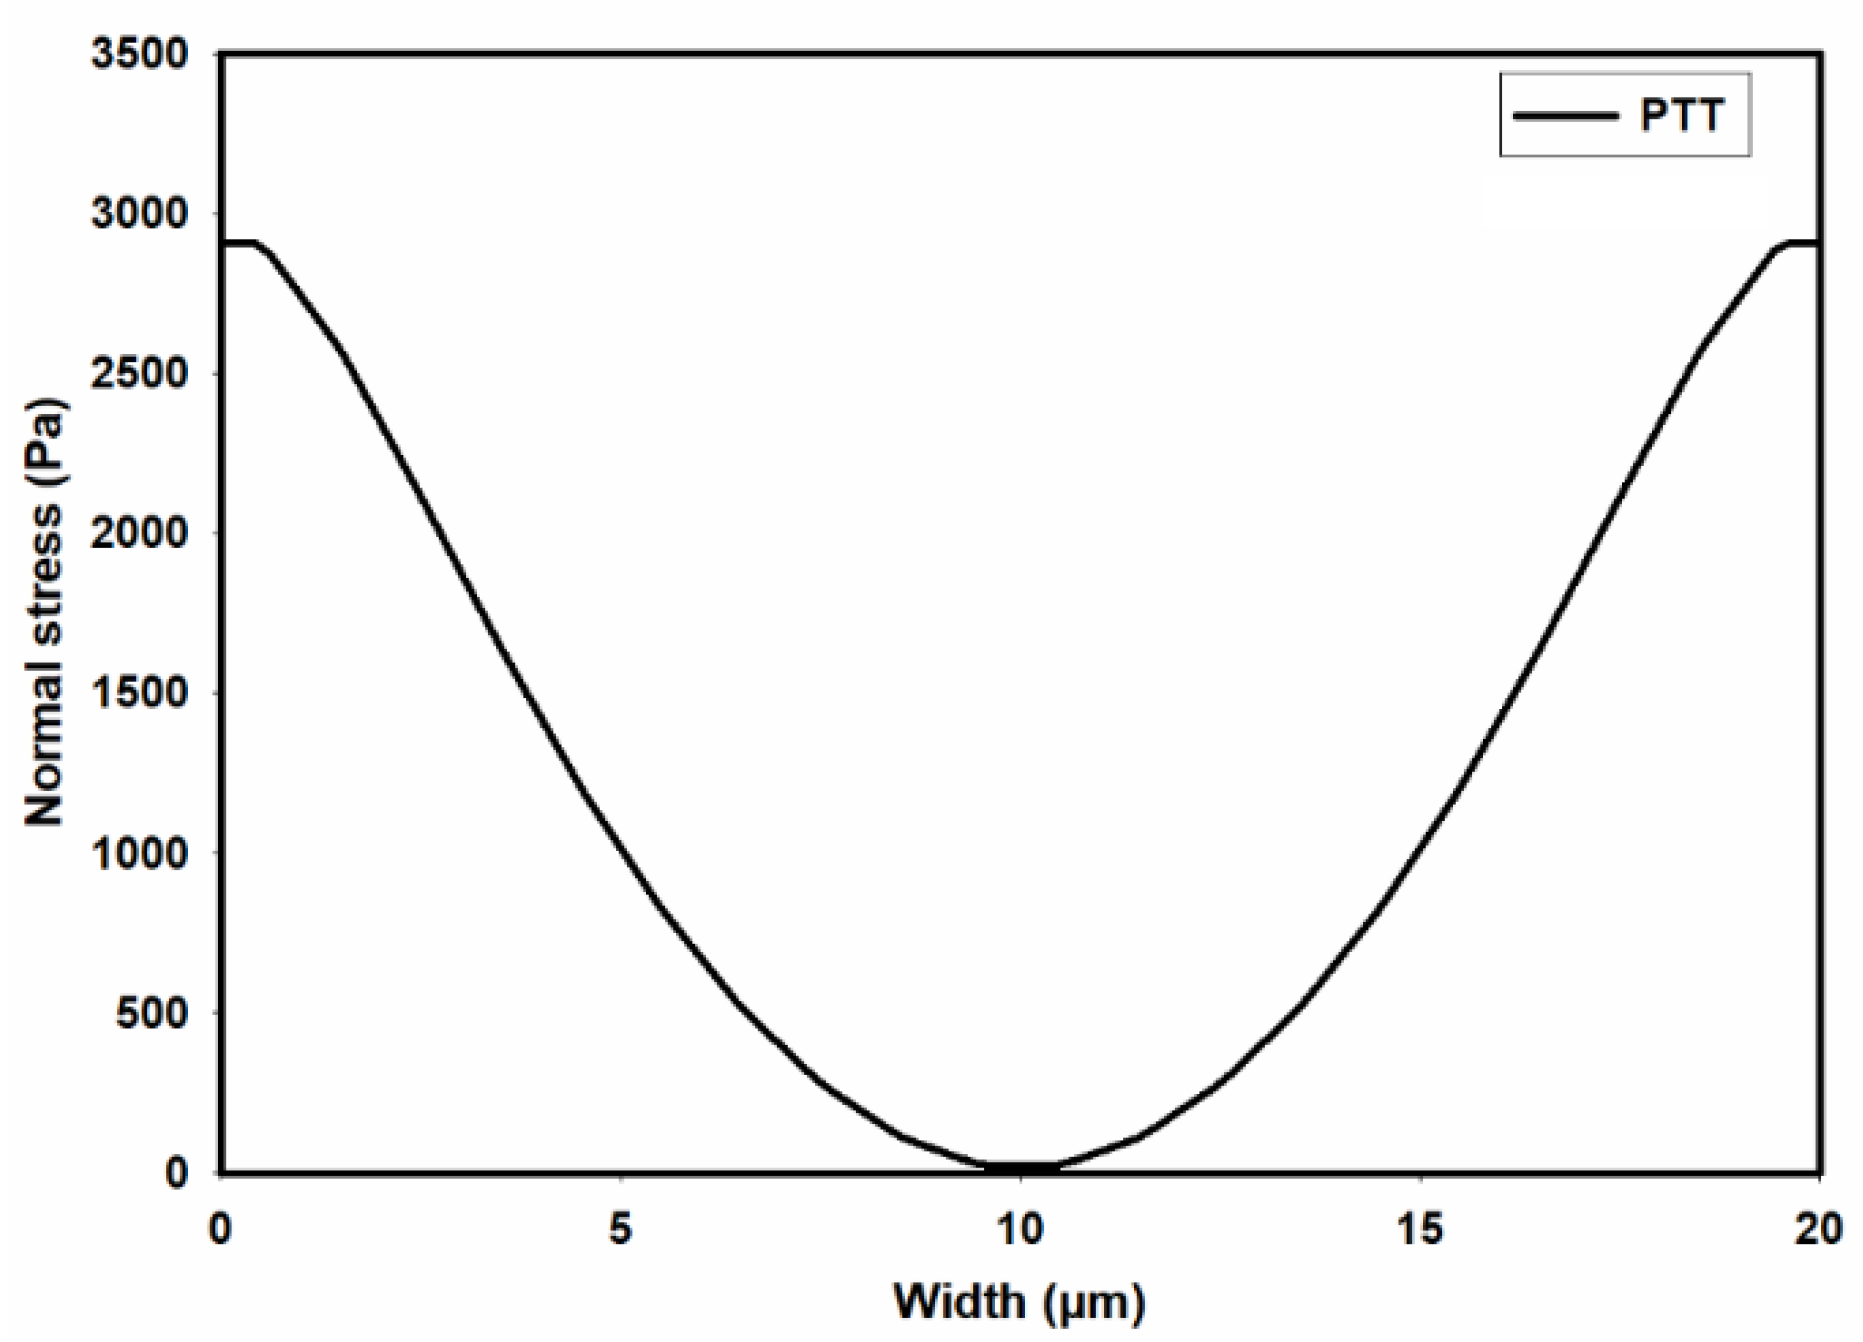
Figure 11.
Distribution of average shear stress at the wall along the channel as predicted by the PTT and Carreau-Yasuda models.
Figure 11.
Distribution of average shear stress at the wall along the channel as predicted by the PTT and Carreau-Yasuda models.
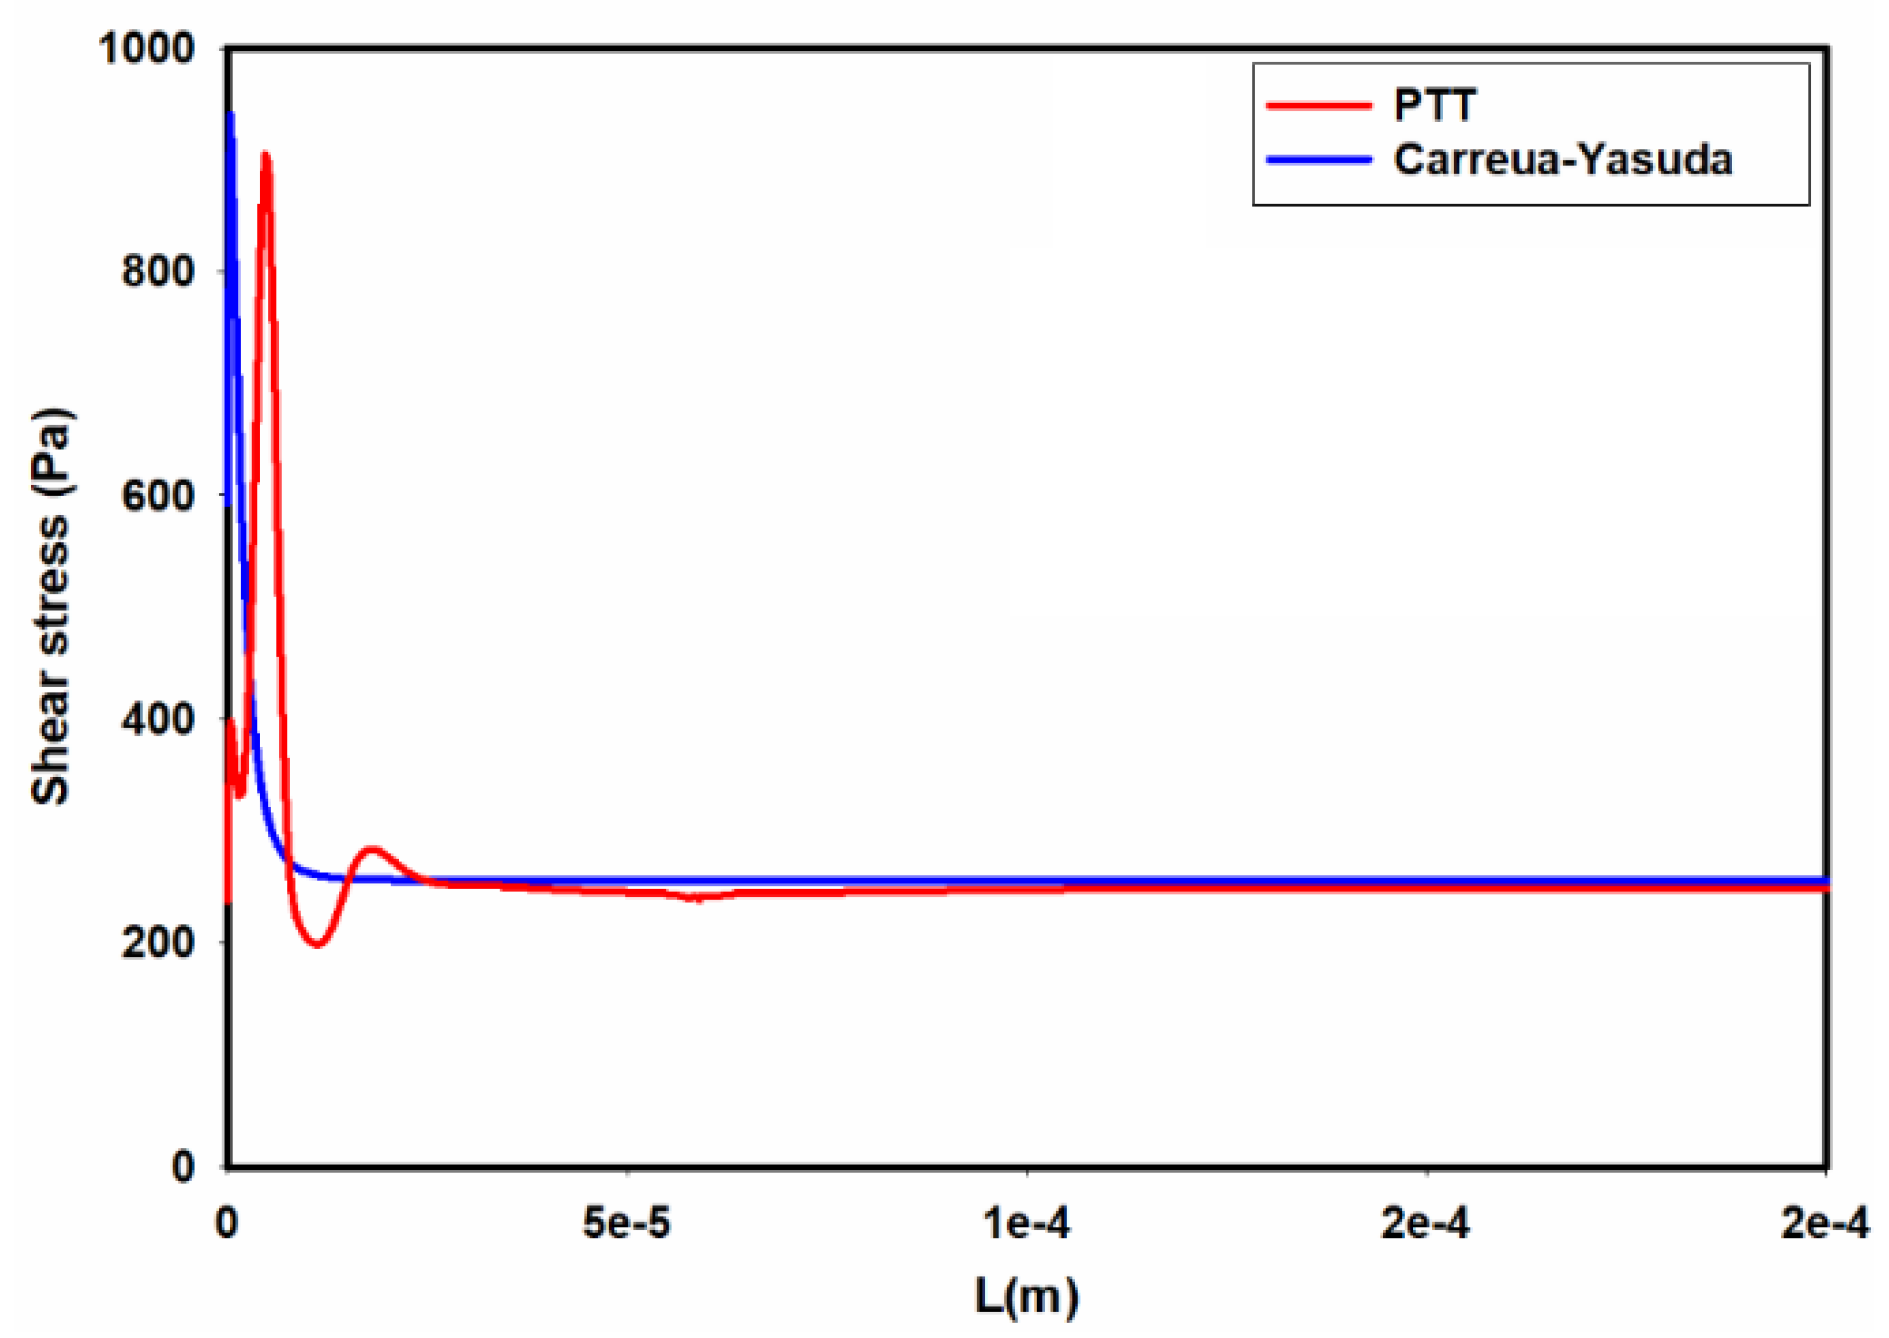
Figure 12.
A comparison of the predicted velocity profiles using analytical and numerical model. De=6.3, =0.1, .
Figure 12.
A comparison of the predicted velocity profiles using analytical and numerical model. De=6.3, =0.1, .
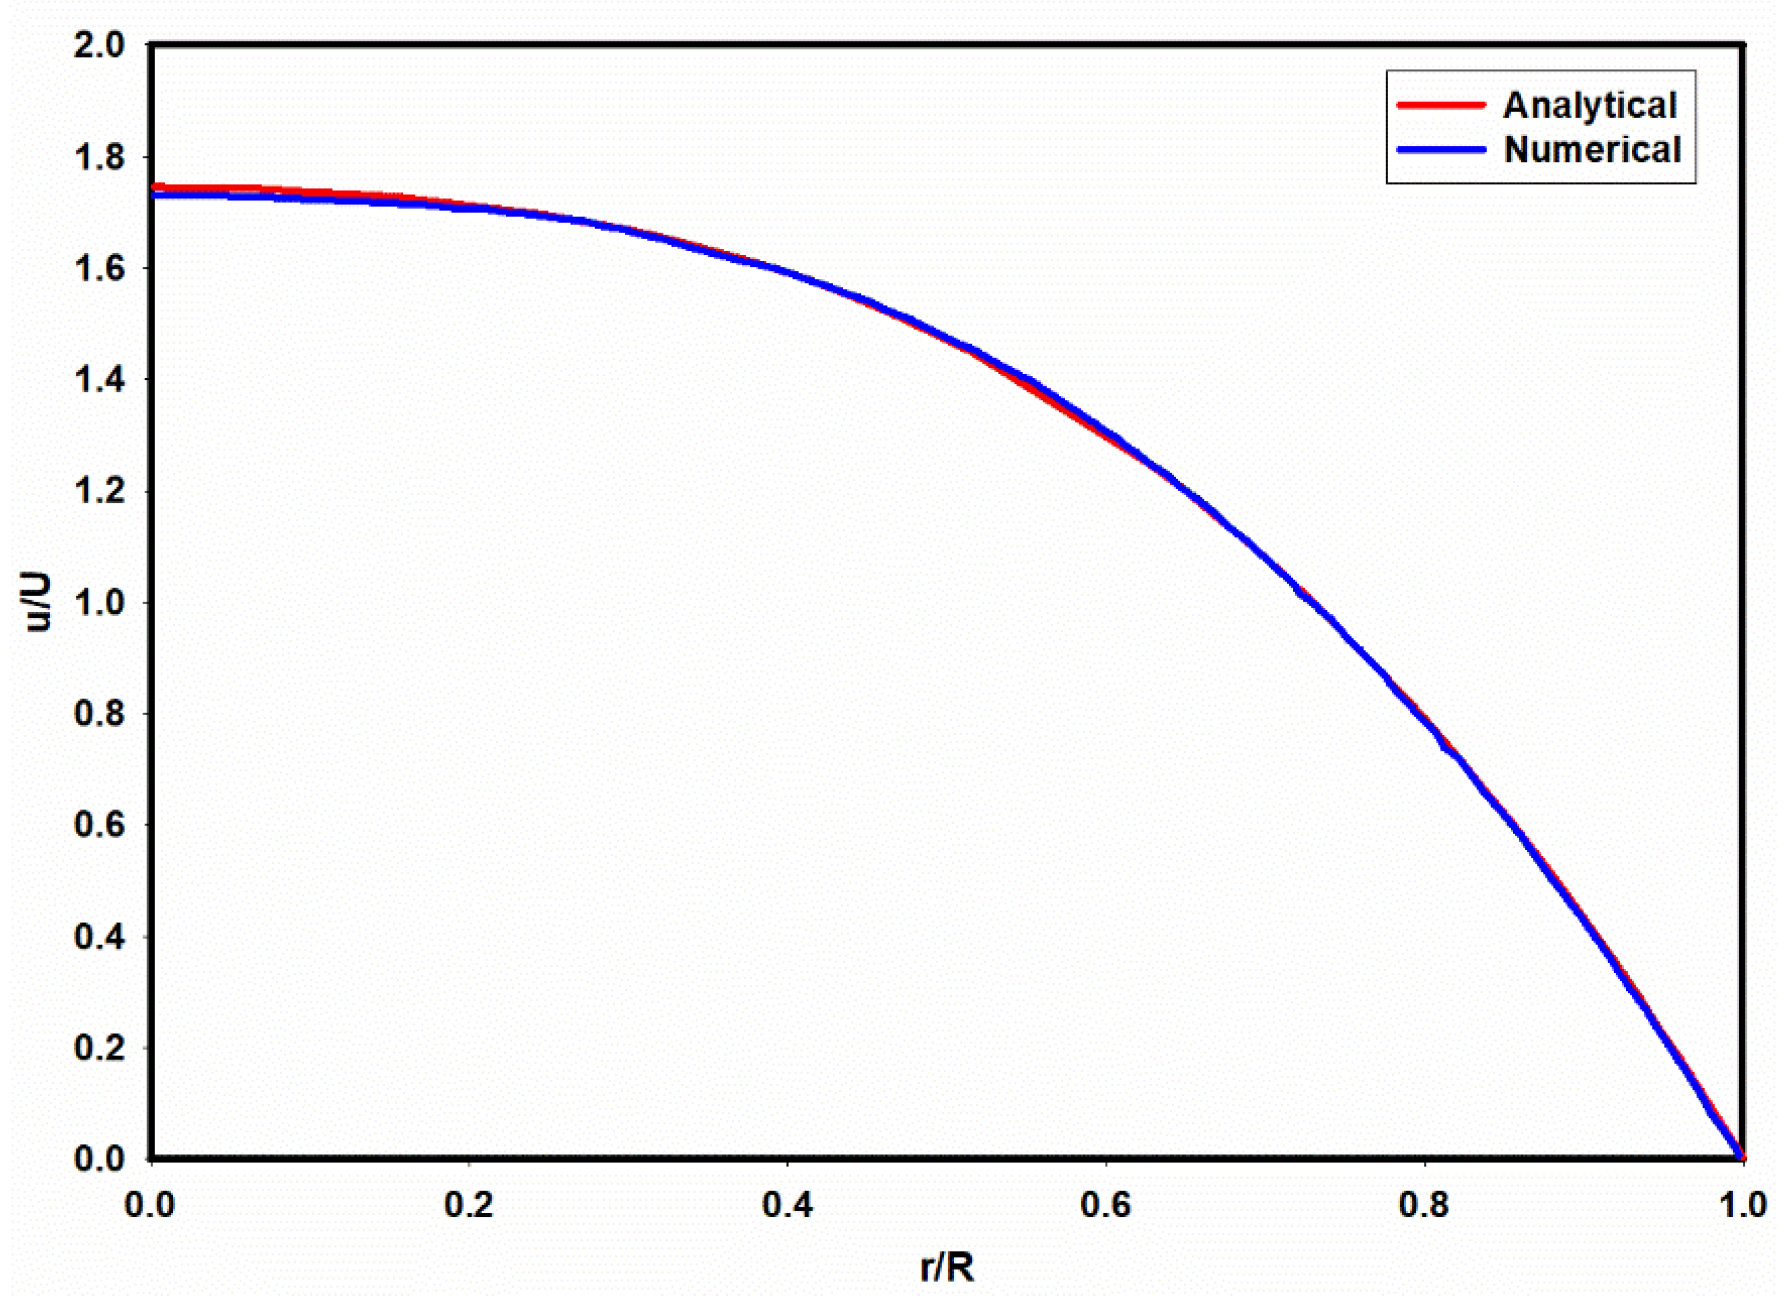
Figure 13.
Contours of cell volume fraction as predicted by (a) PTT, and (b) Carreau-Yasuda models.
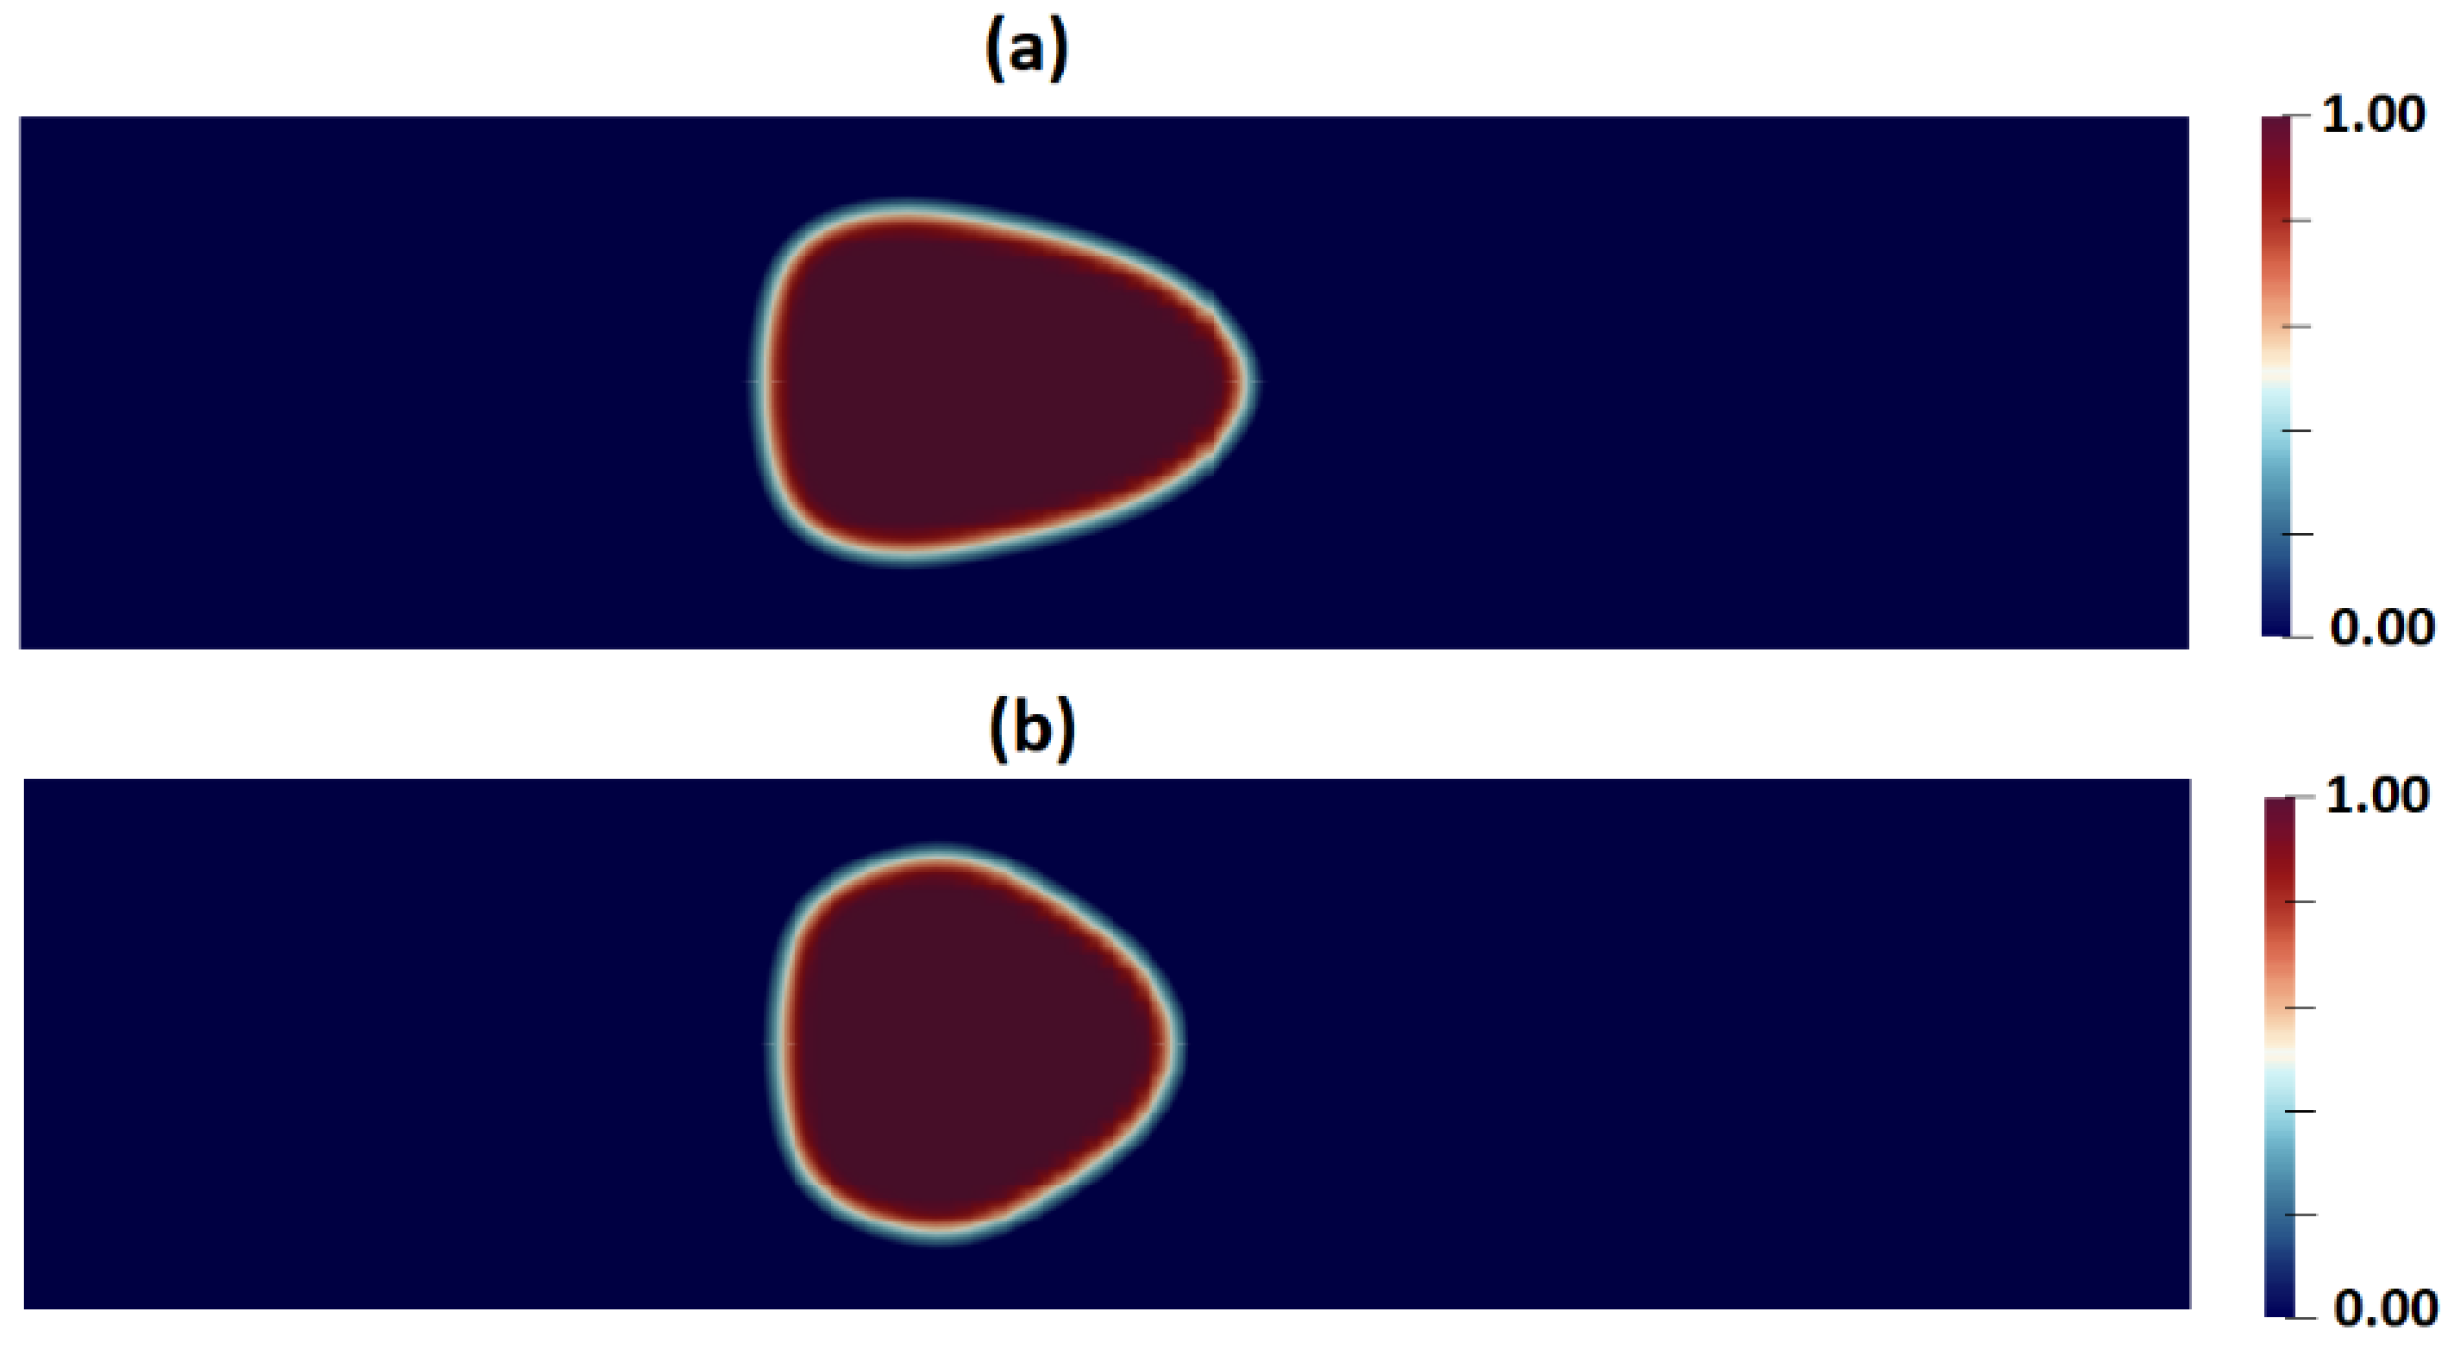
Figure 14.
A comparison of cell deformations as measured in the experiment and predicted by the PTT and Carreau-Yasuda models.
Figure 14.
A comparison of cell deformations as measured in the experiment and predicted by the PTT and Carreau-Yasuda models.
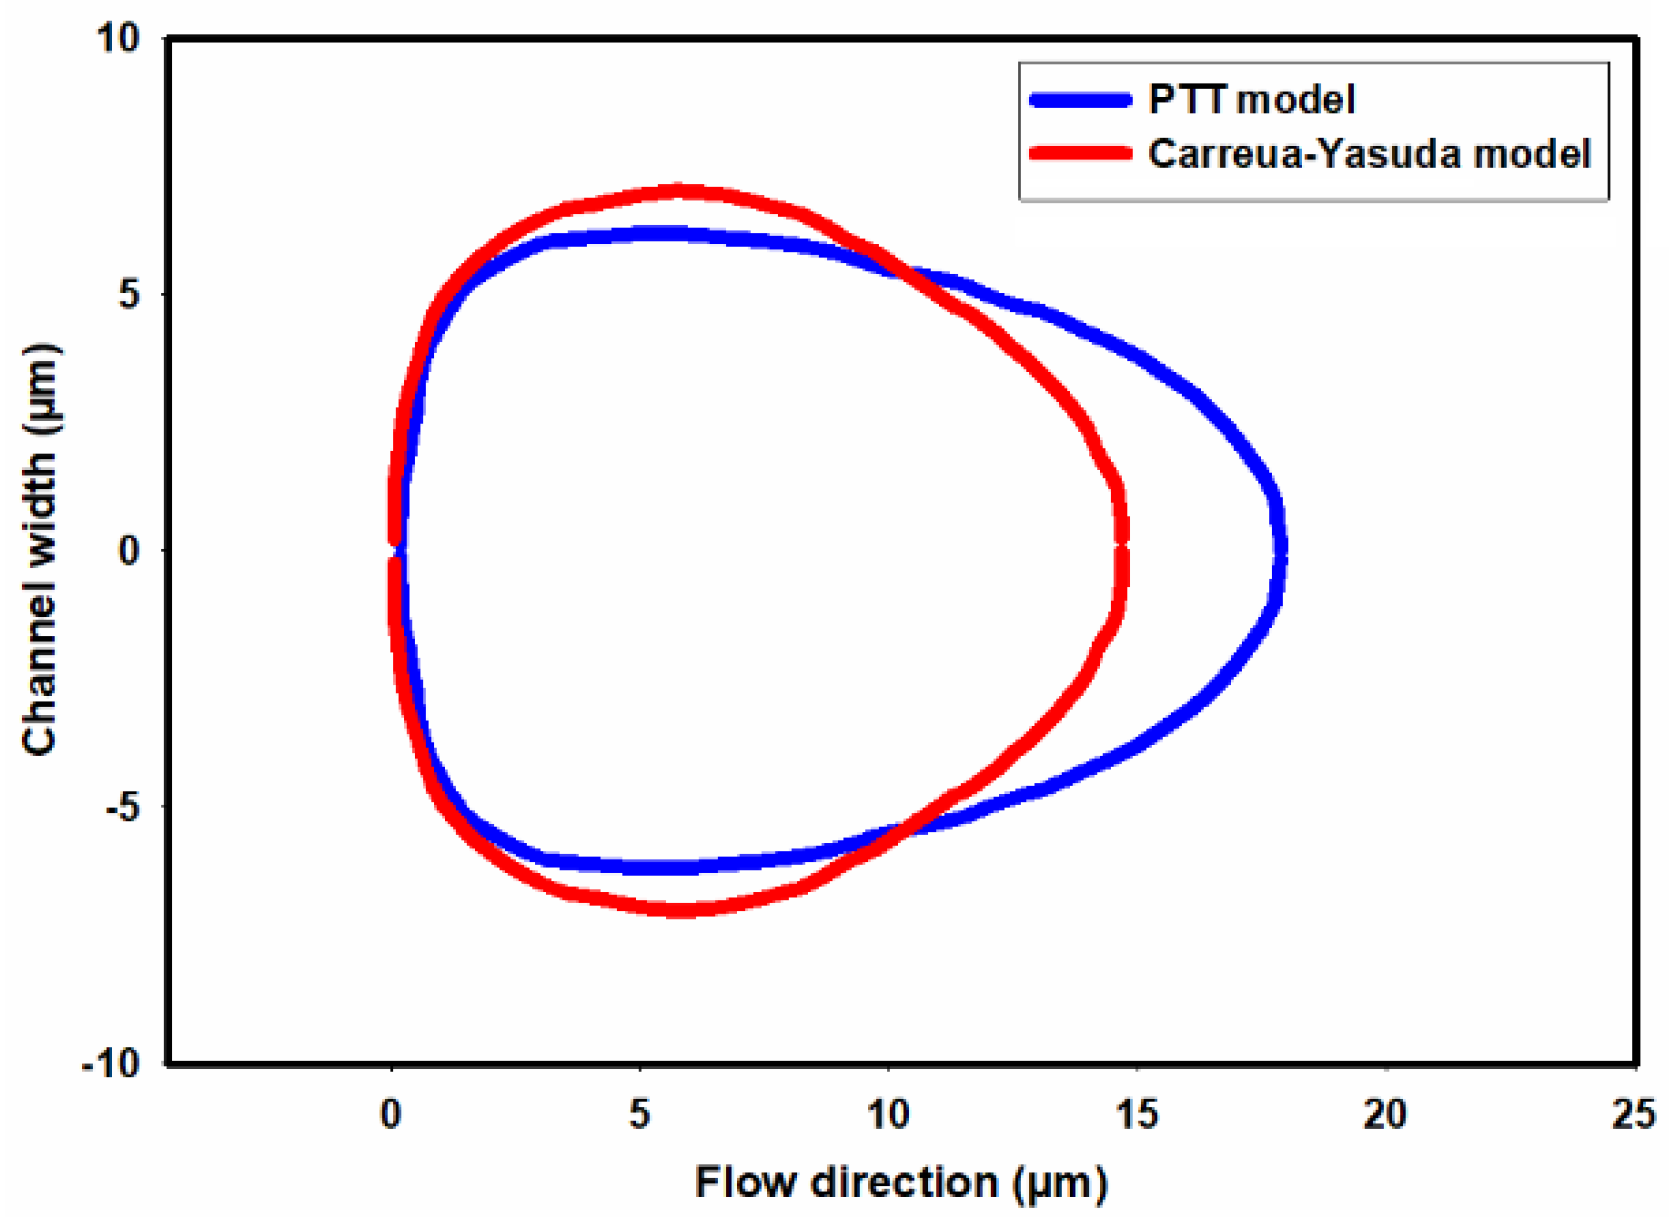
Figure 15.
Distribution of shear stress as predicted by the (a) PTT and (b) Carreau-Yasuda models.
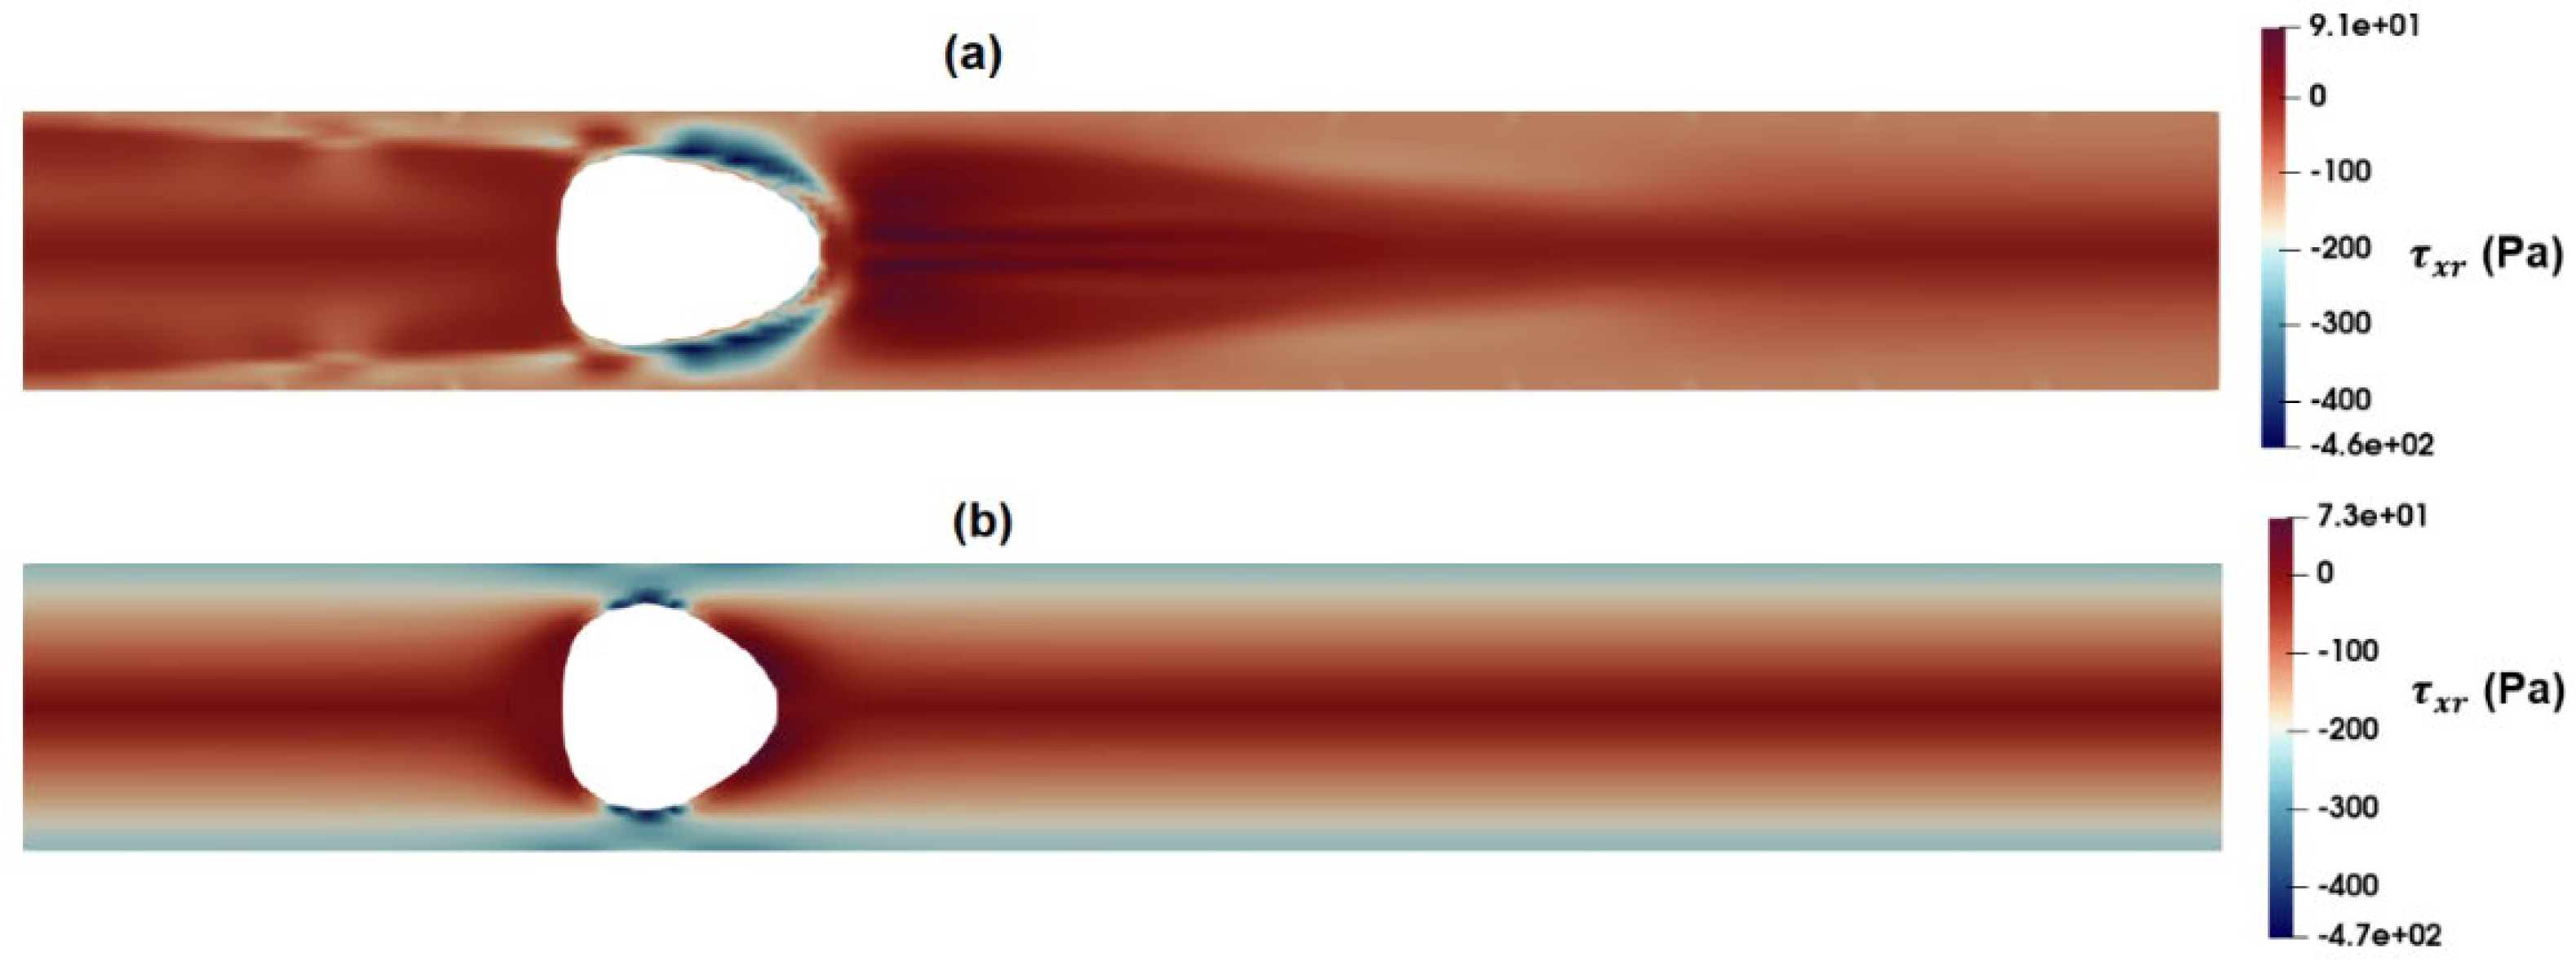
Figure 16.
Distribution of Normal stress components as predicted by PTT model (a) and (b) .
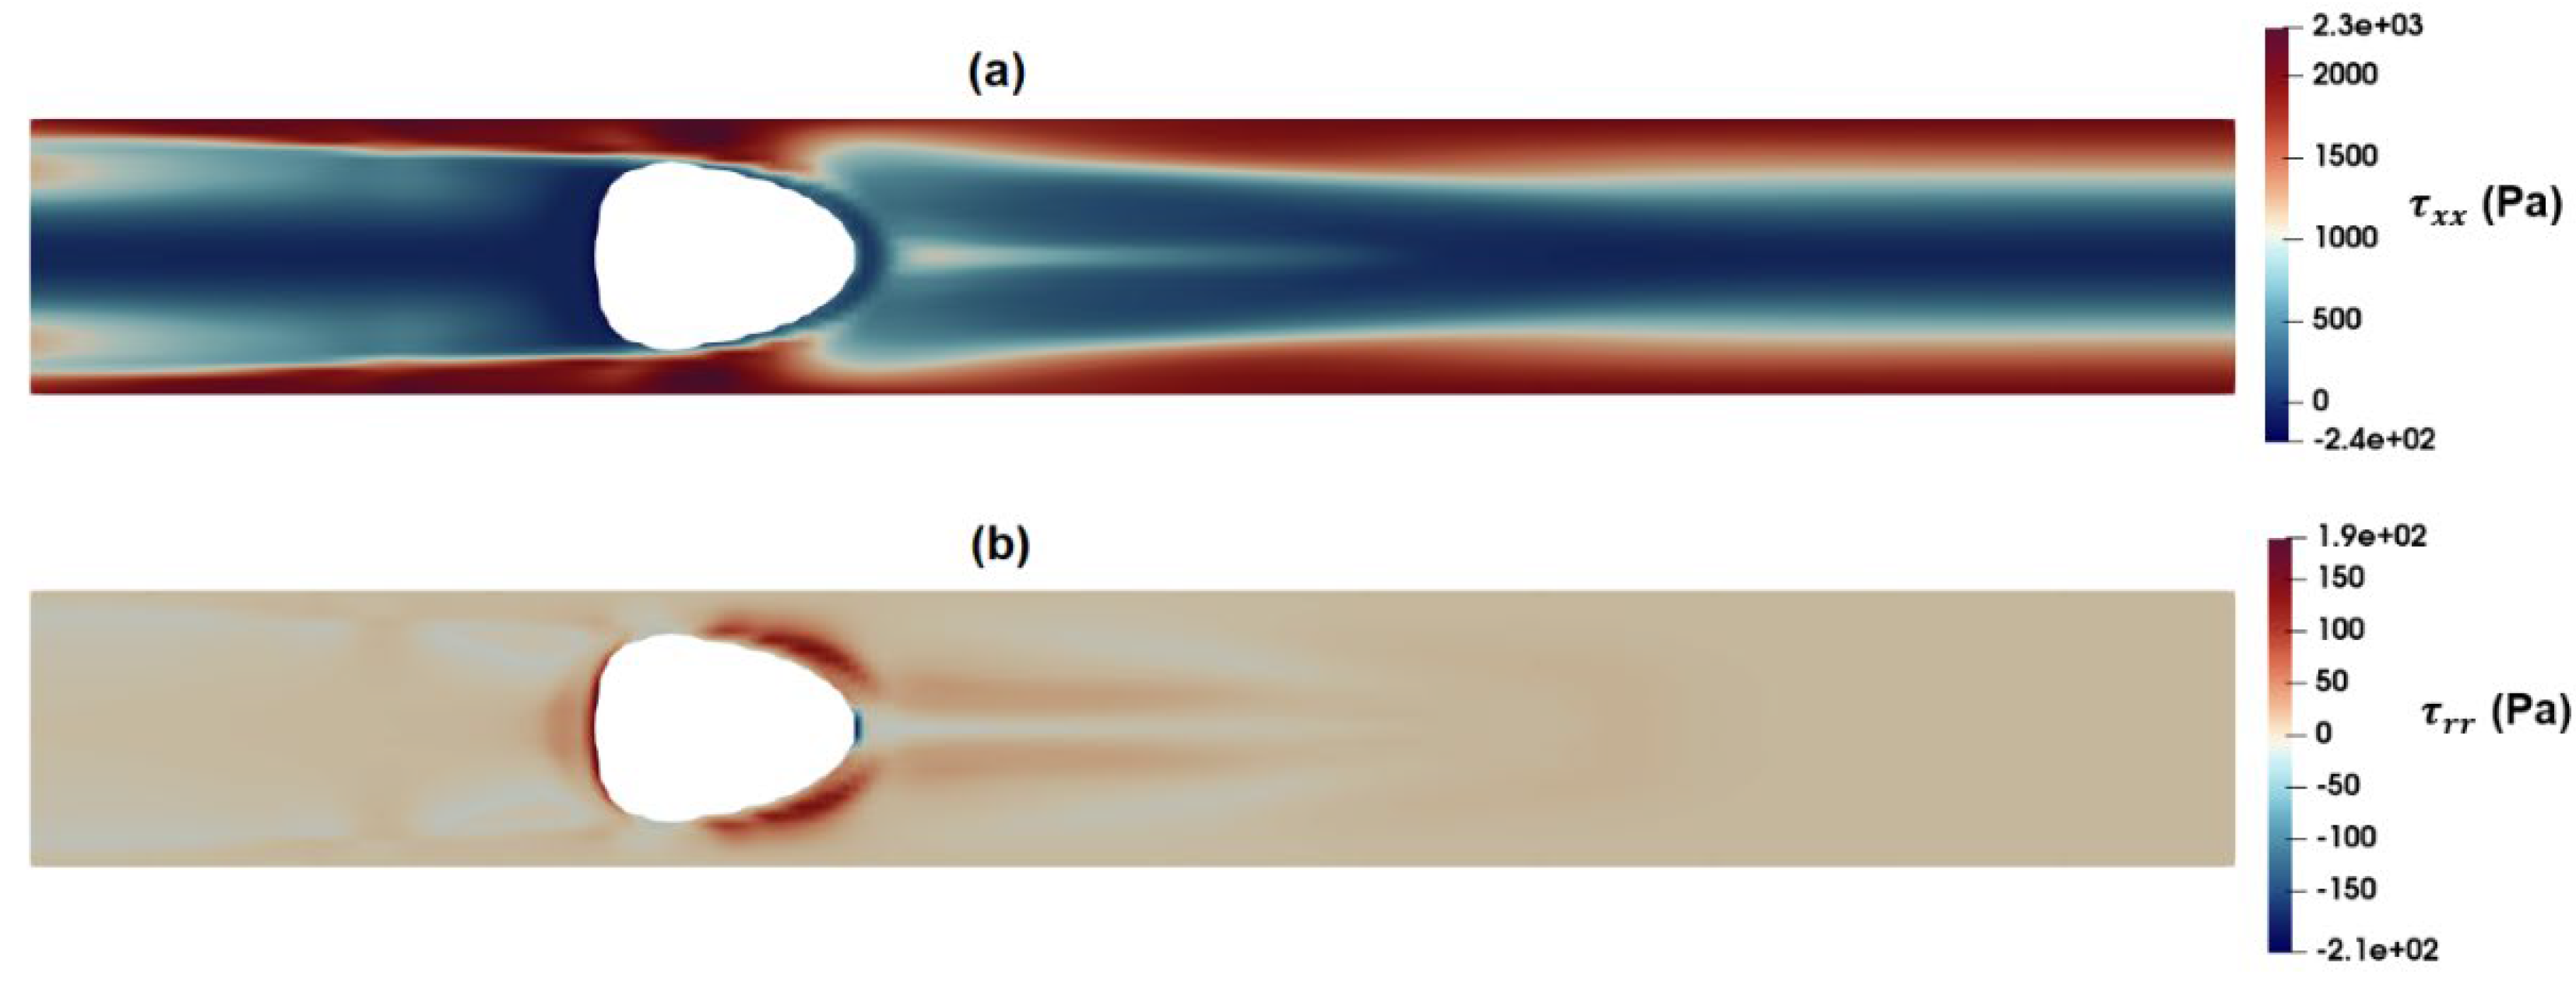
Figure 17.
Distribution of axial velocity as predicted by the (a) PTT and (b) Carreau-Yasuda models.
Figure 17.
Distribution of axial velocity as predicted by the (a) PTT and (b) Carreau-Yasuda models.
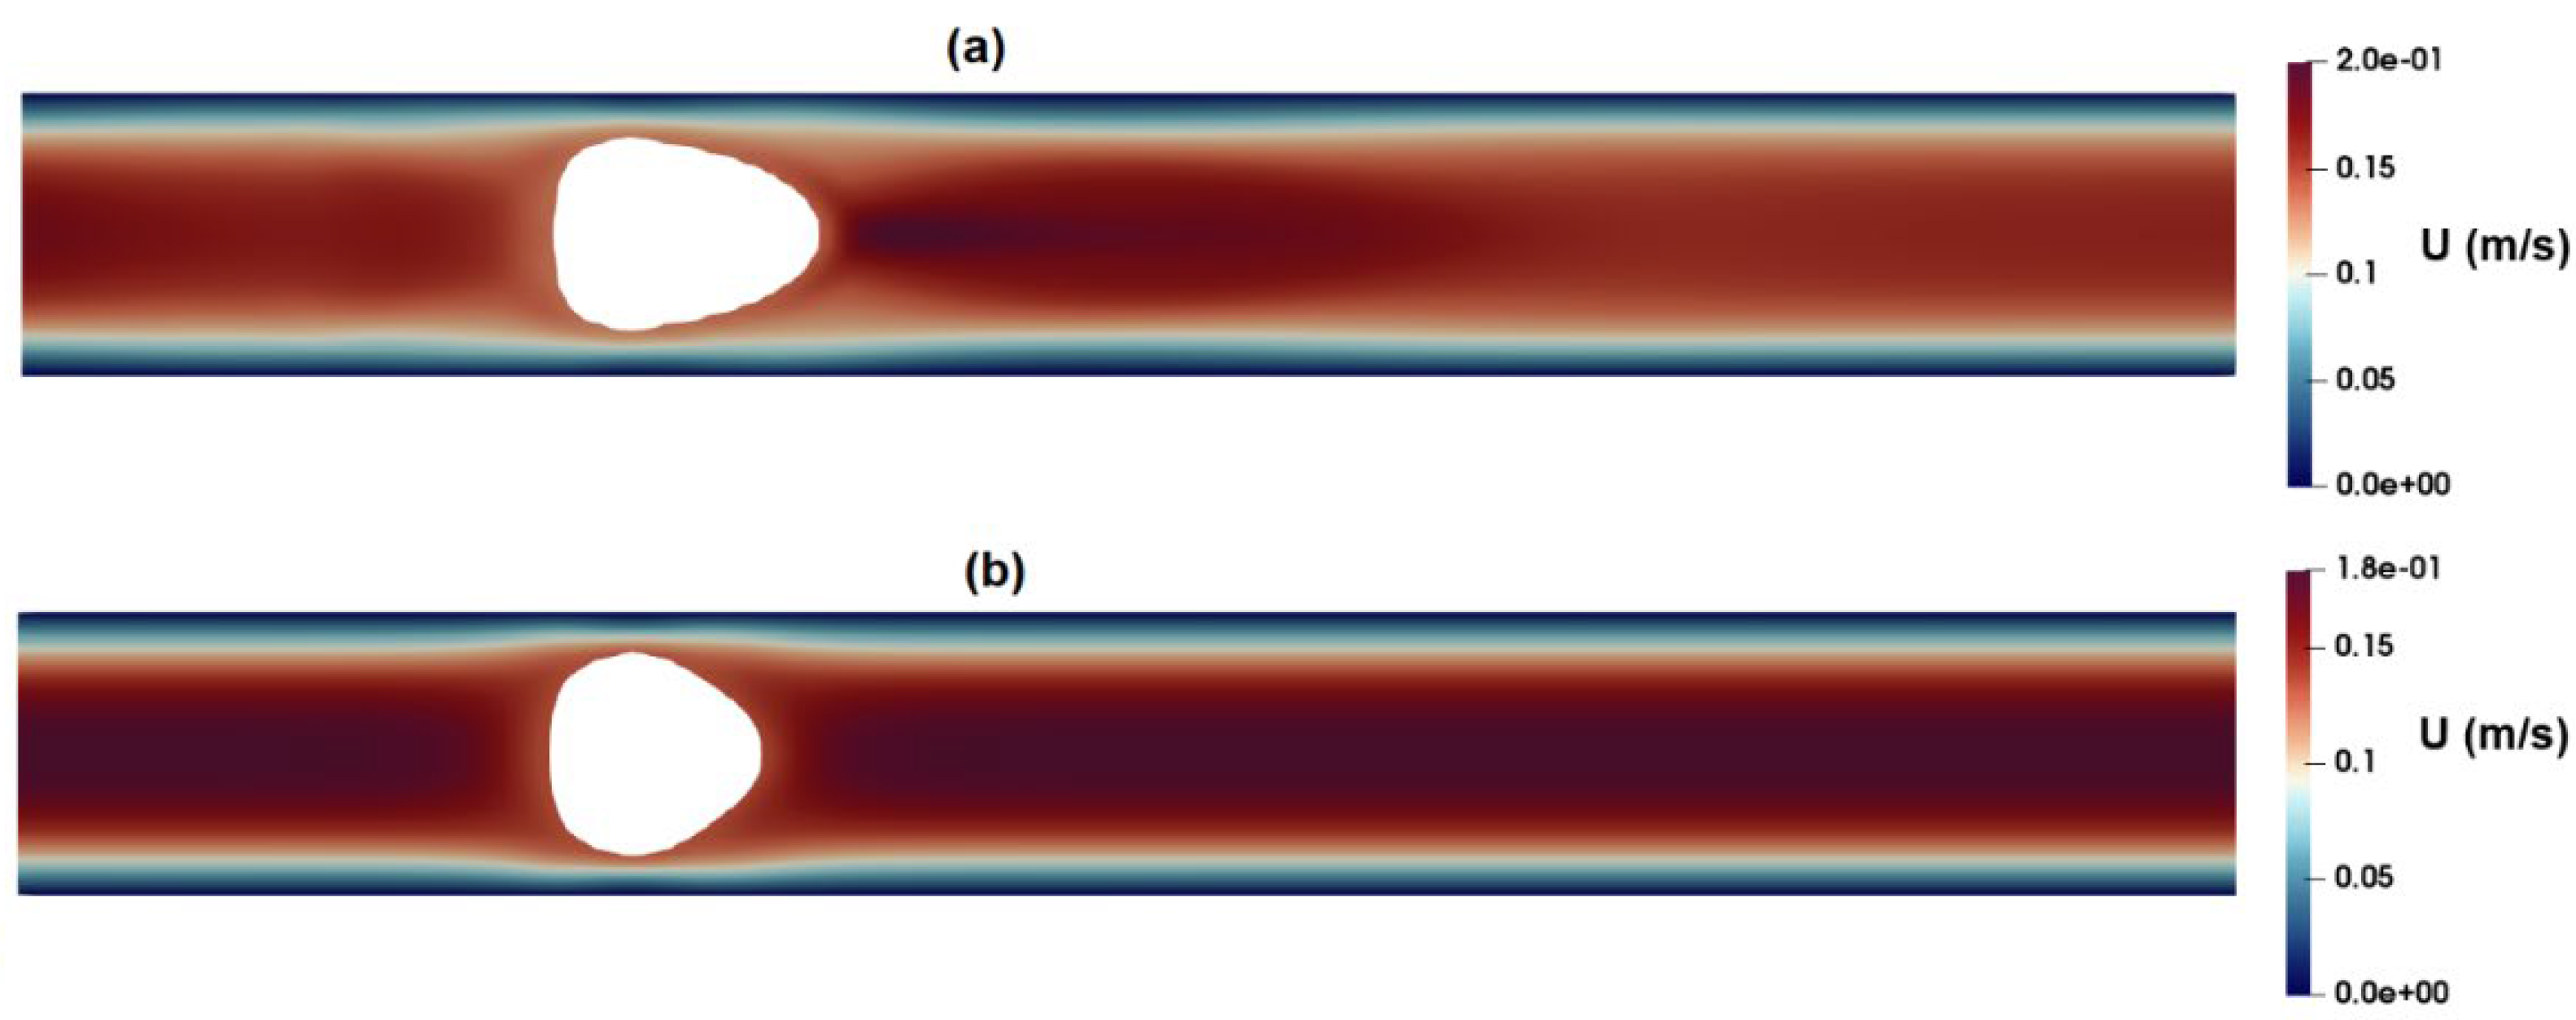
Figure 18.
Distribution of radial velocity as predicted by the (a) PTT and (b) Carreau-Yasuda models.
Figure 18.
Distribution of radial velocity as predicted by the (a) PTT and (b) Carreau-Yasuda models.
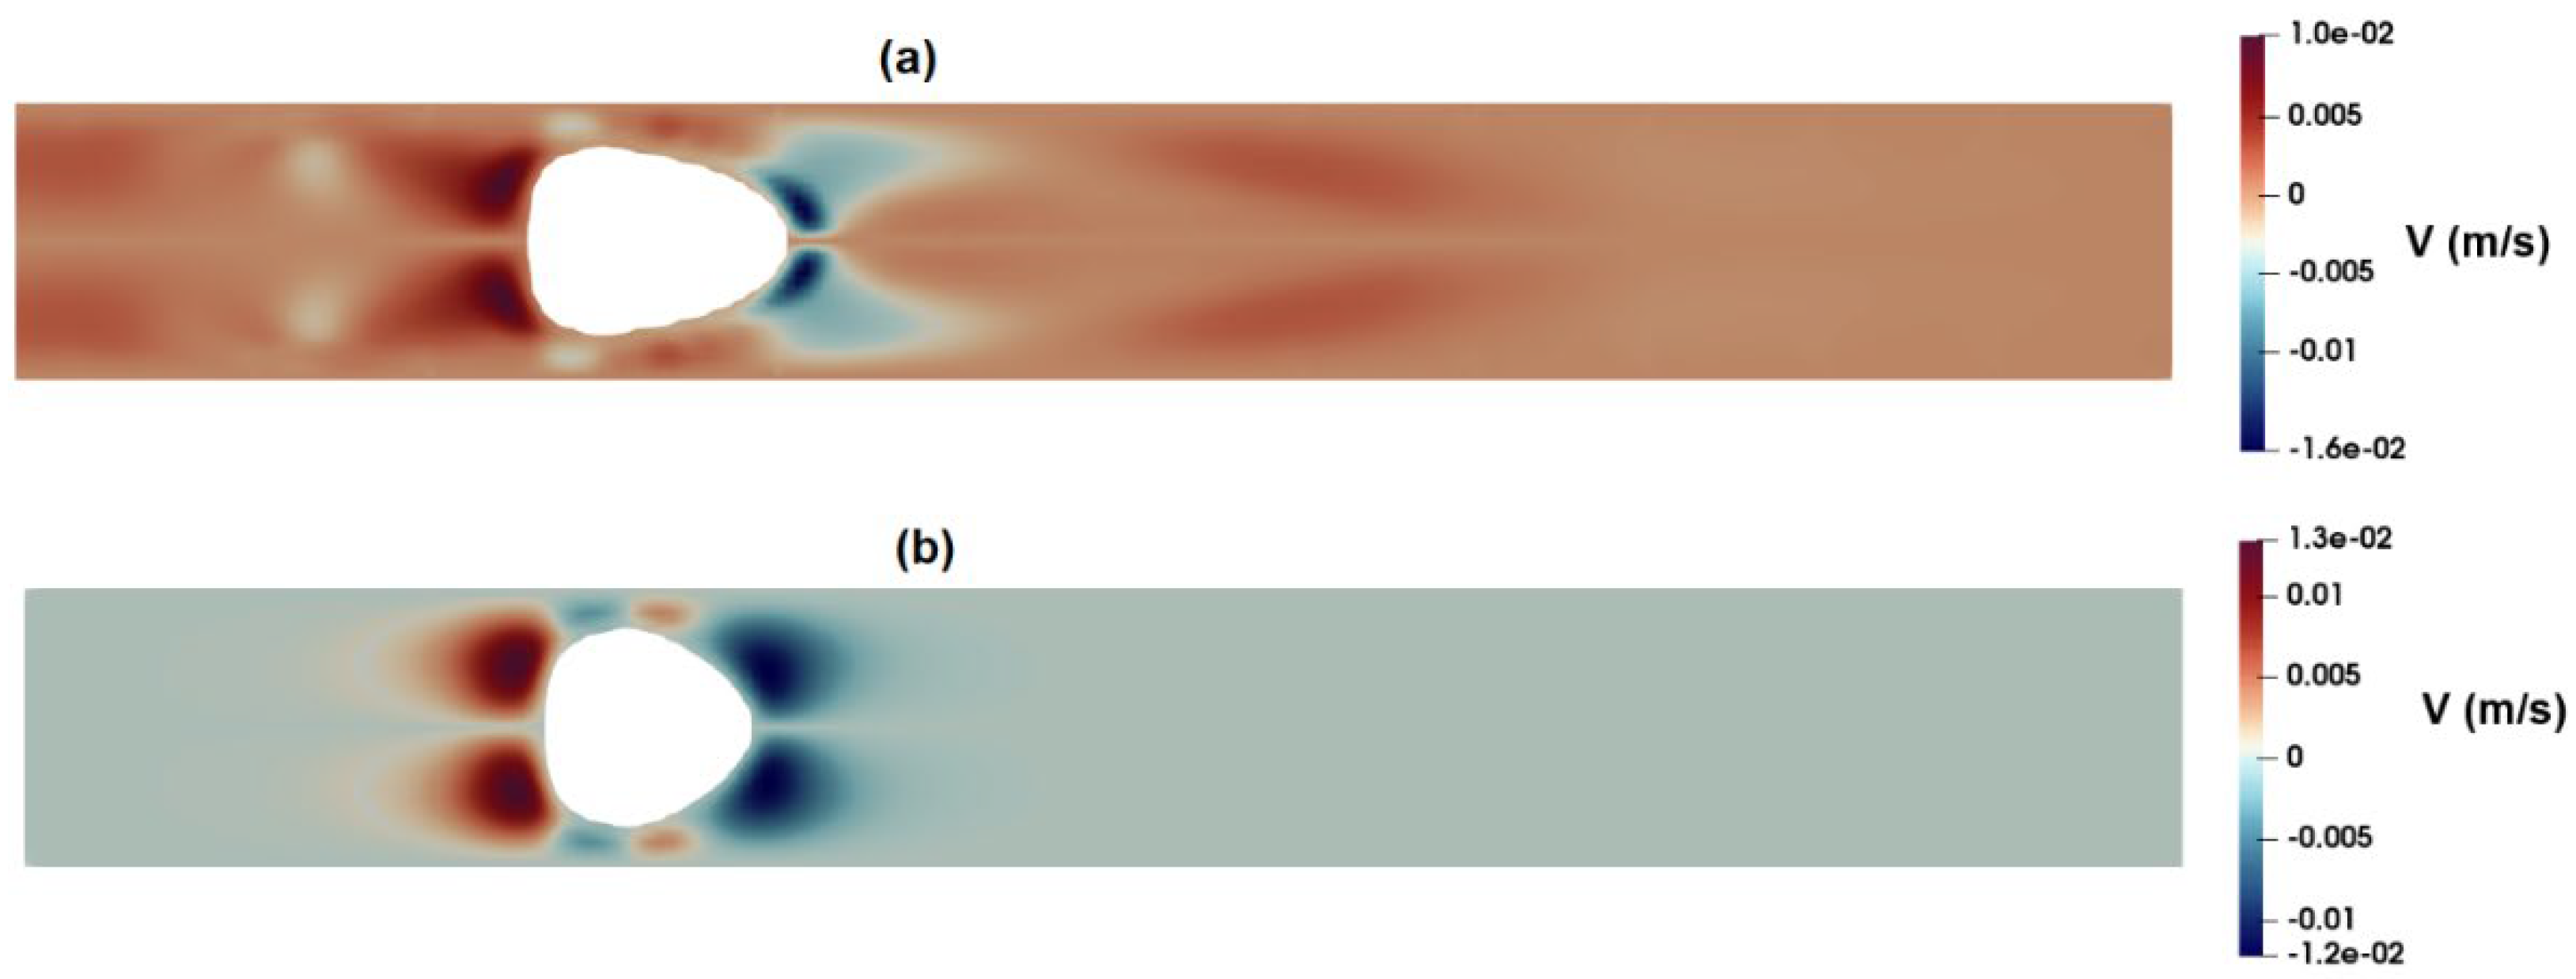

Table 1.
Carreau-Yasuda model constants.
| Fluid | v | |||||
| 0.5% MC-PBS | 20mPa.s | 1mPa.s | 0.0012 | 0.65 | 1.02 | |
Disclaimer/Publisher’s Note: The statements, opinions and data contained in all publications are solely those of the individual author(s) and contributor(s) and not of MDPI and/or the editor(s). MDPI and/or the editor(s) disclaim responsibility for any injury to people or property resulting from any ideas, methods, instructions or products referred to in the content. |
© 2024 by the authors. Licensee MDPI, Basel, Switzerland. This article is an open access article distributed under the terms and conditions of the Creative Commons Attribution (CC BY) license (http://creativecommons.org/licenses/by/4.0/).
Copyright: This open access article is published under a Creative Commons CC BY 4.0 license, which permit the free download, distribution, and reuse, provided that the author and preprint are cited in any reuse.


