
Submitted:
04 July 2025
Posted:
07 July 2025
You are already at the latest version
Abstract
This study investigates the capillary performance and wetting behavior of SLA (Stereolithography) 3D-printed porous structures, focusing on TPMS (Triply Periodic Minimal Surfaces)-Gyroid, Octet, Diamond, and Isotruss lattice designs. High-speed imaging was used to analyze droplet interactions, including penetration, spreading, and contact angles, with 16μl water droplets dropped from 30 mm at 0.77m/s. Results showed variable contact angles, with Isotruss and Octet having higher angles, while Diamond faced measurement challenges due to surface roughness. Numerical simulations of TPMS-Gyroid of 2 mm³ unit cells validated the experimental results and Diamond, Octet, and Isotruss structures were simulated. Capillary performance was assessed through deionized (DI) water weight-time (w-t) measurements, identifying the TPMS-Gyroid structure performed adequately. Structures with 4 mm³ unit cells had low capillary performance, excluding them from permeability testing, whereas smaller 2 mm³ structures demonstrated capillary effects but had printability and cleaning issues. Permeability results indicated that Octet performed best, followed by Isotruss, Diamond, and TPMS-Gyroid. Findings emphasize unit cell size, beam thickness, and droplet positioning as key factors in optimizing fluid dynamics for cooling, filtration, and fluid management.
Keywords:
Additive Manufacturing
; Triply Periodic Minimal Surfaces (TPMS)
; Contact Angle
; Permeability
; Capillary performance
1. Introduction
Heat pipes are essential in managing heat across a range of applications, such as in electronics like laptops, desktops, and LED (Light-emitting diode) lights, where they prevent overheating and maintain optimal performance. They also play a critical role in spacecraft thermal management, protecting sensitive electronics from temperature fluctuations. In HVAC (Heating, ventilation, and air conditioning) systems, power plant cooling, high-performance CPUs and GPUs, heat pipes are indispensable for ensuring efficient thermal control. The advancement of 3D printing has facilitated the precise creation of complex geometries used in aerospace, biomedical engineering, and energy systems. Specifically, 3D printing allows us to produce porous structures that aid in fluid handling processes such as liquid dispersion and capillary action [1]. This study investigates the fluid dynamics and permeability of 3D-printed porous structures to deepen our understanding of capillary-driven phenomena and optimize design across various industries. Heat pipe performance is significantly influenced by fluid properties like wettability, permeability, and porosity, with the contact angle playing a key role in heat transfer. The contact angle, which measures fluid wettability on surfaces, directly affects heat transfer efficiency. Lower contact angles indicate better wettability, enhancing heat transfer. In applications such as inkjet printing and membrane technology, the contact angle governs fluid spreading and penetration [2,3,4]. While research has focused on substrate pore size and liquid properties, no studies have fully explored the effects of absorption, drop size, and surface tension on contact angles in TPMS structures [5,6].
2. Design and Manufacturing
2.1. Designing of Porous Medium
Recent advancements in additive manufacturing (AM) have accelerated the development of TPMSs for heat exchange (HX) applications. While TPMS structures offer high surface area density, significantly enhancing heat exchange capabilities, further design modifications are necessary to make them suitable for heat pipe (HP) application [7]. Building on these findings, our current study focuses on TPMS structures, specifically the TPMS Gyroid, which aims to outperform traditional unit cells due to its unique geometric properties. Four models were designed using nTopology, as shown in Figure 1.
We refined our methods to re-evaluate Octet, Diamond, and Isotruss structures under updated conditions, improving the accuracy of permeability and capillary performance measurements. This reassessment deepens our understanding and advances TPMS Gyroid applications in additive manufacturing and thermal management. The surface area-to-volume (SA/V) ratio was examined as a key factor affecting heat and mass transfer efficiency, revealing differences based on geometry and unit cell size. Contact angle measurements were conducted on samples sized 80 mm height, 20 mm width, and 15 mm length, (Table 1, Figure 2a) to ensure consistent, reliable results.
In our initial experiments on capillary performance and permeability, we used larger porous media samples as outlined in Table 1. However, their complexity posed challenges for 3D printing. To address this, we reduced the sample width to one-third of its original size, making the printing process more manageable while maintaining structural integrity. Despite the size reduction, we kept the porosity around 50% and adjusted the beam thickness, as shown in Table 2, to preserve the desired structural properties. These modifications enabled more efficient production of test samples without compromising accuracy or relevance. The updated sample dimensions are shown in Figure 3a, illustrating the changes made to accommodate the new size. This approach allowed for a more practical production process while ensuring that the test samples remained effective and true to the original design.
2.2. Manufacturing of Porous Medium
The lattice structures were manufactured using the Phrozen Mega 8K S 3D printer, which utilizes high-resolution LCD (Liquid-Crystal Display) technology for precise details essential for complex geometries. Operating on the SLA principle, it employs photopolymerization, solidifying resin layer by layer with UV (Ultraviolet) radiation to create highly detailed items.
3. Experimental Setup
3.1. Contact Angle Measurement
This experiment uses a custom setup for precise contact angle measurements, shown in Figure 5. It integrates two synchronized high-speed cameras with microscopic lenses to capture dynamic wettability data. Controlling droplet mass was a challenge, addressed with a KDS high-pressure water pump for accurate deposition. Tests ensured repeatability of droplet mass. “Image J” software processed high-speed videos frame-by-frame to measure contact angles, employing advanced image processing to detect droplet edges and calculate angles accurately under varying conditions.
3.2. Capillary Performance Test
This experiment employed a specialized setup, as shown in Figure 6, featuring a precision weighing machine for accurate sample mass estimation. Its software interface allows for quick parameter entry and precise data collection. A Z-axis controller stage ensured stable vertical movement and sample positioning, maintaining consistent results. A custom holder secured samples during measurements, minimizing disturbance and enabling efficient loading and unloading. The combination of precise measurement tools, controlled movement, and custom holders enhanced the accuracy and reliability of the experiment.
3.3. Constant-Head Permeability Test
The constant head permeability experiment used the constant head method to measure permeability in porous structures, as shown in Figure 7. This technique maintains a steady hydraulic head, ideal for high-permeability materials like sands. Water flows from a higher to a lower elevation, with the height difference constant. The flow rate through the structure was recorded, and permeability was calculated using Darcy's Law, factoring in flow rate, cross-sectional area, fluid viscosity, and hydraulic gradient. As seen in Figure 7, the setup includes a porous structure, water inlet, bottom outlet, and an overflow mechanism to stabilize water levels.
The permeability of a porous medium is typically calculated using models that correlate the micro structural characteristics of the medium such as pore size, shape, and distribution, to its permeability. A widely used method for this calculation is Darcy’s Law. Darcy’s law (1) describes the flow of fluid through a porous medium.
Rearranging Darcy’s law to solve permeability, k
Determine the volume of water (V) collected:
For water at room temperature, ρ ≈ 1000 kg/m3
Substituting values to find Volumetric flow rate, Q:
Calculate k from the above Darcy’s Law, which gives the permeability of the porous medium.
4. Numerical Setup of Contact Angle
Four models were created namely TPMS Gyroid, Diamond, Octet, and Isotruss with the unit cell size of 2×2×2 mm3 with the dimensions of 10×10×3 mm3. using commercial implicit CAD modeling software nTopology as shown in Figure 8a.

Table 3.
The following equations were used by the modeler for creating TPMS structures used in this study:.
Table 3.
The following equations were used by the modeler for creating TPMS structures used in this study:.
| TPMS Architecture | Equation f (x, y, z) = 0 |
| Fischer-Koch S (FKS) | cos(2x)⋅sin(y)⋅cos(z)+cos(2y)⋅sin(z)⋅cos(x)+cos(2z)⋅sin(x)⋅cos(y) |
| Gyroid (G) | cos(x)⋅sin(y)+cos(y)⋅sin(z)+cos(z)⋅sin(x) |
| Schwarz primitive (SP) | cos(x)+cos(y)+cos(z) |
The static contact angle needs to be determined before proceeding with the simulation of different structures. Therefore, a 3D-printed flat plate was fabricated using the same resin as the test samples used in the experiments and a water droplet was placed on its surface. The measured static contact angle was 53.72°. The figure below shows the experimental results.
To validate the simulation’s accuracy, in this experiment, distilled water droplets of 16 microliters were deposited on the porous TPMS-Gyroid structure from a height of 30 mm. The machine employed for this task is equipped with a high-resolution camera and precision syringe control. These features are essential for capturing the evolution of the droplet that are in contact with the surface and ensuring accurate volume repeatability. The dynamic contact angle was measured with the help of the elliptical fit method from the goniometer (Figure 8b) and the experimental setup is shown in Figure 5.
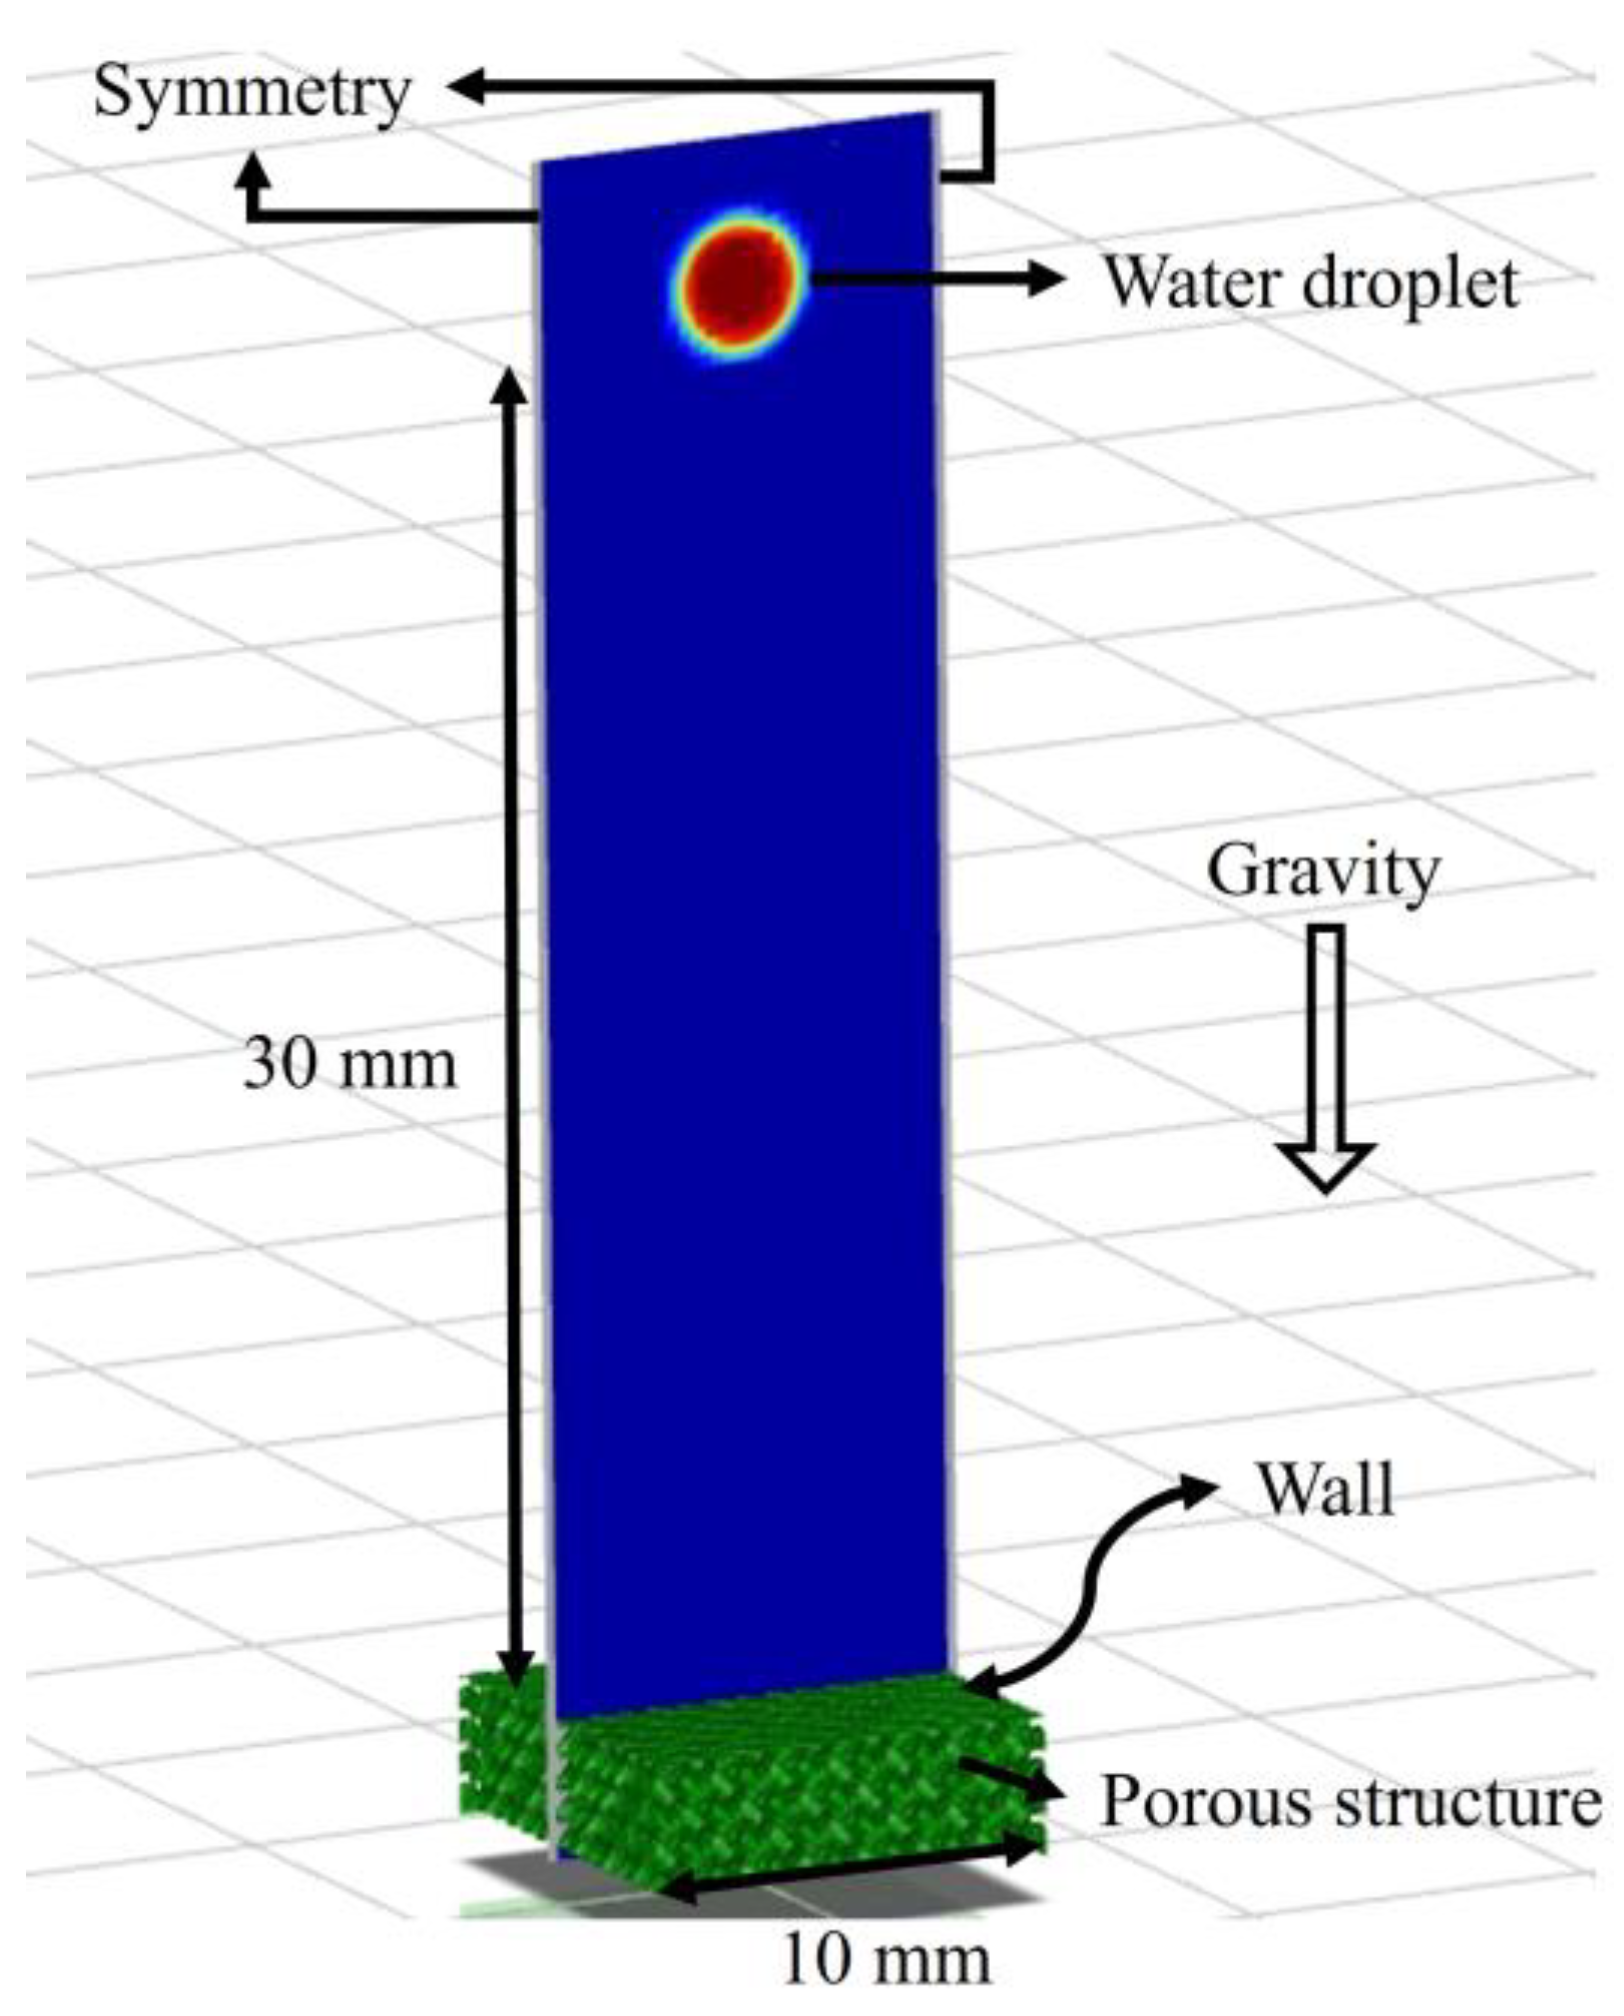
Figure 9.
Fluid domain with applied boundary conditions in the numerical model.
The boundary conditions and the geometry for validation are given. The following assumptions are used to simulate the drop dynamics:
| • Flow type | : | Transient, Laminar |
| • Gravity | : | 9.81 m/s2 |
| • Height at which the water was dropped | : | 30 mm |
| • Multiphase Model | : | VOF |
| • Volume | : | 16 μL |
| • Droplet diameter | : | 1.529 mm |
| • Droplet fluid material | : | Water |
The VOF (Volume of Fluid) with transient, multiphase model was used. The tracking interface between different phases is achieved by solving the continuity equation for the volume fraction of phases. For the qth phase, this equation has the following form:
In which, mqp mass transfer from phase 1 to phase 2, mpq is vice versa and the source term is by default zero. However, as there is no phase change occurred in this study, mqp and mpq are equal to zero.
Volume fraction equation is solved by Explicit time discretization:
Where,
| • | = | index for current time step | |
| • | = | index for previous time step | |
| • | = | volume of cell | |
| • | = | volume flux through face, based on velocity | |
| • | = | face value of the qth volume fraction, computed from the first or second order upwind scheme |
A geometric reconstruction scheme was used for the interface capture of the two phases of fluids. A single momentum equation is solved throughout the domain, resulting velocity term is shared among the phases. The momentum term shown below is dependent on the volume fractions of all the phases:
The surface tension between air and water was 0.072 N/m, using the continuum surface force model to maintain consistent contact angles.
After simulating TPMS-Gyroid structure, the structure then replaced with Diamond, Isotruss, and Octet structures (Figure 8a) while maintaining the same boundary conditions and fluid domain. Droplet dynamics were captured, and contact angles measured with a goniometer. The fluid domain was finely meshed, with a max cell size of 0.2 mm, refined near the surface (Figure 10).
5. Results and Discussion
5.1. Contact Angle Measurment Test
5.1.1. Experimental Results
The dynamic contact angle test tracks liquid droplet behavior on porous surfaces over time, revealing insights into wetting, penetration, and contact angle. Larger pores (4 mm³) allow quicker fluid penetration and smaller contact angles, while smaller pores (2 mm³) result in slower penetration and larger angles, with the 3 mm³ unit showing intermediate values. Experimental results for 2 mm³ show TPMS-Gyroid required less time than other structures, with Isotruss taking the longest. For 3 mm³, TPMS-Gyroid performed best, while Isotruss took more time than TPMS-Gyroid and Diamond. For 4 mm³, Isotruss performed best, followed by TPMS-Gyroid, with Octet taking the longest time. Results for the 2 mm³ Octet structure were not obtained due to challenges during printing, cleaning, and insufficient fluid flow. For the 3 and 4 mm³ Diamond structures, the droplet penetrated too rapidly to accurately capture the contact angle.
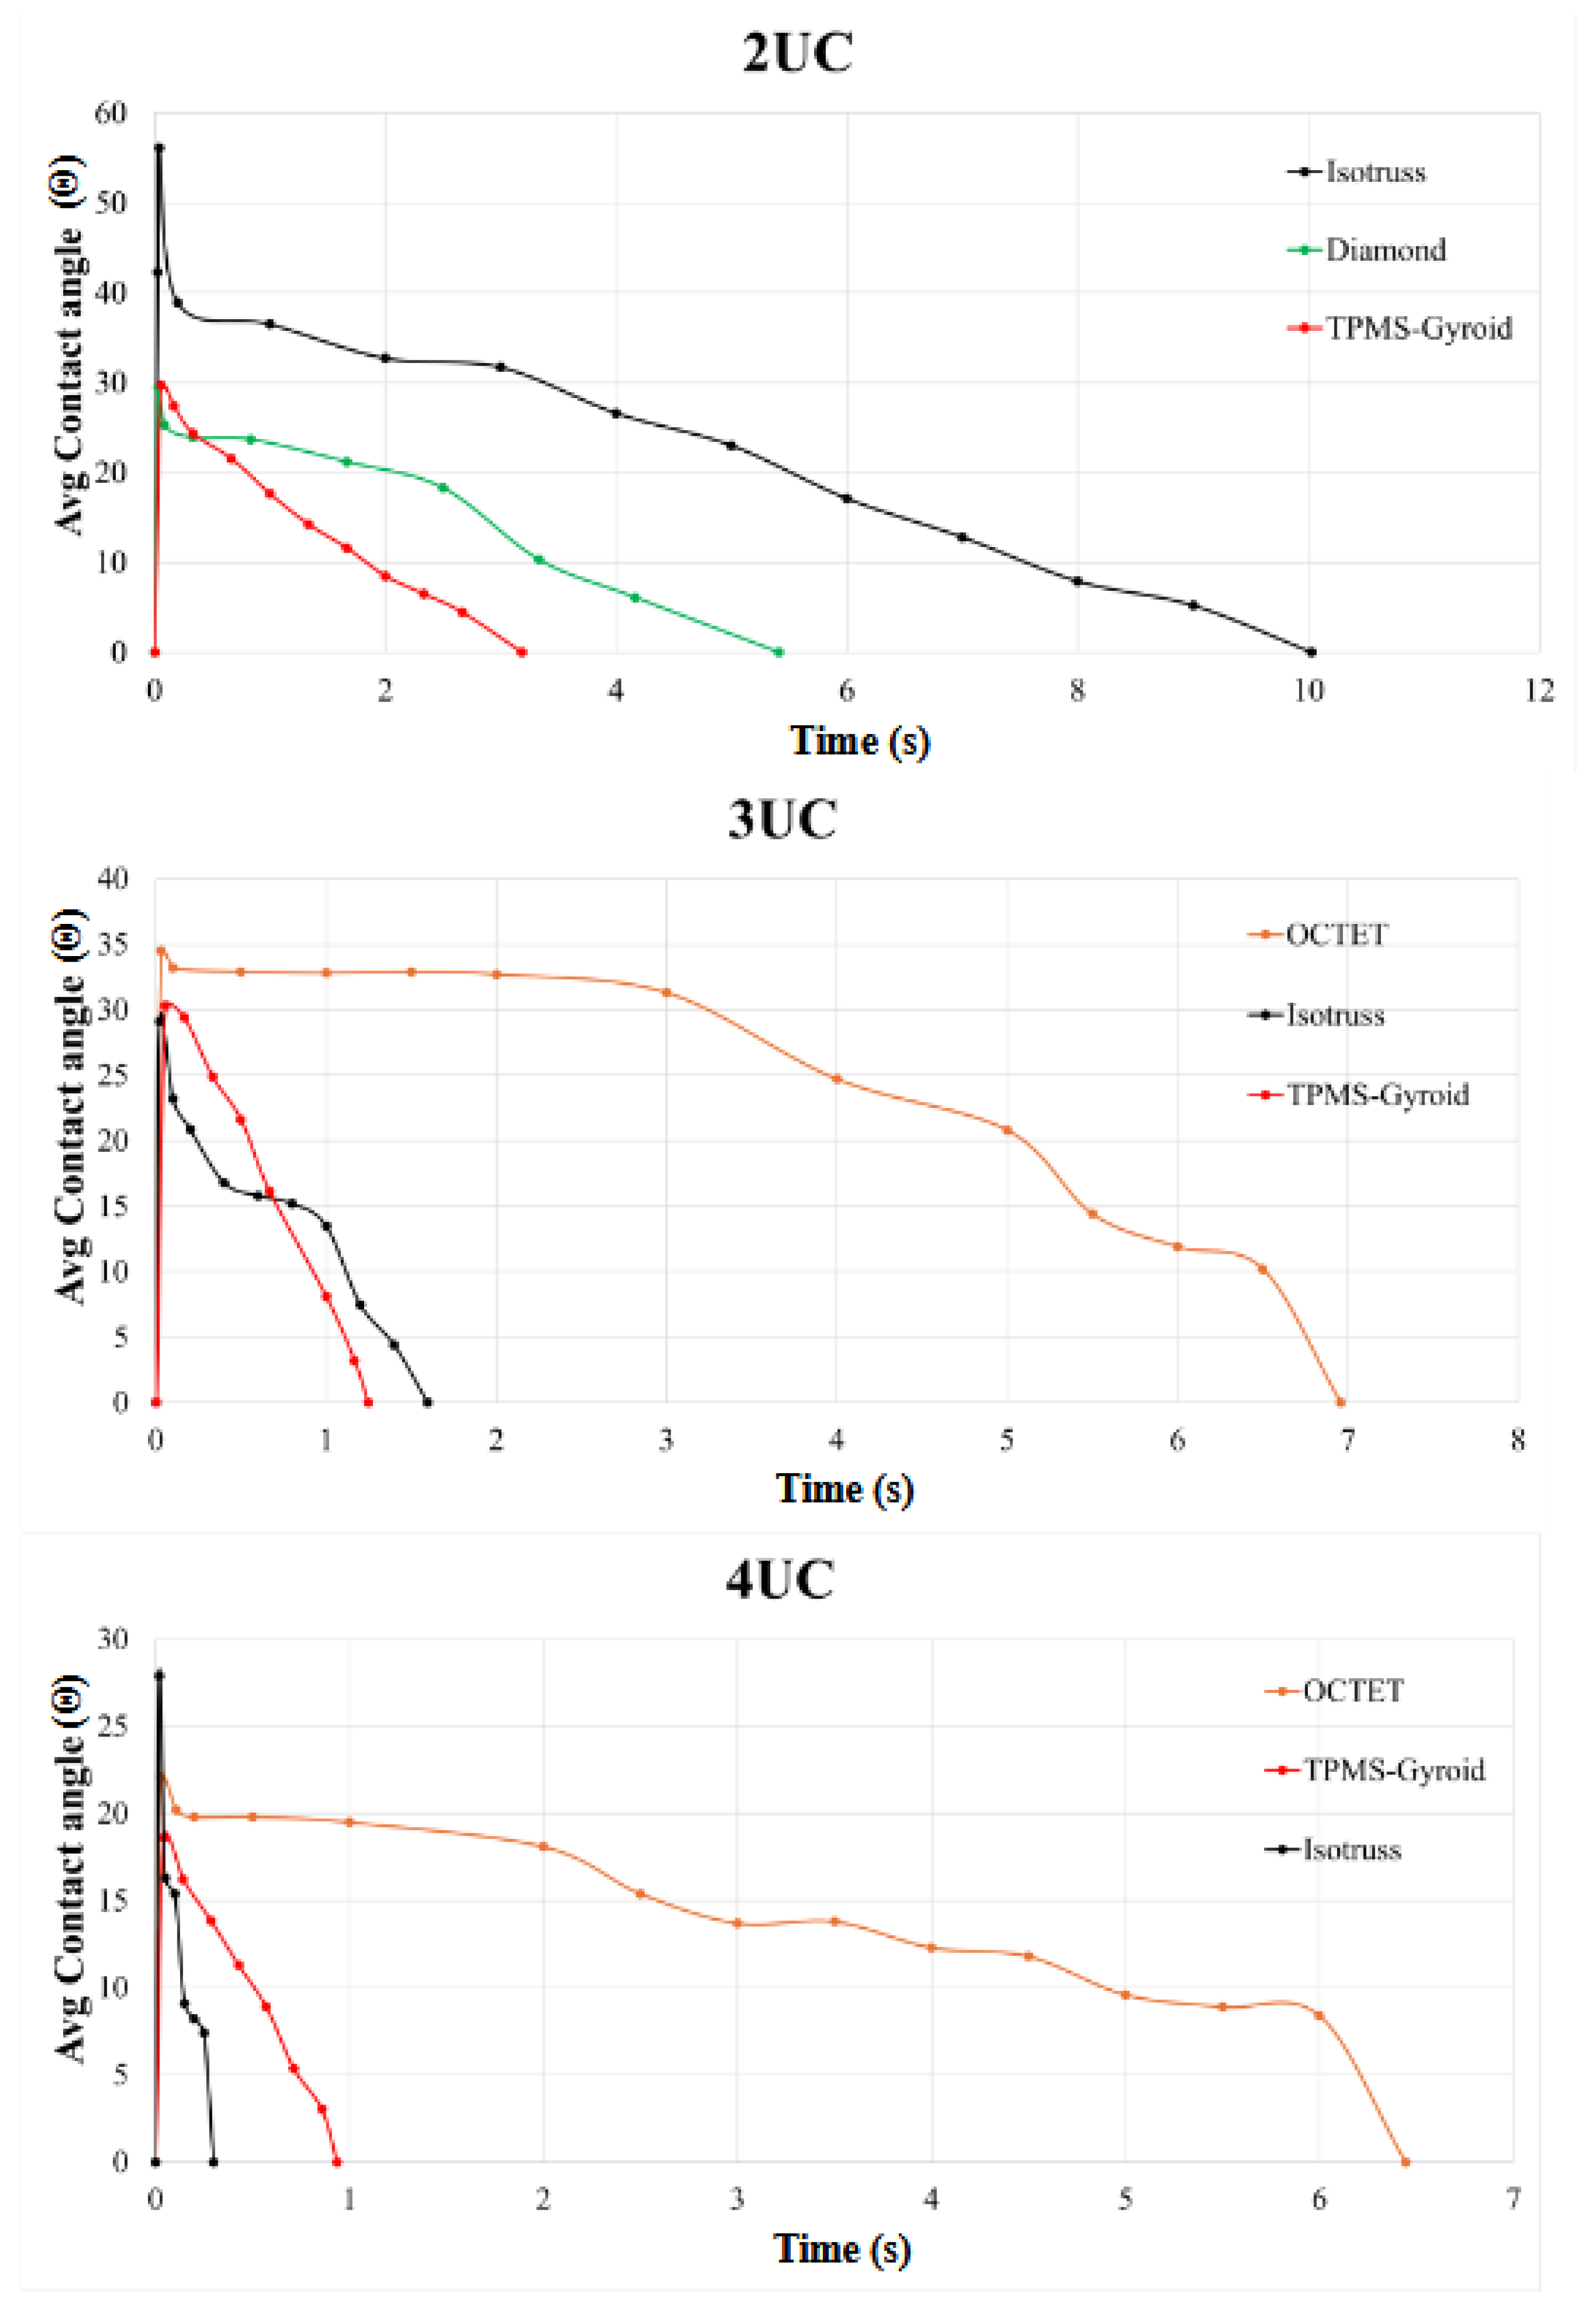
Figure 11.
Contact angle measurement test results of 2,3 and 4 mm³ unit cell structures.
5.1.2. Numerical Study Results
The right, left, and average dynamic contact angles from both experimental and simulated data are plotted in Figure 12a and Figure 13. Identical boundary conditions were applied, including a droplet volume of 16 μL, a drop height of 30 mm, and a Gyroid unit cell size of 2×2×2 mm3.
The dynamic contact angles for both sides show minimal variation, confirming consistency across measurement methods. The average contact angle plot, with trendline and regression equation, indicates independence from the method. R² values validate the numerical model. Experimental and numerical analyses recorded water droplet dispersion at various time intervals as shown in Figure 12b, showing less than 6% error in comparison. The small discrepancy is due to printing thickness and roughness differences.
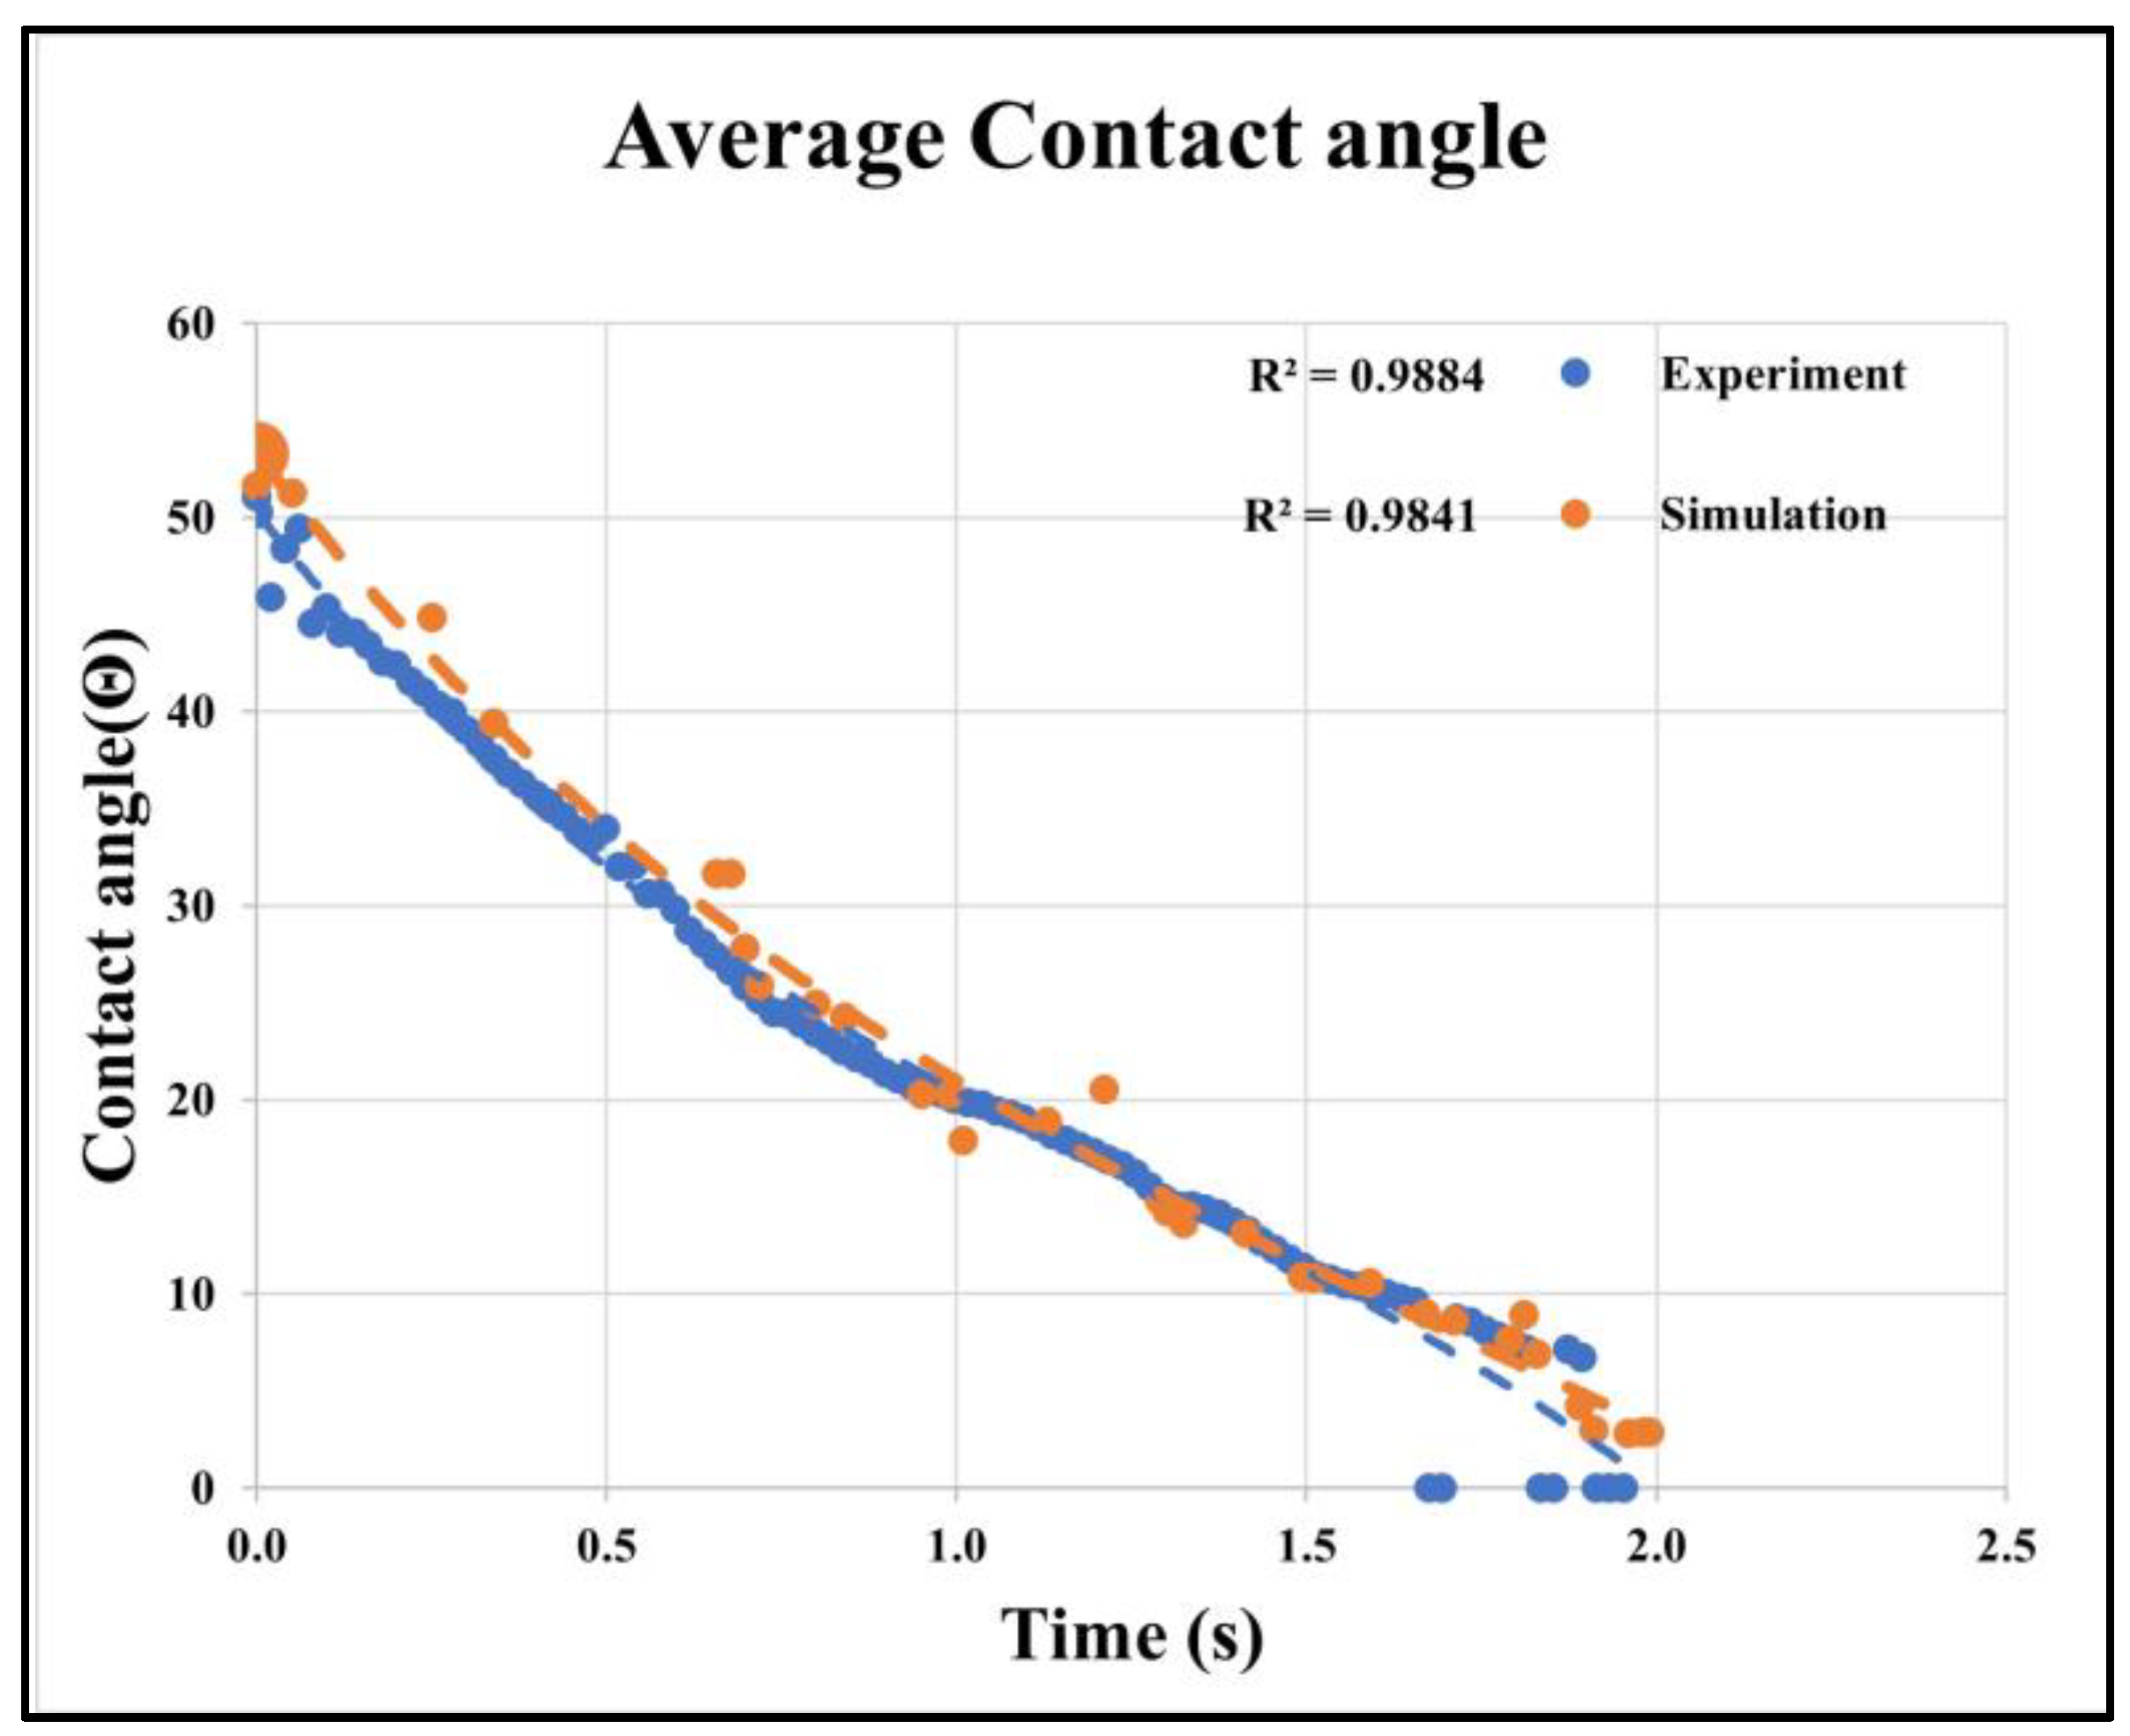
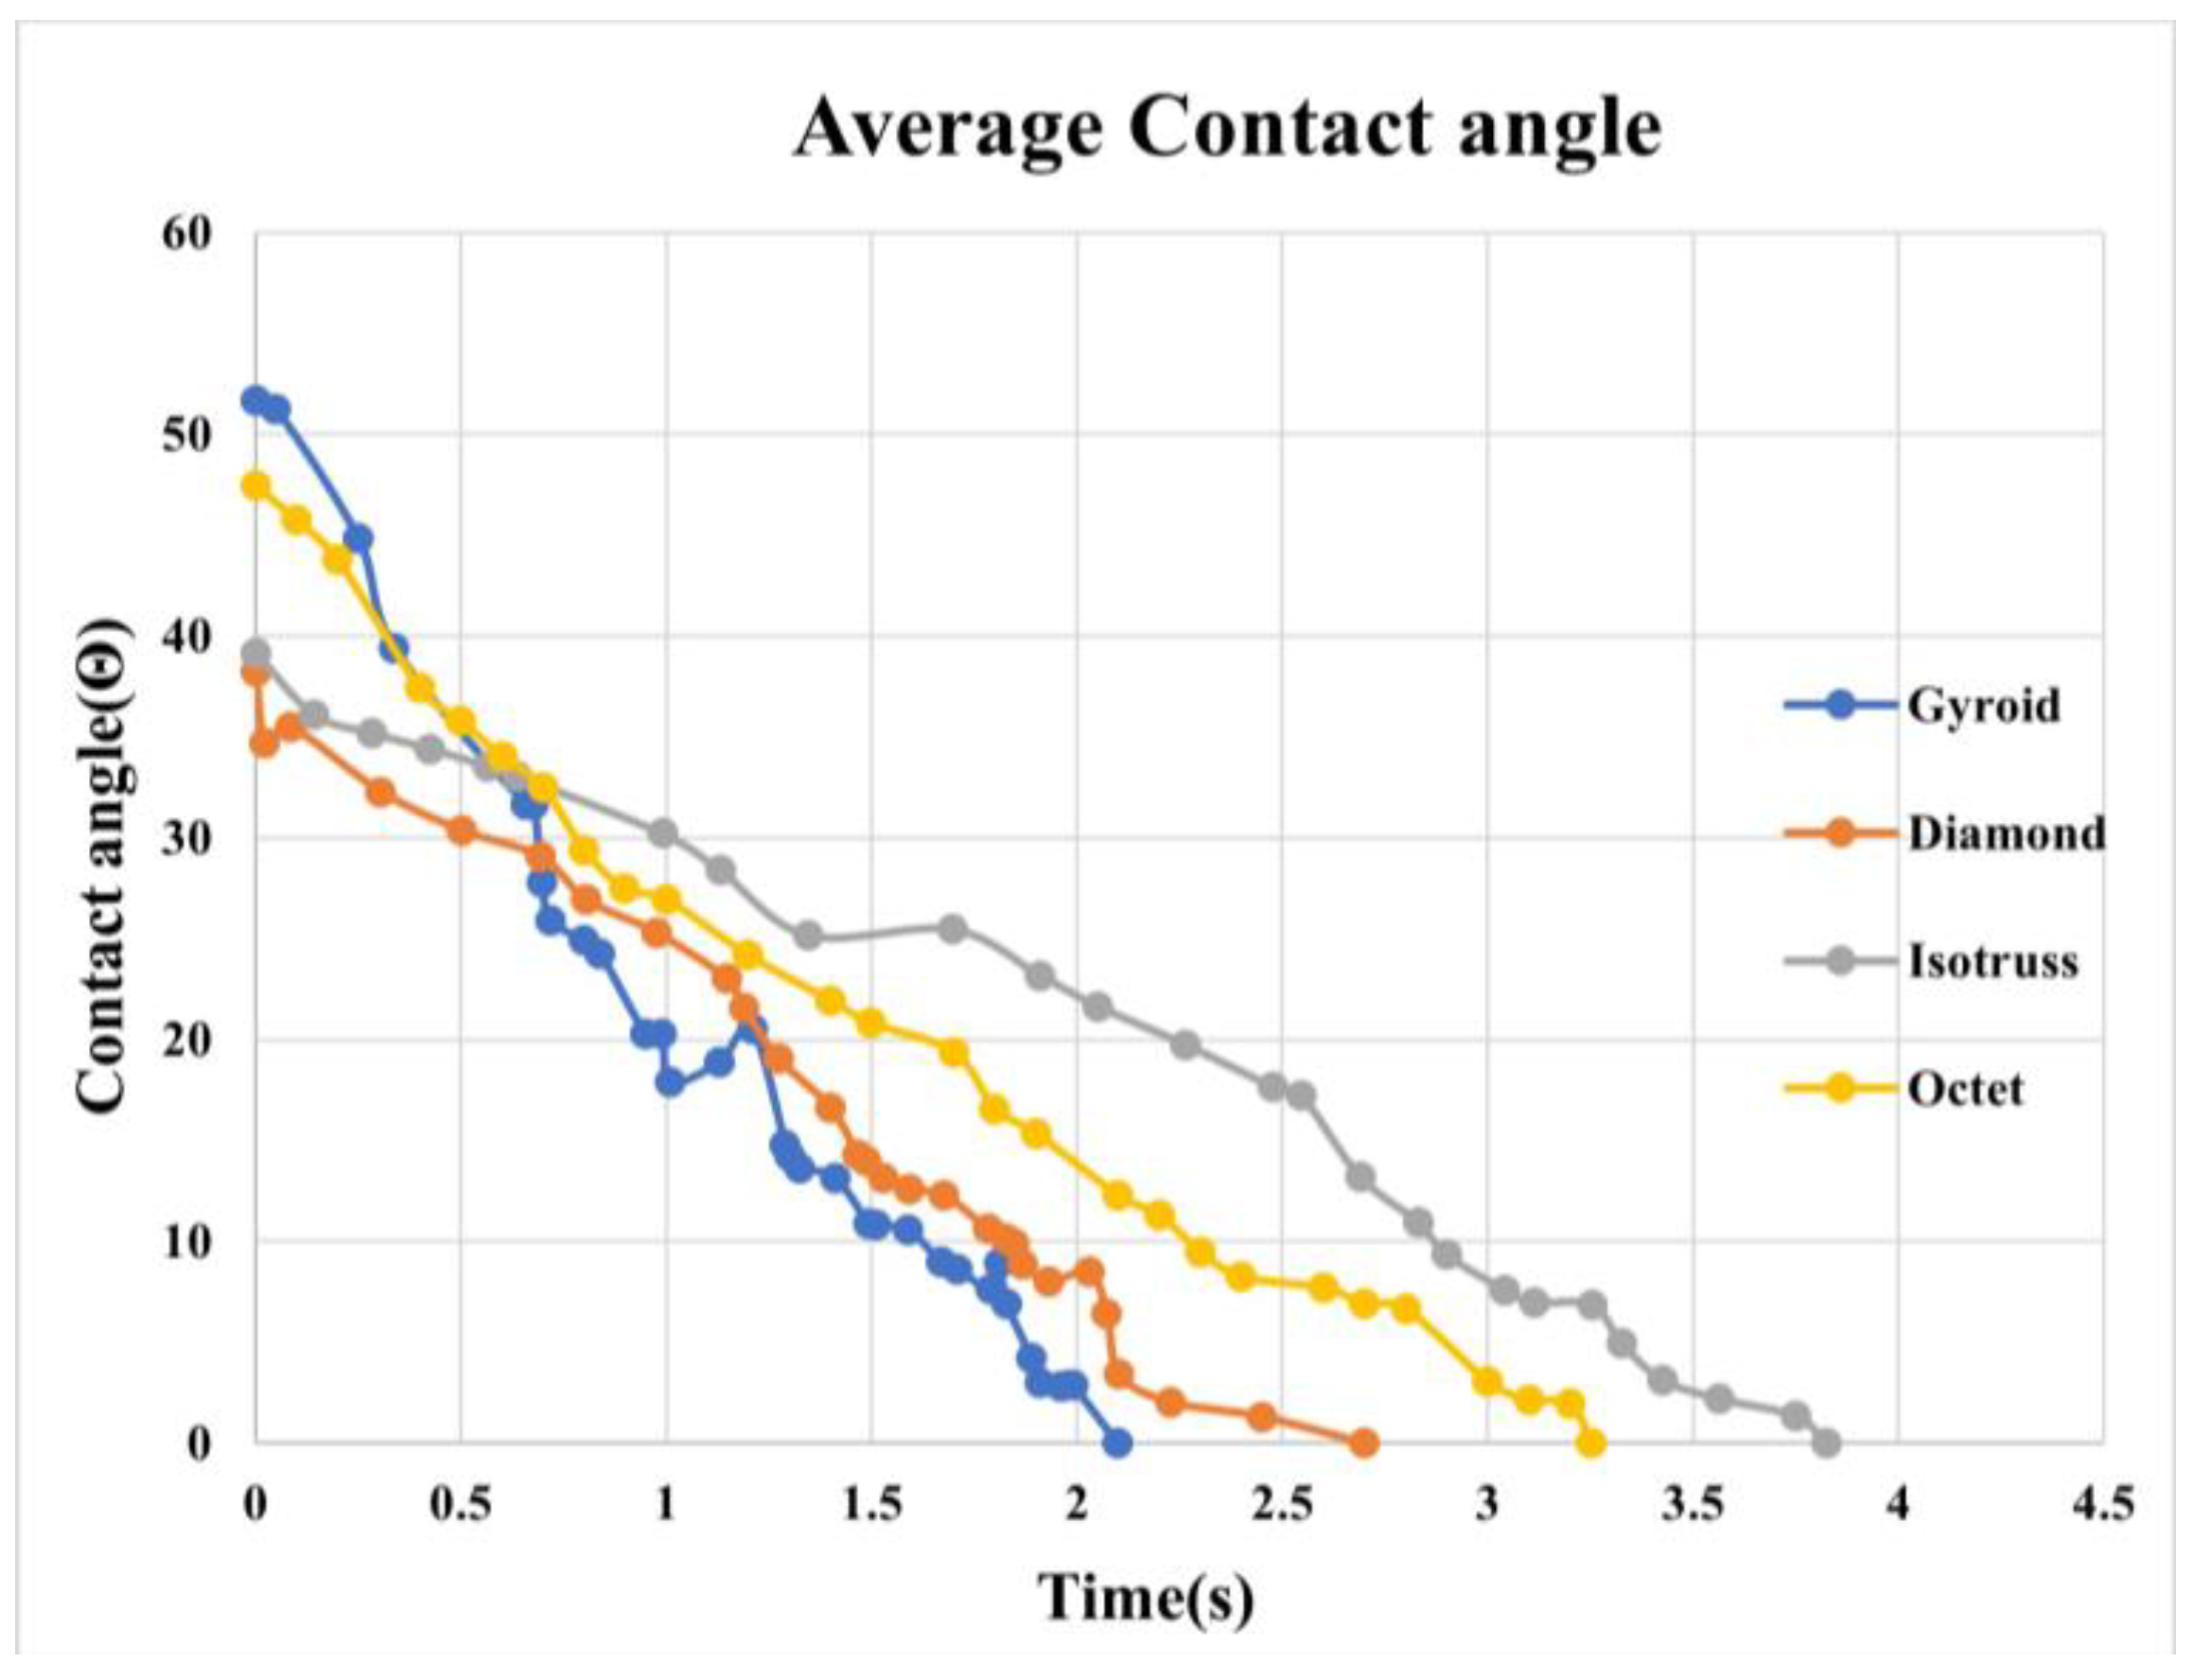
Figure 13.
Average dynamic contact angle comparison of TPMS-Gyroid structure results from experiment and numerical simulation.
Figure 13.
Average dynamic contact angle comparison of TPMS-Gyroid structure results from experiment and numerical simulation.
Figure 14.
Numerically determined contact angles of all four structures.
5.2. Capillary Perfromance Test Results
This study evaluates capillary performance in 3D-printed porous media with unit cell sizes of 2mm³, 3mm³, and 4mm³, as described in Table 2. Samples, with 50% porosity, were submerged in 150ml of DI water, and weight changes were measured over 600 seconds. Figure 15 highlights how unit cell size affects wicking rates.
The Diamond structure showed the best performance at 2mm³, followed by TPMS-Gyroid, Octet, and Isotruss. At 3mm³, Isotruss outperformed the others, while at 4mm³, all structures showed poor capillary performance due to larger pore radii.
5.3. Constant Head Permeability Test
The constant head permeability test was conducted on porous media with a 3mm³ unit cell size. Due to printing challenges, 2mm³ structures were not tested, and 4mm³ structures were excluded after failing preliminary capillary tests. Table 4 presents permeability values (k) for each unit cell structure, along with their averages. From results obtained, the TPMS-Gyroid structure exhibited the highest average permeability (0.0185 m/s), indicating superior fluid flow capacity. The Diamond and Isotruss structures showed intermediate permeability values of 0.0182 m/s and 0.0167 m/s, respectively. The Octet structure had the lowest average permeability (0.0089 m/s), suggesting the least fluid flow capability. However, in terms of practical performance for heat pipe applications, the Octet structure performed best, followed by Isotruss, Diamond, and TPMS-Gyroid. This suggests that factors beyond permeability, such as capillary pressure or structural stability, may influence overall effectiveness in heat pipe wicking.
6. Conclusions
This study captured droplet dynamics with less than 6% error between experimental and numerical results, revealing variations in contact angles across TPMS-Gyroid, Octet, Diamond, and Isotruss structures, with Isotruss (2 mm³) showing the highest angle. 3D printing faced challenges in cleaning uncured resin. TPMS-Gyroid showed favorable contact angles, suggesting further study potential. Wettability impacted penetration times, with larger unit cells causing faster droplet penetration, highlighting the importance of design parameters in thermal management. Capillary performance tests showed TPMS-Gyroid as the best performer, followed by Octet, Isotruss, and Diamond. Structures with 2 mm³ and 3 mm³ unit cells showed capillary effects, while 4 mm³ structures did not. Permeability tests excluded 4 mm³ structures due to poor capillary performance, and 2 mm³ structures were omitted due to printing challenges. Among the remaining, Octet had the highest permeability, outperforming Isotruss, Diamond, and TPMS-Gyroid, which showed strong capillary performance but lower permeability, indicating its potential for fluid retention in thermal applications.
7. Acknowledgement
Sincere thanks to NSTC, Taiwan, ROC, for funding the project (Grant No. 112-2221-E-032-026).
References
- S. Guddati, A. S. K. Kiran, M. Leavy, and S. Ramakrishna, "Recent advancements in additive manufacturing technologies for porous material applications," The International Journal of Advanced Manufacturing Technology, vol. 105, pp. 193-215, 2019. [CrossRef]
- S. Krainer and U. Hirn, "Contact angle measurement on porous substrates: Effect of liquid absorption and drop size," Colloids and Surfaces A: Physicochemical and Engineering Aspects, vol. 619, p. 126503, 2021. [CrossRef]
- W. Han, J. Shin, and J. H. Shin, "Low-cost, open-source contact angle analyzer using a mobile phone, commercial tripods and 3D printed parts," HardwareX, vol. 12, p. e00327, 2022. [CrossRef]
- Kyrloglou, A., et al. (2024). Numerical simulation of droplet dispersion within mesoporous membranes. Frontiers in Physics. [CrossRef]
- D. Jafari, W. W. Wits, and B. J. Geurts, "Metal 3D-printed wick structures for heat pipe application: Capillary performance analysis," Applied thermal engineering, vol. 143, pp. 403-414, 2018. [CrossRef]
- G. F. Sandoval, I. Galobardes, R. S. Teixeira, and B. M. Toralles, "Comparison between the falling head and the constant head permeability tests to assess the permeability coefficient of sustainable Pervious Concretes," Case studies in construction materials, vol. 7, pp. 317-328, 2017. [CrossRef]
- S.-H. Oh, C.-H. An B. Seo, J. Kim, C. Y. Park, and K. Park, "Functional morphology change of TPMS structures for design and additive manufacturing of compact heat exchangers," Additive Manufacturing, vol. 76, p. 103778, 2023. [CrossRef]
Figure 1.
Various unit cells used in this study.
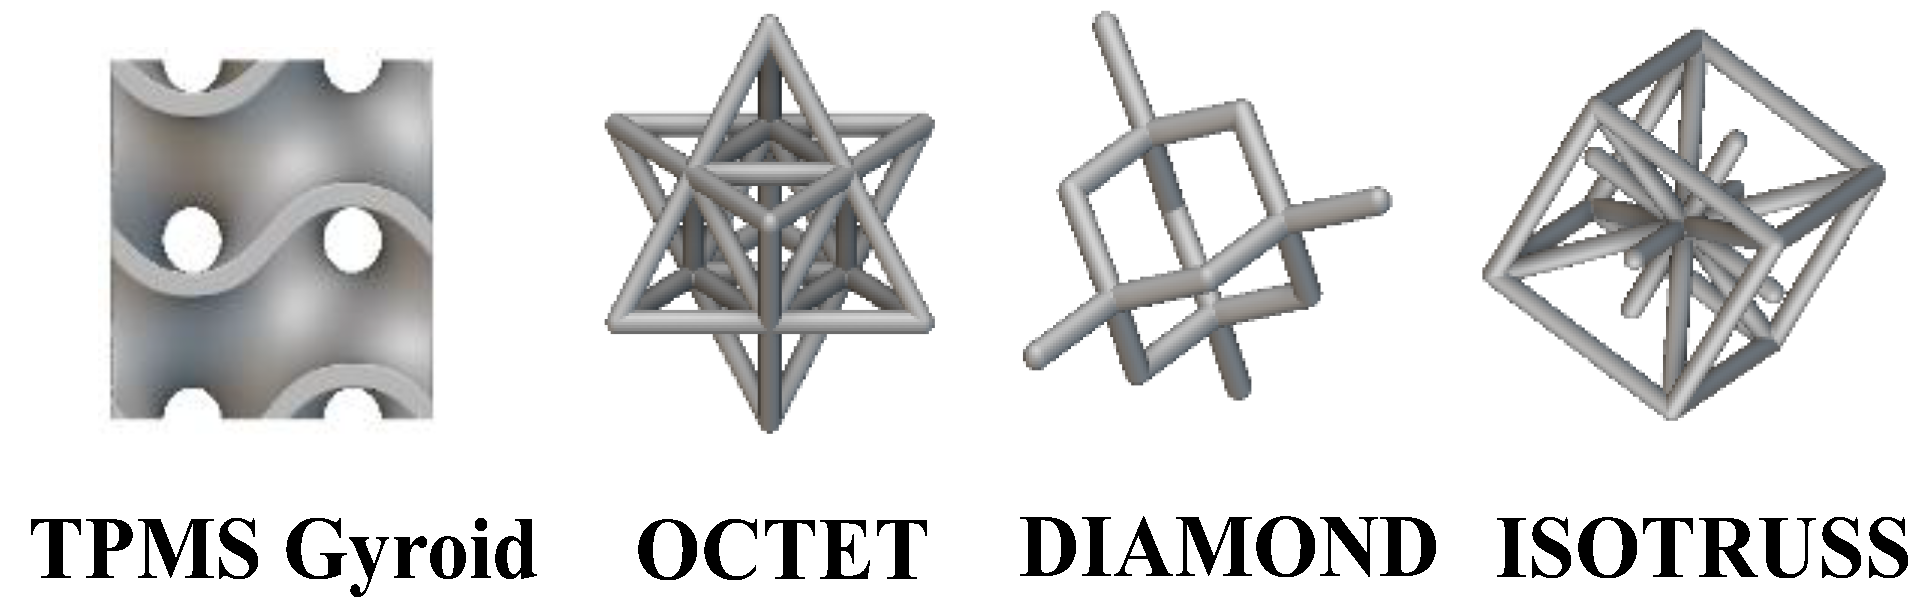
Figure 2.
(a) Porous structures designed for contact angle measurement test: a-TPMS Gyroid, b-Octet, c-Diamond, and d-Isotruss; (b) 3D-printed porous structures: a-TPMS Gyroid, b-Octet, c-Diamond, d-Isotruss.
Figure 2.
(a) Porous structures designed for contact angle measurement test: a-TPMS Gyroid, b-Octet, c-Diamond, and d-Isotruss; (b) 3D-printed porous structures: a-TPMS Gyroid, b-Octet, c-Diamond, d-Isotruss.
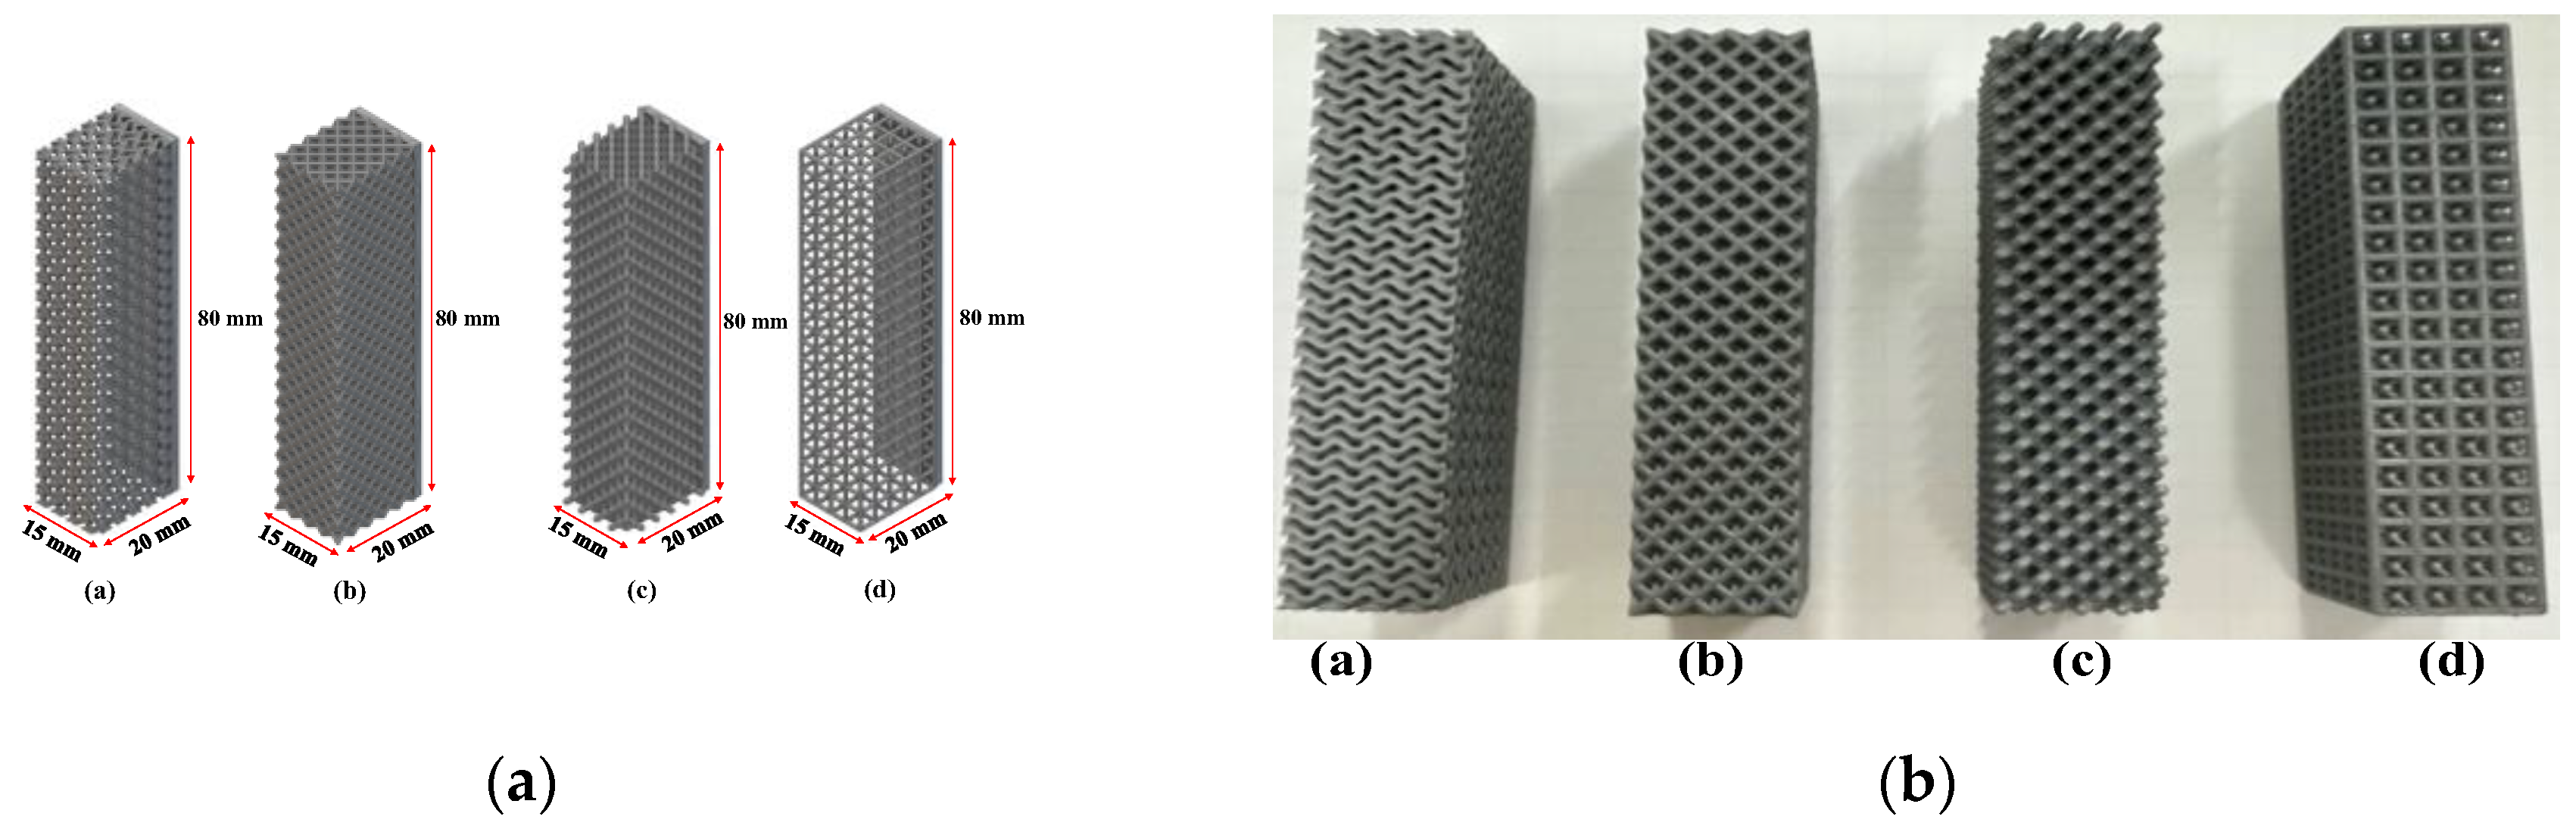
Figure 3.
(a) Porous structures designed for capillary performance and permeability test: a-TPMS Gyroid, b-Octet, c-Diamond, and d-Isotruss; (b) 3D-printed porous structures a-TPMS Gyroid, b-Octet, c-Diamond, d-Isotruss.
Figure 3.
(a) Porous structures designed for capillary performance and permeability test: a-TPMS Gyroid, b-Octet, c-Diamond, and d-Isotruss; (b) 3D-printed porous structures a-TPMS Gyroid, b-Octet, c-Diamond, d-Isotruss.
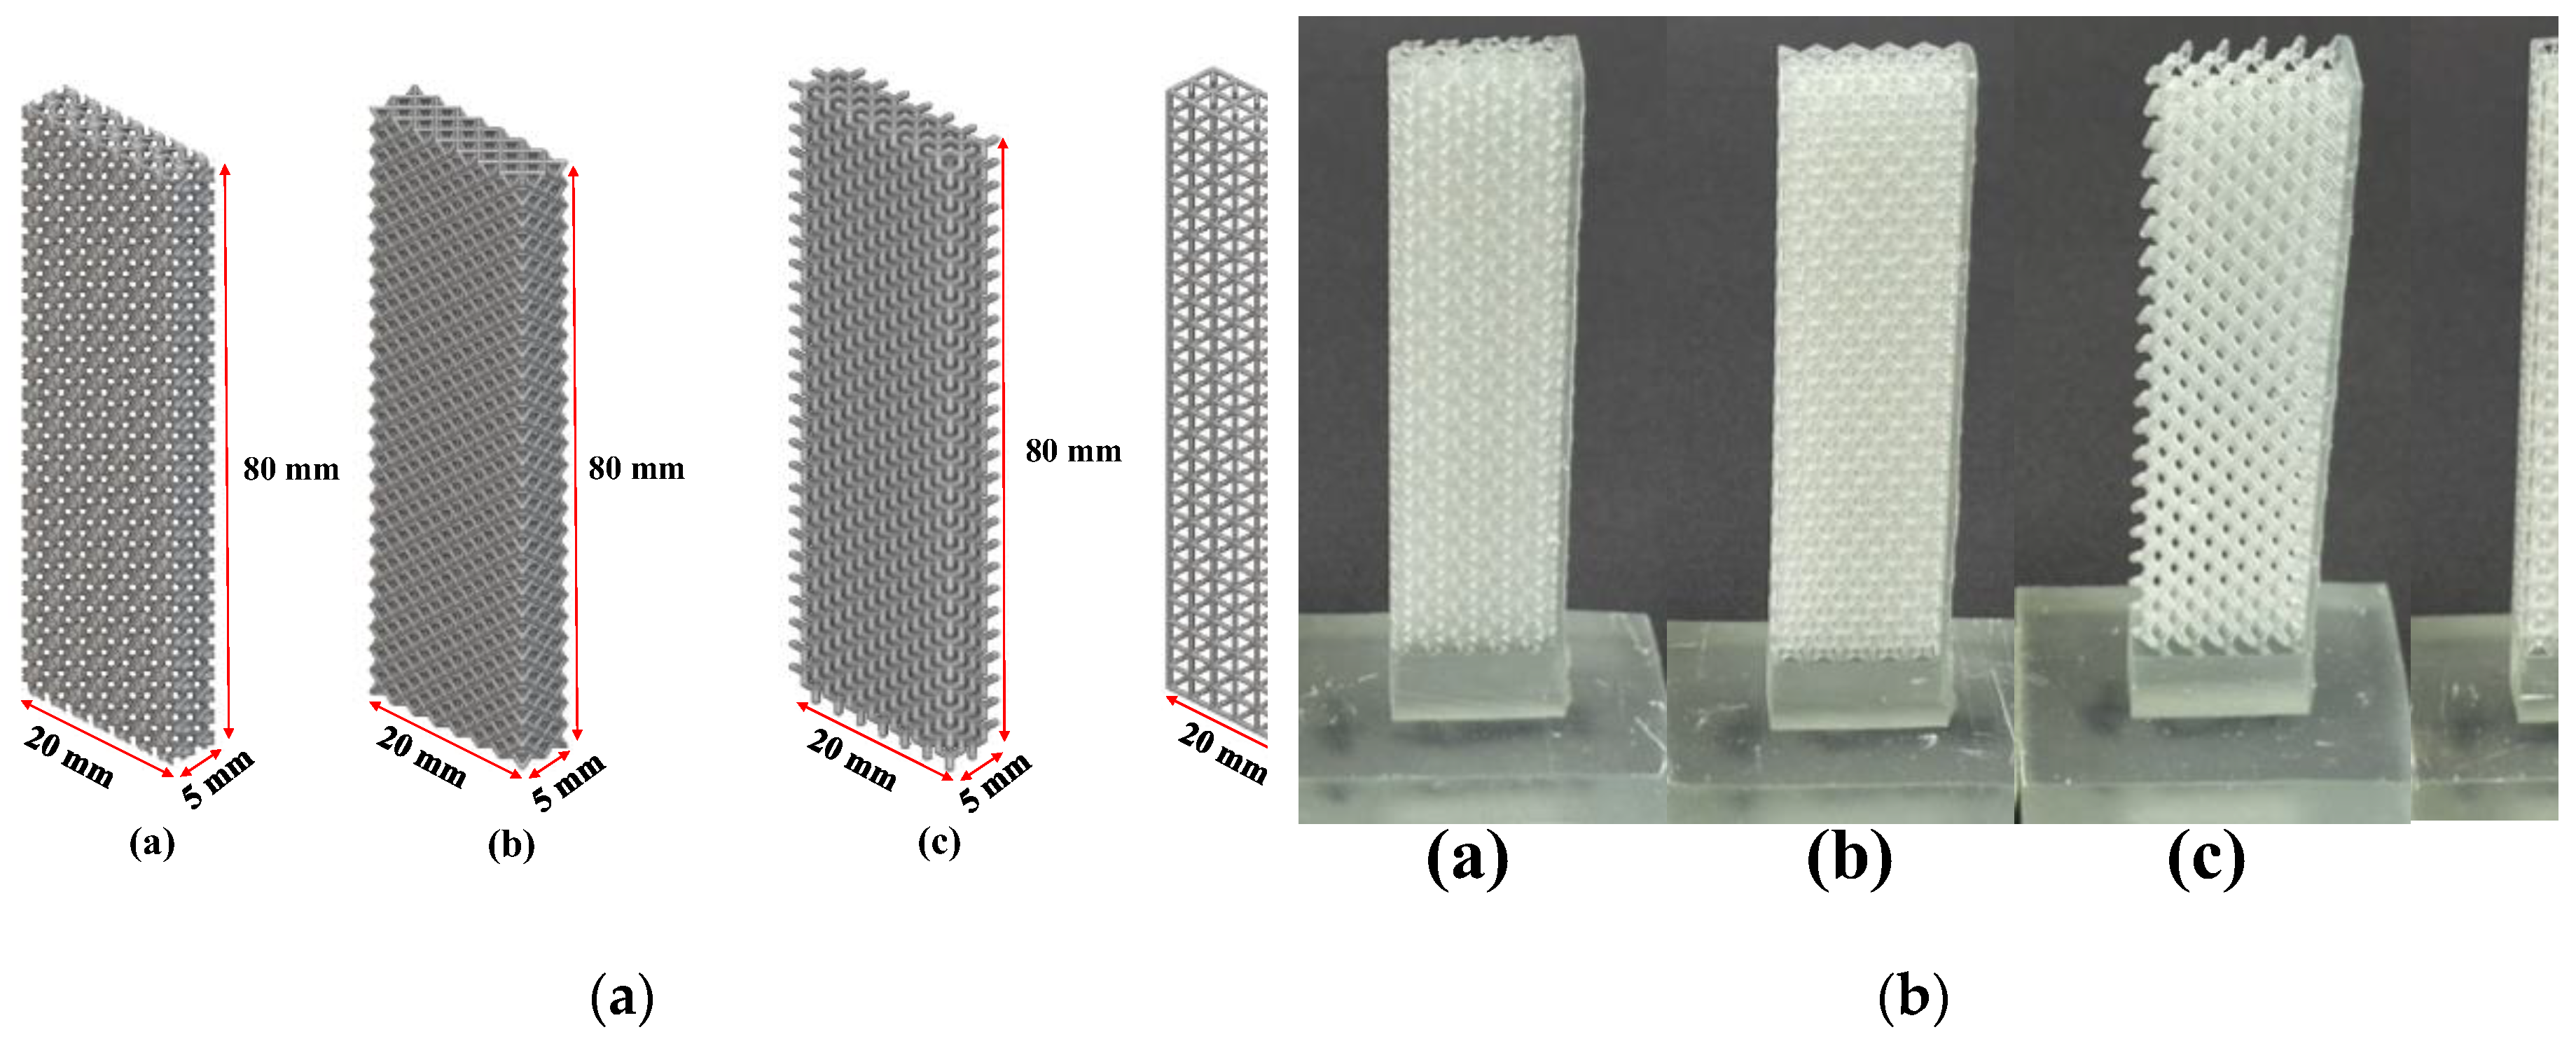
Figure 4.
Schematic diagram of permeability experiment.
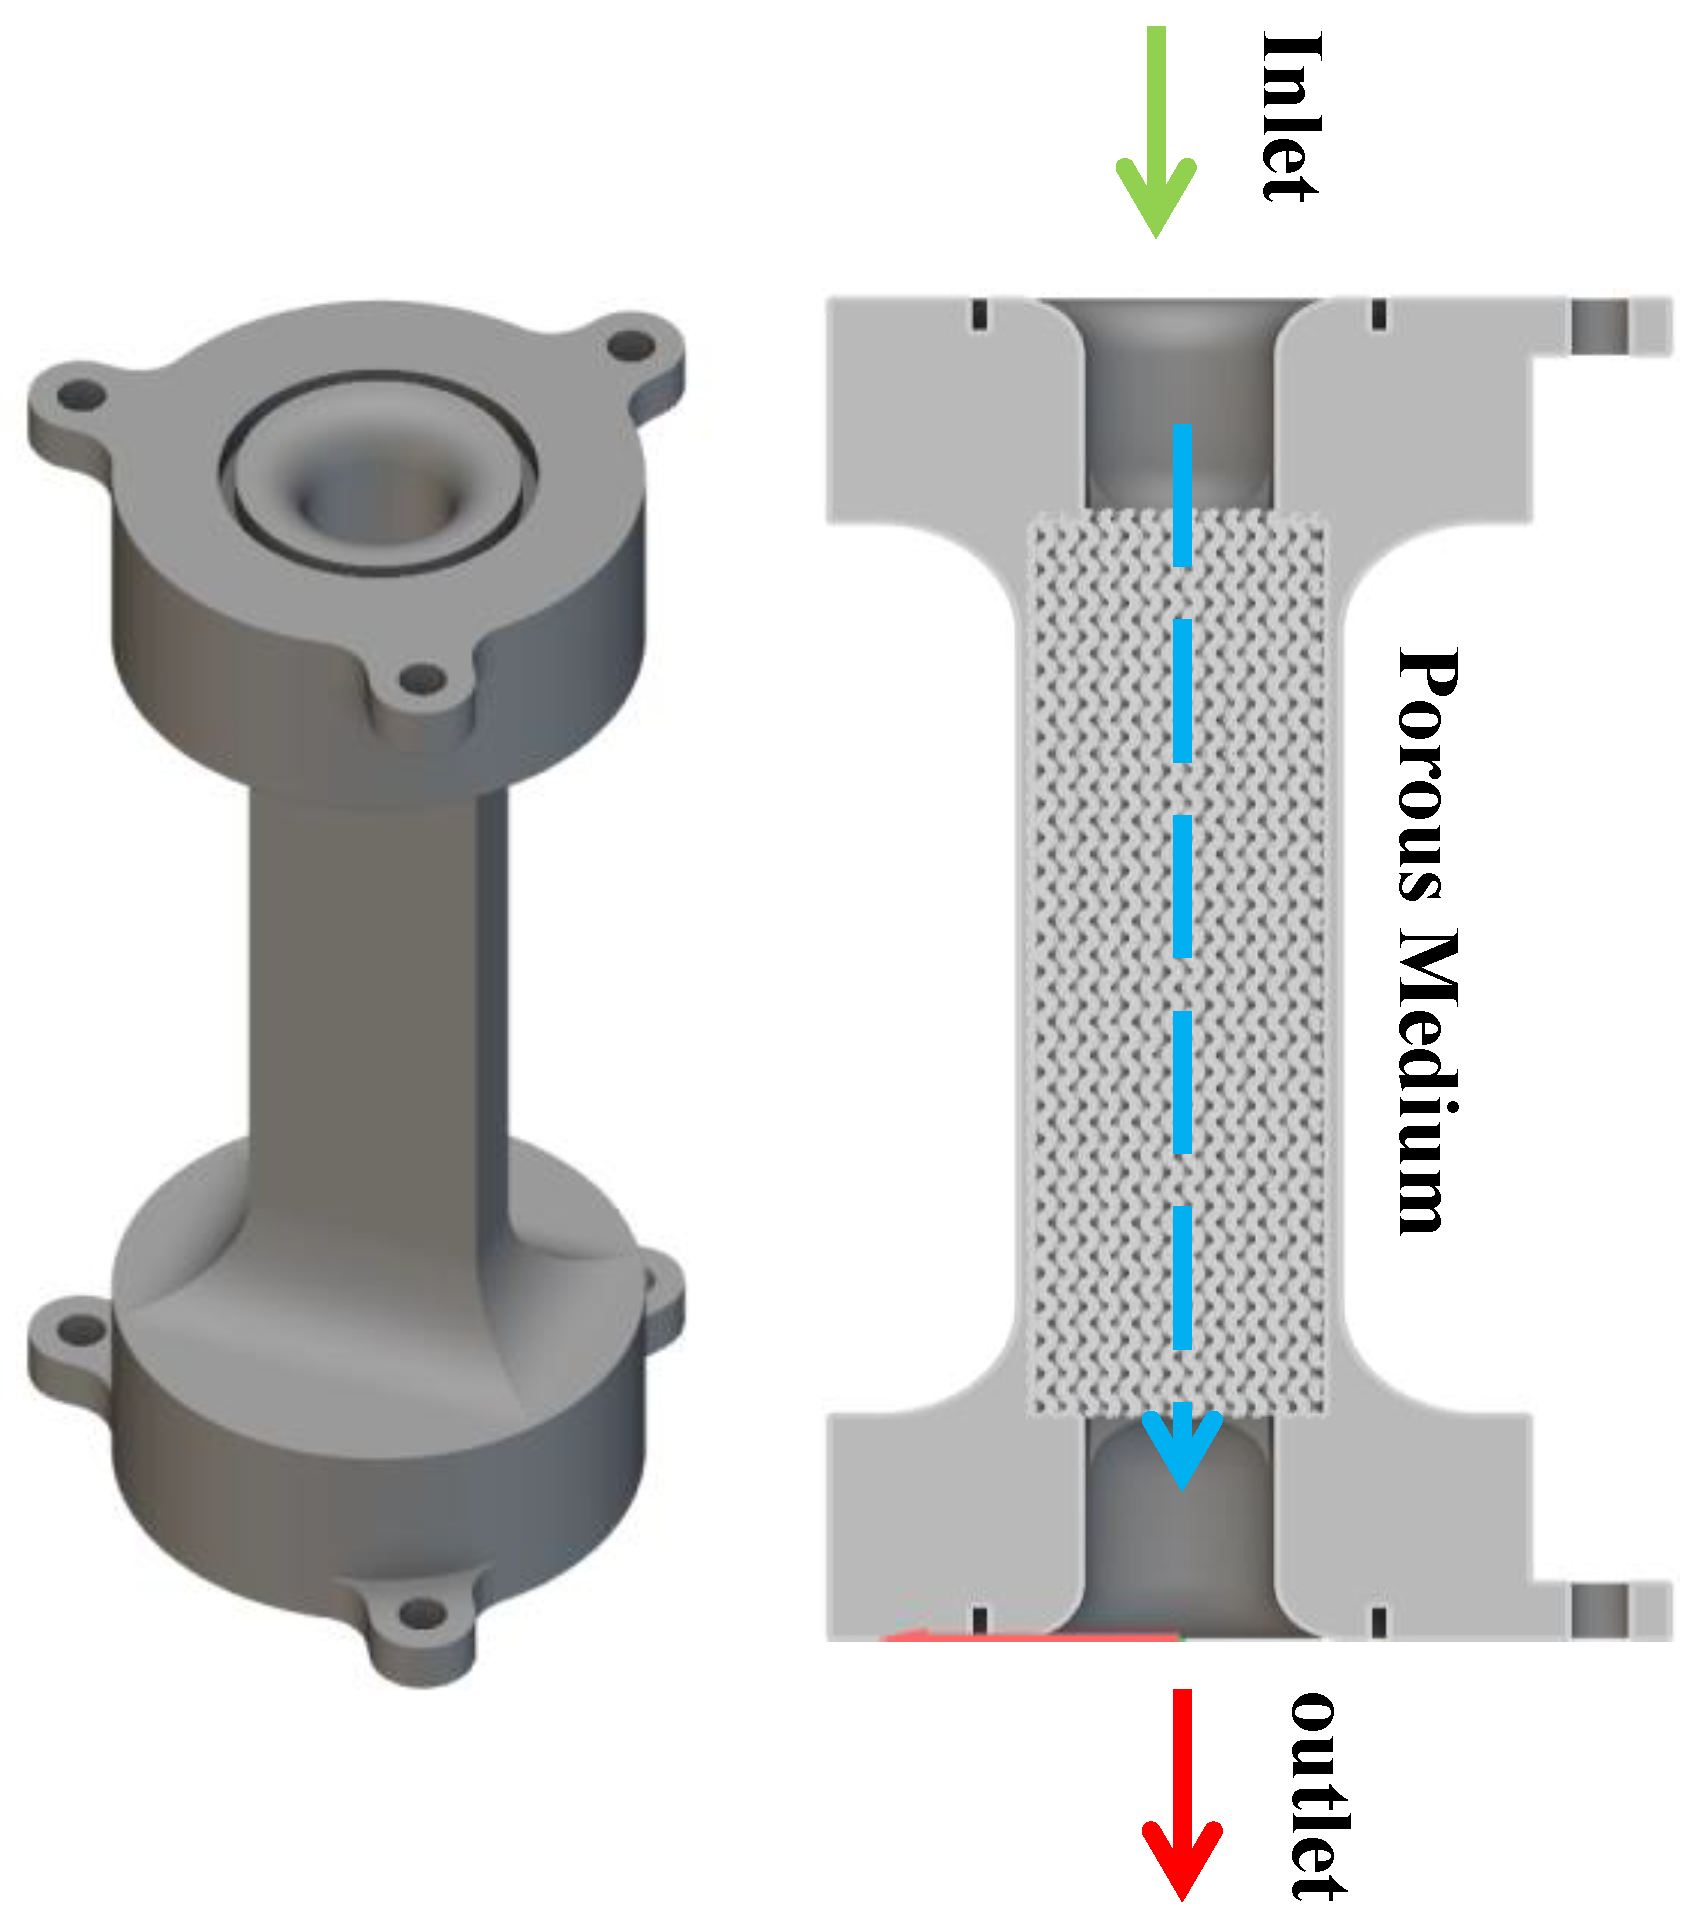
Figure 5.
Fluid domain with applied boundary conditions in the numerical model.
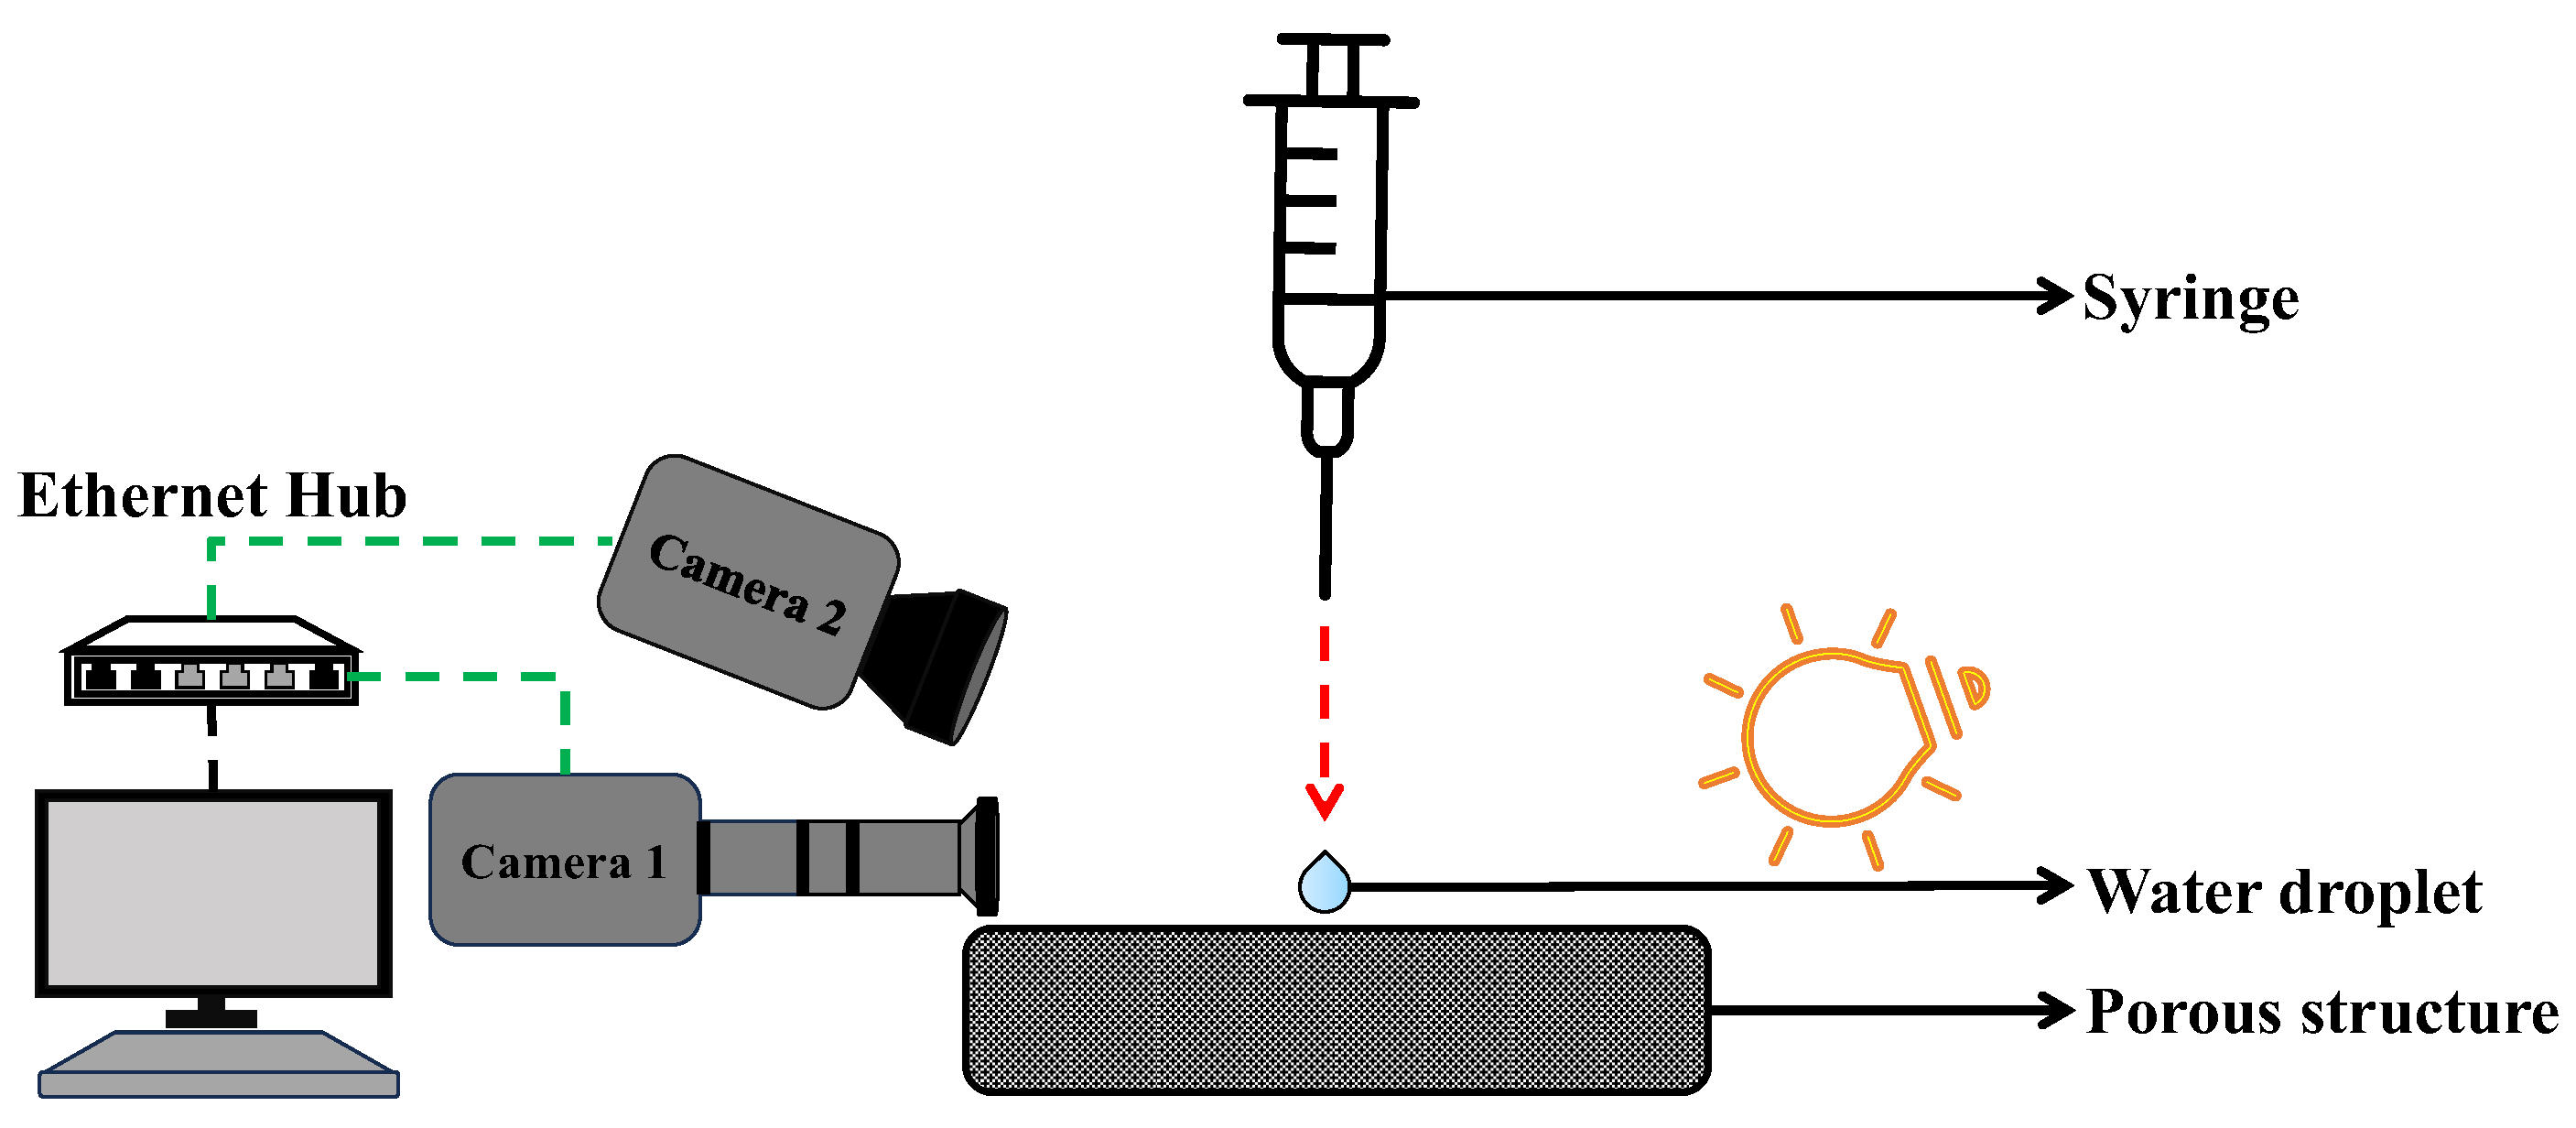
Figure 6.
Fluid domain with applied boundary conditions in the numerical model.
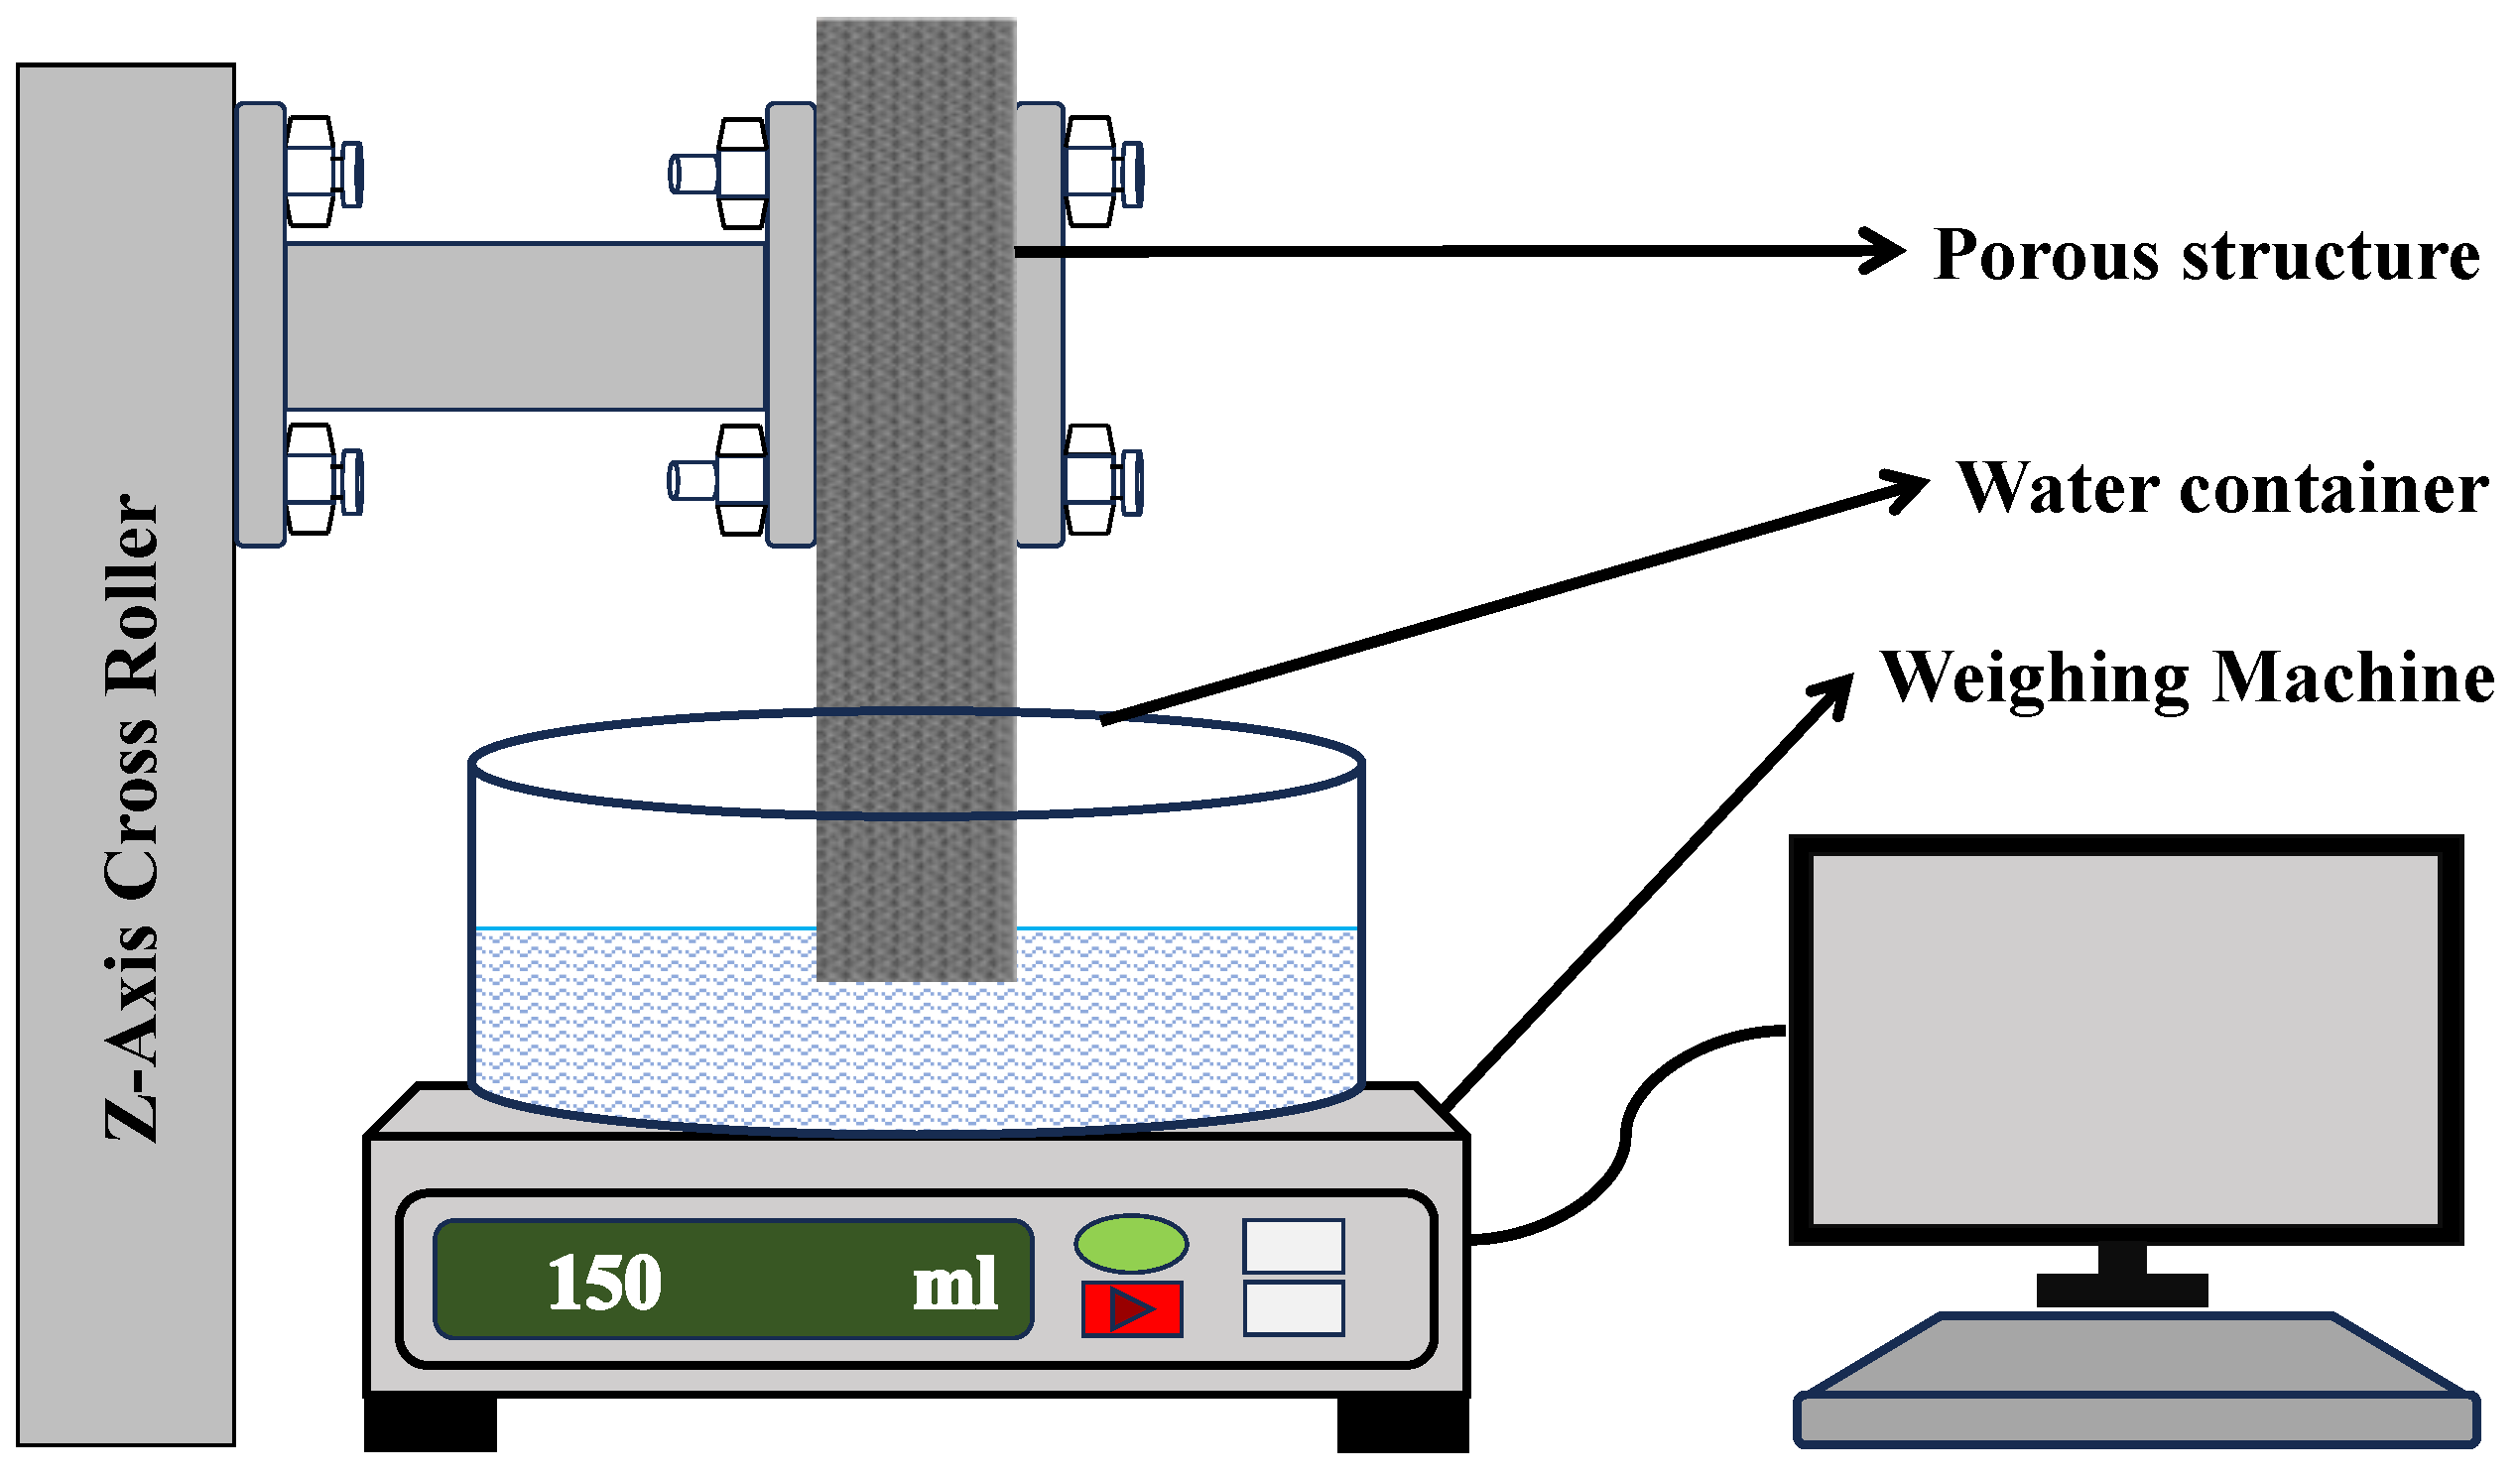
Figure 7.
Fluid domain with applied boundary conditions in the numerical model.
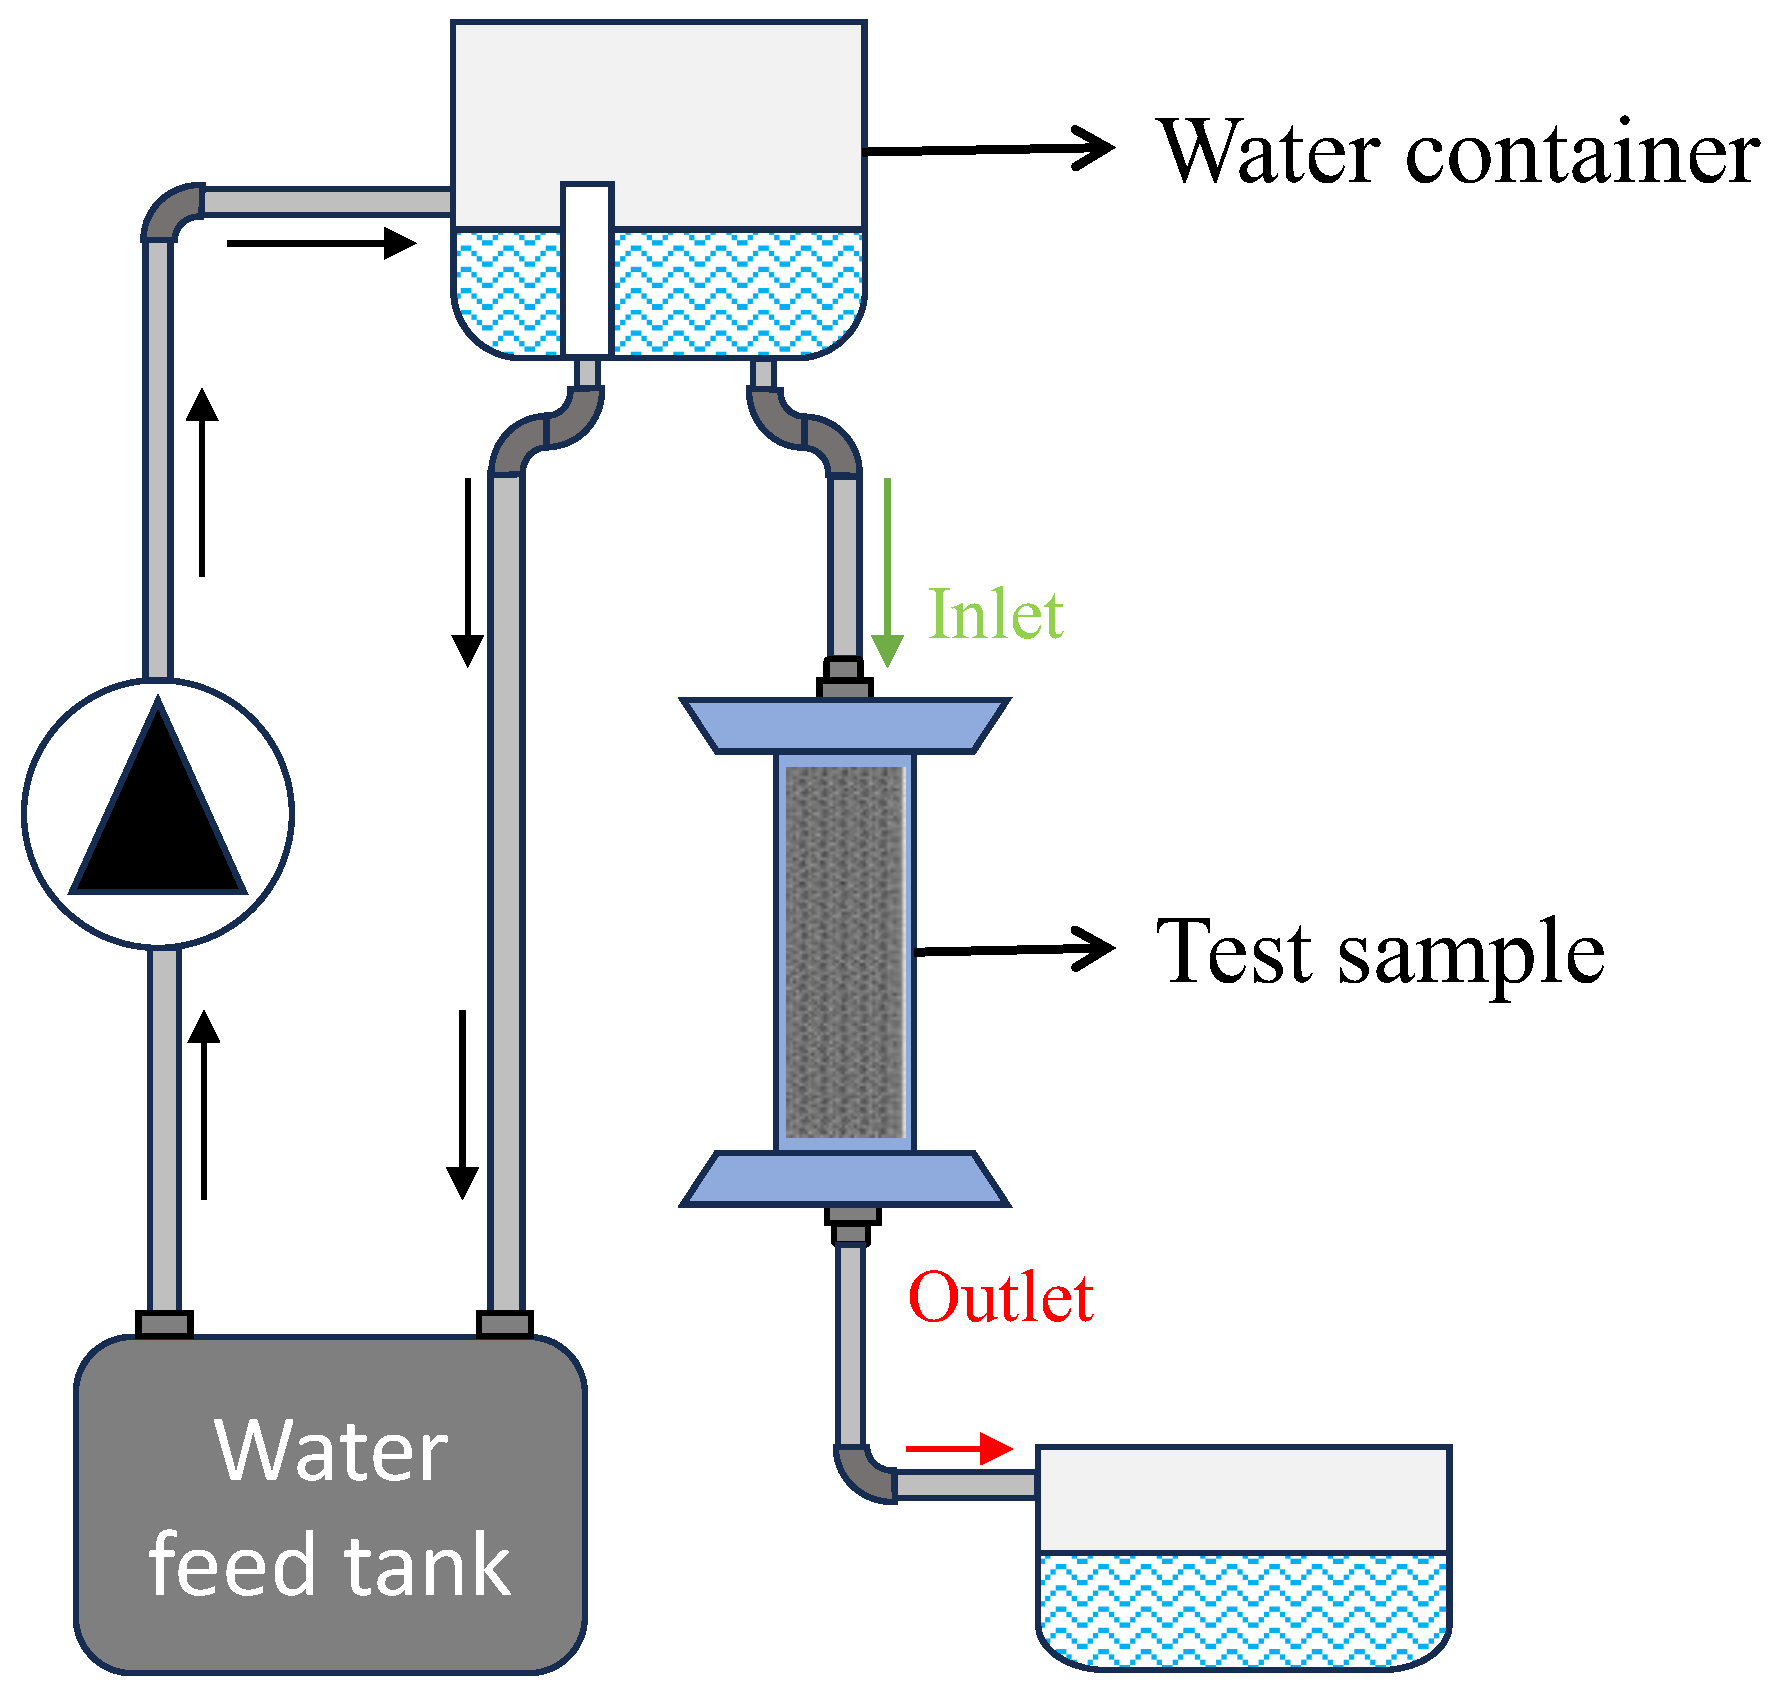
Figure 8.
(a) Porous structures designed using nTopology a-Octet, b- Isotruss, c- TPMS-Gyroid, d- Diamond; (b) Static contact angle of the solid 3-D printed flat plate measured by dpiMAX goniometer.
Figure 8.
(a) Porous structures designed using nTopology a-Octet, b- Isotruss, c- TPMS-Gyroid, d- Diamond; (b) Static contact angle of the solid 3-D printed flat plate measured by dpiMAX goniometer.
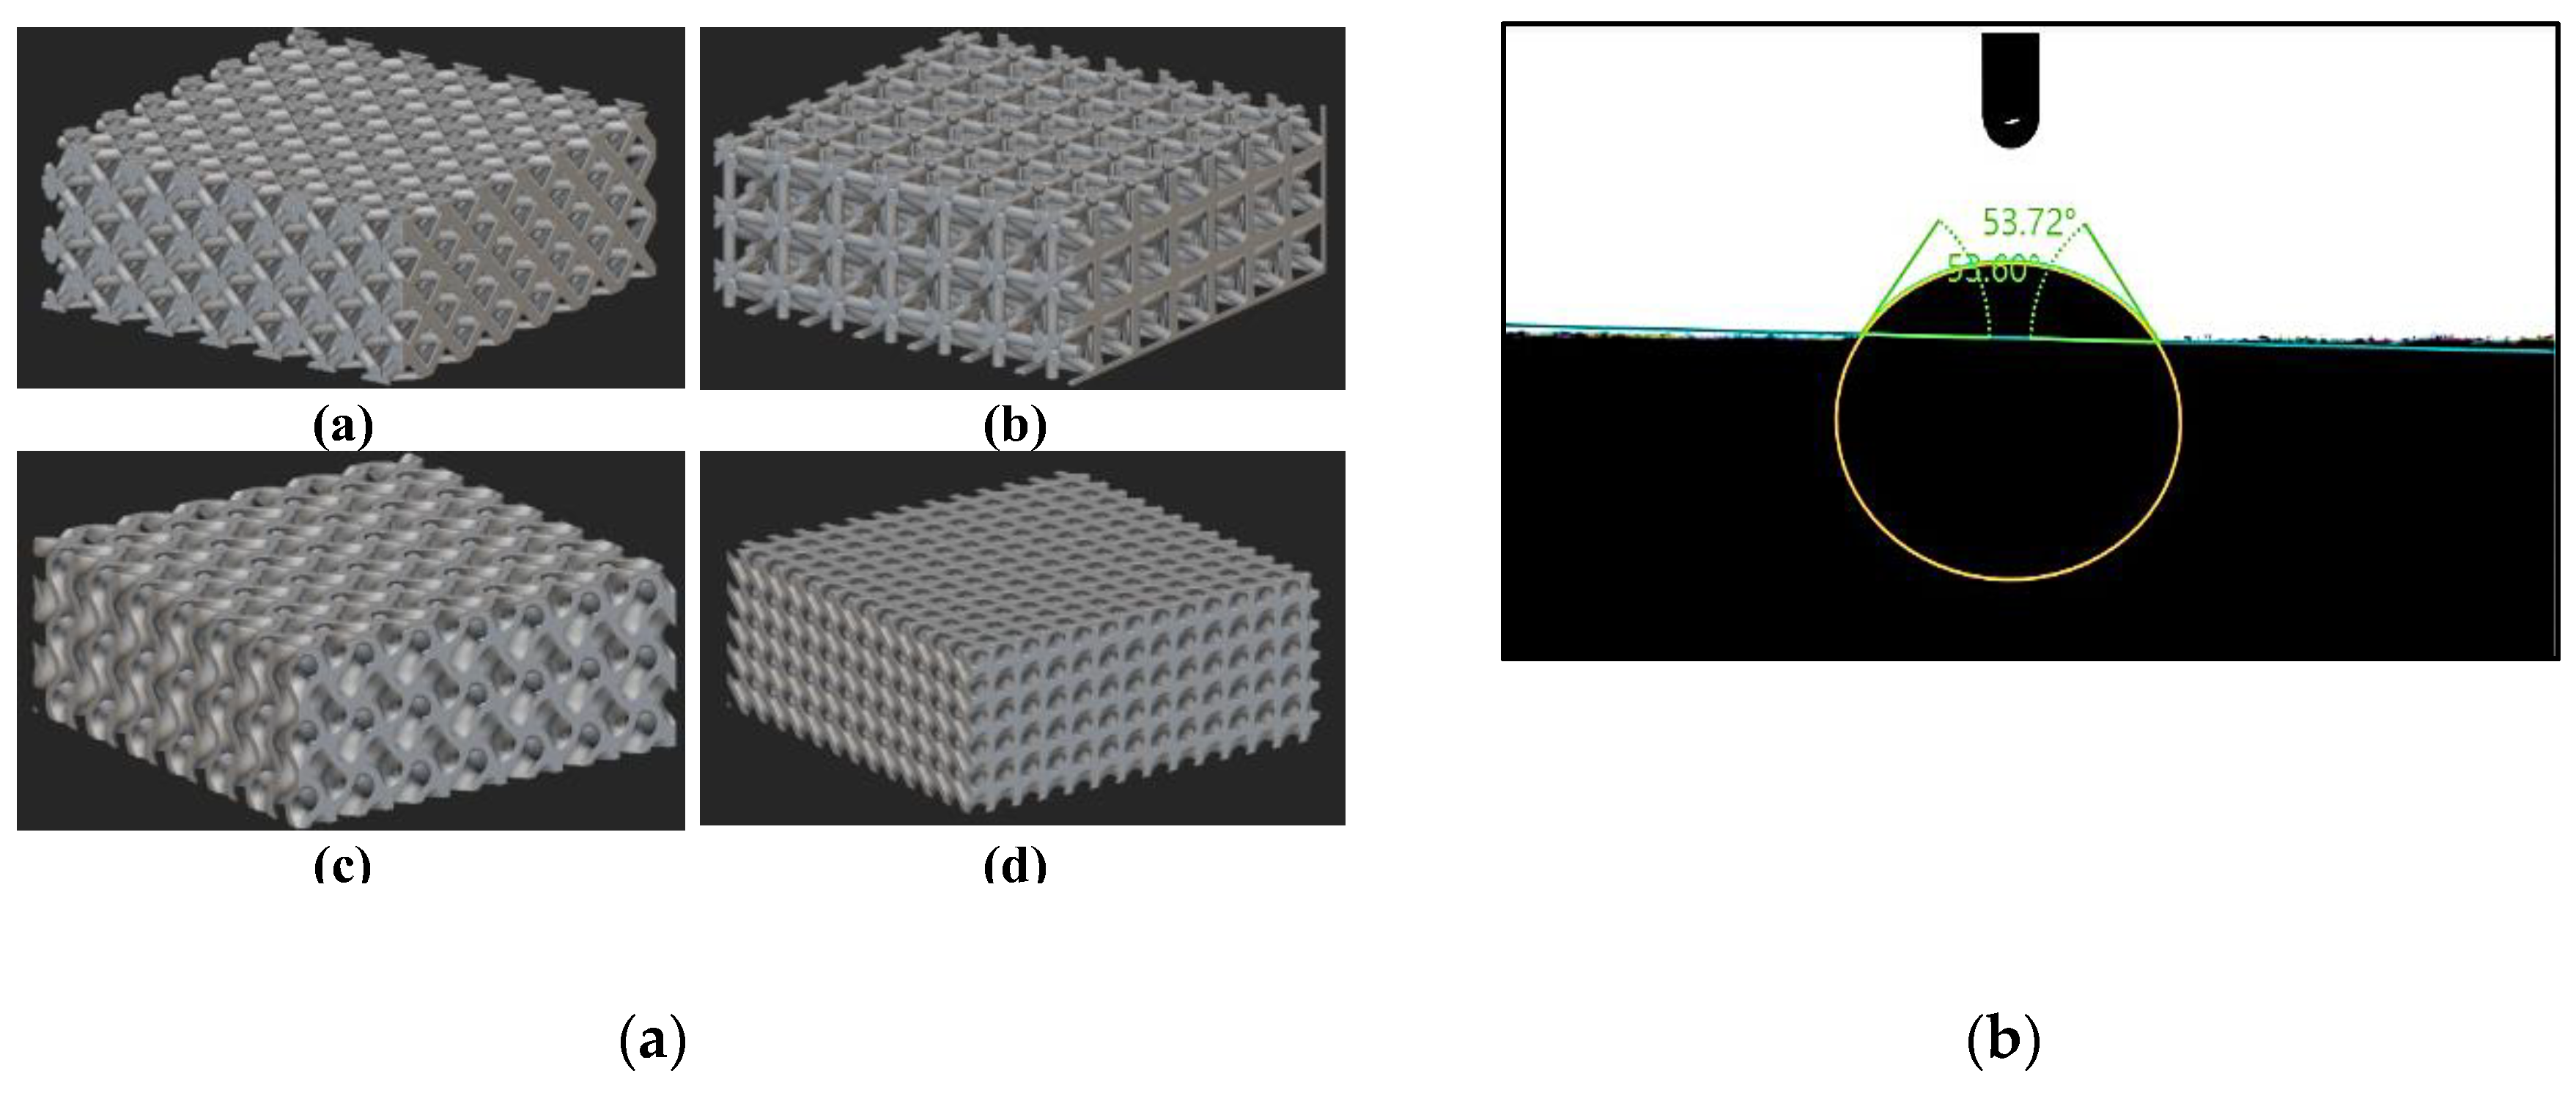
Figure 10.
Polyhexa mesh for Gyroid structure.
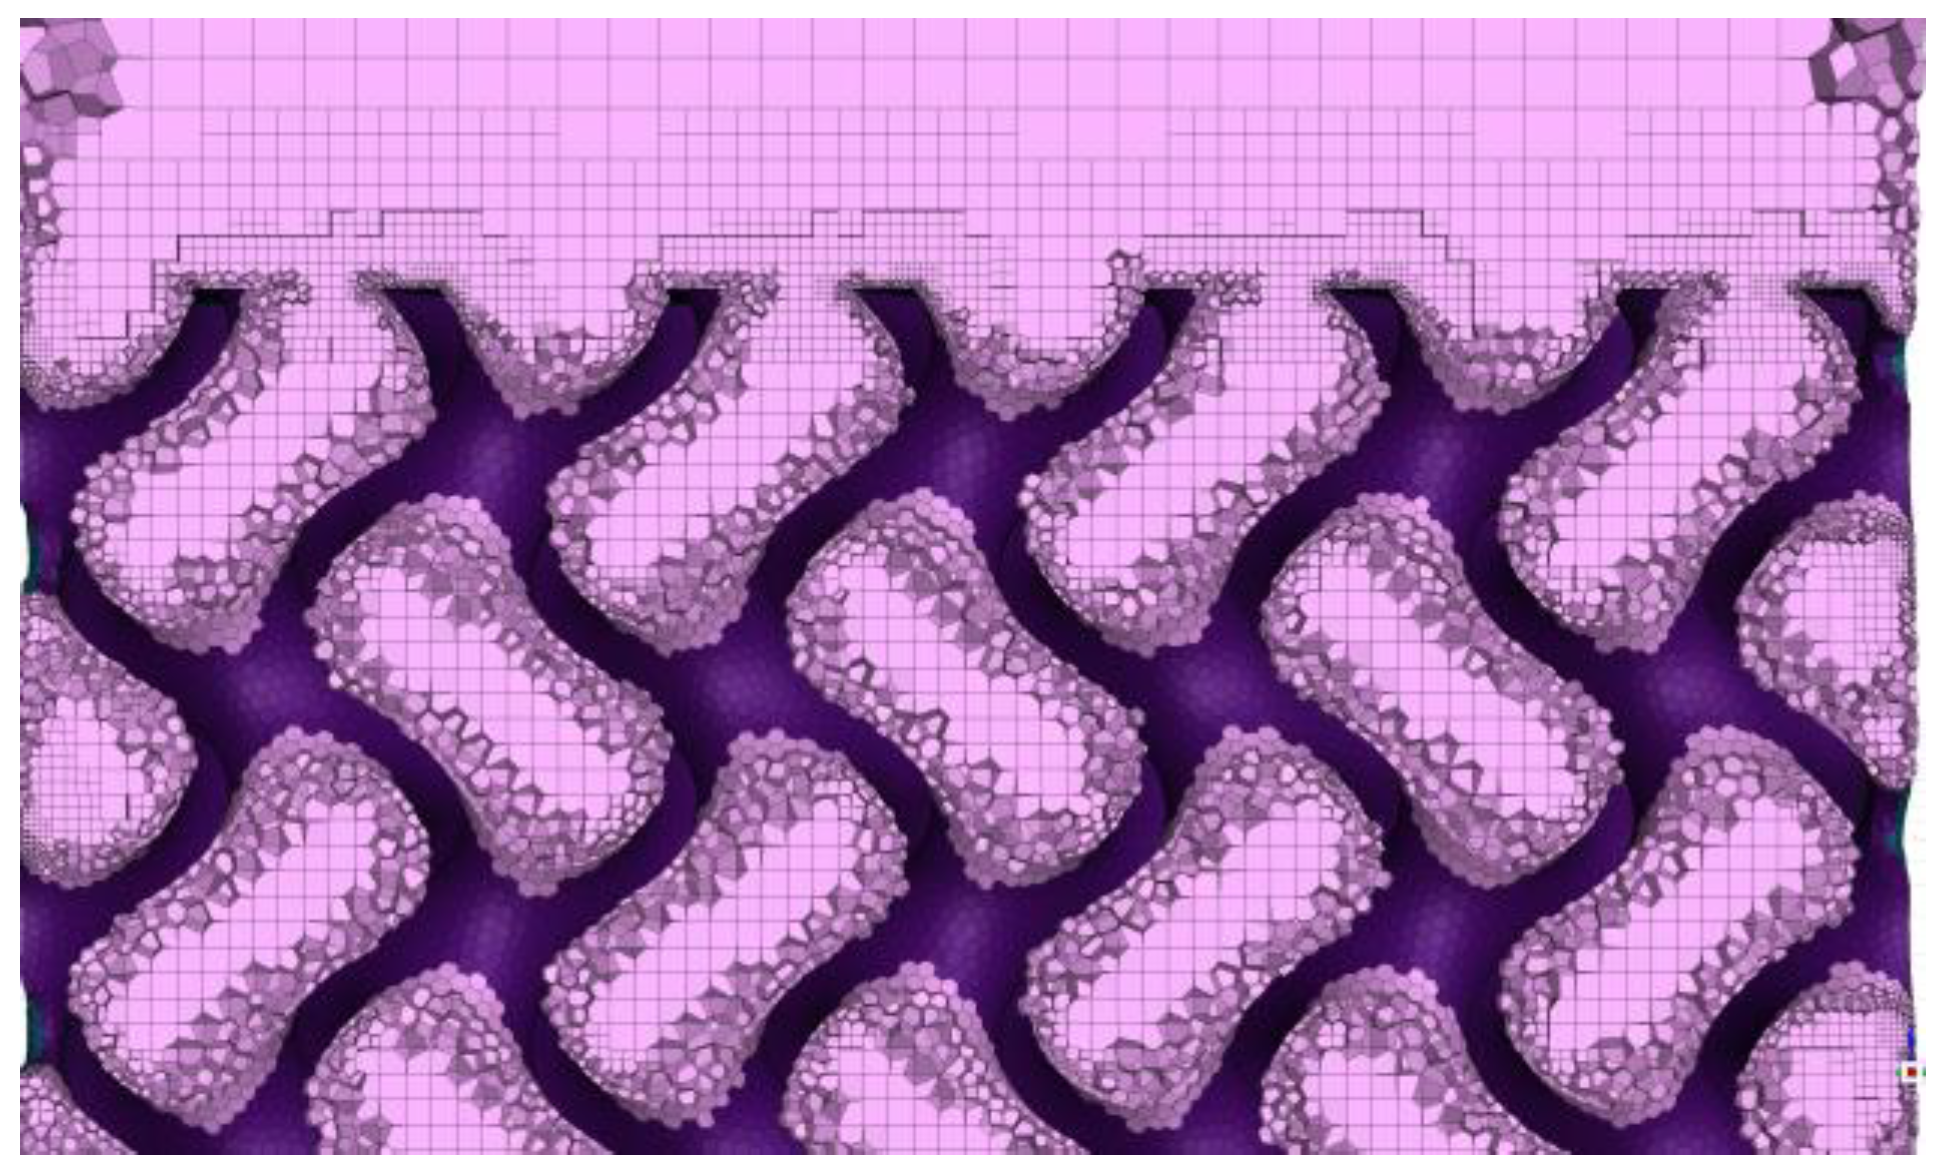
Figure 12.
(a) Comparison of dynamic contact angles from experiments and simulations for the TPMS-Gyroid structure: a- Right angle, b- Left angle; (b) Comparison of water droplet evolution- of TPMS-Gyroid structure results from experiment and numerical simulation.
Figure 12.
(a) Comparison of dynamic contact angles from experiments and simulations for the TPMS-Gyroid structure: a- Right angle, b- Left angle; (b) Comparison of water droplet evolution- of TPMS-Gyroid structure results from experiment and numerical simulation.
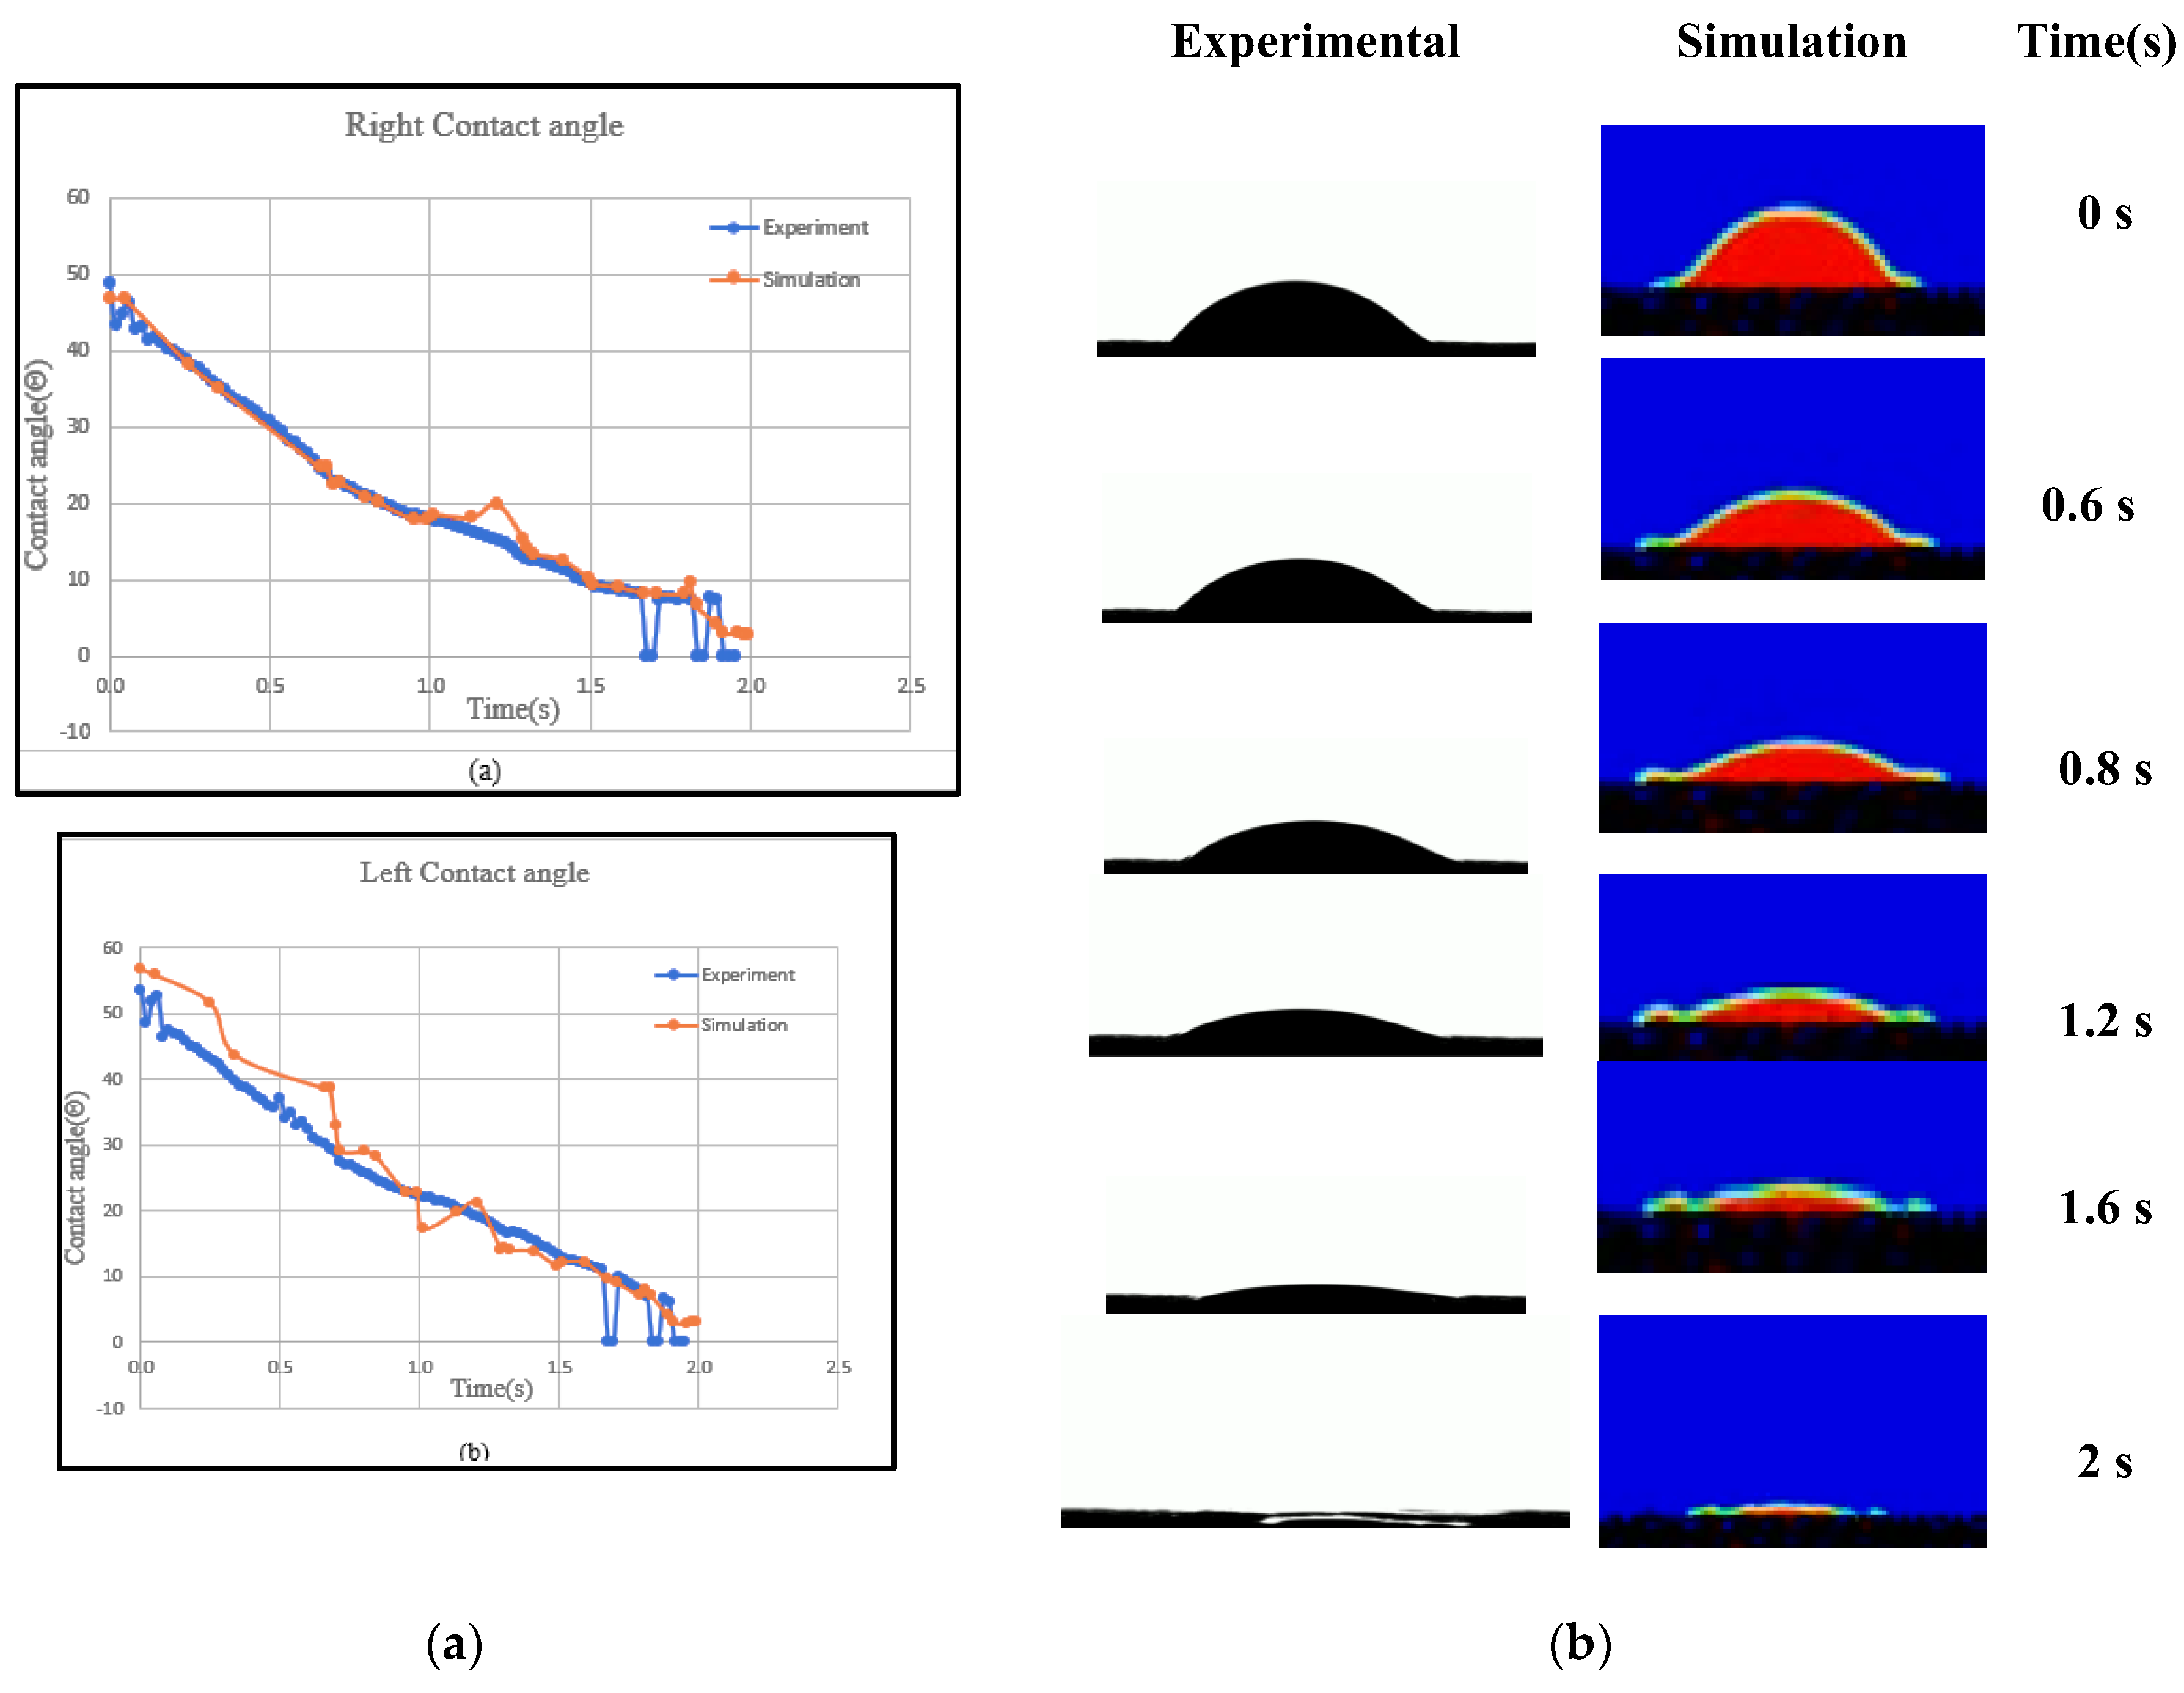
Figure 15.
Capillary performance test results of 2,3 and 4 mm³ unit cell structures.
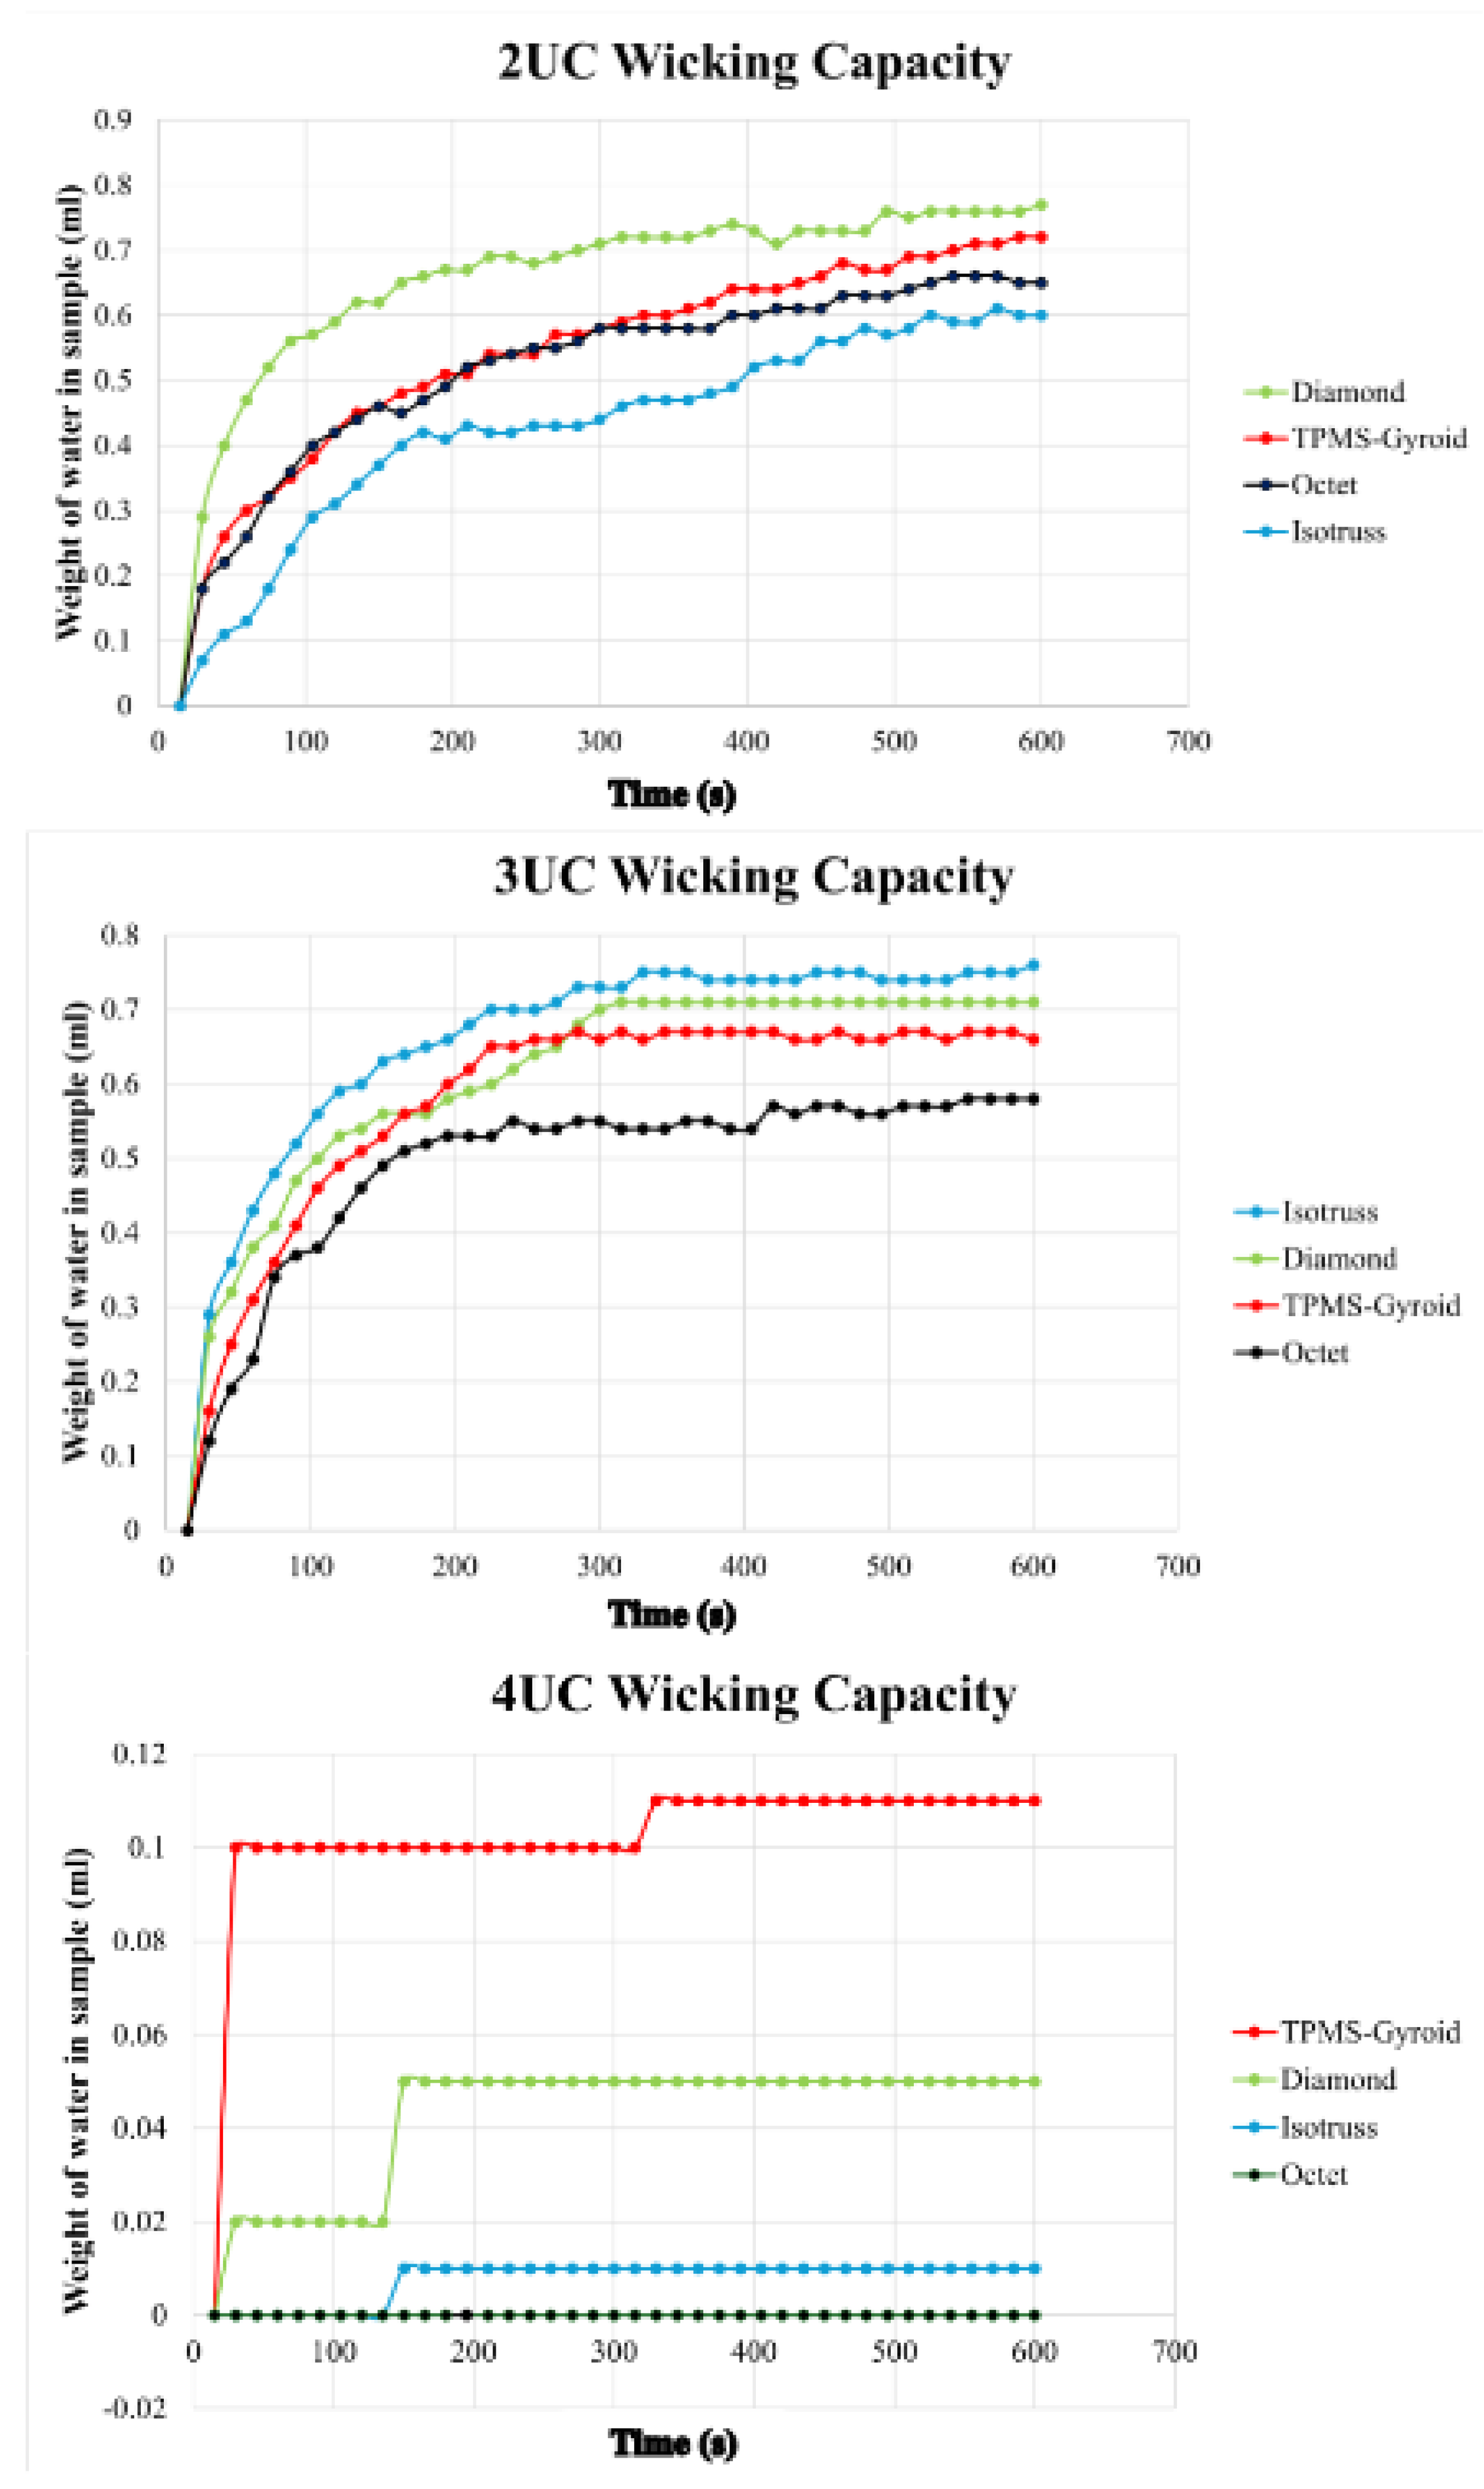
Table 1.
Printing parameters for contact angle measurement test.
| Structure | Unit cell (mm3) | Beam thickness (mm) | Porosity | Surface Area (mm2) | Volume (mm3) | SA/V ratio (mm-1) |
| TPMS-Gyroid | 2 | 0.479 | 50.04 | 72,631.25 | 11,990.4 | 6.05 |
| 3 | 0.721 | 50.08 | 49,185.66 | 11,980.8 | 4.10 | |
| 4 | 0.958 | 50.04 | 37,683.29 | 11,990.4 | 3.14 | |
|
Octet |
2 | 0.444 | 50.02 | 79,630.53 | 11,995.2 | 6.64 |
| 3 | 0.656 | 50.01 | 55,538.52 | 11,997.6 | 4.62 | |
| 4 | 0.859 | 50.00 | 43,220.95 | 12,000.0 | 3.60 | |
|
Diamond |
2 | 0.699 | 50.08 | 53,578.24 | 11,980.8 | 4.47 |
| 3 | 1.040 | 50.08 | 36,659.61 | 11,980.8 | 3.05 | |
| 4 | 1.375 | 50.01 | 28,269.19 | 11,997.6 | 2.35 | |
|
Isotruss |
2 | 0.500 | 50.00 | 72,284.93 | 12,000.0 | 6.02 |
| 3 | 0.740 | 50.09 | 50,126.38 | 11,978.4 | 4.18 | |
| 4 | 0.969 | 50.02 | 39,224.40 | 11,995.2 | 3.27 |
Table 2.
Printing parameters for capillary rate of rise test and permeability experiment.
| Structure | Unit cell (mm3) | Beam thickness (mm) | Porosity | Surface Area (mm2) | Volume (mm3) | SA/V ratio (mm-1) |
| TPMS-Gyroid | 2 | 0.426 | 50.09 | 28383.90 | 3992.8 | 7.10 |
| 3 | 0.603 | 50.05 | 20740.63 | 3996.0 | 5.19 | |
| 4 | 0.644 | 50.08 | 19921.61 | 3993.6 | 4.98 | |
|
Octet |
2 | 0.401 | 50.05 | 30873.67 | 3996.0 | 7.72 |
| 3 | 0.565 | 50.04 | 22871.78 | 3996.8 | 5.72 | |
| 4 | 0.654 | 50.00 | 20645.43 | 4000.0 | 5.16 | |
|
Diamond |
2 | 0.642 | 50.03 | 20433.54 | 3997.6 | 5.11 |
| 3 | 0.916 | 50.05 | 14782.10 | 3996.0 | 3.69 | |
| 4 | 1.067 | 50.05 | 13097.75 | 3996.0 | 3.27 | |
|
Isotruss |
2 | 0.453 | 50.05 | 27787.75 | 3996.0 | 6.95 |
| 3 | 0.639 | 50.01 | 20634.40 | 3999.2 | 5.15 | |
| 4 | 0.740 | 50.02 | 18489.23 | 3998.4 | 4.62 |
Table 4.
Permeability test results of 3mm³ unit cell structures.
| Structure | Permeability, k (m/s) | |||
| Test-1 | Test-2 | Test-3 | Test-4 | |
| Octet | 0.0089 | 0.0088 | 0.009 | 0.0090 |
| Isotruss | 0.0167 | 0.0168 | 0.0166 | 0.0168 |
| Diamond | 0.0184 | 0.0188 | 0.0182 | 0.0175 |
| TPMS-Gyroid | 0.0192 | 0.0181 | 0.0186 | 0.0188 |
Disclaimer/Publisher’s Note: The statements, opinions and data contained in all publications are solely those of the individual author(s) and contributor(s) and not of MDPI and/or the editor(s). MDPI and/or the editor(s) disclaim responsibility for any injury to people or property resulting from any ideas, methods, instructions or products referred to in the content. |
© 2025 by the authors. Licensee MDPI, Basel, Switzerland. This article is an open access article distributed under the terms and conditions of the Creative Commons Attribution (CC BY) license (http://creativecommons.org/licenses/by/4.0/).
Copyright: This open access article is published under a Creative Commons CC BY 4.0 license, which permit the free download, distribution, and reuse, provided that the author and preprint are cited in any reuse.


