
Submitted:
30 July 2024
Posted:
30 July 2024
You are already at the latest version
Abstract
The dynamic landscape of 3D printing has experienced a notable surge in the development of diverse filaments tailored for a wide range of applications in medicine. This experimental study thoroughly examines the mechanical properties of nine popular 3D printer filaments, namely PLA, ABS, HIPS, PETG, PA, Carbon Fiber, Ceramic, PMMA, and Metal composite. Focusing on key aspects such as tensile strength and compressive tests, the study delves into the intricate mechanical characteristics of these 3D printer filaments. In addition to the mechanical properties, the study provides a comprehensive exploration of essential filament attributes, including melting point, bed temperature requirements, and density of nine different filament properties. Furthermore, the study addresses crucial considerations in material selection for different applications. Through insightful comparisons, the article illuminates the advantages and limitations of various available filaments within the realm of applications. This study serves as a valuable resource, offering nuanced insights for researchers, engineers, and medical professionals seeking a deeper understanding of the mechanical characteristics of 3D printer filaments and their potential applications.
Keywords:
Mechanical Properties
; Polymers
; 3D Printing
; Additive manufacturing
; CAD Design
; Printing Filament Materials
; Accuracy
Introduction
3D printing has emerged as an innovative manufacturing technology intersecting various disciplines such as materials science, computing, mathematics, etc. This technology has proven to be highly advantageous for the various manufacturing industries, bringing substantial convenience [1] to creating complex geometries. Additive manufacturing, characterized by its ability to construct objects layer by layer, offers the additional benefits of generating lightweight structures at reduced cost [2]. Among the various additive manufacturing methods, Fused Deposition Modelling (FDM) is prominent, incorporating thermoplastic materials like polylactic acid (PLA), polyethylene terephthalate glycol (PETG), polycarbonate (PC), and acrylonitrile butadiene styrene (ABS) through an extrusion nozzle. FDM stands out as the most common technique in additive manufacturing due to its economic viability, user-friendly nature, compatibility with multiple materials, and high processing speed, outperforming traditional manufacturing methods [3,4]. Presently ABS [5] and PLA [6] dominate the landscape of FDM technology. Scholars have extensively published articles encompassing mechanical properties tests, tensile and torsion tests, and measurements of the elastic mechanical properties of materials.
Polylactic acid (PLA) is the most extensively researched and utilized biodegradable aliphatic polyester in material studies. Its widespread adoption in various applications, both in medicine and industry, makes PLA a leading biomaterial, replacing conventional petrochemical-based polymers. The mechanical and physical properties influencing stability, processability, degradation, immiscibility with other polymers, aging, and recyclability are crucial factors determining PLA's suitability for specific applications [7]. Acrylonitrile butadiene styrene (ABS) is an impact-resistant engineering thermoplastic and amorphous polymer composed of three monomers: acrylonitrile, butadiene, and styrene. ABS is a versatile material with diverse applications, possessing desirable physical properties, including high rigidity, good impact resistance even at low temperatures, excellent insulating properties, good weldability, and abrasion and strain resistance [8]. Requirements for ABS can be classified into four main categories: chemical, mechanical, electrical, and thermal characteristics. Material extrusion is a widely used method with its advantages of simplicity, lower manufacturing costs, fast processing, and the ability to process a wide range of thermoplastics with complex structures. High-impact polystyrene (HIPS), a low-cost polymer with high dimensional stability and ease of fabrication, painting, and connection, finds commercial use in the pre-production of prototypes [9]. Polyethylene terephthalate glycol (PETG), a miscible and transparent thermoplastic, exhibits strong tensile properties, high ductility, and resistance to heat and chemical insults. PETG is a popular choice for 3D printing due to its versatile manufacturing modalities. Nylon (PA), a synthetic material widely used in various industrial fields, is valued for its versatility as an engineering plastic that can be easily transformed into fibres, films, and moulded parts. With biocompatible characteristics, PA is widely used in medical applications such as sutures, catheters, and dentures [10]. Known for superior mechanical properties, including tensile strength, flexibility, and impact resistance, as well as chemical and corrosion resistance, PA stands out as a polymer of significance [11]. Carbon Fiber with PLA composite emerges as a cost-effective alternative to more expensive materials like Titanium. This composite exhibits higher thermal resistance and better impact energy absorption compared to traditional photopolymers used in 3D printing. The process parameters for Fused Deposition Modelling (FDM) of CF-reinforced plastic composites mirror those used in FDM of pure plastic 3D printing materials [12,13]. Polymethylmethacrylate (PMMA), an FDA-approved synthetic biomaterial, finds widespread use in fabricating reconstructive structures, including dental implants and implants for craniofacial defects. Additionally, PMMA serves as bone cement to remodel lost bone and affix implants [14,15,16]. The development of new metal/polymer composite filaments for FDM processes aims to observe the thermo-mechanical properties of these filaments. Variations in printing parameters, such as temperature and fill density, were explored to understand their effects on the tensile strength of the final product manufactured through the FDM process [17].
Dimensional accuracy is usually addressed in manufacturing processes to test if the parts will comply with dimensional requirements. [18]. For additively manufactured parts, for example, in selective laser sintering (SLS), Islam et al. [19] found that the dimensions in the xy plane were undersized, while those in the z direction were oversized. In FFF processes with polylactic acid (PLA), Vidakis et al. [20] reported that bed temperature and nozzle temperature had the most significant effect on the dimensional accuracy of the parts. At the same time, layer thickness and infill density were the most influential parameters on porosity. In a similar work with ABS, the same authors observed that dimensional accuracy mainly depended on bed temperature and print speed, and porosity was influenced by infill density and raster angle [21].
With different materials available in the inventory, it is difficult to make decisions concerning selecting a material to suit a particular application. This study aims to experiment with and describe the characteristics of commonly available materials in FDM technology and understand their mechanical properties to make a decision about their usage in various applications.
Materials and Methods
An experimental study was conducted at the Surgical Innovation Laboratory, JPNATC, AIIMS, New Delhi, with Reconstructive Healthcare Solutions as the technical support partner to test 9 different materials on two standardized designs for their mechanical properties. In this study, two different standard specimens were made in CAD (Computer Aided Design) using SolidWorks software and exported to a .stl file to be printed in different materials for measuring the tensile and compressive strength. ASTM D638 designed the 3D model in Fusion 360. 3D printing was done in 9 different materials using slicer software Simplify 3D in the FDM printer WASP 2040. Temperature of these different filaments vary for all brands. In Table 1. temperature range has been mentioned for accurate printing [11,13,16,17,23,24]. Different materials were printed with the temperature as shown in Table 1. The nozzle diameter was 0.4 mm, and the layer height of 0.2 mm was set up, which is the primarily common setting for economical additive manufacturing with 100% infill. The printing properties of the different materials are shown in Table 1.
The temperature fluctuation during the printing process is illustrated, highlighting that the highest and lowest temperatures necessary for printing are associated with PA and PLA filaments, respectively. It is noteworthy that higher temperature values result in increased electric power consumption. Table 1, provides details on bed temperature, indicating that the maximum temperature is 115 degrees Celsius, attributed to HIPS filament, while the minimum bed temperature of 50 degrees Celsius corresponds to PLA filament.
The density of the filament varies from material to material. PA has the maximum density, and ABS and HIPS filaments have the minimum density. Out of the Nine(9) mentioned filaments, PA's density is 1520 kg/m3, while ABS and HIPS's density is 1030 kg/m3.
Figure 2 Shows the side wall of specimens at different printing temperatures, optimum printing temperature of PLA filament that yielded the best tensile behaviour while maintaining its dimensional accuracy was when T=220°C, and bed temperature of 50°C [25]. Tensile Strength and peak load carrying capacity of ABS was maximum at nozzle temperature of 260 C and bed temperature of 100 C [26,27]. Based on the study found in parameter used for FDM printing of pure HIPS is given as, 250C of nozzle temperature and 100C of bed temperature [28].
Similarly, bed temperature and Nozzle temperature of remaining filaments, PETG [23], PA [11], Carbon Fibre [13], Ceramic [24], PMMA [16], Metal composite [17] , as shown in Table 1. respectively,
The nine specimens underwent testing using the UTM (Universal Testing Machine) Figure 3, Instron 25kN UTM [29], encompassing both tensile and compressive assessments. The dimensions of the specimens for these tests adhered to the standards outlined in ASTM D638 [30] (Type 1 flat sheet dog bone) and ASTM D695 [31].
Ultimate tensile strength is the maximum stress that a material can withstand while being stretched or pulled before breaking. It is usually found by performing a tensile test and recording the engineering stress versus strain. The highest point of the stress–strain curve is the ultimate tensile strength, which has stress units. The equivalent point for the case of compression, instead of tension, is called the compressive strength.
In Figure 4.a and Figure 4.b, the printed part, CAD design, and specimen dimensions for tensile and compressive testing are illustrated, respectively. The UTM machine, capable of measuring materials in tension, compression, and young’s modulus, was employed with a focus on tensile and compressive testing. A constant Z-axis movement was maintained at a speed of 5 mm/min for both tensile and compressive tests [32,33].
Comparison of Printed Part with CAD Design
Original CAD design has the dimension of 20mm diameter and 40mm thickness.
The infill pattern adopted was rectilinear, featuring angles of −45° and 45° for alternating layers. This configuration involved the use of parallel filaments with a raster angle of 45° for one layer, followed by parallel filaments with a raster angle of −45° for the subsequent layer, resulting in a 90° angle between them. The infill ratio was set at 100%, accompanied by a wall count of 5 layers. The nozzle diameter utilized was 0.4 mm. Each specimen was printed individually, positioned at the centre of the building platform. The printing duration for the bone-shaped specimen was approximately 55 minutes, while that for the cylinder-shaped specimen was around 1 hour.
Figure 5a comprises nine images illustrating discrepancies in dimensions compared to the CAD-designed part, with each printed component exhibiting distinct measurements. Table 2 provides a breakdown of the percentage error observed in the printed parts. Negative values indicate dimensions smaller than those of the actual CAD model, while positive values signify dimensions exceeding the original CAD dimensions. Graphically representing the percentage error, Figure 5b visually depicts the variations. The error percentage was meticulously assessed using a vernier calliper, with the least count of 0.01mm [34]. It is found that maximum and minimum error was of -1.75 % (PMMA) and -0.25%(ABS).
Results and Discussion
3.2. Tensile Strength
One specimen was made for each type of test, a total of 9 parts were printed for measuring tensile strength. For statistical evaluation, software office 365 excel was used. Figure 6 shows the images of nine specimen (Figure. 6a ABS, Figure 6b. Carbon Fiber, Figure 6c ceramic, Figure 6d HIPS, Figure 6e Metal Composite, Figure 6f PA, Figure 6g PETG, Figure 6h PLA, Figure 6i PMMA), respectively, which are clamped with holder on both ends of specimen. The specimen was then locked using allen bolt on a specimen holder. Initially at rest position the setup was taken to zero to avoid any error while calculating the values. The data was saved to the excel file. The breaking point of all the samples was different depending on the properties the filament. In each case the nine samples of filament material were subjected to the tensile tests. The tensile test results achieved for different filament material are shown in Table 3.
Young's modulus tells us how well a material can handle stretching or squeezing. It's like a measure of the material's flexibility. Tensile strength, also known as ultimate tensile strength, measures how much force a sample can take before breaking. We calculate it by dividing the maximum force the sample can withstand by its cross-sectional area. In our case, we've kept the specimen's area the same for all samples. The value of the ultimate tensile strength is between 9.18 and 0.93 MPa. Carbon Fiber shows ultimate tensile strength value of 38.43 MPa and PA shows the least ultimate tensile strength value of 9.18 MPa. Similarly, Carbon Fiber shows the maximum young’s modulus of 0.91 GPa while PA has 0.062 GPa with least young’s modulus.
Figure 7a &7b shows the graphically representation of the young’s modulus and ultimate tensile strength.
In this experimental study, graph was drawn from the excel data of nine different filaments, namely ABS, PLA, PETG, PMMA, PA, HIPS, ceramic, carbon fibre, and metal composite. The experimental results were graphically represented, with the x-axis denoting distance by which specimen is expanded which is also position change from rest position in mm and the y-axis representing the applied axial load in newtons (figure 8). Notably, the analysis revealed varying breaking times among the tested filaments, demonstrating their diverse mechanical behaviours under tensile stress. Polyamide (PA) exhibited a noteworthy characteristic, as it required an extended duration before experiencing failure, more than 50mm of elongation, signifying its superior resistance to tensile forces. Conversely, the metal composite filament displayed the shortest breaking time at an elongation of 1.6mm from zero position, suggesting its comparatively reduced tensile strength (Figure 8). These findings contribute valuable insights into the mechanical properties of different filaments, offering valuable information for applications in various fields such as manufacturing, engineering, and material science. As travel speed was constant throughout the testing process, the distance travel is directly proportional to the time taken to break the specimen. The breaking time of the filaments is shown below,
PA > PMMA > HIPS > Carbon Fibre > PLA > PET-G > Ceramic >ABS > Metal composite
3.3. Compressive Testing
In this comprehensive analysis, graphs were generated using Excel data for nine distinct filaments: ABS, PLA, PETG, PMMA, PA, HIPS, Ceramic, Carbon Fiber, and Metal Composite. The experimental findings were visually depicted, with the x-axis indicating time in seconds and the y-axis representing the applied tensile load in newtons.
For each testing, a single specimen was utilized, resulting in a total of nine parts printed for compressive testing. Statistical evaluation was conducted using Microsoft Office 365 Excel.
Figure 9 illustrates images of the nine specimens (Figure 9a: ABS, Figure 9b: Carbon Fiber, Figure 9c: Ceramic, Figure 9d: HIPS, Figure 9e: Metal Composite, Figure 9f: PA, Figure 9g: PETG, Figure 9h: PLA, Figure 9i: PMMA), positioned between flat surfaces on both ends of the specimen. The specimens were freely positioned due to their flat surfaces, with an upper and lower compression platen fixture utilized. The setup was initially zeroed to eliminate any errors during calculations, and the data was saved in an Excel file.
The breaking point of each sample varied depending on the filament's properties. Nine samples of filament materials were individually subjected to compressive tests, with the results tabulated in Table 4. The compressive stress values [MPa] ranged from 52.12 to 70.13, while Young’s Modulus values [GPa] for all nine specimens ranged from 0.24 GPa to 1.93 GPa. PA exhibited the highest compressive stress value of 70.13 MPa, while PMMA displayed the lowest stress value of 32.7 MPa. Similarly, PLA demonstrated the highest Young’s Modulus value of 1.93 GPa, while PA had the lowest at 0.23 GPa.
Figure 10a and 10b depict graphical representations of the stress and applied load, respectively.
Notably, the analysis revealed varying breaking times among the tested filaments, demonstrating their diverse mechanical behaviours under compressive stress. Polyamide (PA) exhibited a noteworthy characteristic, as it required an extended duration before experiencing failure, signifying its superior resistance to compressive forces. Conversely, the Metal Composite filament displayed the shortest breaking time, suggesting its comparatively reduced compressive strength (Figure 11). These findings contribute valuable insights into the mechanical properties of different filaments, offering valuable information for applications in various fields such as manufacturing, engineering, and material science.
Conclusion
The investigation into the mechanical properties of various filaments using Fused Deposition Modelling (FDM) printers has provided valuable insights for diverse applications in diverse fields such as manufacturing, engineering, and material science. The filaments including ABS, PLA, PETG, PMMA, PA, HIPS, Ceramic, Carbon Fiber, and Metal Composite, exhibited distinct characteristics in response to tensile and compressive stresses. Table1. demonstrated different printing temperature for different filaments. Figure 2 concluded the role of optimum bed temperature to obtain an accurate and well finished base layer of a printed part.
The FDM printers employed polymer filaments composed of thermoplastic polymers, allowing for melting and softening during heating and subsequent recovery of their original properties upon cooling. Notably, the tensile testing results revealed PLA to possess superior resistance to tensile forces, exhibiting an extended breaking time compared to other filaments (table 3).
The study further detailed the print parameters for each filament, including temperature, nozzle diameter, printing speed, infill density, platform temperature, layer thickness, filament diameter, and density. The investigation considered variations in temperature, with PA requiring the highest print temperature and PLA the lowest (table 1). Additionally, the density of filaments varied, with PA having the highest density and ABS and HIPS having the lowest.
The research included tensile and compressive testing of standard specimens designed through CAD, and the 3D printing process was executed using a FDM printer. The comparison of 3D printed parts with the original CAD design revealed minimal percentage errors, with the maximum and minimum errors observed in PMMA (-1.75%) and ABS (+0.25%), respectively.
Tensile testing results were obtained using a Universal Testing Machine (UTM), showcasing variations in young’s modulus and ultimate stress among the different filaments. PLA exhibited the highest resistance to tensile stress exhibiting an extended breaking time compared to other filaments (table 3), while the PA showed the lowest resistance. Compressive testing results similarly demonstrated the diverse mechanical behaviours of the filaments, with PLA displaying superior resistance to compressive forces and the PMMA exhibiting reduced compressive strength (table 4).
Young's Modulus aids in understanding the elasticity of materials and how materials with varying elastic properties can be applied in specific applications. In this study, the young's modulus for tensile strength of PLA is found to be maximum, while that of PA is minimum. This suggests that PLA exhibits greater stretchability and elasticity compared to other materials. Conversely, since PA has the lowest Young's modulus, it can be utilized to fabricate strong components. Similarly, in terms of compressive strength, PLA demonstrates the maximum elasticity while PA exhibits the minimum. Consequently, PLA can undergo greater deformation under compression compared to PA and other materials. If required printing part needs to be flexible, then PA can be considered due to its greater young’s modulus value.
In conclusion, this study contributes valuable data on the mechanical properties of diverse filaments, providing a foundation for informed material selection in additive manufacturing processes. The findings have implications for applications where specific mechanical properties are crucial, guiding practitioners in optimizing filament choices for various engineering and manufacturing needs. We can determine the most suitable material for a specific application based on research, considering the type of part to be printed and its intended use.
Declarations
Ethical Clearance was not required in this study as this did not involve any human or animal subject. Patient consent was not needed in this study as it did not involve human subjects. The authors have no competing interests to influence the results and/or discussion reported in this paper.
Funding
We would like to acknowledge Indian Council of medical research (ICMR) for funding this research as per File no5/3/8/3/2022/MDMS.
Acknowledgement
We want to acknowledge Dr Dinesh Kalyansundaram and m-Pragati Lab at Indian Institute of Technology(IIT) New Delhi for their experimental support.
References
- S. H. Ahn, M. Montero, D. Odell, S. Roundy, and P. K. Wright, “Anisotropic material properties of fused deposition modeling ABS,” Rapid Prototyp J, vol. 8, no. 4, pp. 248–257, 2002. [CrossRef]
- H. Gonabadi, & A. Yadav, and S. J. Bull, “The effect of processing parameters on the mechanical characteristics of PLA produced by a 3D FFF printer”. [CrossRef]
- F. Lupone, E. Padovano, A. Veca, L. Franceschetti, and C. Badini, “Innovative processing route combining fused deposition modelling and laser writing for the manufacturing of multifunctional polyamide/carbon fiber composites,” Mater Des, vol. 193, Aug. 2020. [CrossRef]
- X. Zhang, M. A. Geven, D. W. Grijpma, J. E. Gautrot, and T. Peijs, “Polymer-polymer composites for the design of strong and tough degradable biomaterials,” Mater Today Commun, vol. 8, pp. 53–63, Sep. 2016. [CrossRef]
- D. P. Cole, J. C. Riddick, H. M. Iftekhar Jaim, K. E. Strawhecker, and N. E. Zander, “Interfacial mechanical behavior of 3D printed ABS,” J Appl Polym Sci, vol. 133, no. 30, Aug. 2016. [CrossRef]
- E. Patterson, “Crack Propagation in 3-D Printed PLA: Finite Element Modeling, Test Bed Design, and Preliminary Experimental Results.”.
- S. Farah, D. G. Anderson, and R. Langer, “Physical and mechanical properties of PLA, and their functions in widespread applications — A comprehensive review,” Advanced Drug Delivery Reviews, vol. 107. Elsevier B.V., pp. 367–392, Dec. 15, 2016. [CrossRef]
- M. Ziabka, M. Dziadek, and K. Pielichowska, “Surface and Structural Properties of Medical Acrylonitrile Butadiene Styrene Modified with Silver Nanoparticles,” Polymers 2020, Vol. 12, Page 197, vol. 12, no. 1, p. 197, Jan. 2020. [CrossRef]
- S. A. Sajjadi, F. Ashenai Ghasemi, P. Rajaee, and M. Fasihi, “Evaluation of fracture properties of 3D printed high impact polystyrene according to essential work of fracture: Effect of raster angle,” Addit Manuf, vol. 59, Nov. 2022. [CrossRef]
- M. Shakiba et al., “Nylon—A material introduction and overview for biomedical applications,” Polymers for Advanced Technologies, vol. 32, no. 9. John Wiley and Sons Ltd, pp. 3368–3383, Sep. 01, 2021. [CrossRef]
- M. Tutar, “A Comparative Evaluation of the Effects of Manufacturing Parameters on Mechanical Properties of Additively Manufactured PA and CF-Reinforced PA Materials,” Polymers (Basel), vol. 15, no. 1, Jan. 2023. [CrossRef]
- J. Galos, Y. Hu, A. R. Ravindran, R. B. Ladani, and A. P. Mouritz, “Electrical properties of 3D printed continuous carbon fibre composites made using the FDM process,” Compos Part A Appl Sci Manuf, vol. 151, Dec. 2021. [CrossRef]
- M. Kamaal, M. Anas, H. Rastogi, N. Bhardwaj, and A. Rahaman, “Effect of FDM process parameters on mechanical properties of 3D-printed carbon fibre–PLA composite,” Progress in Additive Manufacturing, vol. 6, no. 1, pp. 63–69, Feb. 2021. [CrossRef]
- D. Bourell et al., “Fused deposition modeling of patientspecific polymethylmethacrylate implants,” Rapid Prototyp J, vol. 16, no. 3, pp. 164–173, Apr. 2010. [CrossRef]
- D. K. Mills, U. Jammalamadaka, K. Tappa, and J. Weisman, “Studies on the cytocompatibility, mechanical and antimicrobial properties of 3D printed poly(methyl methacrylate) beads,” Bioact Mater, vol. 3, no. 2, pp. 157–166, Jun. 2018. [CrossRef]
- Polzin, S. Spath, and H. Seitz, “Characterization and evaluation of a PMMA-based 3D printing process,” Rapid Prototyp J, vol. 19, no. 1, pp. 37–43, 2013. [CrossRef]
- S. Hwang, E. I. Reyes, K. sik Moon, R. C. Rumpf, and N. S. Kim, “Thermo-mechanical Characterization of Metal/Polymer Composite Filaments and Printing Parameter Study for Fused Deposition Modeling in the 3D Printing Process,” J Electron Mater, vol. 44, no. 3, pp. 771–777, Mar. 2015. [CrossRef]
- Buj-Corral and M. Sivatte-Adroer, “Multi-Objective Optimization of Material Removal Rate and Tool Wear in Rough Honing Processes,” Machines, vol. 10, no. 2, Feb. 2022. [CrossRef]
- “III. EXPERIMENTAL WORK.” [Online]. Available: http://web.mit.edu/newsoffice/2011/3d-printing-0914.html,.
- N. Vidakis, C. David, M. Petousis, D. Sagris, N. Mountakis, and A. Moutsopoulou, “The effect of six key process control parameters on the surface roughness, dimensional accuracy, and porosity in material extrusion 3D printing of polylactic acid: Prediction models and optimization supported by robust design analysis,” Advances in Industrial and Manufacturing Engineering, vol. 5, Nov. 2022. [CrossRef]
- Buj-Corral and M. Sivatte-Adroer, “An Experimental Investigation about the Dimensional Accuracy and the Porosity of Copper-Filled PLA Fused Filament Fabrication Parts,” Metals (Basel), vol. 13, no. 9, Sep. 2023. [CrossRef]
- “IannGibsonn· DaviddRosen BrenttStucker Additive Manufacturing Technologies 3D Printing, Rapid Prototyping, and Direct Digital Manufacturing Second Edition.”.
- K. Szykiedans, W. Credo, and D. Osiński, “Selected Mechanical Properties of PETG 3-D Prints,” in Procedia Engineering, Elsevier Ltd, 2017, pp. 455–461. [CrossRef]
- N. A. S. Mohd Pu’ad, R. H. Abdul Haq, H. Mohd Noh, H. Z. Abdullah, M. I. Idris, and T. C. Lee, “Review on the fabrication of fused deposition modelling (FDM) composite filament for biomedical applications,” in Materials Today: Proceedings, Elsevier Ltd, 2019, pp. 228–232. [CrossRef]
- R. Pang, M. K. Lai, K. I. Ismail, and T. C. Yap, “The Effect of Printing Temperature on Bonding Quality and Tensile Properties of Fused Deposition Modelling 3d-Printed Parts,” IOP Conf Ser Mater Sci Eng, vol. 1257, no. 1, p. 012031, Oct. 2022. [CrossRef]
- P. Żur, A. Kołodziej, A. Baier, and G. Kokot, “Optimization of Abs 3D-Printing Method and Parameters,” European Journal of Engineering Science and Technology, vol. 3, no. 1, pp. 44–51, Jan. 1970. [CrossRef]
- Casavola, A. Cazzato, V. Moramarco, and G. Renna, “Mechanical behaviour of ABS-Fused Filament Fabrication compounds under impact tensile loadings,” Materials, vol. 12, no. 8, 2019. [CrossRef]
- M. Sieradzka, J. Fabia, D. Biniaś, T. Graczyk, and R. Fryczkowski, “High-impact polystyrene reinforced with reduced graphene oxide as a filament for fused filament fabrication 3D printing,” Materials, vol. 14, no. 22, Nov. 2021. [CrossRef]
- “Out of Production 5900 Series Universal Testing Systems | Instron.” Accessed: Mar. 07, 2024. [Online]. Available: https://www.instron.com/en/products/testing-systems/universal-testing-systems/low-force-universal-testing-systems/5900-series.
- “Standard Test Method for Tensile Properties of Plastics 1”. [CrossRef]
- “Standard Test Method for Compressive Properties of Rigid Plastics 1”. [CrossRef]
- S. Anand Kumar and Y. Shivraj Narayan, “Tensile testing and evaluation of 3D-printed PLA specimens as per ASTM D638 type IV standard,” in Lecture Notes in Mechanical Engineering, Pleiades journals, 2019, pp. 79–95. [CrossRef]
- J. Pernica, M. Sustr, P. Dostal, M. Brabec, and D. Dobrocky, “Tensile Testing of 3D Printed Materials made by Different Temperature,” Manufacturing Technology, vol. 21, no. 3, pp. 398–404, 2021. [CrossRef]
- “EXPERIMENT EXPERIMENT EXPERIMENT EXPERIMENT EXPERIMENT.”.
Figure 2.
Side wall of specimens at different printing temperatures. (a) 180°C, (b) 190°C, (c) 220°C. [25].
Figure 2.
Side wall of specimens at different printing temperatures. (a) 180°C, (b) 190°C, (c) 220°C. [25].
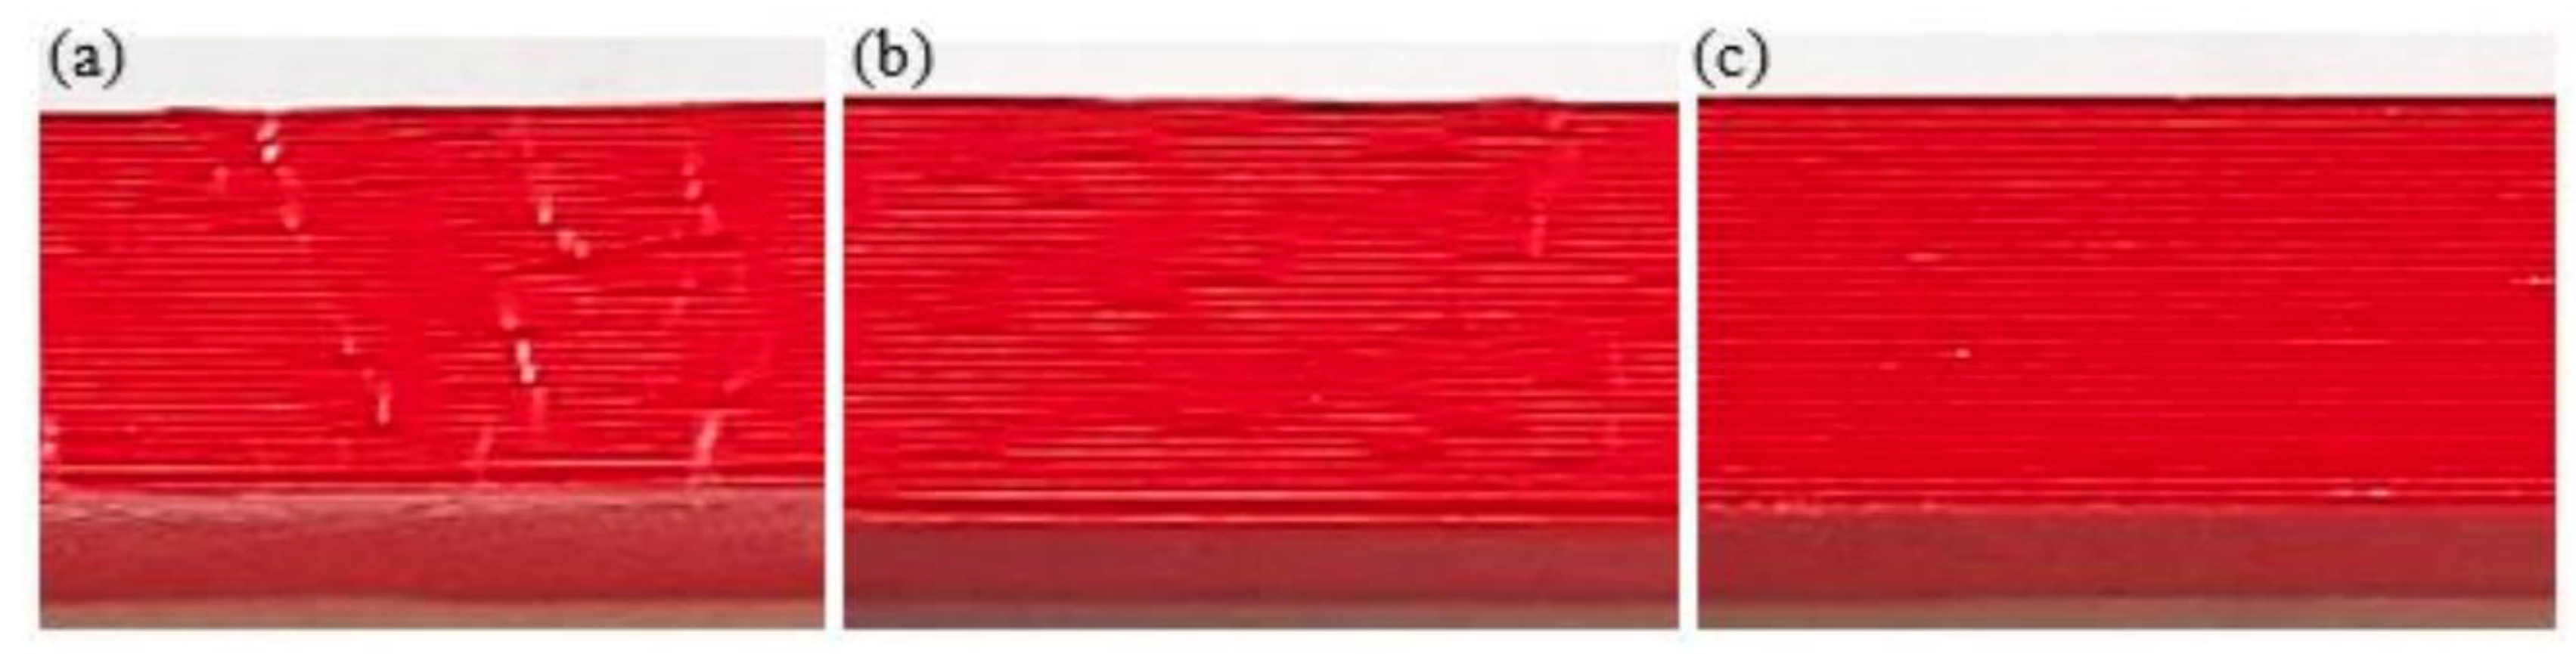
Figure 3.
Instron 25kN UTM.
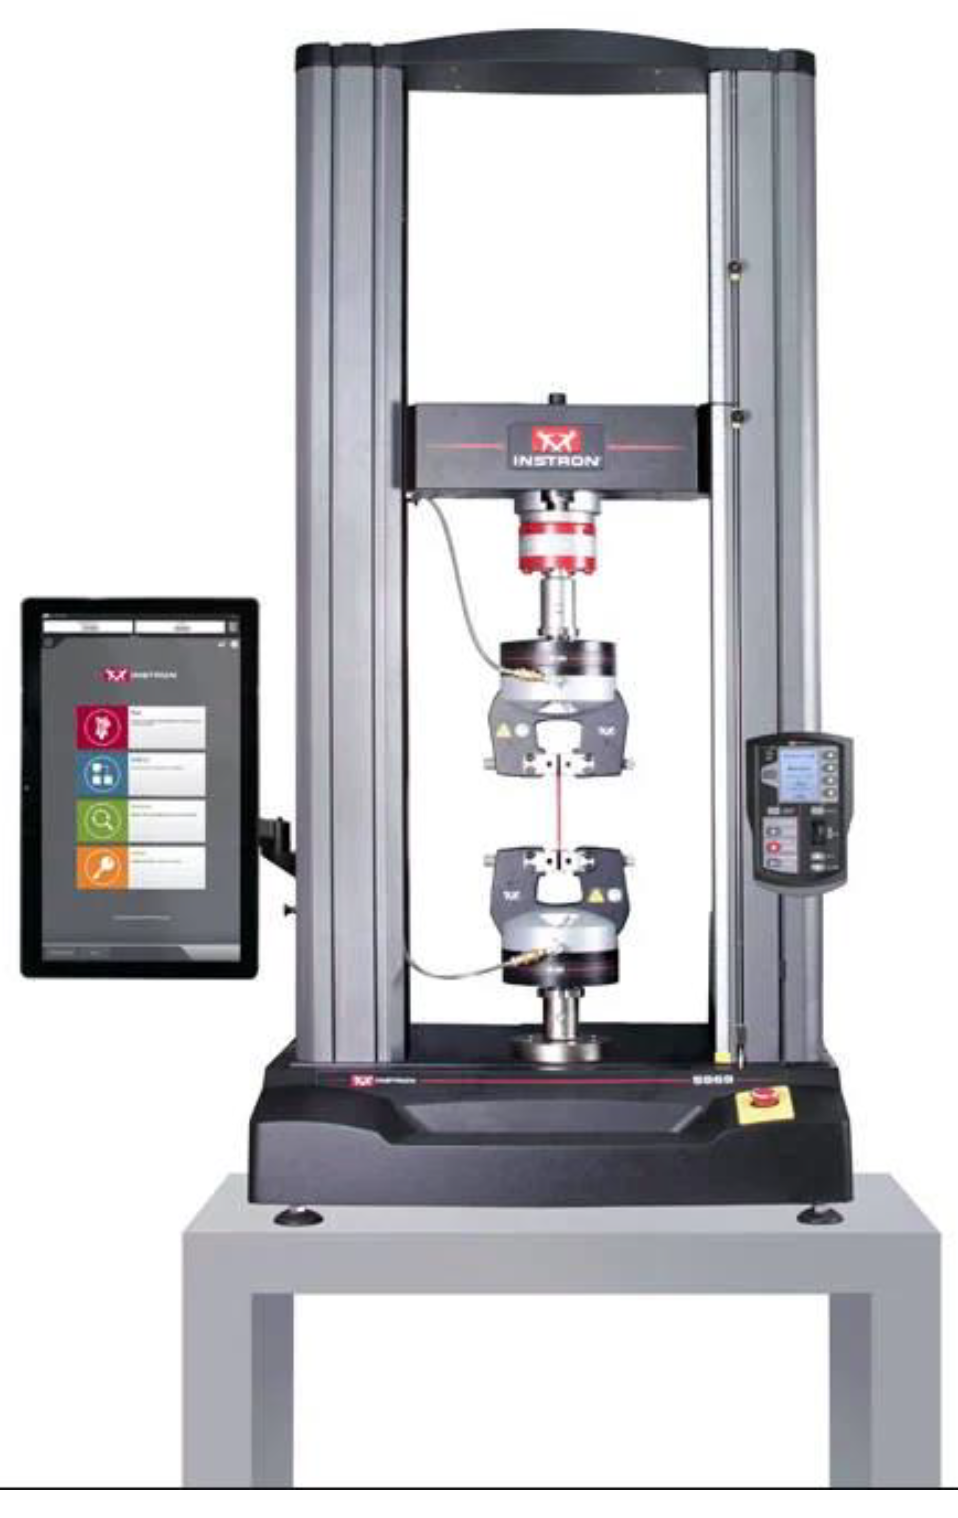
Figure 4.
(a) Tensile specimen. (b) Compressive specimen.
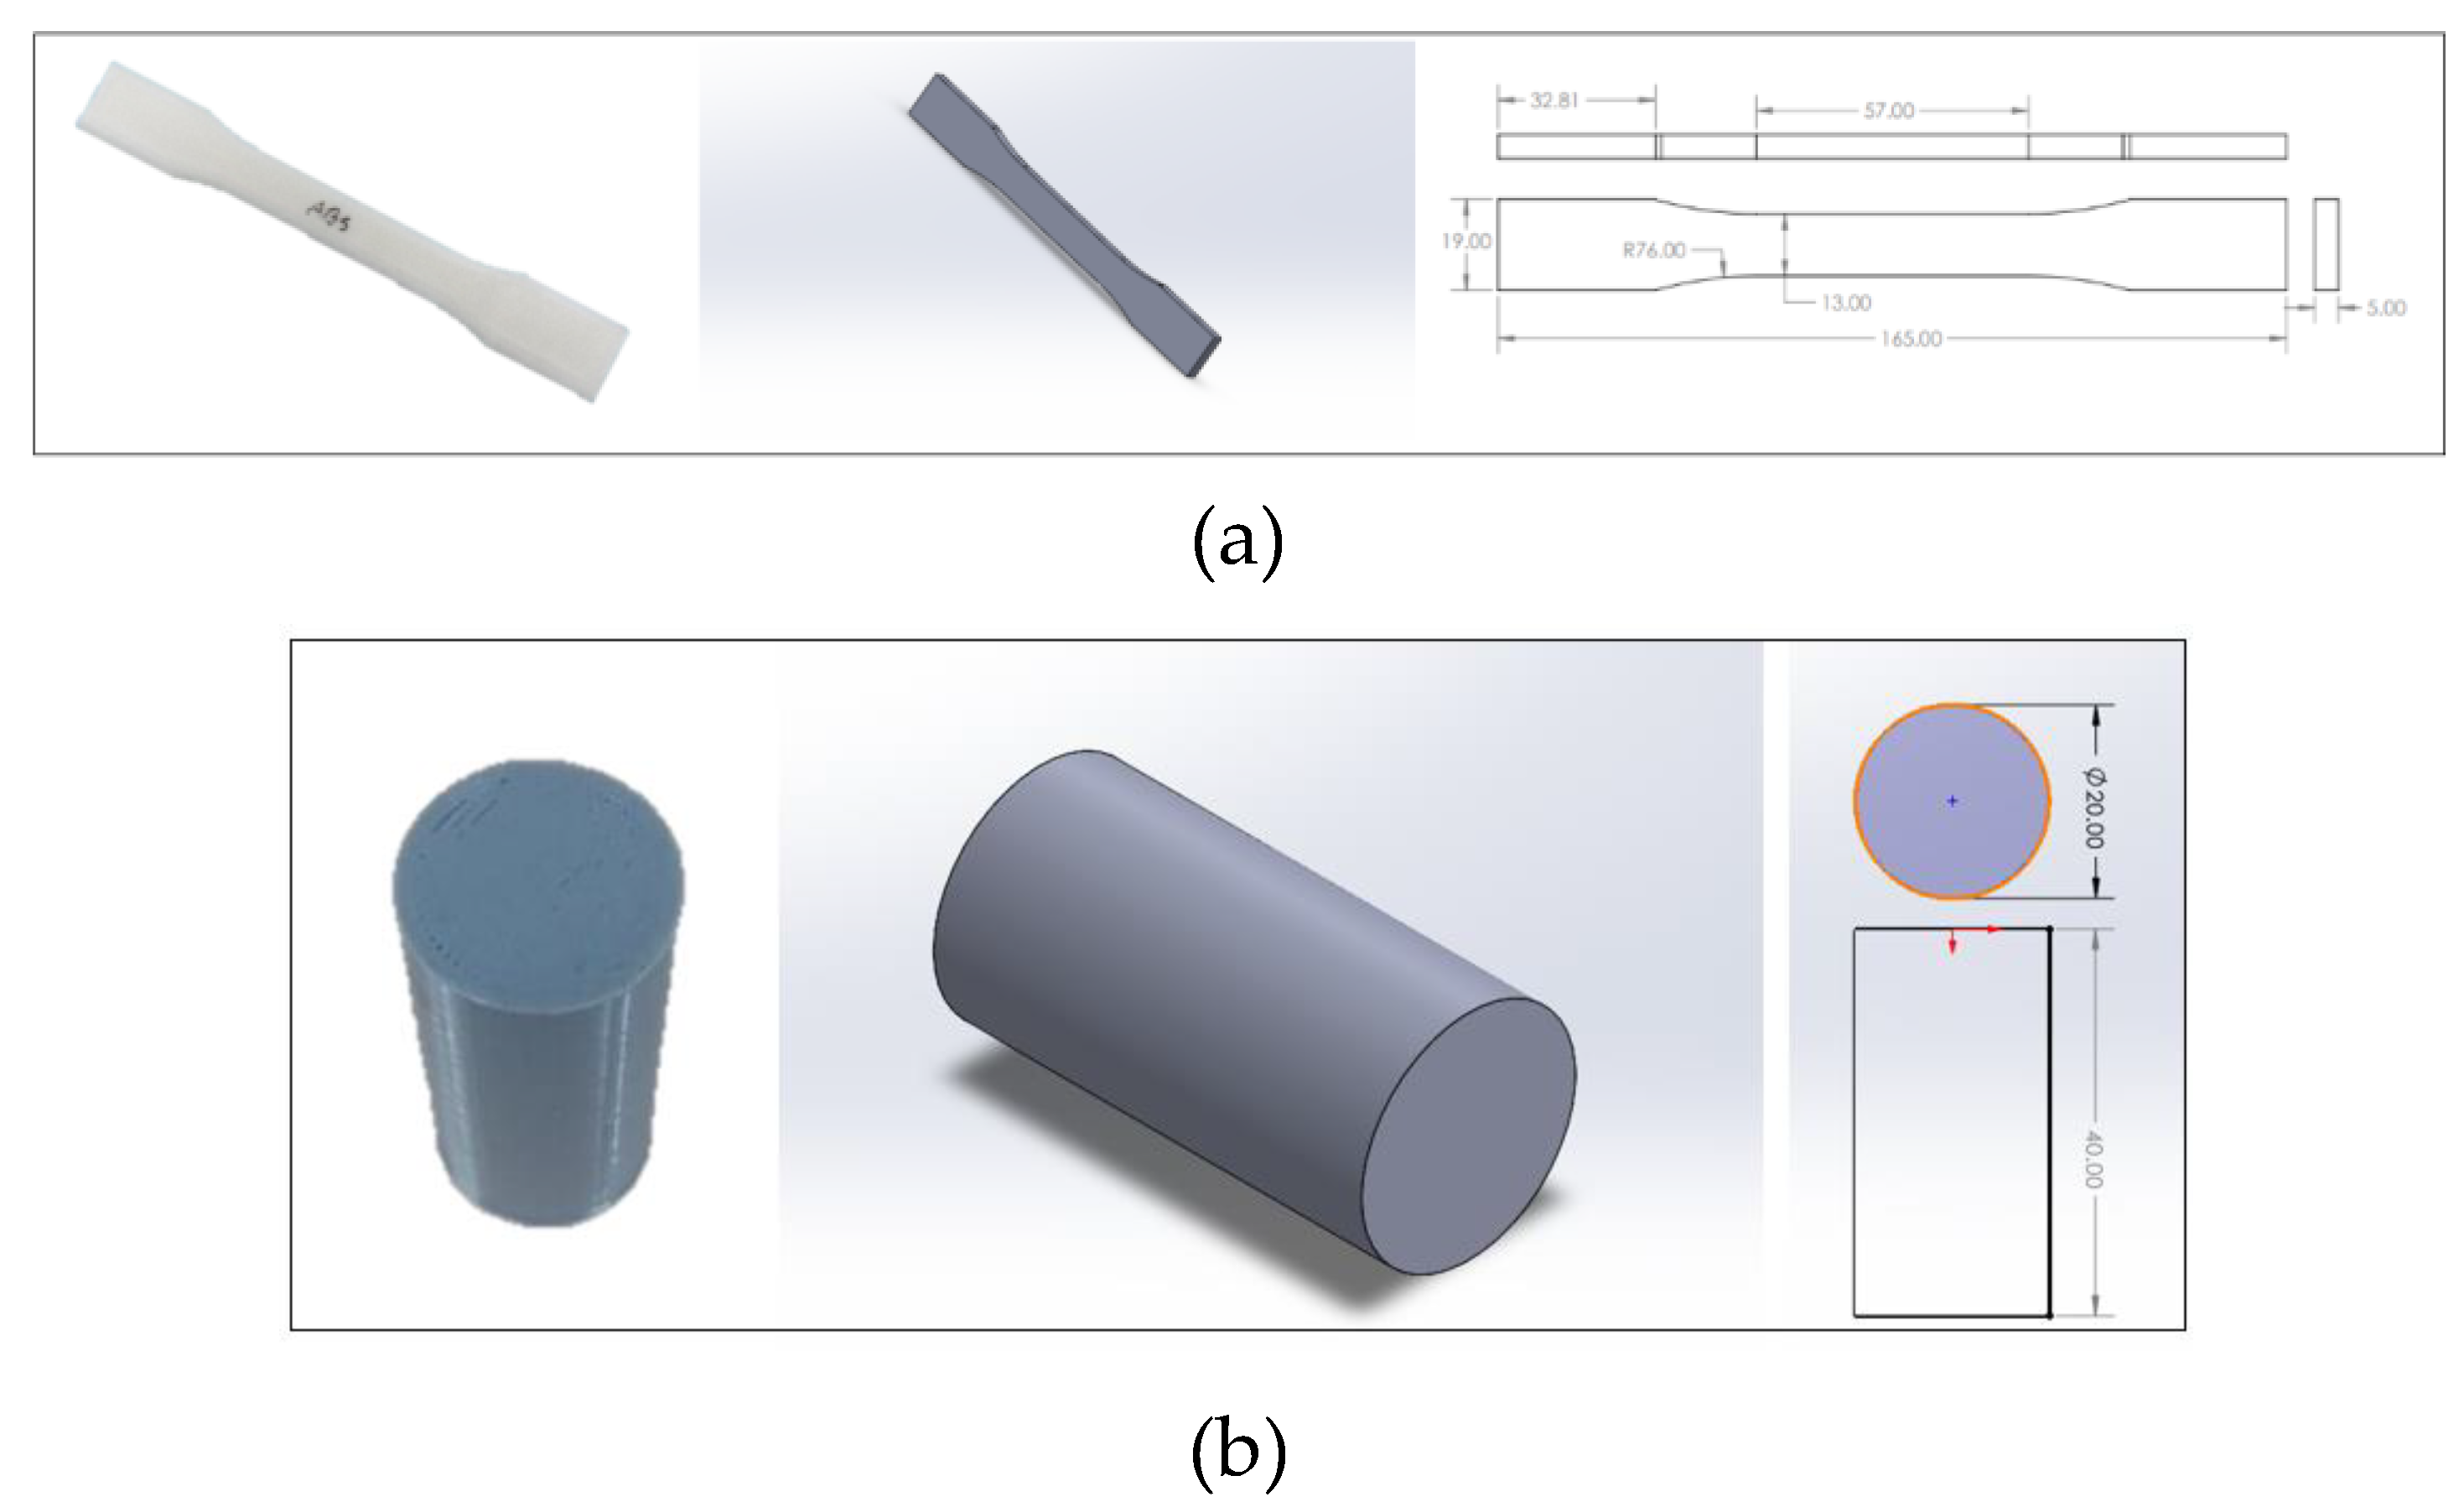
Figure 5.
(a) Comparison of 3d Printed part with original CAD design. (b) Percentage error as compared to actual CAD dimensions.
Figure 5.
(a) Comparison of 3d Printed part with original CAD design. (b) Percentage error as compared to actual CAD dimensions.
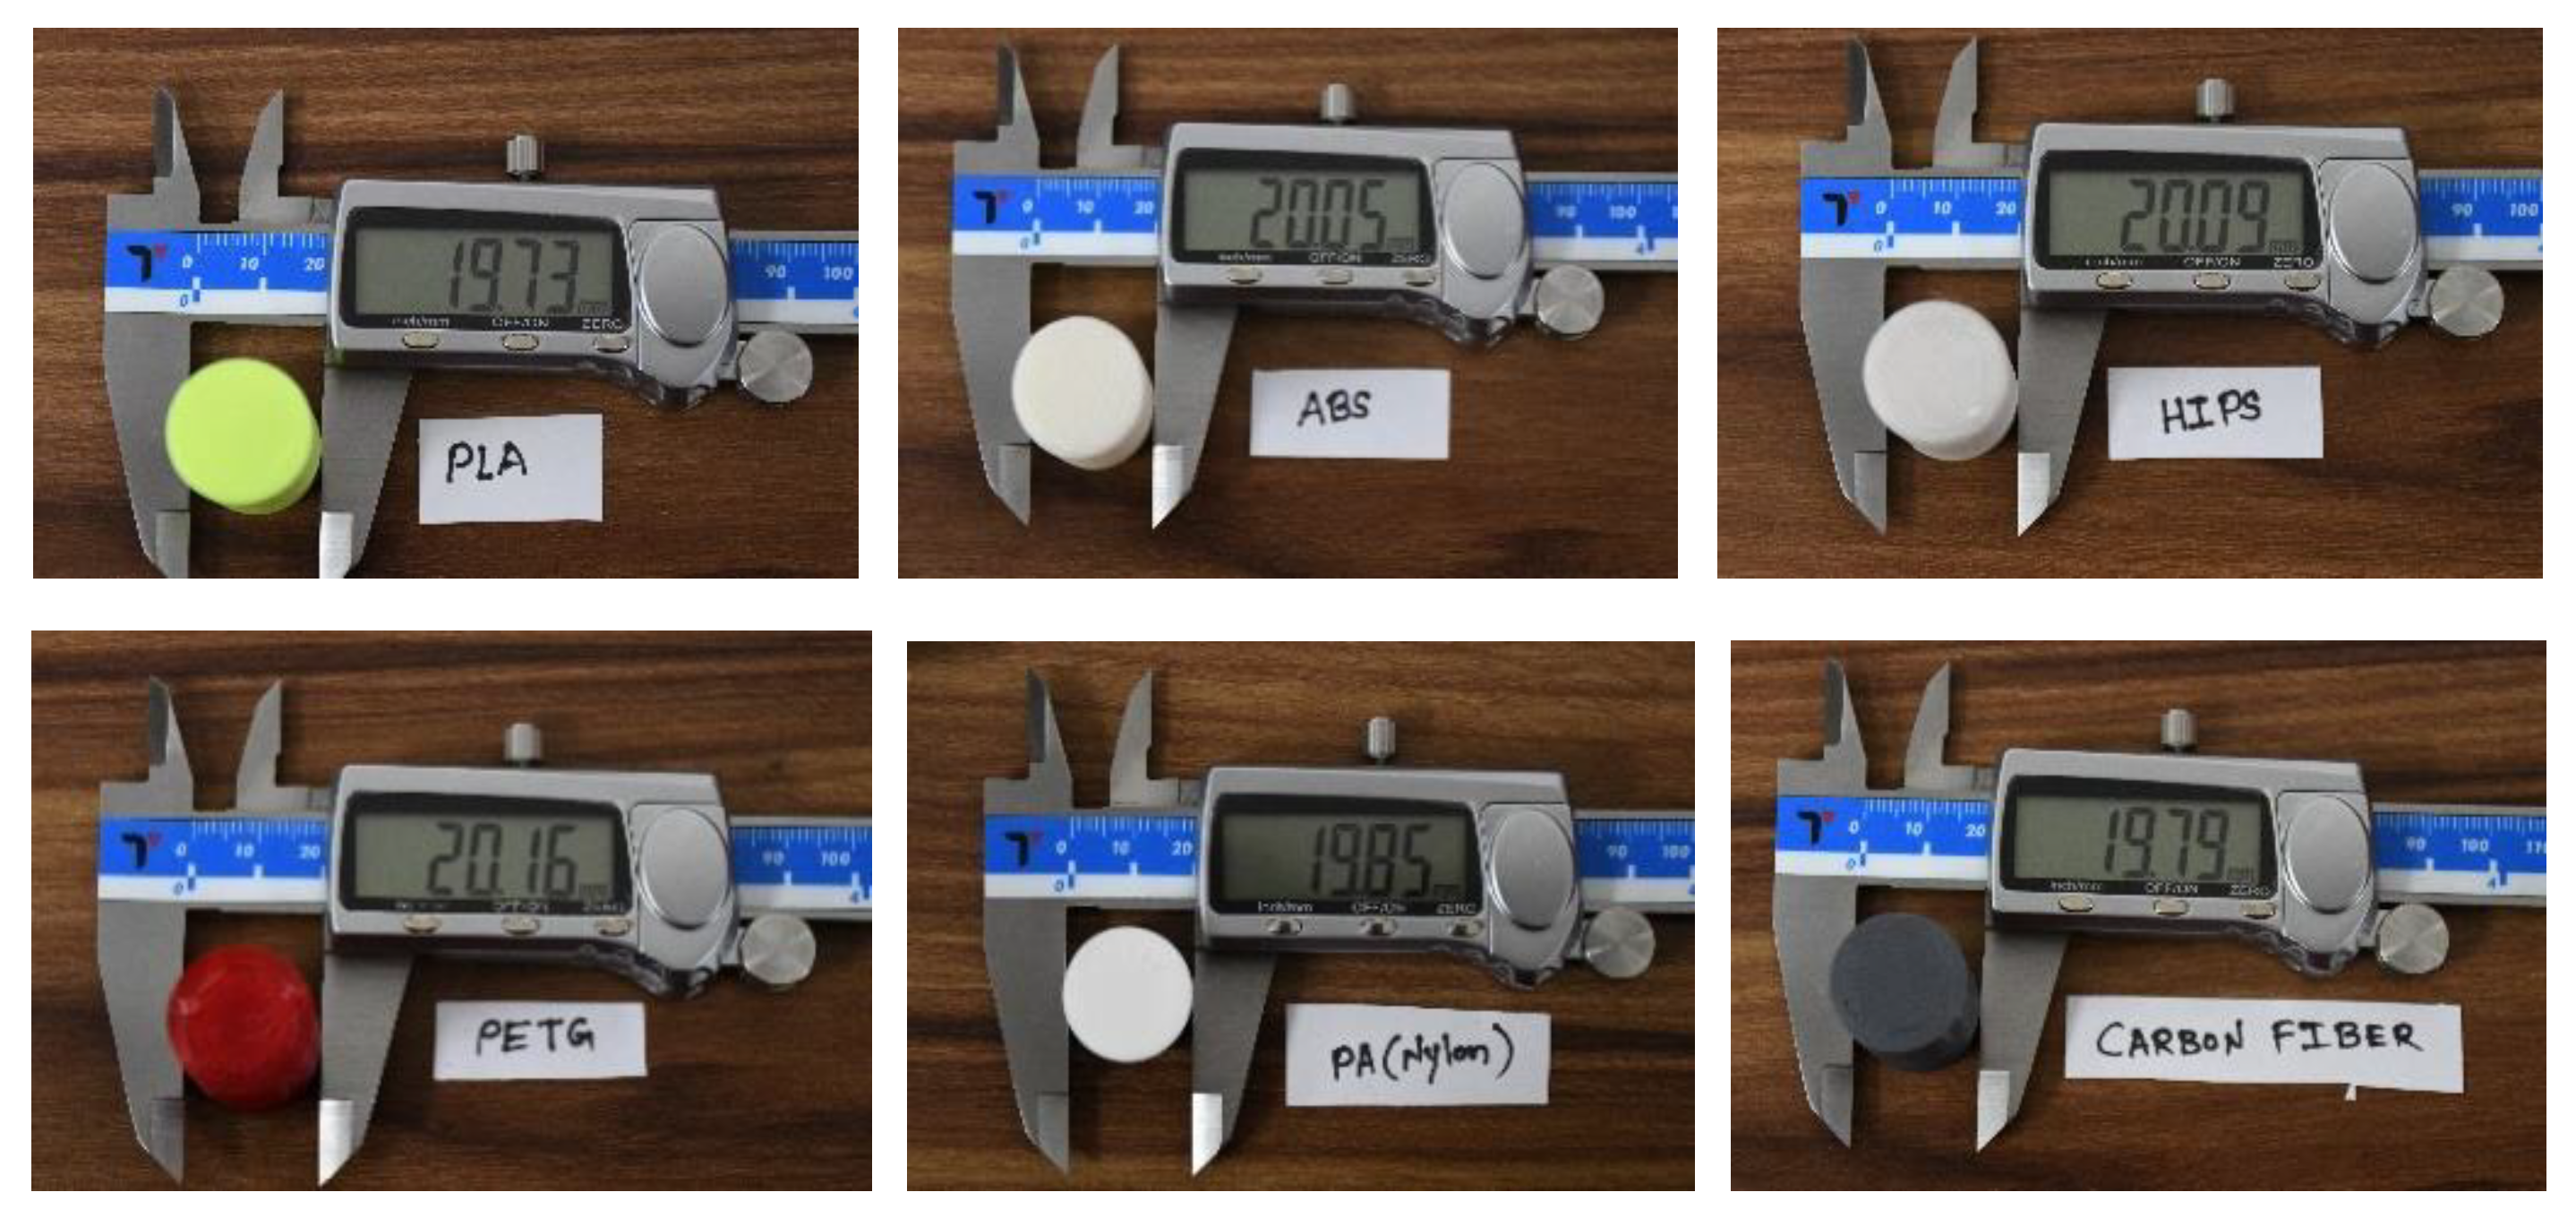
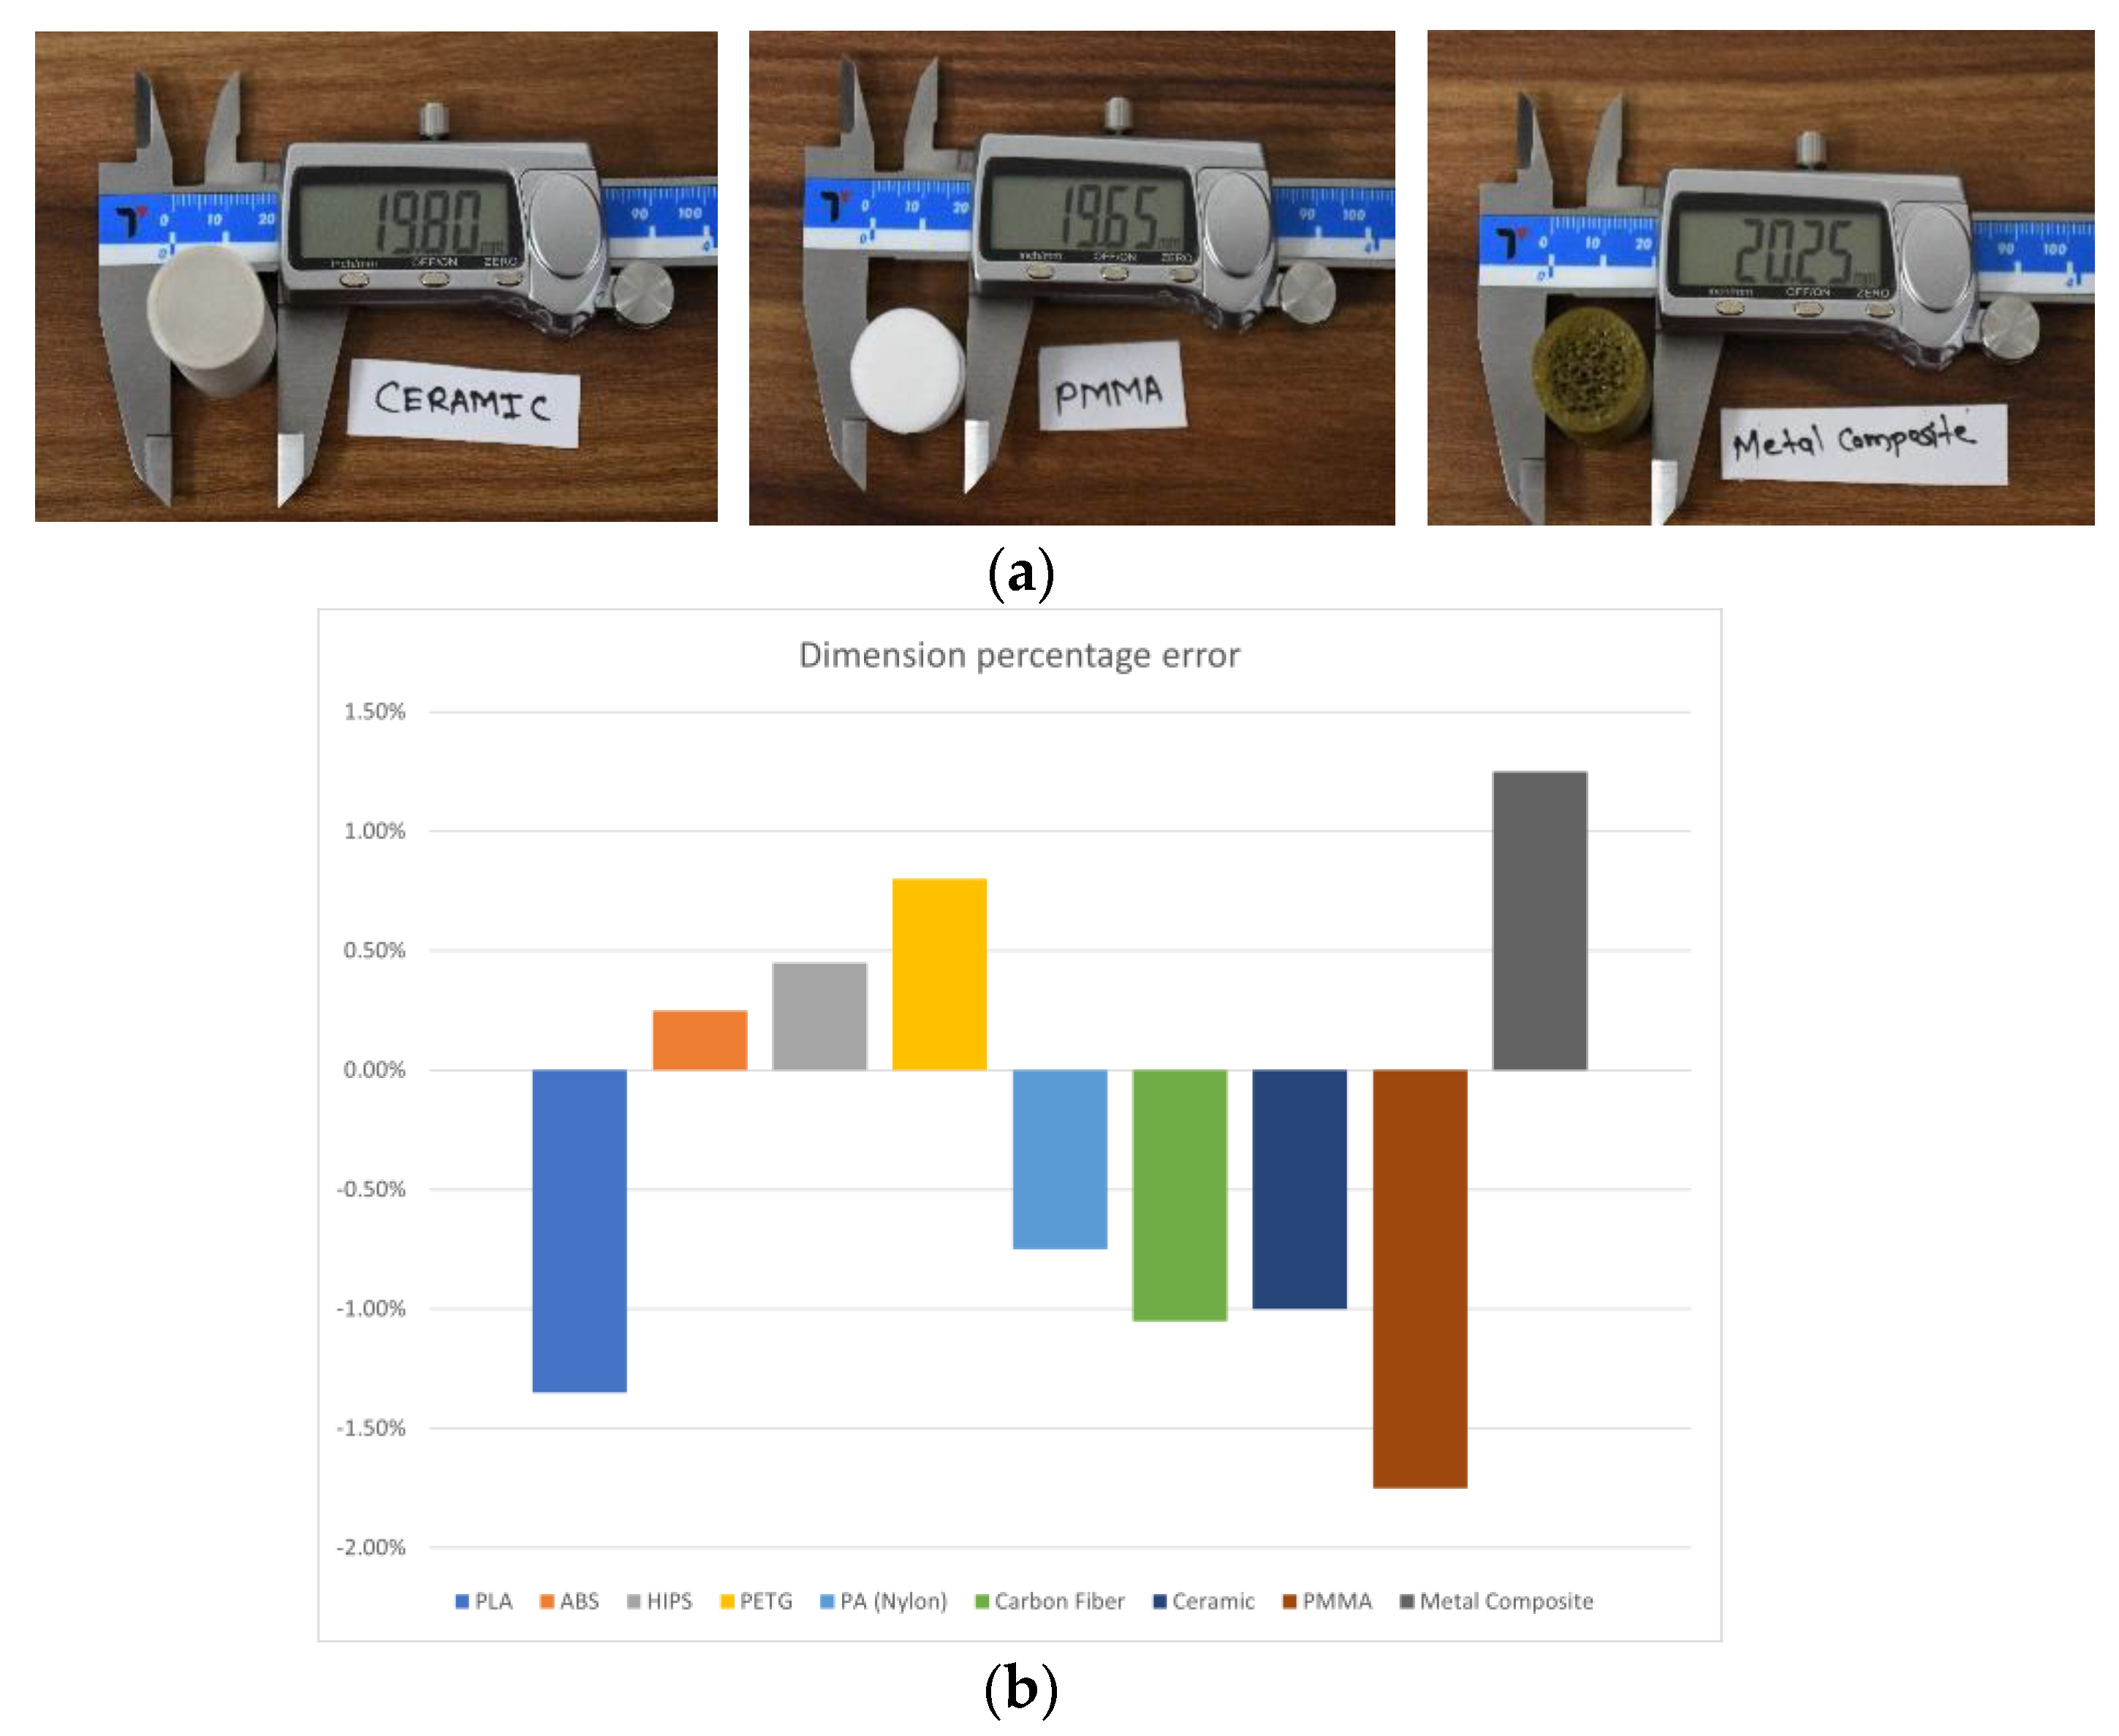
Figure 6.
Tensile testing under UTM machine of Nine different filaments. (Figure. 6a ABS, Figure 6b. Carbon Fiber, Figure 6c ceramic, Figure 6d HIPS, Figure 6e Metal Composite, Figure 6f PA, Figure 6g PETG, Figure 6h PLA, Figure 6i PMMA).
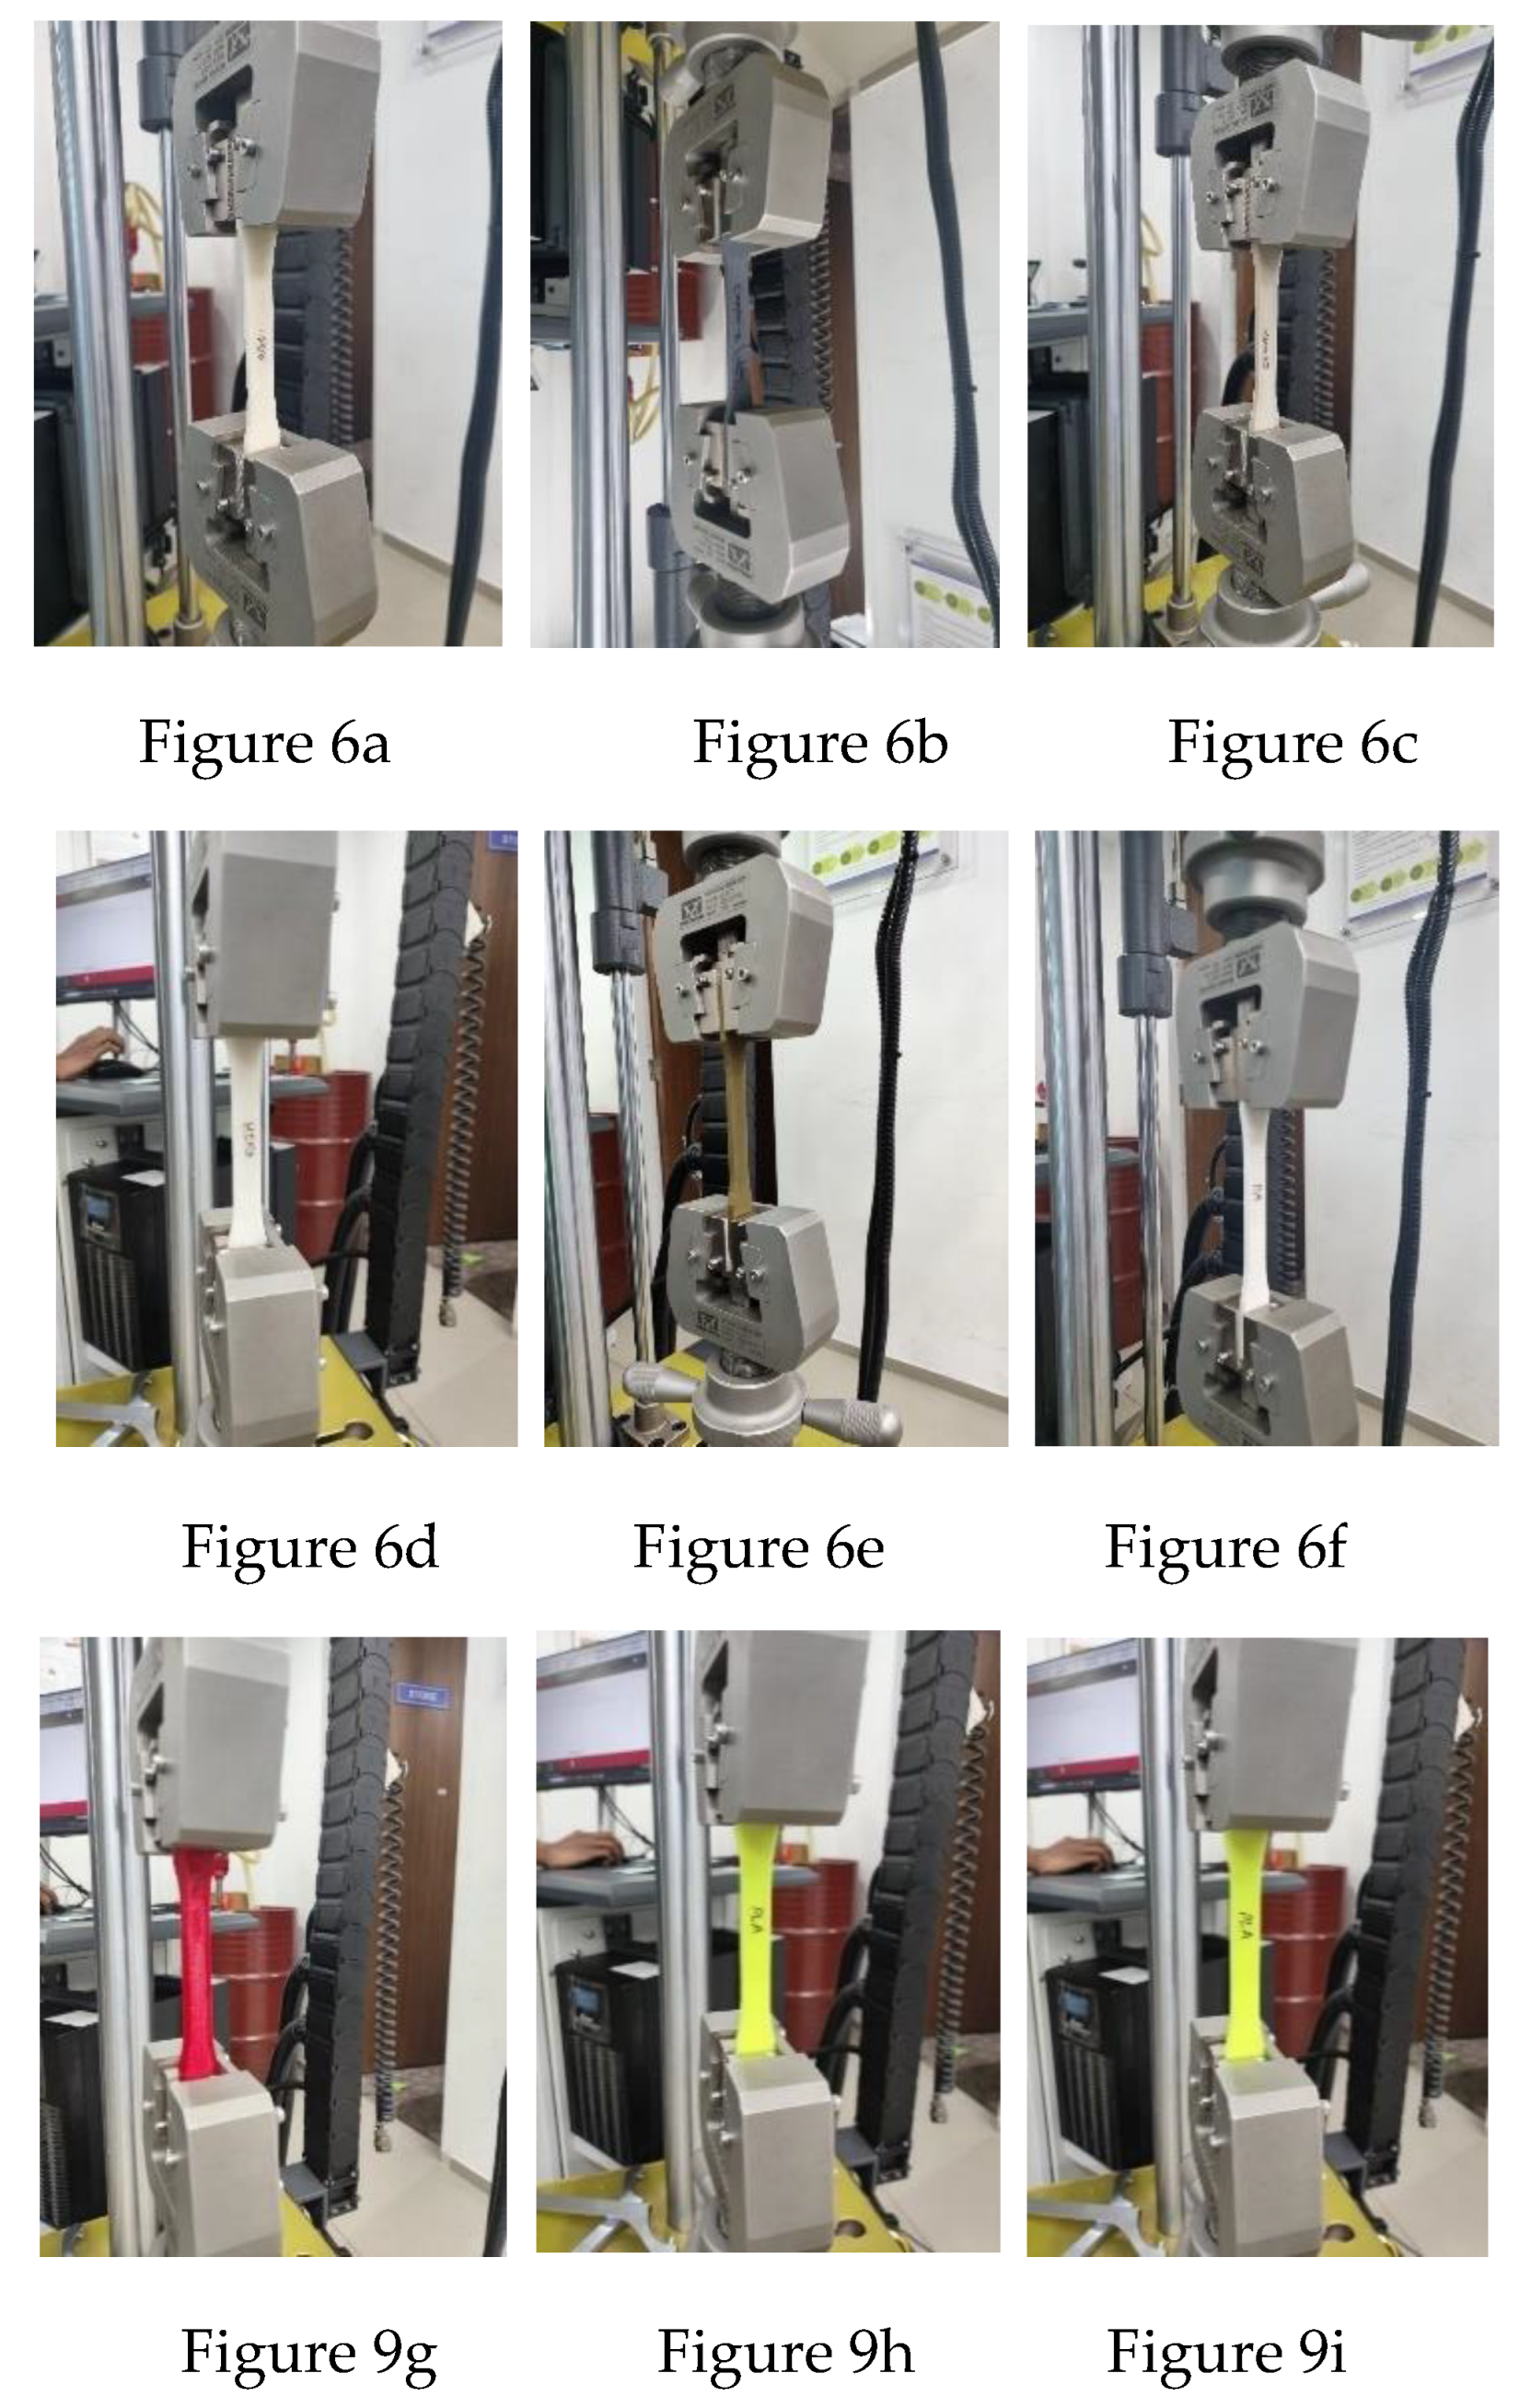
Figure 7.
(a) Young’s Modulus. (b) Ultimate Tensile strength.
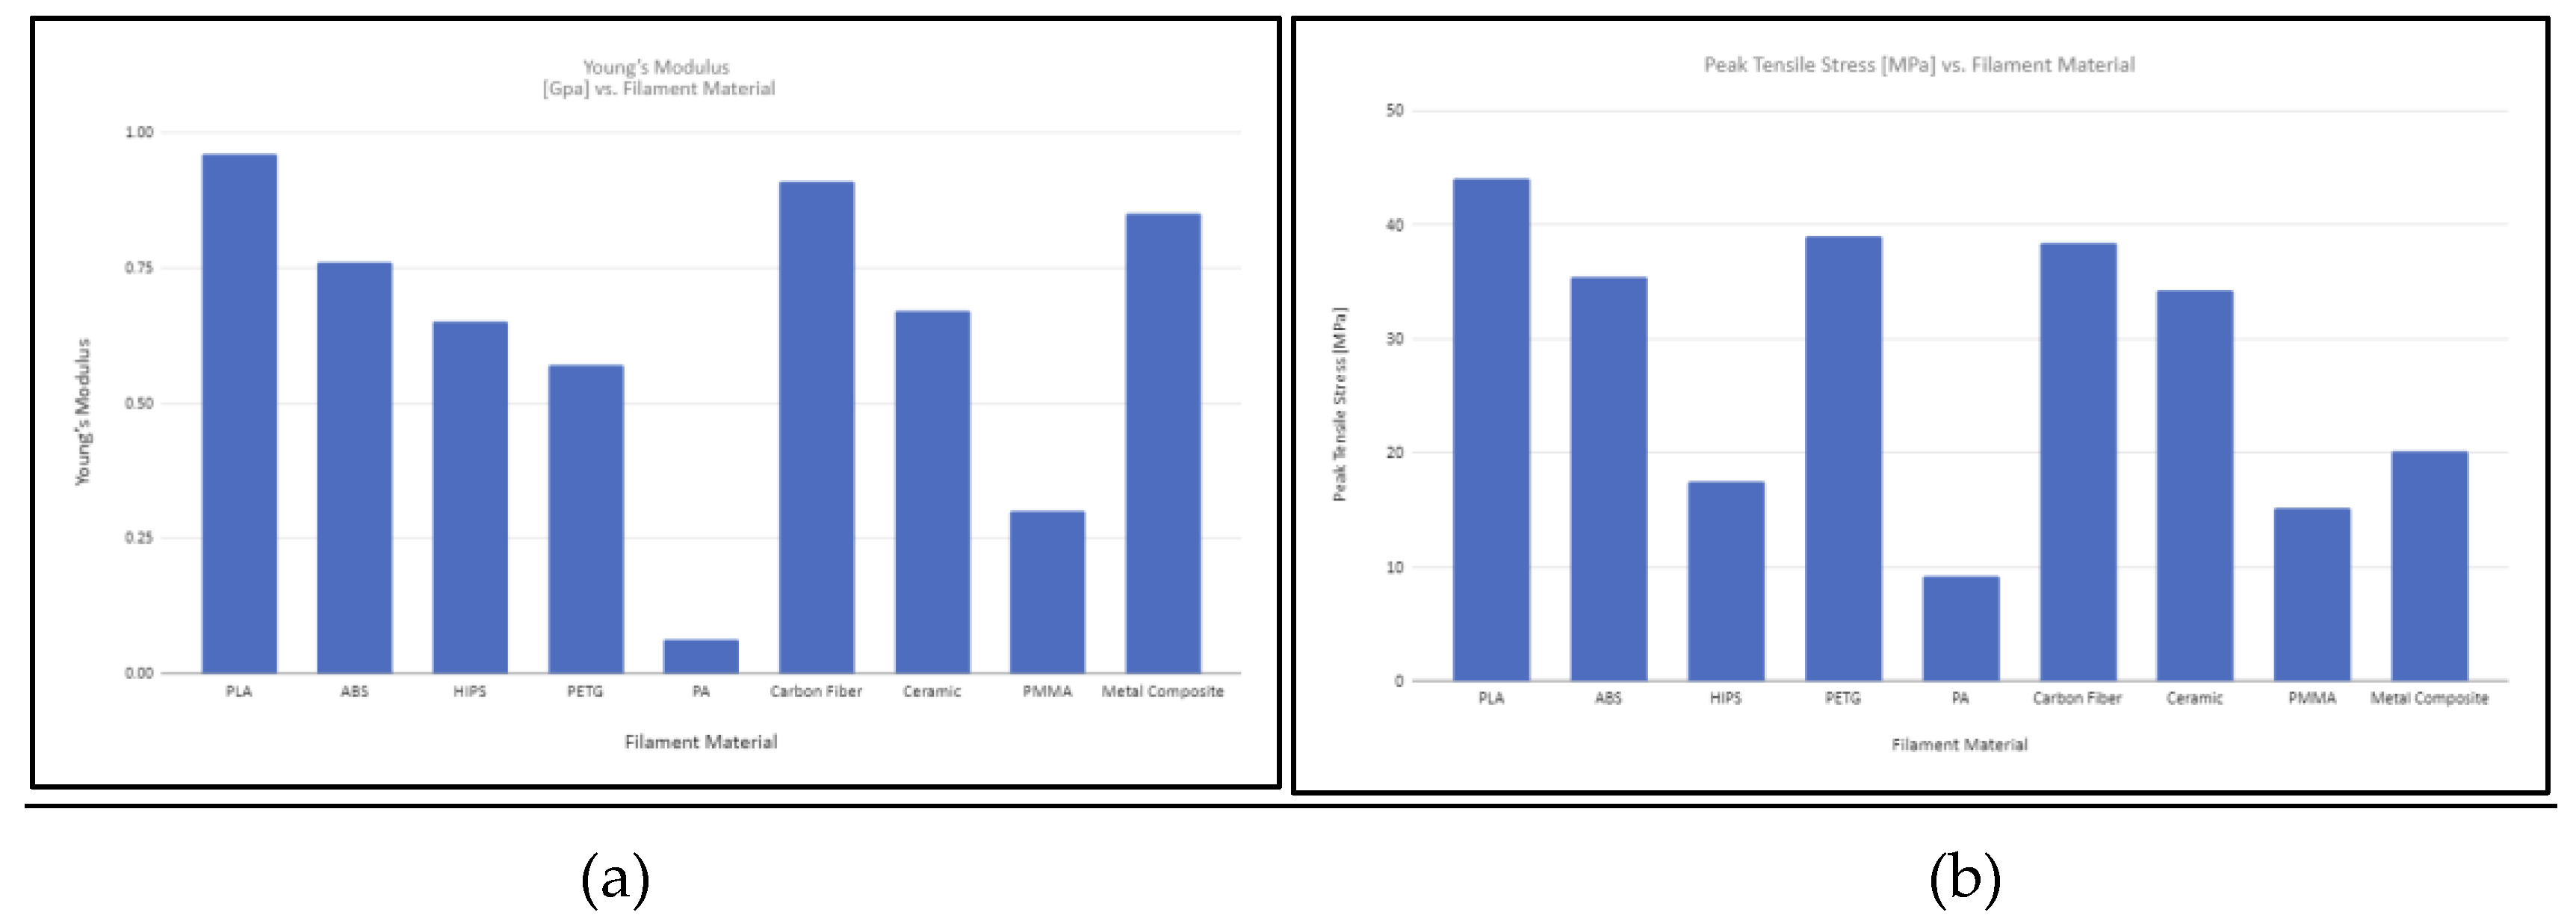
Figure 8.
Graphically representation of sample breaking position.
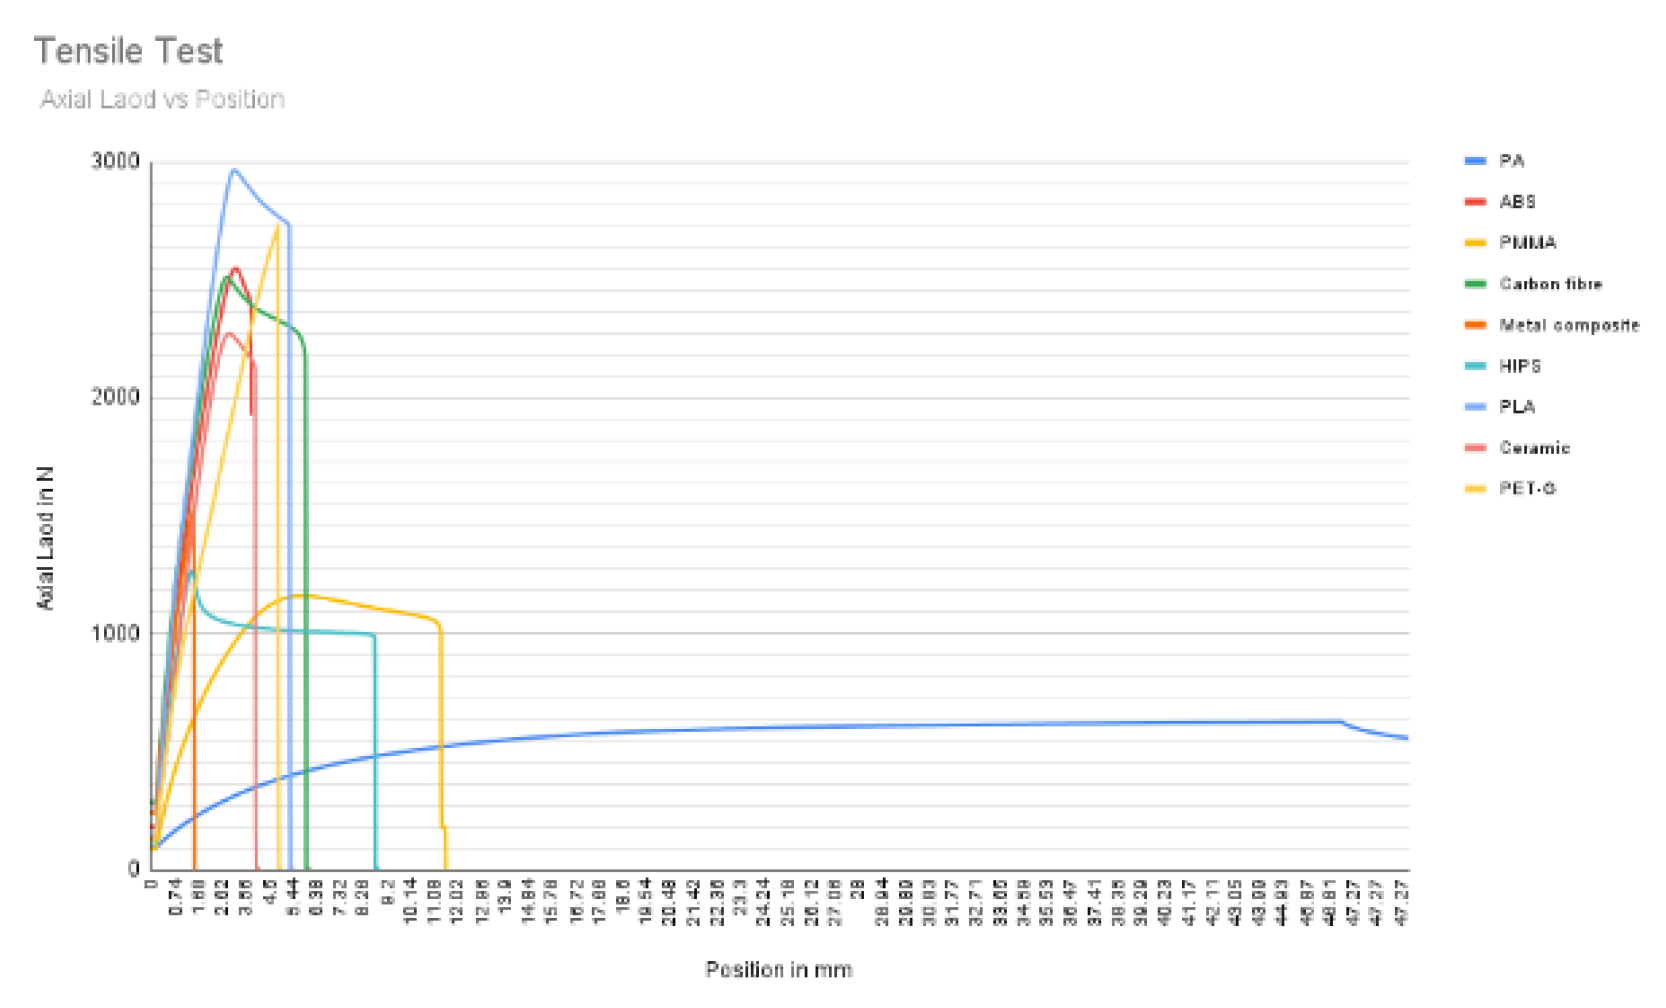
Figure 9.
Compressive testing under UTM machine of Nine different filaments. (Figure 9a ABS, Figure 9b Carbon Fiber, Figure 9c ceramic, Figure 9d HIPS, Figure 9e Metal Composite, Figure 9f PA, Figure 9g PETG, Figure 9h PLA, Figure 9i PMMA).
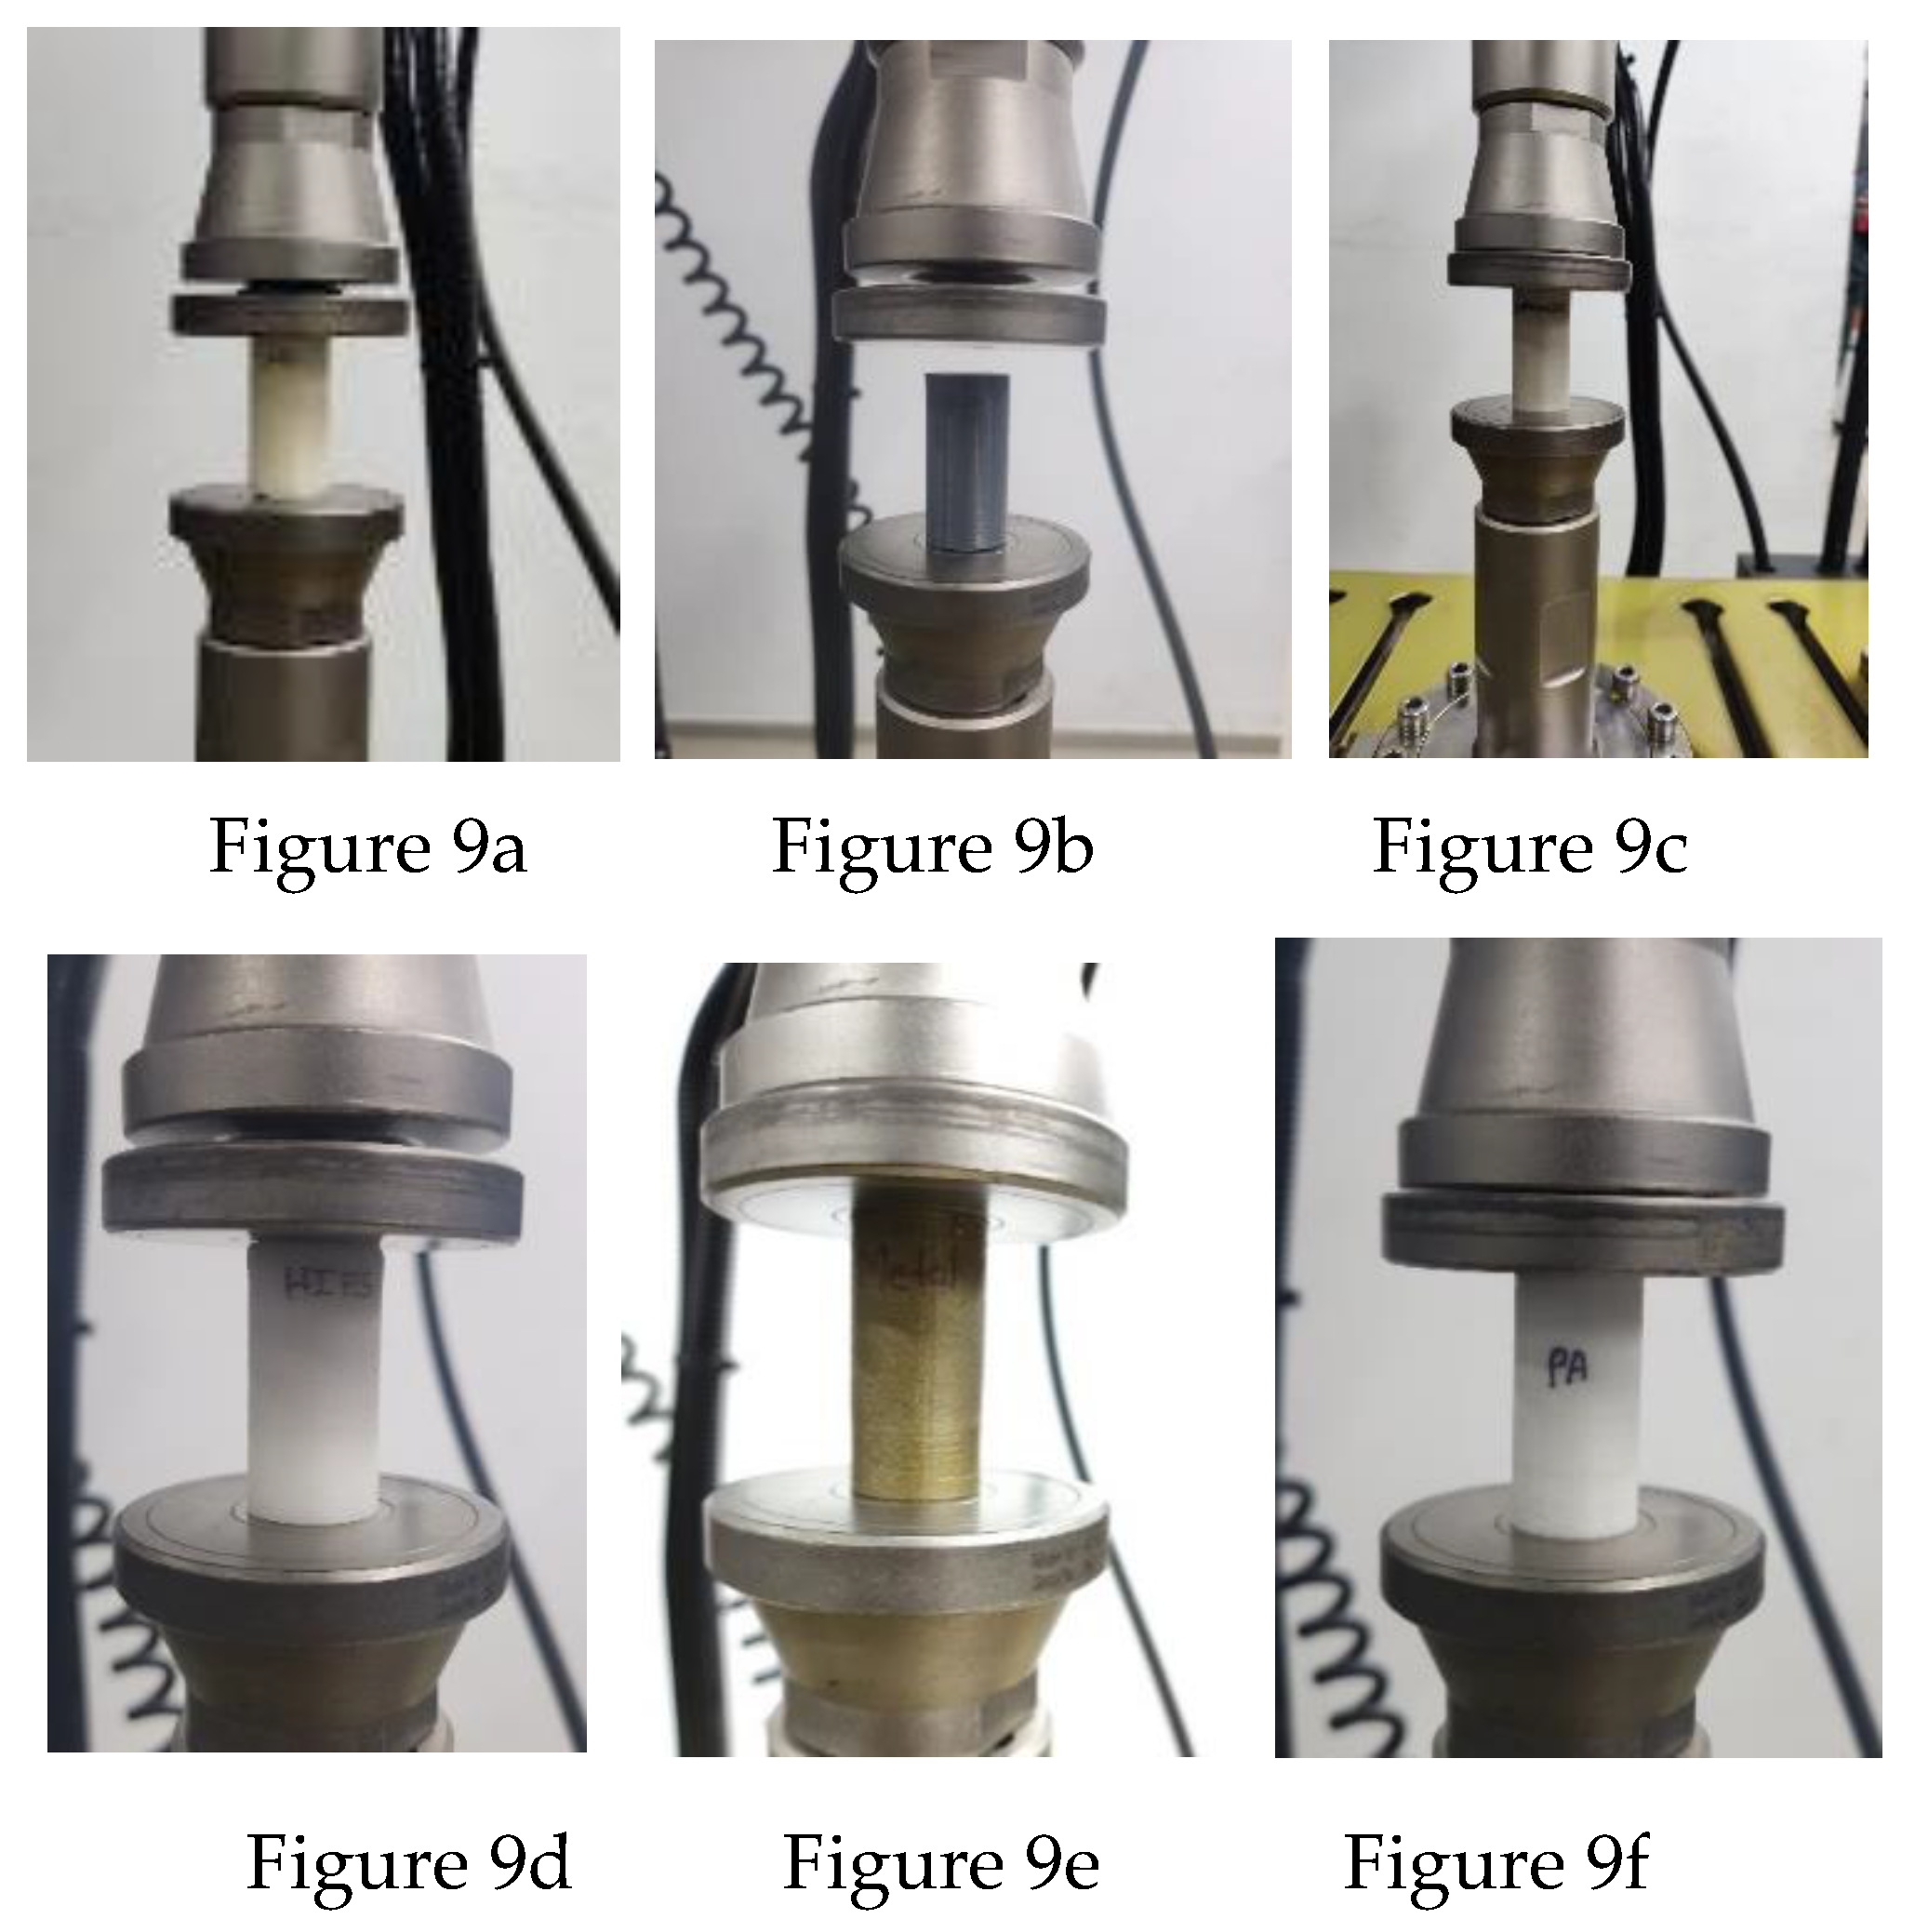
Figure 10.
(a) Young’s Modulus. (b) Compressive strength.
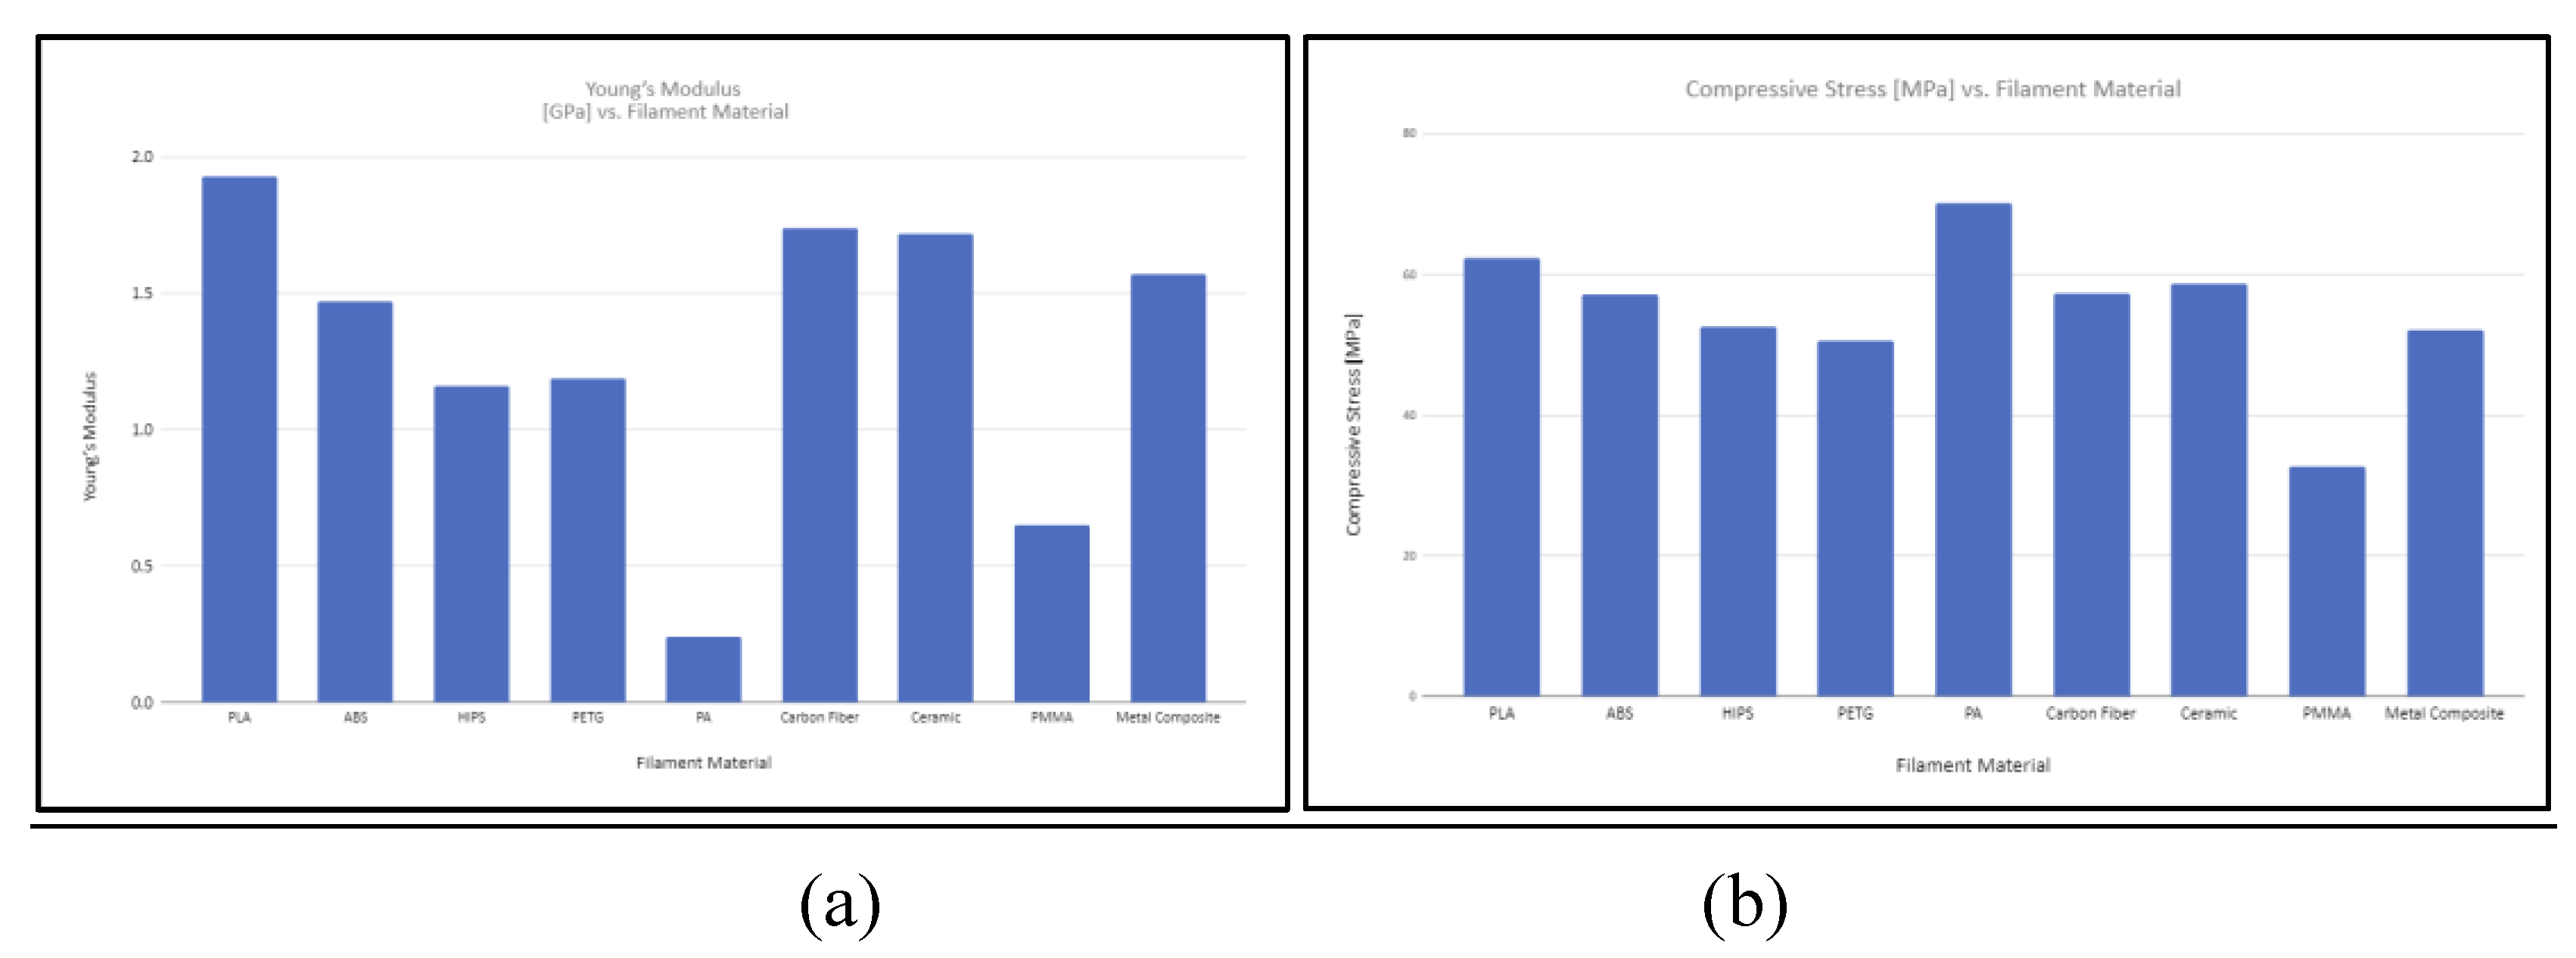
Figure 11.
Graphically representation of sample compressive axial load with relative to position.
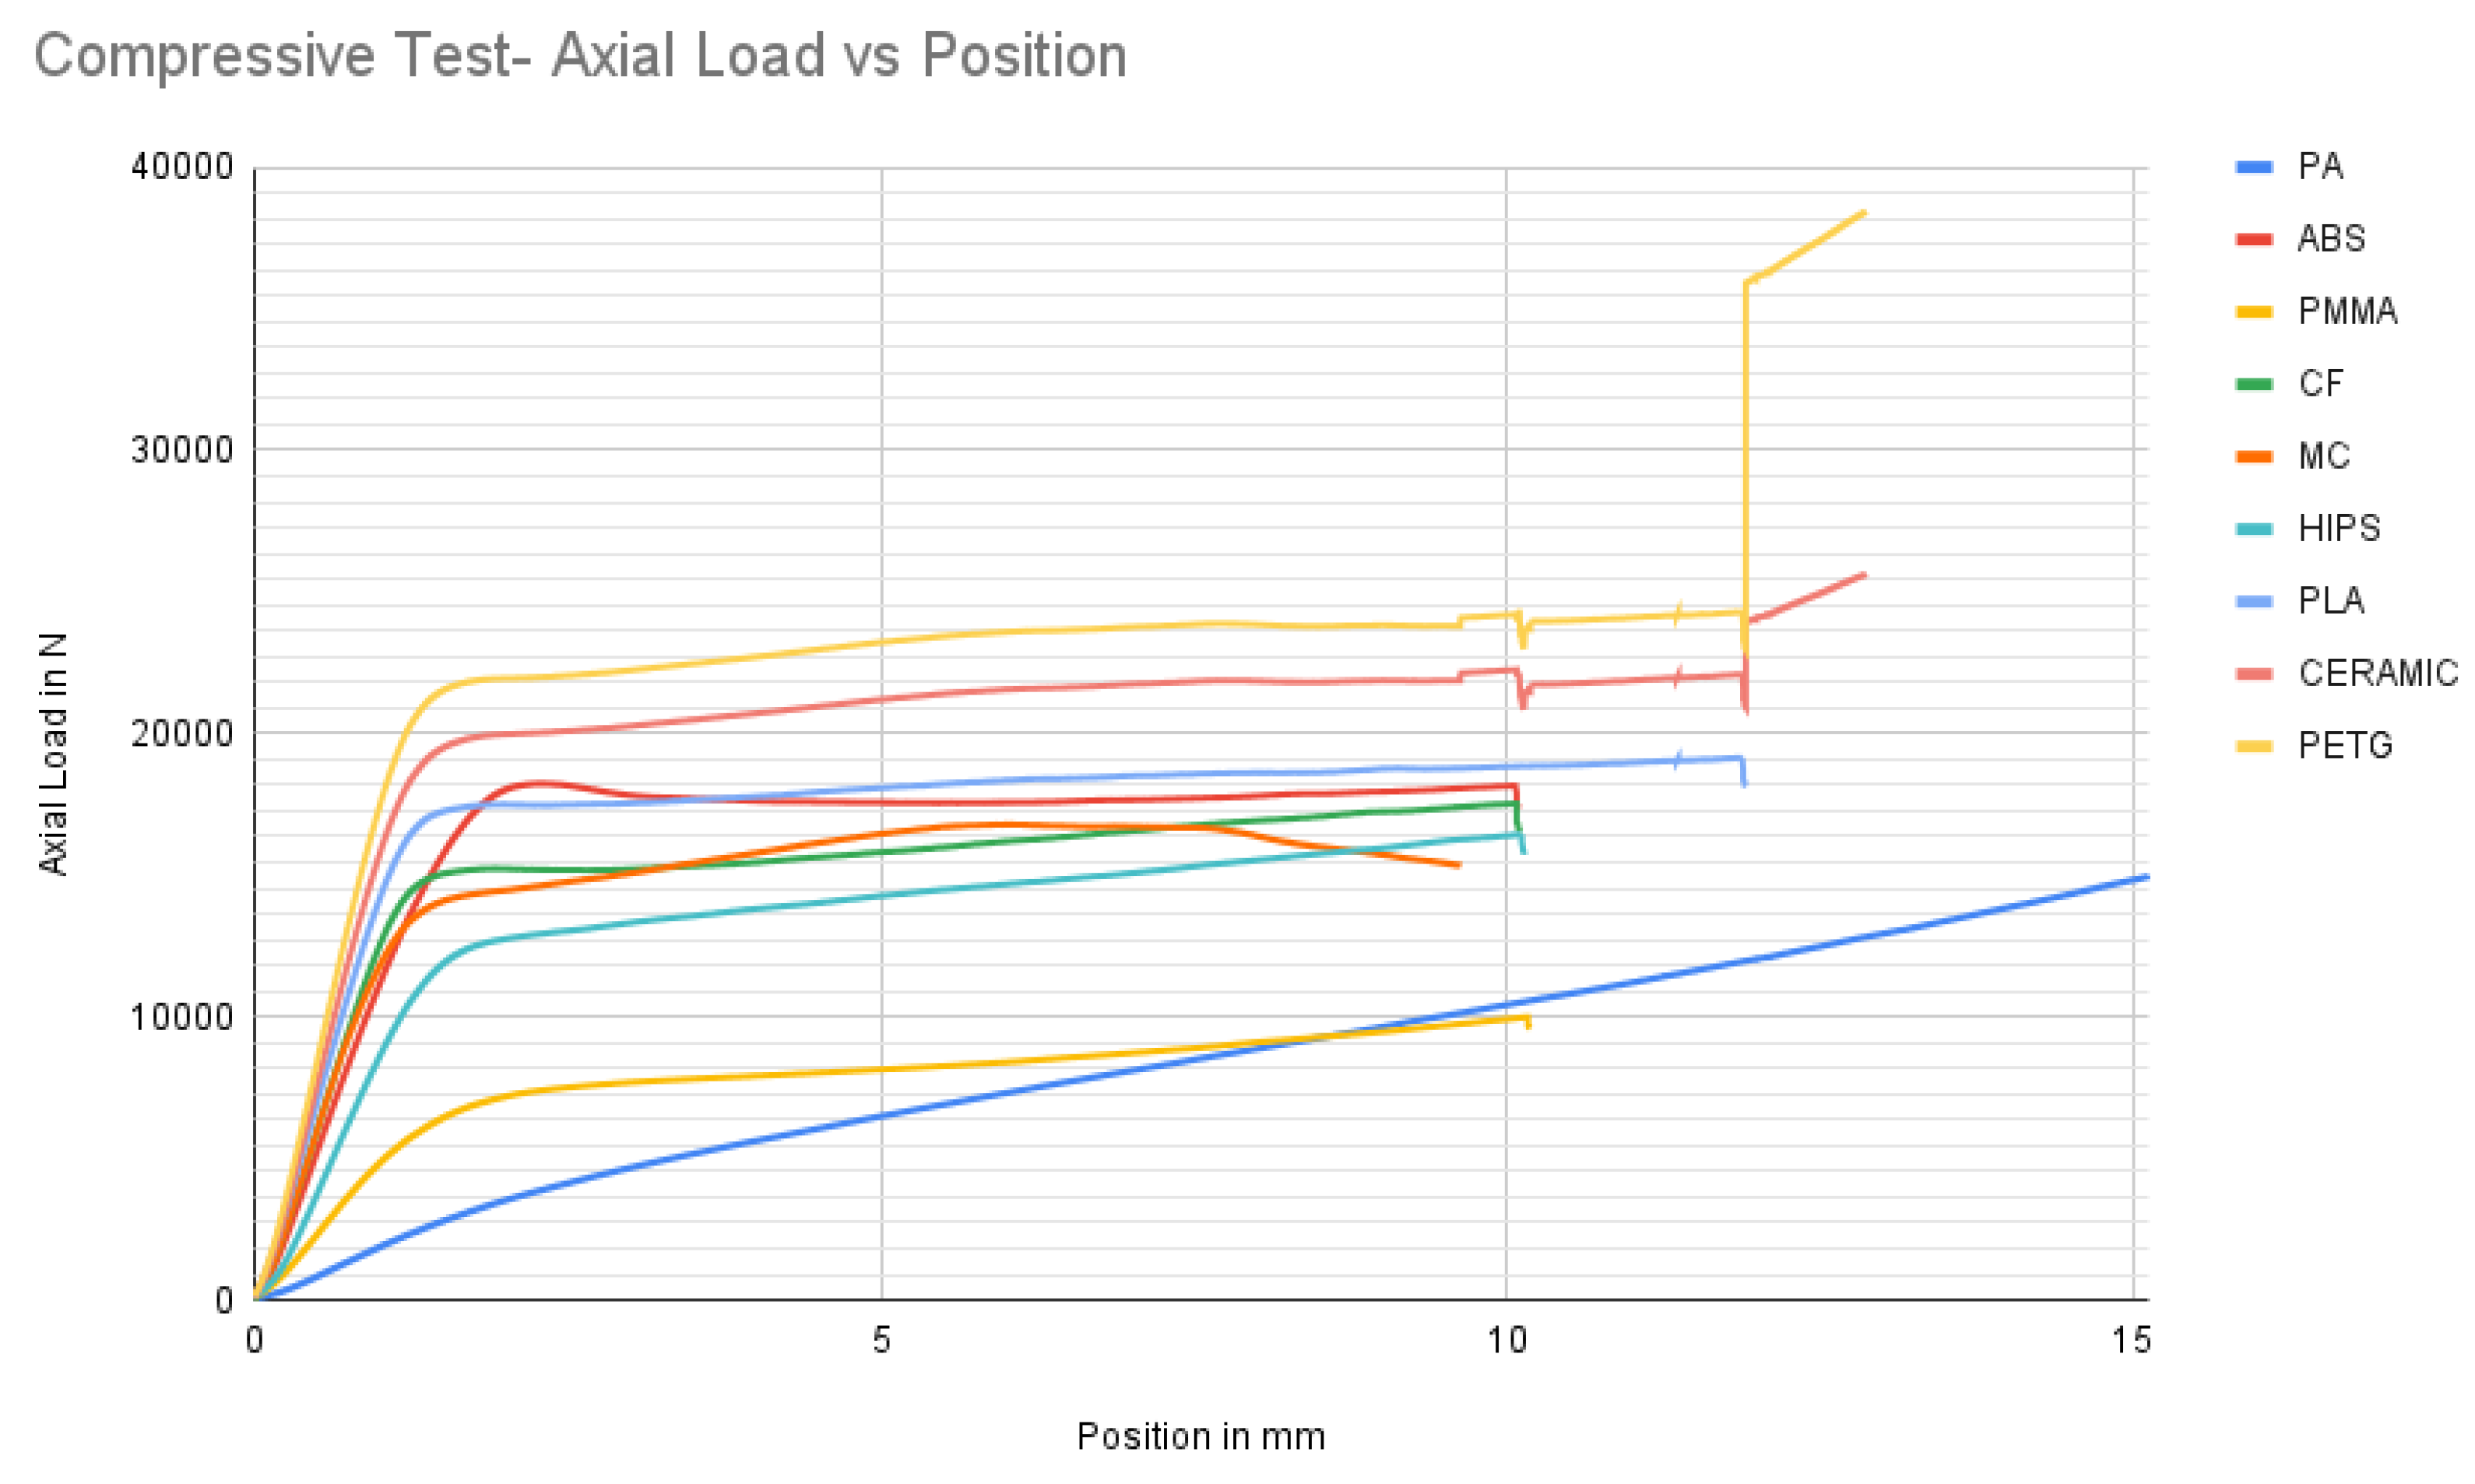

Table 1.
Parameters of FDM printer for different Filament Materials.
|
Parameter |
PLA | ABS | HIPS | PETG | PA | Carbon Fiber | Ceramic | PMMA | Metal Composite |
| Printing Temperature | 220°C | 260 | 245 | 250 | 280 | 230 | 250 | 260 | 220 |
| Nozzle Diameter | 0.4mm | 0.4mm | 0.4mm | 0.4mm | 0.4mm | 0.4mm | 0.4mm | 0.4mm | 0.4mm |
| Printing Speed | 70mm/s | 70mm/s | 70mm/s | 70mm/s | 70mm/s | 70mm/s | 70mm/s | 70mm/s | 70mm/s |
| Infill Density | 100% | 100% | 100% | 100% | 100% | 100% | 100% | 100% | 100% |
| Platform Temperature | 50°C | 100 | 115 | 110 | 90 | 60 | 100 | 110 | 60 |
| Layer Thickness | 0.2mm | 0.2mm | 0.2mm | 0.2mm | 0.2mm | 0.2mm | 0.2mm | 0.2mm | 0.2mm |
| Filament Diameter | 1.75 mm | 1.75 mm | 1.75 mm | 1.75 mm | 1.75 mm | 1.75 mm | 1.75 mm | 1.75 mm | 1.75 mm |
| Density | 1240kg/m3 | 1030kg/m3 | 1030 kg/m3 | 1270 kg/m3 | 1520 kg/m3 | 1300 kg/m3 | 1270 kg/m3 | 1180 kg/m3 | 1200 kg/m3 |
Table 2.
Percentage error in dimension.
| Fig No | Filament Material | Printed part dimension | Percentage error as compared to original CAD dimensions i.e. 20mm |
| 1 | PLA | 19.73 | -1.35 % |
| 2 | ABS | 20.05 | +0.25% |
| 3 | HIPS | 20.09 | +0.45% |
| 4 | PETG | 20.16 | +0.8% |
| 5 | PA (Nylon) | 19.85 | -0.75% |
| 6 | Carbon Fiber | 19.79 | -1.05% |
| 7 | Ceramic | 19.80 | -1.0% |
| 8 | PMMA | 19.65 | -1.75% |
| 9 | Metal Composite | 20.25 | +1.25% |
Table 3.
Peak load and Peak stress during tensile test.
| No. | Filament Material | Young’s Modulus [GPa] |
Ultimate tensile strength [Mpa] |
| 1 | PLA | 0.96 | 44.09 |
| 2 | ABS | 0.76 | 35.42 |
| 3 | HIPS | 0.65 | 17.47 |
| 4 | PETG | 0.57 | 39.01 |
| 5 | PA | 0.062 | 9.18 |
| 6 | Carbon Fiber | 0.91 | 38.43 |
| 7 | Ceramic | 0.67 | 34.31 |
| 8 | PMMA | 0.30 | 15.21 |
| 9 | Metal Composite | 0.85 | 20.19 |
Table 4.
Peak load and Peak stress of Compressive test.
| No. | Filament Material | Young’s Modulus [GPa] |
Compressive Stress [MPa] |
| 1 | PLA | 1.93 | 62.28 |
| 2 | ABS | 1.47 | 57.2 |
| 3 | HIPS | 1.16 | 52.47 |
| 4 | PETG | 1.19 | 50.51 |
| 5 | PA | 0.24 | 70.13 |
| 6 | Carbon Fiber | 1.74 | 57.3 |
| 7 | Ceramic | 1.72 | 58.63 |
| 8 | PMMA | 0.65 | 32.70 |
| 9 | Metal Composite | 1.57 | 52.12 |
Disclaimer/Publisher’s Note: The statements, opinions and data contained in all publications are solely those of the individual author(s) and contributor(s) and not of MDPI and/or the editor(s). MDPI and/or the editor(s) disclaim responsibility for any injury to people or property resulting from any ideas, methods, instructions or products referred to in the content. |
© 2024 by the authors. Licensee MDPI, Basel, Switzerland. This article is an open access article distributed under the terms and conditions of the Creative Commons Attribution (CC BY) license (http://creativecommons.org/licenses/by/4.0/).
Copyright: This open access article is published under a Creative Commons CC BY 4.0 license, which permit the free download, distribution, and reuse, provided that the author and preprint are cited in any reuse.


