
Submitted:
18 November 2024
Posted:
19 November 2024
You are already at the latest version
Abstract
This study explores the use of a nonlinear vibration absorber to mitigate aeroelastic effects on a wing operating near the ground. An aeroelastic model, based on a typical airfoil section, equipped with a nonlinear tuned vibration absorber (NLTVA), is established to study the interactions between the airfoil’s dynamics, aerodynamics, and the nonlinear energy dissipation mechanisms. Geometric nonlinearity is incorporated into the airfoil's dynamics to account for possible large wing deflection and rotation. The flow is modeled based on the nonlinear unsteady discrete vortex method with the ground effect simulated using the mirror image method. Stability analyses are conducted to study the influence of NLTVA parameters on flutter instability and bifurcation behavior of the airfoil near the ground. The numerical results demonstrate that the NLTVA effectively delays the onset of flutter and promotes a supercritical bifurcation in the presence of ground effect. Optimally tuning the NLTVA’s linear parameters significantly increases flutter speed, while selecting the optimal nonlinear parameter is key to preventing subcritical behavior near the ground and reducing post-flutter limit cycle oscillations amplitude. Overall, this study highlights the potential of the NLTVA in enhancing the aeroelastic stability of flying vehicles with highly flexible wings, especially under the influence of ground effects during takeoff and landing.
Keywords:
flutter mitigation
; nonlinear tuned vibration absorber
; passive control
; ground effect
1. Introduction
Aeroelasticity, the interaction between aerodynamic loads and structural dynamics, presents a major challenge in the design of modern flying vehicles. This interaction can induce undesirable vibrations, potentially leading to structural fatigue or even failure. The severity of aeroelastic effects, influenced by the complex dynamics of fluid-structure coupling, is more pronounced in innovative flexible wings [1]. Such wings are increasingly employed in unmanned aerial vehicles, high-altitude long-endurance aircraft [2], and unconventional aircraft [3] designed for enhanced mission performance. When flying close to the ground or during critical phases like takeoff and landing, these aircraft are subjected to aerodynamic changes due to the ground effect. While the ground effect enhances aerodynamic lift and reduces drag [4], research has indicated that it can also adversely affect dynamic aeroelastic stability [5,6]. This imposes significant constraints on performance and operational capabilities in low-altitude environments, emphasizing the importance of aeroelastic mitigation strategies.
Various control strategies offer promising solutions for mitigating aeroelastic instability. Both active and passive control methods have been explored over the years. Active control, which incorporates sensors, actuators, and feedback systems, allows real-time adjustment of aerodynamic loads and vibration modes, making it effective for varying flight conditions [7,8]. Semi-active devices, on the other hand, adapt their stiffness or damping properties dynamically in response to vibrations, offering adaptability with lower energy requirements than active systems [9]. In contrast, passive control methods employ energy-absorbing or dissipating devices to mitigate vibration. Passive systems are energy-efficient, less prone to failure, and may be fully reliable over the aircraft’s lifespan, as well as being simpler and more cost-effective than active and semi-active systems [10]. A tuned mass damper (TMD) is a classical example of a passive control device, consisting of a small mass attached to the primary structure via a linear spring and damper. When TMD parameters are tuned correctly, it can significantly delay the onset of flutter [11]. However, because a TMD operates linearly, it is not efficient on post-flutter instability behavior, such as limit cycle oscillations (LCO). Instead, researchers have proposed the use of nonlinear absorbers, based for instance on frictional effects [12,13] or a cubic restoring force – then called ”nonlinear energy sink” (NES) [14,15,16,17,18], and have reported a reduction in post-flutter LCO amplitude. When a TMD and a NES are combined – referred to as a nonlinear tuned vibration absorber (NLTVA) – the resulting system can offer even more robust control through optimized design. The linear component of the NLTVA can substantially increase the onset of flutter, while the nonlinear components can be tuned to reduce the LCO amplitude and promote supercritical behavior. Both numerical [19,20,21], and experimental studies [22,23] have demonstrated the effectiveness of NLTVA in controlling the flutter and post-flutter behavior. Most studies have primarily focused on structural effects, often using low-fidelity aerodynamics models. However, for aircrafts operating outside standard flight conditions, where aerodynamic interactions may play a significant role, assessing the NLTVA’s effectiveness from the aerodynamic perspective is essential.
Both quasi-steady and Theodorsen-based theories are often employed as complementary aerodynamic models in flutter mitigation. Theodorsen’s theory [24] is regarded as more accurate than quasi-steady theory, as it accounts for flow unsteadiness, including the phase lag between airfoil motion and aerodynamic loads, which is crucial in flutter dynamics. This approach is generally sufficient for predicting flutter onset and performing aeroelastic analysis, particularly when structural nonlinearities are significant and nonlinearities in the flow are minimal. However, when considering the ground effect, a high-fidelity model such as computational fluid dynamics (CFD) is often preferred in aerodynamics studies [25,26]. In aeroelastic studies, CFD is yet rarely considered due to its high computational demands. Instead, the unsteady discrete vortex method (UDVM), based on a potential flow theory, will be used in this study. This method is better suited for modeling interference effects, such as the ground effect [27,28], while providing a computationally efficient approach.
The objective of this study is to numerically assess how an NLTVA can improve aeroelastic performance under ground effect conditions, addressing both the critical flutter speed and the resulting post-flutter behavior. The problem is analyzed using a typical section model supported elastically by nonlinear springs, which provides a practical approximation of a high-aspect-ratio wing and is widely used in flutter calculations [20,29,30]. The aeroelastic equations of motion are formulated using Lagrange’s equations. Aerodynamic loads are computed using the UDVM, while the ground effect is simulated using the mirror-image method. The transient aeroelastic behavior at, before, and after flutter onset is obtained by numerical time integration. The influence of key design parameters, including the linear stiffness and damping of the NLTVA and the airfoil’s height from the ground, on flutter dynamics is analyzed. Additionally, the effect of the NLTVA’s nonlinear component on LCO amplitude and bifurcation behavior is investigated. The modeling and numerical solution procedures are presented in Section 2, with results and analysis in Section 3.
2. Mathematical Modeling
2.1. Typical Airfoil Section with Nonlinear Absorber
The structural model of the wing used in the following developments is illustrated in Figure 1. It incorporates a typical airfoil section (TSM) in a uniform flow . The airfoil is supported by torsional and flexural springs at the elastic axis. These springs provide linear stiffness, denoted by and , and include damping, denoted by and , which influence airfoil pitch () and heave (h) motions, respectively. Moreover, the structural model accounts for geometric nonlinearities. The impact of the nonlinear effects in the heave mode has been shown to be negligible [20], therefore, the nonlinearity considered is exclusively in the pitch mode, modeled by a cubic stiffness denoted . The nonlinear absorber, connected to the TSM at a distance l from the elastic axis, consists of mass () supported by linear stiffness (), cubic stiffness (), and damping (). The cubic stiffness term in the absorber primarily affects the amplitude of the nonlinear response after flutter; without it, the absorber functions as a traditional tuned mass damper. The absorber relative transverse motion to the airfoil is denoted by z. The governing equations of the TSM coupled with the nonlinear absorber are written as [20]:
where m is the mass of the TSM, and and are its moment of inertia and its static moment of inertia about its elastic axis, respectively. L and represent the aerodynamic lift and moment about the elastic axis, which will be detailed in the following section. Equation (1) can be rearranged into standard matrix form as:
where , , and are the mass, damping, and stiffness matrices of the system. represents the nonlinear restoring forces, including geometric nonlinearities and nonlinear effects from the absorber, accounts for the aerodynamic loads, and contains the generalized coordinates.
In the numerical simulations presented in Section 3, non-dimensional values will be used. The airfoil model is then characterized by the following parameters: the non-dimensional locations of the elastic axis and center of mass ; the uncoupled heave-to-pitch frequency ; the radius of gyration ; and the non-dimensional airfoil mass . The structural damping coefficients are denoted by and for pitch and heave, while the cubic restoring forces coefficient for pitch is denoted by . Furthermore, the quantity and , referring to the reduced airspeed and air density, are used. For a given pitch frequency and semi-chord length , the following relationships are applied in terms of physical quantities:
Concerning the NLTVA, the ratio between its mass and that of the airfoil is set to , following [20], with the NLTVA positioned at the leading edge of the airfoil. The other parameters that define the NLTVA are considered design parameters. These are the ratio of NLTVA-to-pitch frequency , the damping coefficient of the NLTVA , and the coefficient of the NLTVA’s nonlinear restoring force . The following relations are applied in terms of physical quantities:
2.2. Ground Effect Aerodynamics
The aerodynamics of the airfoil in proximity to the ground are modeled using the UDVM, with the ground interference effect simulated using the mirror image method [31]. UDVM is a computational approach based on potential flow theory. It is inherently nonlinear, applies to two-dimensional thin bodies in a uniform flow , and accounts for flow interference. However, it does not incorporate flow separation or thickness effects. Figure 2 illustrates the discrete vortex representation of the airfoil, its wake, and their mirror images. Here, the airfoil is discretized into N panels, in which each panel is represented by a lumped vortex strength (noted ) placed at the quarter chord of the panel. The mirror image method simulates the ground effect by considering the mirror image of the primary model, positioned symmetrically relative to the ground plane. Thus, the influence of the ground is modeled by the image vortices, which have the same strength but are opposite in direction to those of the primary model. The image vortices are located at a distance of from the primary model, where d is the height of the structure above the ground. The numerical solution proceeds in a time-marching process formulated by satisfying the continuity equation complemented with boundary conditions. The aerodynamic model applied in this study is well-established; for a comprehensive mathematical foundation, readers are encouraged to consult Katz and Plotkin’s textbook [31]. The main constitutive equations are recalled next.
The basic condition of physical flow over an airfoil (i.e. the flow should not penetrate the surface) is satisfied by enforcing the zero normal flow boundary condition. This condition is applied at the control point of each panel to solve for the unknown bound and wake vortex strengths. The zero normal flow boundary condition near the ground is written as:
where and represent the self-induced component of the normal velocity due to the primary and image vortices, respectively. Likewise, and accounts for the induced normal velocity from the wake vortices of the primary and image airfoils. The remaining terms account for the kinematic contribution to the normal velocity from the airfoil’s motion, where is the instantaneous velocity of the airfoil origin, is the relative motion of the chord line within the body coordinate system, is the position vector, and is the instantaneous rotation of the body coordinate system.
The flow leaving the trailing edge is governed by the Kutta condition, ensuring smoothing vorticity shedding. In addition, Kelvin’s theorem is applied to determine the strength of the shed wake according to the conservation of total circulation in the flowfield, written as:
where and are the sum of all vortex strengths on the airfoil at the current and previous time step, respectively. The most recent wake vortex, with strength , is positioned within the interval behind the trailing edge to correct for the wake-discretization error [31]. At each time step, Equations (3) and (4) are solved simultaneously to determine the strength of the airfoil vortices and the latest wake vortex. Once these strengths are known, the pressure along the airfoil is computed from the unsteady Bernoulli’s equation. The pressure difference at the ith control panel is given by:
where is the fluid density, is the magnitude of the velocity which is the kinematic velocity due to the motion of an airfoil, and is the tangential speed. The aerodynamic lift and moment at the elastic axis are then calculated by integrating the pressure along the chord, and subsequently used in Equations (1)-(2).
The wake vortices shed from the airfoil are free to deform and move downstream with the local flow velocity. The circulation strength around each vortex remains unchanged after detaching from the trailing edge, according to Helmholtz’s theorem. As the vortices are convected downstream, their new position is determined by calculating the induced velocity components , which are influenced by the singularities from the primary and image airfoils as well as their wake. Consequently, the wake vortex points are transported along the distance and in the plane, achieving a vortex wake rollup, as given by:
A numerical problem is often encountered while estimating the induced velocity between two closely spaced vortices, which often results in large values that are unrealistic compared to the real flow. To address this, the Lamb-Oseen vortex model in conjunction with vortex-core growth mode is employed [32,33]. Vortex-core growth model incorporates the effect of eddy viscosity and allows the core radius of a vortex to grow with time, which leads to more accurate vortex dynamics.
2.3. Aeroelastic Solution
The second-order differential equation (Equation (2)) is first transformed into a set of first-order equations and expressed in state-space form. The state-space aeroelastic equation is solved iteratively in the time domain using a fifth-order Runge-Kutta numerical integrator to obtain the dynamic response of the system. The integrator calculates the airfoil’s position, which is then provided to the aerodynamic model. In return, the aerodynamic model computes the aerodynamic loads and feeds them back to the integrator. To maintain stability and prevent the response from diverging, an integral time step is employed within the integrator, during which the aerodynamic load is assumed to remain unchanged. Figure 3 illustrates the flowchart for performing the time-domain aeroelastic analysis using the UDVM.
3. Results and Discussion
3.1. Model Validation
The present method is first validated against the results presented in [5] – using the same numerical values – for near and far from the ground cases, without the absorber. Far from the ground, the present method predicts flutter instability at a reduced speed of 2.091 as compared to 2.073 reported in [5]. The difference in the reduced speed is attributed to the placement of the latest wake vortex: in the present approach, the latest wake vortex is positioned at behind the trailing edge, whereas in [5], it is positioned at the trailing edge. The aeroelastic behavior is characterized by examining the evolution of the transient response over time. In Figure 4 transient responses are shown at three different reduced speeds, each starting with an initial pitch angle of 5 degrees. At reduced flutter speed of , the response is self-sustaining. Below this speed, the response dampens out, while above it, the response grows to a larger amplitude and stabilizes into a LCO. The development of LCO above the flutter speed, in the absence of structural nonlinearities, is attributed solely to aerodynamic nonlinearities, which are captured in this study using the UDVM.
As the airfoil moves closer to the ground, a significant change occurs in the wake dynamics, resulting in increased aerodynamic loads. Consequently, the closer the airfoil is to the ground, the stronger the ground effect becomes, destabilizing the airfoil at lower speeds. This is illustrated in Figure 5, showing a significant decrease in the flutter speed as the airfoil height above the ground is decreased. In the figure, relates to the case where the most recent wake vortex is placed at the trailing edge whereas it is placed at behind the trailing edge for . The latter case shows a slight increase in flutter speed. Nevertheless, all results are in good agreement with the references [5,6].
3.2. Linear Flutter Analysis
In this section, neither the geometric nonlinearities of the airfoil nor the nonlinear stiffness of the absorber are considered. The absorber is then similar to a simple TMD. The structure is treated as purely linear, though simulations with the UDVM inherently include aerodynamic nonlinearity effects. The results obtained from the UDVM are first compared with those derived using the Wagner approach (a linear, time-domain approximation of Theodorsen’s theory) as aerodynamic model [34].
The numerical values reported in [20], as recalled in Table 1, are used for the simulations. Without the absorber and far from the ground, the present approach predicts a reduced flutter speed of , while the Wagner approach predicts a reduced flutter speed of . For the same system, Malher et al. [20] reported the flutter speed at . Their analysis utilized quasi-steady aerodynamics, which ignores the effects of flow unsteadiness, thus underestimating the flutter speed. Similar to the approach taken in [20], an optimization of the linear parameters of the NLTVA ( and ) is next conducted, but incorporating the unsteady effects, in order to identify the optimal pair that maximizes flutter speed. Using the Wagner method, eigenvalue analyses are performed over a range of and . As shown in the results illustrated in Figure 6, the maximum reduced flutter speed of is achieved at and .
Using the enhanced aerodynamic model of the UDVM, the flutter speed is calculated only as a function of , with simulations run at the optimal value of due to the high computational demands of the model. Despite some differences attributed to the linear and nonlinear aerodynamic models, the results from both methods are consistent, as shown in Figure 7, with a maximum flutter speed of obtained using the UDVM, indicating that the addition of the NLTVA results in an approximate increase in flutter speed as compared to without absorber. It is also observed that increasing has a stabilizing effect on the airfoil up to the optimal value, beyond which it destabilizes. Eigenvalue analyses for two cases of using Wagner approach, one before and one after the optimal value, are shown in Figure 8. The results indicate that the unstable flutter mode for is mainly associated with the pitch mode, while the instability for is mainly linked to the heave mode. The sudden change in behavior illustrated in Figure 7 is then attributed to the transition between unstable flutter modes. The NLTVA absorbs energy from the pitch mode while dissipating energy to the heave mode, resulting in stabilization of the pitch mode but destabilization of the heave mode as increases. The optimal value marks the point at which the switching of the flutter unstable mode occurs. In subsequent analyses, the optimal values of and are utilized.
For the aeroelastic system approaching the ground, the influence of ground proximity on flutter instability is computed as a function of the normalized height above the ground. The results, shown in Figure 9, compare systems with and without the absorber. In both cases, the ground destabilizes the airfoil and lowers the flutter speed as the height between the model and the ground is reduced. The inclusion of an absorber improved the flutter stability in the presence of the ground effect as compared to the system without it. Moreover, since the results in Figure 9 correspond to the optimal values determined for the system far from the ground, it is possible that different optimal values for and may exist under the influence of ground effects, which could further mitigate flutter instability.
3.3. Post-Flutter Analysis with a Nonlinear Structural Model
The post-flutter solution follows the process outlined in Figure 3. The coefficient of nonlinear restoring force for pitch is set to unity. In the numerical time integration simulation, the airfoil motion is initiated with an initial disturbance of pitch angle, while all other degrees of freedom are set to zero. The flow speed is initially set below the critical speed and is then gradually increased and decreased back to the initial value within a single computation. The resulting post-flutter responses, for both increasing and decreasing flow speed, are examined to determine the system’s criticality that describes the nature of the Hopf bifurcation related to flutter. The Hopf bifurcations of supercritical nature are characterized by the gradual change in the onset of LCOs whereas subcritical ones are characterized by jump phenomenon and the appearance of a bistable region, see [20] for instance.
First, the nonlinear analysis of an aeroelastic system without an absorber, and positioned far from the ground, is realized. The simulation is initiated with a pitch angle of 2 degrees, and reduced speed of , which is below the reduced flutter speed of the system without NLTVA. The value of is gradually increased up to and subsequently decreased back to its initial value over time. Figure 10 shows the resulting pitch and heave responses. In the figure, the solid blue curve traces the maximum amplitude of the response during the increase in , while the dashed red curve shows the maximum amplitude as decreases. Together, these curves effectively give insight on the LCO amplitude as a function of . The post-flutter response would be supercritical if these two curves were to coincide. However, achieving this requires a much slower variation in in order to give the system enough time to reach a dynamic behavior close to a steady state at a given value. This problematic is even more pronounced when the disturbances are relatively small, leading to higher computation costs. Nonetheless, it is inquired that the post-flutter instability in the Figure 10 of the system without NLTVA is supercritical.
Similarly, the nonlinear analysis of the aeroelastic system with a NLTVA far from the ground is carried out with an initial pitch angle of 2 degrees and reduced speed of . The starting is below the critical speed of the system with NLTVA, but higher than that of the system without NLTVA. Figure 11 illustrates the pitch and heave responses as is gradually increased and then decreased for three different values of the nonlinear stiffness . For , which corresponds to a traditional TMD, the amplitude of the response rapidly increases to a large value as rises beyond the critical speed and exhibits a bistable region when decreases. This behavior is related to a subcritical bifurcation and it shows the negative impact of TMD on shifting the original supercritical bifurcation (as illustrated in Figure 10) to a subcritical one. In contrast, the introduction of a nonlinear absorber, as observed with , promotes supercritical bifurcation leading to more controlled response amplitude. However, increasing may not guarantee a smooth behavior. This parameter significantly impacts the nonlinear response, potentially leading to the emergence of additional bifurcation points. As exhibited in [20], relatively high values of can result in the creation of limit points that correspond to distinct jumps: a transition to high-amplitude LCO as increases, and a shift to low-amplitude LCO as decreases. This phenomenon is depicted in Figure 11 with .
Overall, the results show the NLTVA’s effectiveness in mitigating LCO amplitudes compared to TMD ( and underscore the importance of optimally tuning to avoid subcritical instabilities and jumps, which pose a risk of structural failure. Similar conclusions were drawn in [20], though the numerical values differ, likely due to the use of a more simplified aerodynamic model.
In order to support the distinction between supercritical and subcritical bifurcations, the pitch response from Figure 11 is plotted on a logarithmic scale in Figure 12. Two cases are examined, and . In Figure 12a, pitch envelopes are shown for increasing and decreasing , while in Figure 12b, pitch envelopes are shown as a function of time for a constant speed of just beyond the critical speed. The envelope in Figure 12b initially follows the same path in both cases, but over time, they settle at different steady-state values. The time required to reach a steady state would increase with a smaller initial disturbance. The steady-state values in Figure 12b, marked as A and B, correspond to the markers A and B in Figure 12a at . Marker A represents a pitch LCO amplitude of approximately 11 degrees with the TMD, while marker B corresponds to a pitch LCO amplitude of approximately 3 degrees reached with the NLTVA, clearly demonstrating the NLTVA’s effectiveness in suppressing oscillation. Furthermore, for the envelopes to pass through their respective markers A and B during both increasing and decreasing , a slower variation in would be needed to allow the response to stabilize. This required variation in must be especially slow when the disturbance is small, as a larger initial disturbance drives the response to a steady state more rapidly. This behavior is observed for decreasing , where the envelopes effectively pass through markers A and B. Furthermore, the primary change in slope in Figure 12a, observed with decreasing values, occurs approximately at the critical speed for . However, this change is more pronounced and occurs at a lower critical speed for . The latter case suggests a jump phenomenon, where the solution branch extends below the critical speed as decreases, further indicating subcritical instability.
A detailed bifurcation analysis was conducted in [12,20] through the use of continuation procedures to identify multiple solution branches as the flow speed U varies. In our current approach, the weakly coupled model between structural dynamics and aerodynamics, combined with time-delayed terms in the aerodynamic model, makes the application of continuation techniques particularly challenging and merits further consideration.
Considering the ground effect, Figure 13 shows pitch and heave responses of a system with a NLTVA in the post-flutter regime, analyzed for increasing and decreasing . In this analysis, the airfoil is positioned closer to the ground at a height equal to the airfoil chord (), and motion is initiated with 2 degrees pitch disturbance at a reduced speed of , below the critical speed. Similarly to the simulations presented far from the ground, the responses are evaluated for three different values of . When , equivalent to a TMD, a subcritical bifurcation is observed even in the presence of the ground effect. Introducing a nonlinear component encourages supercritical bifurcation, as observed for , with potential limit points bifurcation (and associated jumps) occurring for larger , as observed for . Comparing, with ground (Figure 13) and without ground effects (Figure 11) results, show no significant changes in the nature of the bifurcations and overall dynamics.
Figure 14 retrieves time histories and phase plots of the system near the ground at the reduced speed of and presents comparisons between various cases: without the absorber, with a TMD, and with a NLTVA configured at or at . The reduced speed chosen voluntarily exceeds the critical speed for all systems. Simulations are initiated with a small disturbance of pitch angle deg.) and are allowed to have prolonged transient for the system to develop LCO. The phase in Figure 14 is plotted for part of the transient response after the response has reached a steady state. Due to the ground influence, the equilibrium position of the responses is no longer symmetric but has shifted upward. Among the cases, the system without an absorber attains LCO most quickly and exhibits the largest amplitude. In contrast, the systems with absorber exhibit significantly reduced LCO amplitudes, as the absorber particularly affects the pitch, which is considered as most energetic degree of freedom of the system. Furthermore, the mitigation of LCO is especially effective when the NLTVA is employed.
To investigate the influence of the NLTVA on the LCO amplitude under ground influence, numerical simulations are performed at a constant speed of . This speed is above the critical speed for cases far from the ground, thus, ensuring the development of LCO across all ground heights. In a single computation, the airfoil height relative to the ground is gradually varied, starting from twice the chord length and 2 degrees pitch disturbance, reducing to of the chord length, and then returning to the initial height. Figure 15 illustrates the pitch and heave responses for three different values of . The results clearly demonstrate the effectiveness of the NLTVA in suppressing the amplitude of post-flutter amplitude even in the presence of strong ground effects. Notably, with the NLTVA , a reduction in amplitude approximately from to is observed as the airfoil height is varied from twice the chord length to the chord length compared to the TMD case (). However, as the ground height decreases, the critical flutter speed also drops (as it was shown in Figure 5 in the linear case), and thus the global effectiveness of the NLTVA diminishes at lower ground heights. For , the results in Figure 15 indicate the coexistence of several stable branches within the height range of approximately to 2 times the chord length. A relatively small initial condition in pitch allows the system to follow a low-amplitude branch while decreasing the height. Conversely, if the initial condition were larger, the system could transition to a different basin of attraction, reaching the red stable branch -— this behavior is observed when increasing the height.
4. Conclusions
The study investigated the aeroelastic behavior of an airfoil equipped with a nonlinear passive absorber in uniform flow near the ground. This absorber acted as both a tuned mass damper and a nonlinear energy sink, effectively dissipating energy from the unstable system. The airfoil was modeled as a typical section with geometric nonlinearity, subjected to nonlinear aerodynamic loads using the unsteady discrete vortex method, while the ground effect was simulated via the mirror image method. The primary goal was to assess the absorber’s effectiveness in mitigating aeroelastic instability, particularly by delaying flutter onset and reducing limit cycle oscillation amplitude. Key design parameters of the nonlinear tuned vibration absorber (NLTVA) were analyzed, including linear stiffness, damping, cubic stiffness, and airfoil height from the ground. The approach also provided insights into modeling instability behaviors, such as supercritical and subcritical bifurcations, influenced by various factors including geometric nonlinearities and wake interactions. However, the use of continuation techniques to a nonlinear aeroelastic model with time-domain nonlinear aerodynamics is particularly challenging and merits further consideration.
The nonlinear tuned vibration absorber was designed to increase flutter onset speed. A linear stability analysis showed a increase in flutter speed with an optimal combination of linear stiffness and damping. Both the UDVM and Wagner’s approach demonstrated consistent results in the absence of ground effects. However, introducing ground effects reduced the flutter speed as the airfoil approached the ground, due to increased aerodynamic loads from altered wake dynamics. Importantly, the presence of the absorber significantly enhanced the flutter onset speed, improving it by to as the airfoil’s height above the ground varied from to of the chord length, compared to cases without the absorber.
Post-flutter analyses revealed that the nonlinear tuned vibration absorber can induce subcritical or supercritical behavior, and also jumps associated with limit points. Using only the linear component of the absorber resulted in subcritical bifurcation, while incorporating the nonlinear component shifted the behavior to supercritical bifurcation, significantly reducing the LCO amplitude under the ground influence. The global effectiveness of the NLTVA in reducing LCO amplitudes decreases at lower ground heights due to stronger ground influence. The system’s bifurcation behavior was sensitive to the nonlinear stiffness of the NLTVA, with higher stiffness values leading to jumps to higher amplitude LCO. To avoid subcritical bifurcation, which can cause sudden and explosive motion, it is crucial to determine an optimal nonlinear parameter for the NLTVA that works effectively in both near-ground and far-from-ground scenarios. This study underscores the effectiveness of NLTVA in mitigating the aeroelastic instabilities in a near-ground scenario, which could be advantageous in the dynamic stability control of aero-elastically vulnerable aircraft with highly flexible wings.
Author Contributions
Conceptualization, K.D. and B.C.; methodology, K.D.; writing—original draft preparation, K.D.; writing—review and editing, B.C.; funding acquisition, B.C. All authors have read and agreed to the published version of the manuscript.
Funding
The authors are grateful for the financial support of the French Armed Forces Ministry and Defense Innovation Agency.
Conflicts of Interest
The authors declare no conflicts of interest. The funders had no role in the design of the study; in the collection, analyses, or interpretation of data; in the writing of the manuscript; or in the decision to publish the results.
References
- Palacios, R.; Cesnik, C. Dynamics of Flexible Aircraft: Coupled Flight Mechanics, Aeroelasticity, and Control; Cambridge Aerospace Series, Cambridge University Press, 2023.
- Amato, E.M.; Polsinelli, C.; Cestino, E.; Frulla, G.; Joseph, N.; Carrese, R.; Marzocca, P. HALE wing experiments and computational models to predict nonlinear flutter and dynamic response. The Aeronautical Journal 2019, 123, 912–946. [Google Scholar] [CrossRef]
- Dhital, K.; Nguyen, A.T.; Han, J.H. Aeroelastic modeling and analysis of wings in proximity. Aerospace Science and Technology 2022, 130, 107955. [Google Scholar] [CrossRef]
- Phillips, W.F.; Hunsaker, D.F. Lifting-Line Predictions for Induced Drag and Lift in Ground Effect. Journal of Aircraft 2013, 50, 1226–1233. [Google Scholar] [CrossRef]
- Dhital, K.; Han, J.H. Ground Effect on Flutter and Limit Cycle Oscillation of Airfoil with Flap. Journal of Aircraft 2021, 58, 688–692. [Google Scholar] [CrossRef]
- Nuhait, A.O.; Mook, D.T. Aeroelastic Behavior of Flat Plates Moving Near the Ground. Journal of Aircraft 2010, 47, 464–474. [Google Scholar] [CrossRef]
- Librescu, L.; Marzocca, P. Advances in the linear/nonlinear control of aeroelastic structural systems. Acta Mechanica 2005, 178, 147–186. [Google Scholar] [CrossRef]
- Livne, E. Aircraft Active Flutter Suppression: State of the Art and Technology Maturation Needs. Journal of Aircraft 2018, 55, 410–452. [Google Scholar] [CrossRef]
- Hu, J.; Zhou, L. Semi-active flutter control of a high-aspect-ratio wing using multiple MR dampers. Sensors and Smart Structures Technologies for Civil, Mechanical, and Aerospace Systems 2007; Tomizuka, M.; Yun, C.B.; Giurgiutiu, V., Eds. International Society for Optics and Photonics, SPIE, 2007, Vol. 6529, p. 65291C. [CrossRef]
- Almajhali, K.Y.M. Review on passive energy dissipation devices and techniques of installation for high rise building structures. Structures 2023, 51, 1019–1029. [Google Scholar] [CrossRef]
- Gattulli, V.; Luongo, A.; others. Nonlinear tuned mass damper for self-excited oscillations. Wind and Structures 2004, 7, 251–264. [Google Scholar] [CrossRef]
- Alcorta, R.; Chouvion, B.; Michon, G.; Montagnier, O. On the use of frictional dampers for flutter mitigation of a highly flexible wing. International Journal of Non-Linear Mechanics 2023, 156, 104515. [Google Scholar] [CrossRef]
- Sinha, A.; Griffin, J.H. Friction damping of flutter in gas turbine engine airfoils. Journal of Aircraft 1983, 20, 372–376. [Google Scholar] [CrossRef]
- Lee, Y.S.; Vakakis, A.F.; Bergman, L.A.; McFarland, D.M.; Kerschen, G. Suppression Aeroelastic Instability Using Broadband Passive Targeted Energy Transfers, Part 1: Theory. AIAA Journal 2007, 45, 693–711. [Google Scholar] [CrossRef]
- Lee, Y.S.; Kerschen, G.; McFarland, D.M.; Hill, W.J.; Nichkawde, C.; Strganac, T.W.; Bergman, L.A.; Vakakis, A.F. Suppressing Aeroelastic Instability Using Broadband Passive Targeted Energy Transfers, Part 2: Experiments. AIAA Journal 2007, 45, 2391–2400. [Google Scholar] [CrossRef]
- Tian, W.; Li, Y.; Li, P.; Yang, Z.; Zhao, T. Passive control of nonlinear aeroelasticity in hypersonic 3-D wing with a nonlinear energy sink. Journal of Sound and Vibration 2019, 462, 114942. [Google Scholar] [CrossRef]
- Fernandez Escudero, C.; Prothin, S.; Laurendeau, E.; Ross, A.; Michon, G. Nonlinear flap for passive flutter control of bidimensional wing. Journal of Vibration and Control 2023. [Google Scholar] [CrossRef]
- García Pérez, J.; Ghadami, A.; Sanches, L.; Michon, G.; Epureanu, B.I. Data-driven optimization for flutter suppression by using an aeroelastic nonlinear energy sink. Journal of Fluids and Structures 2022, 114, 103715. [Google Scholar] [CrossRef]
- Malher, A.; Touzé, C.; Doaré, O.; Habib, G.; Kerschen, G. Passive control of airfoil flutter using a nonlinear tuned vibration absorber. 11th International Conference on Flow-induced vibrations, FIV2016, 2016.
- Malher, A.; Touzé, C.; Doaré, O.; Habib, G.; Kerschen, G. Flutter Control of a Two-Degrees-of-Freedom Airfoil Using a Nonlinear Tuned Vibration Absorber. Journal of Computational and Nonlinear Dynamics 2017, 12, 051016. [Google Scholar] [CrossRef]
- Lacarbonara, W.; Cetraro, M. Flutter Control of a Lifting Surface via Visco-Hysteretic Vibration Absorbers. International Journal of Aeronautical and Space Sciences 2011, 12, 331–345. [Google Scholar] [CrossRef]
- Verstraelen, E.; Habib, G.; Kerschen, G.; Dimitriadis, G. Experimental Passive Flutter Suppression Using a Linear Tuned Vibration Absorber. AIAA Journal 2017, 55, 1707–1722. [Google Scholar] [CrossRef]
- Fernandez-Escudero, C.; Prothin, S.; Laurendeau, E.; Ross, A.; Michon, G. Nonlinear flap for passive flutter control of bidimensional wing. Journal of Vibration and Control 2023, 0, 10775463231223778. [Google Scholar] [CrossRef]
- Theodorsen, T. General Theory of Aerodynamic Instability and the Mechanism of Flutter. 1934.
- Moryossef, Y.; Levy, Y. Effect of Oscillations on Airfoils in Close Proximity to the Ground. AIAA Journal 2004, 42, 1755–1764. [Google Scholar] [CrossRef]
- Molina, J.; Zhang, X. Aerodynamics of a Heaving Airfoil in Ground Effect. AIAA Journal 2011, 49, 1168–1179. [Google Scholar] [CrossRef]
- Nuhait, A.O.; Zedan, M.F. Numerical simulation of unsteady flow induced by a flat plate movingnear ground. Journal of Aircraft 1993, 30, 611–617. [Google Scholar] [CrossRef]
- Han, C.; Yoon, Y.; Cho, J. Unsteady Aerodynamic Analysis of Tandem Flat Plates in Ground Effect. Journal of Aircraft 2002, 39, 1028–1034. [Google Scholar] [CrossRef]
- Price, S.; Alighanbari, H.; Lee, B. The Aeroelastic Response of a Two-Dimensional Airfoil with Bilinear and Cubic Structural Nonlinearities. Journal of Fluids and Structures 1995, 9, 175–193. [Google Scholar] [CrossRef]
- Lee, B.; Price, S.; Wong, Y. Nonlinear aeroelastic analysis of airfoils: bifurcation and chaos. Progress in Aerospace Sciences 1999, 35, 205–334. [Google Scholar] [CrossRef]
- Katz, J.; Plotkin, A. , Frontmatter. In Low-Speed Aerodynamics; Cambridge Aerospace Series, Cambridge University Press, 2001; p. i–vi.
- Ramasamy, M.; Leishman, J.G. A Reynolds Number-Based Blade Tip Vortex Model. Journal of The American Helicopter Society 2007, 52, 214–223. [Google Scholar] [CrossRef]
- Dhital, K.; Han, J.H. Aeroelastic Behavior of Two Airfoils in Proximity. AIAA Journal 2022, 60, 2522–2532. [Google Scholar] [CrossRef]
- Alighanbari, H.; Price, S.J. The post-Hopf-bifurcation response of an airfoil in incompressible two-dimensional flow. Nonlinear Dynamics 1996, 10, 381–400. [Google Scholar] [CrossRef]
Figure 1.
Typical section model with NLTVA near ground.
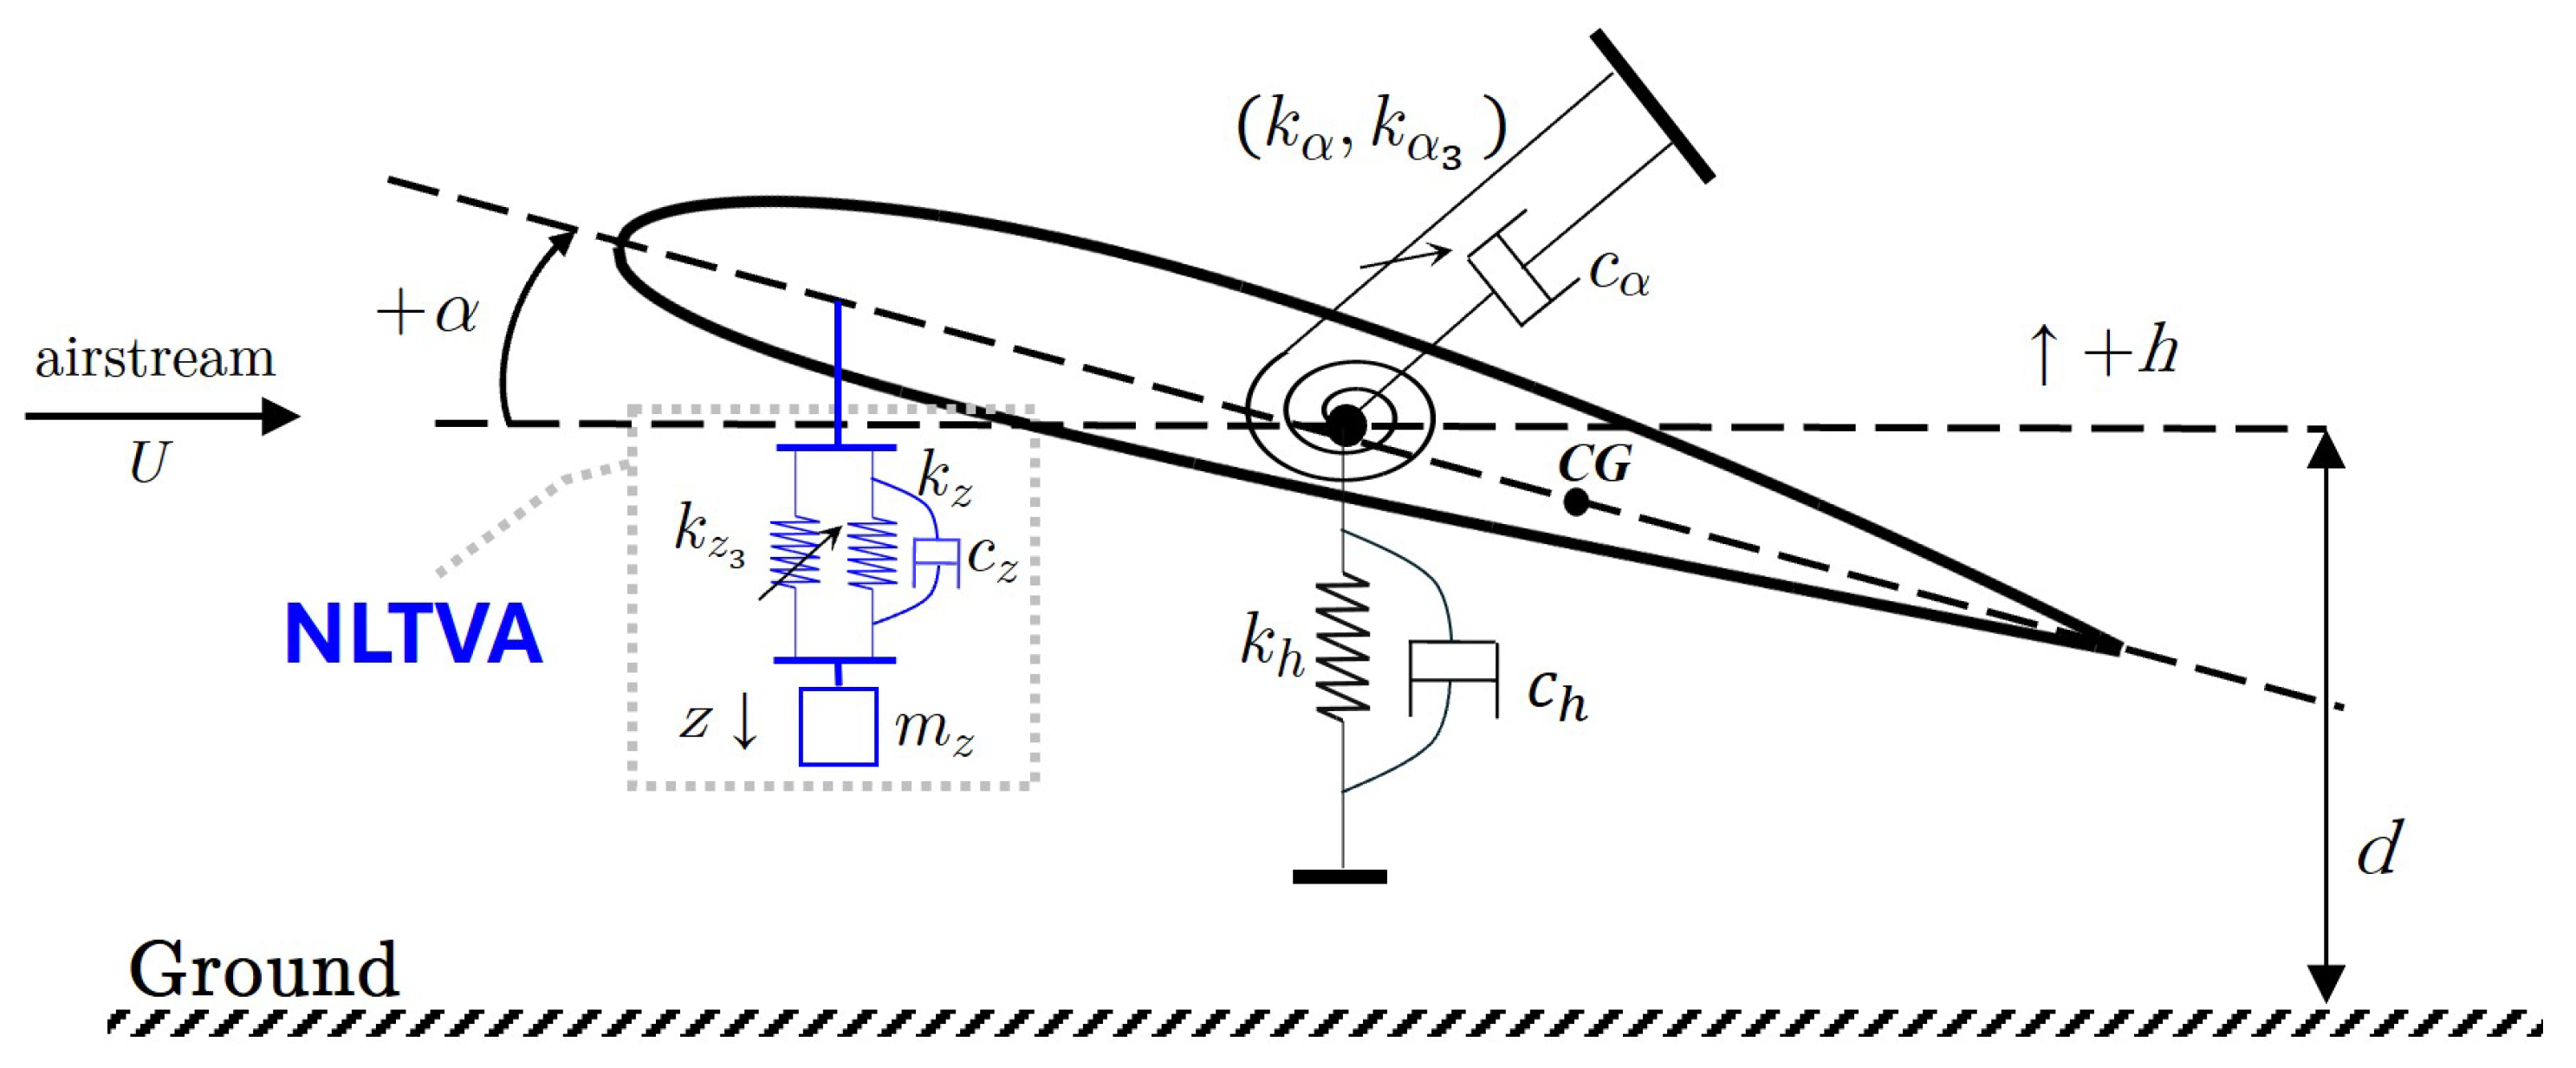
Figure 2.
Discretization of an airfoil, its wake, and their mirror images by discrete vortices.
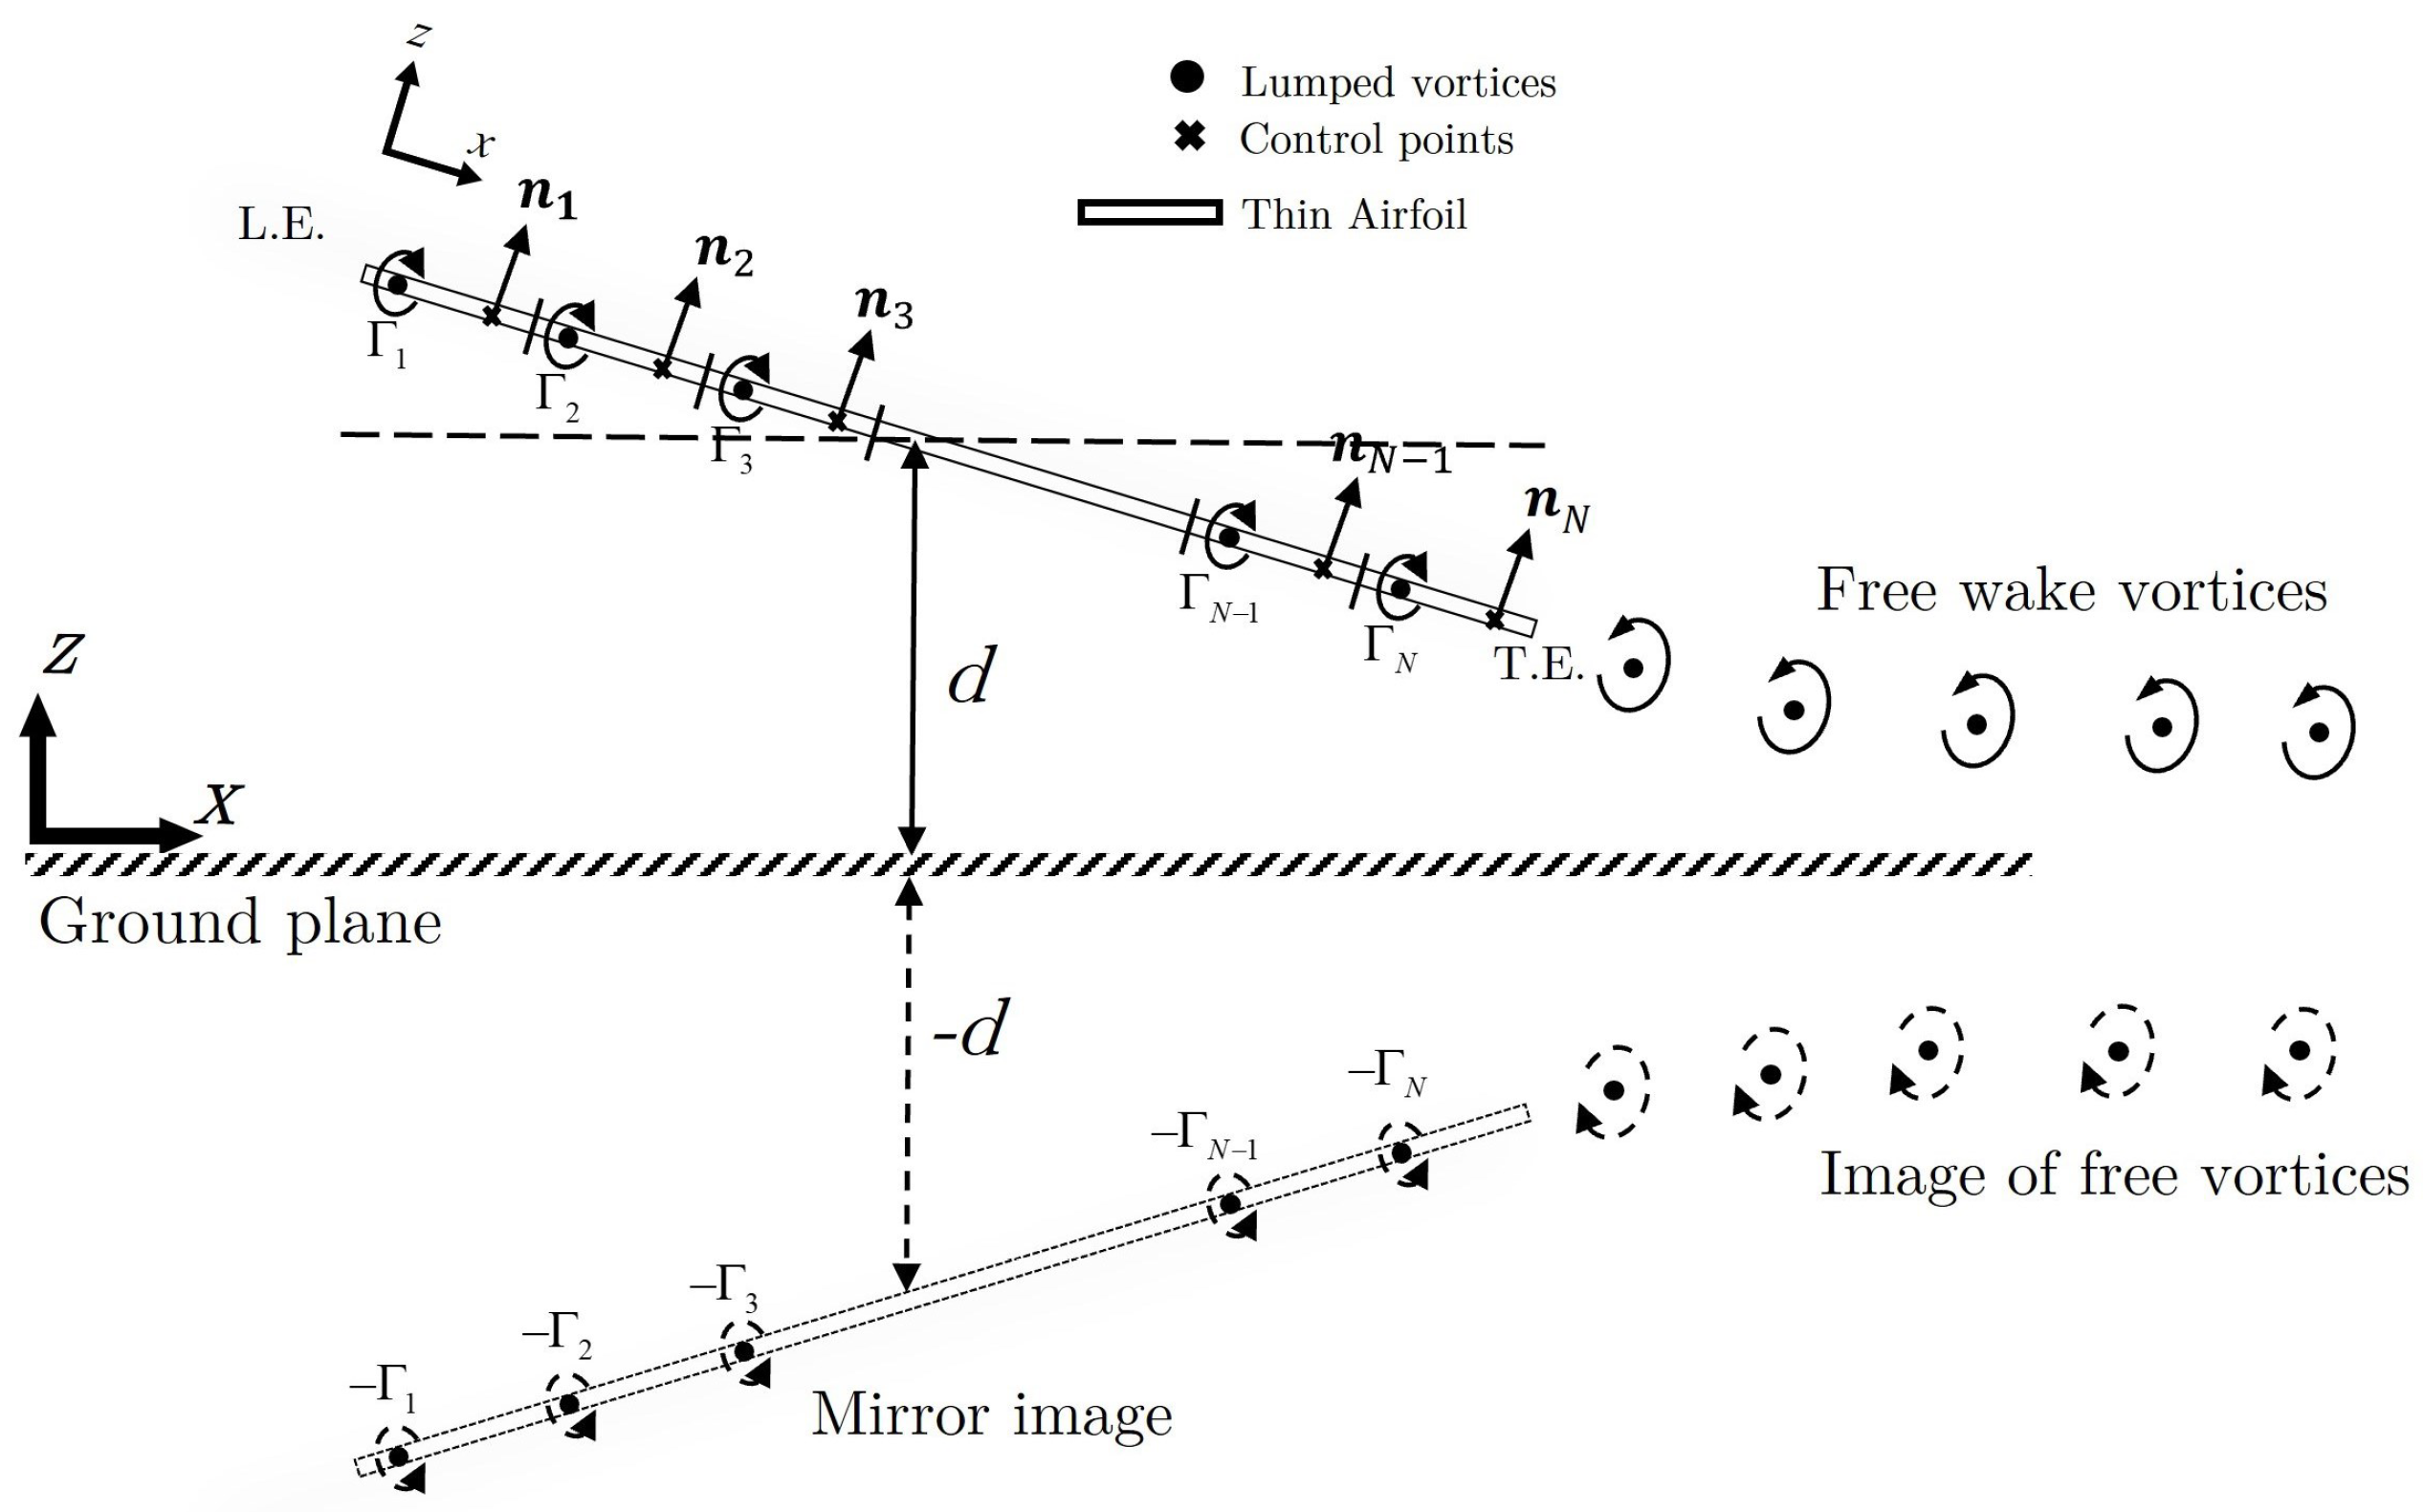
Figure 3.
Schematic flowchart for a time-iterative aeroelastic solution using the UDVM.
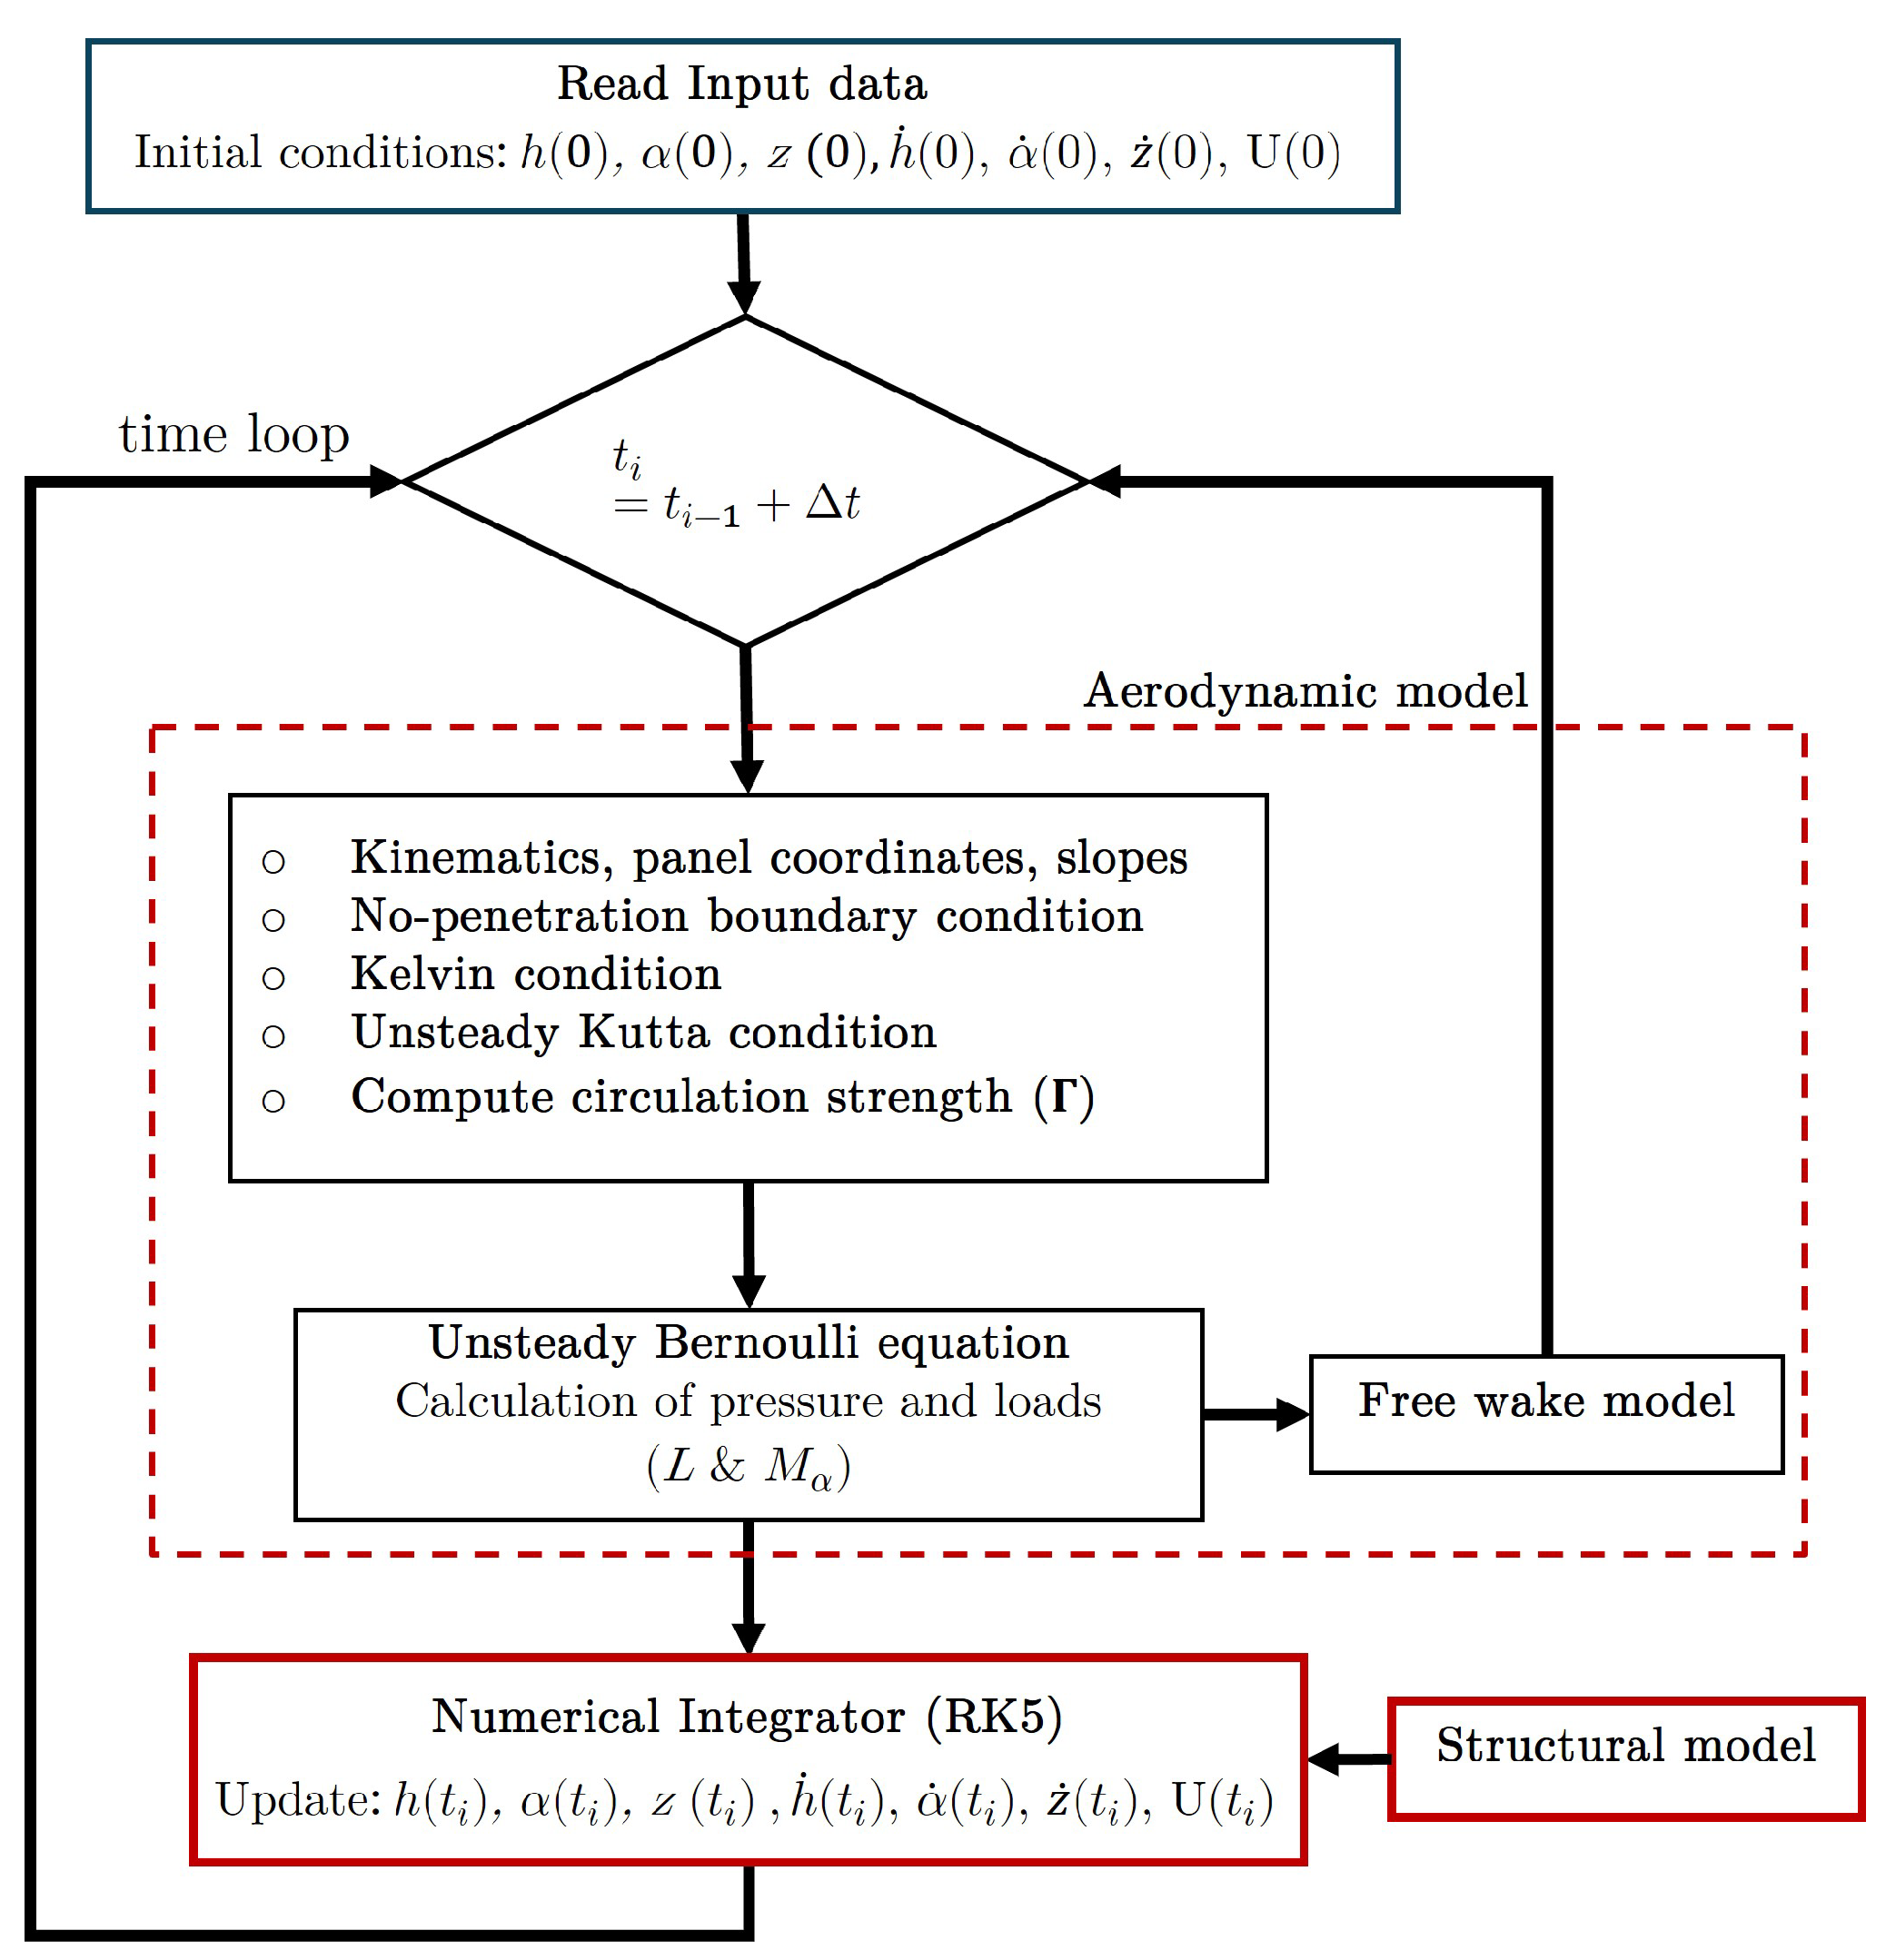
Figure 4.
Aeroelastic response below, above, and at the flutter speed using the UDVM (without absorber).
Figure 4.
Aeroelastic response below, above, and at the flutter speed using the UDVM (without absorber).
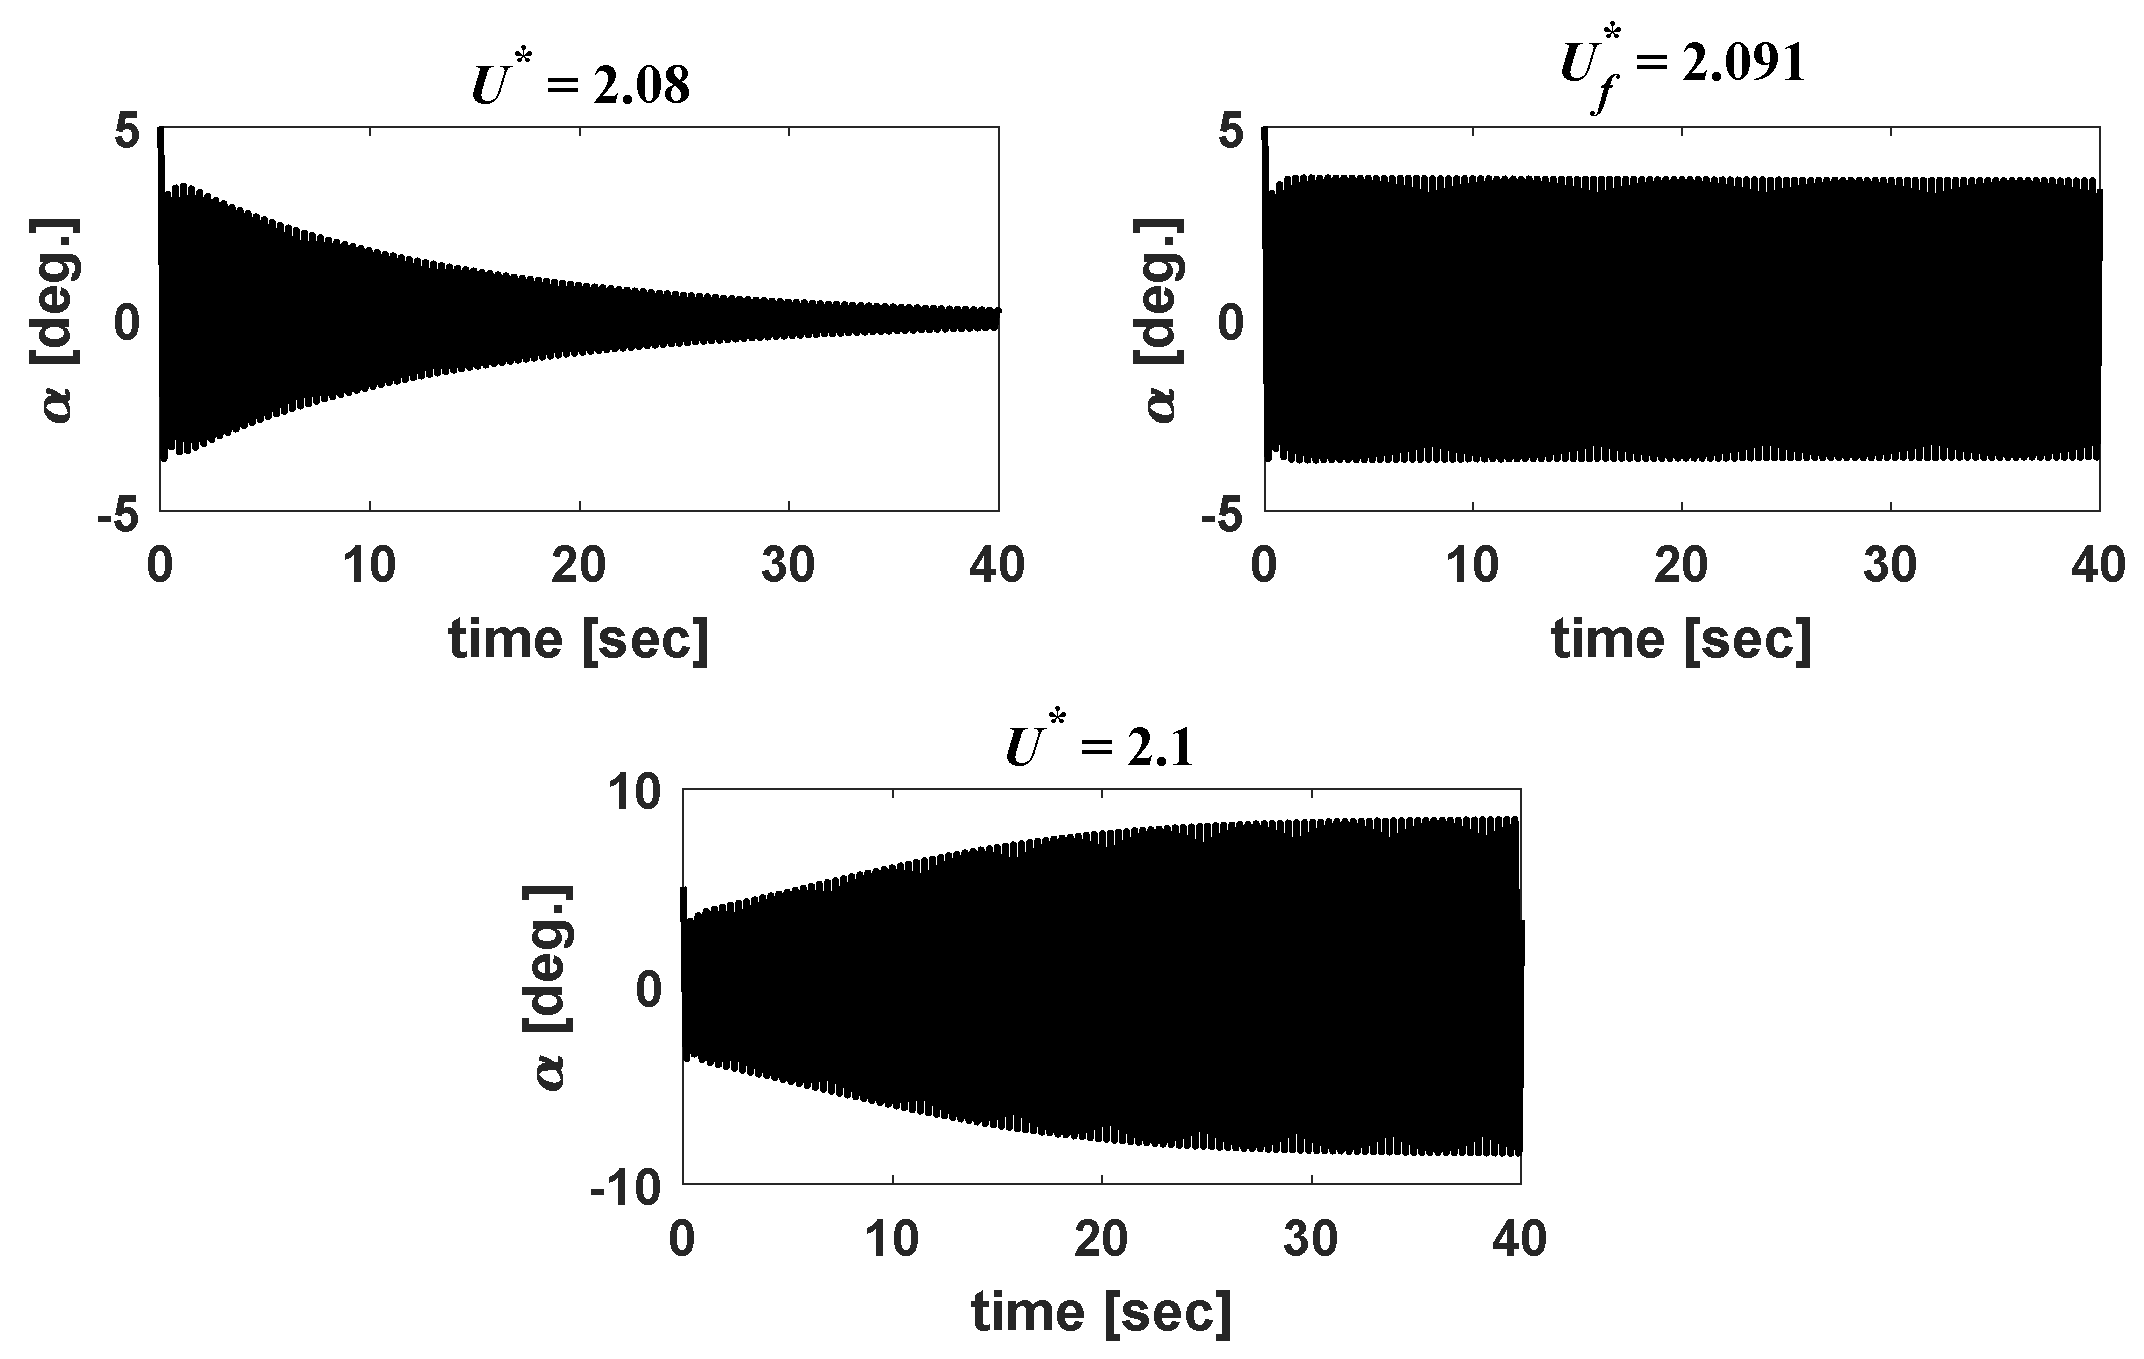
Figure 5.
Ground effect on the flutter speed (without absorber).
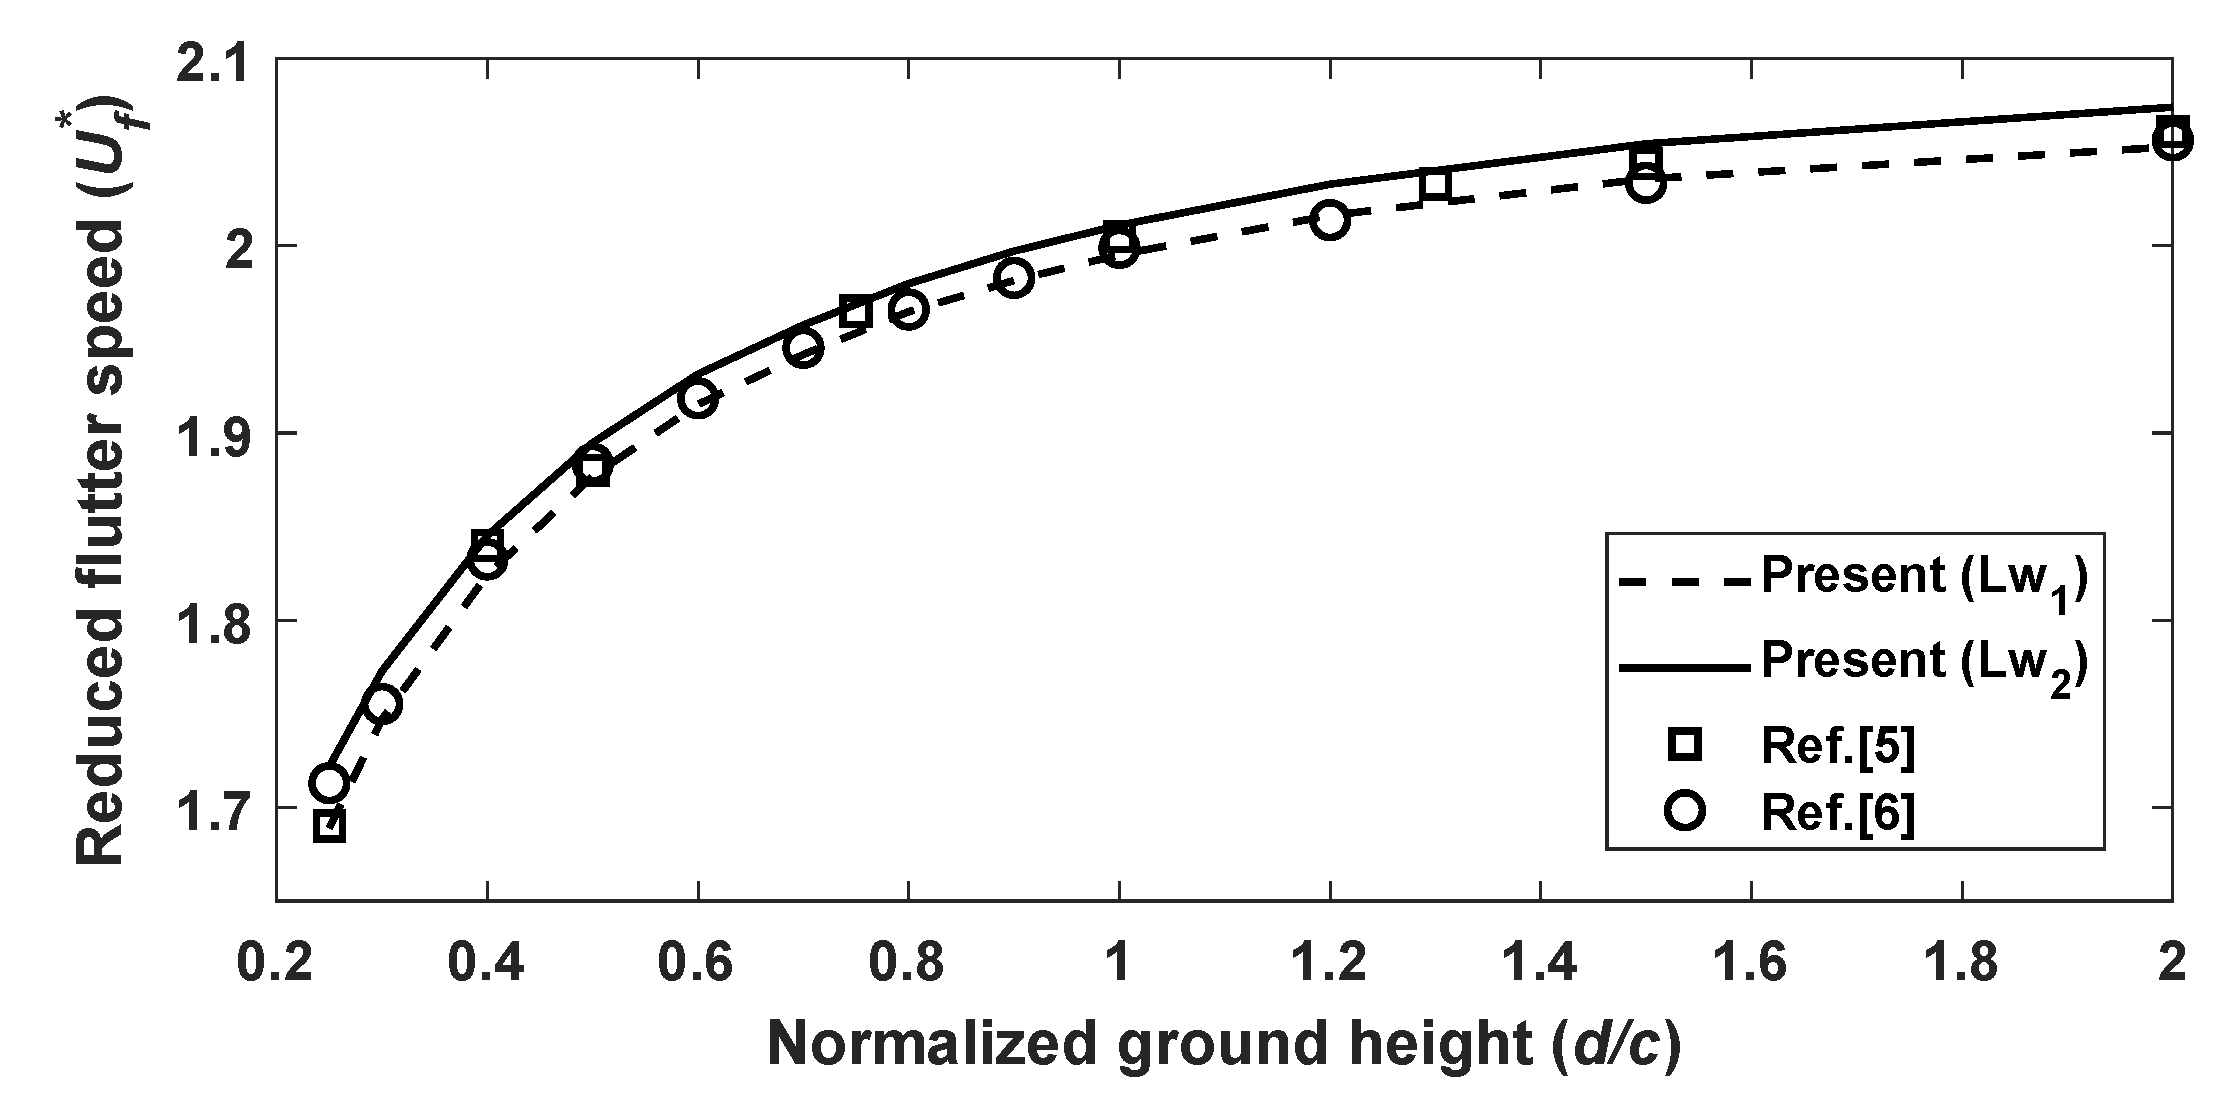
Figure 6.
Cartography of the reduced flutter speed as a function of NLTVA to pitch frequency ratio () and damping coefficient ().
Figure 6.
Cartography of the reduced flutter speed as a function of NLTVA to pitch frequency ratio () and damping coefficient ().
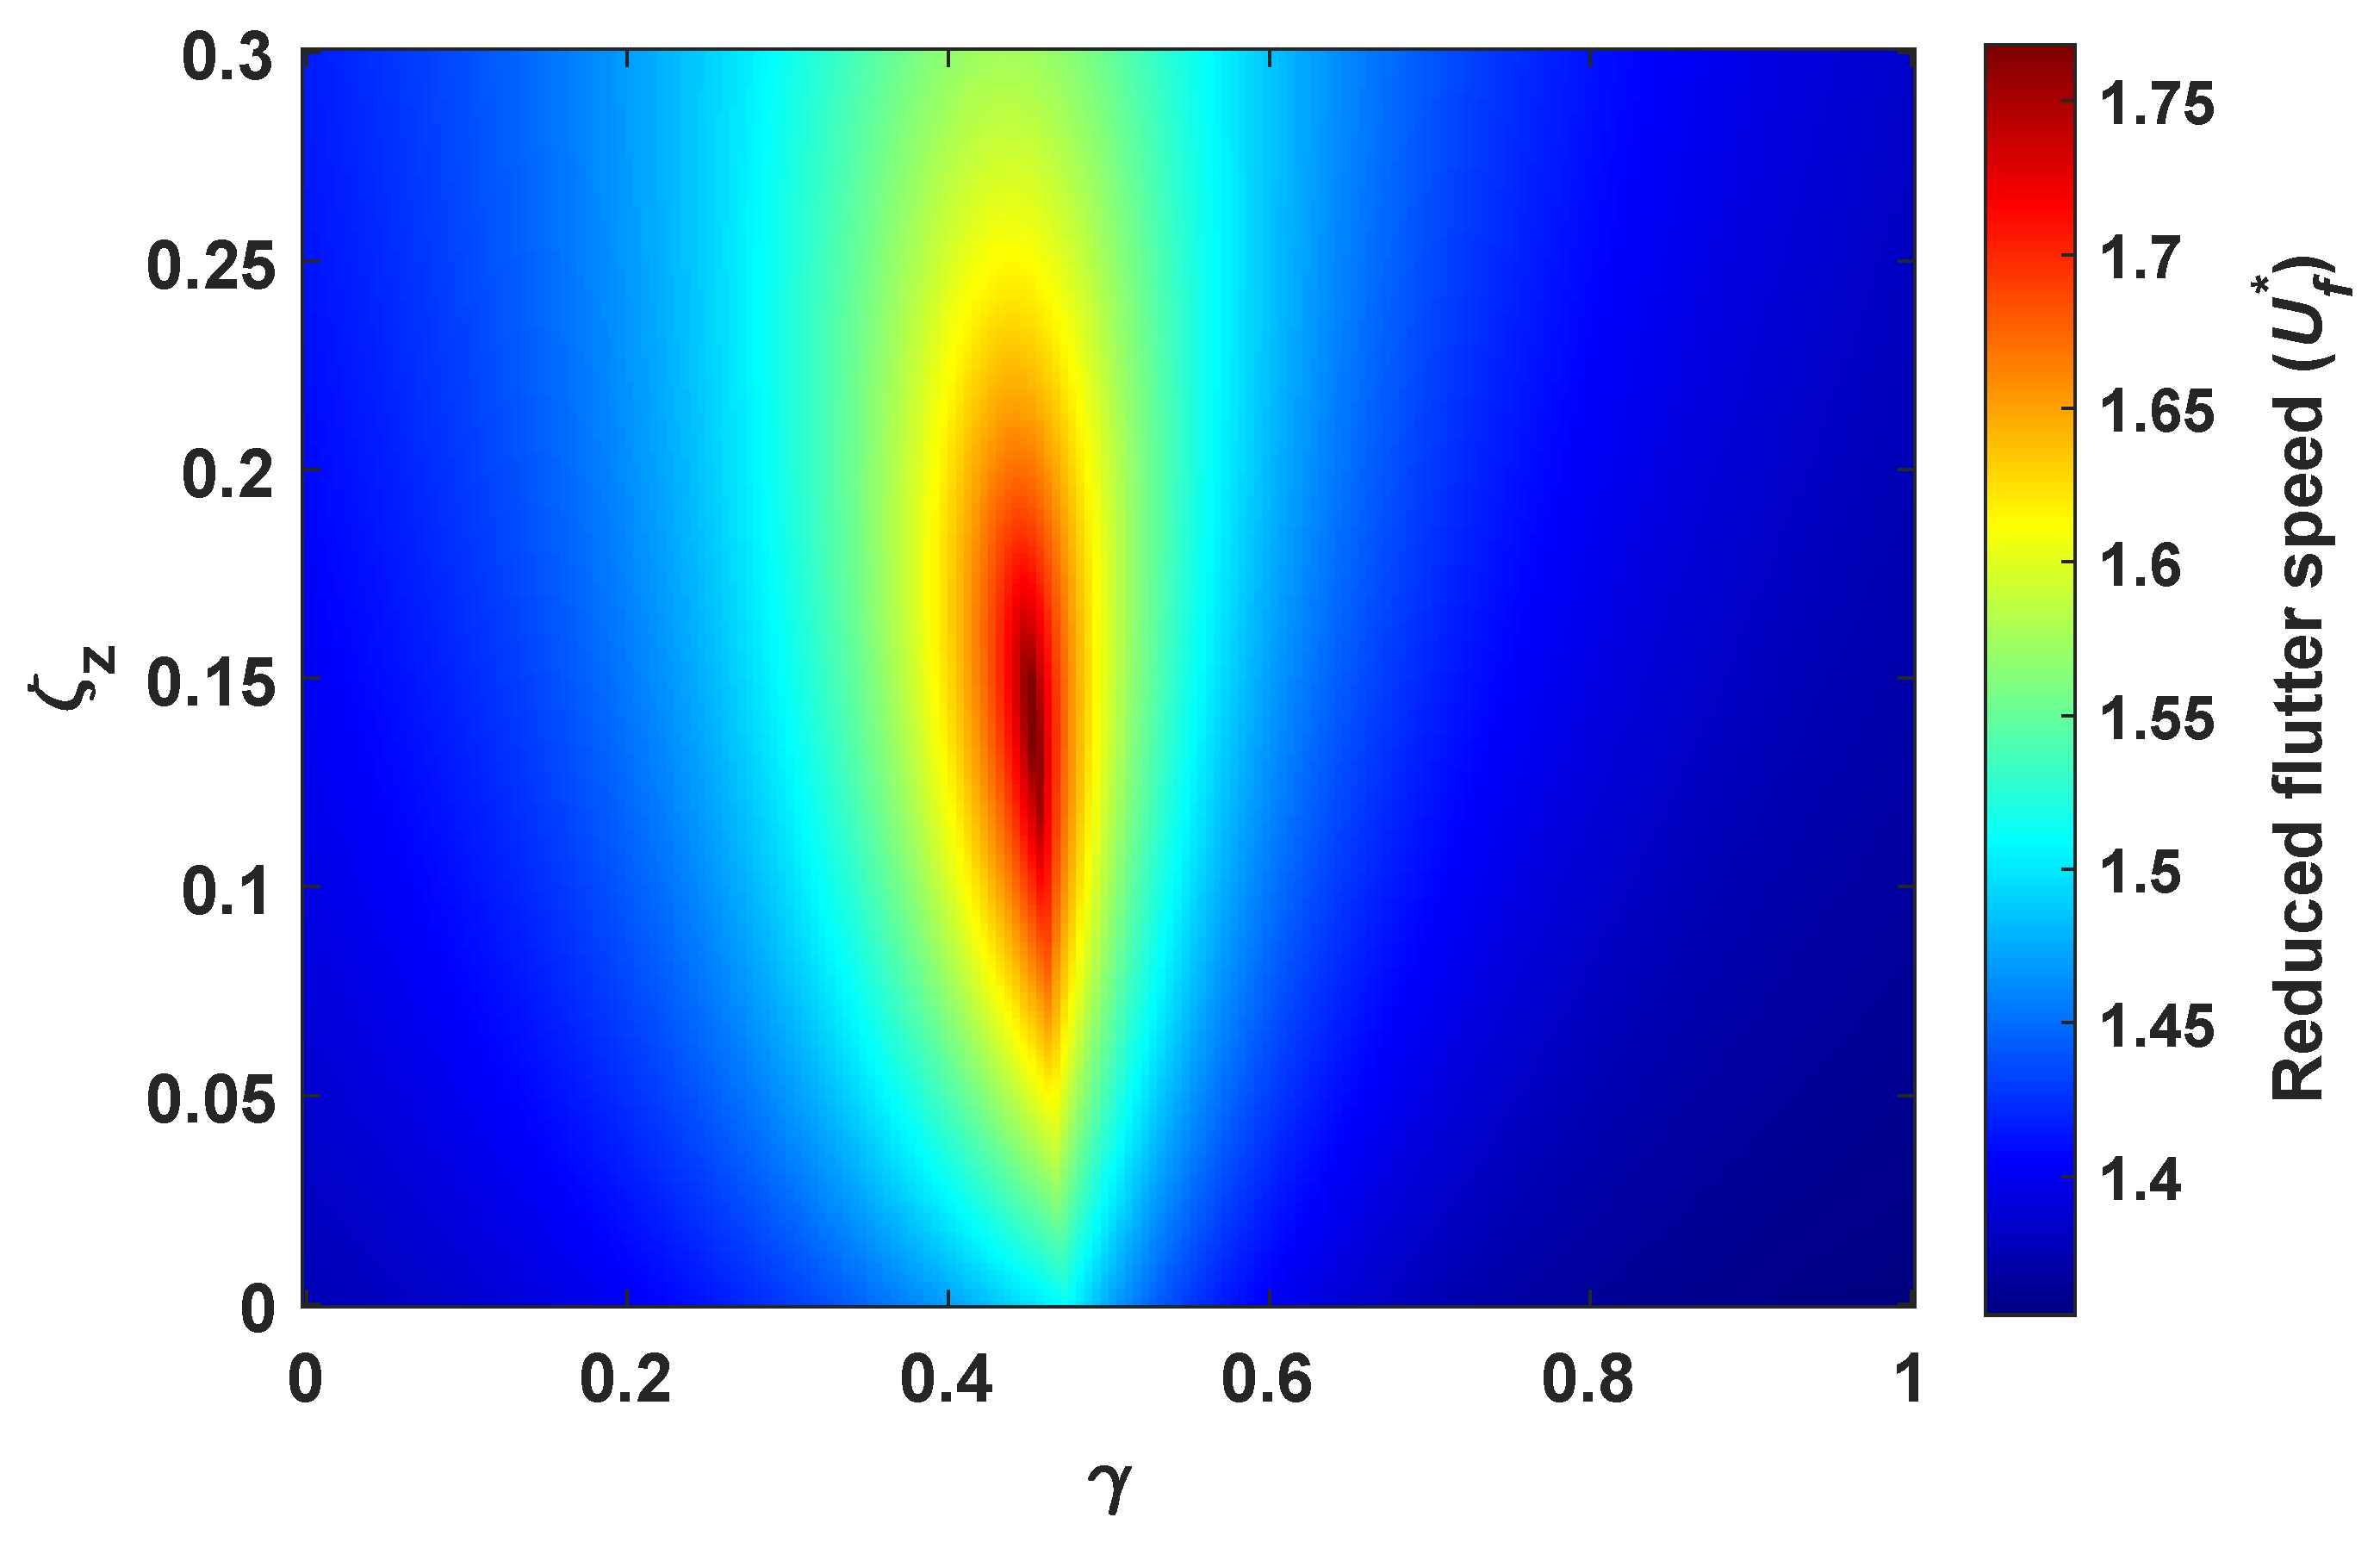
Figure 7.
Effect of NLTVA-pitch frequency ratio on the flutter speed (and with ).
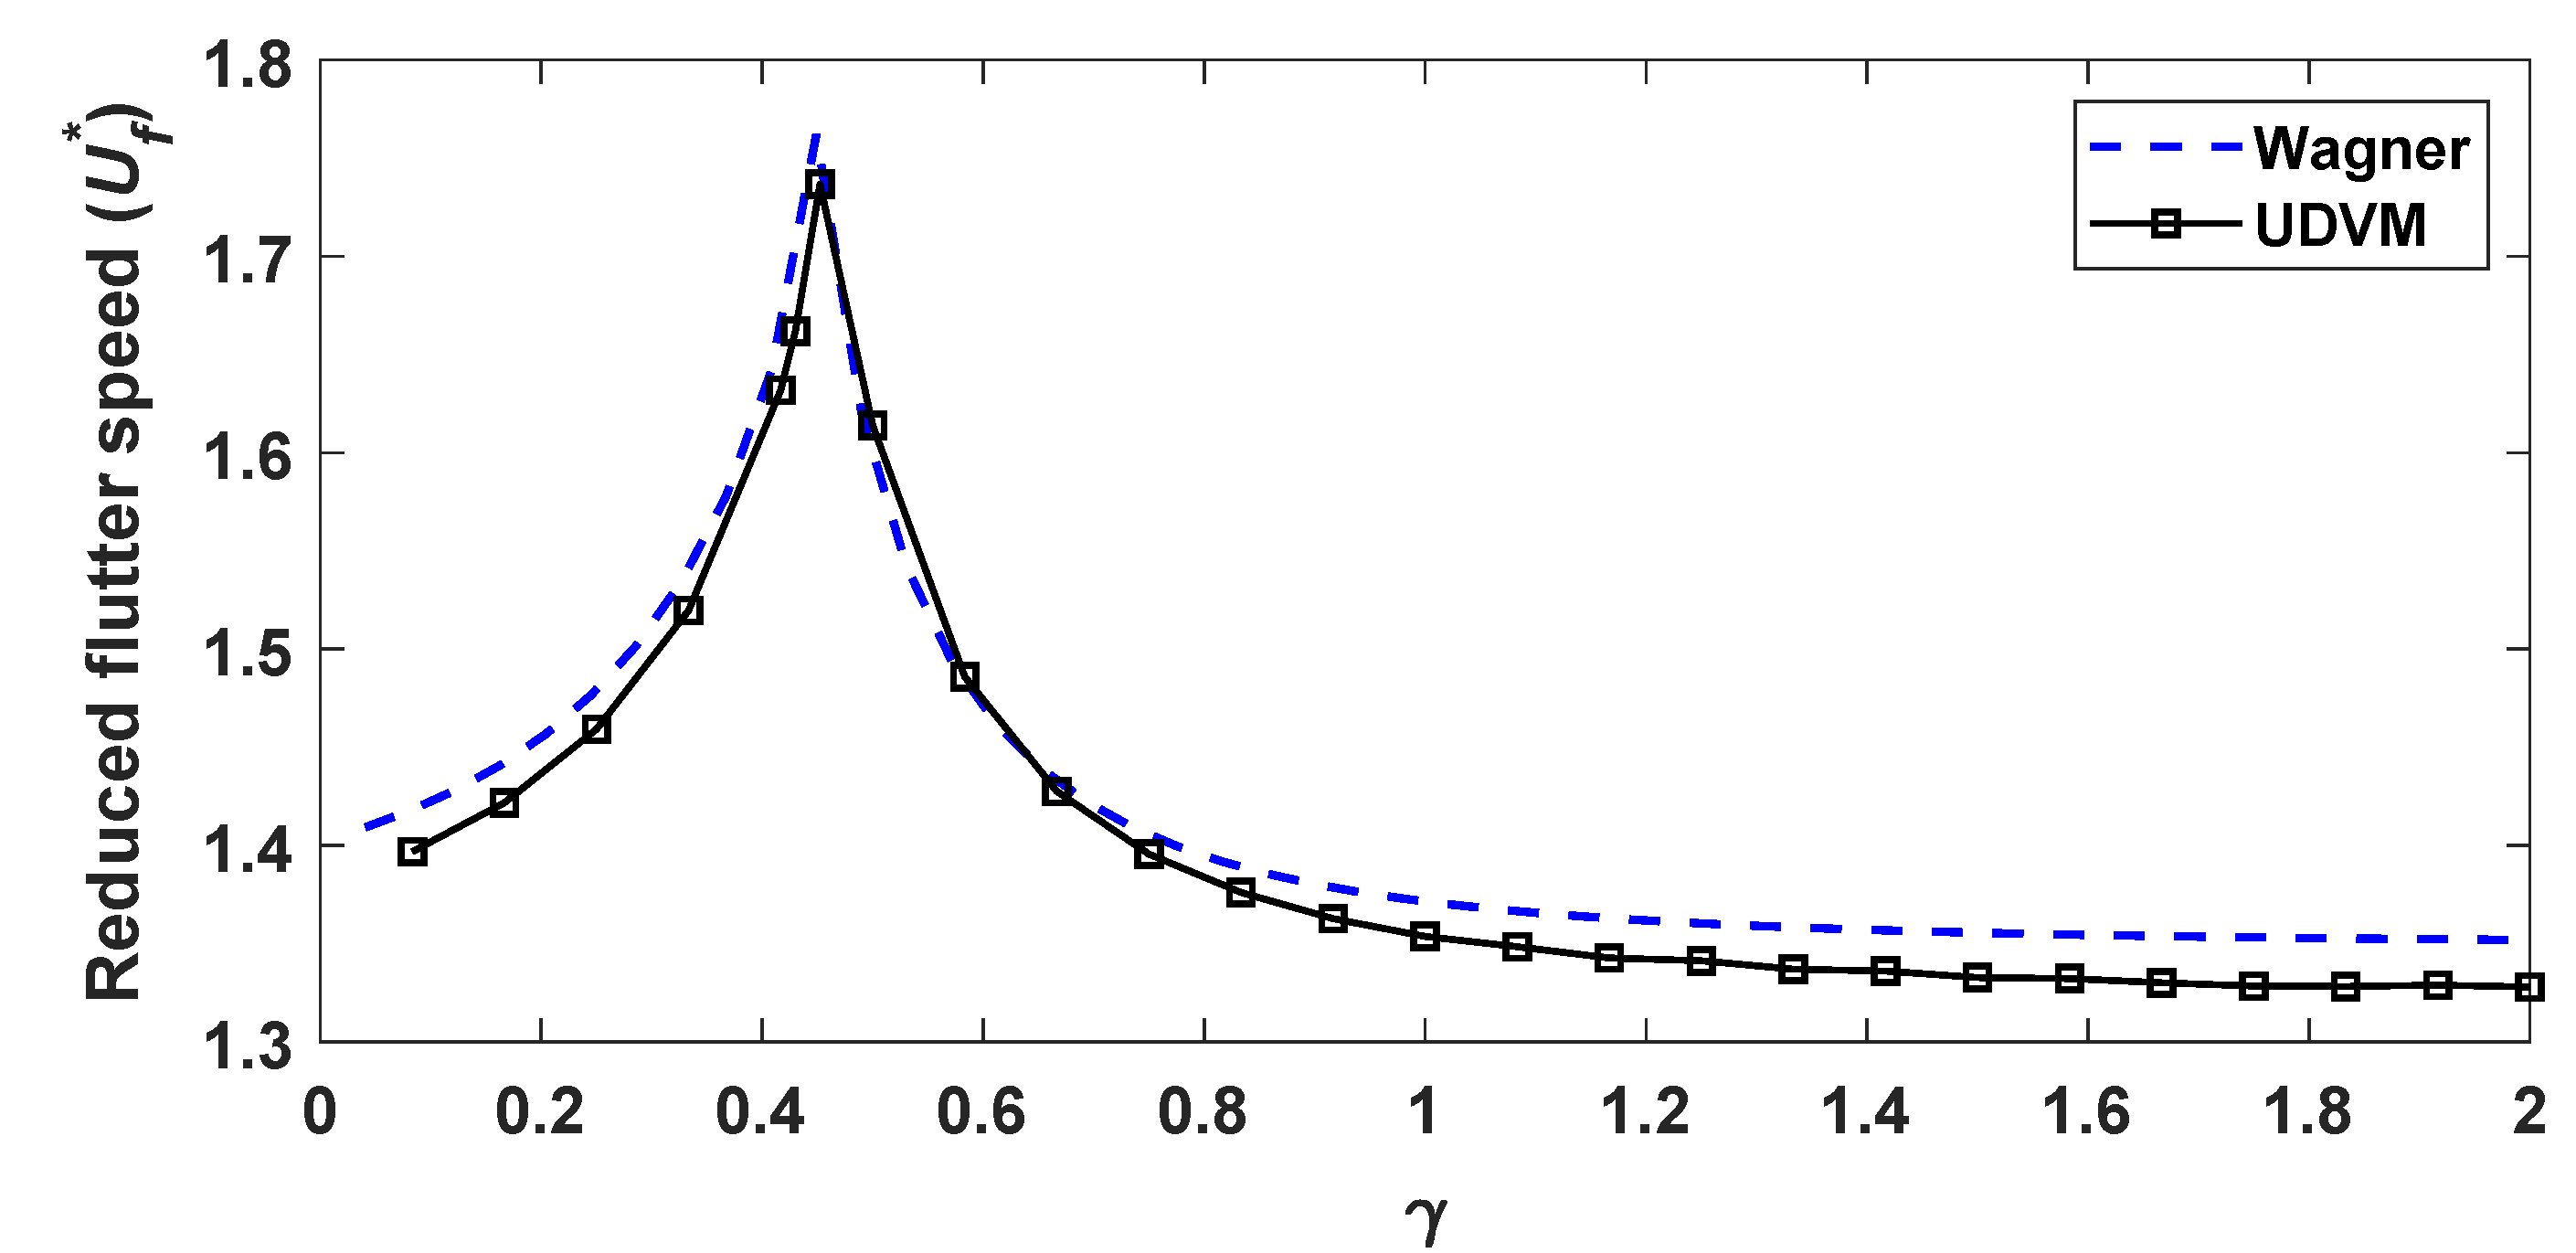
Figure 8.
Eigenvalue results obtained using the Wagner approach (and with ).
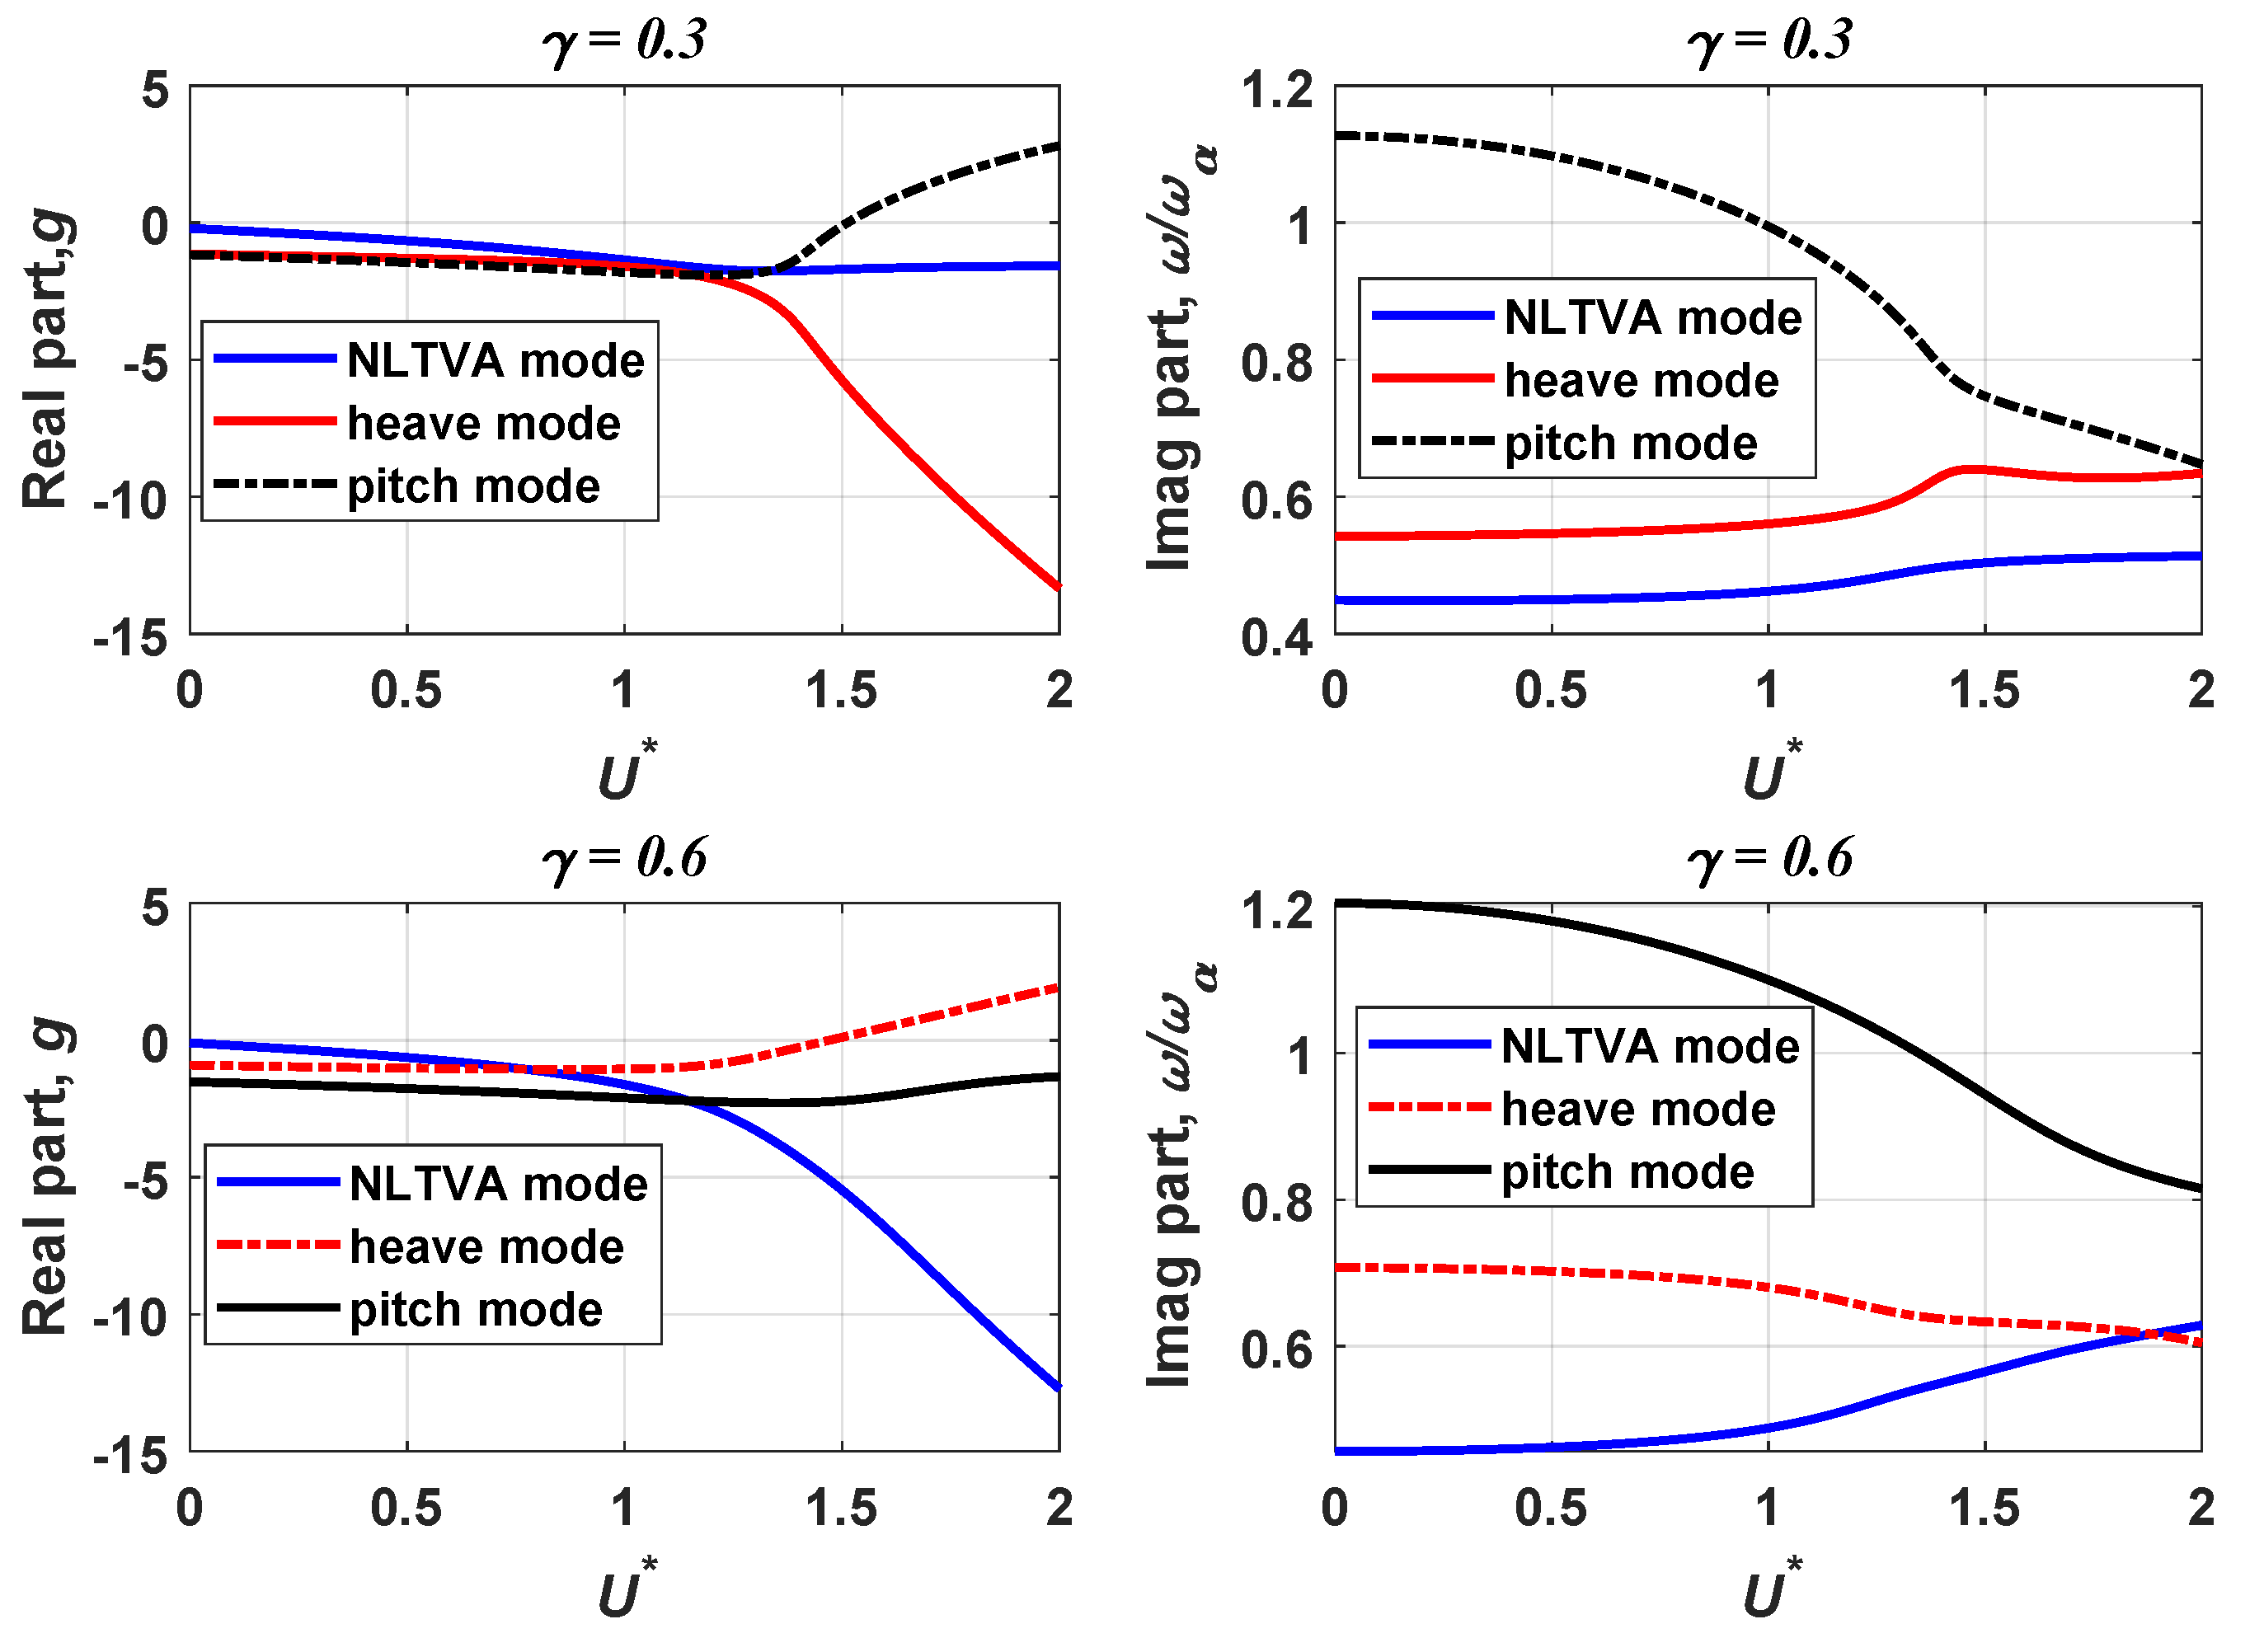
Figure 9.
Ground effect on the flutter speed.
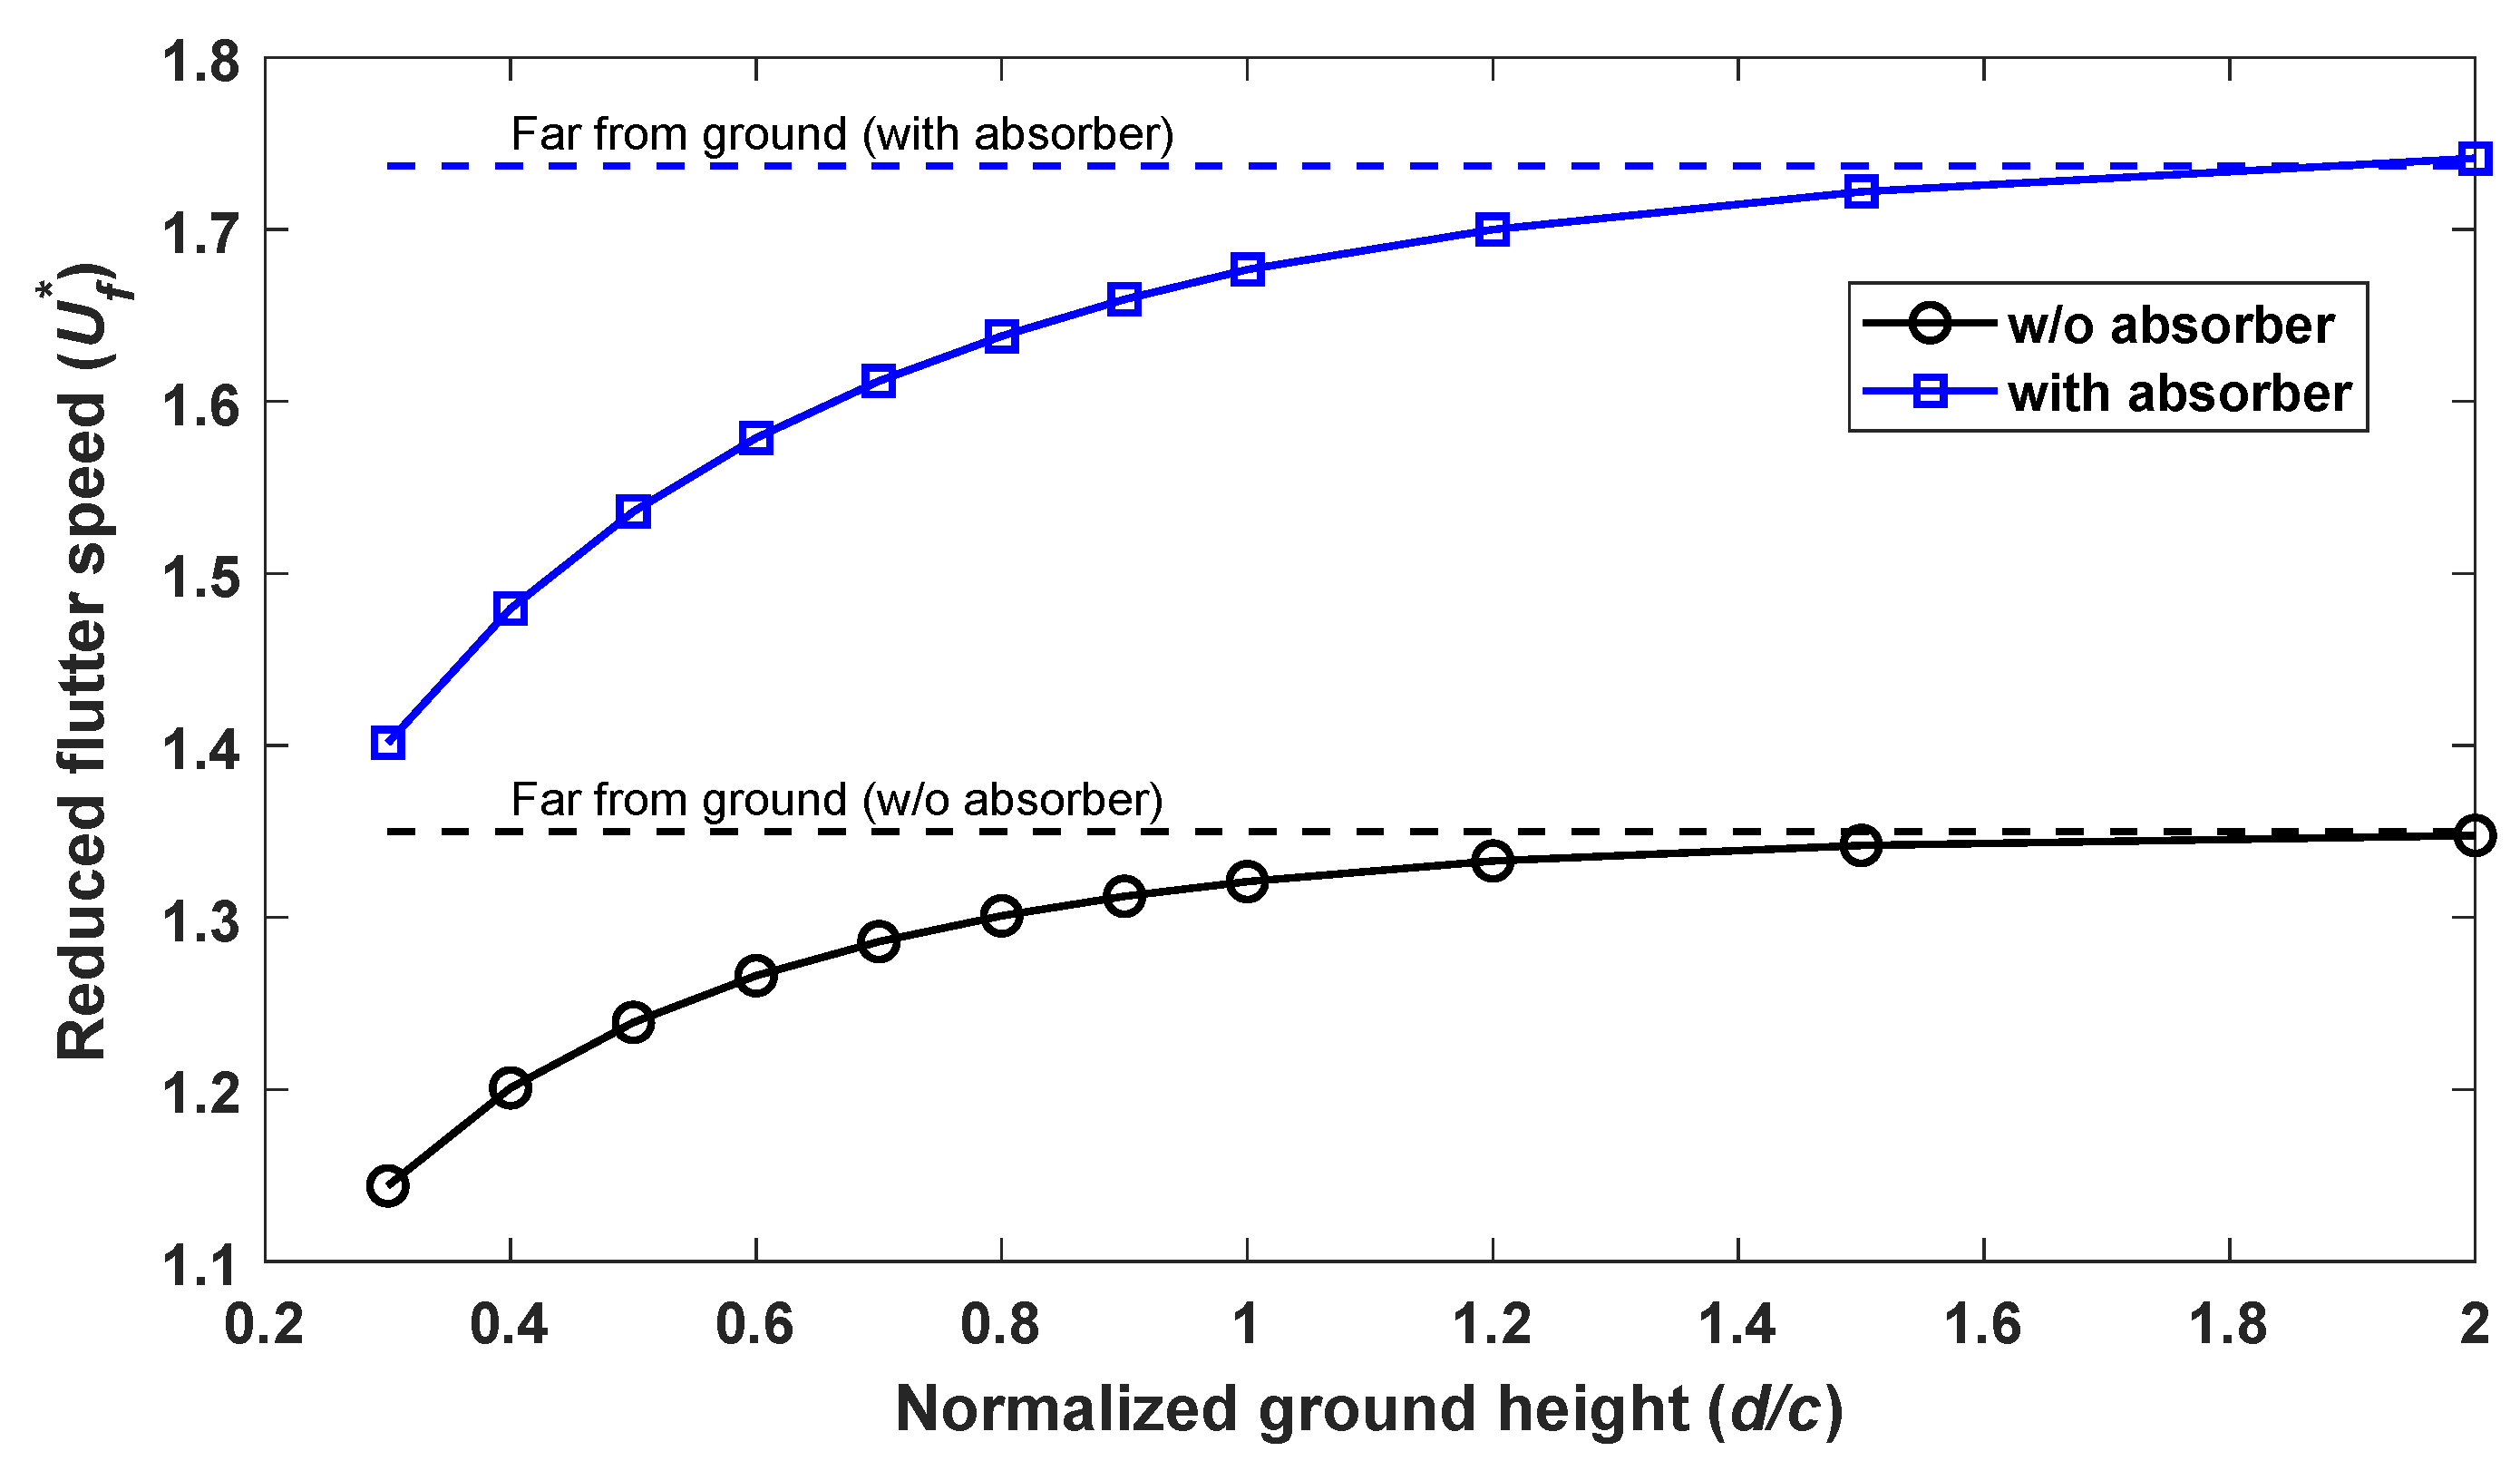
Figure 10.
Post-flutter response of an airfoil without absorber and far from ground.

Figure 11.
Post-flutter response of an airfoil with a NLTVA and far from ground.
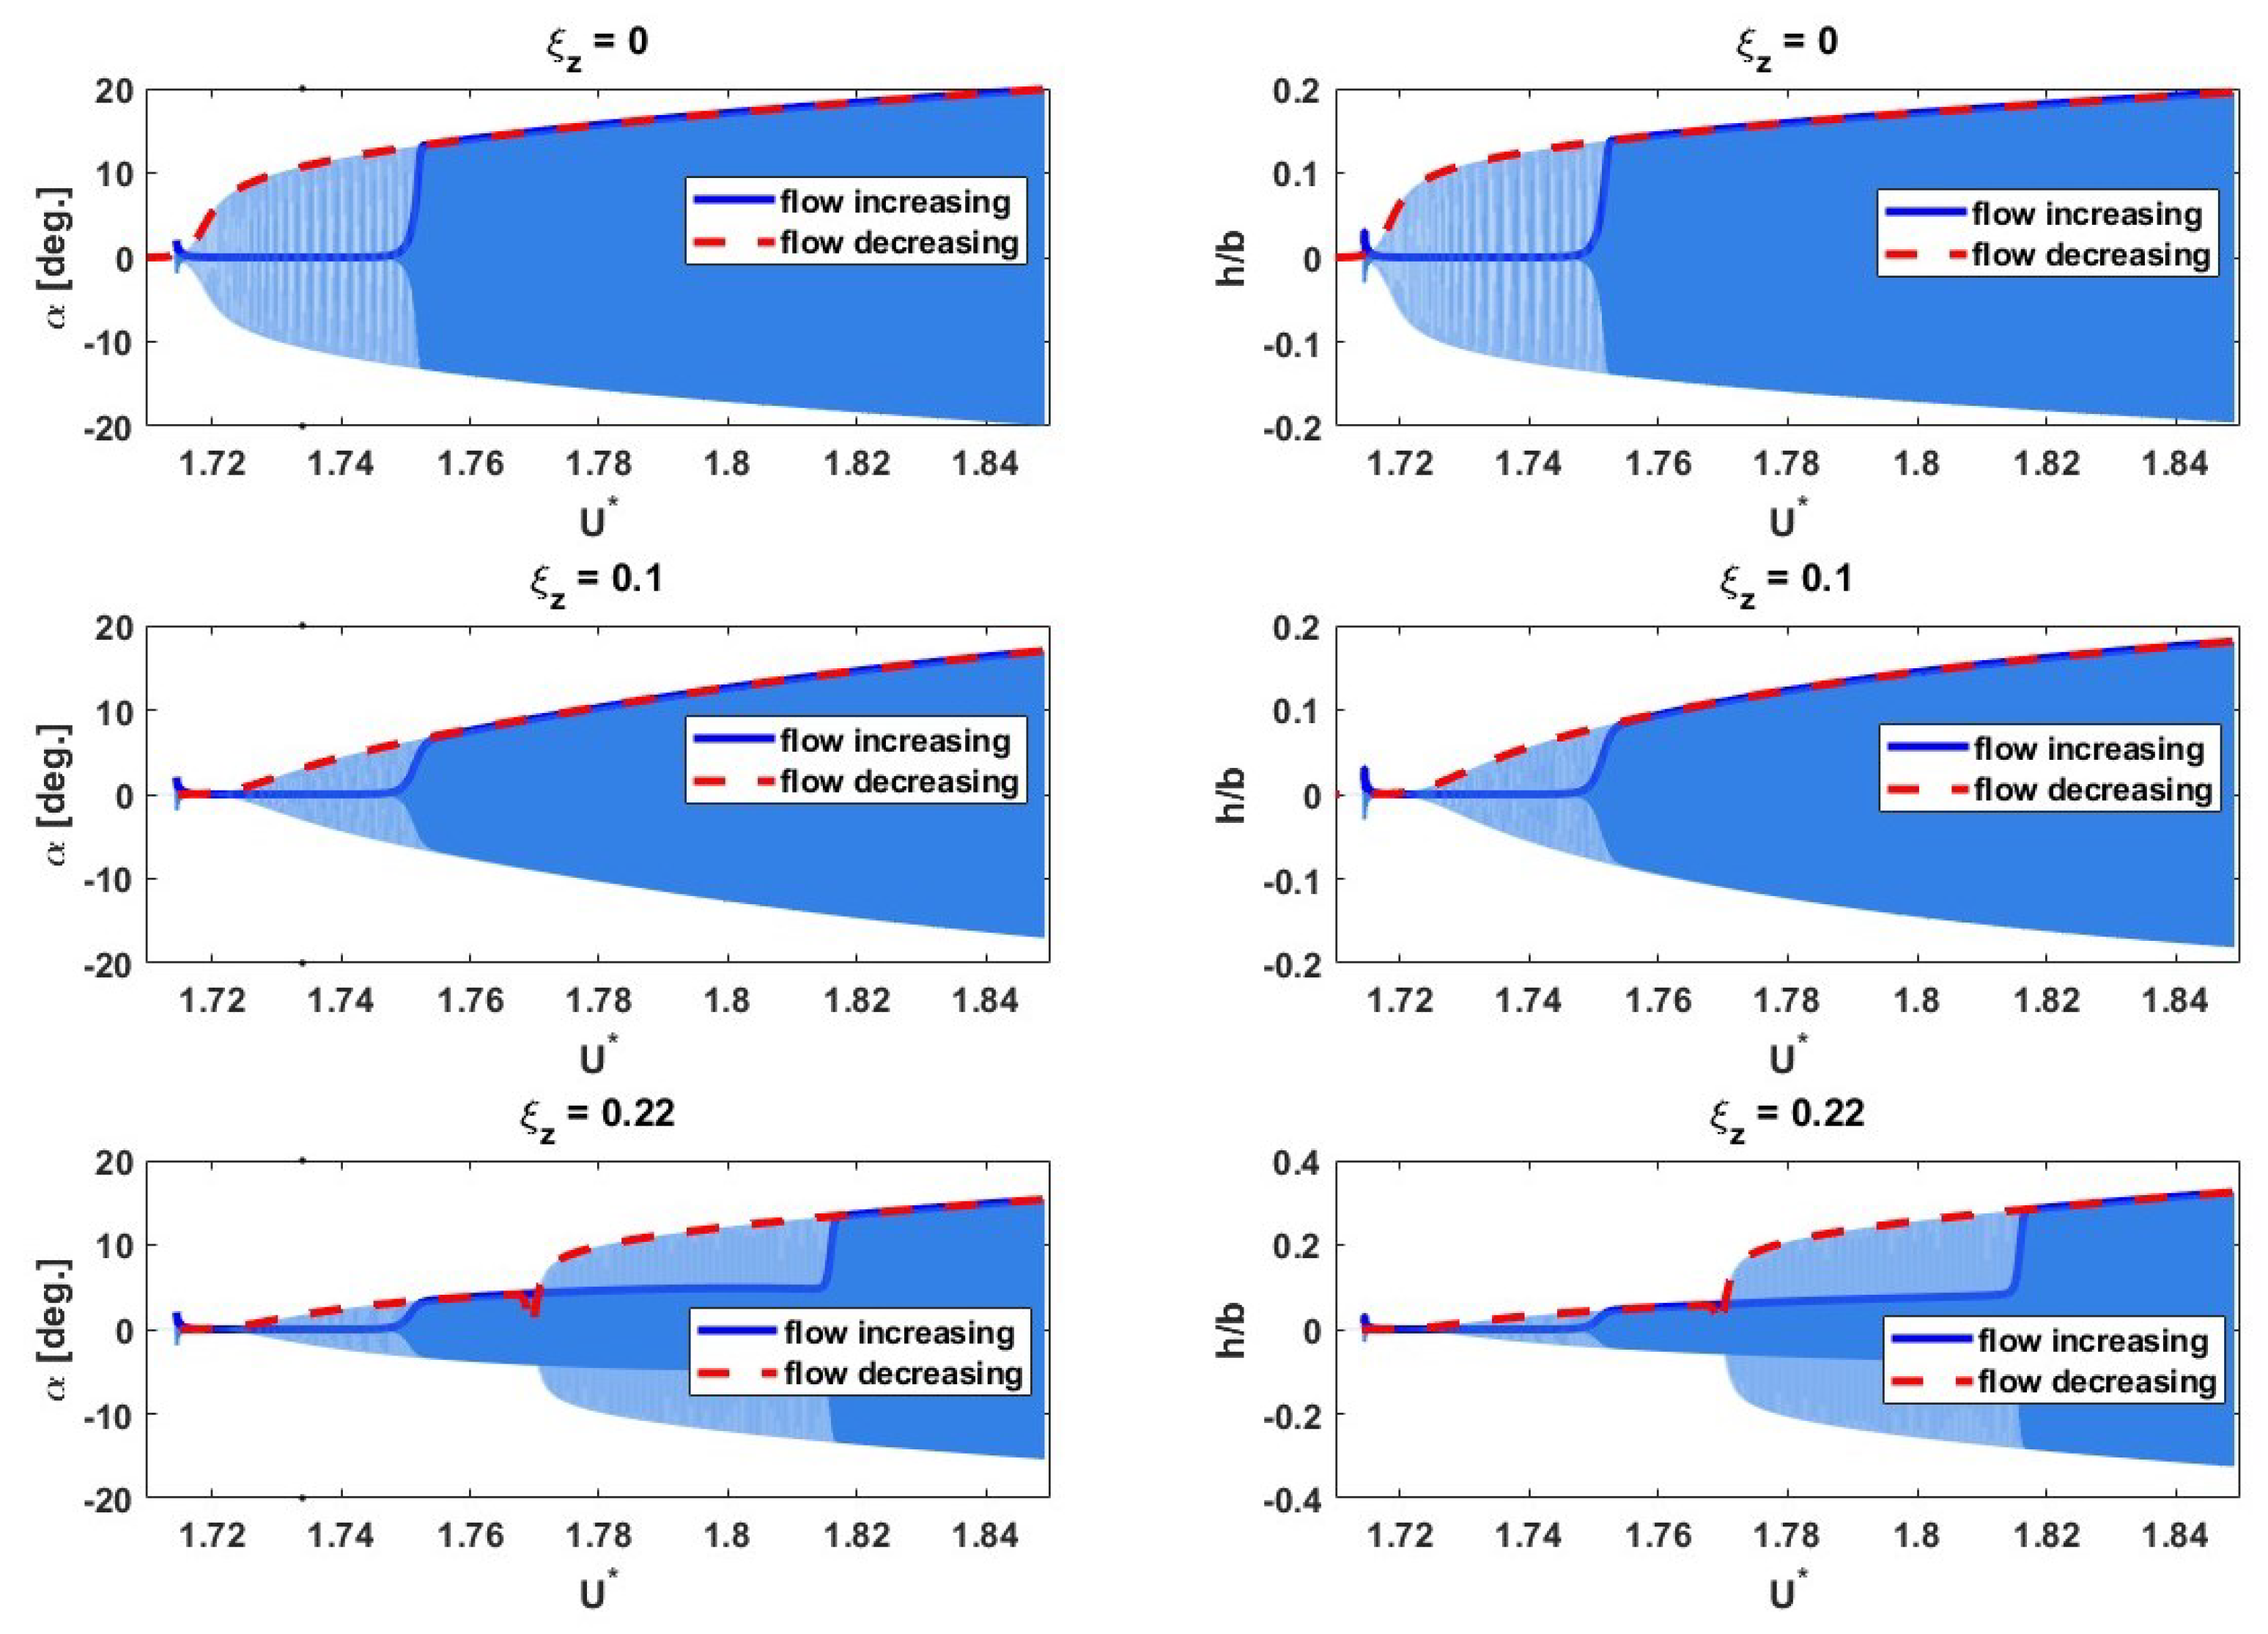
Figure 12.
Logarithmic plots of a) the pitch envelope of the simulation reported in Figure 11 b) the pitch envelope at a constant reduced speed of as a function of time.
Figure 12.
Logarithmic plots of a) the pitch envelope of the simulation reported in Figure 11 b) the pitch envelope at a constant reduced speed of as a function of time.
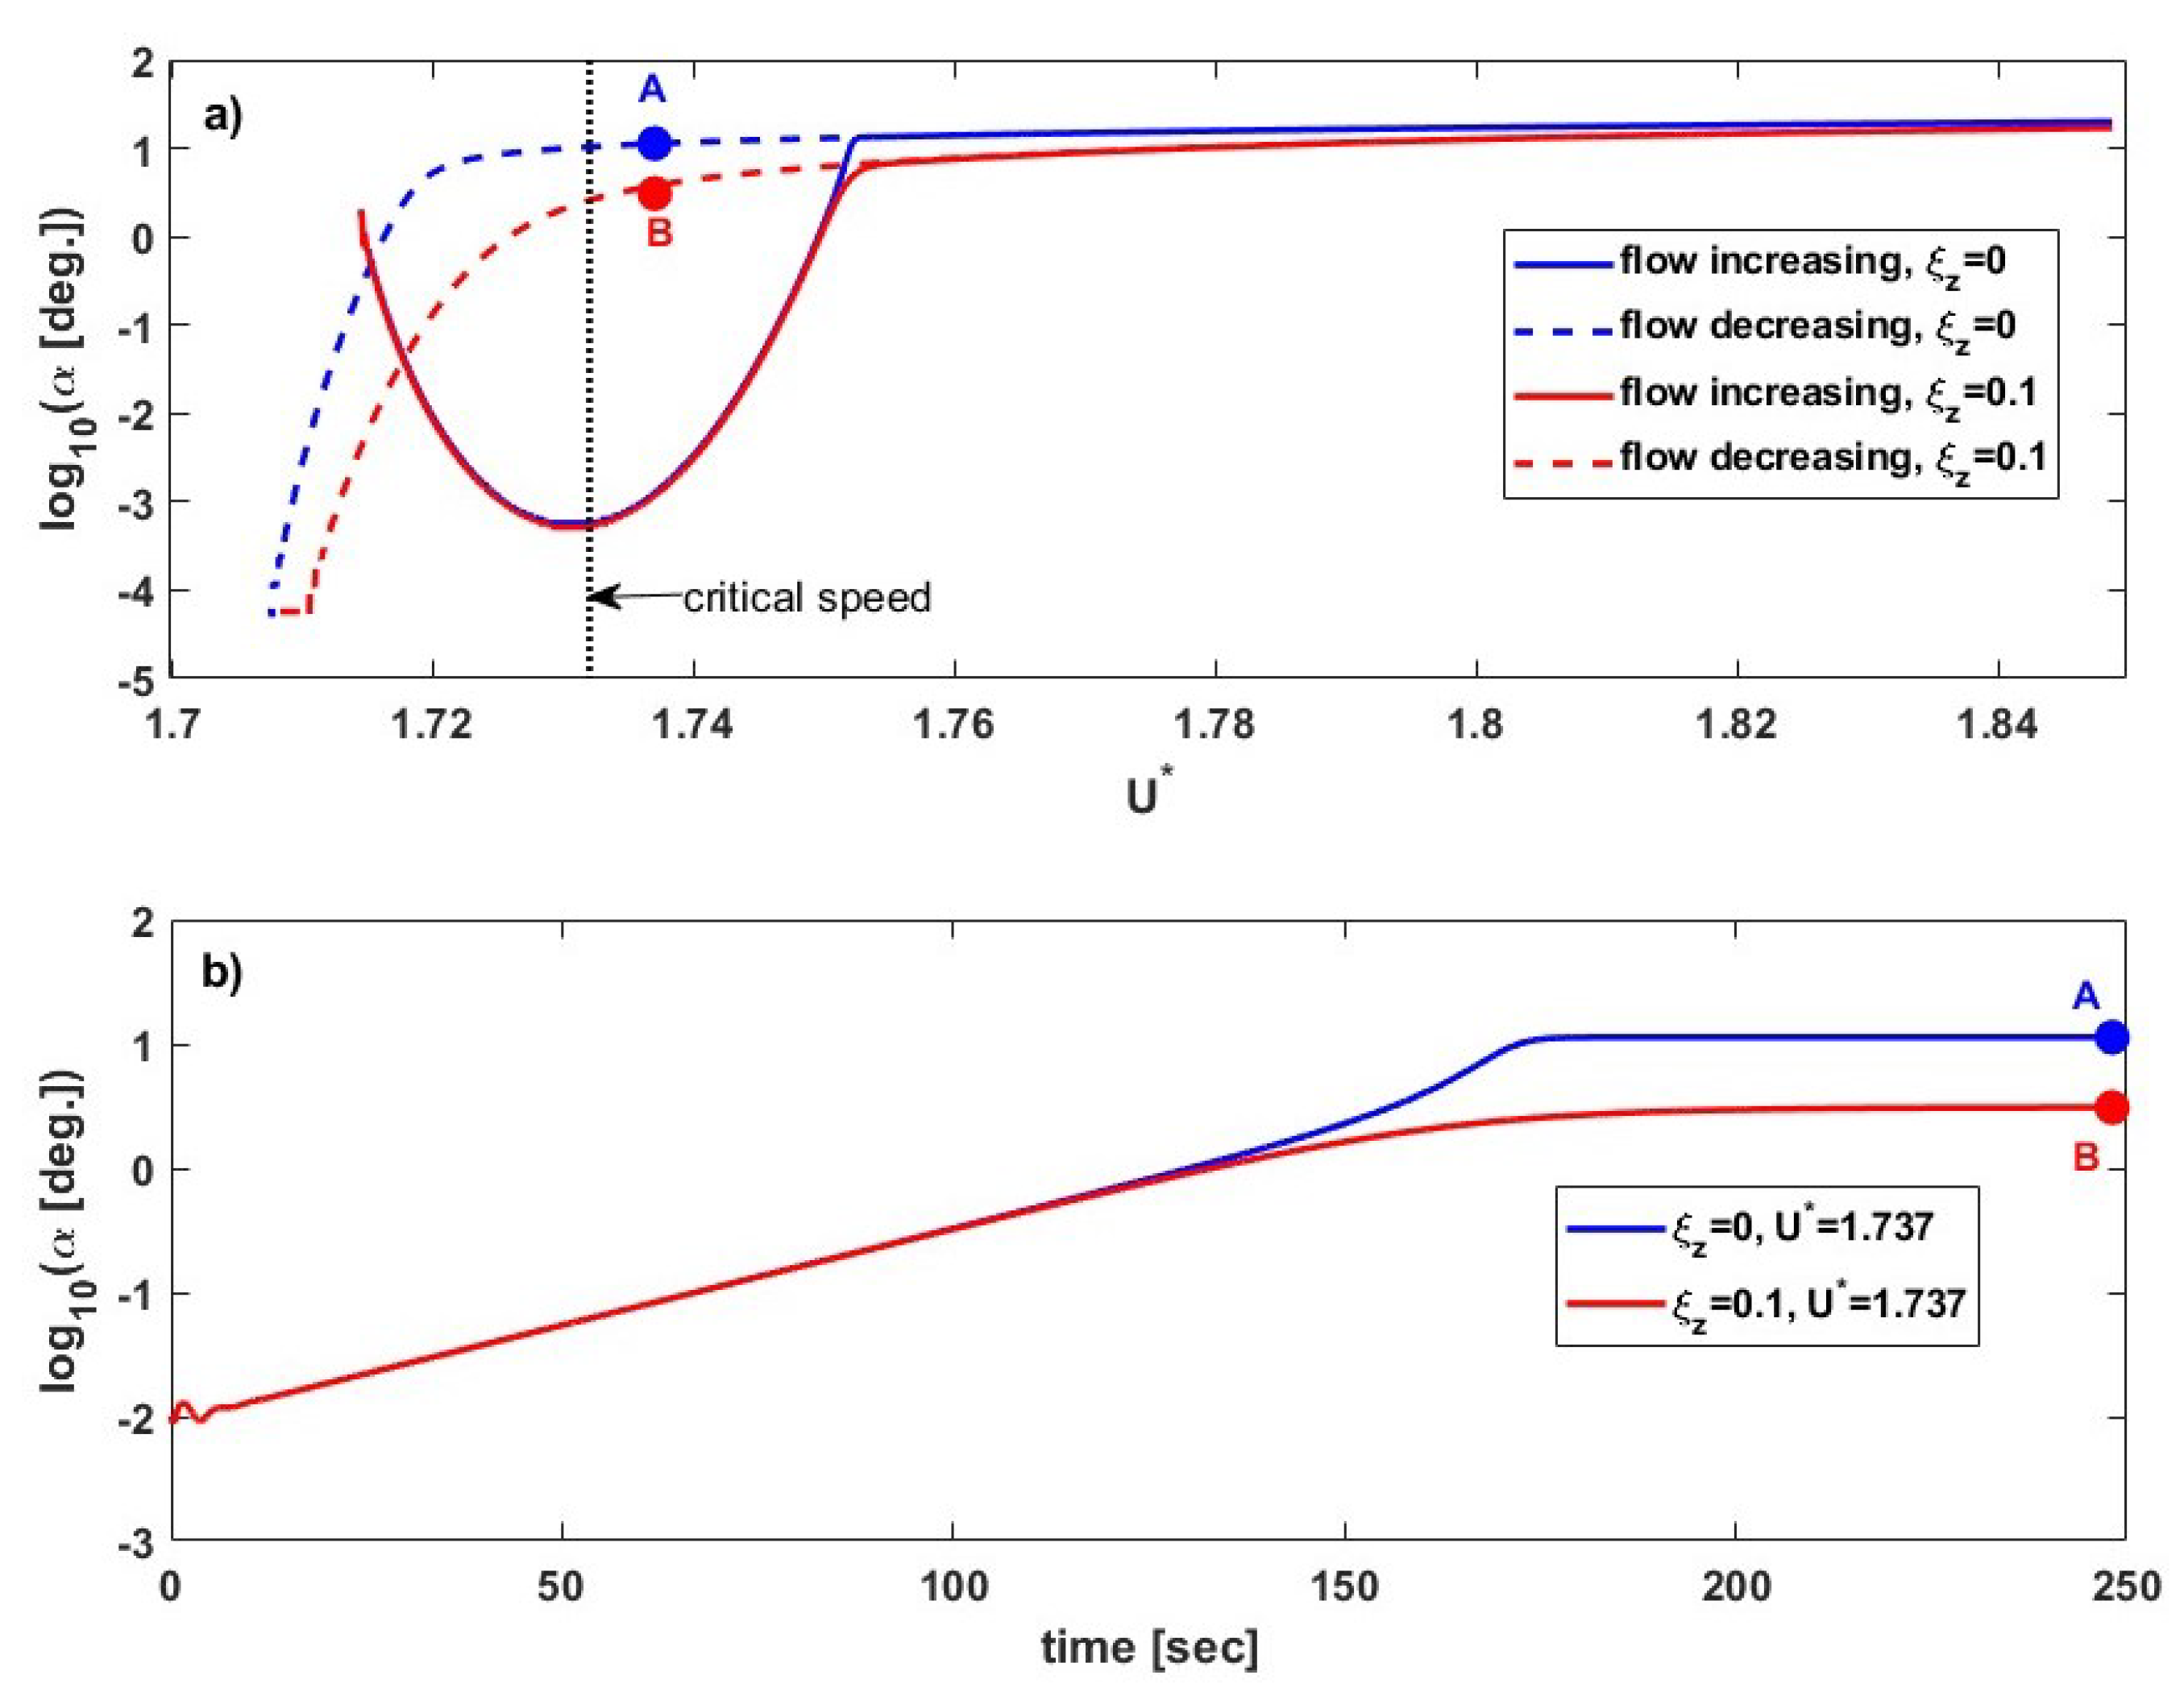
Figure 13.
Post-flutter response of an airfoil with NLTVA near ground .
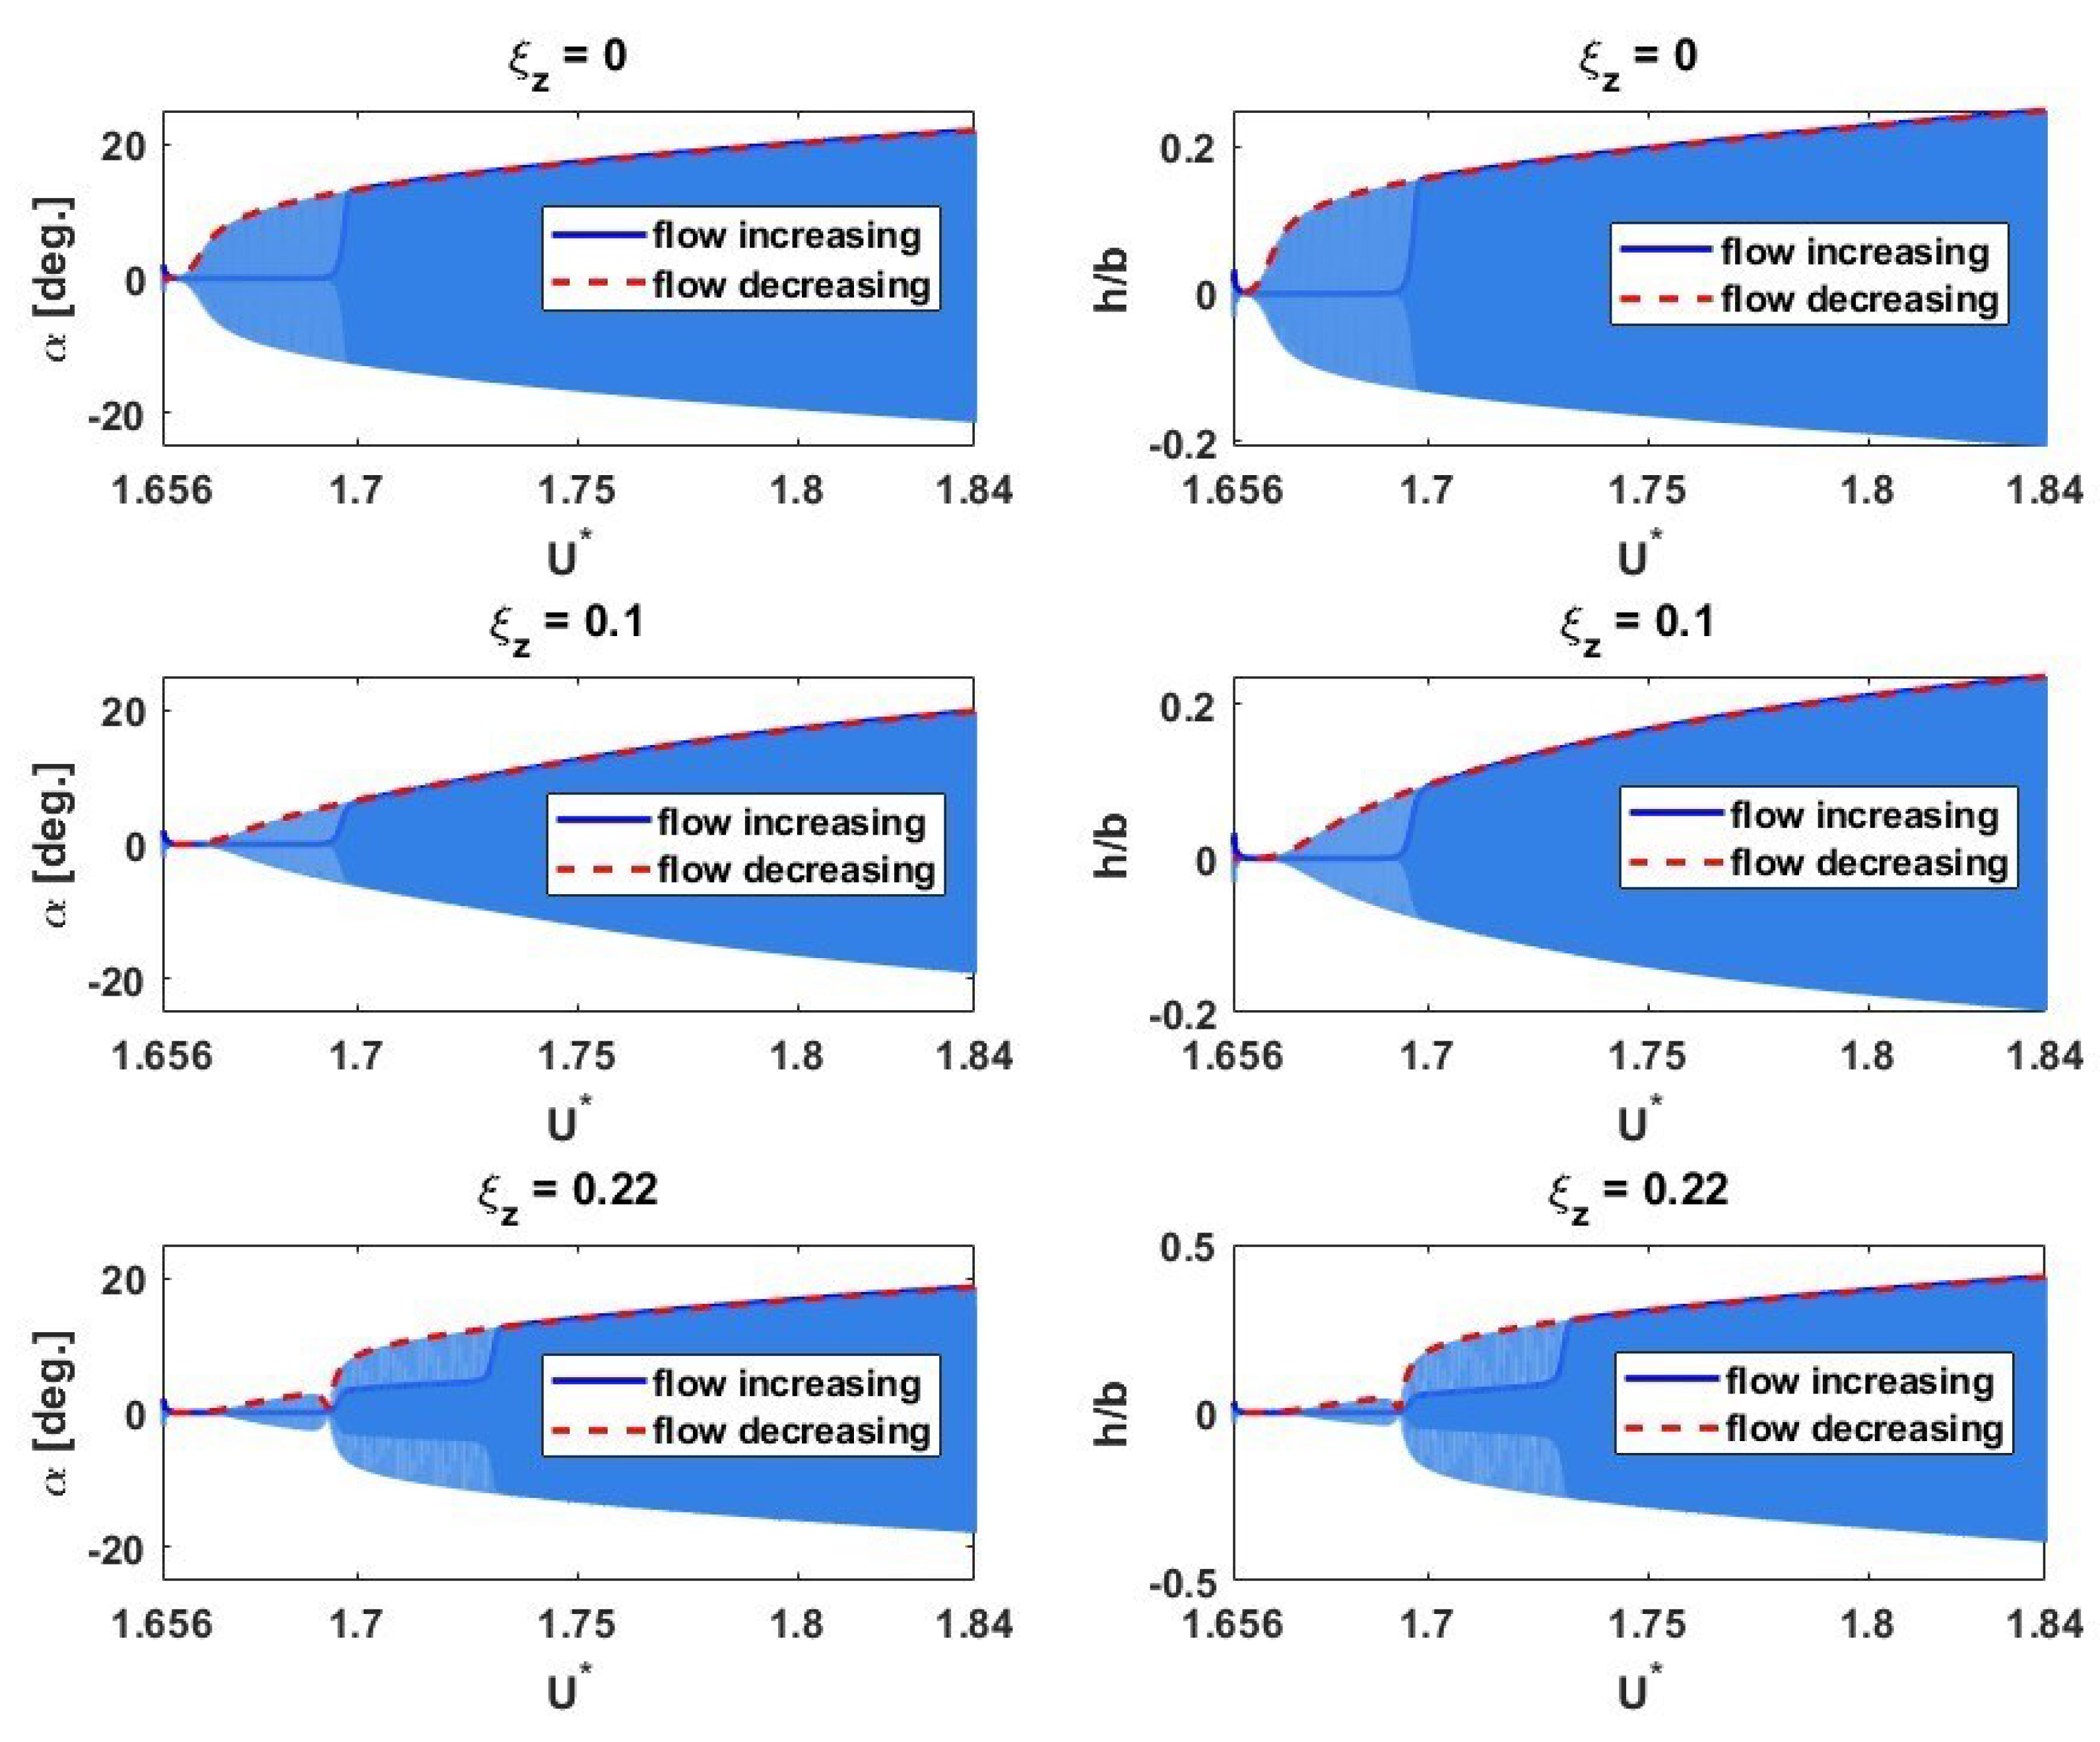
Figure 14.
Time histories LCO response of an airfoil with and without absorber near the ground when and .
Figure 14.
Time histories LCO response of an airfoil with and without absorber near the ground when and .
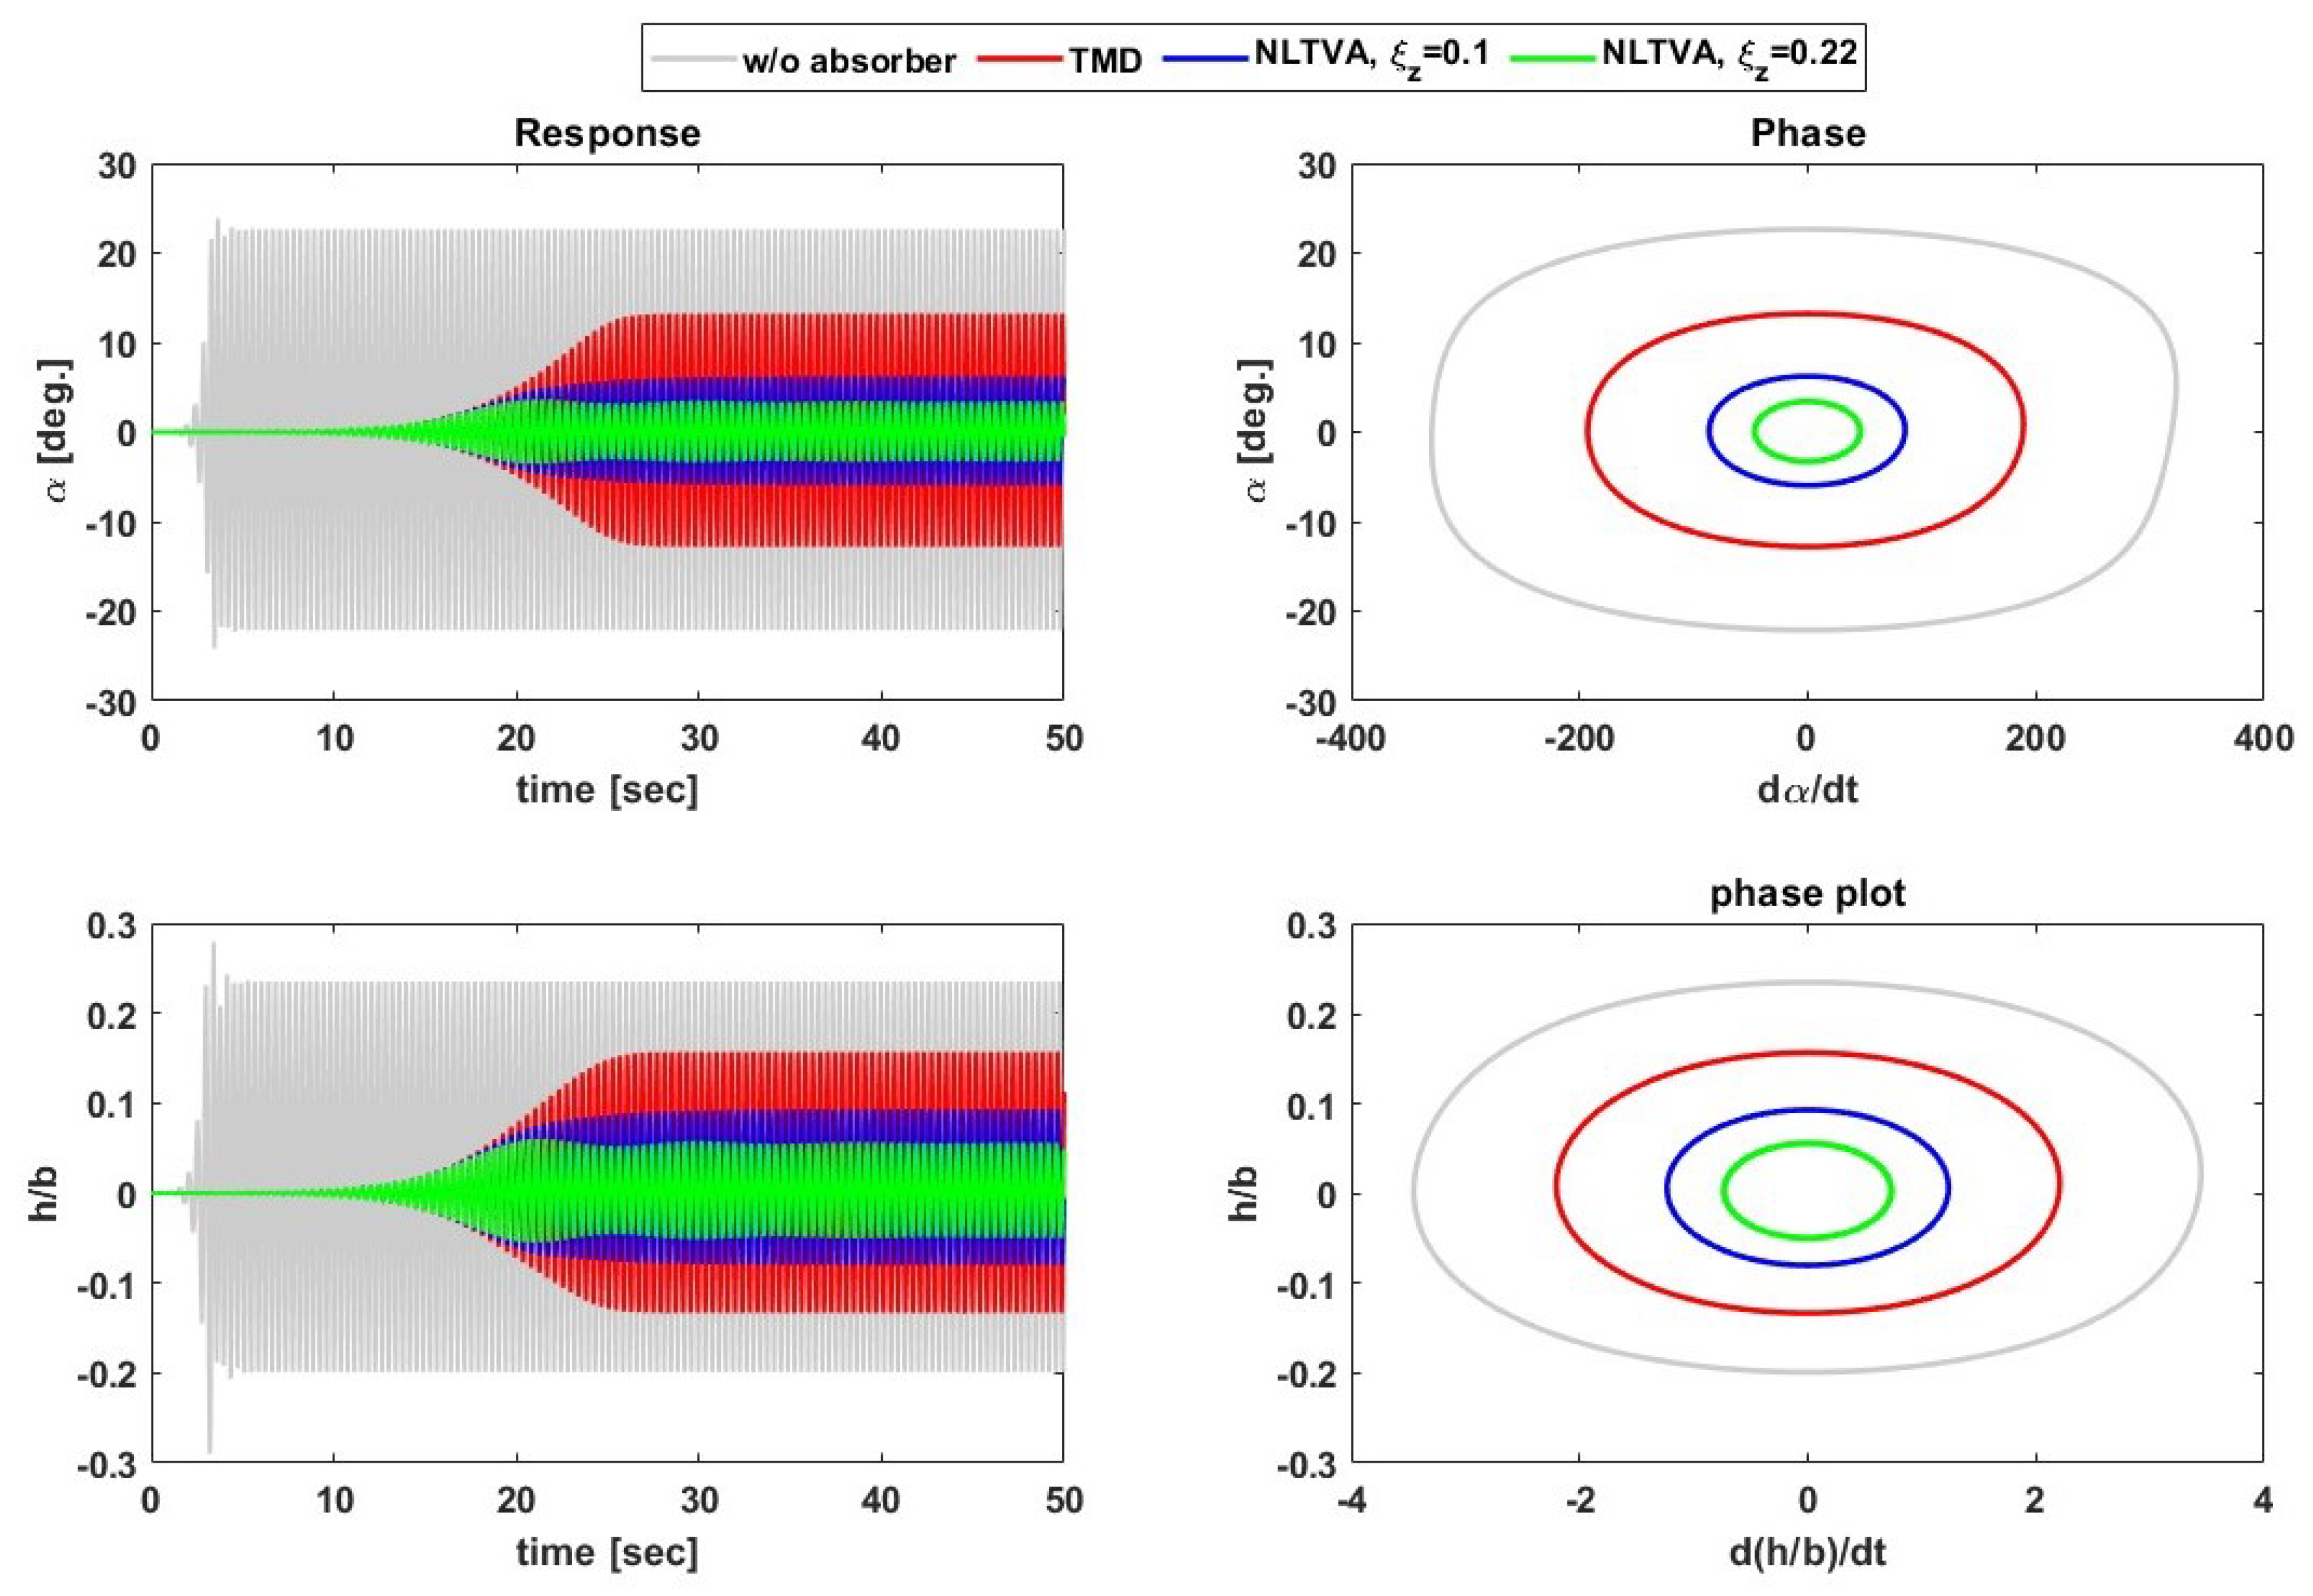
Figure 15.
Effect of ground height on the post-flutter response of an aeroelastic system with a NLTVA at .
Figure 15.
Effect of ground height on the post-flutter response of an aeroelastic system with a NLTVA at .
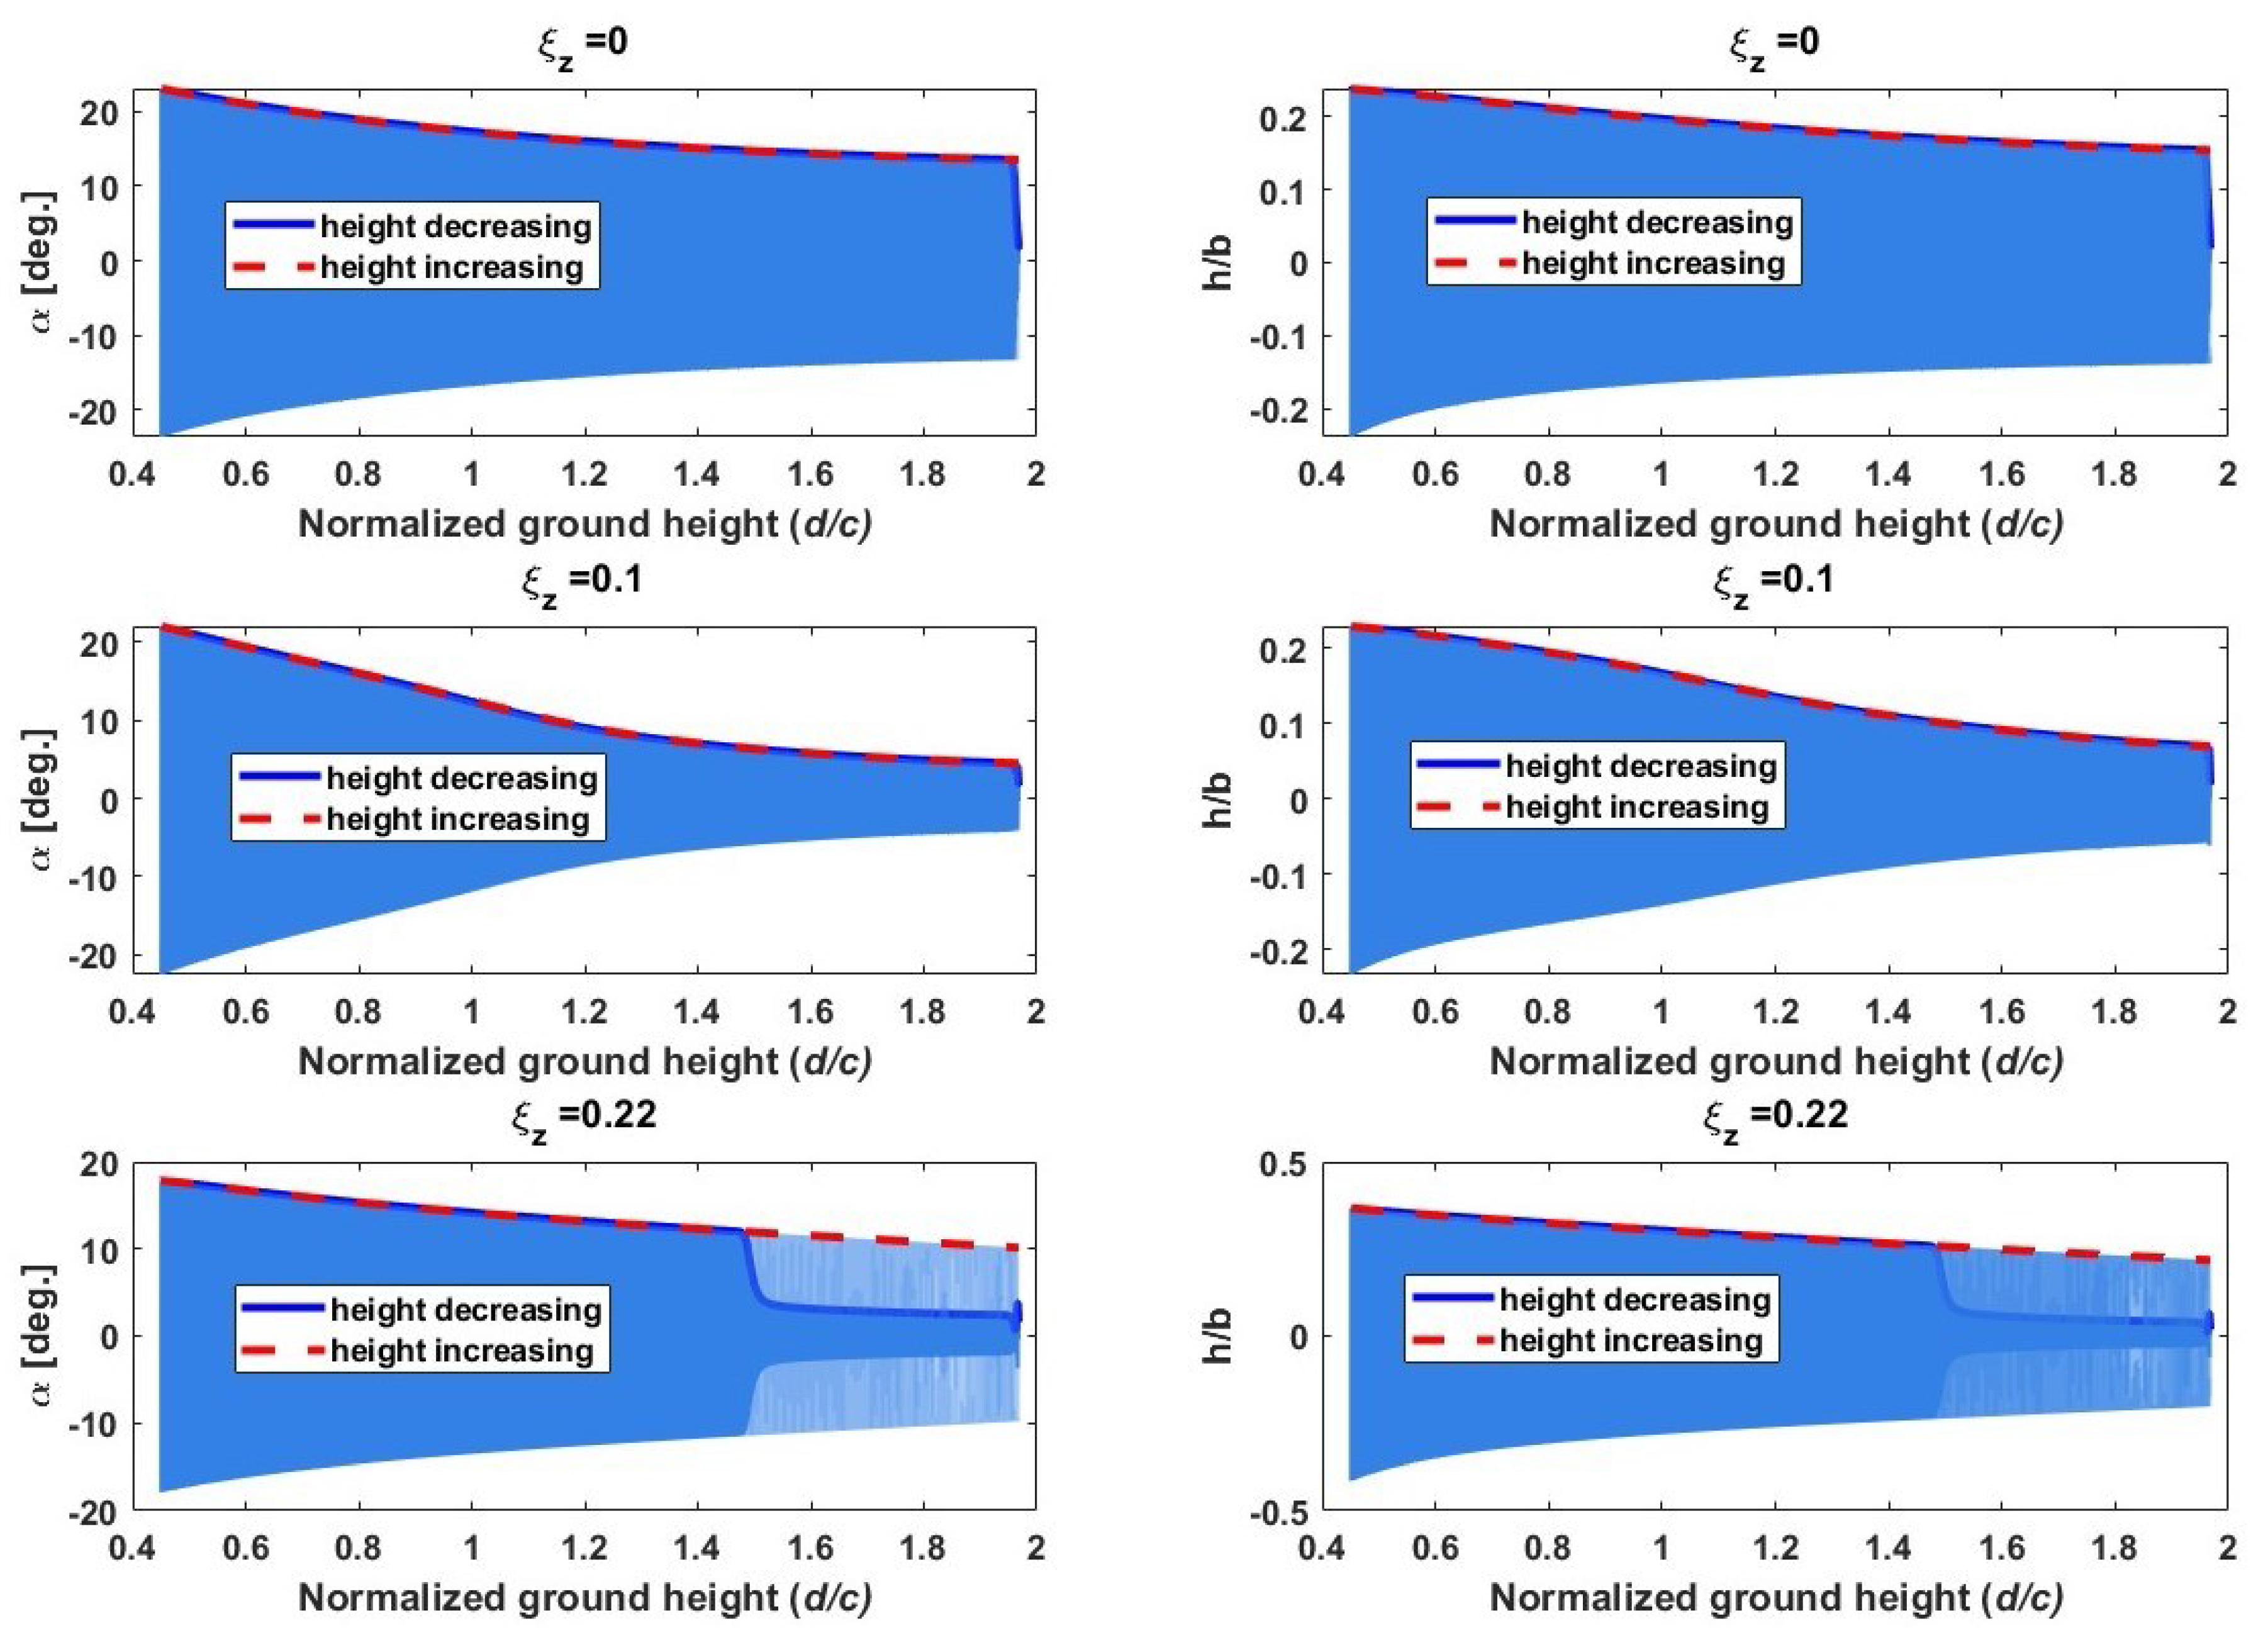

Table 1.
Non-dimensionalized airfoil properties.
| Parameters | Value |
|---|---|
| a | -0.1 |
| 0.2 | |
| 0.5 | |
| 0.5 | |
| 0.1 | |
| 0.01 | |
| 0.01 |
Disclaimer/Publisher’s Note: The statements, opinions and data contained in all publications are solely those of the individual author(s) and contributor(s) and not of MDPI and/or the editor(s). MDPI and/or the editor(s) disclaim responsibility for any injury to people or property resulting from any ideas, methods, instructions or products referred to in the content. |
© 2024 by the authors. Licensee MDPI, Basel, Switzerland. This article is an open access article distributed under the terms and conditions of the Creative Commons Attribution (CC BY) license (http://creativecommons.org/licenses/by/4.0/).
Copyright: This open access article is published under a Creative Commons CC BY 4.0 license, which permit the free download, distribution, and reuse, provided that the author and preprint are cited in any reuse.


