
Submitted:
01 November 2024
Posted:
04 November 2024
You are already at the latest version
Abstract
The present work analyses the behaviour of an activated carbon fabricated from almond shell for the removal of cationic dyes (methylene blue and malachite green) by adsorption from aqueous solutions. The carbonized precursor was activated with KOH at a 1:1 (w/w) ratio with the objective of increasing both surface area and pore volume. Both non-activated and activated carbon were characterized in different aspects of interest in dye adsorption studies (surface structure, point of zero charge, surface area, pore size distribution). The effect of dye initial concentration and adsorbent dosage upon dye removal efficiency and carbon adsorption capacity has been studied. Adsorption kinetics was analysed under different experimental conditions and different models were essayed to determine the adsorption mechanism. Dye adsorption in the adsorbent surface could be considered the rate-limiting step. Adsorption equilibrium isotherms have also been obtained, and Langmuir and Freundlich equations showed the best fitting to the experimental data. Moreover, Adsorption kinetic and equilibrium data have been used to simulate breakthrough curves in a packed-bed column using different conditions (bed length, liquid flowrate, dye initial concentration). Simulation results showed that almond shell activated carbon is a suitable adsorbent for methylene blue and malachite green removal from wastewater.
Keywords:
activated carbon
; almond shell
; malachite green
; methylene blue
; adsorption
; breakthrough curve
1. Introduction
The presence of pollutants in wastewater continues to be one of the main problems associated to industrial processes (i. e. pesticides, heavy metals, dyes, etc.) [1]. Although the presence of emerging contaminants has increased concern about this problem, other more common contaminants (e.g. industrial dyes) continue to be the target of development, improvement and application of new separation operations [2].
Water contamination due to the presence of dyes continues to be a major problem due to the significant losses that are produced (close to 20%) in the industrial processes in which they are used [3]. These losses generate high flowrates of wastewater that increase the cost associated to downstream treatments. In addition to this highly negative fact, the concern is increased due to the low dye concentration (in the order of mg·L-1) along with the difficulty of the recovery processes and the cost associated with these operations. Also, the importance of a right recovery process is justified by the undesirable effects of this type of substances (carcinogenic, mutagenic, teratogenic...) in relation to human health.
In recent years, advanced oxidation processes have been shown to be very effective techniques for the elimination of this type of substances, although high pollutant concentration tends to favor the overall process. In this way, a previous stage that allows increasing the dye concentration can improve the overall removal performance, as well as reduce the cost associated to the separation process. Thus, the adsorption of dyes in porous materials is considered a suitable solution for this purpose [4]. Different investigations have even indicated that the in-situ degradation of previously adsorbed pollutants could avoid the desorption stages that can show some difficulties and reduce the overall yield of the process [5, 6]. A significant number of research papers are focused on batch studies, which are essential to obtain valuable information regarding the adsorbent characteristics in relation to the adsorption of a target adsorbate. In any case, the information provided by dynamic adsorption studies using packed bed columns allows to lead a realistic simulation of the process on an industrial scale [7, 8] and to evaluate the specific characteristics of the industrial equipment mainly of that related with mass transfer processes. Therefore, it is necessary to carry out an overall evaluation of both batch and steady state results, which can provide a more suitable point of view of the adsorption process.
Focusing interest on reducing the cost associated with the overall process of dye recovery by adsorption, as well as on attaining some of the Sustainable Development Goals (e.g. 6-clean water and sanitation and/or 11-sustainable cities and communities), the present work proposes the use of an activated carbon produced from an industrial biomass waste, almond shell, which is available in high quantities, as dye adsorbent [9]. The activation process as well as the activating agent used, are important aspects that can affect the adsorption behavior of the adsorbate. Consequently, the degree of carbon microporosity must be enhanced or reduced depending on the adsorbate or other compounds that are present in the wastewater. Previous studies [10] have shown that physical or chemical activation with certain agents (i.e. ZnCl2) tend to increase slightly both specific surface area and pore volume. However, the use of KOH can produce generally important increases in both parameters [11]. Therefore, this agent has been selected to prepare an almond shell activated carbon, also considering the relatively large molecular size of the cationic dyes (blue methylene and green malachite) to be adsorbed. Bach experiments were performed to evaluate the influence of operational conditions (initial concentration, contact time and carbon dosage) and adsorption kinetics and equilibrium were analyzed to determine the dye adsorption mechanism. Simulated breakthrough curves were also obtained.
2. Materials and Methods
2.1. Materials and Chemicals
Milled almond shell supplied by Biogramasa company (Spain) with a particle size lower than 5 mm was used as activated carbon precursor. The activation step was carried out with potassium hydroxide (KOH 85%, Probus) as activating agent. Sodium chloride (NaCl, 99.5%, Probus), hydrochloric acid (HCl 37%, Sigma Aldrich) and sodium hydroxide (NaOH 98%, Sigma Aldrich) were used for the point of zero charge determination and the acid was also used to wash the fabricated carbon. Methylene blue (MB > 83%) and malachite green (MG > 93%) dyes were supplied by Panreac Applichem.
2.2. Adsorbent Fabrication
Almond shell was carbonized at 873 K during 1 hour under nitrogen atmosphere (34 L h-1) in an oven (Nabertherm GmbH-Germany) with a temperature ramp of 5 K min-1. An inertization step was carried out for 30 minutes. Carbon activation consisted of a thermal treatment at 1123 K for 2 hours of a mixture of carbonized material and KOH using a ratio of 1:2 (w/w). The temperature ramp and nitrogen flowrate applied were the same as in carbonization stage. The activated carbon was washed successively with 0.1 M HCl and distilled water and dried overnight at 378 K.
2.3. Adsorbent Characterization
The point of zero charge (pHpzc) was determined as the pH at which the difference between final and initial pH was zero. Several flasks were prepared with aqueous solutions (10 mL) of 0.01 M NaCl at several pH values adding NaOH and/or HCl. After pH adjustment, carbon was added (10 mg) to each flask and shaken at 350 rpm and 25 °C for 48 hours to reach the equilibrium [12].
Surface area and pore size distribution data were obtained using an ASAP 2020 sorption analyser (Micromeritics). Samples were outgassed under vacuum at 573 K and nitrogen adsorption and desorption data at 77 K and carbon dioxide adsorption data at 298.15 K were carried out. BET equation was used to determine surface area corresponding to N2 and CO2 adsorption data. The nitrogen amount adsorbed at a relative pressure of 0.99 was used to calculate the total pore volume. Pore size distribution was determined using the two-dimensional non-local density functional theory (2D-NLDFT) model that combines CO2 and N2 experimental data.
Fourier transform infrared (FTIR) spectra (Varian FTIR 670 spectrometer) were obtained by preparation of KBr pellets (0.4 mg of carbon with 600 mg of KBr). The wavenumber range was 400-4000 cm-1. In addition, adsorbent properties before and after dye adsorption were characterized by scanning electron microscopy (SEM) using a Zeiss FESEM Ultra Plus.
2.4. Batch Adsorption Experiments
Adsorption experiments in batch mode were performed in an orbital shaking air bath (VWR-Cienytech) at a stirring rate of 210 rpm, 298.15 K and natural pH. The experiments carried out consisted in the analysis of initial dye concentration (between 50 and 500 mg L-1) and carbon dosage (between 0.2 and 1 g L-1) to study their effect on the removal of methylene blue and malachite green.
The amount of adsorbed dye in the supernatant after samples centrifugation was determined at different times at the maximum dye wavelength by UV/visible spectrophotometry (UV/Visible spectrophotometer V630, Jasco) and was used for calculating the dye removal efficiency (Eq. (1)). The adsorption capacity of the adsorbent (Eq. (2)) was estimated as the amount of adsorbed dye per adsorbent mass used.
where C0 and C are the initial and final dye concentration, respectively (mg L-1), q is the adsorption capacity (mg g-1), V is the volume of the dye solution (L), and m is the adsorbent mass (g) employed in each experiment.
%adsorption = (C0 - C) / C0 · 100
q = (C0 - C) · V / m
2.5. Adsorption Kinetics
Several models were employed to fit experimental data corresponding to the adsorption kinetics of both dyes under different experimental conditions. Thus, pseudo-first order, pseudo-second order and intraparticle diffusion models were evaluated to analyse the rate-limiting step of the overall process.
The pseudo-first order kinetic model, recognized as Lagergren equation, is as indicated in equation 3.
where k1 (min-1) is the first-order reaction rate constant, qt and qe (mg·g-1) represent the adsorption capacity at time t and at equilibrium.
log (qe - qt) = log (qe) - (k1 · t) / 2.303
Pseudo-second-order equation is expressed as equation 4.
where k2 (g·mg-1·min-1) is the constant rate of the pseudo-second order model.
t / qt = 1 / (k2 · qe2) + t / qe
Intraparticle diffusion equation (Weber-Morris model) is given by equation 5.
where kid is the intraparticle diffusion rate constant (mg·g-1·min-0.5) and C is the kinetic constant.
qt = kid · √t + C
2.6. Adsorption Isotherms
The equilibrium data were obtained for both dyes from adsorption experiments carried out at an adsorbent dosage of 0.5 g·L-1, natural pH and 25ºC for 24 h. Langmuir, Freundlich, Temkin and Dubinin-Radushkevich models were used to fit equilibrium experimental data.
For equilibrium experiments, the corresponding amount of each AC according to the solid-liquid ratio was added individually to solutions with distinct dye concentrations in Erlenmeyer flasks. The mixes were stirred at 210 rpm and 25ºC in a shaking water bath (H20 SOW-Lawda) for the selected time. To depict adsorption process, the linearized forms of Langmuir (Eq. (6)), Freundlich (Eq. (7)), Temkin (Eq. (8)) and Dubinin-Radushkevich (Eq. (9)) models were used.
where Ce is the concentration of dye at equilibrium (mg·L-1); qe is the adsorption capacity at equilibrium (mg·g-1); qm is the maximum adsorption capacities (mg·g-1); KL corresponds to the Langmuir adsorption constant (L·mg-1); KF and n are Freundlich model constants; B is associated to the heat of adsorption (J·mol-1); KT (L·g-1) is the other Temkin constants, R is universal constant of gases (J·mol-1·K-1), T (K) is absolute temperature, ɛ (kJ·mol-1) is Polanyi coefficient and KDR is activity coefficient (mol2·J-2).
qe = (qm,L · KL · Ce) / (1 + KL · Ce)
qe = KF · Ce (1 / n)
qe = B · ln (KT · Ce)
qe = qm,D · exp (-KDR · ε2)
2.7. Packed Bed Adsorption Simulation
Aspen Adsorption V14 was employed to carry out simulated breakthrough curves corresponding to MB and MG adsorption in almond shell activated carbon varying different operation variables such as wastewater flowrate, bed heigh or dye concentration. Some assumptions were made for dyes simulation based on the previous paper of Juela [13]. To complete this simulation procedure, some considerations from the results obtained in previous sections were applied (i.e. equilibrium isotherm, mass transfer coefficient, etc).
3. Results
3.1. Adsorbent Characterization
The value corresponding to the point of zero charge (pHpzc) can be determined by plotting ΔpH against initial pH as shown in Figure 1. The pHpzc shows the point at which the electrostatic interactions between positive and negative charges of the adsorbent surface are equal. In this way, below this value (pHpzc) the surface of the adsorbent is positively charged, while above it will be negatively charged. The values obtained for carbons without and with activation were 8.3 and 7.8, respectively. Therefore, considering that the dyes used in this study are cationic, it would be expected that adsorption would be enhanced at pH higher than pHpzc. However, in this first stage it was decided to work at natural pH to simplify the operation and reduce costs.
SEM images have been used to analyze the texture and characteristics of the almond shell activated carbon surface. As an example, Figure 2 shows the images obtained by SEM of the activated carbon before and after the adsorption of both dyes (MB and MG). The porous structure of the carbon (Figure 2-a) is shown with pores of different sizes and shapes, probably due to activation with KOH [14]. Also, it seems that some of these pores are coated, and a layer is formed covering part of the surface (especially in Figure 2-c) after adsorption, which confirms that both methylene blue and malachite green have been adsorbed on the carbon surface.
FTIR spectra for non-activated and activated carbon were recorded to evaluate their surface chemistry. As shown in Figure 3 both spectra were very similar and the presence of different functional groups capable of participating in dyes adsorption was confirmed. Peaks at 470 and 797 cm-1 are associated to C–H groups and the corresponding band at 1097 cm-1 could be assigned to C-O stretching vibration of ether and alcohol groups which indicates the presence of hydroxyl functional groups. At 1404 cm-1 a peak appears corresponding to C-N stretching. An additional band was observed at 1724 cm-1 confirming the presence of C = O groups. The peaks corresponding to C–H and N–H bonds are present at 2850 and 2919 cm-1 respectively. Finally, a wide band is observed at 3427 cm-1 that can be assigned to hydroxyl and amine groups. As indicated, KOH activation did not cause significant changes in the functional groups on the surface, except for increasing the intensity of some peak and wavenumber shifts.
In applications that involve the use of solid material, and especially when its porous structure could play an important role in the process, as is the case, the knowledge of some characteristics such as specific surface area is crucial and allows a better understanding of the adsorption mechanism.
Therefore, the determination of the carbon specific surface area has been carried out using gas adsorption, specifically, adsorption of nitrogen at 77 K and carbon dioxide at 273 K were performed. This determination is usually made with nitrogen. but in recent years the complementary use of carbon dioxide has been included to provide more information on the pore structure in the range of smaller pores [15].
Figure 4 shows the experimental data of adsorption and desorption isotherms of nitrogen at 77 K, both for the activated carbon used for dye adsorption studies, and for its carbonized precursor. It is observed that as the relative pressure increases, and therefore the presence of nitrogen molecules in the gas phase, there is an increase in the amount adsorbed on the materials being significantly higher for the activated carbon. This increase is important at low relative pressures, subsequently reaching a constant value.
Considering that the amount of adsorbed gas is directly related to the solid surface area, it can be concluded that the activated material has a greater surface area which is the aim of the activation of carbonized materials.
A deeper analysis of the nitrogen adsorption/desorption isotherms (Figure 4) confirms that both have a shape similar to the Langmuir isotherm and can be included in type I isotherms. This type of isotherm is observed in materials whose porous structure is formed mainly by small pores, included within the so-called micropores. The main difference observed is the range of relative pressure in which the knee is formed. In the case of the non-activated carbon, the knee formation occurs in a narrow range of relative pressures, which classifies this isotherm as type Ia. In this case, the pores have a very small size and therefore the formation of several layers of nitrogen molecules inside is not favored. Regarding the activated carbon, the range of relative pressures is larger and is in accordance with the formation of micropores (due to the shape of isotherm) but in a larger size range. In this case, the isotherm corresponds to type Ib [16].
As mentioned previously, the study related to the characterization of the porous structure has been completed recording the carbon dioxide adsorption data at 273 K. These data are shown in Figure 5 for both non-activated and activated carbons.
As in the case of nitrogen adsorption, a greater amount of carbon dioxide was adsorbed by the activated material. Previous studies [15] have related the amount of adsorbed carbon dioxide to the specific surface area corresponding to ultramicroporosity (pores with diameters lower than 0.7 nm). As indicated, this type of study complements that using nitrogen at 77 K, since this one, due to the low temperature used, has mass transfer limitations in low-size pores due to increased viscosity. This fact causes a nitrogen size exclusion, and it does not allow to determine the pore volume corresponding to diameters lower than 0.7 nm. Therefore, based on the results shown in Figure 5, the activated carbon also seems to have a higher surface area than the non-activated carbon in the ultramicropore range.
The experimental data shown in Figure 4 and Figure 5, were used to calculate the specific surface area of the activated carbon for both nitrogen and carbon dioxide adsorption using the BET equation, which are shown in Table 1 together with other parameters related to its porous structure.
As shown, the values of the specific surface area calculated using the BET equation allow to conclude that the activation process allowed obtaining a relatively high specific surface area, which can be considered as a suitable characteristic for the use of this material in dye adsorption.
In addition, pore size distribution in the porous structure of activated carbon can be considered another important characteristic for adsorption. The determination of pore size distribution has been carried out with the NLDFT Advanced PSD tool included in the MicroActive software version 5.02 from Micromeritics. This tool allows us to obtain the pore size distribution by combining the nitrogen adsorption experiments at 77 K and carbon dioxide adsorption at 273 K.
Figure 6 shows that most of the porous structure of the activated carbon is made up of micropores smaller than 2 nm and a small fraction of mesopores (sizes between 2 and 50 nm). These results agree with the conclusions previously obtained from the adsorption isotherms shape (Figure 4). Moreover, the large relative pressure range for the knee formation in the isotherm can be related with the second peak present in Figure 6 corresponding to supramicropores (0.7-2 nm). The values of the other parameters shown in Table 1 also confirm that the material is highly microporous (78.2% microporosity). An important increase in the surface area and pore volume is observed when activation is carried out.
3.2. Dye Adsorption Studies
3.2.1. Effect of Adsorbent Dosage and Initial Dye Concentration
The influence of the adsorbent dosage on dye removal efficiency and adsorption capacity was analyzed at different dye initial concentrations. This information allows to determine the best operating conditions to achieve the objectives established for dye recovery and evaluate the cost associated with the carbon. The experimental results obtained are shown in Figure 7.
The results show that for both dyes and at all initial concentrations tested, as the amount of adsorbent increases, there is a significant increase in the adsorption percentage reaching values above 95% at 1 g·L-1. This behavior is due to the greater number of active centers available due to the increased total surface area, which produces the shift of the equilibrium favoring the adsorption of a larger number of molecules on the activated carbon surface [17]. It can be also observed that for dye concentrations of 50 and 250 mg·L-1, small differences (lower than 5%) were found using 0.75 and 1 g·L-1 as adsorbent dosages.
Regarding the influence of the adsorbent dosage upon adsorption capacity, in general it can be concluded that increasing the carbon dosage the adsorption capacity decreases for both dyes, except for the highest dye initial concentration. In this case, a maximum was observed at an adsorbent dosage of 0.75 g·L-1that can be explained by the large amount of adsorbate molecules present in the liquid phase and more adsorption sites available in the carbon.
Figure 7 shows also the influence of dye initial concentration on adsorption. In general, as expected, higher adsorption percentages were obtained at the lowest initial dye concentration. Moreover, for both dyes, a change in the trend was observed depending on the adsorbent dosage used; thus, when relatively low carbon dosages were used, the adsorption percentage was significantly higher using low dye concentrations, due to the lower presence of adsorbate molecules. Conversely, a significant increase in the adsorption percentage is observed with increasing the adsorbent dosage, reaching similar or even higher values at higher initial dye concentrations, probably related to the carbon/dye ratio. Furthermore, it can be seen that the carbon is slightly more effective for the removal of methylene blue than for malachite green.
3.2.2. Adsorption Kinetics
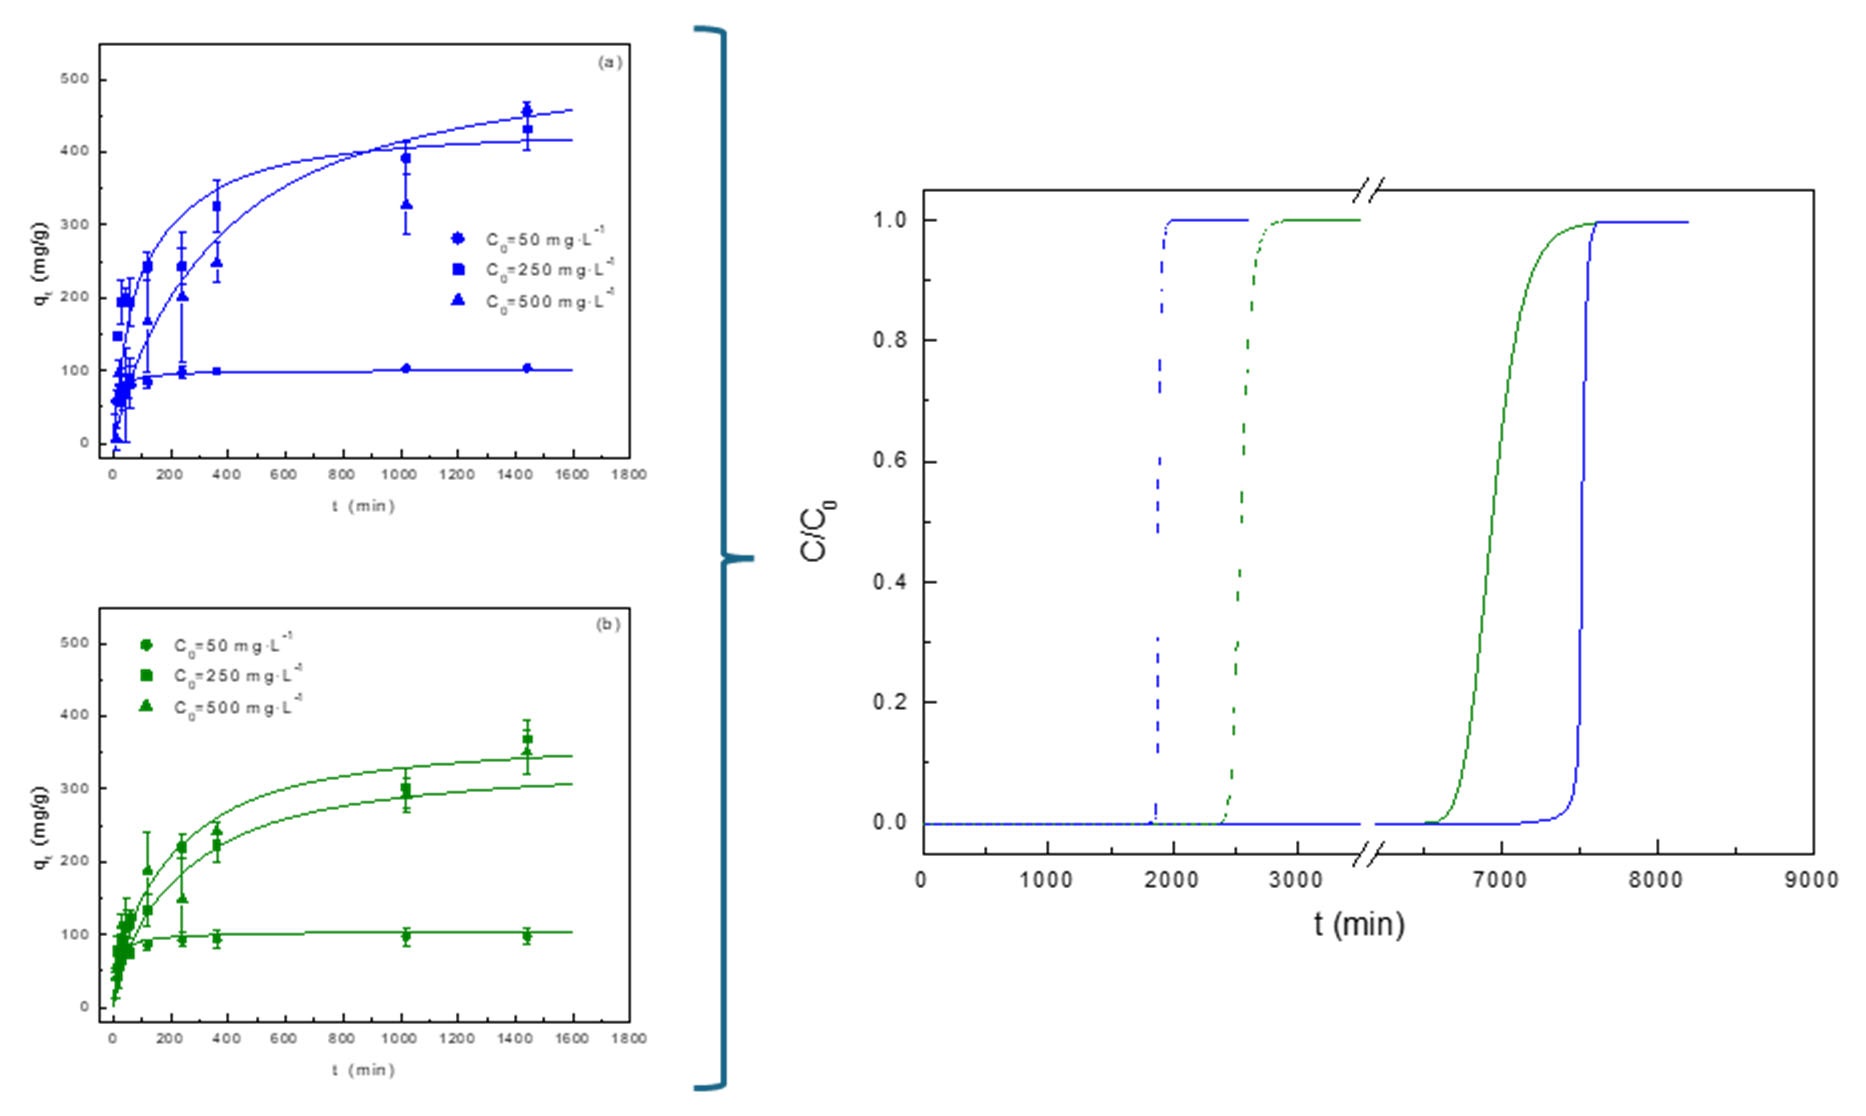
As previously described, several experiments have been carried out at 25ºC and adsorbent dosage of 0.5 g·L-1 to analyze the kinetic behavior of dye adsorption process and to evaluate the main adsorption mechanism and determining the existence of limiting rate steps. In this way, different models have been tested to fit the experimental data as shown in Figure 8 and Table 3.
Figure 8 shows a typical behavior in this type of adsorption systems, in which at short times a high dye adsorption rate is observed, whereas, as the time increases, a decrease in the adsorption rate is produced due to an important increase in the adsorbent saturation degree [3]. Comparing both dyes, it is observed that MB adsorption is faster at short times especially at an initial dye concentration of 250 mg·L-1. Additionally, for the highest initial dye concentration, the adsorption rate tends to decrease, mostly for MB, perhaps due to the repulsions between dye molecules that hinder the overall adsorption process.
The adsorption kinetic data were fitted to the commonly used models, i.e. the pseudo-first order (PFO), the pseudo-second order (PSO) and the intraparticle diffusion model (IP). At first, the use of PFO model was discarded, because the fitting parameters were unsatisfactory. This model is considered suitable for modelling adsorption processes in which the limiting stage is the mass transfer of adsorbate from the bulk to the external surface of the adsorbent material [17]. Therefore, this conclusion could agree with the fact that the main part of the surface area in the carbon is due to the porous structure, and the diffusion processes inside pores can be more important than the external diffusion. For this reason, the other models employed have been analyzed deeply. Table 2 includes the fitting parameters of both models. In general, the PSO model has shown a better fit for both initial dye concentrations than the IP one. These results allow to conclude the important role of the dyes adsorption step over the carbon surface (chemisorption process) that is the rate-limiting step. In relation with the fitting parameters included in Table 2, k2 values for MB adsorption are generally higher than the corresponding ones for MG adsorption, that agrees with the previous analysis.

Table 2.
Kinetic parameters for methylene blue and malachite green adsorption by almond shell activated carbon at 25 ºC, natural pH and an adsorbent dosage of 0.5 g·L-1.
Table 2.
Kinetic parameters for methylene blue and malachite green adsorption by almond shell activated carbon at 25 ºC, natural pH and an adsorbent dosage of 0.5 g·L-1.
| Kinetic model | Parameter | Methylene blue | Malachite green |
|---|---|---|---|
| C0 = 50 mg·L-1 | |||
| Pseudo-second order | qe (mg·g-1) | 100.4 | 104.0 |
| k2 (g·mg-1·min-1) | 9.16·10-4 | 6.96·10-4 | |
| R2 | 0.9998 | 0.9998 | |
| Intraparticle diffusion | Kid,1 (mg·g-1·min0.5) | 11.87 | 14.68 |
| C1 (mg·g-1) | 7.55 | 1.77 | |
| R2 | 0.9243 | 0.9753 | |
| Kid,2 (mg·g-1·min0.5) | 0.286 | 3.02 | |
| C2 (mg·g-1) | 93.03 | 53.14 | |
| R2 | 0.6673 | 0.9075 | |
| Kid,3 (mg·g-1·min0.5) | - | 0.273 | |
| C3 (mg·g-1) | - | 93.41 | |
| R2 | - | 0.8709 | |
| C0 = 250 mg·L-1 | |||
| Pseudo-second order | qe (mg·g-1) | 441.1 | 378.6 |
| k2 (g·mg-1·min-1) | 2.62·10-5 | 1.76·10-4 | |
| R2 | 0.9880 | 0.9747 | |
| Intraparticle diffusion | Kid,1 (mg·g-1·min0.5) | 35.85 | 13.02 |
| C1 (mg·g-1) | 1.69 | 13.12 | |
| R2 | 0.9974 | 0.9619 | |
| Kid,2 (mg·g-1·min0.5) | 7.65 | 7.55 | |
| C2 (mg·g-1) | 148.3 | 73.23 | |
| R2 | 0.9640 | 0.9769 | |
| Kid,3 (mg·g-1·min0.5) | - | - | |
| C3 (mg·g-1) | - | - | |
| R2 | - | - | |
Table 2.
(cont). Kinetic parameters for methylene blue and malachite green adsorption by almond shell activated carbon at 25 ºC, natural pH and an adsorbent dosage of 0.5 g·L-1.
Table 2.
(cont). Kinetic parameters for methylene blue and malachite green adsorption by almond shell activated carbon at 25 ºC, natural pH and an adsorbent dosage of 0.5 g·L-1.
| Kinetic model | Parameter | Methylene blue | Malachite green |
|---|---|---|---|
| C0 = 500 mg·L-1 | |||
| Pseudo-second order | qe (mg·g-1) | 551.9 | 343.2 |
| k2 (g·mg-1·min-1) | 5.54·10-6 | 1.54·10-5 | |
| R2 | 0.9966 | 0.9933 | |
| Intraparticle diffusion | Kid,1 (mg·g-1·min0.5) | 10.43 | 11.46 |
| C1 (mg·g-1) | 22.47 | 20.48 | |
| R2 | 0.9397 | 0.8573 | |
| Kid,2 (mg·g-1·min0.5) | 1.25 | 3.31 | |
| C2 (mg·g-1) | 419.7 | 205.9 | |
| R2 | 0.7235 | 0.9763 | |
| Kid,3 (mg·g-1·min0.5) | - | - | |
| C3 (mg·g-1) | - | - | |
| R2 | - | - | |
3.2.3. Adsorption Equilibrium
A very useful information that allows to evaluate separation processes based on adsorption is the analysis of adsorption isotherms. Figure 9 shows the experimental equilibrium data obtained for each dye at selected conditions. At first glance some difference can be observed in the shape of the isotherms obtained, since in the case of MB the adsorbed amount tends to a constant value when the liquid phase concentration reaches 20 mg·L-1. However, in the case of MG, this plateau is not reached, thus a monotonic increase in the amount of adsorbed dye is observed and then, the saturation of the adsorbent is not reached.
Based on the previously described behavior, it seems that the carbon has a strong affinity for MB. Once the saturation of the carbon is reached, an increase in the concentration of MB in the fluid phase is observed. This behavior corresponds to a type H2 isotherm according to the Giles classification. In the case of MG, the affinity towards the carbon is significantly lower and the isotherm would be classified as type L2, in which the interactions between the dye molecules could be important, increasing the resistance to adsorption [18].
The experimental equilibrium data have been fitted with different models previously described (Figure 9). Table 3 shows the fit parameters, as well as the goodness of the fit to each model. In view of the results it can be concluded that Langmuir and Freundlich models showed the best fitting for MB and MG equilibrium data, respectively, which is in agreement with the previous discussion about the different shape of the adsorption isotherms.
In any case, Langmuir isotherm can satisfactorily fit the adsorption equilibrium for both dyes, and it allows to conclude that the main part of adsorption occurs through the formation of a monolayer. Also, for both dyes, the parameter n of the Freundlich model reaches values between 1 and 10 indicating that adsorption is favorable [19]. The higher value in the case of MB adsorption agrees with the higher affinity of the carbon for this dye previously commented.
Table 4 shows a comparison of the adsorption capacity obtained using the Langmuir model for both dyes in the present work with those of previous studies using different biomass-derived activated carbons. It can be seen that the almond shell activated carbon exhibited high adsorption capacities for both dyes but particularly for MG which far surpassed all other materials.
Table 3.
Equilibrium parameters of different models for the adsorption of methylene blue and malachite green.
Table 3.
Equilibrium parameters of different models for the adsorption of methylene blue and malachite green.
| Equilibrium model | Parameter | Methylene blue | Malachite green |
|---|---|---|---|
| Langmuir | qm,L (mg·g-1) | 341.3 | 363.6 |
| kL (L·mg-1) | 2.64 | 0.15 | |
| R2 | 0.989 | 0.982 | |
| Freundlich | N | 7.9 | 3.6 |
| kF (mg·g-1·(L·mg-1)-1/n) | 217.0 | 103.5 | |
| R2 | 0.896 | 0.998 | |
| Temkin | B (J·mol-1) | 26.4 | 53.2 |
| kT (L·mg-1) | 9514.8 | 6.3 | |
| R2 | 0.910 | 0.948 | |
| Dubinin-Radushkevich | qm,DR (mg·g-1) | 314.2 | 257.6 |
| kDR (mol2·kJ-2) | 8.54·10-9 | 1.83·10-7 | |
| R2 | 0.919 | 0.730 |
Table 4.
Langmuir adsorption capacity of several biomass-derived activated carbons for MB and MG.
| Precursor material | Dye | Capacity (mg·g-1) | Reference |
|---|---|---|---|
| Almond shell | MB | 341 | This work |
| Walnut shell | MB | 247 | [20] |
| Rubber seed pericarp | MB | 348 | [21] |
| Oil palm frond and palm kernel shell | MB | 332 | [22] |
| Sunflower pith | MB | 581 | [23] |
| Chickpea peel | MB | 200 | [24] |
| Sugarcane bagasse waste | MB | 142 | [25] |
| Almond shell | MG | 364 | This work |
| Charcoal | MG | 27 | [26] |
| Pinus roxburghii cone | MG | 250 | [27] |
| Walnut shell | MG | 155 | [28] |
| Okra stalks | MG | 100 | [29] |
| Hevea brasiliensis root | MG | 260 | [30] |
| Peach pit | MG | 70 | [31] |
3.3. Simulation of Dyes Adsorption in a Packed-Bed Column
The different studies developed in this work focused on the adsorption of two dyes (MB and MG) on an activated carbon produced from a biomass waste, almond shell, have been completed with a simulation of the separation of these pollutants in a packed-bed column. For this, Aspen Adsorption V14 software package from Aspentech has been used. Moreover, with the objective of validating the methodology and carrying out a comparison of MB adsorption dynamics, a previous study has been used [32]. Based on previous studies about steady state simulation for the adsorption of different pollutants (including dyes), the NRTL model has been chosen [33]. Furthermore, Table 5 shows the most important parameters used in present study.
The values of the mass transfer coefficients for both dyes have been estimated based on the adsorption kinetics previously analysed in section 3.2.2. The isotherm models for each dye employed in the software have been those that showed the best fit in section 3.2.3, that is, Langmuir model for MB and Freundlich model for MG.
Table 5.
Modelling parameters for dye adsorption simulation.
| Parameter | Value |
|---|---|
| Internal diameter of packed bed (cm) | 2.4 |
| Interparticle voidage (m3 void·m-3 bed) | 0.497* |
| Solid density (kg·m-3) | 3045* |
| Mass transfer coefficient MB (s-1) | 0.00103 |
| Mass transfer coefficient MG (s-1) | 0.00126 |
| Mass of carbon (g) | 12.1 |
*[33].
Once the data had been collected or estimated, the simulation of the breakthrough curves for MB adsorption by almond shell activated carbon was carried out at two different initial concentrations and compared to those obtained for a coconut shell activated carbon [32], observing a very good agreement (Figure 10). Regarding the influence of initial concentration, when it is increased, the breakthrough point is reached in a shorter time due to the high amount of dye molecules that are being fed to the adsorbent bed. On the other hand, it can be concluded that the almond shell carbon is able to adsorb a larger amount of MB than the coconut shell one, which can be related with its significantly largest surface area (1577 m2·g-1 vs 1026 m2·g-1), allowing to increase the adsorption capacity.
Various simulations were also carried out to analyze the role that different operating variables may have on the shape of the breakthrough curves, since they can provide valuable information for the industrial application of this type of operation. Hence, Figures S1 and S2 show the influence of the adsorbent bed height and initial dye concentration on the breakthrough curves of MB adsorption in a fixed bed.
When the bed length is increased the breakthrough curve shifts to longer times because there is a greater amount of carbon surface available for dye adsorption. The opposite behaviour is observed when the influent flowrate is increased as adsorbent saturation occurs in a shorter time due to the increase in the amount of MB molecules fed per unit of time. In both studies, no notable changes were observed in the shape of the breakthrough curve, with a similar mass transfer zone (MTZ) in all cases.
The same study has been carried out for green malachite adsorption (MG), obtaining a similar behavior to that previously explained for MB (Figures S3-S5).
Figure 11 shows a comparison of the breakthrough curves obtained for both dyes (MB and MG) using different inlet concentrations. It is observed that the shape of the curve for MG changes when the breakthrough time increases (by decreasing the concentration of dye in the feed), showing a clear increase in MTZ. Conversely, in the case of MB, the shape of the curve remains relatively constant.
Moreover, it can be observed that for the lower dye inlet concentration, dye adsorption on the carbon is higher for MB, whereas the opposite occurs when the dye inlet concentration is increased This behavior can be related, to the adsorption isotherms previously obtained in relation to the affinity of the dyes for the carbon and the type of interactions that predominate for each system. In addition, the fact that MTZ increases notably for MG (especially for low dye concentrations) could be related to interactions between the dye molecules that hinder their adsorption on the carbon surface and therefore the length of the MTZ tends to increase.
4. Conclusions
The present study has analyzed the use of an activated carbon derived from an industrial waste (almond shell) for the adsorption of two dyes, blue methylene and green malachite, from aqueous solutions.,. Activation with KOH has led to an important increase in both surface area and pore size, which favors the adsorption of this type of pollutants. Regarding the influence of adsorption conditions, it was found that increasing the adsorbent dosage the adsorption percentage (for all tested dye initial concentrations) increases, but causes a decrease in the adsorption capacity, due to limitations caused by adsorption equilibrium. The behavior is slightly different for the highest concentration of dyes used (500 mg·L-1) because a maximum is reached at a dosage of 0.75 g·L-1. On the other hand, a greater affinity of the carbon for MB than for MG was detected.
Adsorption kinetics was explained by the pseudo-second order kinetic model (PSO) suggesting chemical adsorption as the main adsorption mechanism, although the importance of intraparticle diffusion in the overall adsorption mechanism was also evidenced.
Regarding adsorption equilibrium, Langmuir and Freundlich models showed the best performance, particularly Langmuir for MB and Freundlich for MG. This difference in the adsorption equilibrium of both dyes can be related to the interactions between dye molecules which are more significant for MG.
Finally, simulation studies have shown that the activated carbon prepared in the present study has presented a good overall performance for both dyes adsorption. Furthermore, the most pronounced interactions between MG molecules explain the different shape of the breakthrough curves compared to the MB ones, increasing the MTZ and decreasing the adsorption at low dye concentrations in the fluid phase.
Supplementary Materials
The following supporting information can be downloaded at the website of this paper posted on Preprints.org, Figure S1. Influence of bed length upon the breakthrough curves of MB adsorption. QL = 0.01 mL·min-1, C0 = 200 mg·L-1, mb = 12.1 g, Db = 2.4 cm. Figure S2. Influence of feed flowrate upon the breakthrough curves of MB adsorption. C0 = 200 mg·L-1, mb = 12.1 g, Db = 2.4 cm. Hb = 1.74 cm. Figure S3. Influence of dye concentration in feed stream upon the breakthrough curves of MG adsorption. QL = 0.01 mL·min-1, mb = 12.1 g, Db = 2.4 cm. Figure S4. Influence of bed length upon the breakthrough curves of MG adsorption. QL = 0.01 mL·min-1, C0 = 200 mg·L-1, mb = 12.1 g, Db = 2.4 cm. Figure S5. Influence of liquid phase flowrate upon the breakthrough curves of MG adsorption. C0 = 200 mg·L-1, mb = 12.1 g, Db = 2.4 cm. Hb = 1.74 cm.
Author Contributions
Investigation, validation, visualization, A.R. and C.H.P.; methodology, supervision, funding acquisition, writing—review and editing, M.S.F., D.G.-D. and J.G.-Á. All authors have read and agreed to the published version of the manuscript.
Funding
This work was financially supported by Xunta de Galicia (ED431B 2020/039).
Institutional Review Board Statement
Not applicable.
Informed Consent Statement
Not applicable.
Data Availability Statement
The data presented in this study are available on request from the corresponding author.
Conflicts of Interest
The authors declare no conflicts of interest.
References
- Lotfy, H.R.; Roubik, H. Water purification using activated carbon prepared from agriculture waste—Overview of a recent development. Biomass. Conv. Bioref. 2023, 13, 15577–15590. [Google Scholar] [CrossRef]
- Ullah Khan, W.; Ahmed, S.; Dhoble, Y.; Madhav, S. A critical review of hazardous waste generation from textile industries and associated ecological impacts. J. Indian Chem. Soc. 2023, 100, 100829. [Google Scholar] [CrossRef]
- Shakoor, S.; Nasar, A. Adsorptive treatment of hazardous Methylene Blue dye from artificially contaminated water using Cucumis sativus peel waste as a low-cost adsorbent. Groundw. Sustain. Dev. 2017, 5, 152–159. [Google Scholar] [CrossRef]
- Wisniewska, M.; Urban, T.; Tokarska, K.; Marciniak, P.; Giel, A.; Nowick, P. Removal of organic dyes, polymers and surfactants using carbonaceous materials derived from walnut shells. Materials 2024, 17, 1987. [Google Scholar] [CrossRef]
- Santos, D. H. S.; Duarte, J. L. S. Tonholo, J.; Meili, L.; Zanta, C. L. P. S. Saturated activated carbon regeneration by UV-light, H2O2 and Fenton reaction. Sep. Purif. Technol. 2020. 250, 117112.
- Santos, D. H. S.; Xiao, Y.; Chaukura, N.; Hill, J. M. Selvasembian, R.; Zanta, C. L. P. S.; Meili, L. Regeneration of dye-saturated activated carbon through advanced oxidative processes: A review. Heliyon 2022, 8, e10205. [Google Scholar] [CrossRef]
- Plassard, F.; Winiarski, T.; Petit-Ramel, M. Retention and distribution of three heavy metals in a carbonated soil: comparison between batch and unsaturated column studies. J. Contam. Hydrol. 2000, 42, 99–111. [Google Scholar] [CrossRef]
- Kumar, D.; Pandey, L. K.; Gaur, J. Metal sorption by algal biomass: from batch to continuous system. Algal Res. 2016, 18, 95–109. [Google Scholar] [CrossRef]
- Selambakkannu, S.; Othman, N. A. F.; Bakar, K. A.; Karim, Z. A. Adsorption studies of packed bed column for the removal of dyes using amine functionalized radiation induced grafted fiber. SN Applied Sciences 2019, 1, 175. [Google Scholar] [CrossRef]
- Li, L.; Sun, F.; Gao, J.; Wang, L.; Pi, S.; Zhao, G. Broadening the pore size of coal-based activated carbon via a washing-free chem-physical activation method for high-capacity dye adsorption. RSC Adv. 2018, 8, 14488. [Google Scholar] [CrossRef]
- Amran, F.; Zaini, M. A. A. Effects of chemical activating agents on physical properties of activated carbons – a commentary. Water Prac. Technol. 2020, 15, 863–876. [Google Scholar] [CrossRef]
- Carabineiro, S. A. C.; Thavorn-Amornsri, T.; Pereira, M. F. R.; Serp, P.; Figueiredo, J. L. Comparison between activated carbon, carbon xerogel and carbon nanotubes for the adsorption of the antibiotic ciprofloxacin. Catal. Today 2012, 186, 29–34. [Google Scholar] [CrossRef]
- Juela, D.M. Comparison of the adsorption capacity of acetaminophen on sugarcane bagasse and corn cob by dynamic simulation. Sustain. Environ. Res. 2020, 30, 23. [Google Scholar] [CrossRef]
- Pimentel, C. H. Díaz-Fernández, L.; Gómez-Díaz, D.; Freire, M. S.; González-Álvarez, J. Separation of CO2 using biochar and KOH and ZnCl2 activated carbons derived from pine sawdust. J. Env. Chem. Eng. 2023, 11 111378.
- Thommes, M.; Kaneko, K.; Neimark, A. V.; Olivier, J. P.; Rodríguez-Reinoso, F.; Rouquerol, J.; Sing, K. S. W. Physisorption of gases, with special reference to the evaluation of surface area and pore size distribution. Pure Appl. Chem. 2015, 87, 1051–1069. [Google Scholar] [CrossRef]
- Manyá, J. J.; González, B.; Azuara, M.; Arner, G. Ultra-microporous adsorbents prepared from vine shoots-derived biochar with high CO2 uptake and CO2/N2 selectivity. Chem. Eng. J. 2018, 345, 631–669. [Google Scholar] [CrossRef]
- Freire, M. S. , Gómez Díaz, D., González Álvarez, J.; Pimentel, C. H. Preparation of activated carbon from pine (Pinus radiata) sawdust by chemical activation with zinc chloride for wood dye adsorption. Biomass Conv Bioref. 2023, 13, 16537–16555. [Google Scholar]
- Giles, C. H.; MacEwan, T.; Nakhwa, S.; Smith, D. A system of classification of solution adsorption isotherms and its use in diagnosis of adsorption mechanisms and in measurement of specific surface area solids. J. Chem. Soc. 1960, 14, 3973–3993. [Google Scholar] [CrossRef]
- Spessato, L.; Bedin, K. C.; Cazetta, A. L.; Souza, I. P. A. F.; Duarte, V. A.; Crespo, L. H. S.; Silva, M. C.; Pontes, R. M.; Almeida, V. C. KOH-super activated carbon from biomass waste: insights into the paracetamol adsorption mechanism and thermal regeneration cycles. J. Hazard. Mater. 2019, 371, 499–505. [Google Scholar] [CrossRef]
- Jawad, A. H.; Malek, N. N. A.; Khadiran, T.; Alothman, Z. A.; Yaseen, Z. M. Mesoporous high-surface-area activated carbon from biomass waste via microwave-assisted-H3PO4 activation for methylene blue dye adsorption: An optimized process. Diam. Relat. Mat. 2022, 128, 109288. [Google Scholar] [CrossRef]
- Jasri, K.; Abdulhameed, A. S.; Jawad, A. H.; Alothman, Z. A.; Yousef, T. A.; Al Duaij, O. K. Mesoporous activated carbon produced from mixed wastes of oil palm frond and palm kernel shell using microwave radiation-assisted K2CO3 activation for methylene blue dye removal: Optimization by response surface methodology. Diam. Relat. Mat. 2023, 131, 109581. [Google Scholar] [CrossRef]
- Baysal, M.; Bilge, K.; Yılmaz, B.; Papila, M.; Yürüm, Y. Preparation of high surface area activated carbon from waste-biomass of sunflower piths: kinetics and equilibrium studies on the dye removal. J. Environ. Chem. Eng. 2018, 6, 1702–1713. [Google Scholar] [CrossRef]
- Jahan, K.; Singh, V.; Mehrotra, N.; Rathore, K.; Verma, V. Development of activated carbon from KOH activation of pre-carbonized chickpea peel residue and its performance for removal of synthetic dye from drinking water. Biomass Convers. Biorefinery 2023, 13, 6913–6923. [Google Scholar] [CrossRef]
- Jawad, A. H.; Abdulhameed, A. S.; Bahrudin, N. N.; Hum, N. N. M. F.; Surip, S. N.; Syed-Hassan, S. S. A.; Yousif, E.; Sabar, S. Microporous activated carbon developed from KOH activated biomass waste: surface mechanistic study of methylene blue dye adsorption. Water Sci. Technol. 2021, 84, 1858–1872. [Google Scholar] [CrossRef] [PubMed]
- Ali, F.; Bibi, S.; Ali, N.; Ali, Z.; Said, A.; Wahab, Z. U.; Bilal, M.; Iqbal, H. M. N. Sorptive removal of malachite green dye by activated charcoal: process optimization, kinetic, and thermodynamic evaluation. Case Stud. Chem. Environ. Eng. 2020, 2, 100025. [Google Scholar] [CrossRef]
- Sharma, G.; Sharma, S.; Kumar, A.; Naushad, M.; Du, B.; Ahamad, T.; Ghfar, A. A.; Alqadami, A. A.; Stadler, F. J. Honeycomb structured activated carbon synthesized from Pinus roxburghii cone as effective bioadsorbent for toxic malachite green dye. J. Water Process. Eng. 2019, 32, 100931. [Google Scholar] [CrossRef]
- Merrad, S.; Abbas, M.; Trari, M. Adsorption of malachite green onto walnut shells: Kinetics, thermodynamic, and regeneration of the adsorbent by chemical process. Fibers Polym. 2023, 24, 1067–1081. [Google Scholar] [CrossRef]
- Yildiz, H.; Gülşen, H.; Şahin, Ö.; Baytar, O.; Kutluay, S. Novel adsorbent for malachite green from okra stalks waste: Synthesis, kinetics and equilibrium studies. Int. J. Phytoremediat. 2023, 10, 1–13. [Google Scholar] [CrossRef]
- Ahmad, A. A.; Ahmad, M. A.; Yahaya, N. K. E. M.; Karim, J. Adsorption of malachite green by activated carbon derived from gasified Hevea brasiliensis root. Arab. J. Chem. 2021, 14, 103104. [Google Scholar] [CrossRef]
- Qu, W.; Yuan, T.; Yin, G.; Xu, S.; Zhang, Q.; Su, H. Effect of properties of activated carbon on malachite green adsorption. Fuel 2019, 249, 45–53. [Google Scholar] [CrossRef]
- Zainol, N. B. Aspen simulation of methylene blue adsorption using coconut shell based activated carbon. Bachelor of Chemical Engineering Universiti Sains Malaysia 2021. [Google Scholar]
- Hameed, A.; Hameed, B. H.; Almomani, F. A.; Usman, M.; Ba-Abbad, M. M.; Khraisheh, M. Dynamic simulation of lead (II) metal adsorption from water on activated carbons in a packed-bed column. Biomass Conv. Bioref. 2024, 14, 8283–8292. [Google Scholar] [CrossRef]
- Rahimi, V.; Ferreiro-Salgado, A.; Gómez-Díaz, D.; Freire, M. S.; González-Álvarez, J. Evaluating the performance of carbon-based adsorbents fabricated from renewable biomass precursors for post-combustion CO2 capture. Sep. Purif. Technol. 2024, 344, 127110. [Google Scholar] [CrossRef]
Figure 1.
Point of zero charge (pHpzc) determination for almond shell carbons.
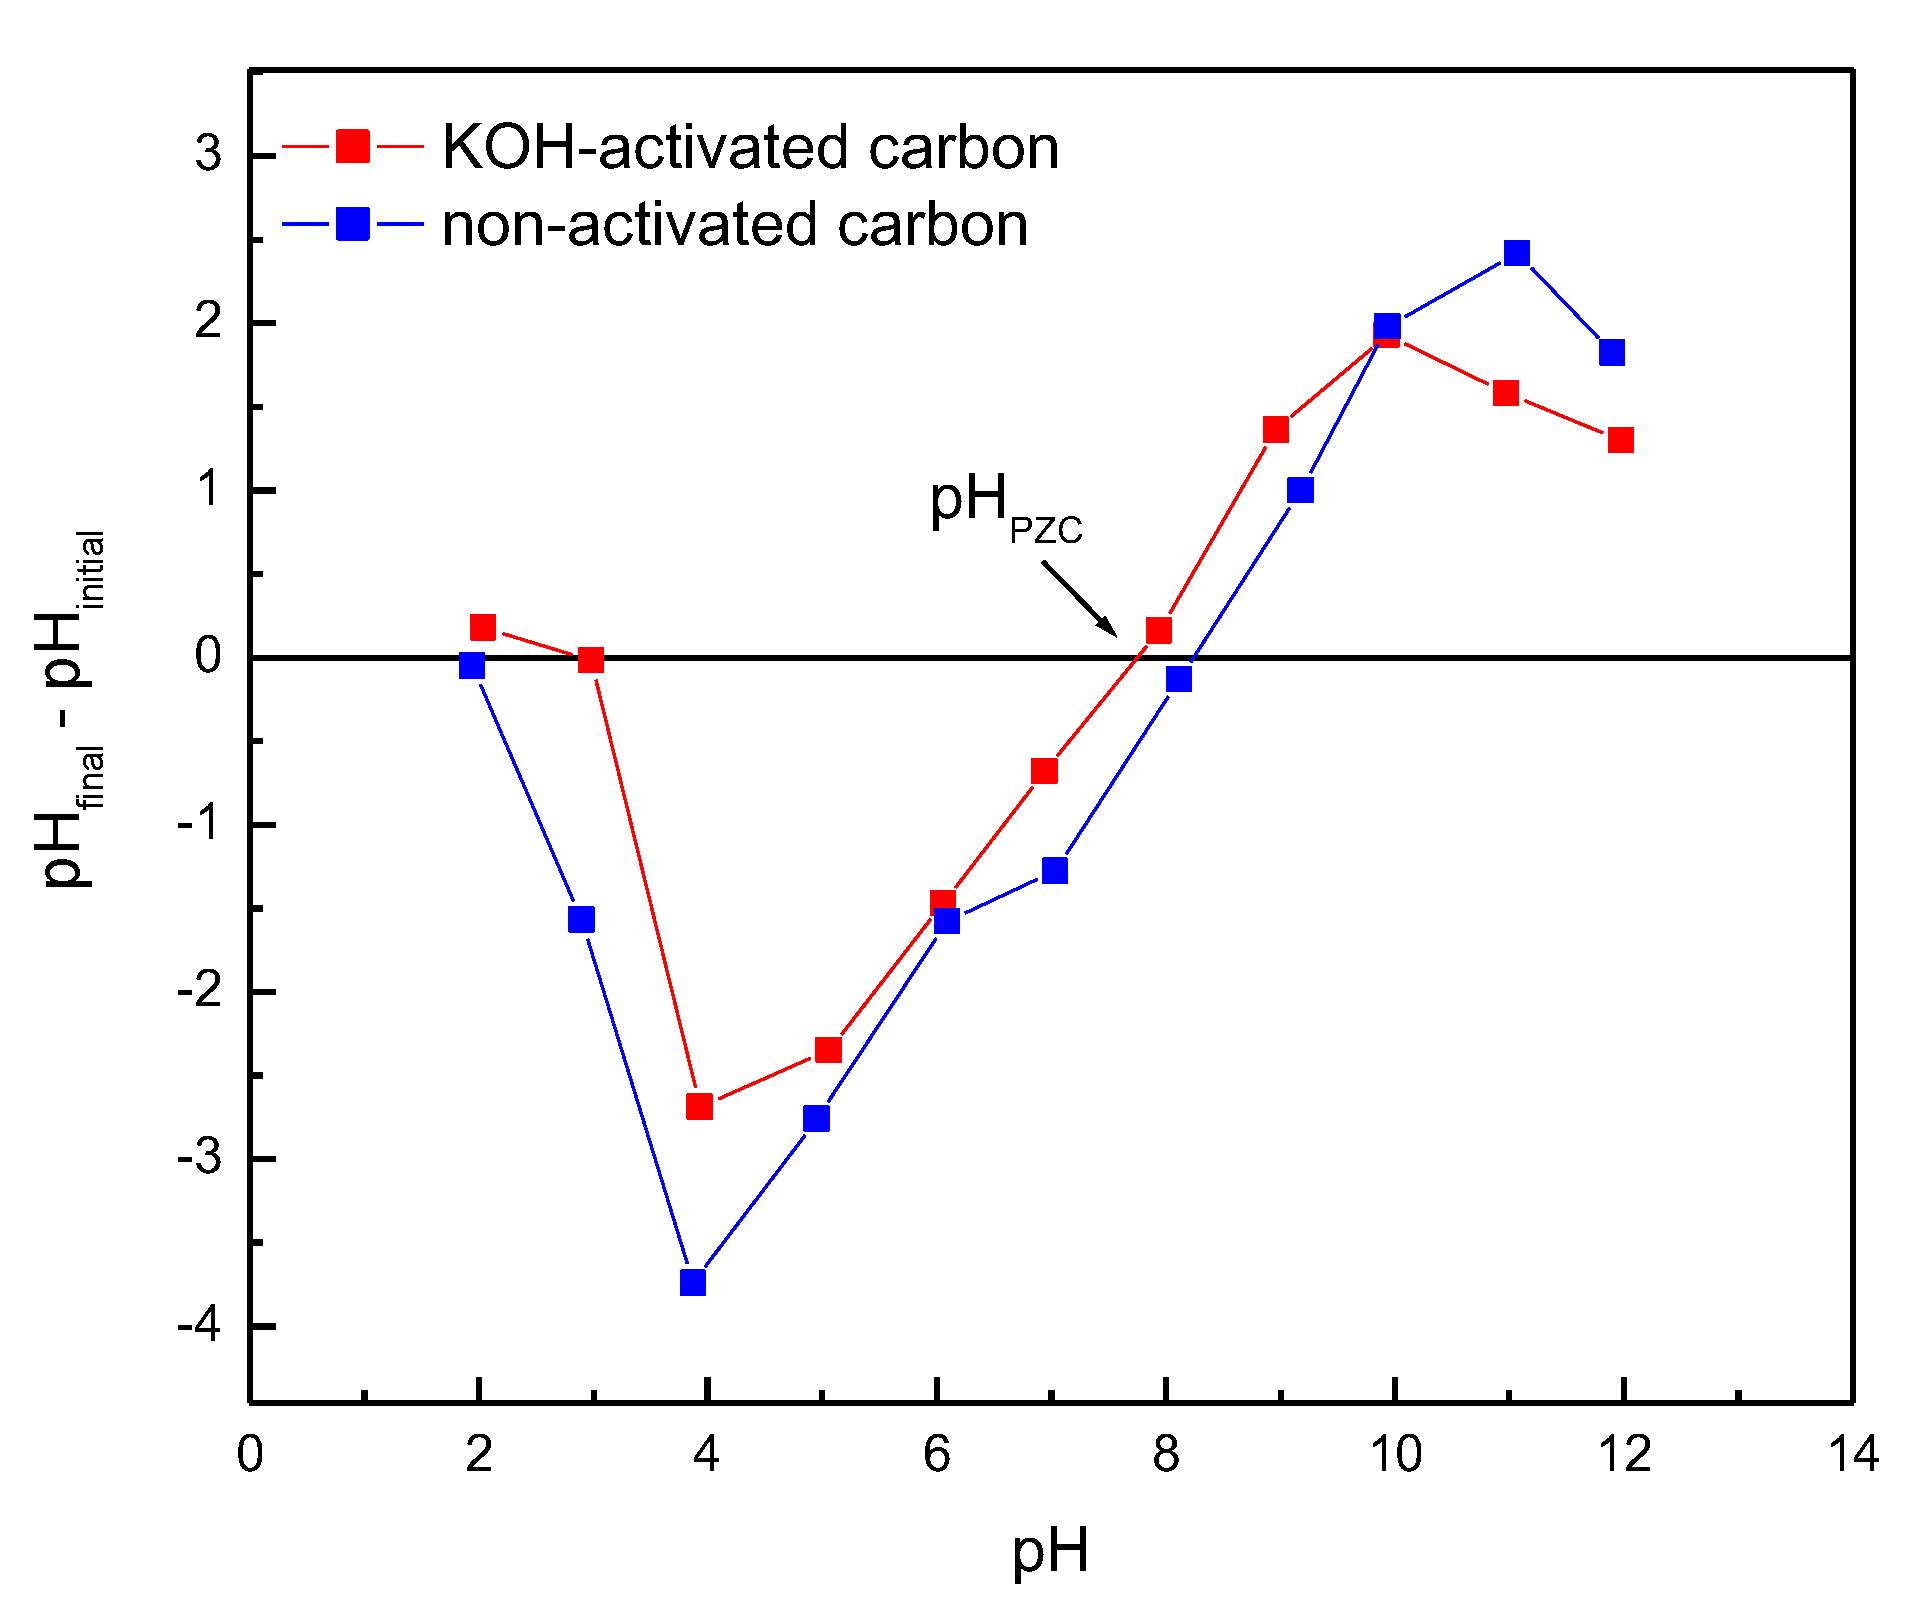
Figure 2.
Activated carbon surface images obtained with scanning electron microscopy (SEM) before (a) and after methylene blue (b) and malachite green (c) adsorption (C0 = 250 mg·L-1, adsorbent dosage = 0.5 g·L-1, T=25ºC, t=1440 min, natural pH).
Figure 2.
Activated carbon surface images obtained with scanning electron microscopy (SEM) before (a) and after methylene blue (b) and malachite green (c) adsorption (C0 = 250 mg·L-1, adsorbent dosage = 0.5 g·L-1, T=25ºC, t=1440 min, natural pH).
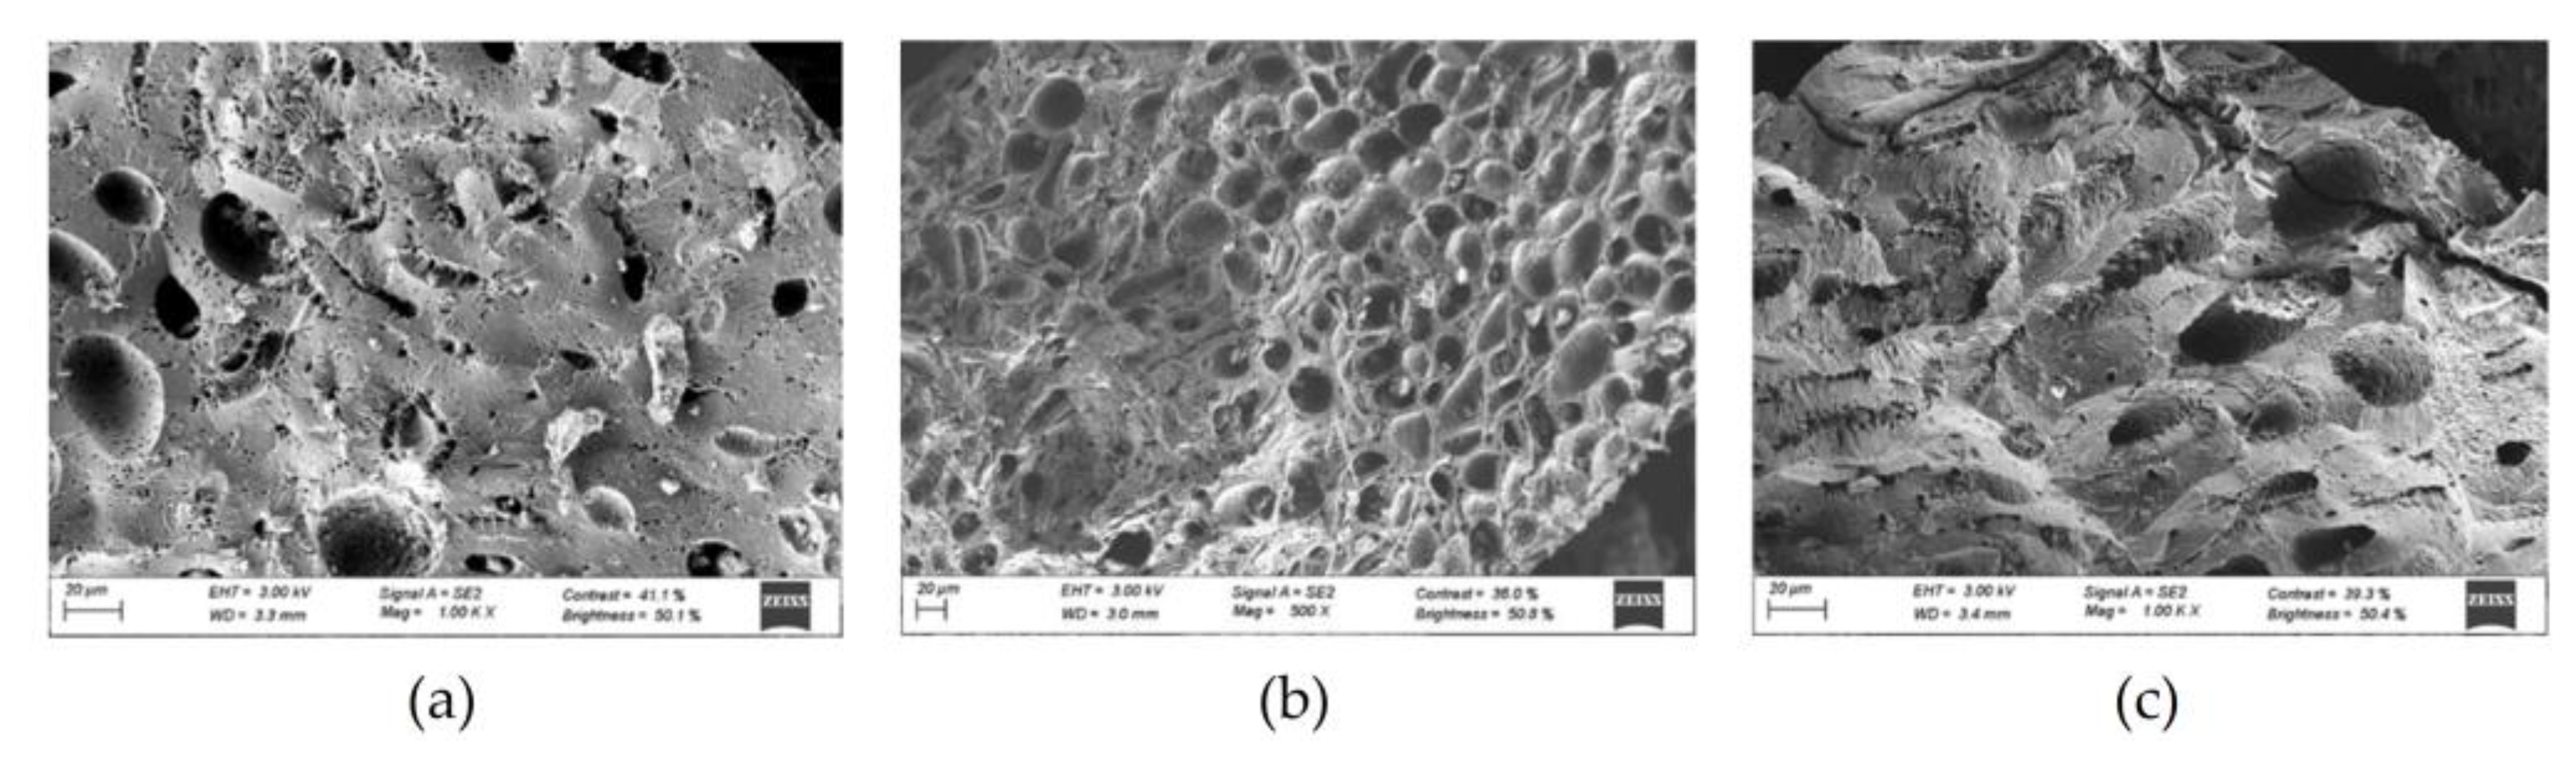
Figure 3.
FTIR spectra of carbons with and without KOH activation.
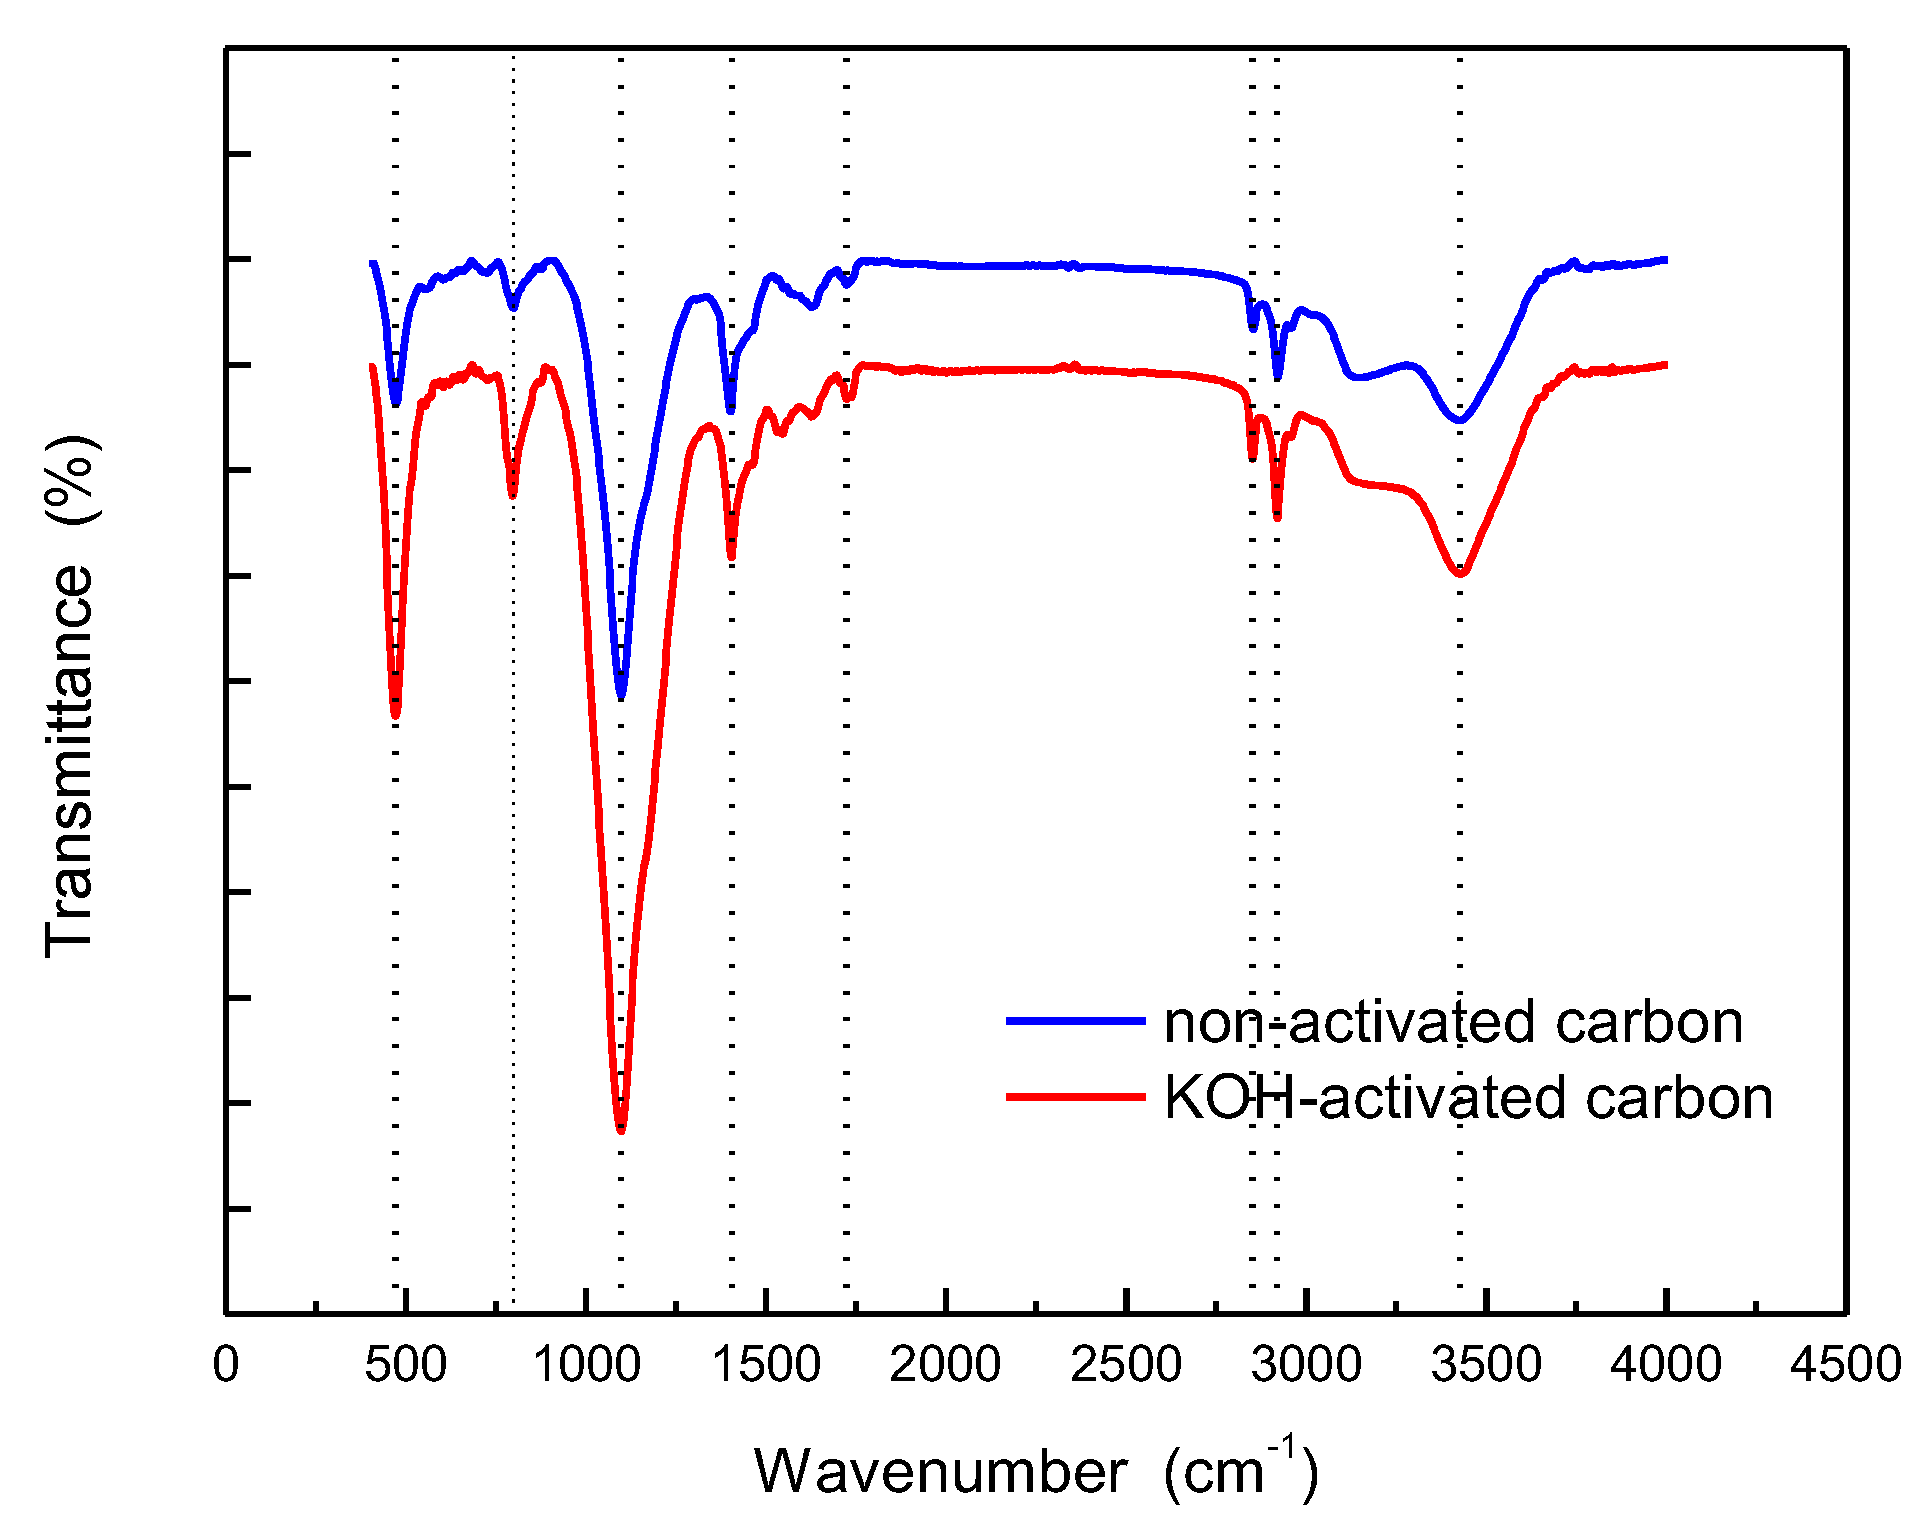
Figure 4.
Nitrogen adsorption and desorption isotherms at 77 K for almond shell non-activated and activated carbons.
Figure 4.
Nitrogen adsorption and desorption isotherms at 77 K for almond shell non-activated and activated carbons.
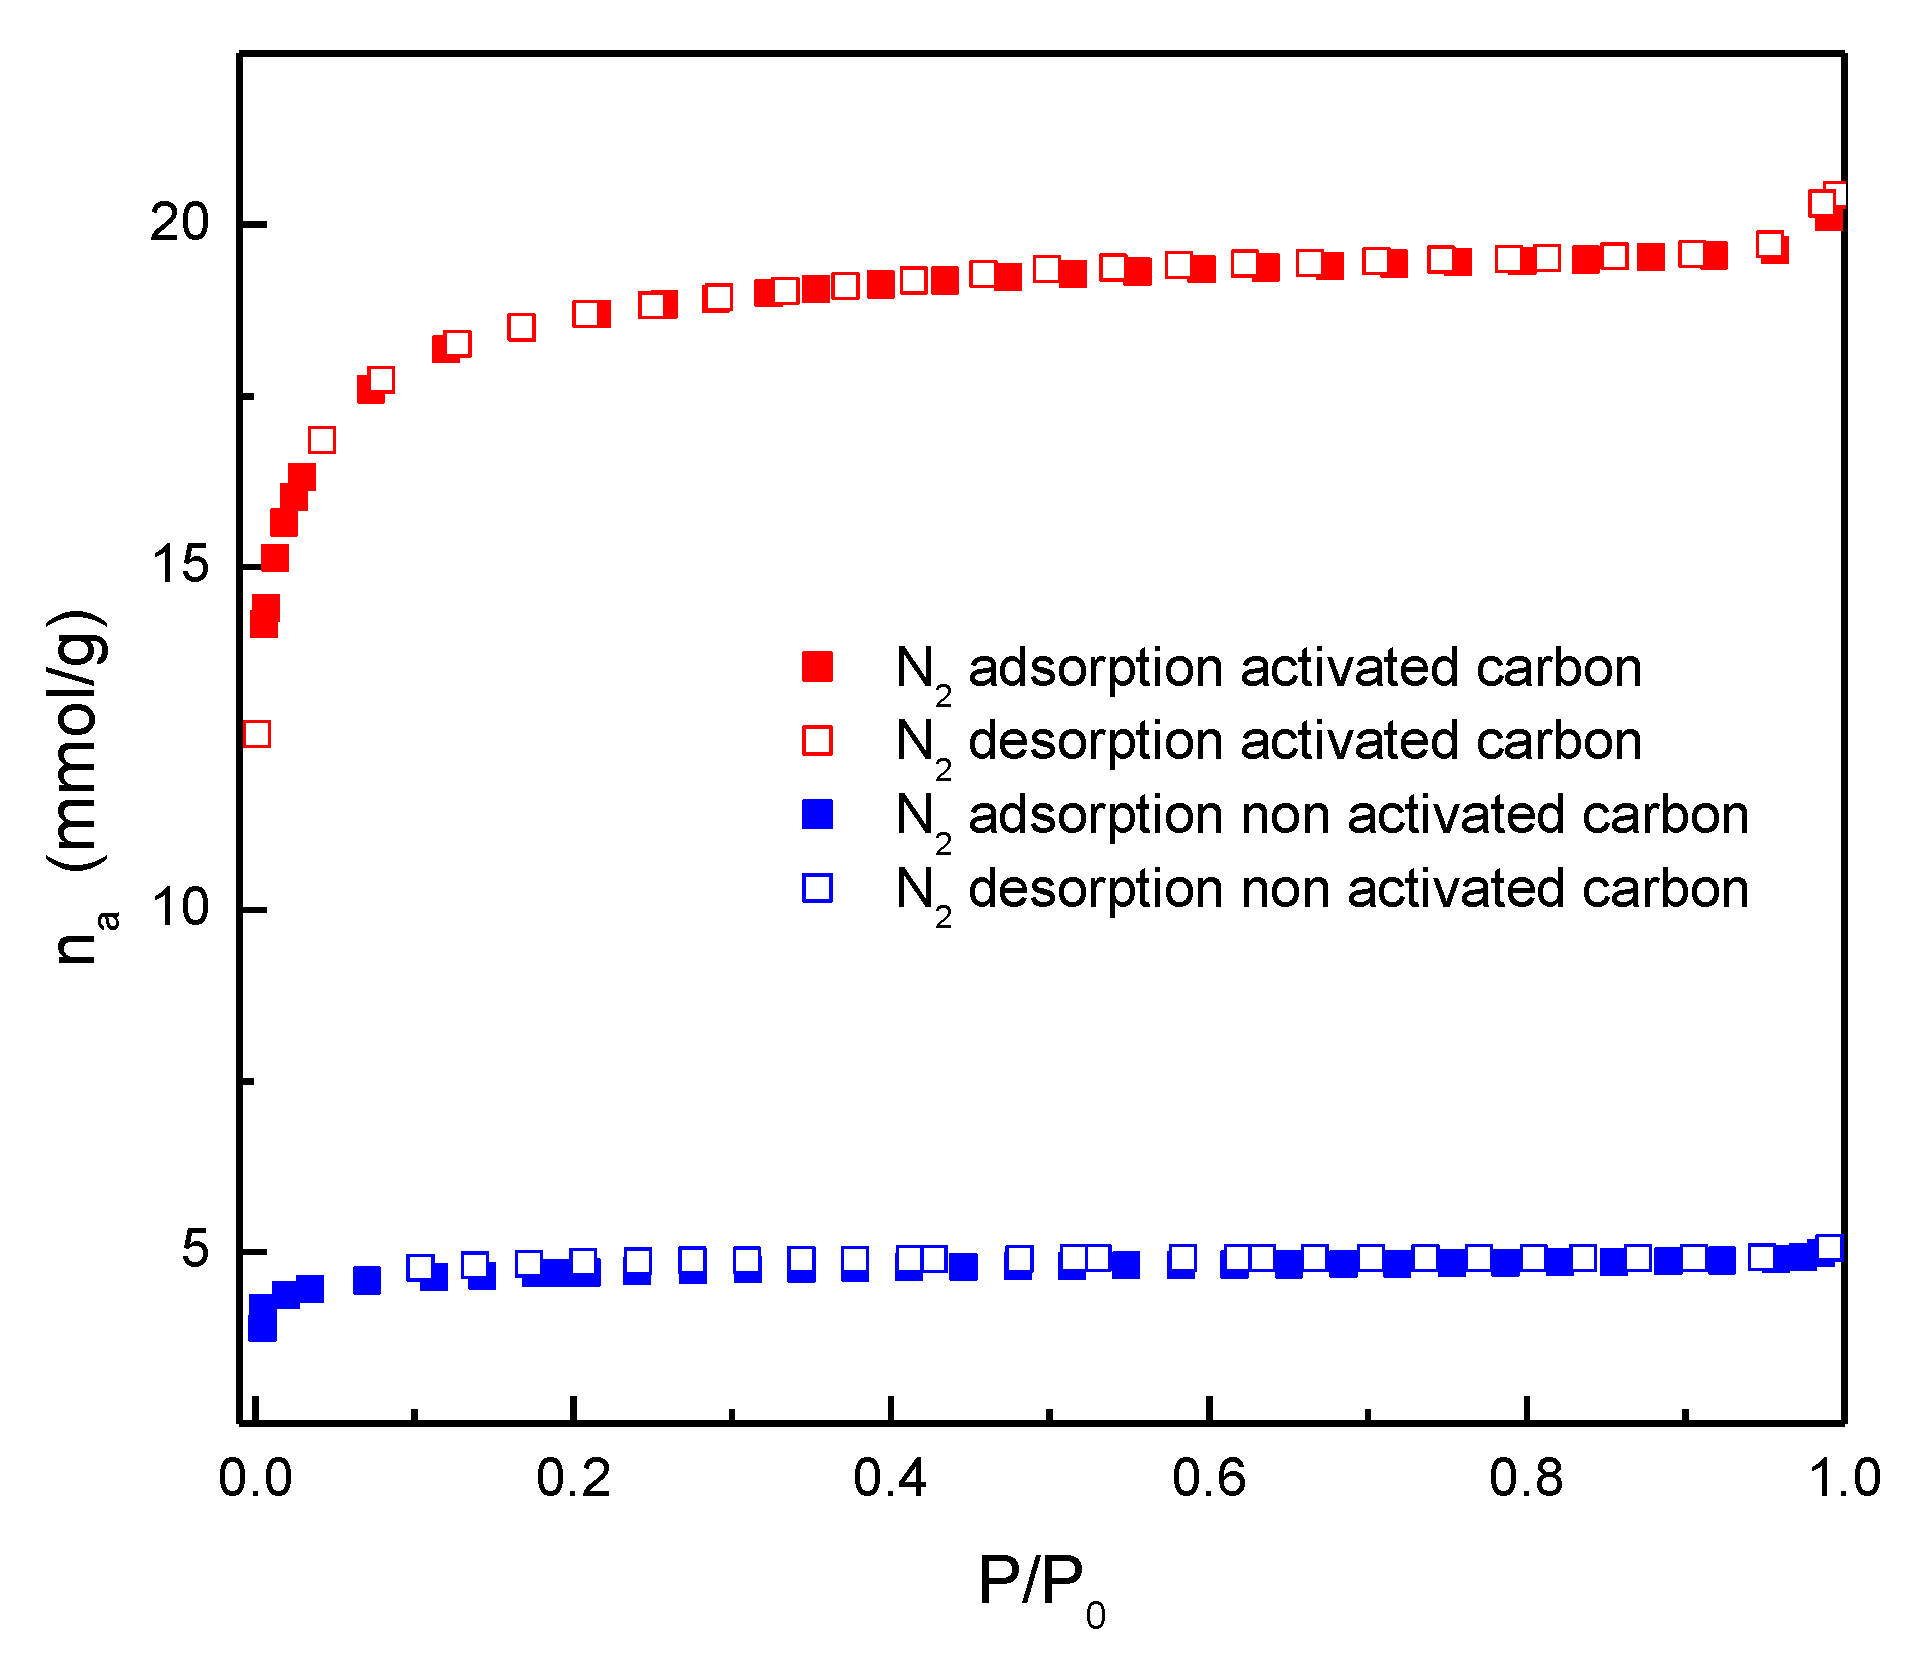
Figure 5.
Carbon dioxide adsorption isotherms at 273 K for almond shell non-activated and activated carbons.
Figure 5.
Carbon dioxide adsorption isotherms at 273 K for almond shell non-activated and activated carbons.
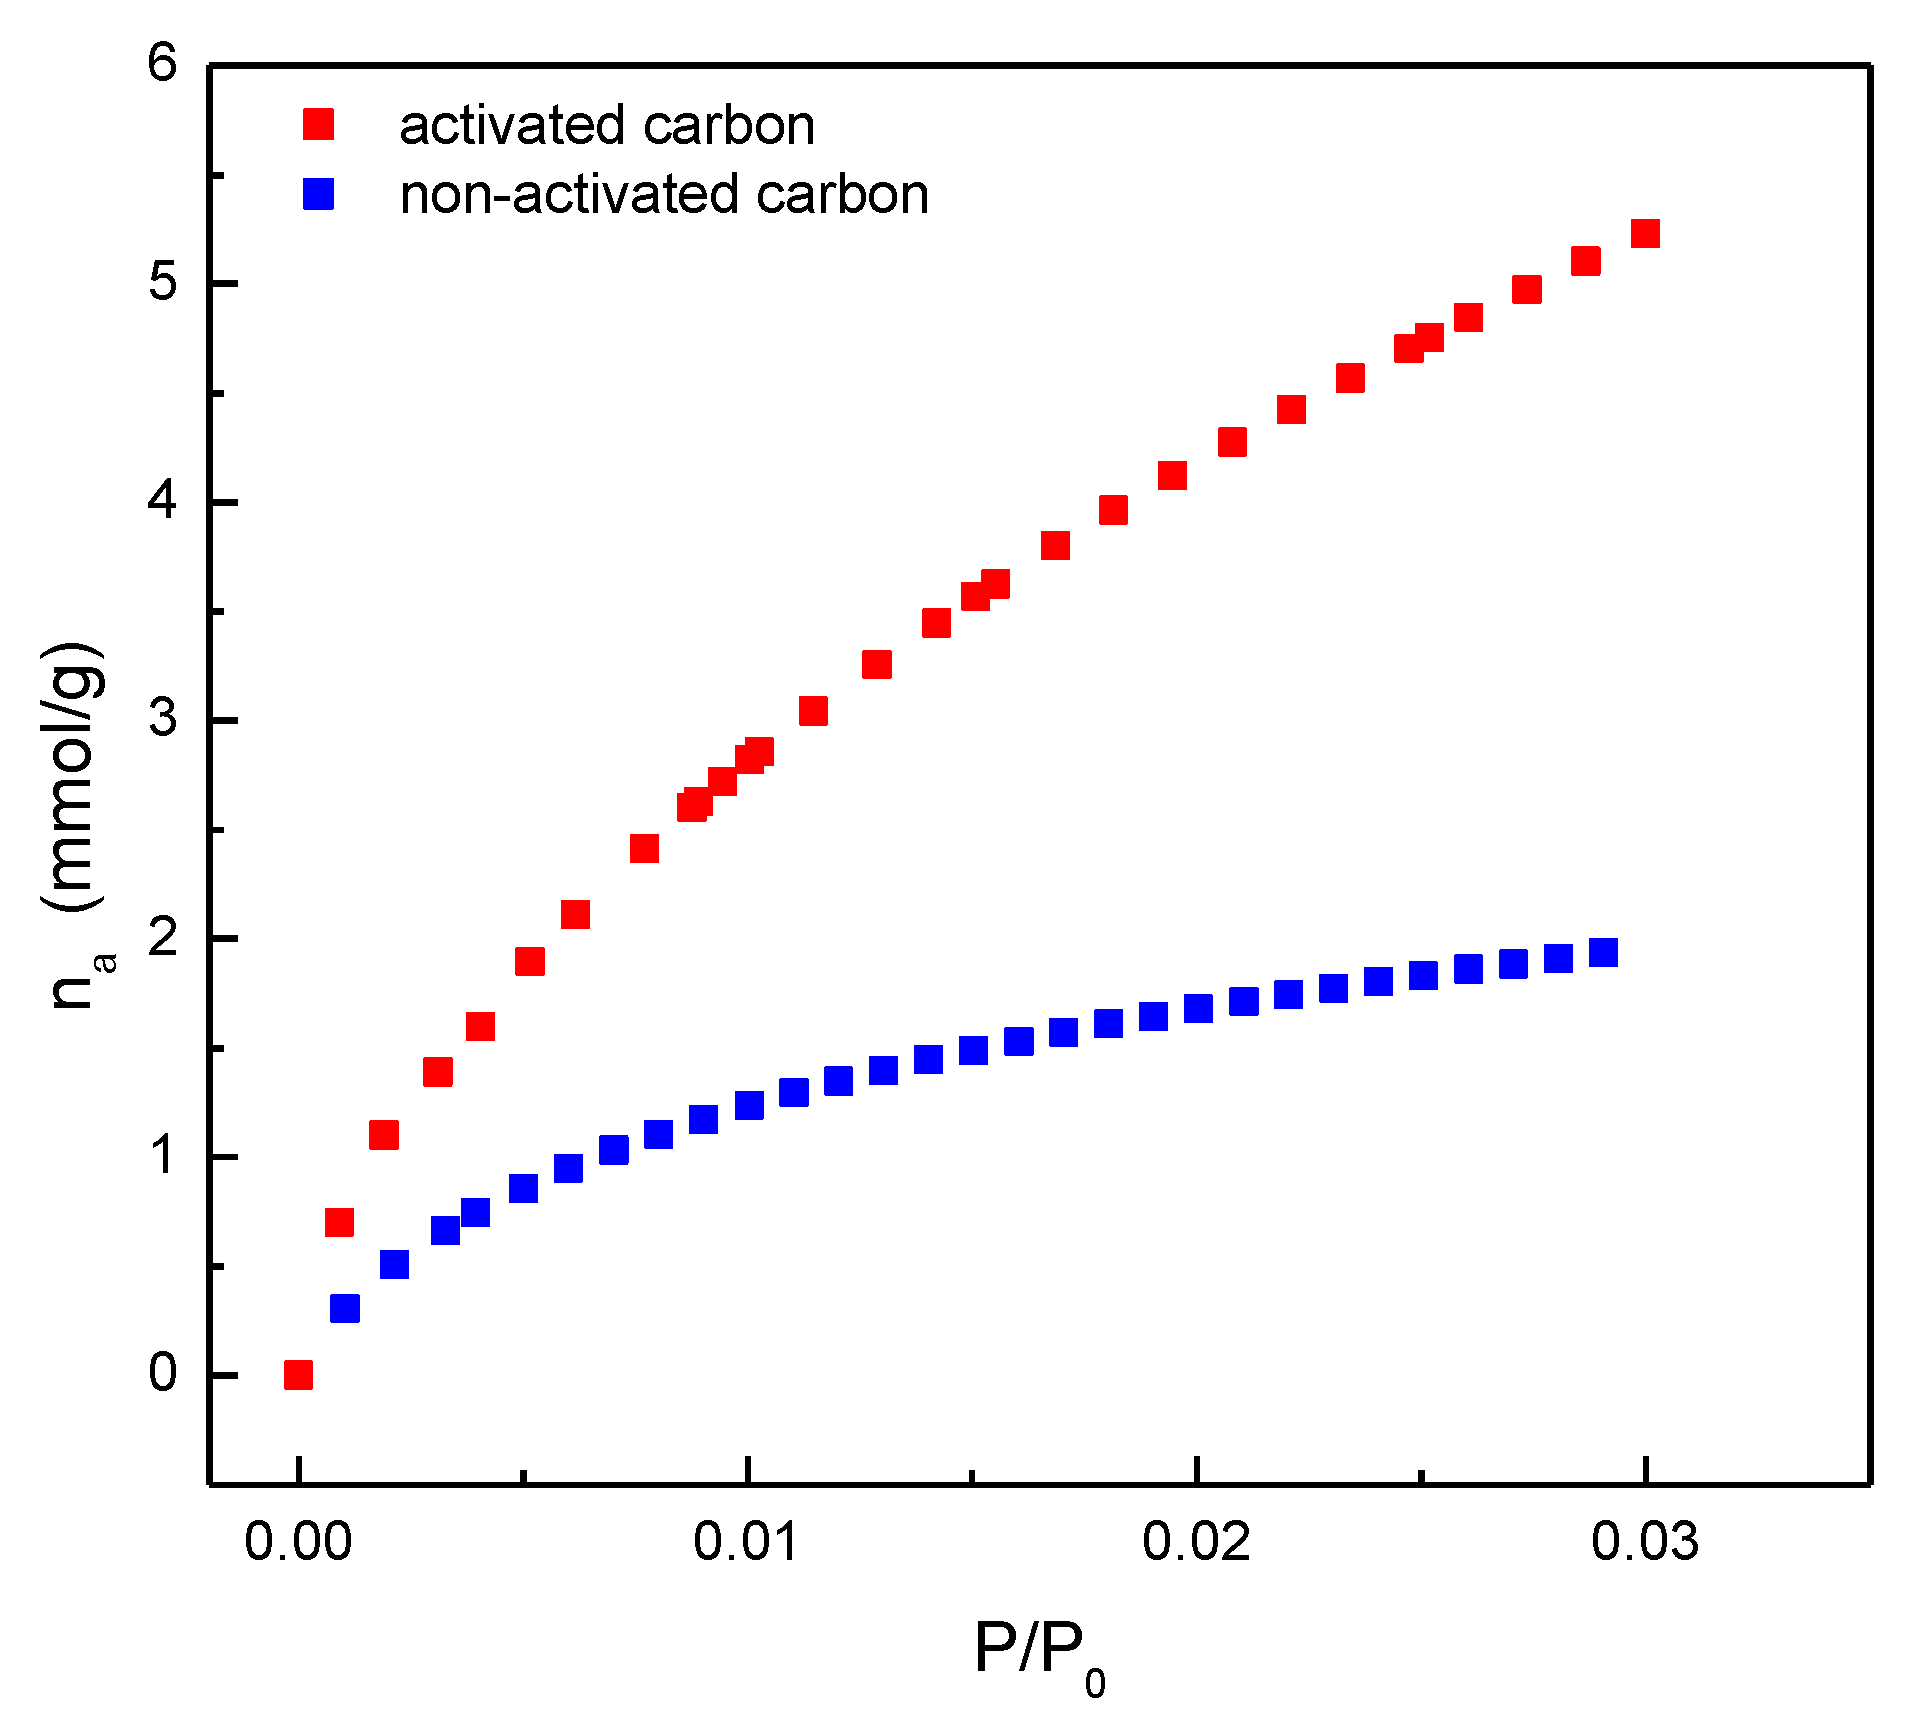
Figure 6.
Pore size distribution of the almond shell activated carbon estimated using NLDFT model.
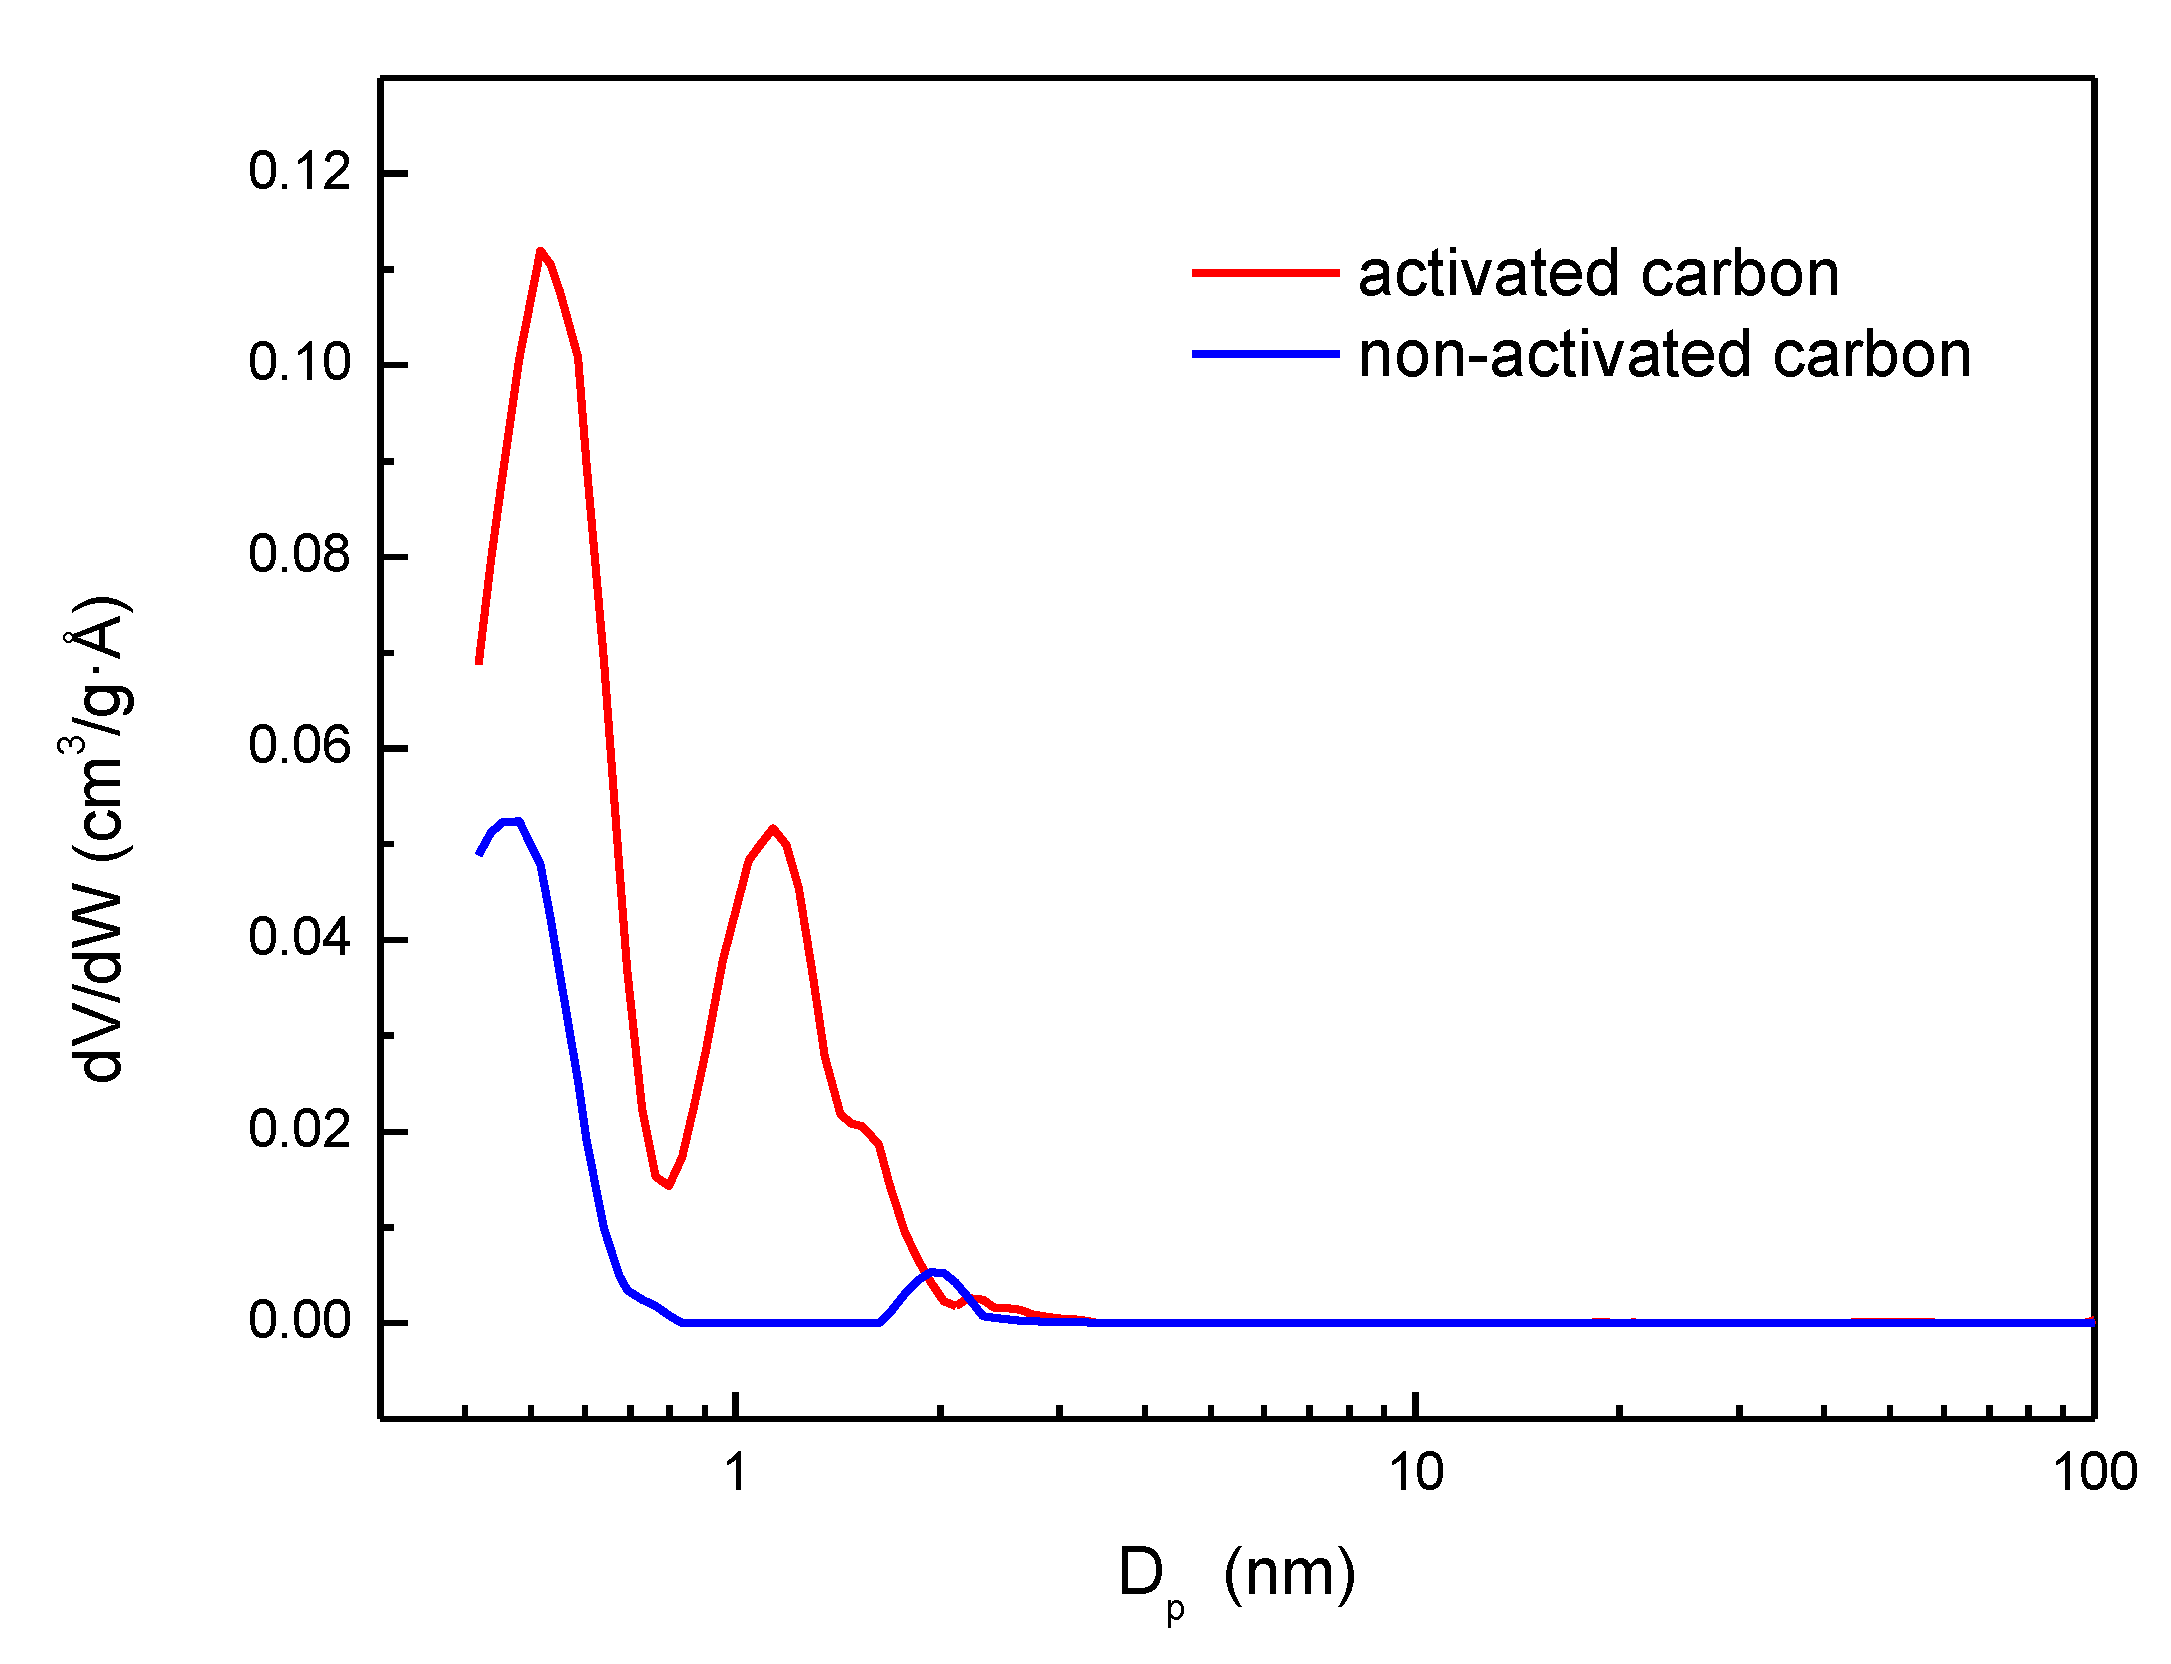
Figure 7.
Influence of adsorbent dosage upon adsorption percentage (columns) and capacity (symbols+lines) of MB (a) and MG (b) using different dye initial concentration. (■) C0=50 mg·L-1, (■) C0=250 mg·L-1, (■) C0=500 mg·L-1. T=25ºC, t=24 h.
Figure 7.
Influence of adsorbent dosage upon adsorption percentage (columns) and capacity (symbols+lines) of MB (a) and MG (b) using different dye initial concentration. (■) C0=50 mg·L-1, (■) C0=250 mg·L-1, (■) C0=500 mg·L-1. T=25ºC, t=24 h.
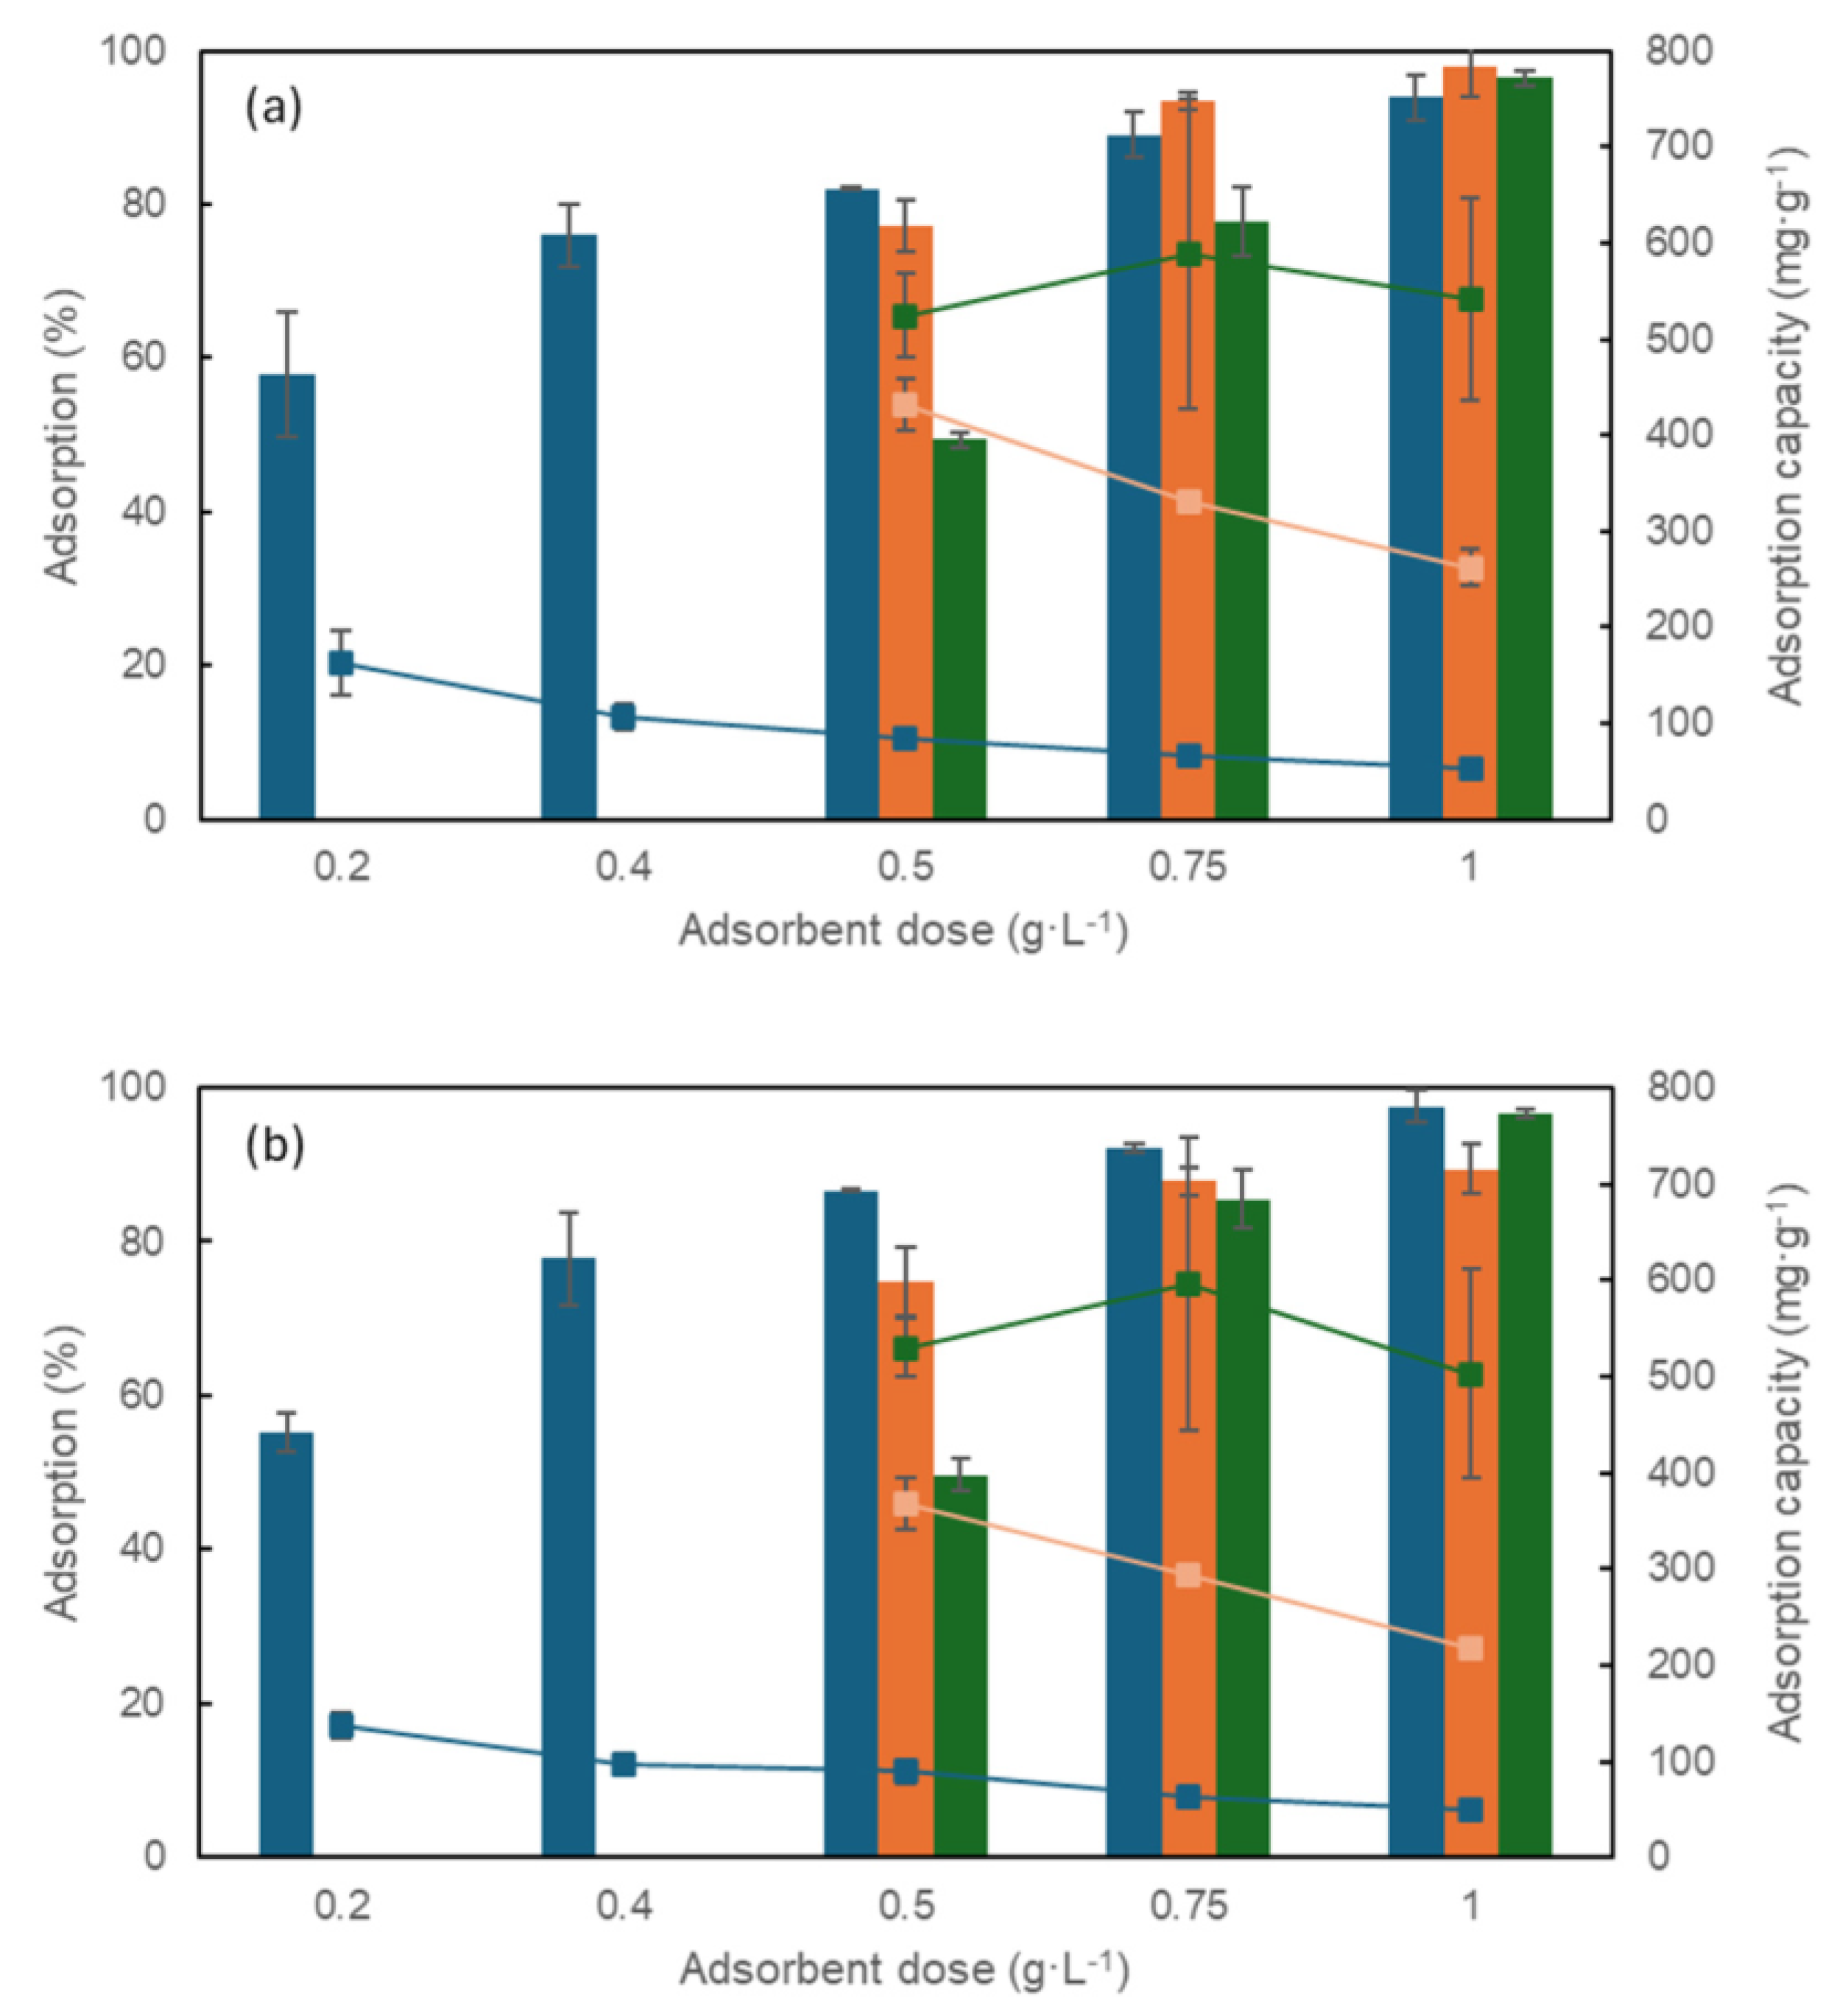
Figure 8.
Adsorption kinetics for the adsorption of MB (a) and MG (b) adsorption by almond shell activated carbon using different dye initial concentration at 25ºC, natural pH and an adsorbent dosage of 0.5 g·L-1. Solid line corresponds to the fitting to the pseudo-second order model.
Figure 8.
Adsorption kinetics for the adsorption of MB (a) and MG (b) adsorption by almond shell activated carbon using different dye initial concentration at 25ºC, natural pH and an adsorbent dosage of 0.5 g·L-1. Solid line corresponds to the fitting to the pseudo-second order model.
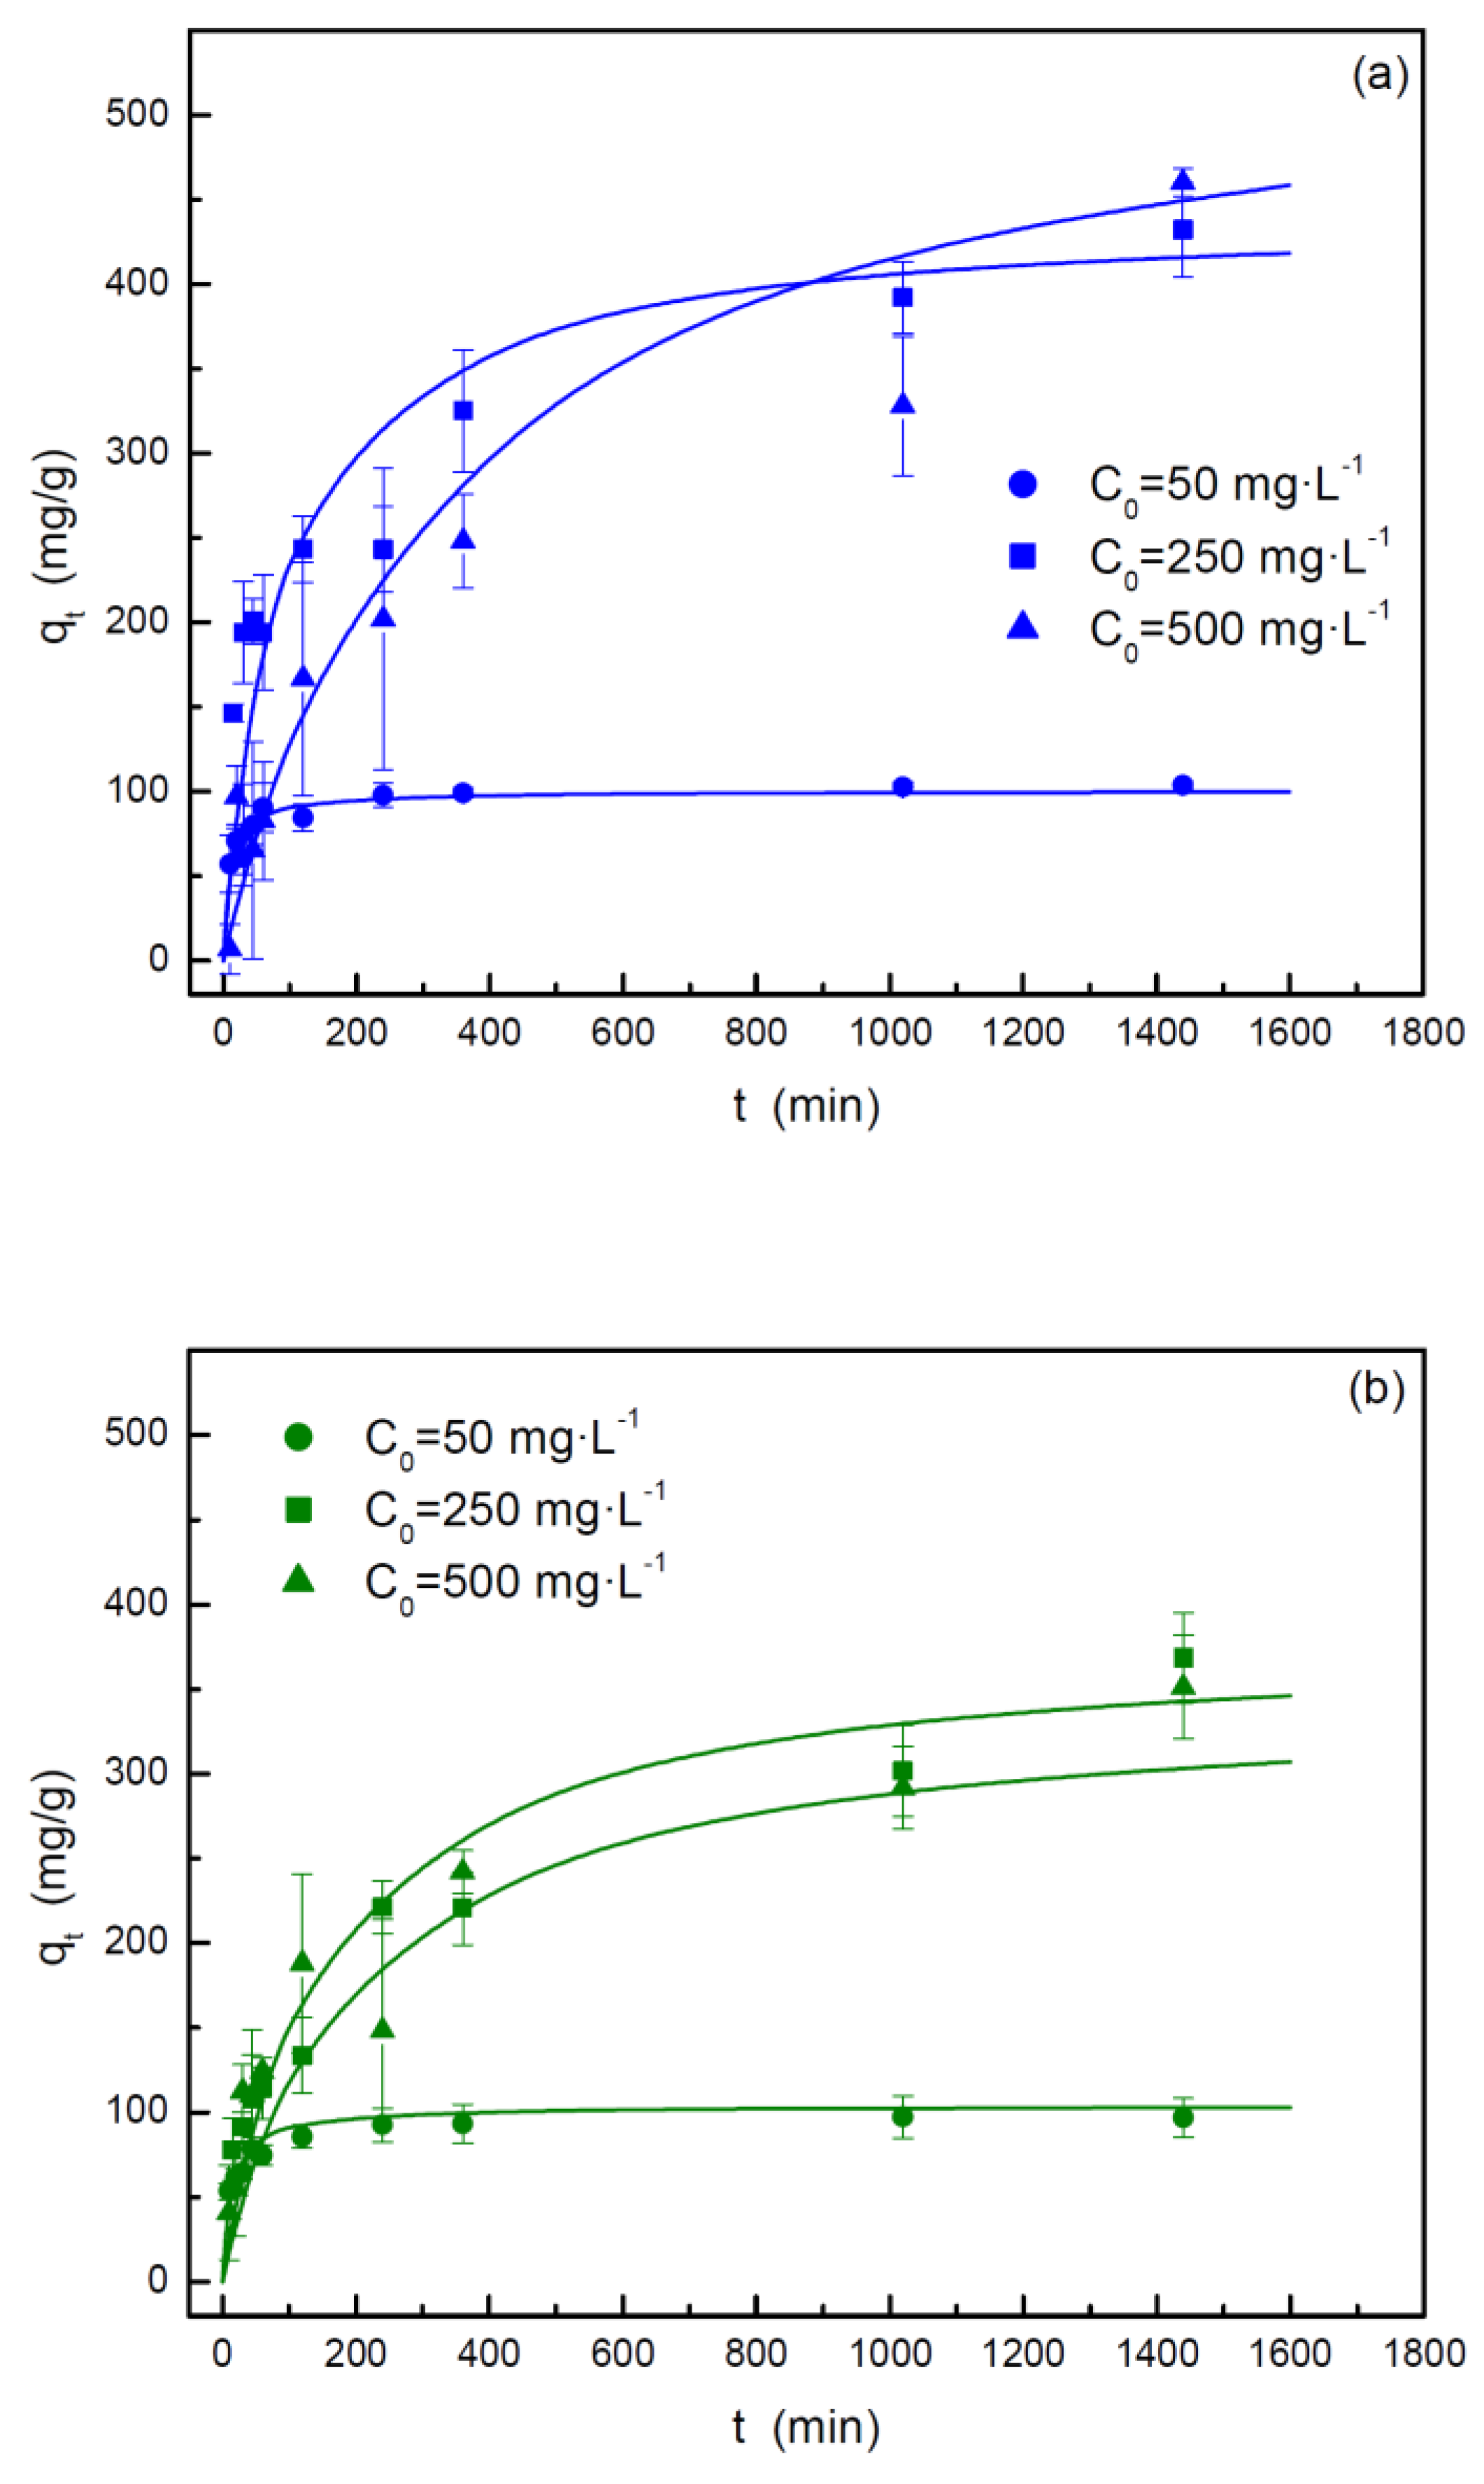
Figure 9.
Experimental data and adsorption isotherm models corresponding to (a) MB and (b) MG adsorption by almond shell activated carbon at 25 ºC, natural pH and an adsorbent dosage of 0.5 g·L-1.
Figure 9.
Experimental data and adsorption isotherm models corresponding to (a) MB and (b) MG adsorption by almond shell activated carbon at 25 ºC, natural pH and an adsorbent dosage of 0.5 g·L-1.
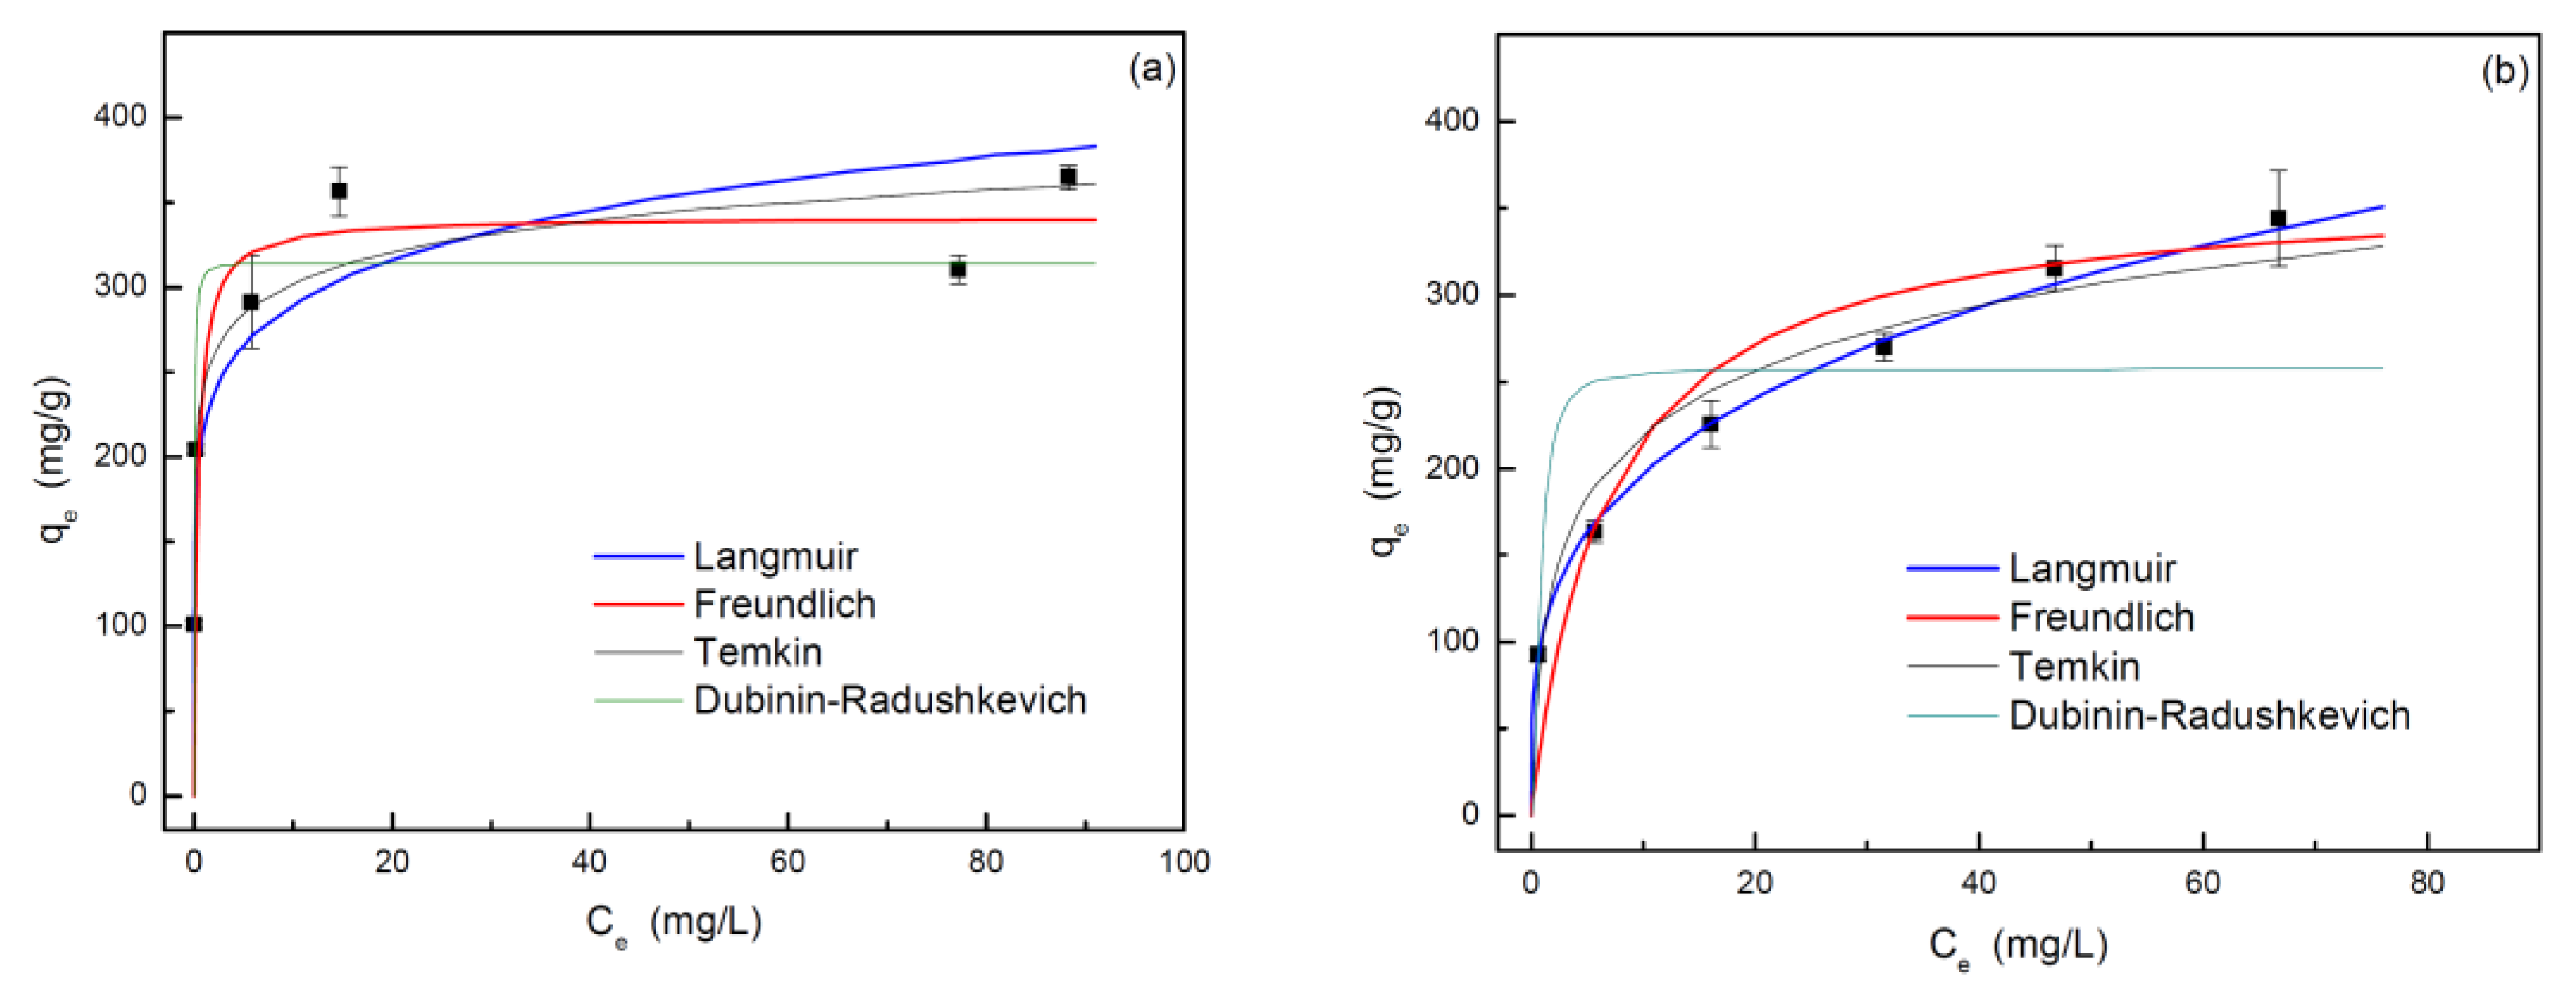
Figure 10.
Simulated breakthrough curves for MB adsorption by activated carbons: Black curves, coconut shell precursor [32]. Red curves, almond shell precursor, present work. Continuous line: 50 mg·L-1, initial dye concentration. Dashed line: 200 mg·L-1, initial dye concentration. Flow rate, QL = 0.01 mL·min-1. Mass of carbon, mb = 12.1 g.
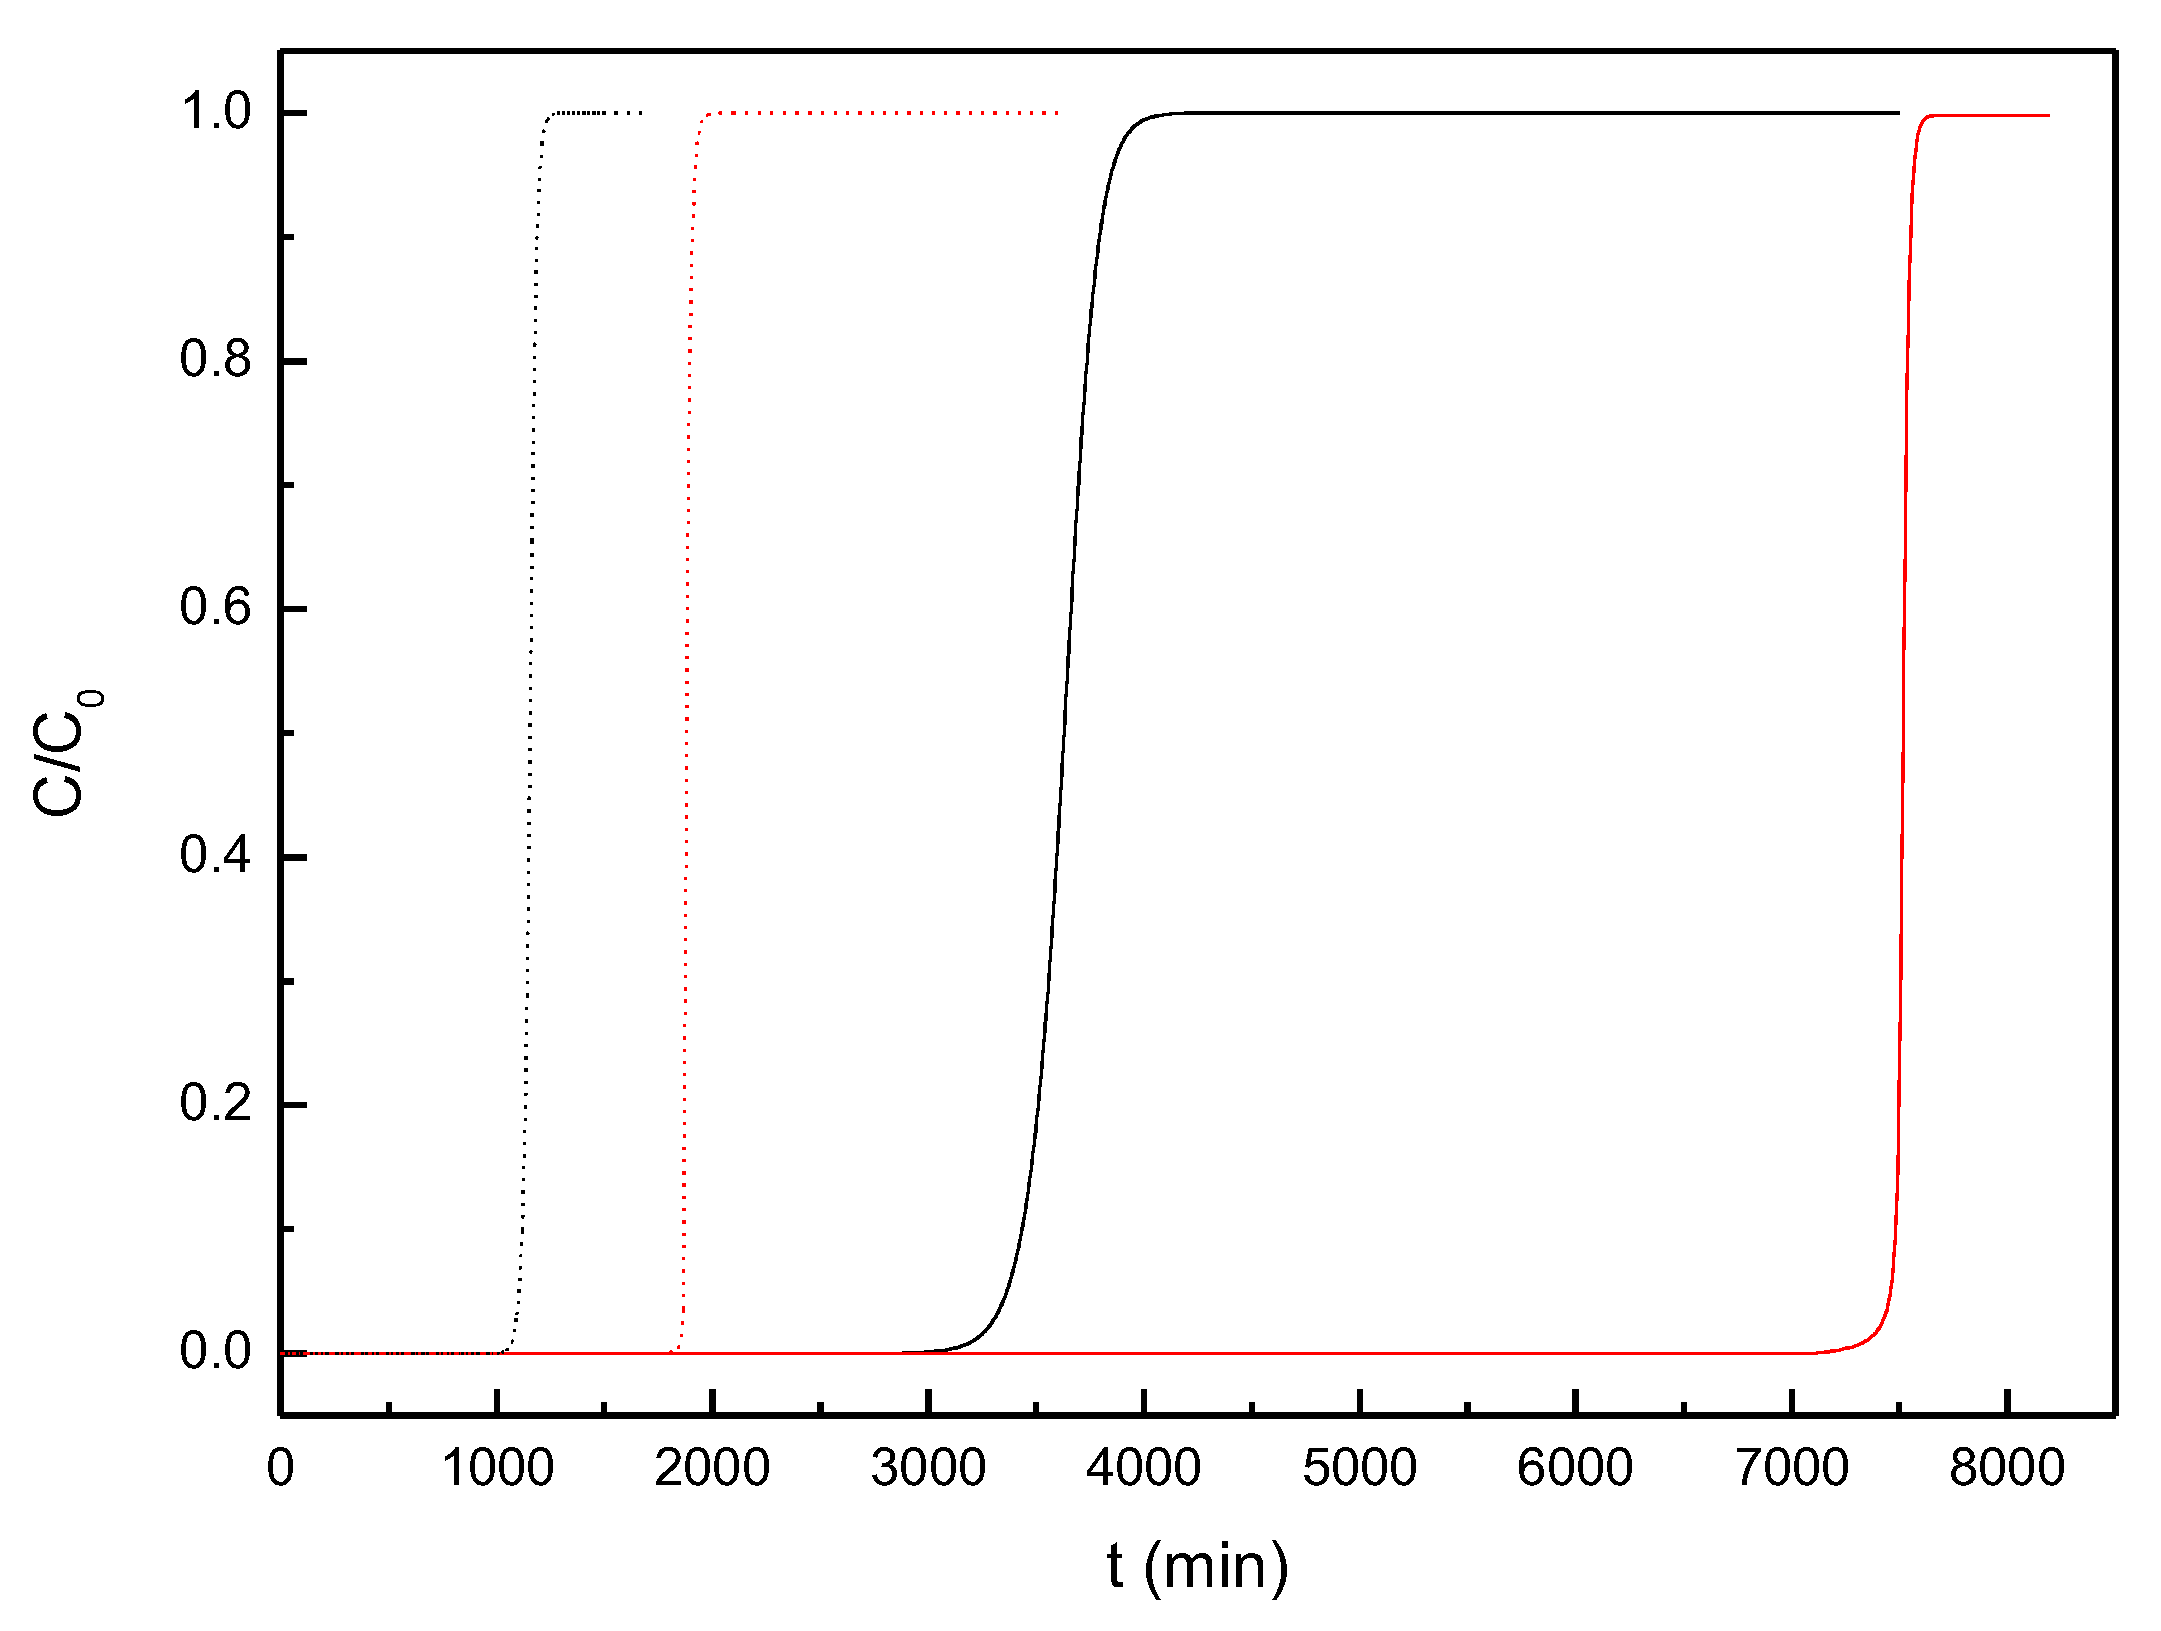
Figure 11.
Breakthrough curves simulation for MB and MG adsorption. Blue lines, MB, Green lines, MG. Continuous line: 50 mg·L-1. Dashed line: 200 mg·L-1. QL = 0.01 mL·min-1, mb = 12.1 g, Db = 2.4 cm.
Figure 11.
Breakthrough curves simulation for MB and MG adsorption. Blue lines, MB, Green lines, MG. Continuous line: 50 mg·L-1. Dashed line: 200 mg·L-1. QL = 0.01 mL·min-1, mb = 12.1 g, Db = 2.4 cm.
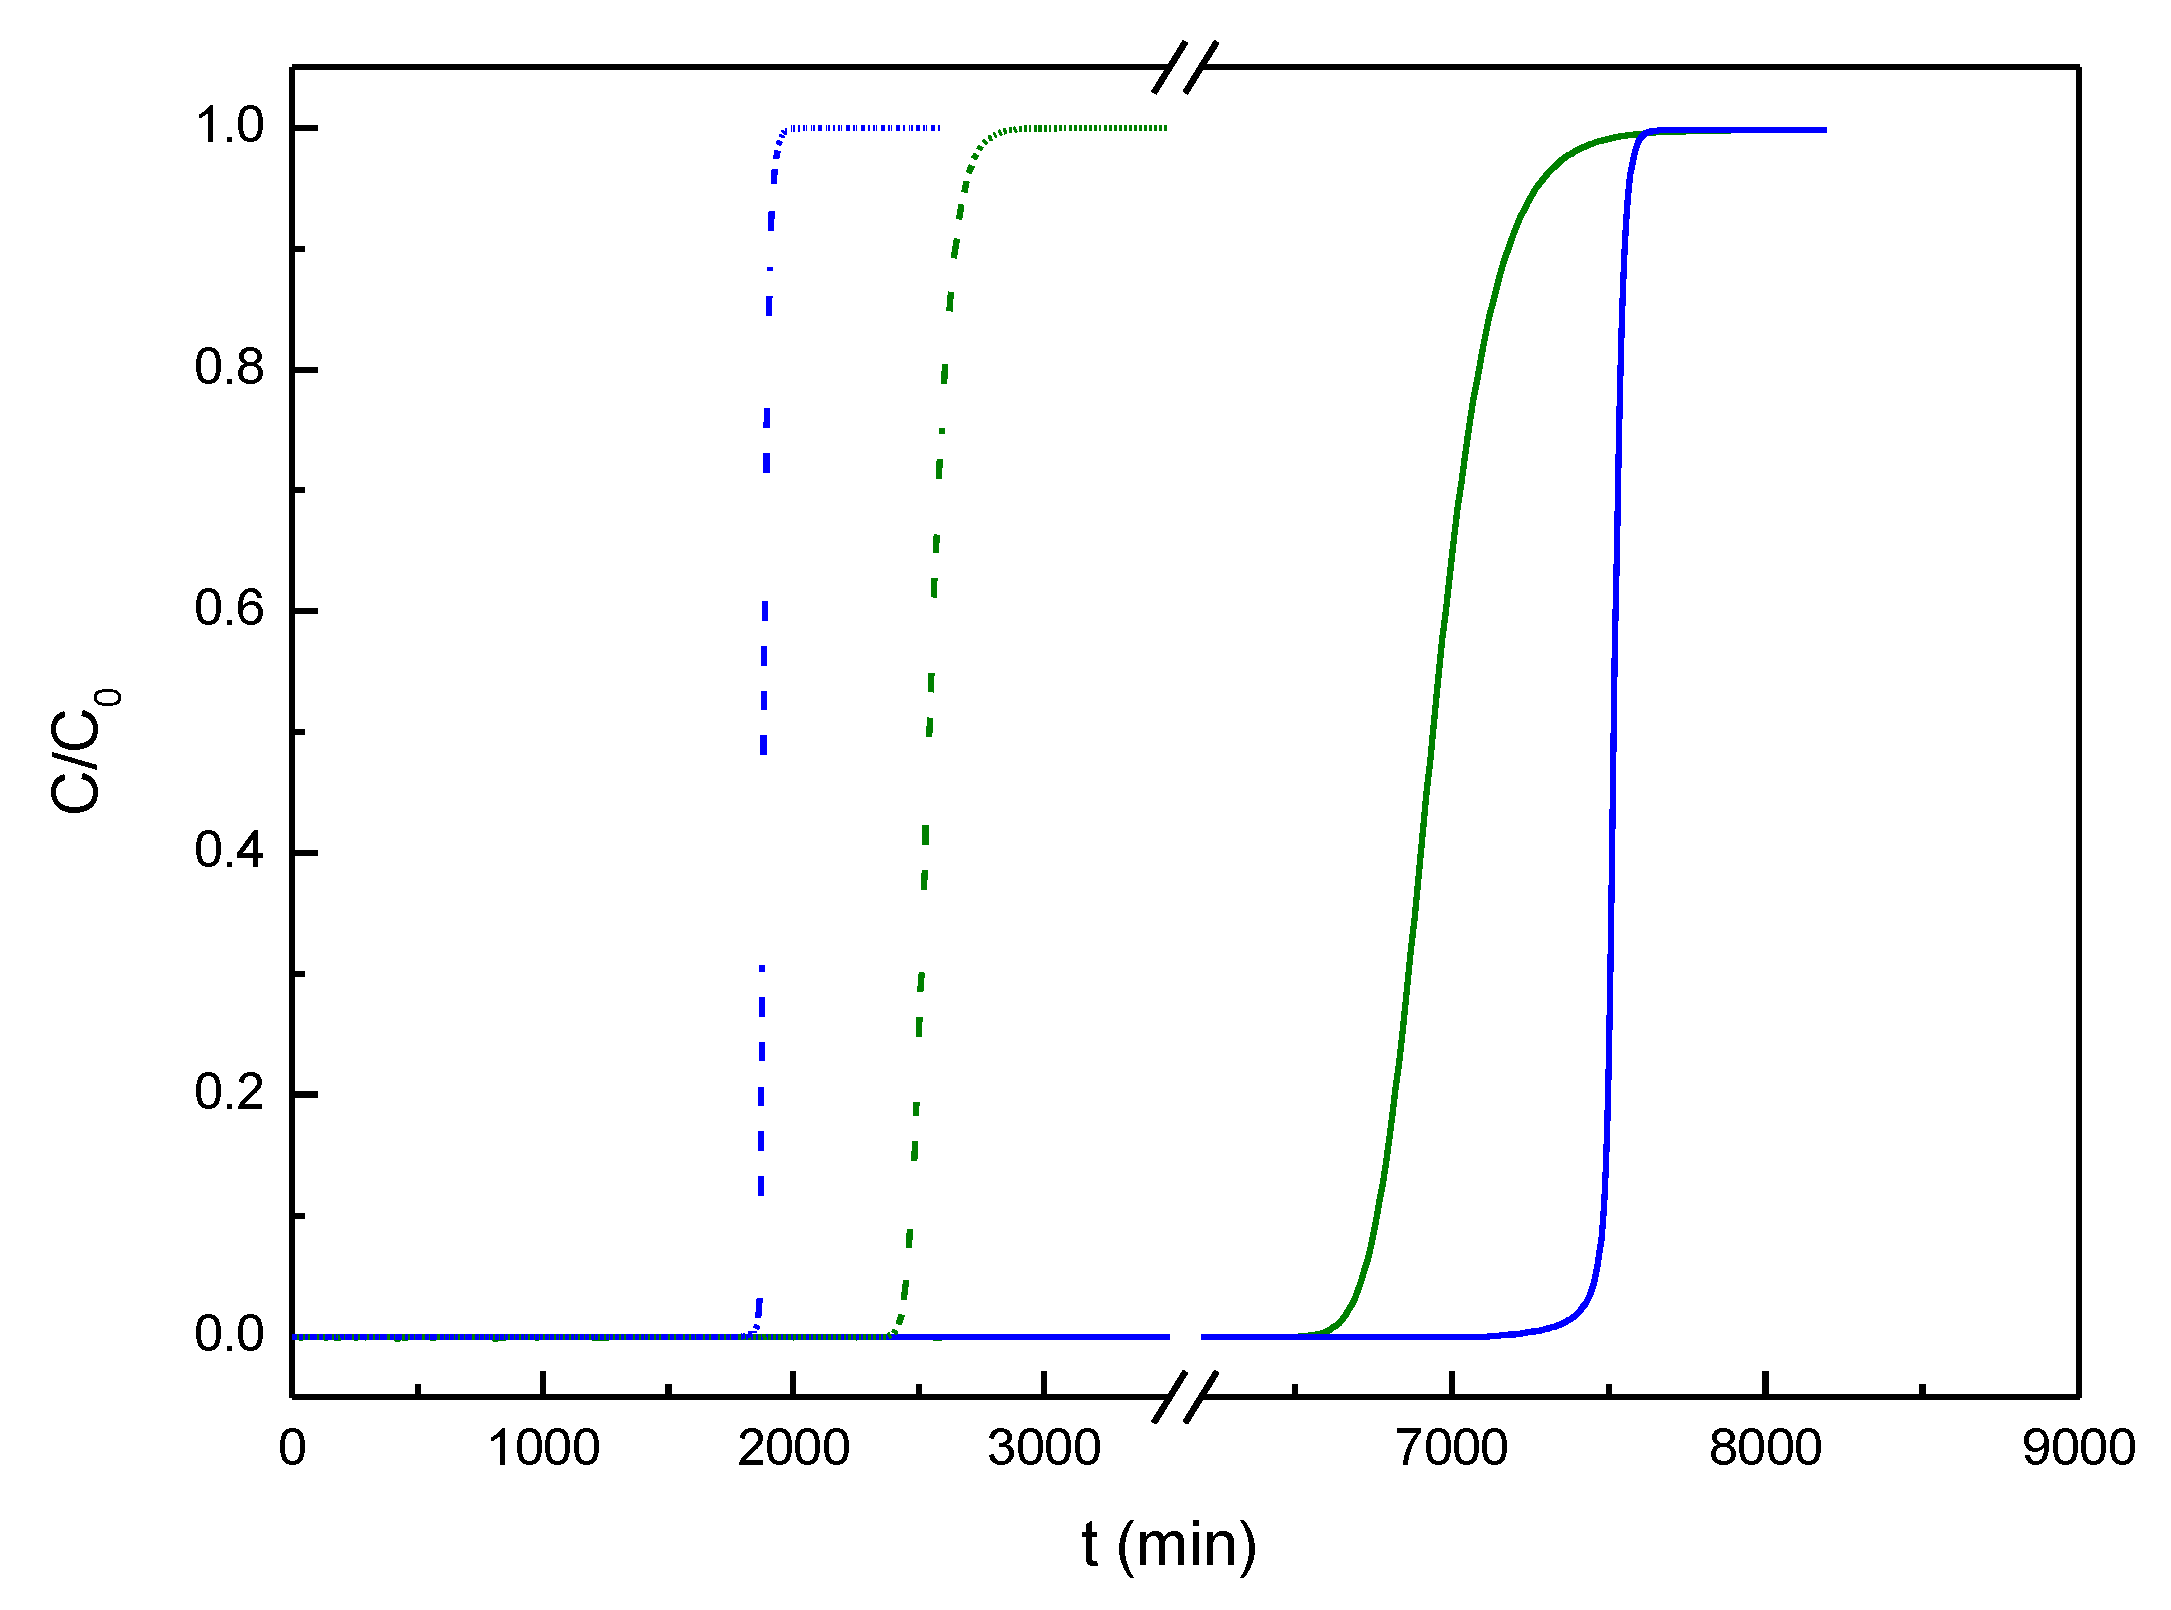
Table 1.
Porous structure characteristics of almond shell carbons.
| Parameter | Non-activated carbon | Activated carbon |
|---|---|---|
| Surface area (m2/g) N2 at 77 K (BET) | 294±7 | 1577±13 |
| Average pore size (Å) N2 at 77 K (BET) | 21.8 | 17.7 |
| Surface area (m2/g) CO2 at 273 K (BET) | 268±1 | 772±12 |
| Total pore volume (cm3/g) at P/Po = 0.99 | 0.161 | 0.697 |
| Microporosity (%) | 92.7 | 78.2 |
Disclaimer/Publisher’s Note: The statements, opinions and data contained in all publications are solely those of the individual author(s) and contributor(s) and not of MDPI and/or the editor(s). MDPI and/or the editor(s) disclaim responsibility for any injury to people or property resulting from any ideas, methods, instructions or products referred to in the content. |
© 2024 by the authors. Licensee MDPI, Basel, Switzerland. This article is an open access article distributed under the terms and conditions of the Creative Commons Attribution (CC BY) license (https://creativecommons.org/licenses/by/4.0/).
Copyright: This open access article is published under a Creative Commons CC BY 4.0 license, which permit the free download, distribution, and reuse, provided that the author and preprint are cited in any reuse.


