
Submitted:
14 April 2025
Posted:
15 April 2025
You are already at the latest version
Abstract
Organic dyes are pollutants that threaten aquatic life and human health. These dyes are used in various industries; therefore, recent research focuses on the problem of their removal from wastewater. This aim of this study is to examine the clay/Gum Arabic nanocomposite (CG/NC) as an adsorbent to adsorb methylene blue (MB) and crystal violet (CV) dyes from synthetic wastewater. The CG/NC was characterized using Fourier Transform Infrared spectroscopy (FTIR), X-ray diffraction (XRD), Scanning Electron Microscopy (SEM), and Brunaure-Emmett-Teller (BET). The effect of parameters that may influence the efficiency of removing MB and CV dyes was studied: (dosage of CG/NC, contact time, pH values, initial concentration, and temperature), and the optimal conditions for removal were determined. Furthermore, an Artificial Neural Network (ANN) model was adopted in this study. The results designated that the adsorption behavior adhered to the Langmuir model and conformed to pseudo-second-order kinetics. The results also indicated that the removal efficiency reached 99%, and qmax reached 66.7 mg/g and 52.9 mg/g for MB and CV, respectively. Results also proved that CG/NC can be reused up to four times with high efficiency. The ANN models have proven effective in predicting the process of the removal, with the low Mean Square Error (MSE = 1.824 and 1.001) and high Correlation Coefficient (R2 = 0.945 and 0.952) for the MB and CV dyes, respectively.
Keywords:
Methylene blue
; Crystal violet
; Adsorption
; Clay
; Gum Arabic
; ANN
1. Introduction
Water and wastewater treatment remain a major global challenge, particularly due to the presence of harmful organic dyes in industrial effluents. These dyes, widely used in industries like textiles, printing, and plastics, contribute to water pollution, with 10–15% entering wastewater. Their release into water bodies blocks light, causes eutrophication, and poses serious health risks, including cancer and heart problems, as many dyes are non-biodegradable [1,2].
Various low-cost and natural adsorbents have been explored for removing methylene blue (MB) from wastewater. Materials like bamboo [3], activated carbon [4], NiO/ZnO nanocomposites [5], wheat shells [6], biochar [7], and sugarcane [8] have shown promising MB removal efficiency, often following Langmuir isotherm and pseudo-second-order kinetic models. Some adsorbents, like biochar from municipal waste, need improved capacity to compete with more efficient alternatives. Clay-based adsorbents also showed strong performance [9], with high adsorption capacities and spontaneous nature, and often endothermic behavior. Magnetic nanocomposites (e.g., Fe₃O₄, chitosan-based, gum Arabic-coated, and polyaniline-ferrite composites) [10,11,12] offer advantages in ease of separation and regeneration, although reusability sometimes reduces efficiency. Overall, many materials offer effective, low-cost alternatives to commercial adsorbents, though performance varies based on conditions like pH, temperature, and contact time.
Many previous studies have been reported that used different adsorbents to remove crystal violet (CV) dye from aqueous solutions. The powder of banana peels was utilized to decontaminate synthetic wastewater from CV. Results show that the adsorption process adheres to the pseudo-first-order and the Langmuir models. The removal efficiency reached only 93% [13]. Rice straw underwent thermochemical modification with citric acid to adsorb CV dye from water. The adsorption phenomenon was determined as both spontaneous and exothermic. The data fit a Langmuir isotherm and pseudo-second-order models [14]. Spent pepper seed powder (SSP) was used as a biosorbent to remove CV from wastewater. The adsorption process was characterized as spontaneous, physical, and endothermic. SSP was not reproduced and used for removal due to the cost of reproduction [15]. In another study, sawdust was used to adsorb CV from aqueous solutions. It wasobserved that solution pH was inversely proportional to the adsorption efficiency, and the process is exothermic [16]. Almond shell (AS) was also used to adsorb CV dye from aqueous solutions. The removal percentage was found to be only 83% [17]. In another study, NaOH-activated Aerva javanica leaf (NAJL) was examined as an adsorbent to remove CV dye from aqueous solutions. Although NAJL achieved maximum adsorption at 315.2mg/g, it has not demonstrated good effectiveness when regenerated and reused [18]. Male flowers from the coconut tree were employed to activate carbon through the utilization of phosphoric and sulfuric acids (PAAC and SAAC, respectively). This activation process facilitated the adsorption of CV dye from aqueous solutions. The adsorption capacity of (PAAC) reached 60.4 mg/g, while (SAAC) reached 85.8 mg/g. However, the use of acids poses risks to both human health and the environment. [19]. Coniferous pinus bark powder was used to remove CV dye. The maximum dye removal was about 8.9 mg/g, and the adsorption kinetics followed the pseudo-second-order. It is noted that the maximum adsorption capacity is low compared to that reported in other literature [20]. Bamboo chips modified with sodium carbonate showed spontaneous and endothermic adsorption with a capacity of 20.84 mg/g [21]. Activated carbon fibers achieved 91.2% removal in 20 minutes, though reuse was not evaluated [22]. A magnetite nanoparticle was used to remove CV from aqueous solutions with 20.9 mg/g capacity, but efficiency dropped to 63% after reuse [23]. Most of the previous studies lacked reuse evaluations, ANN modeling, or required longer contact time.
Due to the cost and time consumption of experimental testing, adsorption processes are not always available for all operating conditions. Artificial intelligence can provide a powerful method to predict adsorption efficiency, such as using an artificial neural network (ANN) model [24].
Numerous studies have applied Artificial Neural Networks (ANNs) to predict dye removal efficiency from aqueous solutions using various adsorbents. ANN models typically consist of input, hidden, and output layers, trained using algorithms like back-propagation or Levenberg-Marquardt, and are built using software such as, PYTHON, MAPPLE, MATLAB or JMP [25].
Different adsorbents, including natural materials, industrial by-products, and nanocomposites have shown high dye removal efficiency using ANN model, often exceeding R2 = 0.95 and achieving low MSE/RMSE values, indicating strong predictive accuracy [26]. ANN inputs generally include parameters like pH, dye concentration, contact time, temperature, and adsorbent dosage. The majority of models demonstrated high accuracy in predicting the removal efficacy across different types of dyes. (e.g., CV, MB, eosin, malachite green, methyl violet, methyl orange, and Congo red), demonstrating the flexibility and reliability of ANN in adsorption studies. Despite variations in data size and architecture (e.g., number of neurons and layers), the ANN approach consistently produced strong fits between predicted and experimental data, making it a valuable tool for modeling and optimizing dye adsorption processes [27].
Based on the preceding discussion, a clear literature gap exists, as many studies report issues like long adsorption times, low capacities, high material costs, and limited testing of environmental impact, reusability, and high-temperature performance. Additionally, ANN modeling is often missing. Addressing these gaps can lead to more efficient and eco-friendly adsorption methods. This research introduces a novel, eco-friendly clay/gum Arabic nanocomposite for removing MB and CV dyes, materials not previously used for this purpose. It also applies ANN modeling to predict and optimize removal efficiency. This study aims to synthesize and characterize a Gum Arabic/Clay nanocomposite, evaluate its dye adsorption performance, analyze isotherm, kinetic, and thermodynamic behavior, and develop an ANN model to predict adsorption efficiency.
2. Materials and Methods
Gum Arabic was obtained from Nature Gums (UK), all other chemicals were purchased from Sigma-Aldrich, and the clay was collected from Abha City, South of Saudia Arabia.
2.1. Synthesis of Clay/Gum Arabic Nanocomposite
25.0 grams of Gum Arabic powder were combined with 50.0 ml of 99% pure ethanol. The mixture was allowed to sit overnight at 25.0 °C. To prepare the nanocomposite, 16.1 g of the ground clay was weighed and soaked in a flask containing 50 ml of ethanolic Gum Arabic solution. The mixture was stirred at approximately 25o C for 24 hours, then filtered to separate the solid contents. The solid contents were dried in an oven at about 105.0 °C for 3 hours [28].
2.2. Batch Adsorption Experiments
In these experiments, varying concentrations of MB or CV solutions were placed in glass bottles, and then the desired amount of nanocomposite material was added to each bottle. The blend was stirred using a thermostated water-bath shaker. Different factors, including the amount of adsorbent used, the duration of contact, the initial concentration, temperature, and pH, were examined to understand their impacts. Each parameter was studied individually while keeping the other parameters constant. The adsorbed amount was calculated via Equation (1): [29]
where qe (mg/g) is the dye uptake capacity, co and ce (mg/L) are the initial and equilibrium concentrations of MB or CV, V is the volume of MB or CV solutions (L), M is the CG/NC mass (g).
The removal efficacy was determined via Equation (2): [29]
The distribution coefficient (Kd) of the dyes between the solid and aqueous phases is calculated using Equation (3): [29]
2.3. Kinetic studies
Kinetic investigations were performed to analyze the adsorption behavior. The pseudo-first-order model is given in Equation (4): [29]
where k1 is the adsorption rate constant and t is the time.
The pseudo-second-order determined using Equation (5): [30]
where is pseudo-second-order rate constant.
Intra-particle diffusion presented in Equation (6): [30]
signifies the diffusion rate constant (mg/g.min), while I is a constant indicating the width of the boundary layer (mg/g).
Elovich model is presented in Equation (7):[30]
where and are Elovich constants and t is the time (min).
2.4. Adsorption Isotherm Models
Adsorption of MB or CV onto the surface of the CG/NC was studied by various adsorption isotherm models, viz. Langmuir, Freundlich, and Temkin using Equations (8-10), respectively.
where, qmax represents the maximum uptake capacity of CG/NC (mg/g), while kL is the Langmuir constant, kf represents the adsorption capacity of the sorbent, while the n value determines the extent of non-linearity between the concentration of the solution and the adsorption process, A and B are Temkin isotherm constants which were calculated from the intercept and slope of equation (10).
2.5. Artificial Neural Networks (ANN)
A handmade algorithm was used to train the model based on Gradient Descent (CG) or Monte Carlo Simulation methods. The algorithm is suitable when its ability to accomplish the lowest value of the Mean square Error (MSE) and the highest value of Correlation Coefficient (R2) by using the equations (1 and 2) and when the experimental data conform with ANN predicted data. The model was built on the Maple 6 Software. The model consists of three layers (i) input layer which contains five neurons for five parameters: (initial concentration, dosage, pH, contact time, and temperature) for both dyes. (ii) the hidden layer contains one layer with nine neurons used for MB and eleven neurons for CV. (iii) the output layer that contains one neuron for the removal efficiency of the two dyes. A representative drawing of the model's parts is shown in Figure 1.
2.6. Reusability of CG/NC
To reactivate the CG/NC, it was put in deionized water. The blend was continuously shaken at about 25o C for a duration of 30 minutes. Afterward, the mixture was filtered, and the CG/NC was subsequently dried at 105°C for 3 hours [31].
2.7. Zeta Potential (ZP)
To evaluate the surface charge and zero-point values of adsorbent, 25 ml of deionized water in eleven bottles was mixed with 0.20 g of the nanocomposite and stirred for ten minutes. To modify the mixture pH, NaOH or HCl solutions were used to adjust the pH within the range of 2.0 to 11.0. Then, the conductivity of each bottle was measured using a 4510 Conductivity-meter immediately and after 24 hours [32].
2.8. Instrumentation
The MB and CV concentrations were measured before and after adsorption using Shimadzu UV/visible spectrophotometer (Shimadzu UV-1650). An attenuated total reflectance (ATR) spectroscopy instrument (Agilent Model Cary 630) was utilized to identify the functional groups present in the samples. Spectra were recorded by the instrument within the range of 4000 cm-1 to 350 cm-1. A Shimadzu 6000 DX instrument diffractometer was used to investigate the prepared samples’ degree of crystallinity and morphological structure, where it was equipped with a graphite monochromator (CuKα, λ = 0.1541 nm). The technique measures the angles of diffraction and their intensities with a scan range of 2θ = 5-80 ° with steps of 0.02 °. The SEM instrument used for this study was a JEOL JSM-7600f. Additionally, the SEM device was equipped with Energy-Dispersive X-ray (EDX) capabilities to determine the elemental ratio and quantify the amounts of elements present in the nanocomposite. The surface area (in m2/g) and pore size of the samples were evaluated using Quantachrome Nova A4200E, at a temperature of 77K.
3. Results and Discussion
3.1. Characterization
3.1.1. Fourier Transform Infrared Spectroscopy (FTIR)
The functional groups of the clay, Gum Arabic, CG/NC, CG/NC after asorbed MB adsorption, and CG/NC after CV adsorption were identified by FTIR (Figure 2). The bands, around 3686 cm⁻¹ and 3611 cm⁻¹, suggest O-H stretching vibrations, indicating the presence of inner and outer structural hydroxyl groups or water molecules [33].
The band at 1632 cm⁻¹ can be attributed to H-O-H bending of absorbed water or bending vibrations of O-H groups in minerals within the clay structure. There are complex bands between 1400 cm⁻¹ and 400 cm⁻¹ in the fingerprint region due to overlapping vibrations [97]. In clays, Si-O stretching vibrations appeared at 1103 cm⁻¹ for silicate minerals [34]. Al-OH bending vibrations can occur at 987 cm⁻¹. The peaks at the range from 700-800 cm⁻¹ revealed to the deformation of Al-Al-OH and Mg-Al-OH, which indicate of mixed-layer clays [98]. Si-O-Si and Si-O-Al bending vibrations are often observed around 641 cm⁻¹ and 521 cm⁻¹ in clays with aluminosilicate structures [34,35]. The broad peak at 3317 cm-1 belongs to O-H stretching vibrations in Gum Arabic [36]. The peak at 1591 cm-1 can belong to the carbonyl group C=O [37]. The spectrum of CG/NC shows peaks at 3611 cm-1 and 3309 cm-1 for the hydroxyl group and O-H stretching vibrations. The aliphatic C-H stretching vibrations in Gum Arabic presented at 2903 cm-1. The peak at 1606 cm-1 for C=O stretching vibrations in Gum Arabic [33]. The spectrum also contains bending vibrations. The 900-800 cm-1 peaks were attributed to Si-O and Al-OH [35]. The spectrum of CG/NC after adsorbed MB dye, showed a slight shift of some bands compared with the bands in the CG/NC spectrum, this suggested that the functional groups of CG/NC played a role in the adsorption of the MB dye [38]. The peak at 991 cm-1 for C-N stretching vibrations in MB dye [39]. It is noted that the peaks of the spectrum of CG/NC after adsorbed CV dye have disappeared, some positions have been shifted, and their intensity has decreased e.g. the peak at 3309 cm-1. This could be ascribed to the formation of hydrogen bonds between the CG/NC and the dye or the presence of water molecules [40].
3.1.2. Scanning Electron Microscopy (SEM-EDX)
SEM analysis images of the CG/NC after and before the adsorption of MB and CV are displayed in Figure 3.
Prior to adsorption, the surface exhibited fine particles ranging from 200 to 380 nm in size (Figure 3A1). After adsorption, the surface appeared noticeably rougher with visible spots and surface scars, ascribed to the gathering of dye molecules on the CG/NC surface (evident in Figure 3(B1) for MB and Figure 3(C1) for CV [31].
EDX analysis confirmed the existence of elements like O, C, Si, and Al in the CG nanocomposite, with corresponding weight percentages listed in the inset table of Figure 2(A2). Following dye adsorption, the carbonation content increased from 12.29% to 26.08% for MB and 27.02% for CV, as observed in Figure 3(B2) and Figure 3(C2). These increases provide further evidence that adsorption happened primarily on the CG/NC surface [41,42].
3.1.3. Brunauer-Emmett-Teller (BET) Analysis
The pore size, surface area, and pore size for Clay, Gum Arabic, and CG/NC are listed in Table 1. It is obvious that all the compositional properties improved upon the formation of the CG/NC, particularly the surface area.
It is obvious that all the compositional properties improved upon the formation of the CG/NC, particularly the surface area.
3.1.4. X-Ray Powder Diffraction (XRD)
XRD was adopted to determine the crystallinity and identify the main minerals present in the samples.
Figure 4 shows pattern displayed the distinguishing peaks of the clay at 6°, 9°, 25°, 27°, and 28° 2θ that are related to montmorillonite (001), illite (001), kaolinite (001), quartz (101), and Muscovite (001), respectively [43]. XRD analysis indicated the Gum Arabic to be amorphous in nature, due to the absence of peaks in the diffraction pattern [44]. The formation of CG/NC led to the disappearance of some peaks and their intensities decreased due to the interaction between the Gum Arabic molecules and minerals in the clay. However, the presence of an amorphous peak next to some crystalline peaks provides further evidence of the formation of the compound [44,45].
To get the crystal size of the sample’s crystals, the Scherrer equation was used {Equation 11). The average crystal structure sizes of the clay and CG/NC were found to be 39.70, and 27.75 nm, respectively.
where D is the diameter of the crystallites (nm), β is half-peak width (FWHM) in radians, K is Scherer constant (0.9), λ is x-ray wavelength, and θ is the diffraction angle. The obtained findings conform to the previously reported results [46].
D = kλ / β cos θ.
3.2. Artificial Neural Network (ANN)
The model was built to predict the removal efficacy of MB and CV dyes from aqueous solutions using handmade algorithm based on the Gradient Descent (GD) and Monte Carlo Simulation methods based on experimentally collected data. The experimental data used in the prediction process for MB and CV are listed in Tables 1(S)-2(S). The predicted results were close to the experimental results, which proved its effectiveness in prediction. Its efficiency was also mathematically verified by finding the values (MSE= 1.824 and R2= 0.945) and (MSE= 1.001 and R2= 0.952) for the MB and CV, respectively.
3.3. Adsorption Studies
3.3.1. Effect of Dosage of CG/MC
The effect of CG/NC dosage on the removal efficiency of MB and CV dyes from aqueous solutions was examined, with dosages ranging from 0.10 g to 1.10 g. All other parameters were held constant (initial concentration: 50 mg/L; pH: 7.00; contact time: 30 minutes; temperature: 25.00°C). Figure 5 presents both the experimental and predicted ANN results. For MB dye (Figure 5-A), increasing the CG/MC dose from 0.10 g to 0.20 g raised the removal efficiency gradually to 99.4%. Further increases in dosage showed no significant improvement in MB removal. For CV dye (Figure 5B), the removal efficacy increased from 88.6% to 95.4% as the dose rose from 0.10 g to 1.10 g, eventually reaching equilibrium. This trend is likely due to the increase in available active sites with higher adsorbent doses [31]. To maximize efficiency while minimizing adsorbent use, optimal CG/MC dosages of 0.20 g for MB and 0.30 g for CV were selected for the next experiments. The close agreement between experimental and ANN-predicted data confirms the model’s effectiveness in predicting dye removal efficiency.
3.3.2. Effect of pH
The change in pH is a significant factor that affect the accumulation of dyes on the adsorbent surface. In this study, CG/NC was evaluated for removing MB and CV dyes in a pH range of 2.0-11.0 with the rest of the parameters fixed at (initial concentration 50 mg/L; dose of CG/NC 0.20g for MB and 0.30g for CV; contact time 30 min; temperature 25.0oC). Figure 6 shows the experimental data and ANN predicted for the removal efficacy of MB and CV dyes. It is obvious that the dyes were removed efficiently in the entire pH range (Figure 6). This could be due to no repulsion between the neutral CG/NC surface and the cationic MB and CV dyes [31]. The normal pH value of the solution of 7.0 was used for the rest of the adsorption experiments for both dyes. The relative closeness between the experimental data and the predicted ANN demonstrates the success of the ANN models in predicting the removal efficiency of MB and CV dyes.
3.3.3. Zeta Potential
Zeta potential plays a key role in adsorption by influencing electrostatic interactions, adsorption rates, and competitive adsorption between species. Figure 7 shows that the GG/NC surface remains electrically neutral across different pH levels, as confirmed by consistent conductivity measurements. This neutrality explains why pH variations do not affect dye removal efficiency, due to the absence of electrostatic connections between the neutral surface and cationic dyes.
3.3.4. Effect of Contact Time
The impact of contact time was examined over a range of 10 sec to 32 min, with other parameters held constant Figure 1S compares the experimental data with ANN predictions. Rapid adsorption of MB occurred within the initial minutes (Figure 1S-A), likely because of the availability of empty active sites on the CG/NC surface. After 18 minutes, the removal rate slightly declined, possibly because the adsorption sites were saturated. For CV dye (Figure 1S-B), 96.1% removal was achieved within two minutes, followed by equilibrium. This performance can be explained by the dye molecules occupying most of the active sites. The sorbent demonstrated a faster removal rate than previously reported materials, confirming its high efficiency [31]. Optimal contact times of 8 minutes for MB and 4 minutes for CV were selected for further studies. The close match between experimental and ANN-predicted data highlights the trustworthiness of the ANN models in estimating dye removal efficacy.
3.3.5. Effect of Initial Concentration
The effect of varying the initial concentrations of the dyes from 50 mg/L to 500 mg/L was examined, with all other parameters held constant. Figure 2S illustrates the comparison between experimental data and predictions from the ANN models. The CG/NC demonstrated a high removal speed of MB dye at an initial concentration of 50 mg/L, achieving up to 99% removal (Figure 2S-A); however, as the initial concentration of MB increased, a slight decline in removal efficacy was observed. This decrease might be ascribed to the limited accessibility of active sites on the adsorbent and the intensified competition among MB molecules for these sites [9]. Conversely, the removal efficiency for CV dye slightly increased with higher initial concentrations of the CV solution (Figure 2S-B), possibly due to an enhanced driving force for molecular transfer [14]. An initial concentration of 50 mg/L was identified as optimal for conducting the adsorption experiments. The ANN models effectively predicted the removal efficiencies for both dyes, showing a strong correlation between the predicted and experimental data.
3.3.6. Effect of Temperature
The impact of temperature on the adsorption efficiency of MB and CV dyes was investigated across a range from 25.0°C to 55.0°C, while maintaining all other variables constant (Figure 3S). For MB, an increase in removal efficiency was noted as the temperature rose, likely due to enhanced molecular collisions. Conversely, the efficiency of CV dye slightly decreased, potentially due to weaker interactions with the adsorbent. Room temperature (25.0°C) was selected for subsequent experiments since temperature variations had a minimal effect. The experimental results aligned well with the predictions from artificial neural network (ANN) models, further validating the model's accuracy.
3.3.7. Optimizing the ANN Model
To assess how well the ANN model could predict outcomes and to improve its reliability, an optimization algorithm was applied to estimate the removal efficiency of CG/NC under conditions that hadn’t been tested in the lab. These predictions (Table 2) were then verified through follow-up laboratory experiments, which confirmed the model’s accuracy.
3.3.7. Thermodynamic Factors
The thermodynamic factors {enthalpy change (∆H°), Gibbs free energy change (∆G°), and entropy change (∆S°)} are utilized to examine the nature of adsorption. Figure 8 shows a straight-line plot of ln KD versus 1/T for the adsorption of MB and CV dyes onto the CG/NC. The ∆H° and ∆S° values are calculated using the slope and intercept of equation (13), and ∆G° is calculated from Equation (12) [24].
where R represents the gas constant (8.314 J/k·mol) and T(K) denotes the temperature
The positive value of ∆H° designates that the adsorption of MB dye is endothermic, whereas a negative ∆H° suggests that the adsorption of CV dye is exothermic. The positive ∆S° values for both dyes signify increased randomness within the adsorption system. The free energy change, ∆G°, for the adsorption of MB and CV on CG/NC was found to range from -3.991 to -5.631 kJ/mol for MB and -2.288 to -2.150 kJ/mol for CV, respectively. The negative values of ∆G° designate the spontaneous and physical nature of the adsorption process for both dyes. These results are consistent with previous reports, with reference [24,31]. The values of ∆G°, ∆S°, and ∆H° are detailed in Table 3.
3.3.8. Adsorption Isotherm Models
Isotherm models describe the interactions between adsorbate and the adsorption sites [19]. In this work, several models were employed: Langmuir, Freundlich, and Temkin.
Langmuir Isotherm Model
The Langmuir model for MB and CV molecules on the CG/NC is depicted in Figure 4S. The mathematical expression for the Langmuir model is provided in Equation (4). Both dye adsorption systems follow the Langmuir model; this is evidenced by the high correlation coefficients (R2), demonstrating that the adsorption forms a monolayer on the adsorbent surface [24,30,31]. The maximum uptake capacities (qmax) obtained were 66.7 mg/g for MB and 52.9 mg/g for CV. The adsorption nature is deemed favorable based on the separation factor (RL) calculated from Equation (4), which assesses the type of interaction between the dyes and CG/NC. RL values show that the adsorption is unfavorable (RL > 1), linear (RL = 1), or favorable (0 < RL < 1), with both dyes showing favorable adsorption [93]. The R2, qmax, and KL values for MB and CV are summarized in Table 4.
3.4.2. Freundlich Isotherm Model
The Freundlich isotherm model was applied and is illustrated in Figure 5S. The correlation coefficient (R2) for MB proposes that adsorption happens on a heterogeneous surface, as depicted in Figure 5S-A. The intercept and slope of the linear relationship were used to determine the values of Kf and n, which signify the adsorption capacity and the heterogeneity factor, respectively. The heterogeneity factor, n, designates the adsorption nature: linear if n = 1, chemical if n > 1, and physical if n < 1 [30]. For CG-MB, the n value is greater than 1, indicating that the adsorption process is chemical, aligning with the reported value [113]. The values of R2, Kf, and n for the adsorption of MB and CV dyes on the CG/NC are detailed in Table 4.
3.4.3. Temkin Isotherm Model
The Temkin model posits that as the surface of the CG/NC becomes covered, the temperature of the molecules drops because of diminished interactions between the adsorbent and adsorbate. The constants A and B were calculated using the slope and intercept of Equation (10) and Figure 6S. The correlation coefficients (R2), along with the constants A and B, are listed in Table 4.
3.5. Kinetic studies
To study the adsorption kinetics, various kinetic models were investigated: pseudo-first-order, pseudo-second-order, intraparticle diffusion, and Elovich,.
3.5.1. The Pseudo-First-Order
The adsorption data for MB and CV dyes on the CG/NC were analyzed using Equation (4). The constant k1 was derived from the slope of Figure 7S. The lack of linearity in these plots, with correlation coefficients (R2) of 0.701 for MB and 0.323 for CV, suggests that the pseudo-first-order model does not suitably designate the adsorption process for these dyes. These findings are consistent with previously reported studies [30,31]. The values of k1, R2, and qe are documented in Table 5.
3.5.2. The Pseudo-Second-Order
This model posits that adsorption of the adsorbate onto the adsorbent surface involves a chemical process [30,31]. This model is distinguished by its ability to directly calculate the equilibrium adsorption capacity (qₑ) from the theoretical framework, rather than depending solely on experimental data. Figure 8S displays the plot of t/qₜ versus time (min), allowing for the calculation of the rate constant k2. The model precisely designated the adsorption kinetics for both dyes, evidenced by the high linearity of the plots (R² = 0.997 for MB and R² = 0.999 for CV). The qₑ values calculated from the model closely aligned with those derived experimentally, affirming the model's accuracy. These results conform with previous reports [30,31]. The values of R2, qₑ, and k2 for both dyes are summarized in Table 5.
The Intra-Particle Diffusion Model
This model is used to analyze the migration of CV and MB dyes from wastewater to the CG/NC surface. This model, which helps understand adsorption kinetics within porous materials, considers factors like pore surface adsorption, film diffusion, surface diffusion, and pore diffusion as potential influences on the adsorption rate. However, the investigation, as depicted in Figure 9S, revealed a noteworthy nonlinearity in the plot of qt versus t1/2, with R2 values of 0.671 for MB and 0.511 for CV. This nonlinearity suggests that the intra-particle diffusion model does not suitably designate the adsorption kinetics of these dyes, indicating that the model's assumptions may not align with the actual controlling mechanisms of dye adsorption [24]. The findings, detailed in Table 5, imply that intraparticle diffusion was not identified as the rate-controlling step, and boundary layer diffusion appears to play a negligible role in the adsorption process.
The Elovich Model
This model postulates that adsorption rates are influenced by the obtainability of the active sites and the rate at which adsorbate molecules overcome the energy barrier for interaction. For MB, the empirical constants α and β were found to be exceptionally high at 3.40 x 1029 and 10.98, respectively, indicating a rapid initial adsorption rate and moderate adsorption capacity. Similarly, for CV, the values were α = 3.16 x 10⁶ and β = 5.89, also suggesting quick adsorption kinetics and moderate capacity.
5.3.6. Reusability of CG/NC
The reusability of the CG/NC as an adsorbent is highlighted as a critical feature due to its ability to reduce costs, enhance environmental sustainability, conserve resources, and maintain consistent performance over time. Although the removal efficacy for MB and CV dyes decreases with each reuse, as shown in Figure 9, the CG nanocomposite remains effective for up to four cycles. This decline in efficiency is likely due to the structural degradation of some CG/NC molecules during the adsorption process. Despite this, the nanocomposite's performance in repeated uses surpasses previously reported results, establishing it as a cost-effective and competitive option for dye removal.
5.3.7. Comparison with Other Adsorbents
Table 6 provides a comparative analysis of various adsorbents used to remove CV and MB dyes from wastewater. Most of these adsorbents follow the Langmuir isotherm and pseudo second order kinetic models, with optimal pH values typically ranging between 5.3 and 9.0. The data highlight the efficiency of CG/NC, which requires only 0.20 g for MB and 0.30 g for CV and operates optimally at a neutral pH of 7.0. This eliminates the necessity for chemical adjustment of pH, enhancing its practicality. In contrast, other adsorbents like PANI-NiFe₂O₄ and Khulays bentonite necessitate either acidic or alkaline conditions to function effectively. Thus, CG/NC is distinguished as one of the most effective and user-friendly adsorbents in this comparative study.
4. Conclusion
This study addressed the challenge of organic dye pollution through an economical and effective adsorption method. The CG/NC was synthesized and demonstrated an effective removal of MB and CV dyes from water. Among the factors tested, adsorbent dose was the most significant in enhancing removal efficiency. The adsorption process conformed to the Langmuir isotherm model, suggesting monolayer coverage of the dyes, and followed pseudo-second-order kinetics, with high accuracy shown by R² values of 0.997 for MB and 0.999 for CV. Advanced ANN models employing Gradient Descent and Monte Carlo Simulation techniques showcased robust predictive capabilities, evidenced by low MSE and high R² values. The study confirms the potential of CG/NC as a low-cost, eco-friendly, and reusable solution for effectively mitigating dye contamination in water.
Supplementary Materials
The following supporting information can be downloaded at the website of this paper posted on Preprints.org.
Author Contributions
Conceptualization, I.H. Ali. and S. Siddeeg.; methodology, I.H. Ali and F. Maiz.; software, F. Maiz. M. Alqahtani.; formal analysis, M. Alqahtani.; investigation, M. Alqahtani.; resources, I.H. Ali.; writing—original draft preparation, I.H. Ali.; writing—review and editing, S. Siddeeg.; funding acquisition, I.H. Ali. All authors have read and agreed to the published version of the manuscript.
Funding
The authors extend their appreciation to the Deanship of Research and Grad- uate Studies at King Khalid University for funding this work through Large Group Project under grant number (341/1445).
Conflicts of Interest
The authors declare no conflicts of interest.
References
- Jaramillo-Fierro, X.; González, S.; Jaramillo, H.A.; Medina, F. Synthesis of the ZnTiO3/TiO2 Nanocomposite Supported in Ecuadorian Clays for the Adsorption and Photocatalytic Removal of Methylene Blue Dye. Nanomaterials 2020, 10, 1891. [CrossRef]
- Ibupoto, A.S., Qureshi, U.A.; Ahmed, F.; Khatri, Z.; Khatri, M.; Maqsood, M.; Brohi., R.Z. Reusable carbon nanofibers for efficient removal of methylene blue from aqueous solution. Chemical Engineering Research and Design, 2018, 136, 744-752.
- Hameed, B.; Din, A.M.; Ahmad, A. Adsorption of methylene blue onto bamboo-based activated carbon: kinetics and equilibrium studies. Journal of hazardous materials 2007.,141(3), 819-825.
- Hong, J.; Bao, J.; Liu, Y. Removal of Methylene Blue from Simulated Wastewater Based upon Hydrothermal Carbon Activated by Phosphoric Acid. Water 2025, 17, 733. [CrossRef]
- Vishal Singh, Rahul Sapehia, Vikas Dhiman, Removal of methylene blue dye by green synthesized NiO/ZnO nanocomposites. Inorganic Chemistry Communications, 2025, 162, 112267, . [CrossRef]
- Bulut, Y.; Aydın, H. A kinetics and thermodynamics study of methylene blue adsorption on wheat shells. Desalination 2006. 194, 259-267.
- Hoslett, J., Ghazal, H.; Mohamad, N.; Jouhara, H. Removal of methylene blue from aqueous solutions by biochar prepared from the pyrolysis of mixed municipal discarded material. Science of the Total Environment 2020. 714, 136832.
- Yang, Z.; Liu, X.; Liu, X.; Wu, J.; Zhu, X.; Bai, Z.; Yu, Z. Preparation of β-cyclodextrin/graphene oxide and its adsorption properties for methylene blue. Colloids and Surfaces B: Biointerfaces 2021, 200, 111605.
- Rehman, M.U. Physicochemical characterization of Pakistani clay for adsorption of methylene blue: Kinetic, isotherm and thermodynamic study. Materials Chemistry and Physics 2021, 269, 124722.
- Patil, M.R.; Shrivastava, V. Adsorptive removal of methylene blue from aqueous solution by polyaniline-nickel ferrite nanocomposite: a kinetic approach. Desalination and Water Treatment. 2016, 57(13), 5879-5887.
- Chang, J.; Adsorption of methylene blue onto Fe3O4/activated montmorillonite nanocomposite. Applied Clay Science 2016, 119, 132-140.
- Alzahrani, E.; Gum Arabic-coated magnetic nanoparticles for methylene blue removal. International Journal of Innovative Research in Science, Engineering Technology 2014, 3(8), 15118-15129.
- Azhar-ul-Haq, M. Adsorptive removal of hazardous crystal violet dye onto banana peel powder: equilibrium, kinetic and thermodynamic studies. Journal of Dispersion Science and Technology 2022, 1-16.
- Chowdhury, S.; Chakraborty, S.; Das, P. Adsorption of crystal violet from aqueous solution by citric acid modified rice straw: equilibrium, kinetics, and thermodynamics. Separation Science and Technology 2013, 48(9), 1339-1348.
- Sulthana, R.; Taqui, S.N.; Syed, U.T. Adsorption of crystal violet dye from aqueous solution using industrial pepper seed spent: equilibrium, thermodynamic, and kinetic studies. Adsorption Science and Technology 2022. doi:10.1155/2022/9009214.
- Khattri, S.; Singh, M. Use of Sagaun sawdust as an adsorbent for the removal of crystal violet dye from simulated wastewater. Environmental Progress & Sustainable Energy 2012, 31(3), 435-442.
- Loulidi, I.; Boukhlifi, F.; Ouchabi, M.; Amar, A. Adsorption of crystal violet onto an agricultural waste residue: kinetics, isotherm, thermodynamics, and mechanism of adsorption. The Scientific World Journal, 2020, 5873521, . [CrossRef]
- AL-Shehri, H.S.; Almudaifer, E.; Alorabi, A.Q.; Alanazi, H.S.; Alkorbi, A.S.; Alharthi, F.A. Effective adsorption of crystal violet from aqueous solutions with effective adsorbent: equilibrium, mechanism studies and modeling analysis. Environmental Pollutants and Bioavailability 2021, 33, 214-226.
- Senthilkumaar, S.; Kalaamani, P.; Subburaam, C. Liquid phase adsorption of crystal violet onto activated carbons derived from male flowers of coconut tree. Journal of hazardous materials 2006, 136, 800-808.
- Ahmad, R.; Studies on adsorption of crystal violet dye from aqueous solution onto coniferous pinus bark powder (CPBP). Journal of hazardous materials 2009, 171, 767-773.
- Laskar, N.; Kumar, U. Adsorption of crystal violet from wastewater by modified bambusa tulda. KSCE Journal of Civil Engineering 2018, 22, 2755-2763.
- Mulla, B.; Ioannou, K.; Kotanidis, G.; Ioannidis, I.; Constantinides, G.; Baker, M.; Hinder, S.; Mitterer, C.; Pashalidis, I.; Kostoglou, N.; et al. Removal of Crystal Violet Dye from Aqueous Solutions through Adsorption onto Activated Carbon Fabrics. C 2024, 10, 19. [CrossRef]
- Ben Tahar, L.; Mogharbel, R.; Hameed, Y.; Noubigh, A.; Abualreish, M.J.A.; Alanazi, A.H.; Hatshan, M.R. Enhanced removal of the crystal violet dye from aqueous medium using tripolyphosphate–functionalized Zn–substituted magnetite nanoparticles. Results in Chemistry 2025, 14, 102152.
- Khan, M.I.; Almesfer, M.K.; Elkhaleefa, A.M.; et al. Efficient adsorption of hexavalent chromium ions onto novel ferrochrome slag/polyaniline nanocomposite: ANN modeling, isotherms, kinetics, and thermodynamic studies. Environ Sci Pollut Res Int 2022. 29, 86665-86679. [CrossRef]
- Abbasi, E.; Moghaddam, M.R.A.; Kowsari, E. A systematic and critical review on development of machine learning based-ensemble models for prediction of adsorption process efficiency. Journal of Cleaner Production 2022, 134588.
- Çelekli, A.; Geyik, F.; Artificial neural networks (ANN) approach for modeling of removal of Lanaset Red G on Chara contraria. Bioresource technology 2011, 102(10), 5634-5638.
- Khonde, R.; Pandharipande, S., Artificial Neural Network modeling for adsorption of dyes from aqueous solution using rice husk carbon. International Journal of Computer Applications 2012. 41(4).
- Sharma, K.; Sharma, S.; Sharma, V.; Mishra, P.K.; Ekielski, A.; Sharma, V.; Kumar, V. Methylene Blue Dye Adsorption from Wastewater Using Hydroxyapatite/Gold Nanocomposite: Kinetic and Thermodynamics Studies. Nanomaterials 2021, 11, 1403. [CrossRef]
- Khan, M.I.; Yahya, S.A.; ElKhaleefa, A.; Shigidi, I.; Ali, I.H.; Rehan, M.; Pirzada, A.M. Toxic Anionic Azo Dye Removal from Artificial Wastewater by Using Polyaniline/Clay Nanocomposite Adsorbent: Isotherm, Kinetics and Thermodynamic Study. Processes 2025, 13, 827. [CrossRef]
- Ali, I.H.; Bani-Fwaz, M.Z.; El-Zahhar, A.A.; Marzouki, R.; Jemmali, M.; Ebraheem, S.M. Gum Arabic-Magnetite Nanocomposite as an Eco-Friendly Adsorbent for Removal of Lead(II) Ions from Aqueous Solutions: Equilibrium, Kinetic and Thermodynamic Studies. Separations 2021, 8, 224. [CrossRef]
- Elkhaleefa, A.; Ali, I.H.; Brima, E.I.; Shigidi, I.; Elhag, A.B.; Karama, B. Evaluation of the Adsorption Efficiency on the Removal of Lead(II) Ions from Aqueous Solutions Using Azadirachta indica Leaves as an Adsorbent. Processes 2021, 9, 559. [CrossRef]
- Hussain, S.A.; Demirci, Ş.; Özbayoğlu, G. Zeta potential measurements on three clays from Turkey and effects of clays on coal flotation. Journal of Colloid and Interface Science 1996, 184(2), 535-541.
- Shehu, Z.; Synthesis, Characterization and Antibacterial Activity of Kaolin/Gum Arabic Nanocomposite on Escherichia Coli and Pseudomonas Aeruginosa. Research Journal of Nanoscience and Engineering 2018. 2(2), 23-29.
- Idrissi, M.; Degradation of crystal violet by heterogeneous Fenton-like reaction using Fe/Clay catalyst with H2O2. Journal of Materials and Environmental Science 2016. 7(1), 50-58.
- Adikary, S.; Wanasinghe, D.; Characterization of locally available Montmorillonite clay using FTIR technique. Annual Transactions of Institution of Engineers Sri Lanka 2012, 1, 140-145.
- Upadhyay, A.; Ethylene scavenging film based on corn starch-gum acacia impregnated with sepiolite clay and its effect on quality of fresh broccoli florets. Food Bioscience 2022, 46, 101556.
- Nayak, A.K.; Das, B.; Maji, R.; Calcium alginate/gum Arabic beads containing glibenclamide: Development and in vitro characterization. International journal of biological macromolecules 2012, 51(5), 1070-1078.
- Jawad, A.H.; Abdulhameed, A.S. Mesoporous Iraqi red kaolin clay as an efficient adsorbent for methylene blue dye: adsorption kinetic, isotherm and mechanism study. Surfaces and Interfaces 2020, 18, 100422.
- Mukherjee, K.; Adsorption enhancement of methylene blue dye at kaolinite clay–water interface influenced by electrolyte solutions. RSC Advances 2015, 5(39), 30654-30659.
- Alorabi, A.Q.; Hassan, M.S.; Alam, M.M.; Zabin, S.A.; Alsenani, N.I.; Baghdadi, N.E. Natural Clay as a Low-Cost Adsorbent for Crystal Violet Dye Removal and Antimicrobial Activity. Nanomaterials 2021, 11, 2789. [CrossRef]
- Amirabadi, S.; Milani, J.M.; Sohbatzadeh, F. Application of dielectric barrier discharge plasma to hydrophobically modification of gum arabic with enhanced surface properties. Food Hydrocolloids 2020, 104, 105724.
- Mecheri, R.; Zobeidi, A.; Atia, S.; Neghmouche Nacer, S.; Salih, A.A.M.; Benaissa, M.; Ghernaout, D.; Arni, S.A.; Ghareba, S.; Elboughdiri, N. Modeling and Optimizing the Crystal Violet Dye Adsorption on Kaolinite Mixed with Cellulose Waste Red Bean Peels: Insights into the Kinetic, Isothermal, Thermodynamic, and Mechanistic Study. Materials 2023, 16, 4082. [CrossRef]
- Marsh, A.; Phase formation behaviour in alkali activation of clay mixtures. Applied Clay Science 2019. 175, 10-21.
- 1Bashir, M.; Haripriya, S. Assessment of physical and structural characteristics of almond gum. International Journal of Biological Macromolecules 2016, 93, 476-482.
- Emam, H.E.; Arabic gum as bio-synthesizer for Ag–Au bimetallic nanocomposite using seed-mediated growth technique and its biological efficacy. Journal of Polymers and the Environment 2019, 27, 210-223.
- Yadav, V.B.; Gadi, R.; Kalra, S. Synthesis and characterization of novel nanocomposite by using kaolinite and carbon nanotubes. Applied Clay Science 2018, 155, 30-36.
- Nasuha, N.; Hameed, B.H.; Din, A.T. Rejected tea as a potential low-cost adsorbent for the removal of methylene blue. J Hazard Mater 2010, 175, 126-32.
- Ali, R.; Elsagan, Z.; AbdElhafez, S.; Lignin from agro-industrial waste to an efficient magnetic adsorbent for hazardous crystal violet removal. Molecules 2022, 27(6), 1831. [CrossRef]
- Al-Shahrani, S.; Phenomena of removal of crystal violet from wastewater using Khulays natural bentonite. Journal of Chemistry 2020. [CrossRef]
- Elsherif, K.M.; El-Dali, A.; Alkarewi, A.A.; Ewlad-Ahmed, A.M.; Treban, A. Adsorption of crystal violet dye onto olive leaves powder: Equilibrium and kinetic studies. Chemistry International 2021, 7, 79-89.
Figure 1.
Schematic illustration ANN model used for predicting MB and CV dyes removal efficiency. A denotes MB; B denotes CV.
Figure 1.
Schematic illustration ANN model used for predicting MB and CV dyes removal efficiency. A denotes MB; B denotes CV.
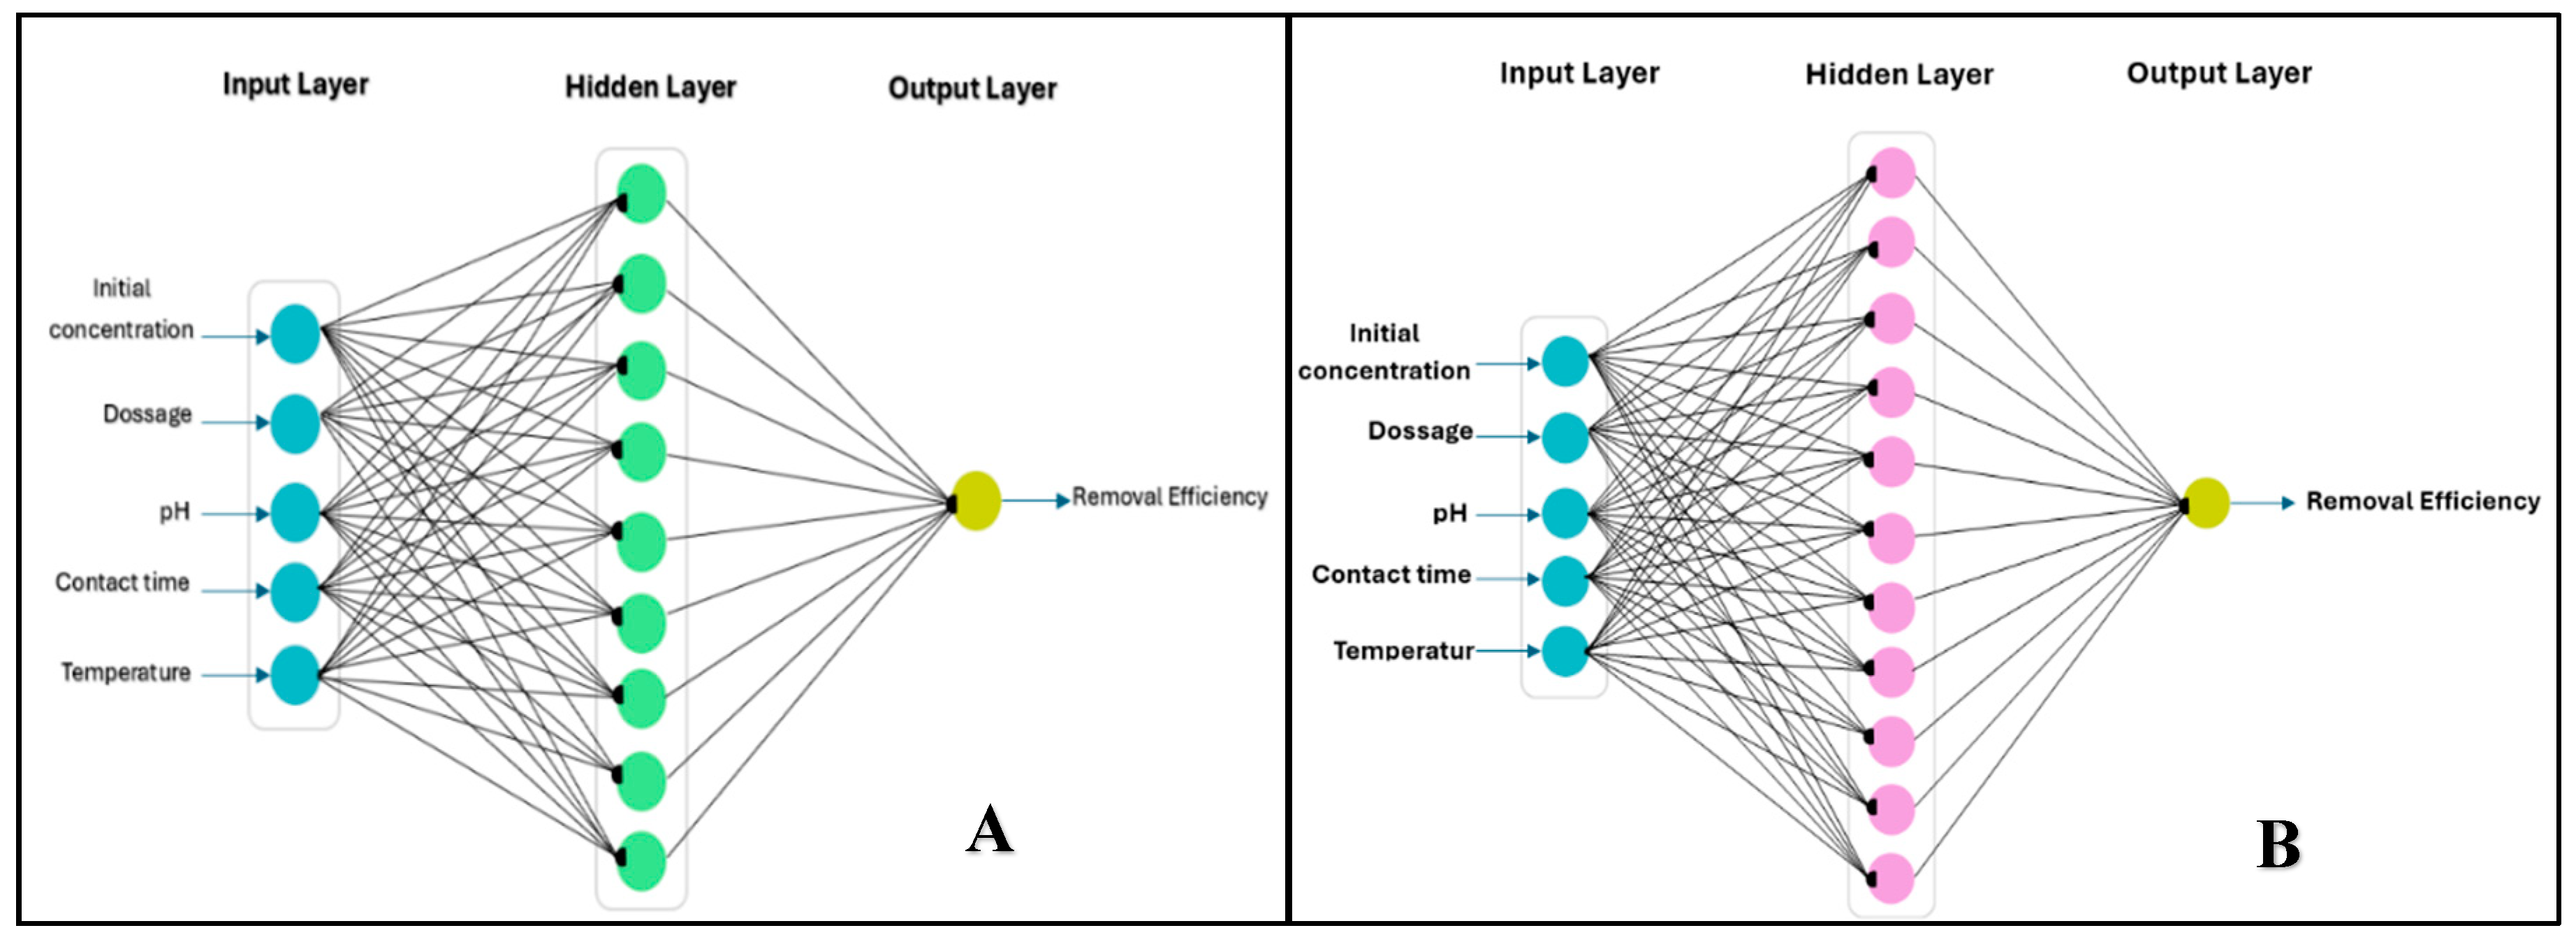
Figure 2.
FTIR for spectra for Clay, Gum Arabic, CG nanocomposite, CG after adsorbed MB, and CG after adsorbed CV.
Figure 2.
FTIR for spectra for Clay, Gum Arabic, CG nanocomposite, CG after adsorbed MB, and CG after adsorbed CV.
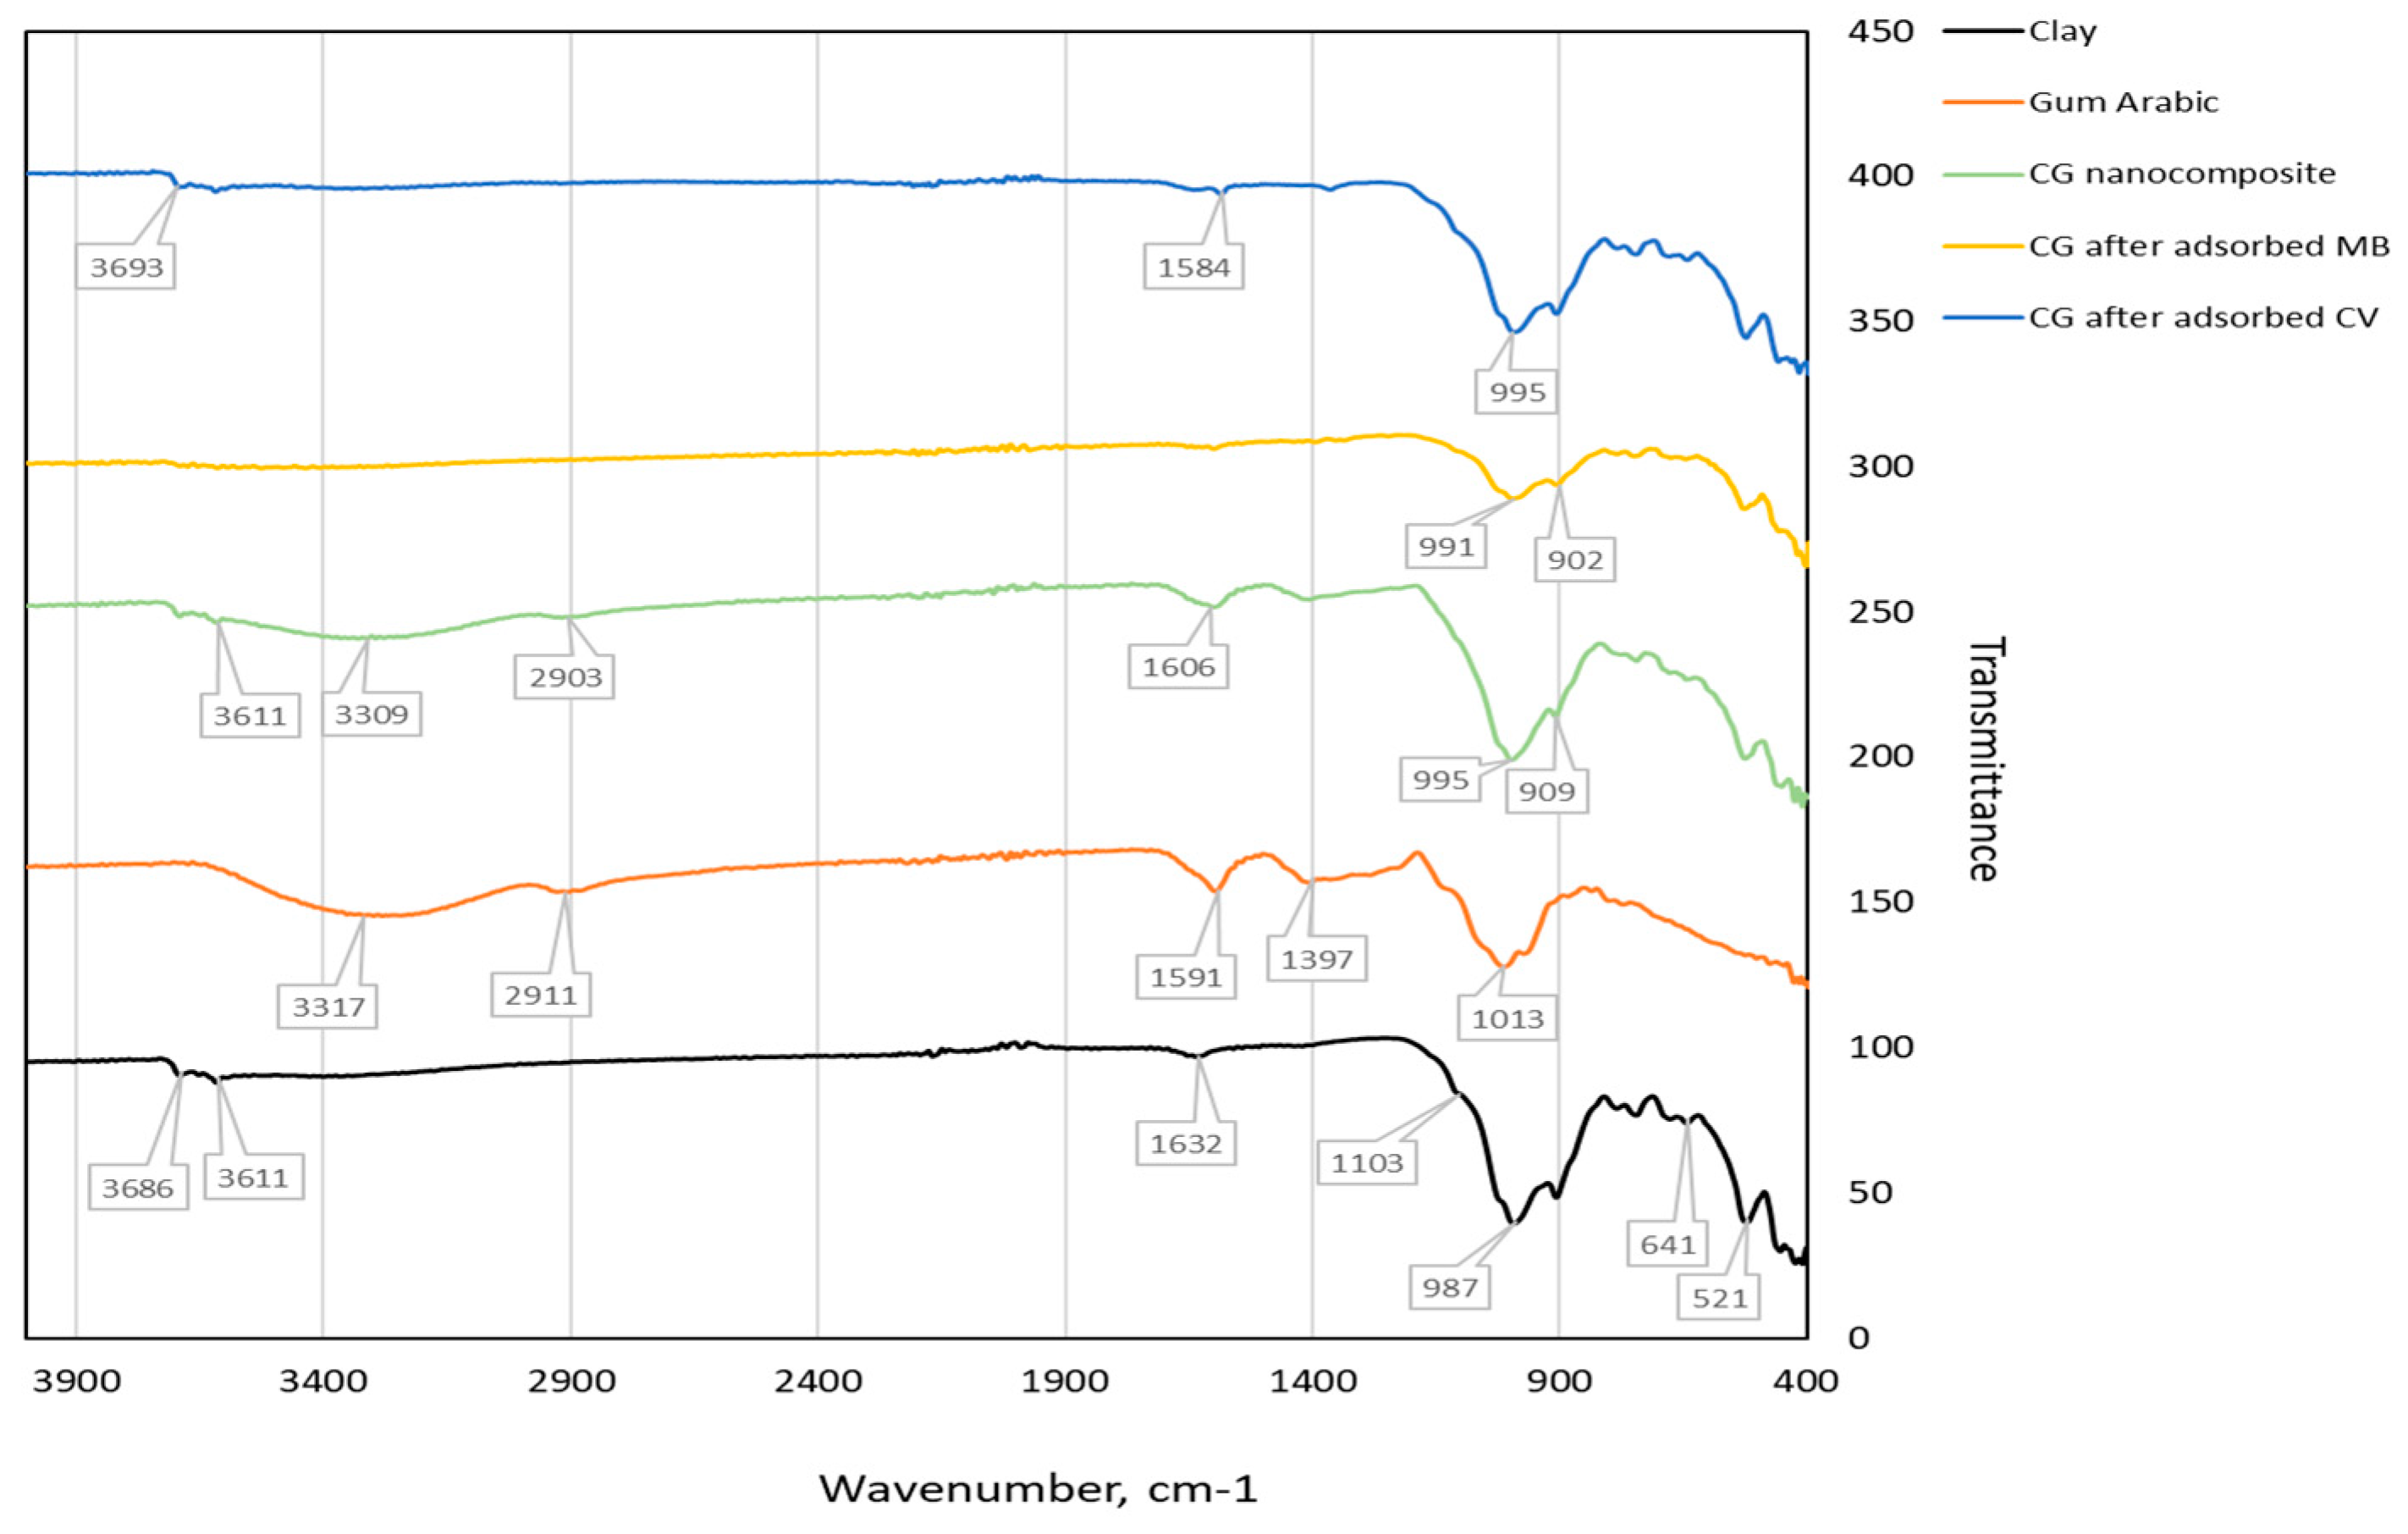
Figure 3.
SEM-EDX analysis of CG/NC before and after adsorption of dyes. A1 and A2 denote SEM-EDX for CG/NC; B1 and B2 denote SEM-EDX for MB; C1 and C2 denotes for SEM-EDX for CV.
Figure 3.
SEM-EDX analysis of CG/NC before and after adsorption of dyes. A1 and A2 denote SEM-EDX for CG/NC; B1 and B2 denote SEM-EDX for MB; C1 and C2 denotes for SEM-EDX for CV.
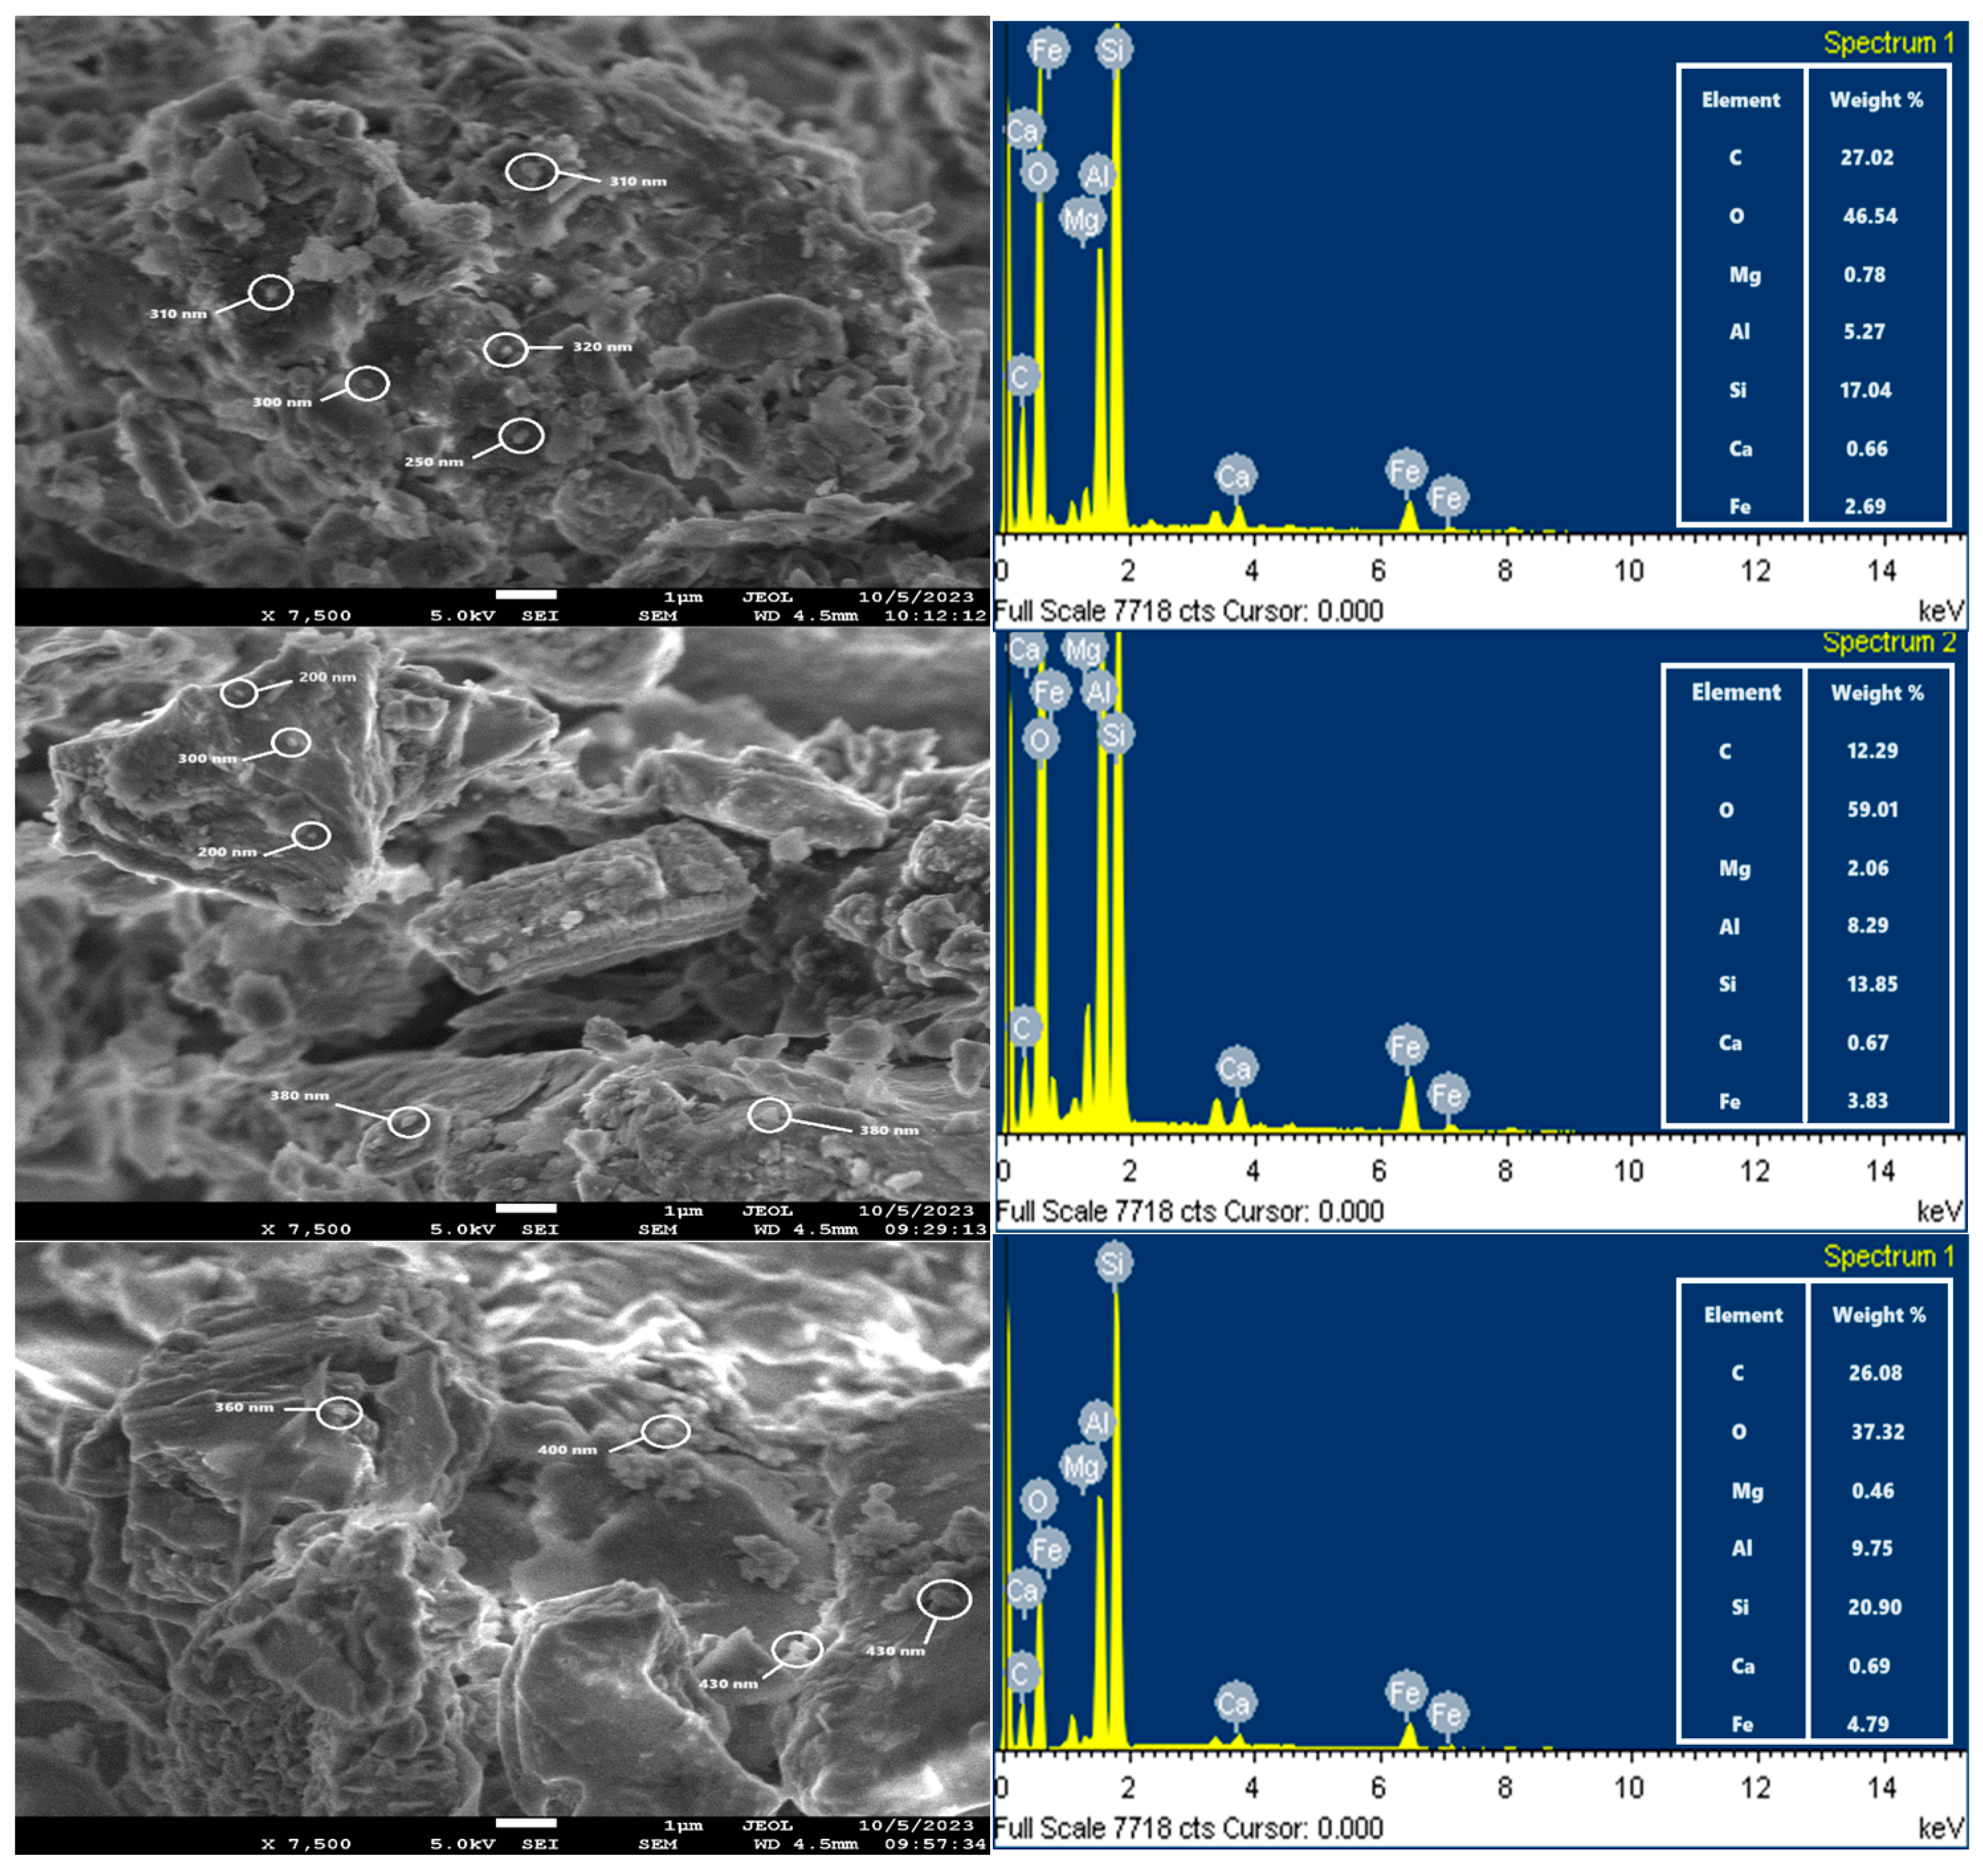
Figure 4.
X-ray diffractogram of Gum Arabic, Clay, and CG/NC.
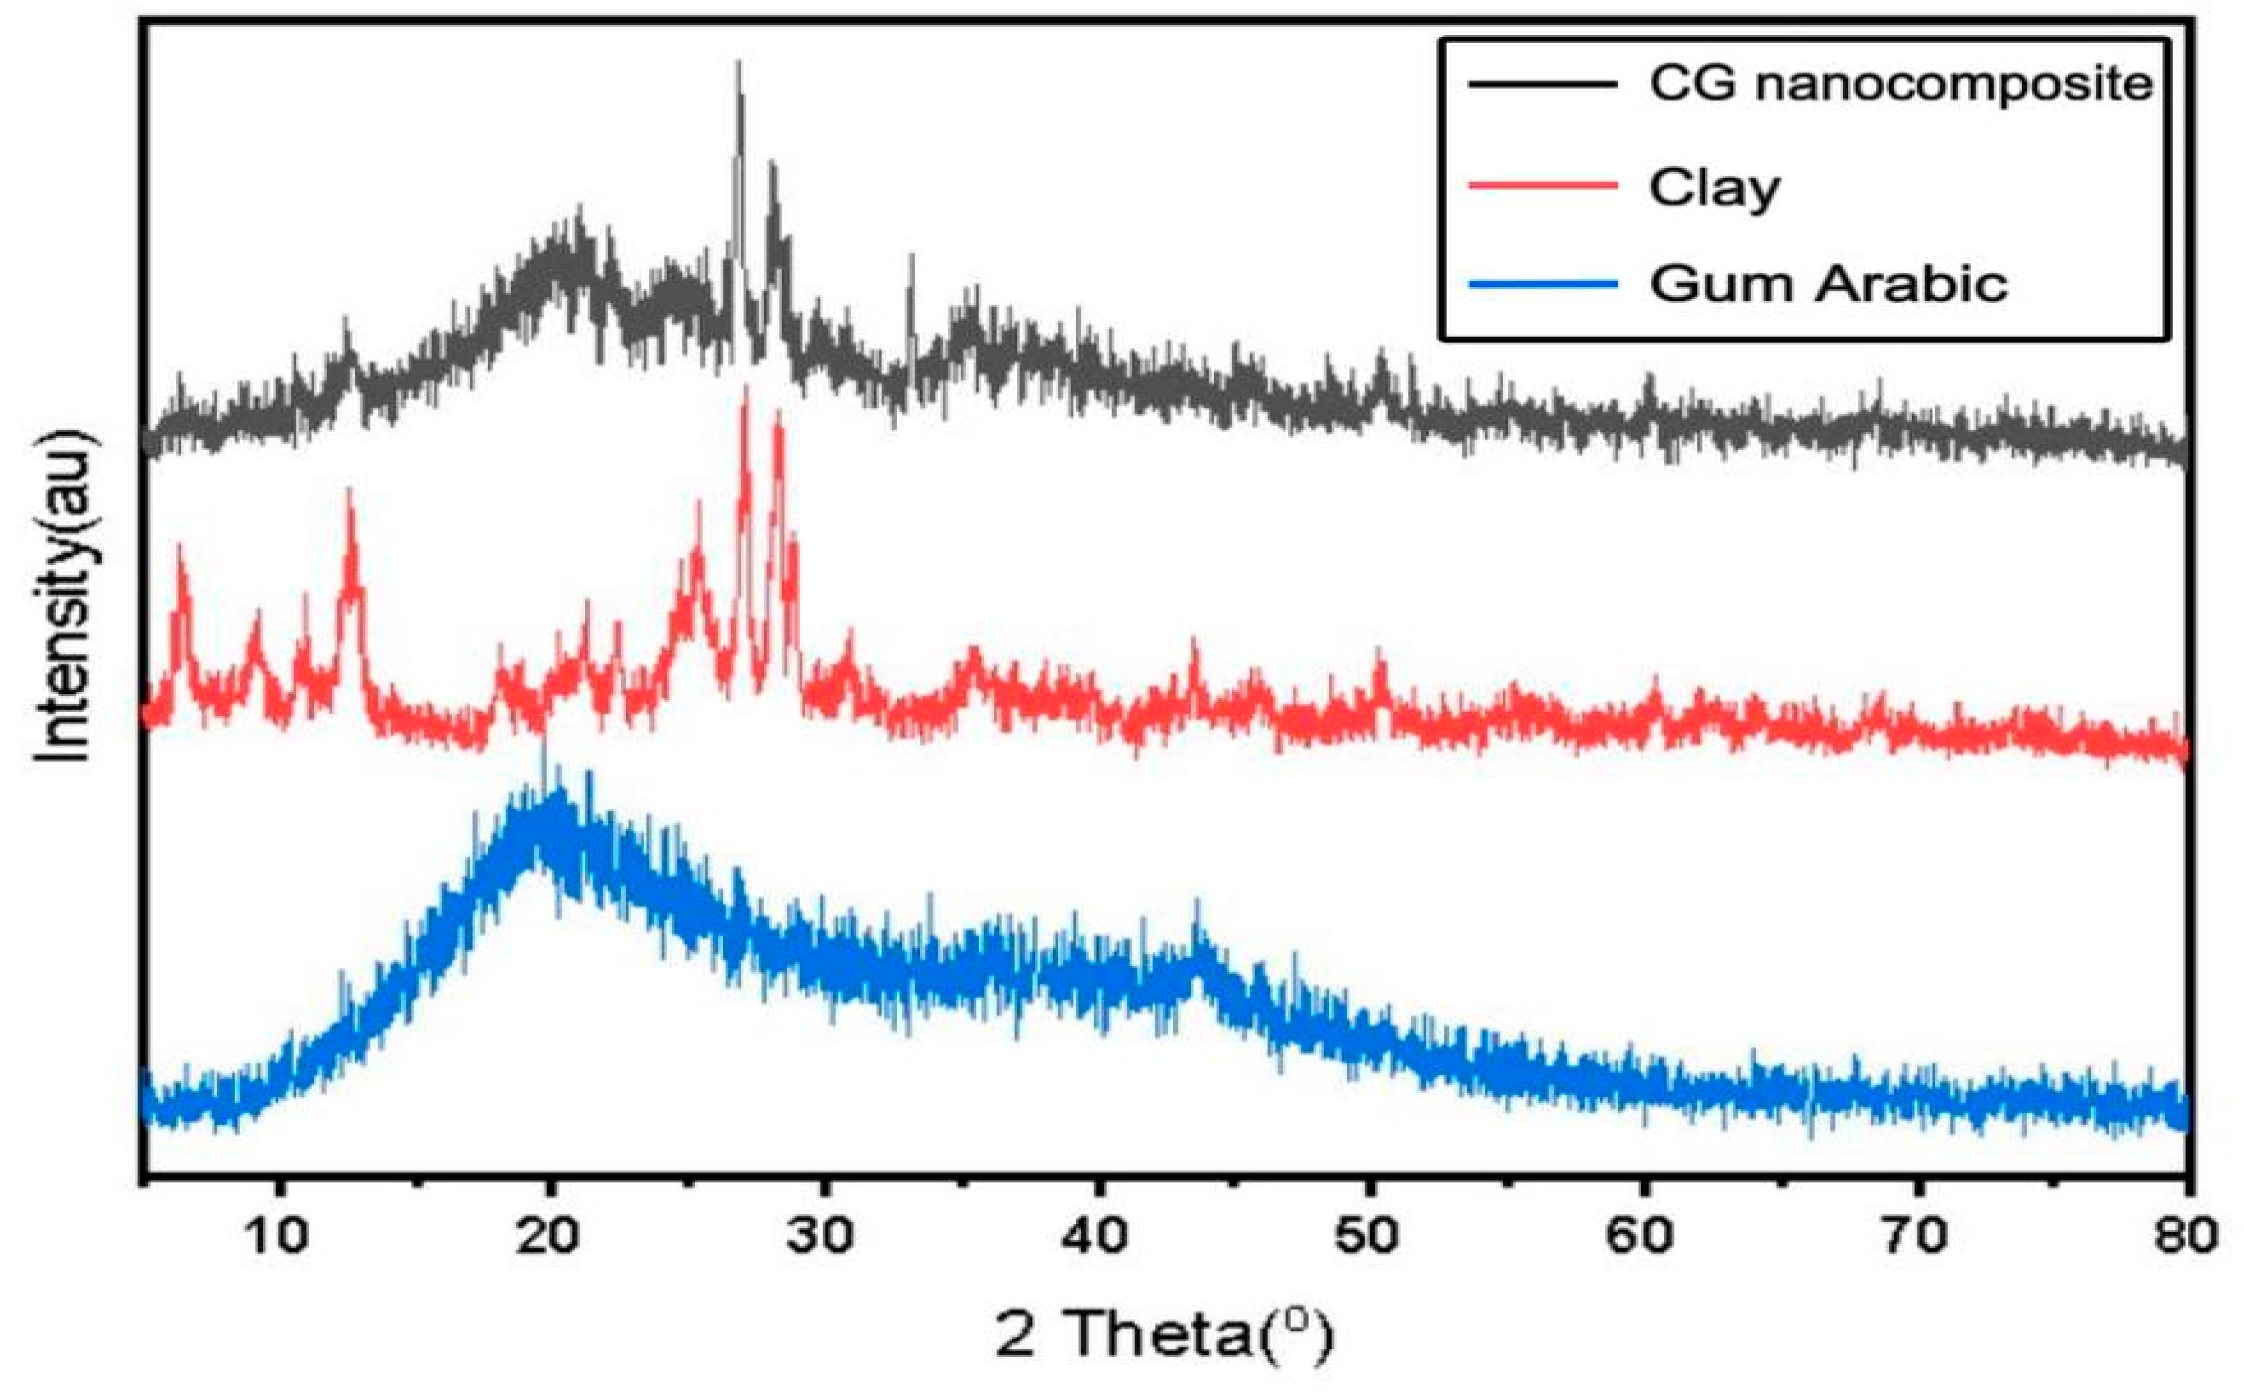
Figure 5.
Removal efficiency for Experimental and ANN predicted data of MB and CV dyes vs adsorbent dosage. A denotes MB; B denotes CV.
Figure 5.
Removal efficiency for Experimental and ANN predicted data of MB and CV dyes vs adsorbent dosage. A denotes MB; B denotes CV.
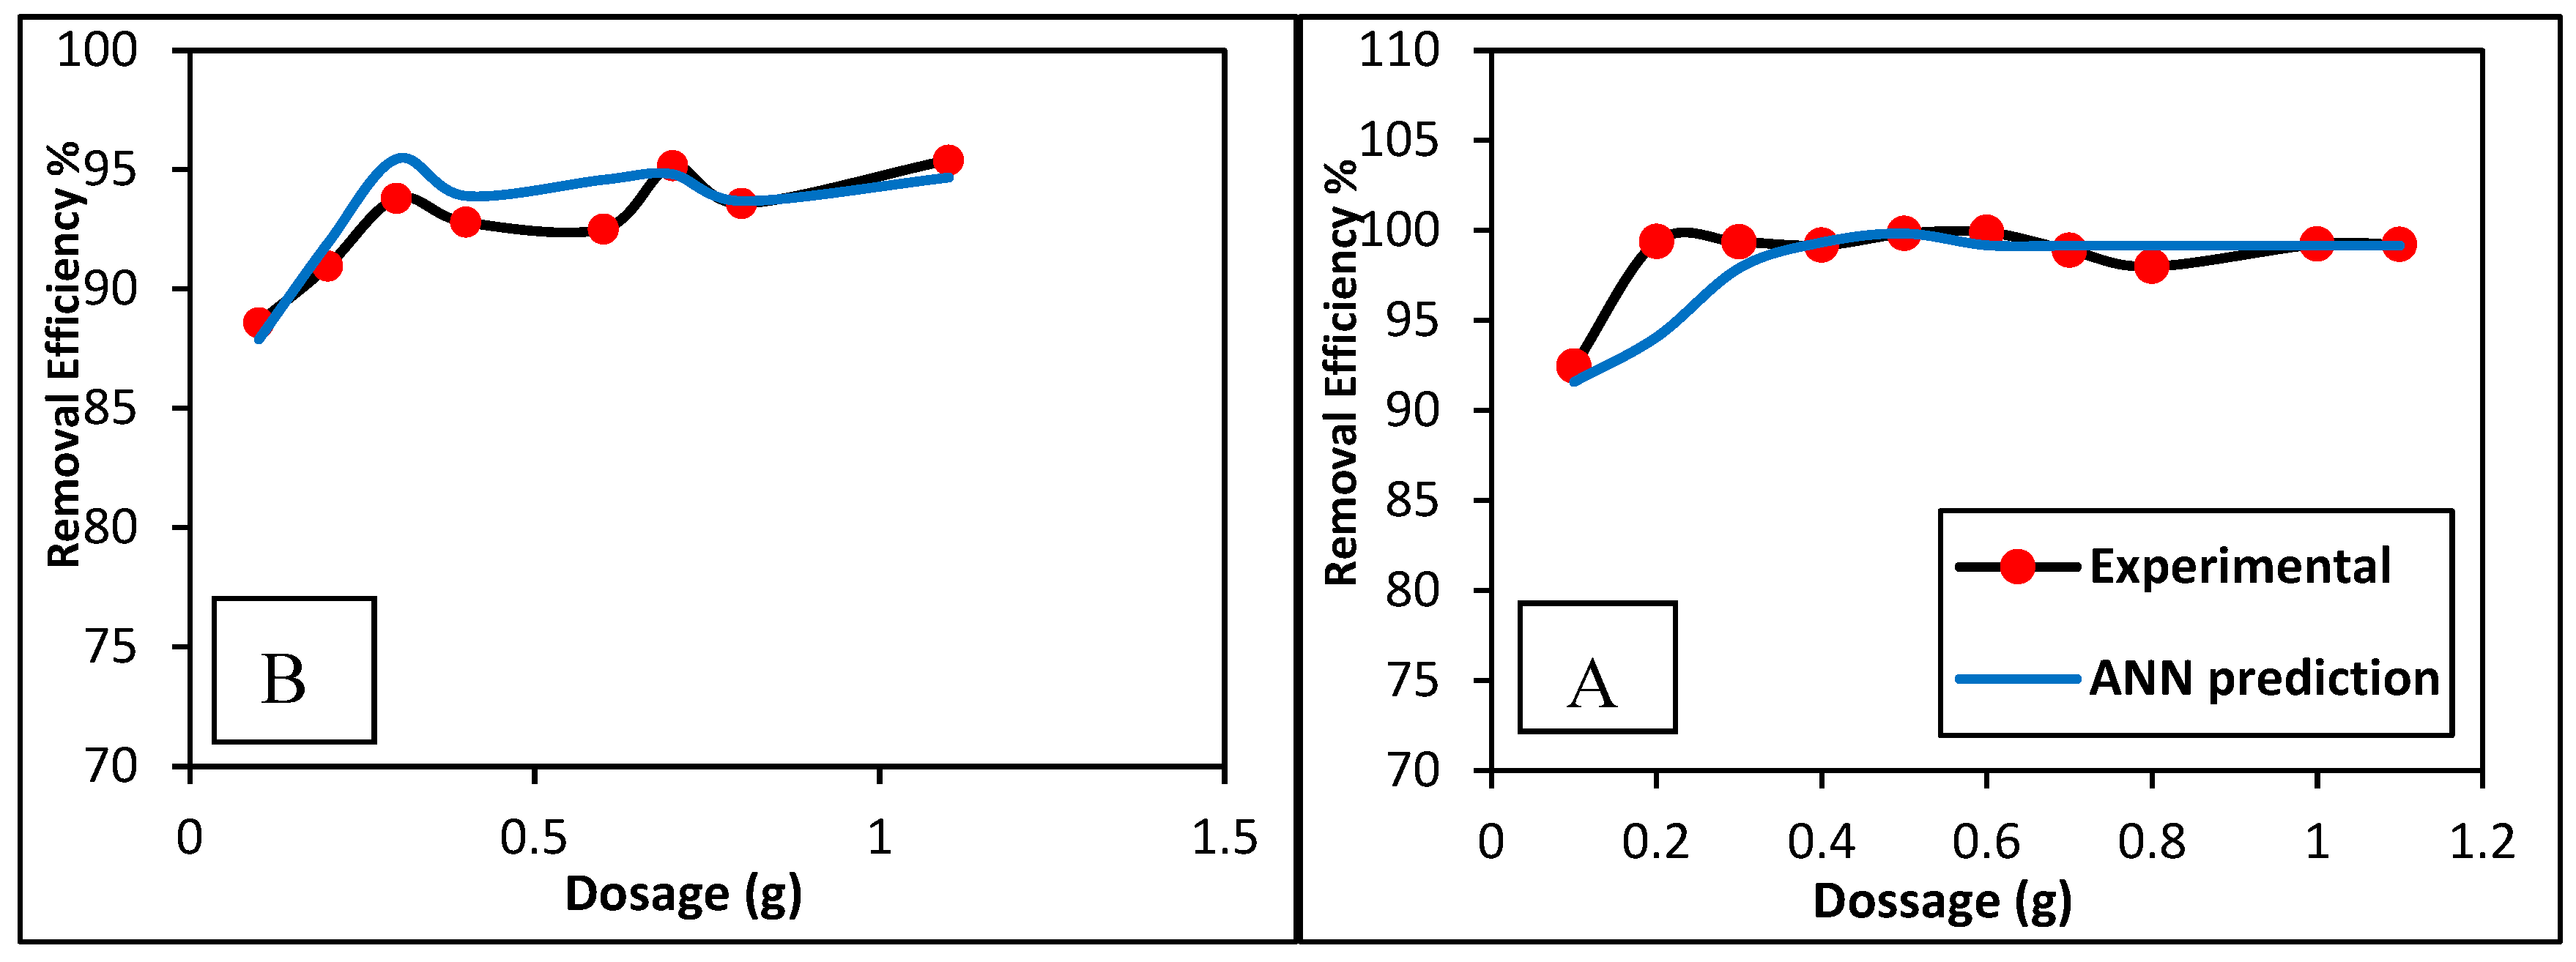
Figure 6.
Removal efficiency for experimental and ANN predicted data of MB and CV dyes vs pH. A denotes MB; B denotes CV.
Figure 6.
Removal efficiency for experimental and ANN predicted data of MB and CV dyes vs pH. A denotes MB; B denotes CV.
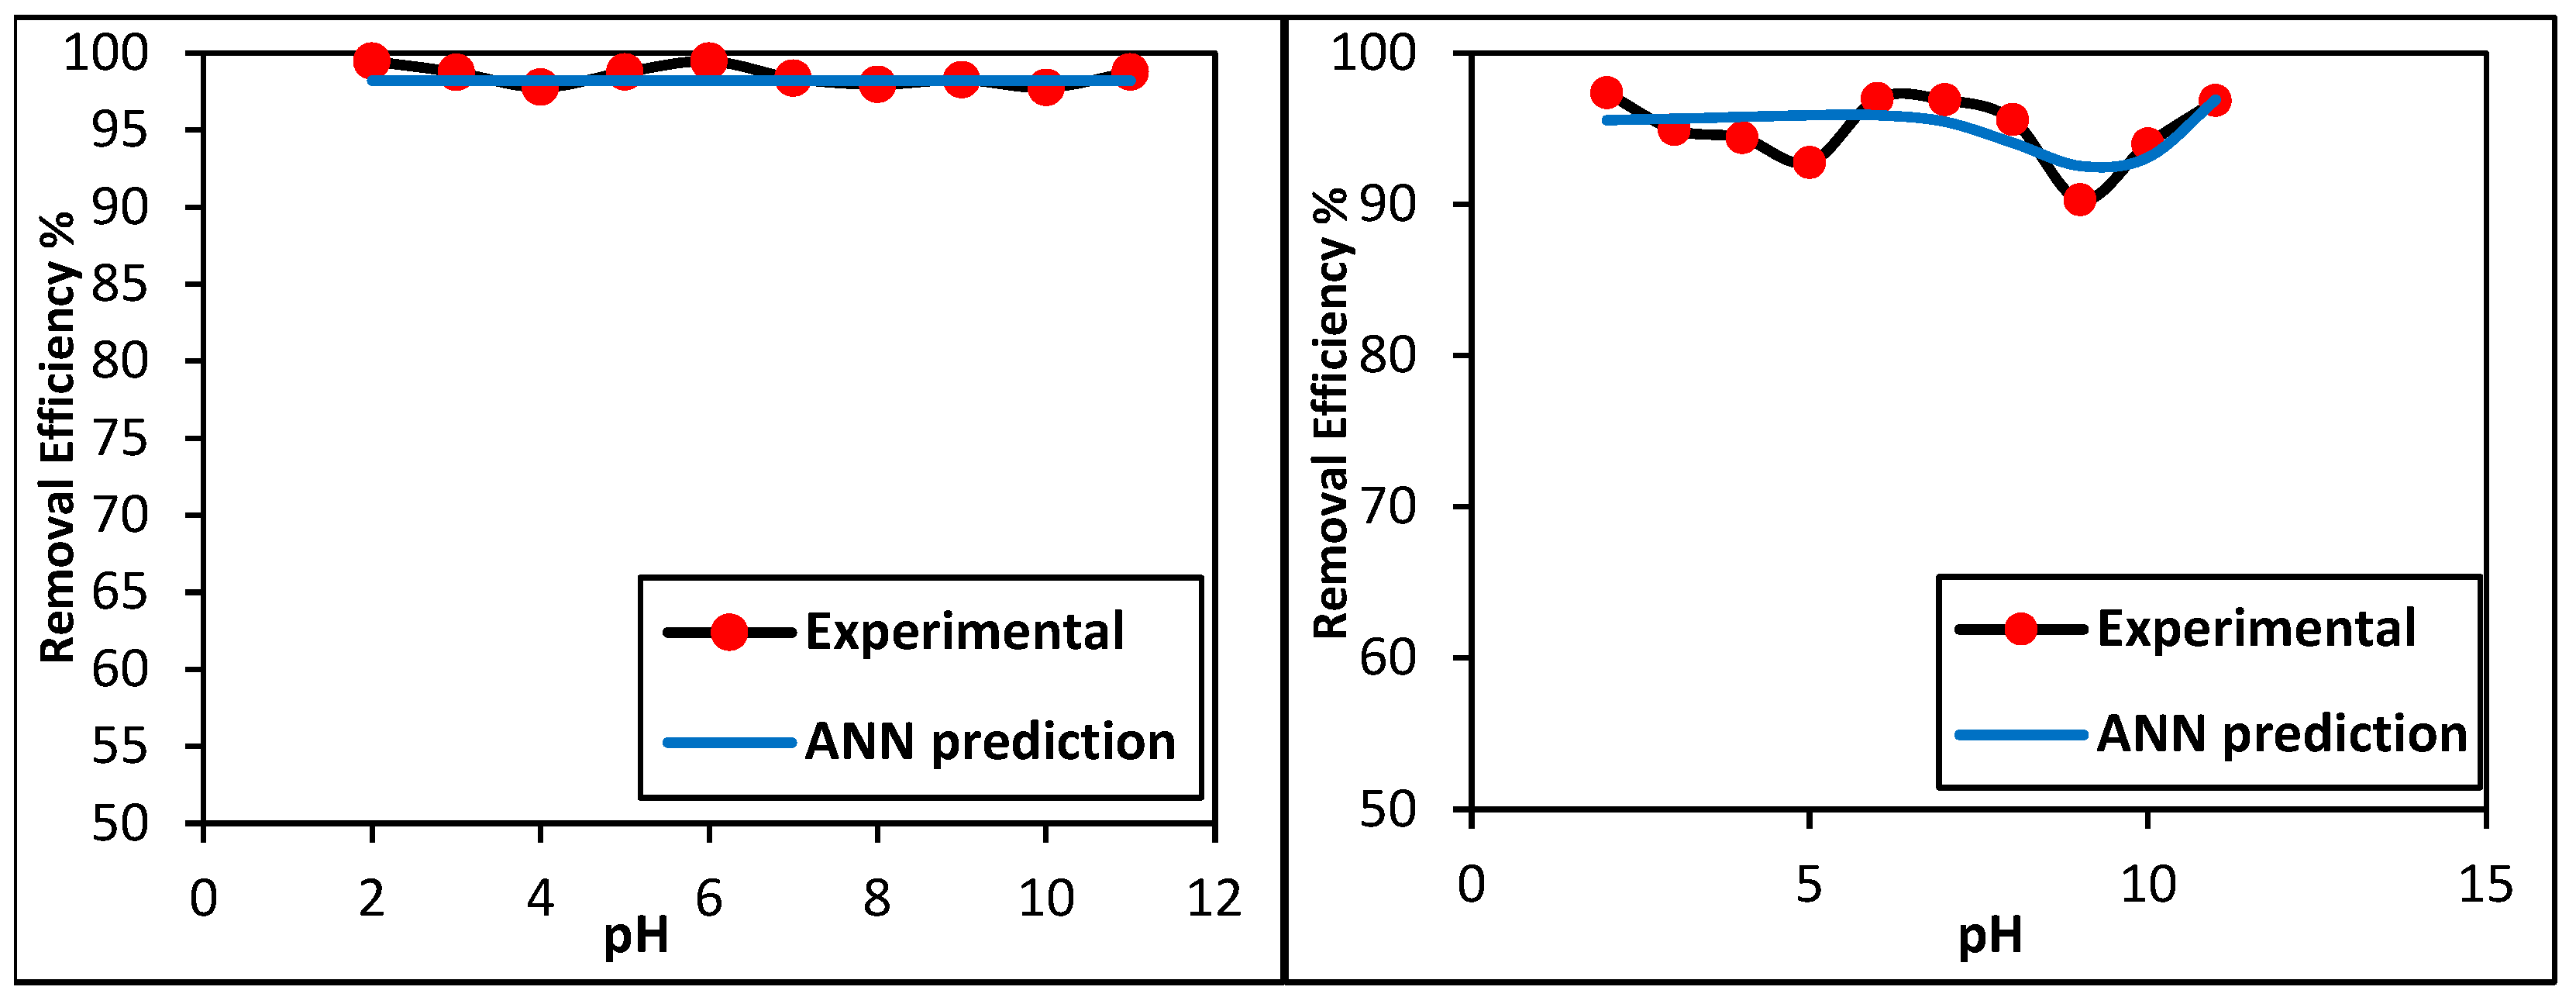
Figure 7.
Surface charge density as a function of pH for GG adsorbent.
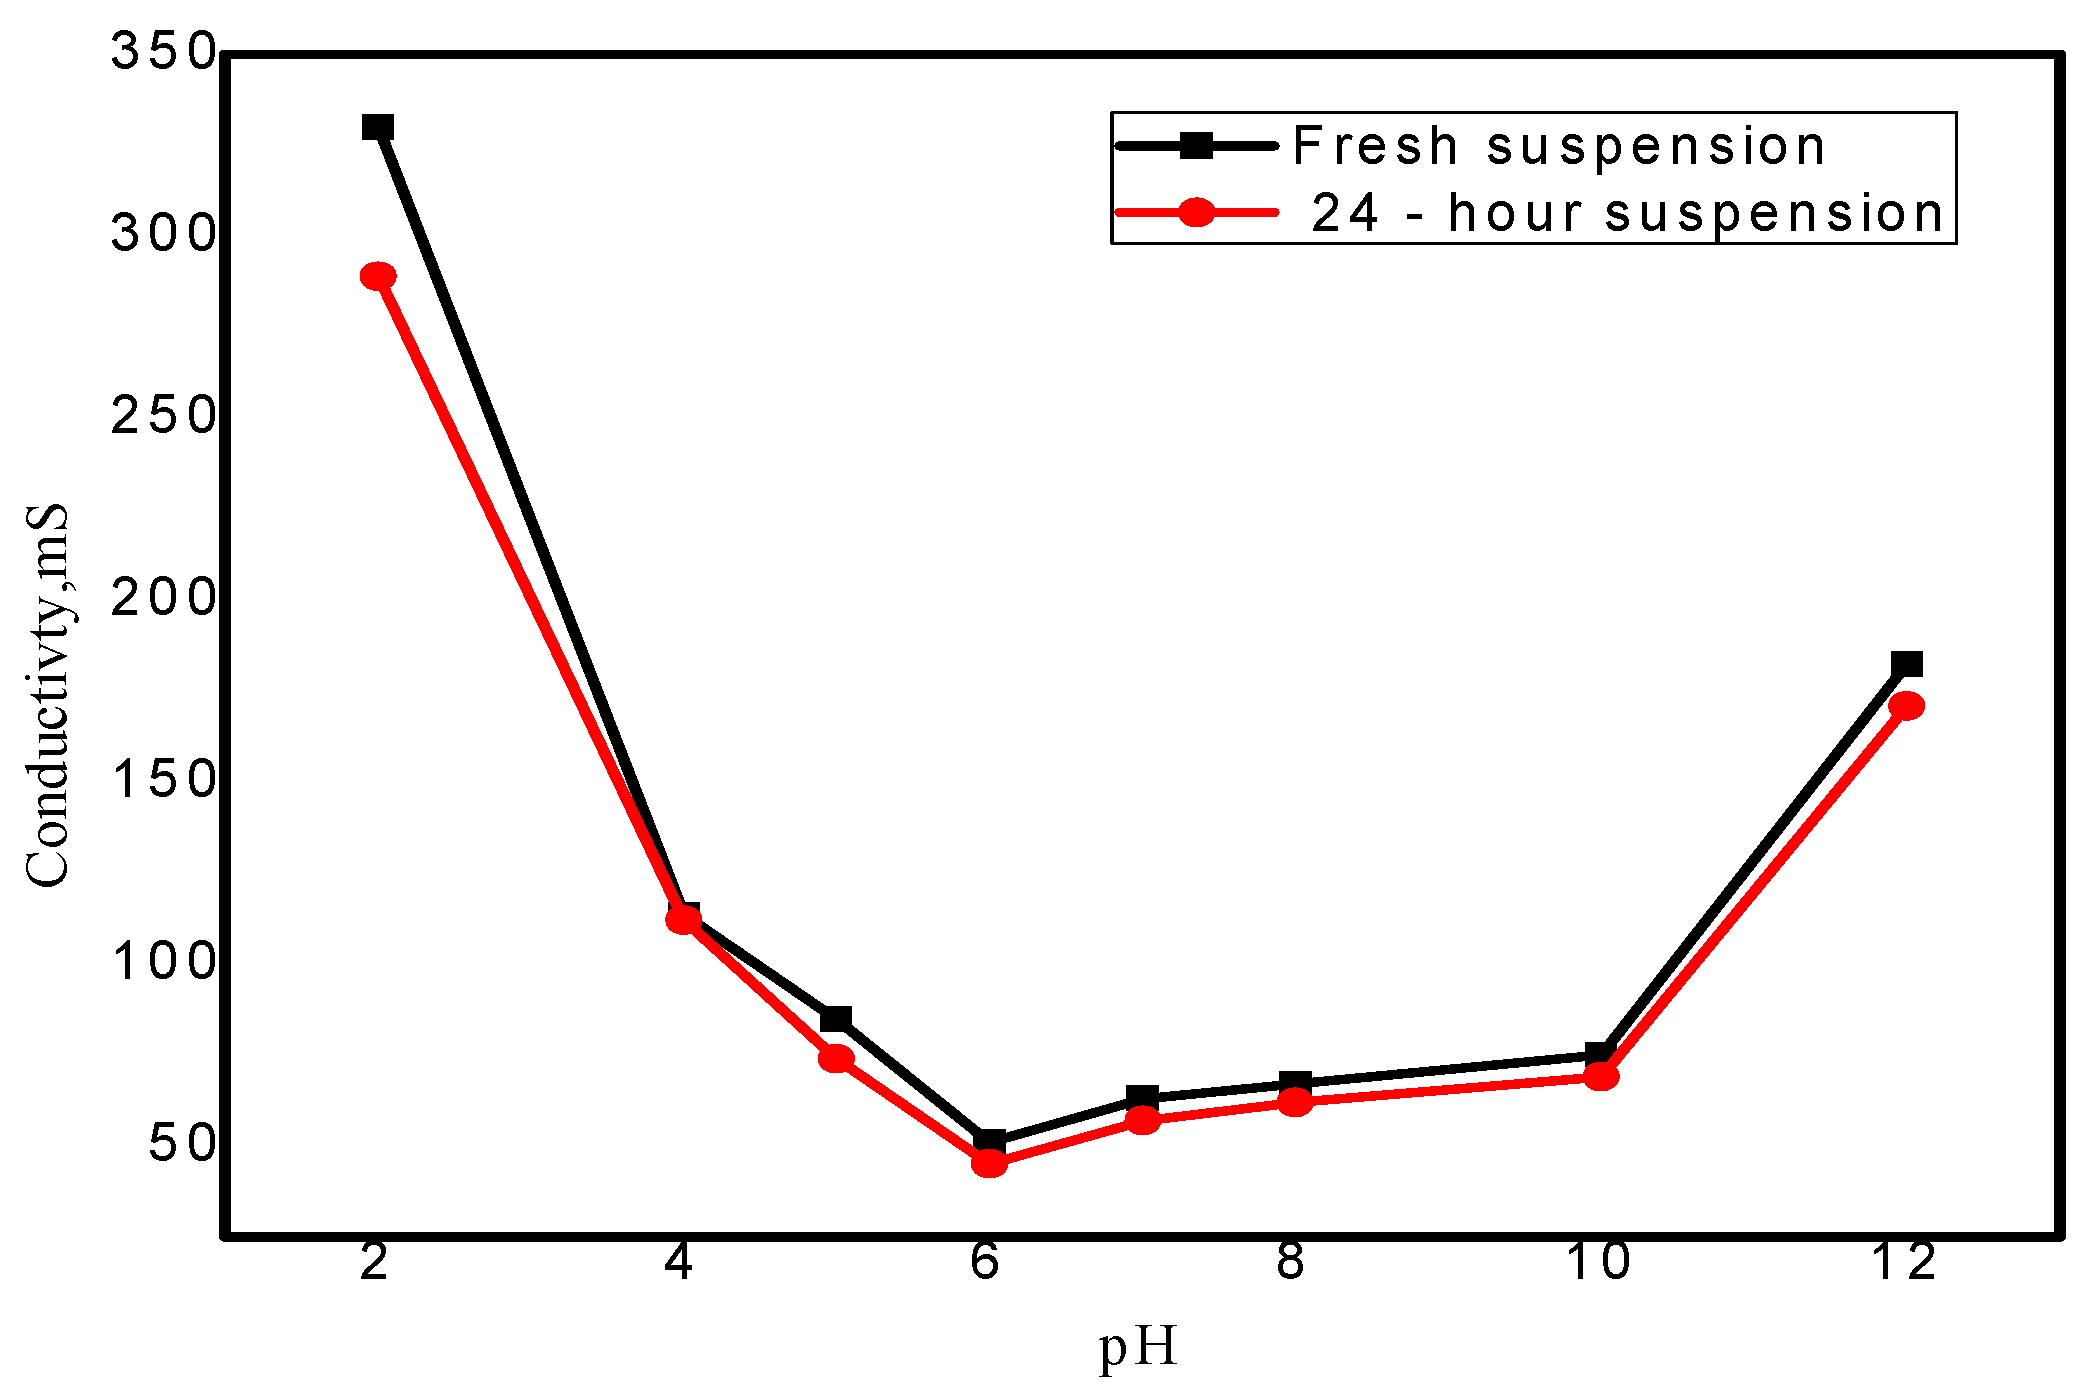
Figure 8.
Thermodynamic factors for MB and CV dyes as function of temperature. A denotes MB; B denotes CV.
Figure 8.
Thermodynamic factors for MB and CV dyes as function of temperature. A denotes MB; B denotes CV.
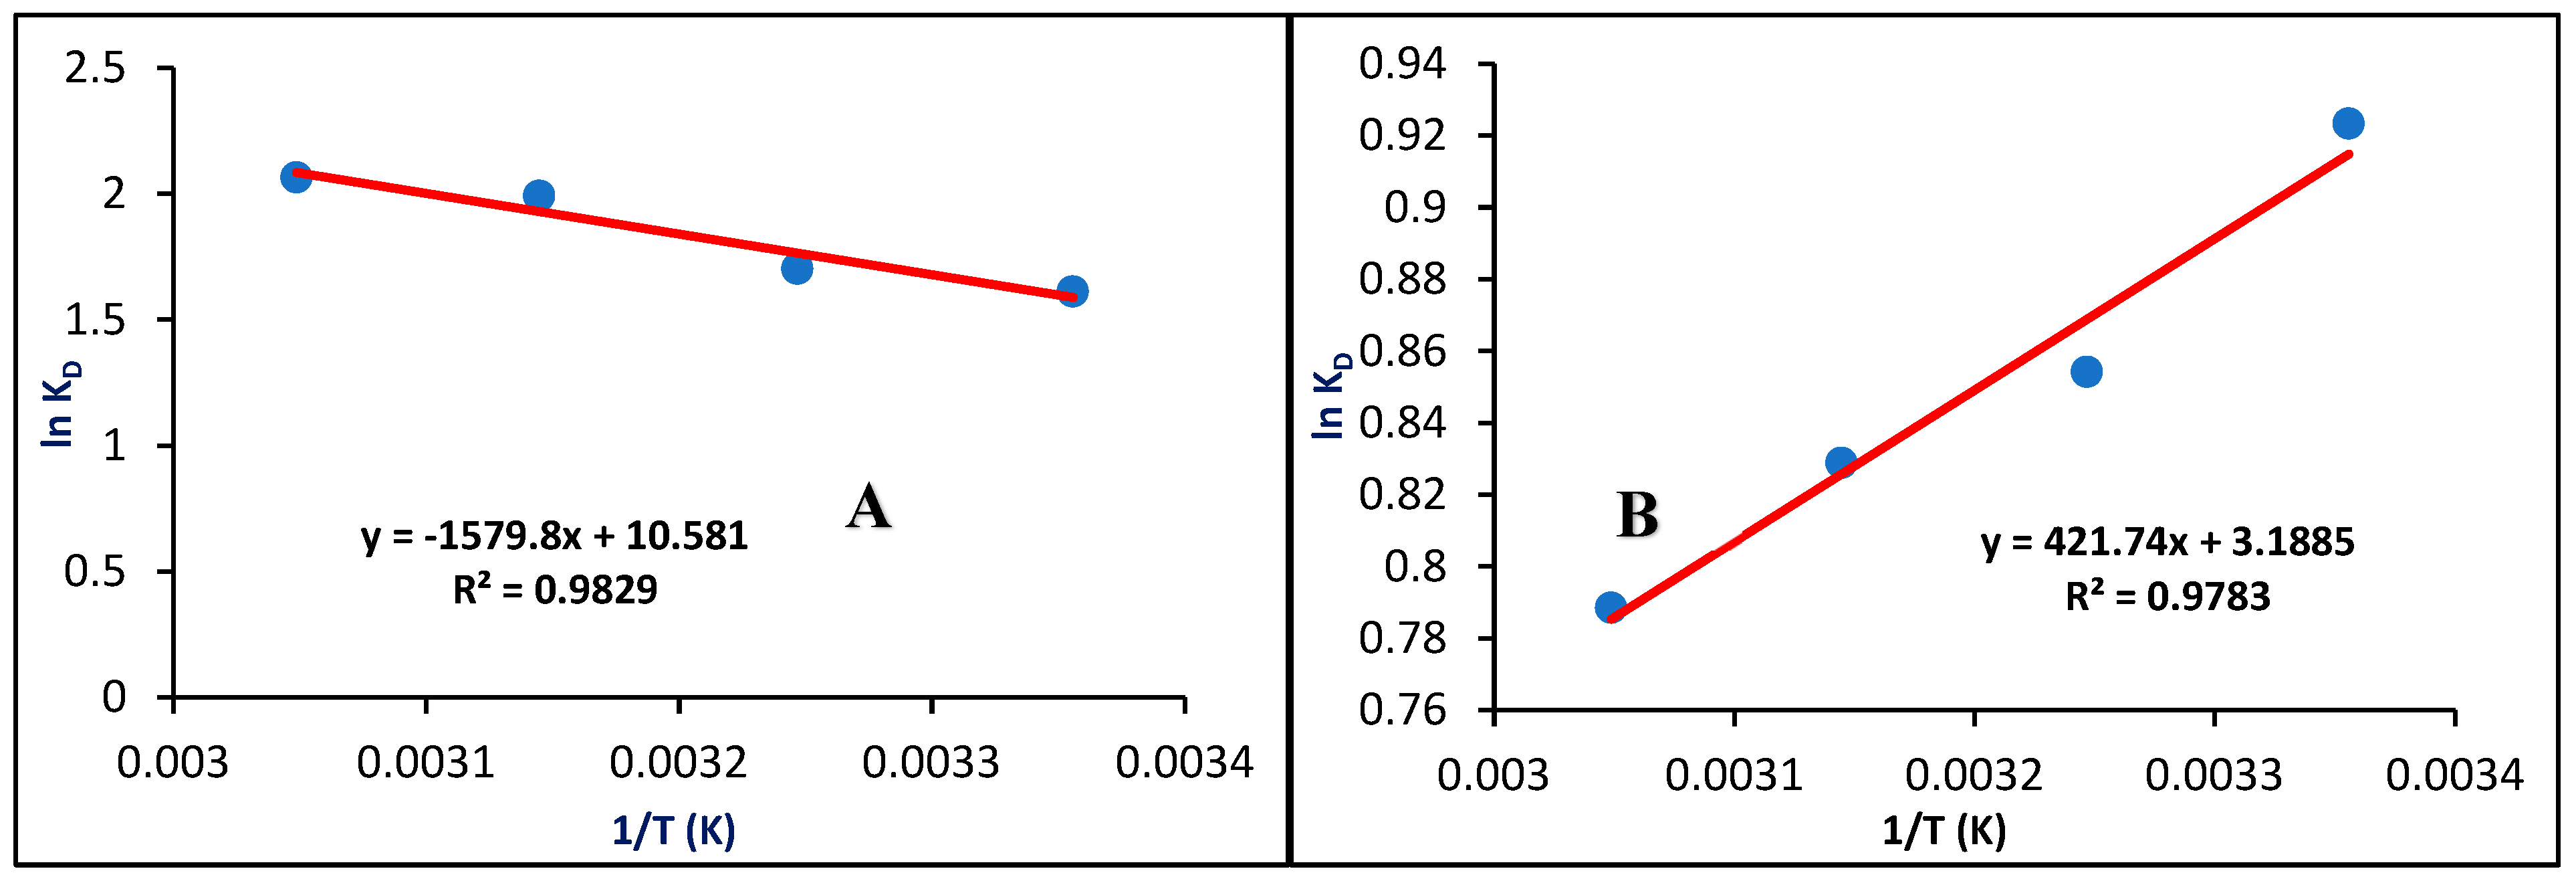
Figure 9.
The reusability of CG/NC.
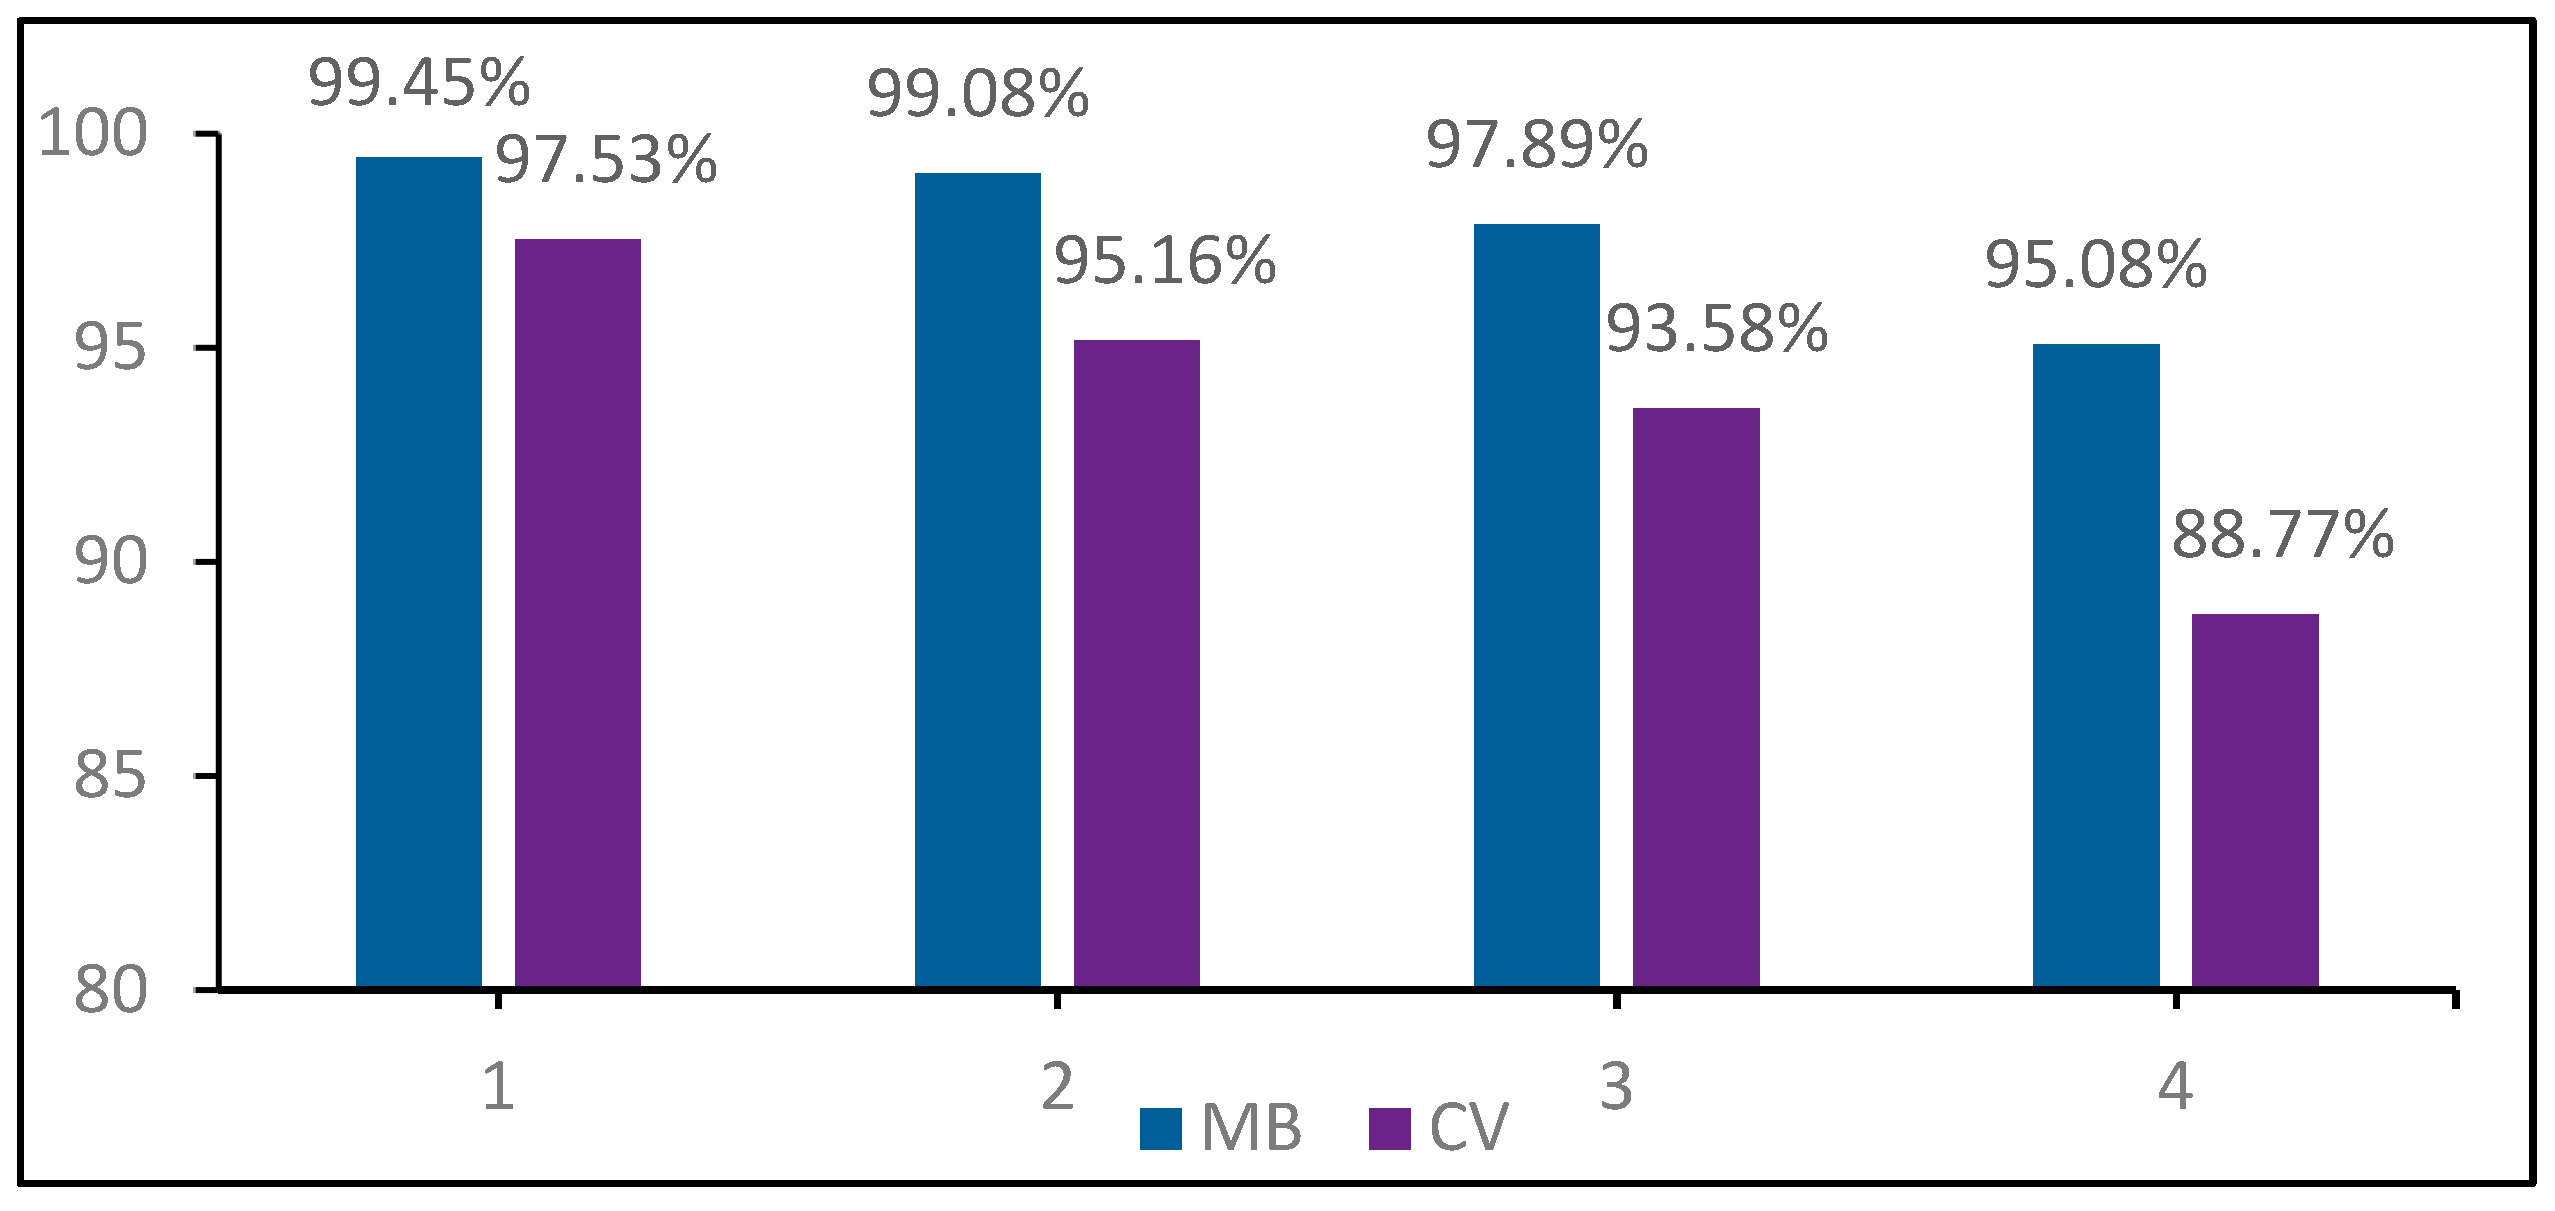

Table 1.
BET data for Clay, Gum Arabic, and CG/NC.
| Sample | Surface Area (m2/g) | Pore Volume (cm3/g) | Pore Size (Ao) |
| Clay | 14.34 | 0.003551 | 39.87 |
| Gum Arabic | 0.3835 | 0.00008181 | 18.85 |
| CG/NC | 46.91 | 0.0111 | 19.08 |
Table 2.
The optimization data for the removal efficiency of MB and CV dyes.
| Initialconcentration (mg/L) | Dosage CG/NC (g) | pH | Contact time (min) |
Temperature (oC) |
R (%) predicted |
R (%) experimentally |
||||
| MB CV |
50.00 47.90 |
0.30 0.29 |
7.00 7.00 |
7.00 3.80 |
24.00 50.00 |
99.15 99.00 |
97.31 96.40 |
|||
Table 3.
Thermodynamic parameters of the adsorption of MB and CV dyes.
| MB | |||
| T, K | ∆G° (kJ/mol) | ∆S° (J/mol) | ∆H° (kJ/mol) |
| 298 308 318 328 |
-3.991 -4.356 -5.266 -5.631 |
88.01 |
13.13 |
| CV | |||
| T, K | ∆G° (kJ/mol) | ∆S° (J/mol) | ∆H° (kJ/mol) |
| 298 308 318 328 |
-2.288 -2.187 -2.191 -2.150 |
26.51 |
-3.50 |
Table 4.
Parameters of the adsorption isotherm models.
| Langmuir Isotherm | |||
| qmax (mg/g) | KL (L/g) | R2 | |
| MB CV |
66.7 52.9 |
0.159 0.298 |
0.991 0.981 |
| Freundlich Isotherm | |||
| n | Kf (mg/g)/(mg/L) | R2 | |
| MB CV |
1.89 2.76 |
10.1 16.5 |
0.975 0.880 |
| Temkin Isotherm | |||
| A(L/g) | B | R2 | |
| MB CV |
2.5 2.6 |
12.08 28.55 |
0.929 0.975 |
Table 5.
Kinetic data of the adsorption of MB and CV dyes onto CG/NC.
| Pseudo-first-order | |||||
| qe (mg/g) | k1 (min-1) | R2 | |||
| MB CV |
5.694 4.028 |
0.000137 0.00035 |
0.701 0.323 |
||
| Pseudo-second-order | |||||
| qe (mg/g) | k2 (mg/g.min) | R2 | |||
| MB CV |
5.694 4.028 |
1.1876 1.9537 |
0.997 0.999 |
||
| Intra-particle diffusion | |||||
| kid (mg/g.min) | I | R2 | |||
| MB CV |
6.228 4.111 |
39.725 12.827 |
0.671 0.511 |
||
| Elovich | |||||
| α | β | R2 | |||
| MB CV |
3.40 x 1029 3.16 x 10⁶ |
10.98 5.89 |
0.704 0.849 |
||
Table 6.
Comparison of optimal conditions and efficiency for different adsorbents.
| Adsorbent | Adsorbate | Isotherm model | Optimum pH | Kinetic model | enthalpy | qmax (mg/g) | Adsorbent mass (g) | Ref. |
| (RT) | MB | Langmuir | 6-7 | Second order | - | 147 | 0.50 | [47] |
| (Fe3O4/Mt) | MB | Langmuir | 7.37 | Second order | - | 106.38 | 0.5 | [11] |
| (IRKC) | MB | Langmuir- Freundlich | 8 | First order | - | 240.4 | 0.1 | [38] |
| PANI-NiFe2O4 | MB | Langmuir | 9 | Second order | - | 6.65 | 8 | [10] |
| (WHS) | MB | Langmuir | 7 | Second order | endothermic | 21.50 | 1 | [6] |
| (LCF) | CV | Langmuir- Freundlich | 7 | First order | exothermic | 34.12 | 0.25 | [48] |
| Khulays natural bentonite | CV | Langmuir- Freundlich | 5.3 | Second order | endothermic | 263 | 0.25 | [49] |
| (NAJL) | CV | Langmuir | 9 | First order | exothermic | 315.2 | 0.02 | [18] |
| (OLP) | CV | Langmuir | 7.5 | Second order | - | 181.1 | 0.1 | [50] |
| (AS) | CV | Langmuir | 6 | Second order | endothermic | 12.2 | 0.5 | [17] |
| CG/NC | MB | Langmuir | 7 | Second order | endothermic | 66.7 | 0.20 | this study |
| CG/NC | CV | Langmuir | 7 | Second order | exothermic | 52.9 | 0.30 | this study |
Disclaimer/Publisher’s Note: The statements, opinions and data contained in all publications are solely those of the individual author(s) and contributor(s) and not of MDPI and/or the editor(s). MDPI and/or the editor(s) disclaim responsibility for any injury to people or property resulting from any ideas, methods, instructions or products referred to in the contennstructions or products referred to in the content. |
© 2025 by the authors. Licensee MDPI, Basel, Switzerland. This article is an open access article distributed under the terms and conditions of the Creative Commons Attribution (CC BY) license (http://creativecommons.org/licenses/by/4.0/).
Copyright: This open access article is published under a Creative Commons CC BY 4.0 license, which permit the free download, distribution, and reuse, provided that the author and preprint are cited in any reuse.


