
Submitted:
29 September 2024
Posted:
30 September 2024
You are already at the latest version
Abstract
A novel nanomaterial was synthesized using natural ilmenite sand via a simple precipitation method, and its ability to remove dyes in wastewater was evaluated using methylene blue (MB). The nanomaterial was synthesized by neutralizing the acid leachate obtained by Ilmenite sand digestion, followed by drying at 180 °C. It was characterized by X-ray diffractometry, Raman spectroscopy, transmission electron microscopy, scanning electron microscopy, X-ray photoelectron spectroscopy, X-ray fluorescence spectroscopy, and Brunauer, Emmett, and Teller surface area analyzer. Synthesized nanoparticles are a composite of Fe3O4/Fe2TiO5/TiO2 with a surface area of 292.18 m2/g pore size distribution with an average pore size of 1.53 nm and pore volume of 0.202 cc/g. The maximum adsorption capacity of 24.573 mg/g was obtained at pH 10 for 10 mg of the nanomaterial used with 10 mg/L MB. Dye concentration was varied in the range of 10-25 mg/L with 5 mg/L increment where equilibrium adsorption capacities of 24.573, 31.012, 41.443, and 52.259 mg/g were obtained with 10, 15, 20, and 25 mg/L, respectively. The adsorbent dosage varied as 10, 25, 45, 65, and 100 mg, and the highest adsorbent capacity of 24.573 mg/g was obtained with 10 mg of the adsorbent and 10 mg/L MB. Adsorption of MB followed pseudo-second-order kinetics with an adsorption capacity of 24.863 mg/g. The intraparticle diffusion model revealed that the MB adsorb in three different stages, and corresponding intra-particle diffusion constants of 1.50, 2.71, 3.38, and 4.41 g/mg min1/2 were calculated with the above dye concentrations. Adsorption followed the Langmuir isotherm model. Thermodynamics parameters ΔG, ΔH, and ΔS were calculated to be -27.5521 kJ/mol at 298 K, 2.571 kJ/mol, and 0.101 kJ/mol, respectively, in the experiments carried out varying the temperature. Regeneration studies of the adsorbent were carried out for five cycles, indicating some activity loss after each cycle.
Keywords:
Dyes
; Elimination
; Chemisorption
; Remediation
; Wastewater
1. Introduction
The textile, paper, printing, paint, cosmetics, and plastic sectors utilize synthetic organic dyes extensively, and because of their widespread application and large-scale manufacturing, they are generally available [1,2]. One of the main sources of synthetic dyes discharged into water reservoirs is the textile sector [3]. Globally, some 7,107 tons of synthetic dyes are generated yearly, and the textile industry uses over 10,000 tons of these dyes [4]. Dyes can obstruct sunlight’s ability to penetrate water bodies, hindering the growth and reproduction of bacteria that break down dyes. Dyes are thereby rendered non-biodegradable in water [5]. Additionally, textile dyes harm aquatic environments by lowering their aesthetic value and raising the need for chemical and biological oxygen. This may hinder plant growth and photosynthesis, seep into the food chain, and build up toxicity, mutagenicity, and carcinogenicity [3]. 80% of the dyes released to the water reservoirs are azo dyes [6]. Azo dyes’ capacity to yield vivid, bright colors makes them popular in the food, textile, and pharmaceutical industries. They have aryl groups at both ends of azo groups, that alter the structure of human DNA and cause cancer [7]. An azo dye with a complicated aromatic structure, methylene blue is challenging for standard biological processes to break down [8].
Many physical, chemical, and biological approaches have been implemented to remove synthetic dyes from contaminated water [3]. Chemical methods such as coagulation/flocculation, advanced oxidation process, electrochemical processes, biological methods such as treatment by bacteria, fungi, and algae, and physical methods such as adsorption, irradiation, membrane filtration processes, ion exchange have been utilized to remove synthetic dyes from wastewater [3,9]. However, some of these methods have drawbacks such as high cost, low efficiency, accumulation of sludge leading to disposal problems, secondary pollution due to excessive chemical use etc. [10,11]. Adsorption is considered the most promising method of removing dyes from wastewater. It is efficient due to its simplicity, operational ease, high sensitivity to pollutants, low cost, and no harmful substances produced after adsorption and reusability several times [8]. The efficiency of the adsorption process can be optimized by varying conditions like pH, temperature, and contact time [7]. Many adsorbents have been employed to remove organic dyes from water, which include activated carbon, bio-sorbents, carbon-based nano-adsorbents, transition metal-based oxides, metal-organic framework, and polymer-based adsorbents, etc. [12,13,14]. Activated carbon is widely used to remove organic dyes from wastewater due to the large volume arising from micropore and mesopore volumes. However, blockage of the micropores of activated carbon by the bulky dye molecules limits the diffusion of macro dyes into the internal pore framework of activated carbon, restraining its usability [11]. Activated carbon is known to be prepared using many natural substances like saw dust [15], coconut pith [16], tea waste [17], peat [18] etc. Additionally, other natural-based adsorbents such as zeolites [19], clay minerals [20], chitosan [21], peat moss [22], rice husk [19], sugar cane [23], etc. have been effectively used to remove pollutants, including dyes, pharmaceuticals, pesticides, and fertilizers from wastewater.
In recent years, nanotechnology has given a great scope in synthesizing interested nanomaterials as viable alternatives to conventional wastewater treatment methods [20,21]. Nanomaterials are better counterparts to the bulk materials of typical materials in terms of physicochemical properties such as high surface area to volume ratio, high porosity, adjustable surface chemistry, short intraparticle diffusion length, resistance to temperature fluctuations, and wide pore size distribution [21,22,23]. Application of metal oxide nanomaterials, including Fe3O4, TiO2, ZnO, and nanocomposites, emerge as a promising new material for the treatment of wastewater because of its unique properties such as large surface area, high adsorption capacity, fast diffusion kinetics, specific affinity for various contaminants etc. [23]. However, nanostructured and nano-dispersed metal oxides can have a significant disadvantage in causing environmental contamination with nanoparticles. The use of metal oxide nanocomposites reduces the release of nanoparticles into the environment and minimizes the potential environmental contamination [24].
The present study is aimed at investigating the applicability of Fe3O4/Fe2TiO5/TiO2 nanocomposite fabricated from natural ilmenite sand for the removal of dyes. Further, here, we propose a new application for value addition to ilmenite sand. The applicability of the produced nanocomposite to remove MB from artificial wastewater is studied in detail.
2. Materials and Methods
2.1. Materials
Ilmenite was provided by Lanka Mineral Sands Ltd. Ammonia solution (25%) and hydrochloric acid (37%) were procured from Sigma Aldrich, USA. Methylene blue was supplied from Himedia Laboratories, India. All the chemicals were used without any further purification. All solutions were prepared using deionized water, with resistivity greater than 18.0 MΩ.cm (Millipore Milli-Q system).
2.2. Methods
2.2.1. Hydrochloric Acid Leaching of Ilmenite
After thoroughly cleaning all dust and debris with distilled water, the ilmenite sand was dried at 80 °C. Dried ilmenite sand (30 g) was well-grounded into a fine powder. It was digested for five hours at 110 °C in 200 mL of concentrated HCl while being stirred and refluxed. Layers of the leached slurry were allowed to form in a separation funnel, after which the liquid part was pipetted out. After that, 200 mL of concentrated HCl was added, and the mixture was refluxed for five hours while stirring at 110 °C. The above process was carried out thrice with 100 milliliters of concentrated hydrochloric acid.
2.2.2. Synthesis of Fe3O4/Fe2TiO5/TiO2 Based Nanocomposite
Leachates were combined, and concentrated NH3 was added until the pH of the solution reached 10. The product formed was filtered and washed with distilled water until the pH of the washings became neutral. The precipitate was dried at 180 °C for 12 hours.
2.3. Adsorption Study
All the adsorption experiments were performed in dark conditions. Initially, the optimum conditions (pH, dosage, concentration of methylene blue, time) for the adsorption of methylene blue dye were determined by adding a known mass of the nanocomposite to 50 mL of MB solutions and shaking at 150 rpm at room temperature. Aliquots were withdrawn at specified time intervals for 2 hours. The absorbance of methylene blue dyes was calculated by measuring the absorbance at 665 nm after necessary dilution using a UV-Vis spectrophotometer. The concentrations of 50 ml MB solutions were varied (10-25 ppm) and were kept in contact with 10 mg of nanocomposite at the optimum pH of 10 to study the kinetic studies. MB solutions (50 ml of 10 ppm) of varying temperatures in the range of 298 K-323 K were kept in contact with a 10 mg of nanocomposite at the optimum pH of 10 to study the isotherms related to thermodynamics. Solutions were shaken at 150 rpm. The equilibrium concentration of MB (Ce) and the amount of MB adsorbed at equilibrium (qe) were calculated.
The amount of MB absorbed at a time of t was calculated using the equation given below in equation 1 [3].
C0- Initial concentration of adsorbate (mg/L)
Ct- Concentration of adsorbate at time “t” (mg/L)
m= mass of adsorbent (mg)
V= volume of the adsorbate (L)
2.3.1. Finding the Point-of-Zero-Charge
The point of zero charge of the adsorbent was calculated by preparing a set of 0.1 M NaCl solutions, of which the pH was adjusted to 2, 4, 6, 8, 10, and 12 using 0.1 M HCl and 0.1 M NaOH. The solutions were shaken for 24 hours at 150 rpm in a Stuart orbital shaker at 25 °C, and the Δ pH (pH initial-pH final) values were calculated. The effect of pH on the adsorption of MB was determined by dispersing 50 mg of nanocomposite in 50 mL of 10 mg/L MB solution and agitating at 150 rpm in the pH range 2-12.
2.3.2. Effect of MB Concentration on Adsorption
The effect of MB concentration was determined by changing the concentration of MB to 10, 15, 20, and 25 mg/L using 50 mL of MB solution. The adsorption capacity of the nanocomposite was calculated using 10 mg of the adsorbate at an optimum pH of 10. Solutions were agitated at 150 rpm for 2 hours at 25 °C.
2.3.3. Effect of the Weight of the Adsorbent on Adsorption
The effect of the weight of the adsorbent was determined by varying the weight of the nanocomposite to 10, 25, 45, 65, and 100 mg, using 50 mL of 10 ppm MB solution at optimum pH 10. Solutions were agitated at 150 rpm for 2 hours at 25 °C.
2.3.4. Effect of Temperature on Adsorption
The effect of temperature was determined by varying the temperature at 298, 308, 318, and 323 K using 50 mL of 10 ppm MB solution at optimum pH 10. Solutions included flasks were shaken at 150 rpm for 2 hours at 25 °C.
2.4. Material Characterization
Using the D8 Advance Bruker system with Cu Kα (λ = 0.154 nm) radiation, the XRD analysis was carried out by changing the 2θ from 5 to 80° at a scan speed of 2 °/min. Raman spectra were acquired using a Bruker Senterra Raman microscope spectrophotometer. Thermo ScientificTM ESCALAB Xi+ X-ray Photoelectron Spectrometer (XPS) was employed to get the survey and higher resolution spectra of the produced nanocomposite. A High-Resolution Transmission Electron Microscope running at 200 kV (JEOL - JEM – 2100) was used to examine the samples’ morphology. A Carl Zeiss EVO 18 Research spectrophotometer was used to capture scanning electron microscope images. An X-ray analytical microscope (HORIBA Scientific XGT-5200) was used to measure X-ray fluorescence (XRF). N2 adsorption-desorption isotherms obtained at 77 K with a Quantachrome equipment were used to calculate the Brunauer-Emmet-Teller (BET) surface area, pore volume, and radius. A Shimadzu UV-1990 double beam UV-visible spectrophotometer was utilized to test the absorbance of MB samples.
3. Results and Discussion
3.1. XRF Analysis
The chemical composition of the acid-leached ilmenite is tabulated in Table 1. XRF analysis revealed that acid-leached ilmenite contained 68.30% of Fe and 26.05% of Ti. Additionally, Al, Si, Ca, Cr, Mn and Zn were also present in minor quantities as those elements are present in the ilmenite sand[25]. This suggests that the metal ions in minor quantities have been extracted to the acid leachate and precipitated while the pH was increased.
3.2. XRD and Raman Analysis
The XRD pattern was collected to determine the crystal structure of the synthesized nanoparticles (Figure 1). The diffraction peaks at 30.39°, 35.79°, 57.55°, and 63.17° are ascribed to the (220), (311), (400), and (422) crystalline planes of octahedral Fe3O4 with the interlayer distances 0.29 nm, 0.25 nm, 0.16 nm, 0.14 nm, respectively (JCPDS card No. 41-1432, 89-4319)[26]. XRD patterns of pure TiO2 and Fe3O4 were referred for comparison with the obtained XRD pattern of the nanocomposite[27,28]. The crystallite size of Fe3O4 was calculated to be 5.91 nm using the highest intense peak corresponding to (311) atomic plane. Parameters related to the crystalline structure are given in Table 2.
Synthesized nanocomposites were investigated by Raman spectroscopy to study the crystallography (Figure 2). Raman bands at 199, 217, 292, 334, 654 cm-1 reveal the presence of Fe2TiO5 [25]. The Raman bands corresponding to TiO2 and Fe3O4 were not apparent due to the low amount of each compound present in the total composite, which could be below the detection limit.
3.3. XPS Analysis
Utilizing X-ray photoelectron spectroscopy (XPS), the surface chemical states of the produced nanocomposites were investigated. The survey spectrum of the nanocomposite and the higher resolution spectra of Ti 2p, Fe 2p, O 1s, and C 1s are displayed in Figure 3. The sample charging effect was corrected, taking the binding energy of sp2 hybridized C=C as 284.6 eV. Three primary peaks, centered at 284.5, 285.9, and 289.1 eV, were identified in the higher resolution spectra of C 1s (Figure 3(a)). These peaks are attributed to C = C, C-O, and O=C-O bonds, respectively [26]. Five peaks were extracted from the higher resolution spectrum of Ti 2p (Figure 3(b)). The Ti4+ in TiO2 (2p3/2) is responsible for the peak at 458.6 eV, and the Ti4+ in Fe2TiO5 of the same composite is responsible for the peak at 459.9 eV. The 2p1/2 of TiO2 and Fe2TiO5 are represented by peaks at 464.3 and 465.6 eV, respectively. The satellite feature of Ti4+ is responsible for the peak at 472.2 eV [29]. The core-level spectrum of Fe 2p (Figure 3(c)) has been fitted to two satellite peaks at 733.9 and 719.7 eV and three major peaks at 725.5, 714.7, and 711.9 eV. Fe 2p3/2 of Fe2+ of Fe3O4 is responsible for the lowest binding energy peak at 711.9 eV, with a matching satellite at 719.7 eV. Fe3+ is responsible for the peak at 714.7 eV. At 725.5 eV, the Fe 2p1/2 of the Fe3+ tetrahedral species was seen. The peak at 728.8 eV is a shake-up peak. Consequently, it is clear that both the Fe2+ and Fe3+ oxidation states of iron are present in the composite [26]. The as-synthesized composite’s higher resolution O 1s spectra (Figure 3(d)) has been fitted into two peaks with binding energies of 530.2 and 531.5 eV, which are attributable to the surface OH and O2− of the Fe3+, Fe2+, and Ti4+ oxides, respectively [26].
3.4. Morphological Analysis
SEM images were attained to study the morphology of the synthesized nanoparticles, and the TEM images were obtained to study the morphology in detail at the nanoscale (Figure 4(a)). The SEM images of the nanocomposite reveal the presence of agglomerated spherical and irregular particles. They have not been evenly distributed but oriented in several clumps. Consistent with the SEM image, the bright field TEM image shows the presence of small, spherical, and irregularly shaped agglomerated nanoparticles. Additionally, irregularly shaped bigger nanoparticles are present among the small nanoparticles, as exhibited in Figure 4(b). The higher resolution TEM image shown in Figure 4(c) exhibits the atomic layer arrangement of the (101) plane of Fe2TiO5, which is represented by the interlayer distance of 0.34 nm and the atomic plane arrangement of the (220) plane of TiO2 (anatase) is indicated by the interlayer distance of 0.28 nm[25,30]. Further, the presence of (220) and (311) atomic planes of Fe3O4 are shown by the interlayer distances of 0.29 and 0.25 nm, respectively (Figure 4(d))[31]. All the interlayer distances calculated by the HRTEM images are consistent with the interplanar distances calculated by the XRD data.
3.5. BET and BJH Analysis
The specific surface area (SBET), average pore size, and pore volume (Vpore) were calculated using Burnauer-Emmett-Teller (BET) theory, and pore size distribution was obtained from the desorption branch of Barrett-Joyner-Halenda (BJH) pore size distribution curve and values are tabulated in Table 3. The nitrogen adsorption-desorption isotherm and the pore size distribution curve of Fe3O4/Fe2TiO5/TiO2 nanocomposite are shown in Figure 5 (a and b). Nanocomposite shows a type (iv) isotherm with H1 hysteresis loop as defined by IUPAC.
V= Volume of gas adsorbed at pressure “P” and temperature “T”
P0= Saturated vapour pressure
nm= Specific monolayer capacity
E1= Heat of adsorption of gas in the formation of monolayer
EL= Heat of liquefaction of gas
R= Universal gas constant (8.314 Jmol-1K-1)
T= temperature
The constant C in the equation is related to the affinity between the nanocomposite and dye molecules [33]. The constant C reported for the nanocomposite synthesized in this work is 94.309, which indicates a comparatively high affinity between the adsorbate and the adsorbent.
3.6. Adsorption Study
Methylene blue uptake by Fe3O4/Fe2TiO5/TiO2 nanocomposite was investigated. To determine the point of zero charge (PZC) of the adsorbents, a set of 0.1 M NaCl solutions was prepared, and the pH was adjusted to 2, 4, 6, 8, 10, and 12 using 0.1 M HCl and 0.1 M NaOH. The solutions were shaken for 24 hours and the Δ pH (pH initial-pH final) values were calculated (Figure 6 (a)). The pH of the point of zero charge of the nanocomposite was found to be 4.8. When pH < pHPZC, the adsorbent is positively charged due to the adsorption of H+, and when pH > pHPZC, the adsorbent is negatively charged due to the desorption of OH- [34].
To study the effect of pH, 50 mg of nanocomposite was dispersed in 50 mL of 10 mg/L MB and agitated at 150 rpm in the pH range 2-12 (Figure 6 (b)). There was no adsorption of MB onto nanocomposite at pH=2, and adsorption capacity increased gradually when changing the pH from 2 to 10 and reached the maximum adsorption capacity (7.077 mg/g) at pH =10. This is due to the electrostatic interactions between the cationic dye MB and the negatively charged surface of the Fe3O4/Fe2TiO5/TiO2 nanocomposite [35]. When pH < pHPZC, electrostatic repulsion between the positively charged adsorbent and cationic MB, decreases with increasing pH of the MB solution. Low adsorption capacities were observed at low pH values as the negatively charged sites of the nanocomposite were occupied by H+, limiting the surface available for MB. Increasing the pH from 2 to 10 causes the surface of the nanocomposite to become available for the adsorption of MB due to the decrease in H+ concentration. When pH > pHPZC, negatively charged adsorbent favors the adsorption of cationic MB, through electrostatic attractions [36]. A shift of λmax of MB from 665 nm to 615 nm is observed at pH 12 due to the dimerization of MB. A sudden drastic drop to zero adsorption capacity of MB onto nanocomposite was observed at pH=12. This may be due to the inability of the dimerized molecules of MB to access the pore structure of the nanocomposite due to the steric hindrance.
The concentration of 50 mL of MB was varied in the range of 10-25 mg/L, and the adsorption capacity of the nanocomposite was studied using 10 mg of the adsorbate at optimum pH 10 (Figure 7(a)). The adsorbent dosage was varied in the range of 10-100 mg, and the adsorption capacity of the nanocomposite was studied using 50 mL of 10 mg/L MB solution at optimum pH 10 (Figure 7(b)). As seen in Figures 7(a) and 7(b), the absorption of MB by the nanocomposite increased quickly in the first five minutes and then progressively until equilibrium was reached at 45 minutes, at all MB concentrations (10-25 mg/L) and adsorbent dosages (10-100 mg) examined. For 25 mg/L MB at different MB concentrations, a maximum adsorption capacity of 52.259 mg/g was recorded, while for 10 mg of nanocomposite at different adsorbent dosages, it was 24.573 mg/g.
The change in adsorption capacity with adsorbent dosage is depicted in Figure 8. The nanocomposite exhibited the maximum adsorption capacity of 24.573 mg/g when 10 mg was used. It was found that the equilibrium adsorption capacity decreases with increasing adsorbent dosage. This is because, as the dosage of the adsorbent increases, the same number of MB molecules adsorb to an increasing number of accessible adsorption sites.
3.7. Adsorption Kinetics
Since the adsorption rate and mechanism can be understood, the study of adsorption kinetics is crucial. The intra-particle diffusion models, pseudo-first-order, and pseudo-second-order models were used to examine the adsorption kinetics of the nanocomposite [37].
Based on the values of the linear regression correlation coefficients found for the adsorption kinetic models, the best-fit model was chosen.
The linear form of the pseudo first-order model described by Lagergren et al. is shown in Equation 4 [37].
where,
qe- Amount of dye adsorbed at equilibrium per unit mass of adsorbent (mg/g)
qt- Amount of dye adsorbed at time t per unit mass of adsorbent (mg/g)
t- Time (min)
k1- Adsorption rate constant (g/min * mg)
Generally applicable in the early adsorption phases, the Lagergren pseudo-first-order model posits that the adsorption rate is directly proportional to the difference in saturation concentration and the amount of solid uptake with time [38]. Sometimes, the Lagergren pseudo-first-order model does not fit the entire adsorption time but is mostly applicable during the first 20-30 minutes of the adsorption process [37]. It is predicated on the idea that the physical adsorption process, which is the rate-limiting stage, is caused by hydrogen bonding, π–π interactions, and van der Waals forces between the adsorbent and the adsorbate [39].
Figure 9 (a) reveals the pseudo-first-order kinetic model for the adsorption of MB (10 mg/L-25 mg/L) to 10 mg of Fe3O4/Fe2TiO5/TiO2 nanocomposite (at pH 10) at 298 K. The calculated qe values, first-order rate constants, and the corresponding linear regression correlation coefficients ( ) are tabulated in Table 4. The linear regression correlation coefficient values that were obtained do not perfectly fit the pseudo-first order kinetic model. Therefore, it can be concluded that the adsorption of MB to Fe3O4/Fe2TiO5/TiO2 nanocomposite does not follow the pseudo-first-order kinetic model.
The linear form of the pseudo-second-order model proposed by Ho and McKay is shown in Equation 5.
where,
qe- Amount of dye adsorbed at equilibrium per unit mass of adsorbent (mg/g)
qt- Amount of dye adsorbed at time t per unit mass of adsorbent (mg/g)
t- Time (min)
k2 –Adsorption rate constant (g/min * mg)
The pseudo-second-order kinetic model forecasts behavior across the whole adsorption range and is predicated on the assumption that chemisorption is the rate-limiting process [37].
Figure 9 (b) shows the pseudo-second-order kinetic model for the adsorption of MB (10 mg/L-25 mg/L) to 10 mg of Fe3O4/Fe2TiO5/TiO2 nanocomposite (at pH 10) at 298 K. The calculated qe values, second-order rate constants, and the corresponding linear regression correlation coefficients ( ) are tabulated in Table 4. The linear regression correlation coefficient values obtained for the pseudo-second-order model for all the concentrations tested were greater than 0.999. Linear pseudo-second-order kinetic model plots show good agreement between experimental qe and calculated qe values. The predicted value of qe obtained from the pseudo-second-order kinetic model was closer to the measured value than that obtained by the pseudo-first-order kinetics equation. Therefore, it is evident that the adsorption of MB to Fe3O4/Fe2TiO5/TiO2 follows a pseudo-second order. This model further describes that the adsorbates adsorb to the adsorbents via chemisorption [40].
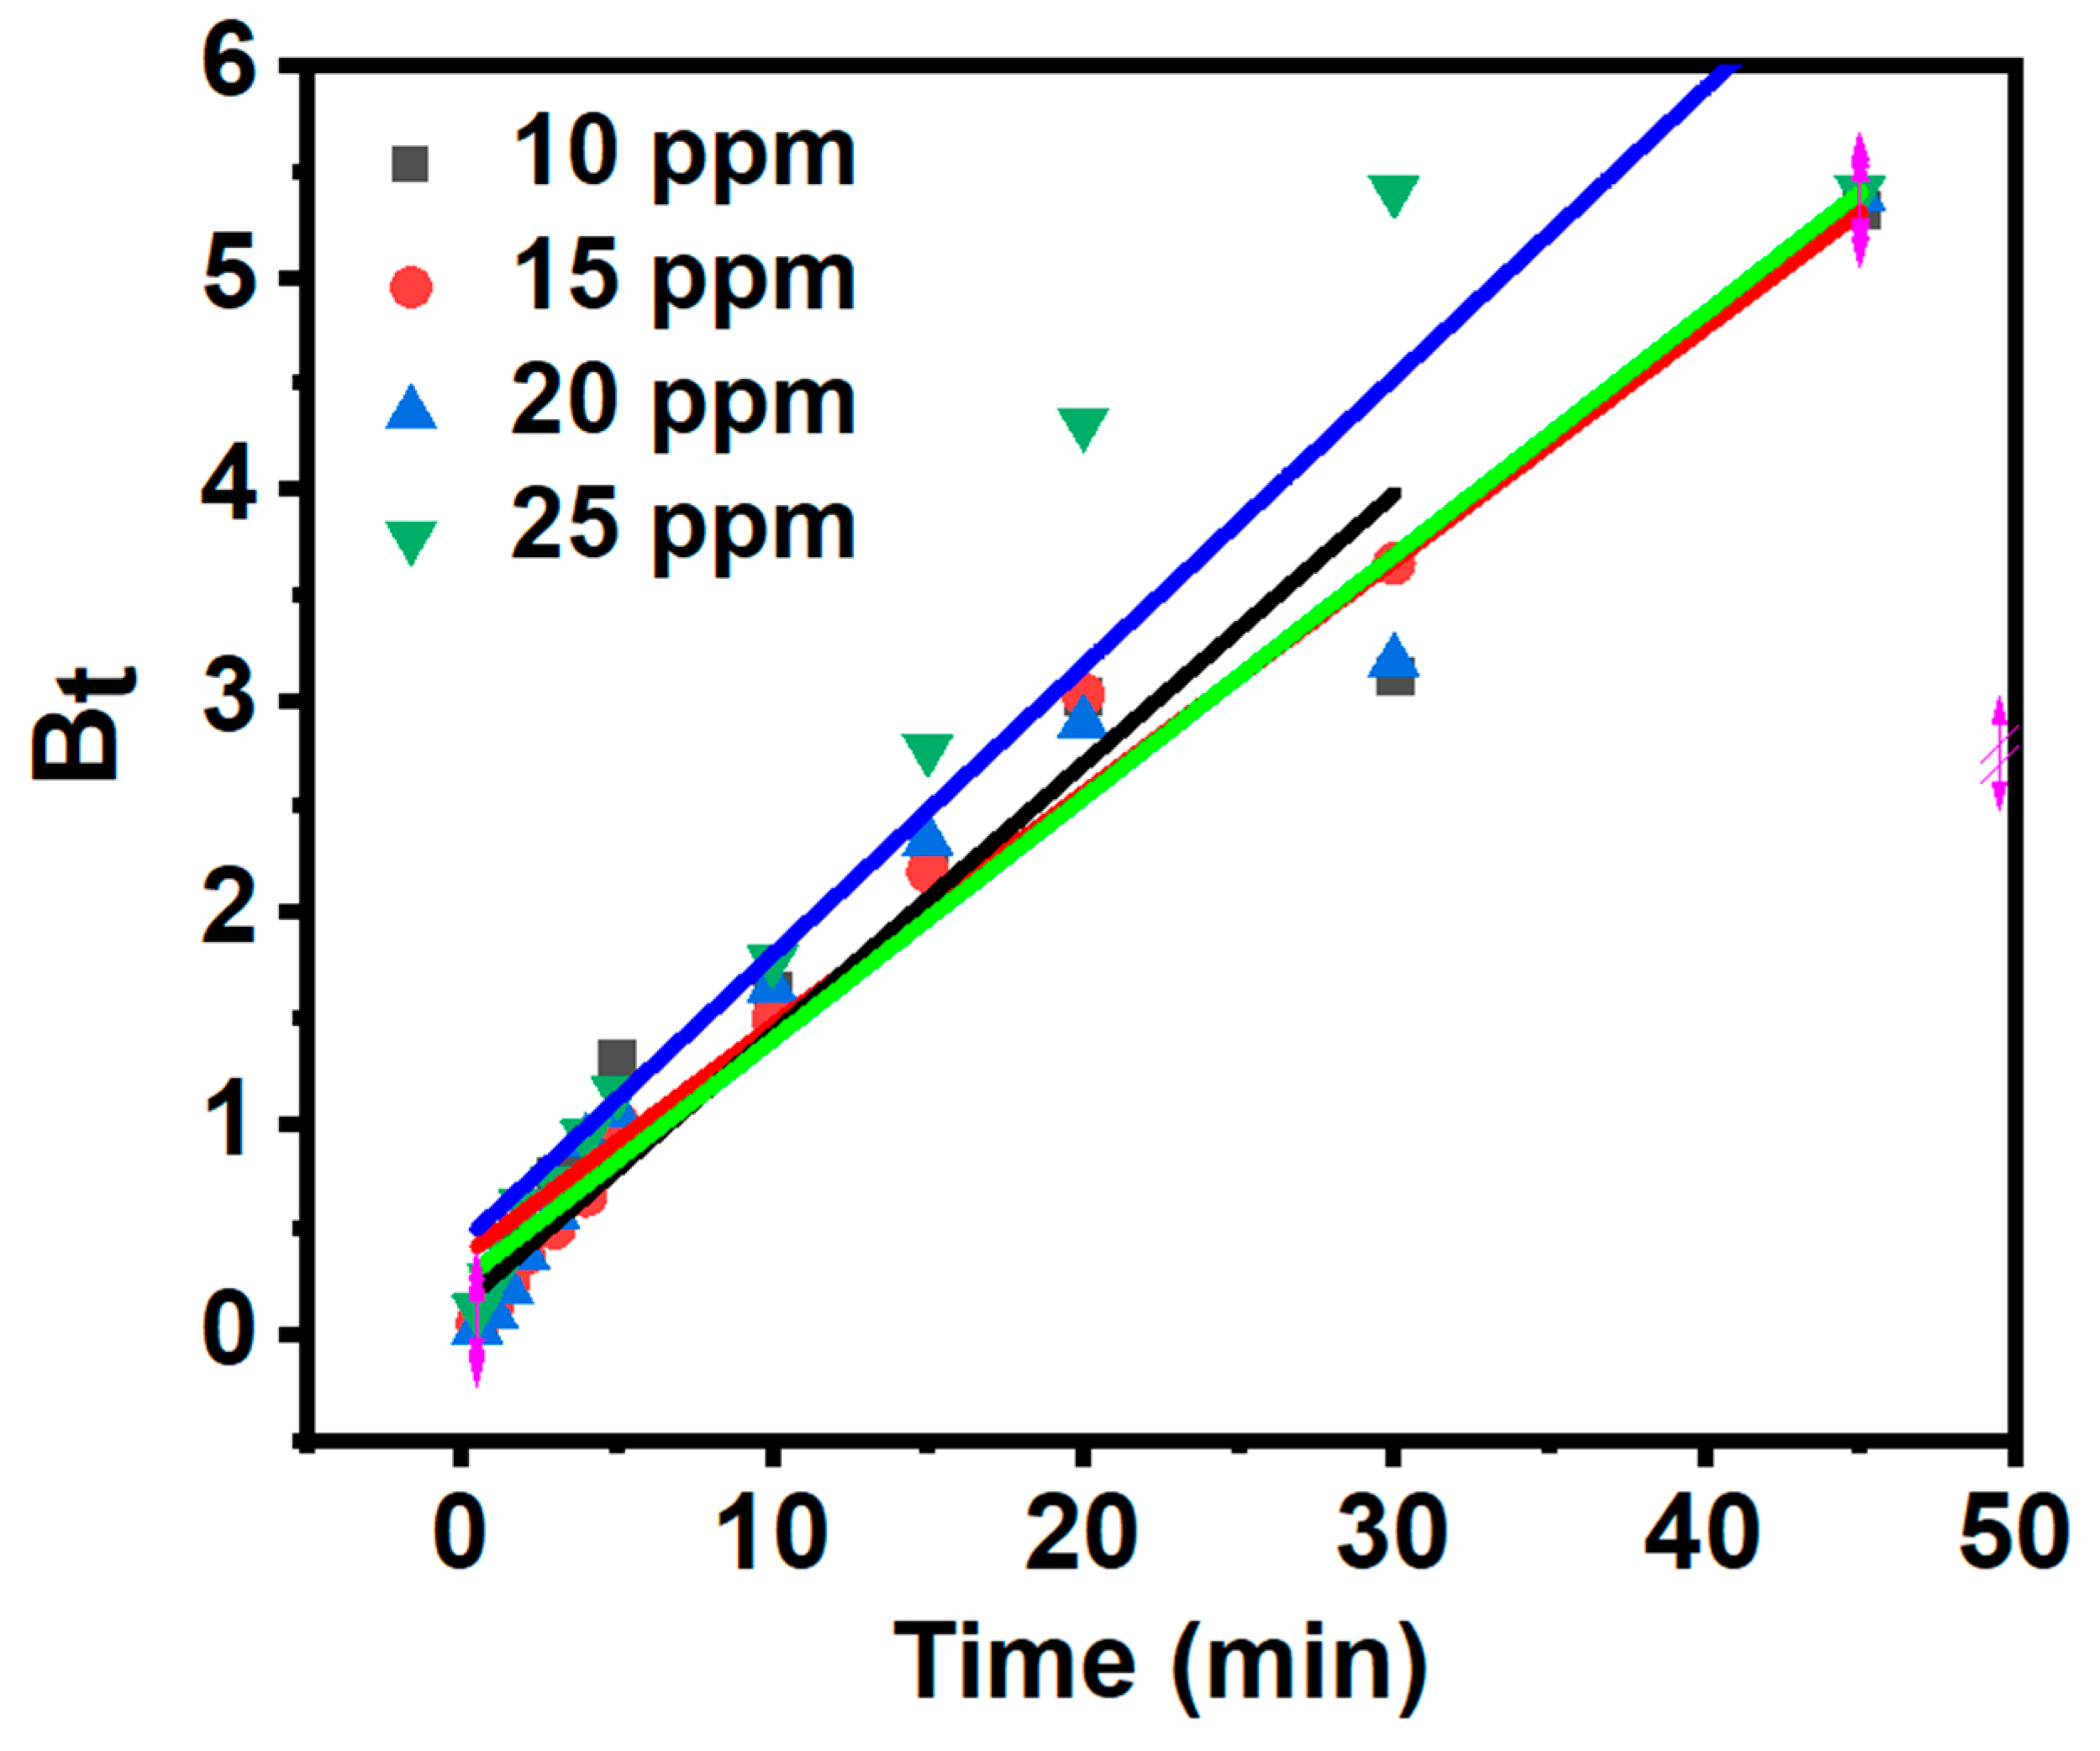
The adsorption curves were fitted to the Boyd diffusion and intraparticle diffusion models (Eq. (6)) in order to further investigate the parameters restricting the adsorption process (Eq (7)-(9))[41,42,43].
where,
qt = adsorption capacity at time “t” (mg/g)
kid = intraparticle diffusion rate constant (mg/g min)
t = time (min)
C = constant related to the thickness of the boundary layer (mg/g)
qe- Amount of dye adsorbed at equilibrium per unit mass of adsorbent (mg/g)
F= Fraction of the dye adsorbed at time “t”
Bt= Mathematical function of F
The only rate-limiting phase in Weber’s intraparticle diffusion model is intraparticle diffusion if the plot of qt vs t1/2 results in a linear graph that crosses the origin [44]. The fact that the intraparticle diffusion model’s plot did not pass through the origin, however, indicates that additional rate-limiting steps may be involved in MB adsorption in addition to intraparticle diffusion [45]. Figure 10 shows that when the intraparticle diffusion equation is applied, adsorption can be divided into three stages: rapid adsorption stage (0-5 min), slow adsorption stage (5-20 min), and equilibrium stage (20-120 min). These three stages correspond to the external surface adsorption, intraparticle diffusion and equilibrium phase, respectively [46]. The calculated rate constants (ki), intercept values (C), and the corresponding linear regression correlation coefficients ( ) are given in Table 5.
According to the data in Table 5, calculated rate constants and intercept values followed the order ki,1˃ ki,2˃ ki,3 and C1˂ C2˂ C3 for all the concentrations of MB considered. The high value of ki,1 compared to ki,2 indicates that the transport of MB from the medium to the surface of the nanocomposite occurred quickly compared to the diffusion of MB into the inner matrix of the nanocomposite [45]. A higher Ci number denotes a stronger influence from the boundary layer. The value of Ci represents the thickness of the boundary layer [47].
The rate-controlling phase of the adsorption process was identified by further fitting the experimental data with the Boyd diffusion model. If the plot is linear or nonlinear and does not pass through the origin, the rate-limiting step would be a chemical reaction regulated by film diffusion. The rate-controlling step would be intraparticle diffusion if the plot is linear and passes through the origin [45]. The correlation coefficients for linearity (R2) for the Boyd plots obtained for different MB concentrations of 10, 15, 20, and 25 ppm are 0.964, 0.977, 0.969 and 0.911, respectively. As a result, one can interpret every plot as linear. They do not, however, proceed to the origin, suggesting that chemical processes or film diffusion control how MB is adsorbed to the nanocomposite [48]. The results of the kinetic and diffusion models indicate that the rate-limiting step is chemisorption and multiple factors control adsorption.
Figure 11.
Boyd diffusion model for adsorption of MB to Fe3O4/Fe2TiO5/TiO2 nanocomposite.
The Elovich model can be explained by equation 10 [49,50]. Elovich model suggests that chemisorption is the mechanism that controls the rate of adsorption [49]. Elovich kinetic model parameters for the adsorption of MB onto Fe3O4/Fe2TiO5/TiO2 are given in Table 6.
qt= adsorption capacity at time “t” (mg/g)
α= initial adsorption rate (mg/g min)
β= desorption constant (g/mg)
t= time (min)

Table 6.
Elovich kinetic model parameters for the adsorption of MB onto Fe3O4/Fe2TiO5/TiO2 nanocomposite.
Table 6.
Elovich kinetic model parameters for the adsorption of MB onto Fe3O4/Fe2TiO5/TiO2 nanocomposite.
| MB concentration (mg/L) | α (mg/g min) | β (g/mg) | R2 |
|---|---|---|---|
| 10 | 487.621 | 0.370 | 0.917 |
| 15 | 278.440 | 0.265 | 0.930 |
| 20 | 379.398 | 0.198 | 0.914 |
| 25 | 1391.411 | 0.179 | 0.910 |
The values of α and β can be found from the slope and the intercept of the plot of Qt vs ln t (Figure 12).
3.8. Adsorption Isotherms
When the adsorption process achieves an equilibrium state, the distribution of molecules between the phases of liquid and solid is explained by adsorption isotherms [51]. Five distinct isotherm models—Langmuir, Freundlich, Temkin, Dubinin-Radushkevich, and Elovich—were fitted to the adsorption data.
According to the Langmuir model, adsorbates bind monolayers to homogenous surfaces, and the adsorption energy remains constant. Additionally, the model presupposes no steric hindrance or lateral contact between the adsorbed molecules [52,53,54]. The linearized Langmuir isotherm equation can be represented by equation 11 [55].
where,
Ce – Concentration of the adsorbate at equilibrium (mg/L)
qe - Amount of adsorbed (adsorbate) at equilibrium per unit mass of adsorbent (mg/g)
KL - Langmuir constant related to adsorption capacity (L/mg)
qm - Practical limiting adsorption capacity (mg/g)
The values of KL and qm were calculated from the intercept and the gradient of the straight lines of the plot of Ce/qe vs. Ce [55]. Langmuir adsorption isotherm model is depicted in Figure 13 (a).
The separation factor (RL), that defines whether the process of adsorption is favorable or unfavorable, is a crucial Langmuir model parameter [56]. The separation factor can be expressed mathematically as given in equation 12.
KL - Langmuir constant (L/mg)
C0 - Initial concentration of adsorbate (mg/L)
Generally, adsorption is beneficial when RL values are between zero and one (0< RL<1), and it is irreversible when RL∼0. The adsorption isotherm is said to be linear if RL = 1, while unfavorable adsorption is indicated if RL >1 [57]. The measured Langmuir adsorption RL value ranges from 0.321 to 0.073, indicating a favorable methylene blue adsorption to the nanocomposite [3].
Assuming nonuniform heat distribution and affinities towards the heterogeneous surface, the Freundlich isotherm applies to adsorption on heterogeneous surfaces [53]. The Freundlich isotherm model’s linear form is provided in eq 13 [53].
where,
qe - Amount of adsorbed (adsorbate) at equilibrium per unit mass of adsorbent (mg/g)
Ce – Concentration of the adsorbate at equilibrium (mg/L)
KF – Freundlich adsorption capacity (mg/g)
1/n – Adsorption intensity
The values of KF and n were calculated from intercept and the gradient of the straight lines of the plot log qe vs. log Ce, respectively. Freundlich adsorption isotherm model is depicted in Figure 13(b) [53]. In general, 1/n values between zero and one indicate the adsorption process is favorable; 1/n>1 indicates unfavorable adsorption, and adsorption becomes irreversible when 1/n=1 [53]. The obtained 1/n values for Freundlich adsorption isotherms vary from 0.186-0.291, indicating adsorption’s favorable nature.
The Temkin model considers the interactions between the adsorbent and the adsorbate in a multilayer adsorption process, but it ignores concentration values that are very small or large [53], [58]. The Temkin model further assumes that the increase in coverage of the adsorbent surface, causes the adsorption heat of all molecules to decrease linearly [59]. The linearized Temkin isotherm can be described by Equation (14) [59].
where,
qe - Amount of adsorbed (adsorbate) at equilibrium per unit mass of adsorbent (mg/g)
Ce - Concentration of the adsorbate at equilibrium (mg/L)
R - Universal gas constant (J mol-1 K-1)
T - Absolute temperature (K)
KT - Temkin isotherm constant (L g-1)
b - Temkin constant related to heat (J mol-1)
The intercept and slope of the straight lines shown in the plot of qe vs. ln Ce were used to compute the values of KT and b. Figure 13(c) shows the Temkin adsorption isotherm model.
The Dubinin-Radushkevich isotherm model is based on a microporous adsorption model rather than a physical adsorption model. Rather than layer-by-layer adsorption on pore walls, this model proposes that adsorption occurs by micropore volume filling [60]. Additionally, the model assumes the existence of Vander Waal interactions between the adsorbent and the adsorbate and is based on a multilayer adsorption process [52]. The linearized Dubinin−Radushkevich isotherm can be described by Equation (15-16) [60].
where,
qe - Amount of absorbed (adsorbate) at equilibrium per unit mass of the adsorbent (mg g−1)
qm- Maximum monolayer adsorption capacity of the adsorbent (mg g−1)
Ce - Concentration of the adsorbate at equilibrium (mg/L)
R - Universal gas constant (J mol−1 K−1)
T - Absolute temperature (K)
Kd - Dubinin constant (mol2 kJ−2)
ε - Potential energy (kJ mol−1)
Em- Mean free energy (KJ mol-1)
From the intercept and gradient of the straight lines in the plot of ln qe vs. ϵ2, the values of qm and K were obtained. Figure 13 (d) shows the Dubinin−Radushkevich adsorption isotherm model. According to the value obtained for mean free energy (Em) in the Dubinin−Radushkevich equation, the adsorption process can be of three different types. Adsorption is categorized as physisorption if Em < 8.0 kJ/mol, ion exchange if Em = 8.0 −16.0 kJ/mol, and chemisorption if Em > 16.0 −400 kJ/mol[52]. The Em values obtained in the study for the four different temperatures 298 K, 308 K, 318 K, and 323 K are 17.175, 28.748, 41.130, and 45.128 KJ mol-1, respectively. It confirms that the adsorption process would be chemisorption. The correlation coefficient (R2) values were used to determine which model best fit the data. When the adsorption models’ correlation coefficients (R2) were examined, the Langmuir model had the best-fit correlation value [52]. Parameters calculated by Langmuir, Freundlich, Temkin, and Dubinin−Radushkevich adsorption isotherm models for the adsorption of MB onto Fe3O4/Fe2TiO5/TiO2 are shown in Table 7.
3.9. Adsorption Thermodynamics.
Thermodynamic parameters were calculated by changing the concentration of MB solution at four different temperatures, i.e., 298, 308, 318 and 323 K. As seen in Figure 14, the acquired data were fitted to the Langmuir isotherm to determine the equilibrium rate constants needed to plot the Van’t Hoff plots.
Equations 18 and 19 were used to calculate thermodynamic parameters, such as the change in free energy (ΔG°), enthalpy (ΔH°), and entropy (ΔS°), to ascertain the impact of temperature on MB adsorption onto Fe3O4/Fe2TiO5/TiO2 nanocomposite [60].
Considering the third principle of thermodynamics,
The combination of equations 18 and 19 leads to equation 20.
where,
R is the universal gas constant (8.314 J mol−1 K−1)
T is the temperature in K
KL is the Langmuir isotherm constant. (L mol-1)
The entropy change and the enthalpy change were determined from the intercept and the slope of the Van’t Hoff plots of In (KL) versus 1/T (Figure 14). The thermodynamic parameters are tabulated in Table 8.
The positive and spontaneous adsorption process is shown by the negative change in free energy, or ΔG°[61]. The adsorption process is more advantageous at higher temperatures, as indicated by the growing negative value of free energy with temperature [62]. The solid-solution system’s unpredictability increased due to structural changes that occurred throughout the adsorption process, as indicated by the positive value of the entropy change [62]. The adsorption process is endothermic, as indicated by the positive value of enthalpy change.
The linearized Arrhenius equation (equation 20) can be used to predict the type of adsorption process by plotting ln K vs 1/T [63]. The pre-exponential factor (A) and activation energy (Ea) of the adsorption process can be determined using the graph’s intercept and gradient, respectively[63]. To determine the pseudo-second-order rate constants needed to plot the Arrhenius plots depicted in Figure 15(b), pseudo-second-order kinetic graphs were created at four different temperatures (Figure 15(a)). Variations of Adsorption Capacity and Pseudo-Second-Order Rate Constants with Temperature are given in Table 9.
3.10. Reusability Studies
The reusability of an adsorbent is a salient characteristic feature that can be used to evaluate the applicability of an adsorbent in the industry [64]. When an adsorbent’s adsorption capability drastically declines with repeated usage, secondary environmental degradation results, and industrial use of the adsorbent becomes expensive [65]. Through five adsorption-desorption cycles, the reusability of the adsorbent was found. For 10 mg of the adsorbent, reusability tests were carried out using 50 ml of a 10 ppm MB solution (pH=10). Following every cycle, ethanol was used to wash the adsorbent until the washings were transparent. Figure 16(a) and (b) depict the change in C/C0 with time and the change in adsorption capacity with time, respectively.
The equilibrium adsorption capacity decreased from 24.573 mg/g (first cycle) to 19.600 mg/g (fifth cycle). Figure 16(b) shows that the adsorption capacity has only marginally diminished after each cycle, confirming that the adsorbent may be reused after usage. This lowers waste formation and offers an affordable water filtration solution [65]. The reduction in adsorption capacities may be due to blockage of mesopores by the chemisorbed MB molecules [3]. Though the adsorbent can be effectively used multiple times to remove MB, once the adsorbent is exhausted due to the saturation of the active sites, it is necessary to remove it safely. It is recommended to anneal the adsorbent at atmospheric conditions at 600 °C for 2 hours to burn out the MB molecules adsorbed, which couldn’t be removed by washing with ethanol. After that, as it is a metal-based nanocomposite, it is recommended to dissolve it in a strong acid or in an acid mixture and use the obtained metal ion solution to produce a new adsorbent by adding ammonia. Hence, the precursors are not being added to the environment, causing any hazardous effect, and the same would be used to produce new adsorbent, which can be used for the removal of MB or any other relevant environmental remediation.
Table 10 compares the adsorbent capacities of different adsorbents in adsorbing MB using different adsorbent dosages. The adsorption capacity varies due to the variation of the surface area, pore volume, and surface functionalities. The adsorbent used in this investigation has a larger adsorbent capacity than some of the other adsorbents, and its adsorption capacity was found to be lower when compared to some others. The parameters mentioned earlier, the adsorbent dosage, and the adsorbate concentration also affect the total adsorption. Hence, a direct comparison hasn’t been made.
4. Conclusions
Using methylene blue (MB) as the model dye, a new Fe3O4/Fe2TiO5/TiO2 nanocomposite was produced, and its efficacy in removing colours from wastewater was assessed. The pH of 10 was shown to be optimal for the elimination of MB. For 10 mg of the nanocomposite containing 10 mg/L MB, a maximum adsorption capacity of 24.573 mg/g was achieved at pH=10. The adsorption of MB onto the Fe3O4/Fe2TiO5/TiO2 nanocomposite was found to be most closely suited to a pseudo-second order kinetic model, suggesting that the adsorption process was chemisorption in nature. The Langmuir adsorption model that best fits the data is thought to be adsorption at the four temperatures. Adsorption capacity fell with increasing adsorbent dosage but rose with increasing MB concentration. The rise in adsorption capacity with temperature suggests the endothermic nature of adsorption. For five cycles in a row, the produced nanocomposite effectively removed MB, with minimal activity loss following each cycle. Fe3O4/Fe2TiO5/TiO2 is a new nanocomposite that can effectively and inexpensively remove MB from water.
Funding
This research was supported by the Accelerating Higher Education Expansion and Development (AHEAD) Operation of the Ministry of Higher Education, funded by the World Bank.
Acknowledgments
The authors acknowledge the Sri Lanka Institute of Nanotechnology and the University of Moratuwa for providing the required instrument facility.
References
- T. Charitha, U. Leshan, M. Shanitha, W. Ramanee, L. Buddi, and B. Martin, Efficient photodegradation activity of α-Fe2O3/Fe2TiO5/TiO2 and Fe2TiO5/TiO2 nanocomposites synthesized from natural ilmenite. Results in Materials, 2021; 12. [CrossRef]
- Tkaczyk, K. Mitrowska, and A. Posyniak, Synthetic organic dyes as contaminants of the aquatic environment and their implications for ecosystems: A review. May 15, 2020, Elsevier B.V. [CrossRef]
- L. Usgodaarachchi, C. Thambiliyagodage, R. Wijesekera, and M. G. Bakker, Synthesis of mesoporous silica nanoparticles derived from rice husk and surface-controlled amine functionalization for efficient adsorption of methylene blue from aqueous solution. Current Research in Green and Sustainable Chemistry, 2021; 4. [CrossRef]
- R. Al-Tohamy et al., A critical review on the treatment of dye-containing wastewater: Ecotoxicological and health concerns of textile dyes and possible remediation approaches for environmental safety. Feb. 01, 2022, Academic Press. [CrossRef]
- Y. Xu, Q. Wang, and Z. Ding, Synthesis of Superparamagnetic Fe3O4 Nano-Adsorbent Using an Energy-Saving and Pollution-Reducing Strategy for the Removal of Xylenol Orange Dye in Water. Energies (Basel) 2022, 15. [Google Scholar] [CrossRef]
- Q. Liu, Pollution and Treatment of Dye Waste-Water. in IOP Conference Series: Earth and Environmental Science, IOP Publishing Ltd., Jul. 2020. [CrossRef]
- S. Zafar, D. A. Bukhari, and A. Rehman, Azo dyes degradation by microorganisms – An efficient and sustainable approach. Dec. 01, 2022, Elsevier B.V. [CrossRef]
- X. Wang, P. Zhang, F. Xu, B. Sun, G. Hong, and L. Bao, Adsorption of Methylene Blue on Azo Dye Wastewater by Molybdenum Disulfide Nanomaterials. Sustainability (Switzerland) 2022, 14. [Google Scholar] [CrossRef]
- Bożęcka, M. Orlof-Naturalna, and M. Kopeć, Methods of Dyes Removal from Aqueous Environment. Journal of Ecological Engineering 2021, 22, 111–118. [Google Scholar] [CrossRef]
- S. Dutta, B. Gupta, S. K. Srivastava, and A. K. Gupta, Recent advances on the removal of dyes from wastewater using various adsorbents: A critical review. Royal Society of Chemistry, 2021; 21. [CrossRef]
- C. Valli Nachiyar, A. D. Rakshi, S. Sandhya, N. Britlin Deva Jebasta, and J. Nellore, Developments in treatment technologies of dye-containing effluent: A review. Case Studies in Chemical and Environmental Engineering, 2023; 7. [CrossRef]
- C. Thambiliyagodage, L. Usgodaarachchi, M. Jayanetti, C. Liyanaarachchi, M. Kandanapitiye, and S. Vigneswaran, Efficient Visible-Light Photocatalysis and Antibacterial Activity of TiO2-Fe3C-Fe-Fe3O4/Graphitic Carbon Composites Fabricated by Catalytic Graphitization of Sucrose Using Natural Ilmenite. ACS Omega 2022, 7, 25403–25421. [CrossRef]
- C. Osagie, A. Othmani, S. Ghosh, A. Malloum, Z. Kashitarash Esfahani, and S. Ahmadi, Dyes adsorption from aqueous media through the nanotechnology: A review. Sep. 01, 2021, Elsevier Editora Ltd.a. [CrossRef]
- S. Homaeigohar, The nanosized dye adsorbents for water treatment. Feb. 01, 2020, MDPI AG. [CrossRef]
- T. E. Oladimeji, B. O. Odunoye, F. B. Elehinafe, O. R. Obanla, and O. A. Odunlami, Production of activated carbon from sawdust and its efficiency in the treatment of sewage water. Heliyon, 2021; 7. [CrossRef]
- T. Sesuk, P. Tammawat, P. Jivaganont, K. Somton, P. Limthongkul, and W. Kobsiriphat, Activated carbon derived from coconut coir pith as high performance supercapacitor electrode material. J Energy Storage, 2019; 25. [CrossRef]
- M. N. Hossain, M. D. Islam, A. Rahaman, N. Khatun, and M. A. Matin, Production of cost-effective activated carbon from tea waste for tannery waste water treatment. Appl Water Sci, 2023; 13. [CrossRef]
- D. Bergna, T. Hu, H. Prokkola, H. Romar, and U. Lassi, Effect of Some Process Parameters on the Main Properties of Activated Carbon Produced from Peat in a Lab-Scale Process. Waste Biomass Valorization 2020, 11, 2837–2848. [Google Scholar] [CrossRef]
- C. J. Thambiliyagodage, V. Y. Cooray, I. N. Perera, and R. D. Wijesekera, Eco-Friendly Porous Carbon Materials for Wastewater Treatment. in Lecture Notes in Civil Engineering, vol. 44, Springer, 2020, pp. 252–260. [CrossRef]
- L. L. Schramm, E. N. Stasiuk, and D. G. Marangoni, Surfactants and their applications. 2003, Royal Society of Chemistry. [CrossRef]
- F. Damiri et al., Recent Advances in Adsorptive Nanocomposite Membranes for Heavy Metals Ion Removal from Contaminated Water: A Comprehensive Review. Aug. 01, 2022, MDPI. [CrossRef]
- S. Singh, K. C. Barick, and D. Bahadur, Nanomaterials and Nanotechnology Functional Oxide Nanomaterials and Nanocomposites for the Removal of Heavy Metals and Dyes Invited Review Article. 2013. [Online]. Available online: www.intechopen.com.
- T. A. Dontsova, S. V. Nahirniak, and I. M. Astrelin, Metaloxide nanomaterials and nanocomposites of ecological purpose. 2019, Hindawi Limited. [CrossRef]
- Z. Alhalili, Metal Oxides Nanoparticles: General Structural Description, Chemical, Physical, and Biological Synthesis Methods, Role in Pesticides and Heavy Metal Removal through Wastewater Treatment. Apr. 01, 2023, MDPI. [CrossRef]
- L. Usgodaarachchi, M. Jayanetti, C. Thambiliyagodage, H. Liyanaarachchi, and S. Vigneswaran, Fabrication of r-GO/GO/α-Fe2O3/Fe2TiO5 Nanocomposite Using Natural Ilmenite and Graphite for Efficient Photocatalysis in Visible Light. Materials, 2023; 16. [CrossRef]
- L. Usgodaarachchi, C. Thambiliyagodage, R. Wijesekera, S. Vigneswaran, and M. Kandanapitiye, Fabrication of TiO2Spheres and a Visible Light Active α-Fe2O3/TiO2-Rutile/TiO2-Anatase Heterogeneous Photocatalyst from Natural Ilmenite. ACS Omega 2022, 7, 27617–27637. [Google Scholar] [CrossRef]
- L. Usgodaarachchi and C. Thambiliyagodage, Photocatalytic activity of GO/Fe3O4 fabricated by Sri Lankan graphite under visible light irradiation. Journal of Science of the University of Kelaniya 2021, 14, 51–65. [Google Scholar] [CrossRef]
- T. Charitha, U. Leshan, M. Shanitha, W. Ramanee, L. Buddi, and B. Martin, Efficient photodegradation activity of α-Fe2O3/Fe2TiO5/TiO2 and Fe2TiO5/TiO2 nanocomposites synthesized from natural ilmenite. Results in Materials, 2021; 12. [CrossRef]
- C. Thambiliyagodage and L. Usgodaarachchi, Photocatalytic activity of N, Fe and Cu co-doped TiO2 nanoparticles under sunlight. Current Research in Green and Sustainable Chemistry, 2021; 4. [CrossRef]
- M. Humayun, F. Raziq, A. Khan, and W. Luo, Modification strategies of TiO2 for potential applications in photocatalysis: A critical review. Apr. 03, 2018, Taylor and Francis Ltd. [CrossRef]
- M. Serhan et al., Total iron measurement in human serum with a smartphone. in AIChE Annual Meeting, Conference Proceedings, American Institute of Chemical Engineers, 2019.
- M. Thommes et al., Physisorption of gases, with special reference to the evaluation of surface area and pore size distribution (IUPAC Technical Report). Pure and Applied Chemistry 2015, 87, 1051–1069. [Google Scholar] [CrossRef]
- F. Mikšík, T. Miyazaki, and K. Thu, Adsorption isotherm modelling of water on nano-tailored mesoporous silica based on distribution function. Energies (Basel), 2020; 13. [CrossRef]
- E. A. Al-Maliky, H. A. Gzar, and M. G. Al-Azawy, Determination of Point of Zero Charge (PZC) of Concrete Particles Adsorbents. IOP Conf Ser Mater Sci Eng 2021, 1184, 012004. [Google Scholar] [CrossRef]
- J. Chang et al., Adsorption of methylene blue onto Fe3O4/activated montmorillonite nanocomposite. Appl Clay Sci 2016, 119, 132–140. [Google Scholar] [CrossRef]
- S. Giraldo, I. Robles, L. A. Godínez, N. Acelas, and E. Flórez, Experimental and theoretical insights on methylene blue removal from wastewater using an adsorbent obtained from the residues of the orange industry. Molecules, 2021; 26. [CrossRef]
- E. D. Revellame, D. L. Fortela, W. Sharp, R. Hernandez, and M. E. Zappi, Adsorption kinetic modeling using pseudo-first order and pseudo-second order rate laws: A review. Dec. 01, 2020, Elsevier Ltd. [CrossRef]
- N. F. Al-Harby, E. F. Albahly, and N. A. Mohamed, Kinetics, isotherm and thermodynamic studies for efficient adsorption of congo red dye from aqueous solution onto novel cyanoguanidine-modified chitosan adsorbent. Polymers (Basel), 2021; 13. [CrossRef]
- J. Chang et al., Adsorption of methylene blue onto Fe3O4/activated montmorillonite nanocomposite. Appl Clay Sci 2016, 119, 132–140. [Google Scholar] [CrossRef]
- N. Ebelegi, N. N. Ebelegi, N. Ayawei, and D. Wankasi, Interpretation of Adsorption Thermodynamics and Kinetics. Open J Phys Chem, 2020; 03. [Google Scholar] [CrossRef]
- J. O. Ojediran, A. O. Dada, S. O. Aniyi, R. O. David, and A. D. Adewumi, Mechanism and isotherm modeling of effective adsorption of malachite green as endocrine disruptive dye using Acid Functionalized Maize Cob (AFMC). Sci Rep, 2021; 11. [CrossRef]
- Vinod, H. Pulikkalparambil, P. Jagadeesh, S. M. Rangappa, and S. Siengchin, Recent advancements in lignocellulose biomass-based carbon fiber: Synthesis, properties, and applications. Mar. 01, 2023, Elsevier Ltd. [CrossRef]
- D. A. Ali, H. Elsawy, D. A. Ali, F. M. Abdalla, D. A. Gamil, and H. A. Elsawy, Isotherm and Kinetics Studies for the Adsorption of Methylene Blue and Methyl Red Dyes from Aqueous Solutions Using Chitosan. vol. 16, no. 7, 2021, [Online]. Available online: www.arpnjournals.com.
- Inyinbor, A. A. Inyinbor, F. A. Adekola, and G. A. Olatunji, EDTA Modified Irvingia gabonensis: An Efficient Bioresource Material for the Removal of Rhodamine B. 2015. [Online]. Available online: https://www.researchgate.net/publication/289957652.
- S. Mohamed Nasser, M. Abbas, and M. Trari, Understanding the rate-limiting step adsorption kinetics onto biomaterials for mechanism adsorption control. Jan. 01, 2024, SAGE Publications Ltd. [CrossRef]
- N. Hasani et al., Theoretical, Equilibrium, Kinetics and Thermodynamic Investigations of Methylene Blue Adsorption onto Lignite Coal. Molecules 2022, 27. [Google Scholar] [CrossRef]
- C. Smaranda, D. Bulgariu, and M. Gavrilescu, An investigation of the sorption of Acid Orange 7 from aqueous solution onto soil. in Environmental Engineering and Management Journal, Gheorghe Asachi Technical University of Iasi, Romania, 2009, pp. 1391–1402. [CrossRef]
- P. K. Singh, S. Banerjee, A. L. Srivastava, and Y. Chandra Sharma, Kinetic and equilibrium modeling for removal of nitrate from aqueous solutions and drinking water by a potential adsorbent, hydrous bismuth oxide.
- G. Muthuraman, Removal of Mn2+ REMOVAL OF MANGANESE FROM GROUND/ DRINKING WATER AT SOUTH MADRAS USING NATURAL ADSORBENTS”.
- M. Abodif et al., Mechanisms and Models of Adsorption: TiO2-Supported Biochar for Removal of 3,4-Dimethylaniline. ACS Omega 2020, 5, 13630–13640. [Google Scholar] [CrossRef] [PubMed]
- L. Taofeek Popoola, Characterization and adsorptive behaviour of snail shell-rice husk (SS-RH) calcined particles (CPs) towards cationic dye. Heliyon 2019, 5, 1153. [Google Scholar]
- S. Raghav and D. Kumar, Adsorption Equilibrium, Kinetics, and Thermodynamic Studies of Fluoride Adsorbed by Tetrametallic Oxide Adsorbent. J Chem Eng Data 2018, 63, 1682–1697. [Google Scholar] [CrossRef]
- S. Kalam, S. A. Abu-Khamsin, M. S. Kamal, and S. Patil, Surfactant Adsorption Isotherms: A Review. Dec. 07, 2021, American Chemical Society. [CrossRef]
- H. Liyanaarachchi, C. Thambiliyagodage, H. Lokuge, and S. Vigneswaran, Kinetics and Thermodynamics Study of Methylene Blue Adsorption to Sucrose- and Urea-Derived Nitrogen-Enriched, Hierarchically Porous Carbon Activated by KOH and H3PO4. ACS Omega 2023, 8, 16158–16173. [Google Scholar] [CrossRef]
- B. Adane, K. Siraj, and N. Meka, Kinetic, equilibrium and thermodynamic study of 2-chlorophenol adsorption onto Ricinus communis pericarp activated carbon from aqueous solutions. Oct. 02, 2015, Taylor and Francis Ltd. [CrossRef]
- B. Meroufel, O. Benali, M. Benyahia, Y. Benmoussa, and M. A. Zenasni, Adsorptive removal of anionic dye from aqueous solutions by Algerian kaolin: Characteristics, isotherm, kinetic and thermodynamic studies. J. Mater. Environ. Sci 2013, 4, 482–491. [Google Scholar]
- E. Ajenifuja, J. A. Ajao, and E. O. B. Ajayi, Equilibrium adsorption isotherm studies of Cu (II) and Co (II) in high concentration aqueous solutions on Ag-TiO2-modified kaolinite ceramic adsorbents. Appl Water Sci 2017, 7, 2279–2286. [Google Scholar] [CrossRef]
- L. Y. George, L. Ma, W. Zhang, and G. Yao, Parametric modelling and analysis to optimize adsorption of Atrazine by MgO/Fe3O4-synthesized porous carbons in water environment. Environ Sci Eur 2023, 35. [Google Scholar] [CrossRef]
- J. S. Piccin, G. L. Dotto, and L. A. A. Pinto, ADSORPTION ISOTHERMS AND THERMOCHEMICAL DATA OF FD&C RED N° 40 BINDING BY CHITOSAN. vol. 28, no. 02, pp. 295–304, [Online]. Available: www.abeq.org.
- V. J. Inglezakis, Solubility-normalized Dubinin–Astakhov adsorption isotherm for ion-exchange systems. Microporous and Mesoporous Materials 2007, 103, 72–81. [Google Scholar] [CrossRef]
- Pholosi, E. B. Naidoo, and A. E. Ofomaja, Intraparticle diffusion of Cr(VI) through biomass and magnetite coated biomass: A comparative kinetic and diffusion study. S Afr J Chem Eng 2020, 32, 39–55. [Google Scholar] [CrossRef]
- E. Sterenzon, V. K. Vadivel, Y. Gerchman, T. Luxbacher, R. Narayanan, and H. Mamane, Effective Removal of Acid Dye in Synthetic and Silk Dyeing Effluent: Isotherm and Kinetic Studies. ACS Omega 2022, 7, 118–128. [Google Scholar] [CrossRef] [PubMed]
- M. A. Zulfikar and H. Setiyanto, Study Of The Adsorption Kinetics And Thermodynamic For The Removal Of Congo Red From Aqueous Solution Using Powdered Eggshell. 2013. [Online]. Available online: https://www.researchgate.net/publication/236263530.
- T. N. Dharmapriya, D. Y. Li, Y. C. Chung, and P. J. Huang, Green Synthesis of Reusable Adsorbents for the Removal of Heavy Metal Ions. ACS Omega 2021, 6, 30478–30487. [Google Scholar] [CrossRef] [PubMed]
- J. M. Jabar, Y. A. Odusote, K. A. Alabi, and I. B. Ahmed, Kinetics and mechanisms of congo-red dye removal from aqueous solution using activated Moringa oleifera seed coat as adsorbent. Appl Water Sci, 2020; 10. [CrossRef]
- S. Z. Razali, M. Y. Aziz, H. A. Edinur, and A. Razali Ishak, Adsorption of Methylene Blue onto Iron Oxide Magnetic Nanoparticles Coated with Sugarcane Bagasse. in IOP Conference Series: Earth and Environmental Science, IOP Publishing Ltd., Dec. 2020. [CrossRef]
- Bavi, M. S. Jafari, M. Heydari, F. Ebrahimi, and A. Sadeghizadeh, Batch and continuous mode adsorption of methylene blue cationic dye onto synthesized titanium dioxide/polyurethane nanocomposite modified by sodium dodecyl sulfate. Colloids and Surfaces C: Environmental Aspects 2023, 1, 100012. [Google Scholar] [CrossRef]
- V. Cao, P. A. Cao, D. L. Han, M. T. Ngo, T. X. Vuong, and H. N. Manh, The Suitability of Fe3O4/Graphene Oxide Nanocomposite for Adsorptive Removal of Methylene Blue and Congo Red. Nature Environment and Pollution Technology 2024, 23, 255–263. [Google Scholar] [CrossRef]
- L. Ai, C. Zhang, and Z. Chen, Removal of methylene blue from aqueous solution by a solvothermal-synthesized graphene/magnetite composite. J Hazard Mater 2011, 192, 1515–1524. [Google Scholar] [CrossRef]
- H. V. Tran, L. T. Bui, T. T. Dinh, D. H. Le, C. D. Huynh, and A. X. Trinh, Graphene oxide/Fe3O4/chitosan nanocomposite: A recoverable and recyclable adsorbent for organic dyes removal. Application to methylene blue. Mater Res Express, 2017; 4. [CrossRef]
Figure 1.
XRD pattern of Fe3O4/Fe2TiO5/TiO2 nanocomposite.
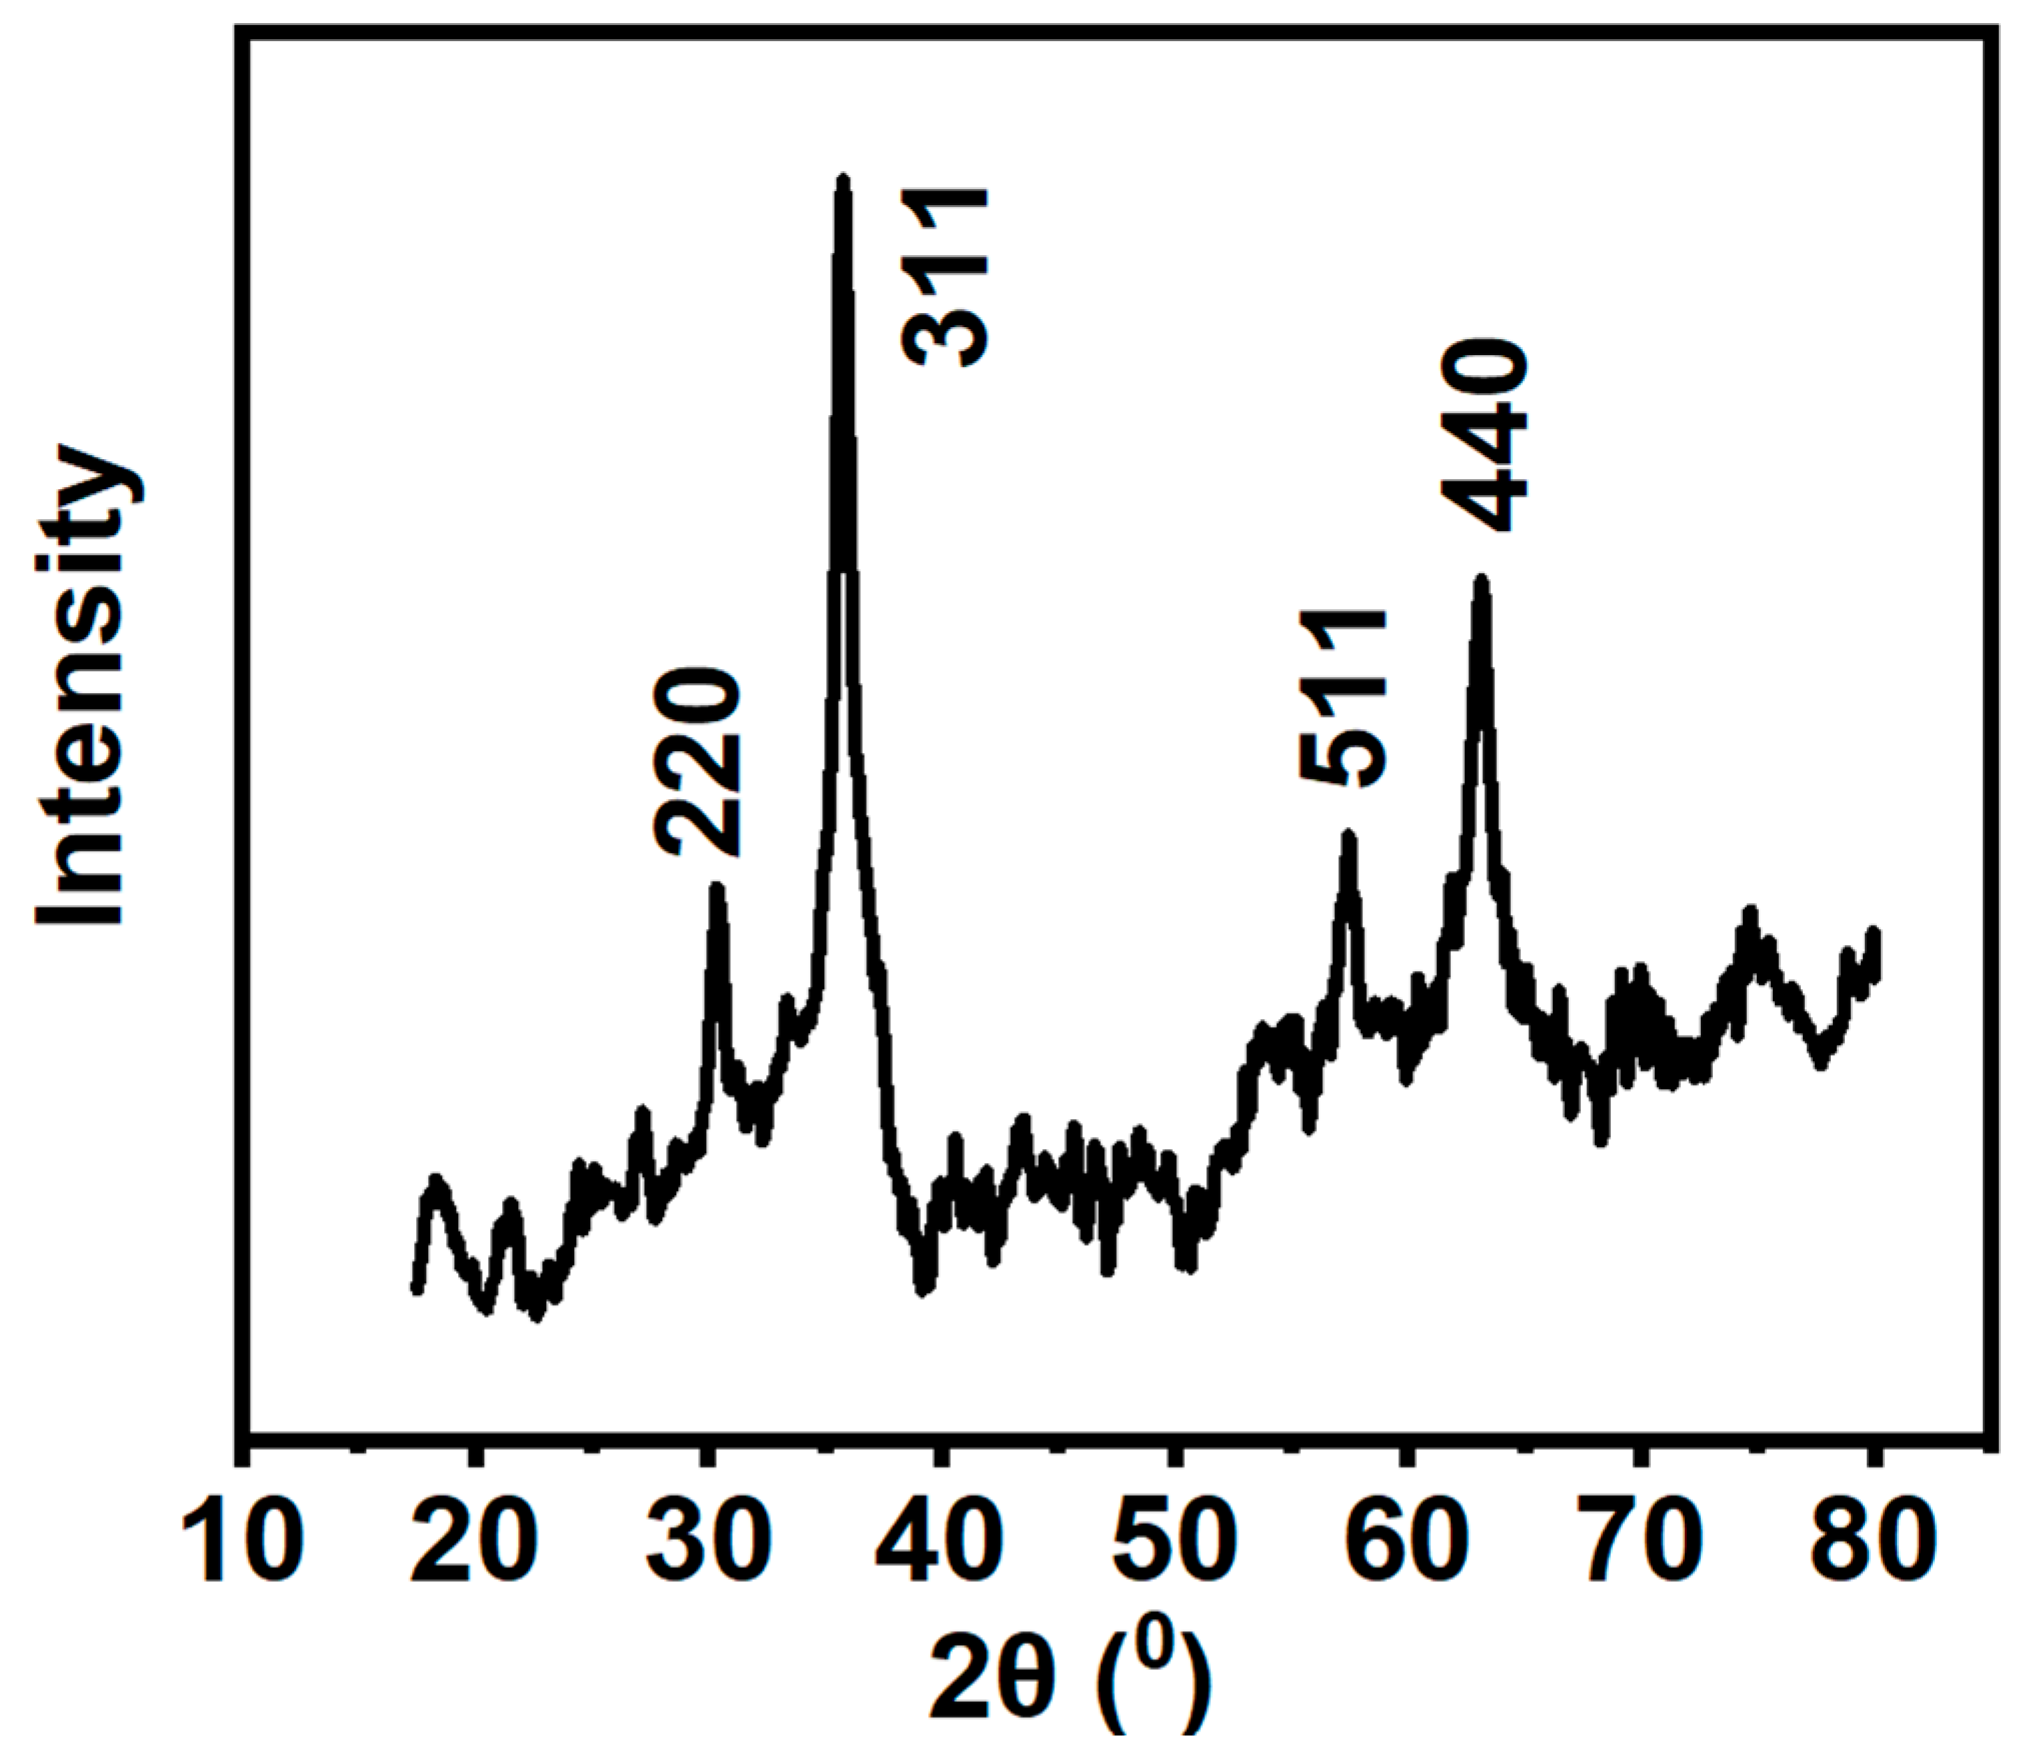
Figure 2.
Raman spectrum of Fe3O4/Fe2TiO5/TiO2 nanocomposite.
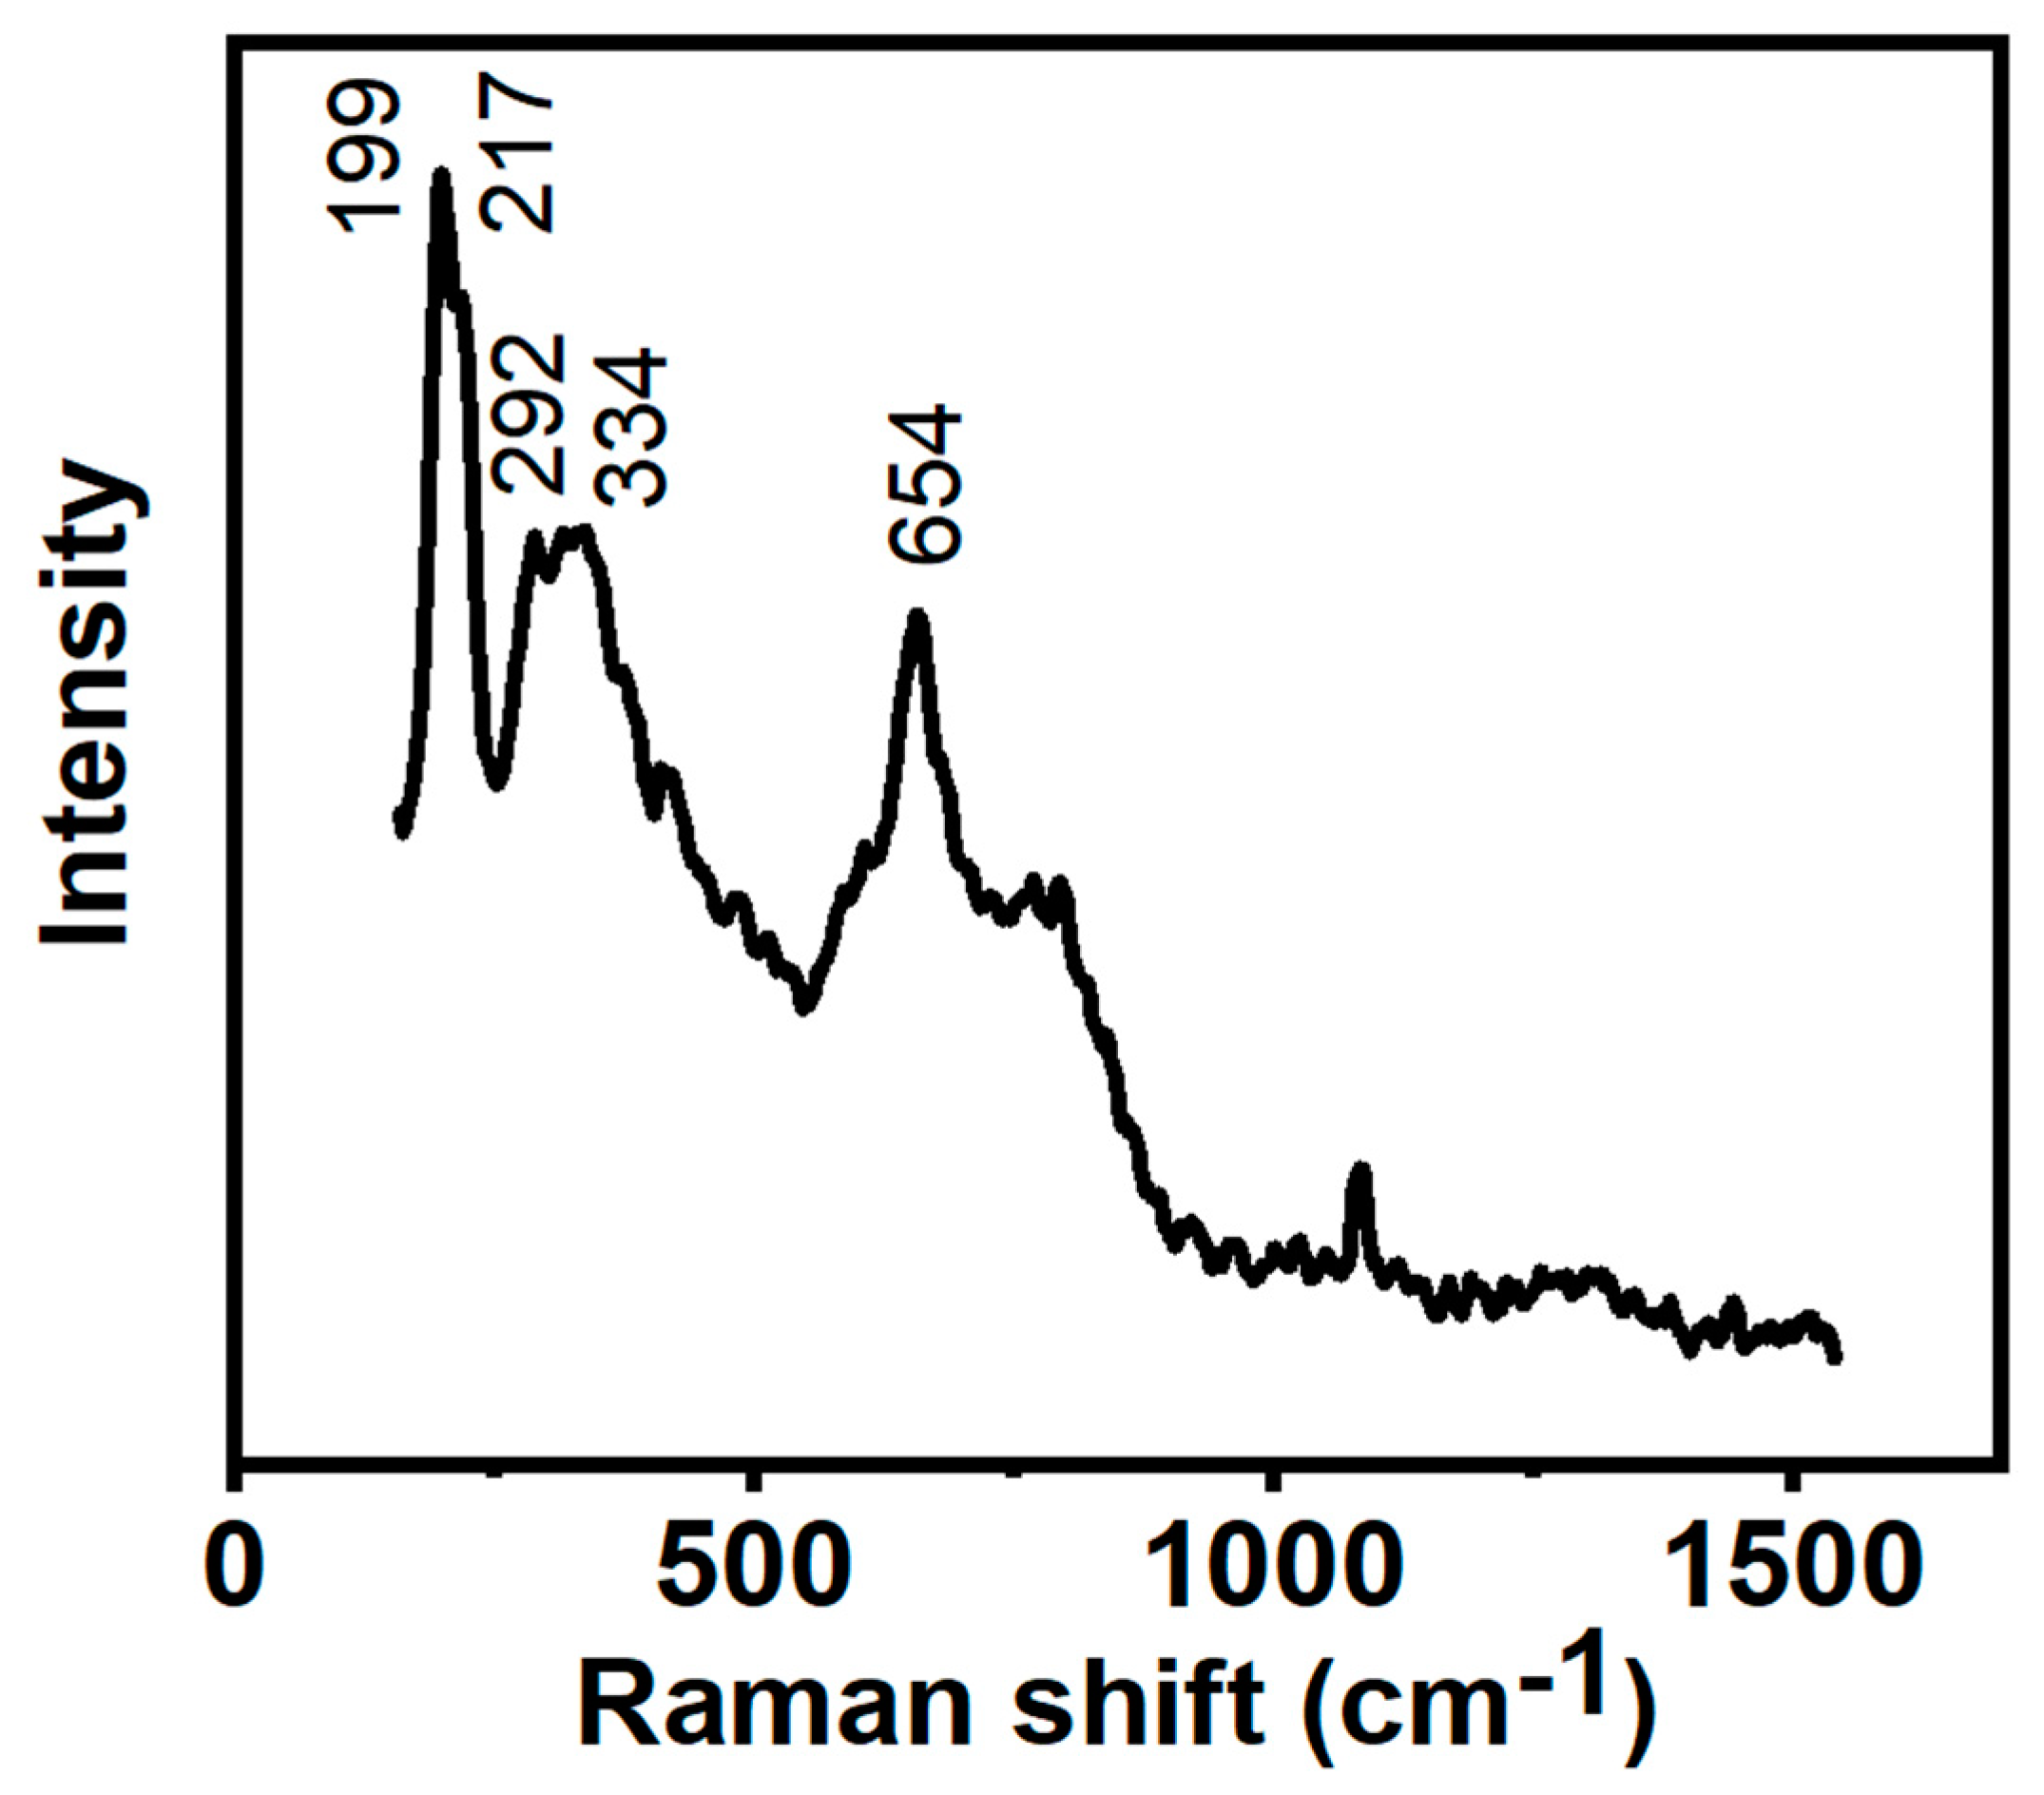
Figure 3.
High-resolution XPS spectra of (a) Ti 2p, (b) Fe 2p, (c) O 2p, (d) C 2p, of nanocomposite (e) Survey spectrum.
Figure 3.
High-resolution XPS spectra of (a) Ti 2p, (b) Fe 2p, (c) O 2p, (d) C 2p, of nanocomposite (e) Survey spectrum.
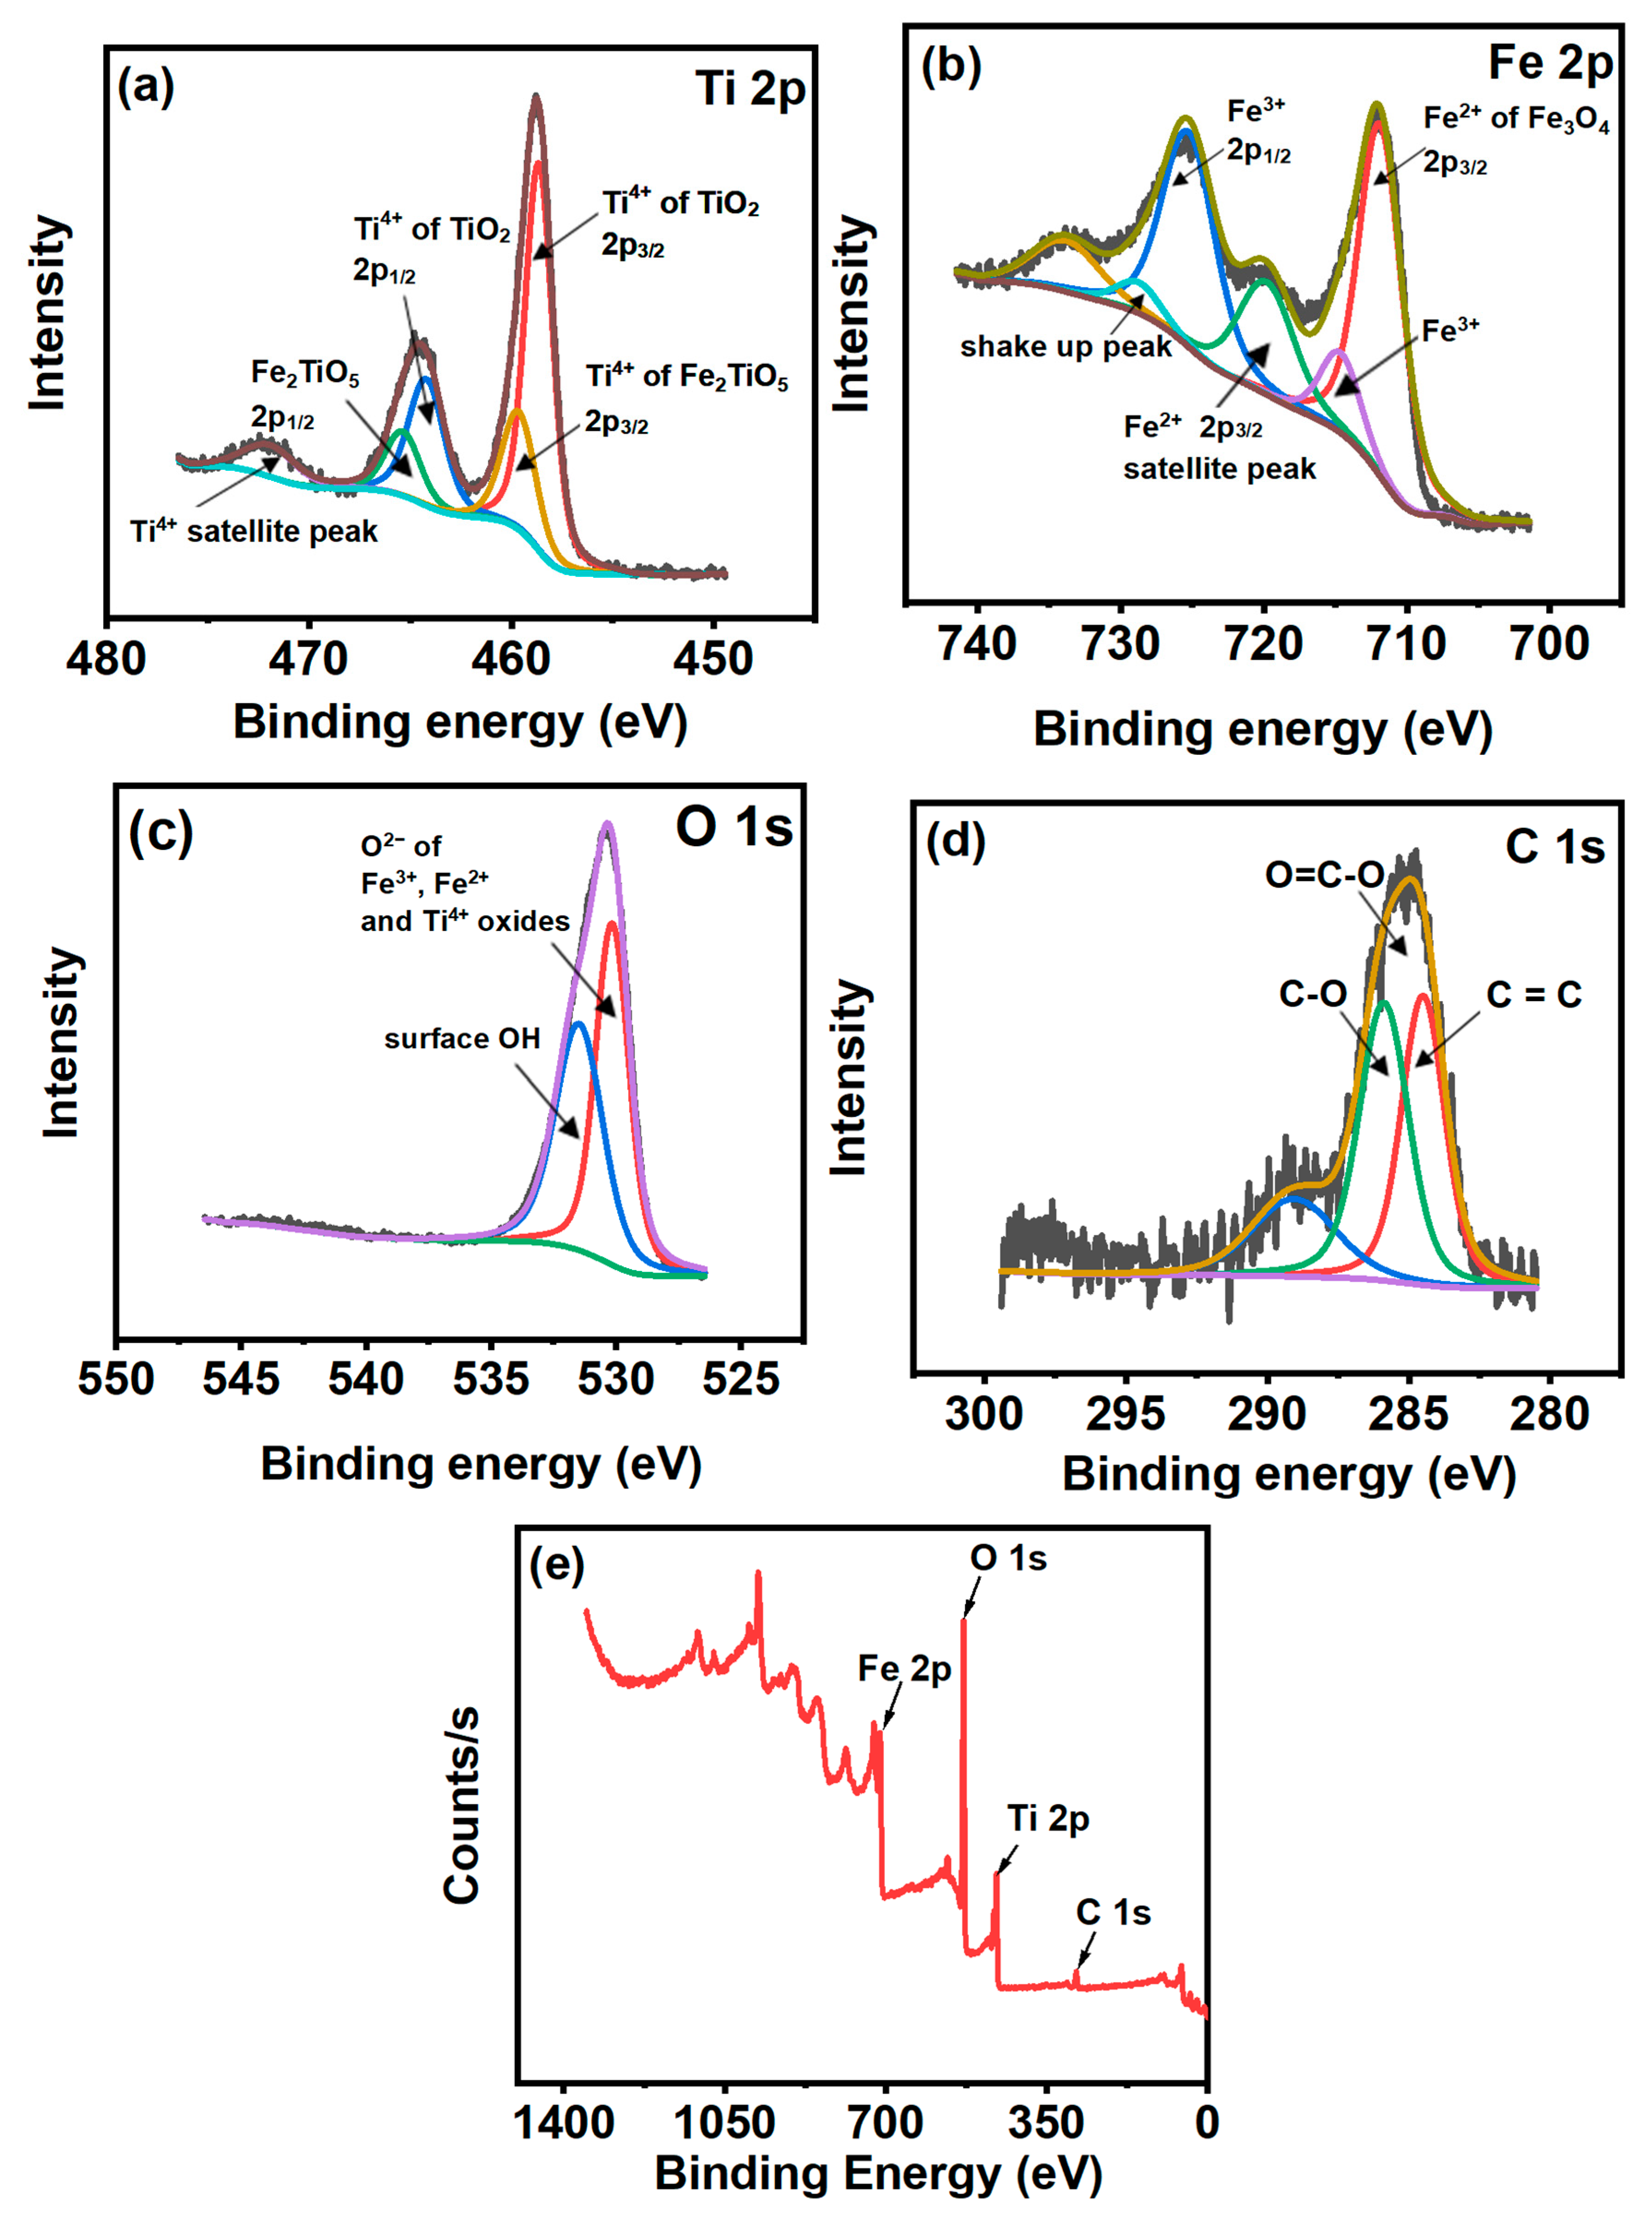
Figure 4.
(a) SEM image (b) TEM image (c, d) HR-TEM images of Fe3O4/Fe2TiO5/TiO2 nanocomposite.
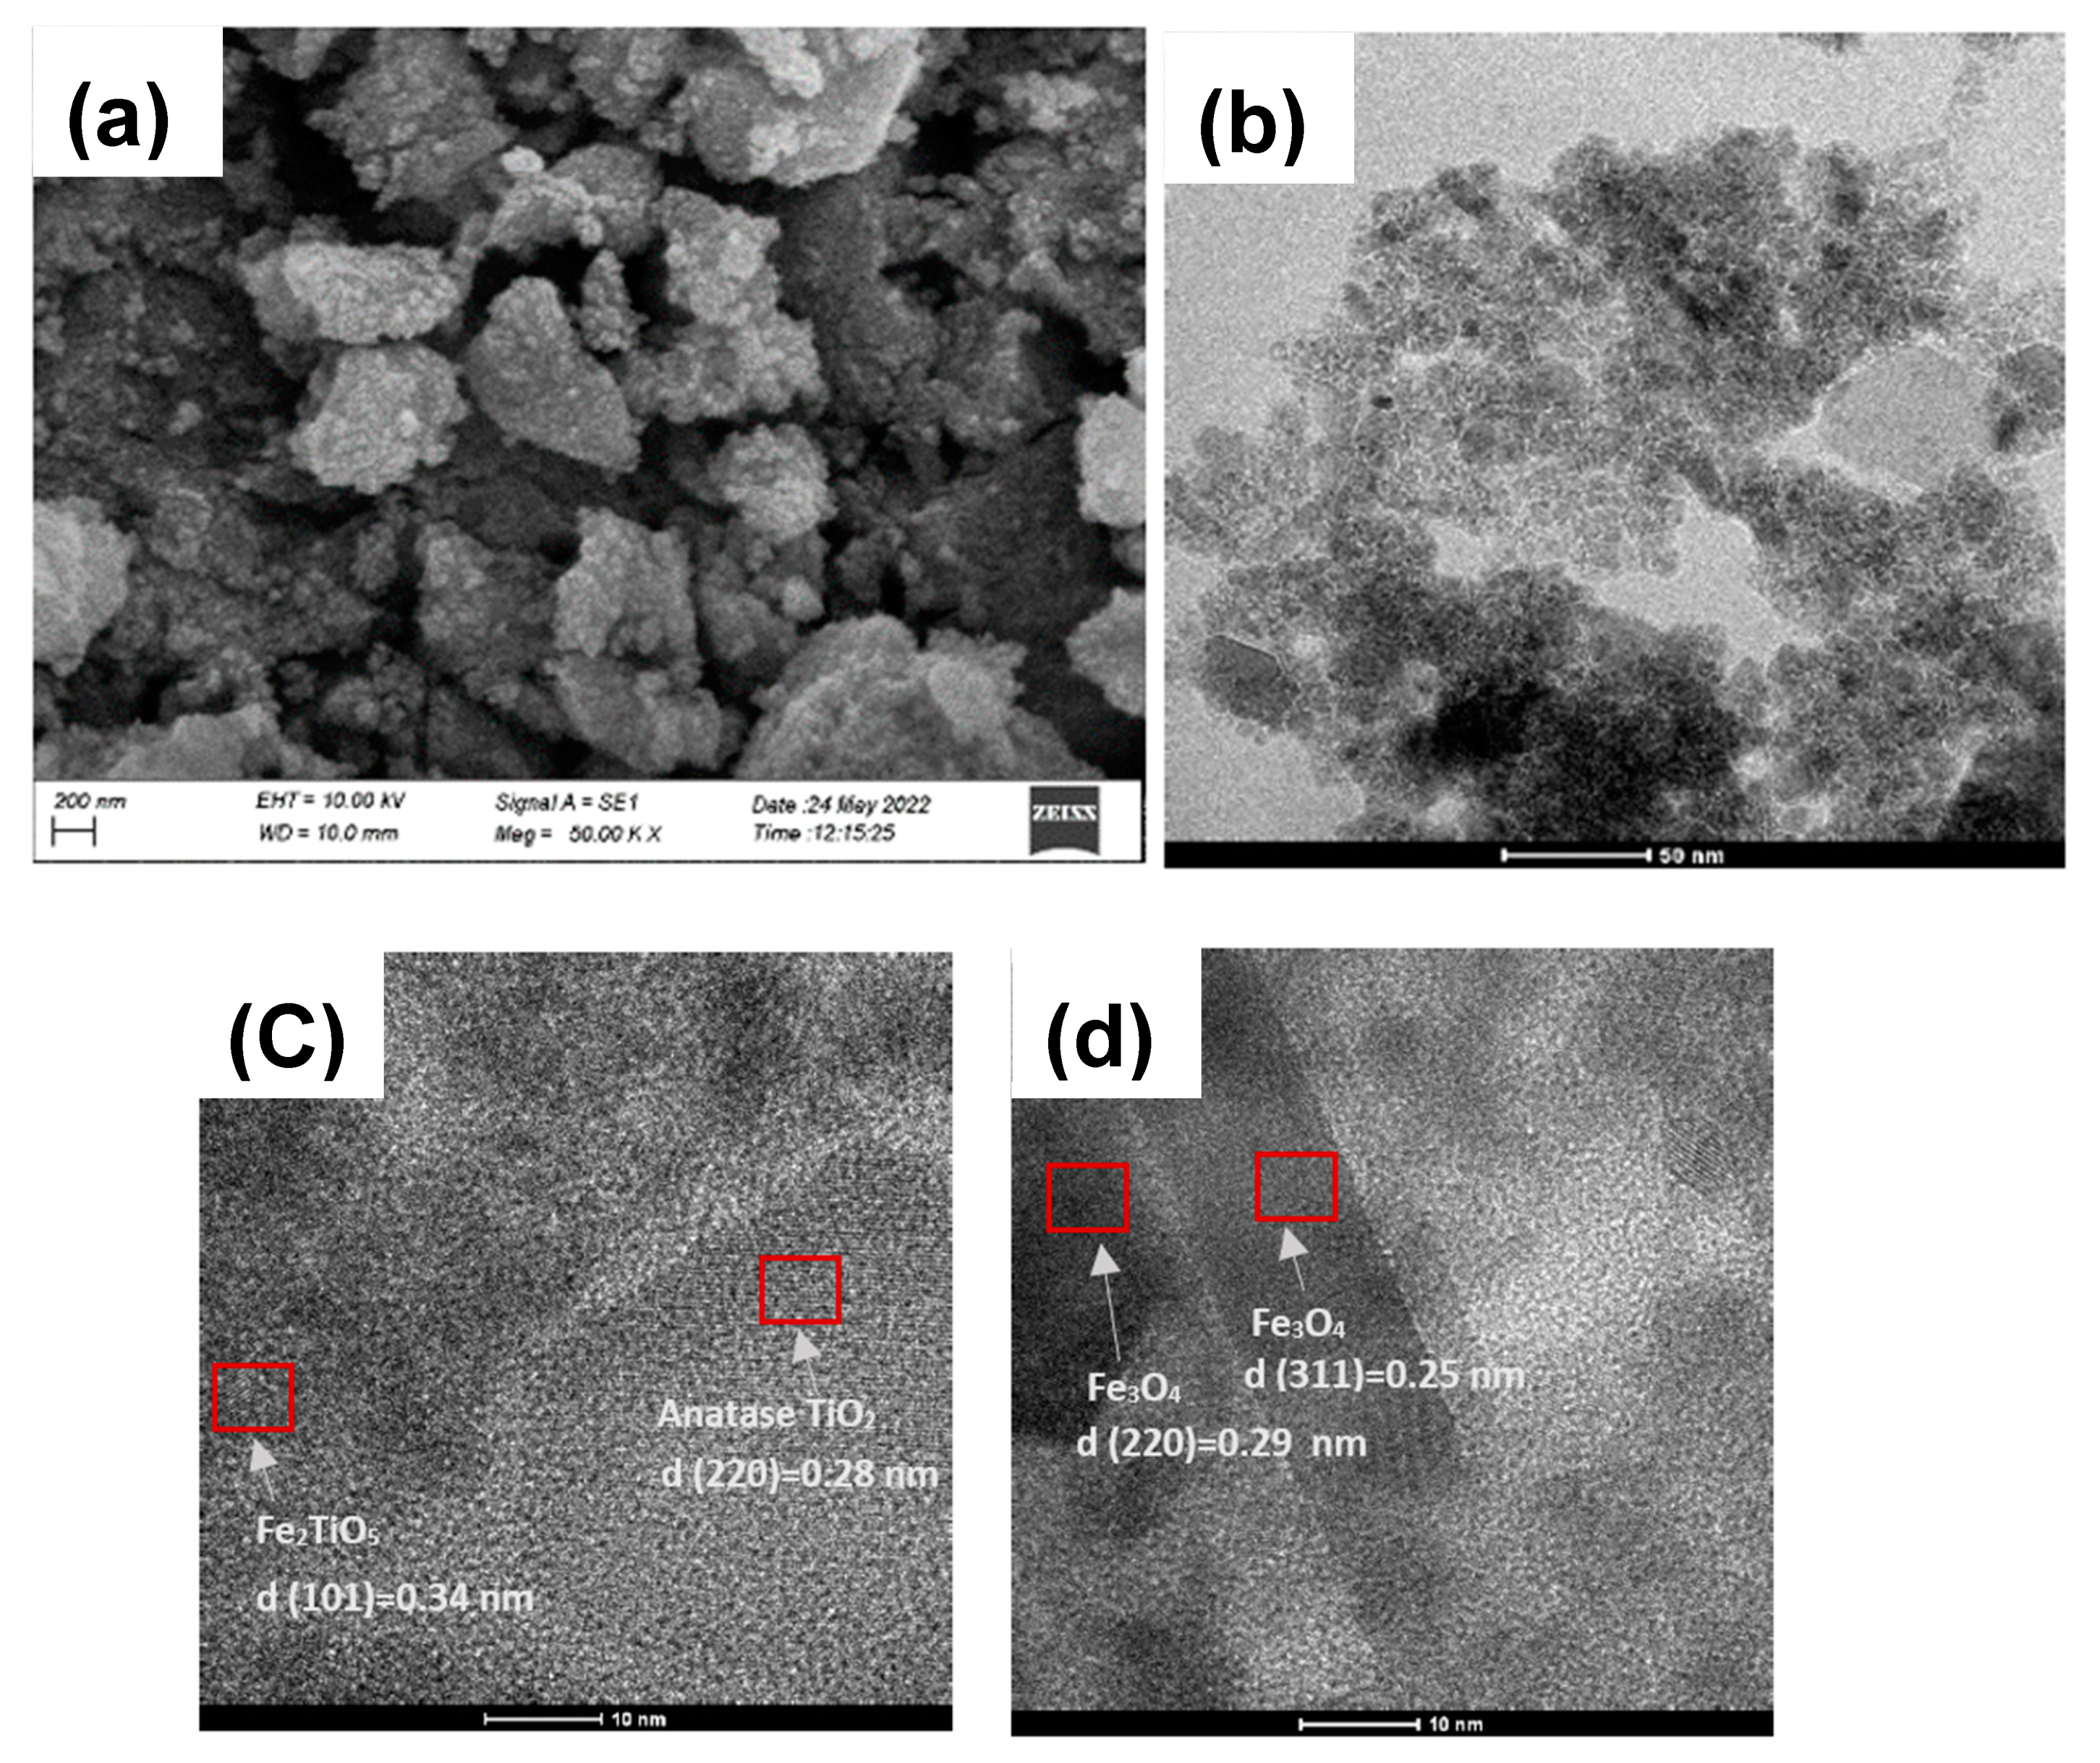
Figure 5.
(a) Nitrogen adsorption-desorption isotherms of Fe3O4/Fe2TiO5/TiO2 nanocomposite (b) Pore size distribution of Fe3O4/Fe2TiO5/TiO2 nanocomposite.
Figure 5.
(a) Nitrogen adsorption-desorption isotherms of Fe3O4/Fe2TiO5/TiO2 nanocomposite (b) Pore size distribution of Fe3O4/Fe2TiO5/TiO2 nanocomposite.
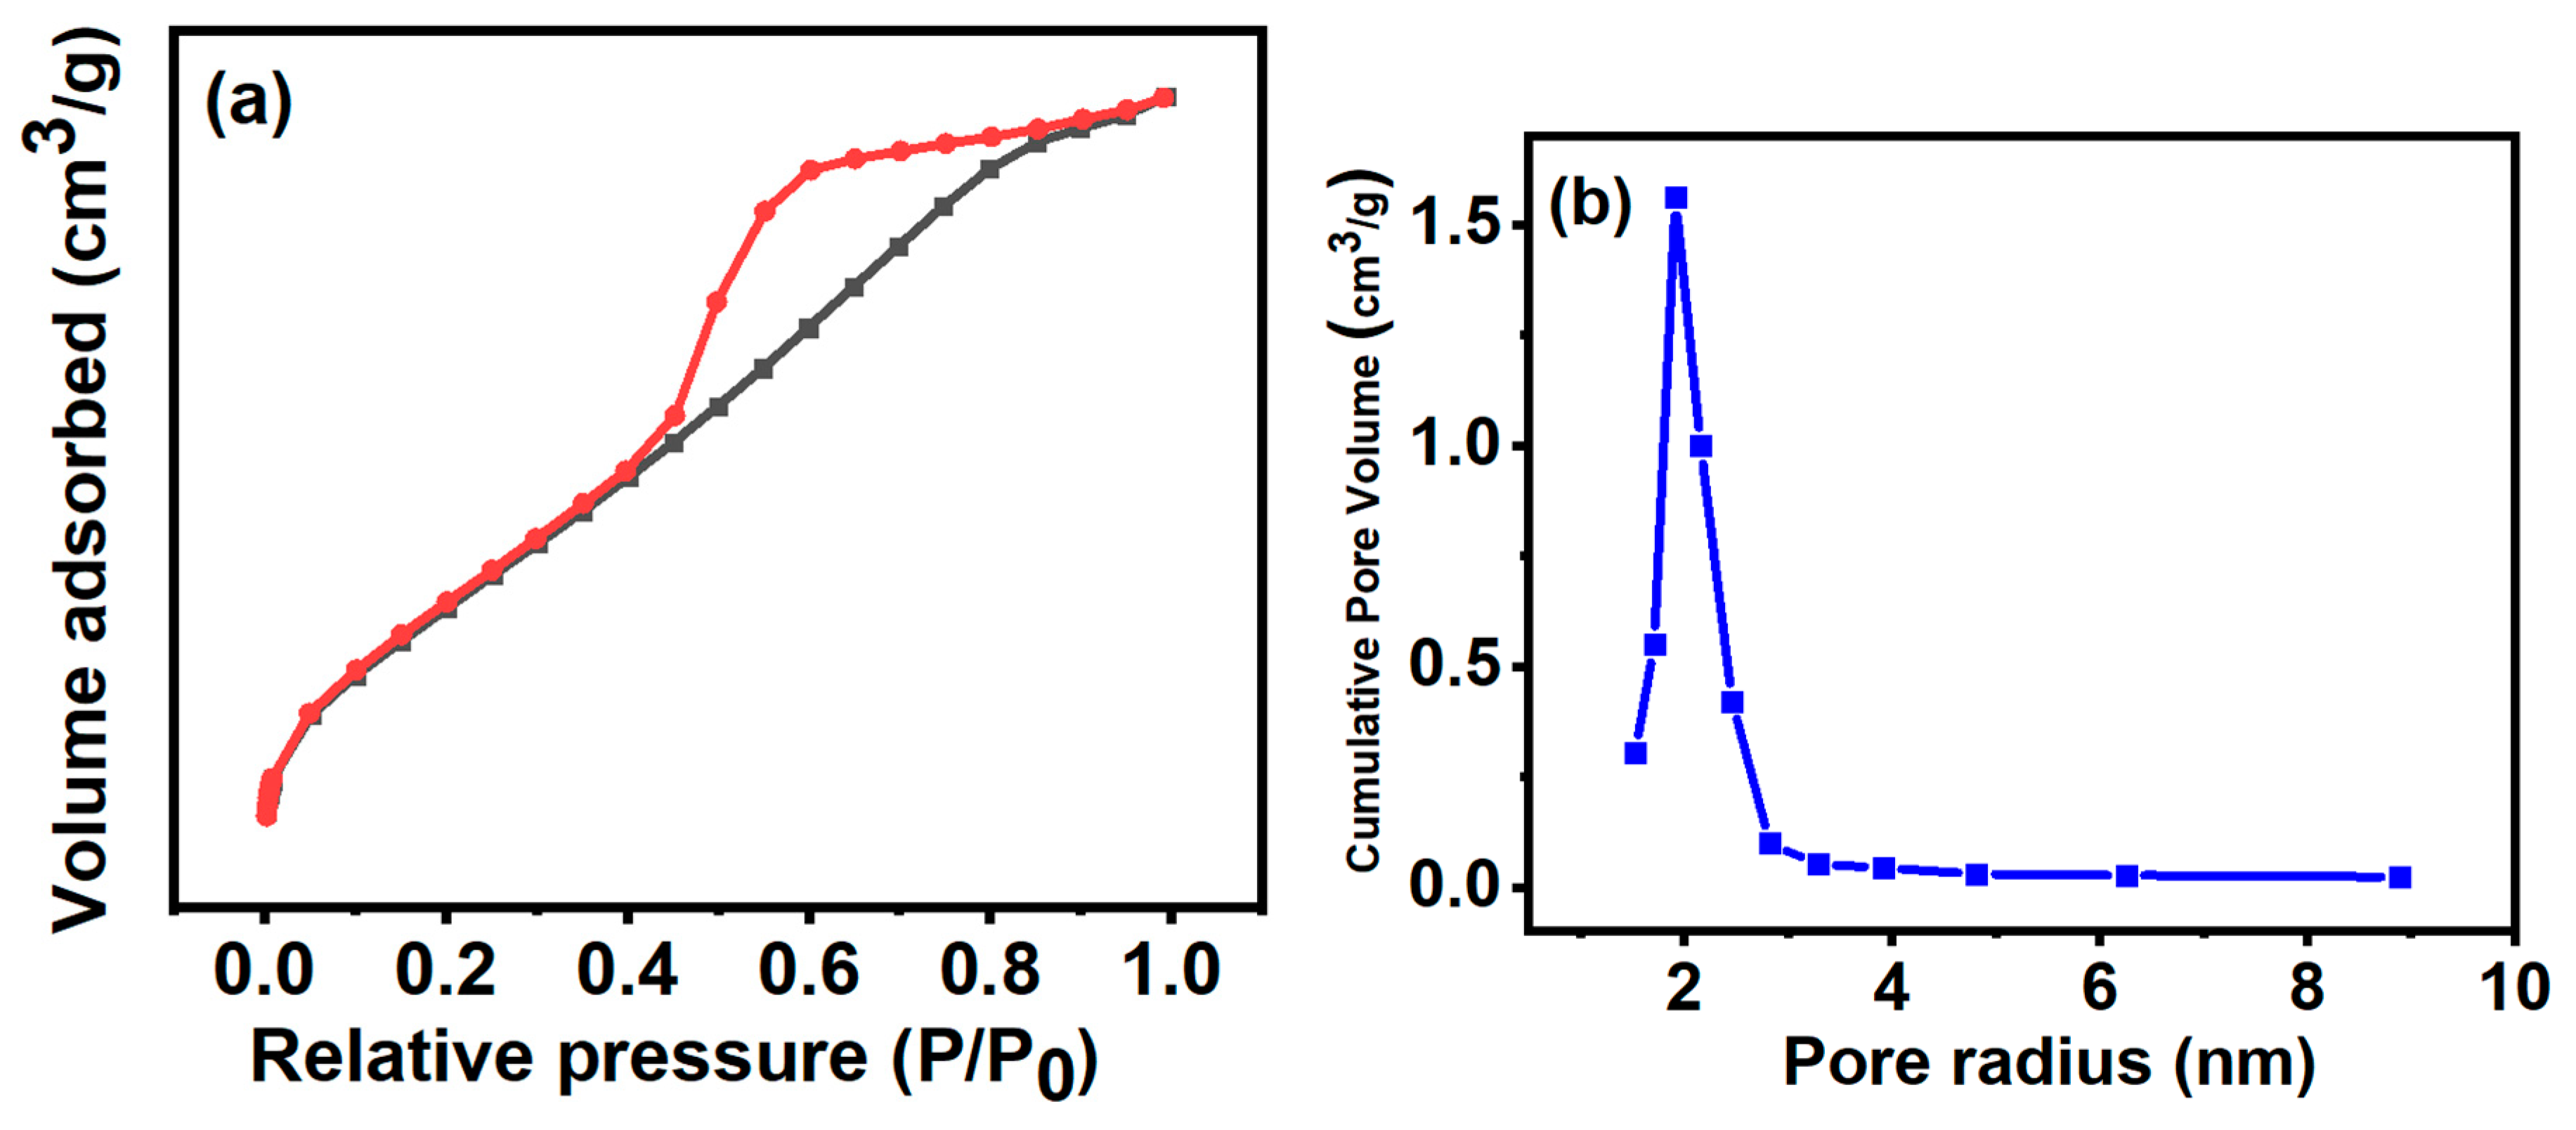
Figure 6.
(a) Effect of pH on adsorption of MB on Fe3O4/Fe2TiO5/TiO2 (b) Determination of the point of zero charge of Fe3O4/Fe2TiO5/TiO2.
Figure 6.
(a) Effect of pH on adsorption of MB on Fe3O4/Fe2TiO5/TiO2 (b) Determination of the point of zero charge of Fe3O4/Fe2TiO5/TiO2.
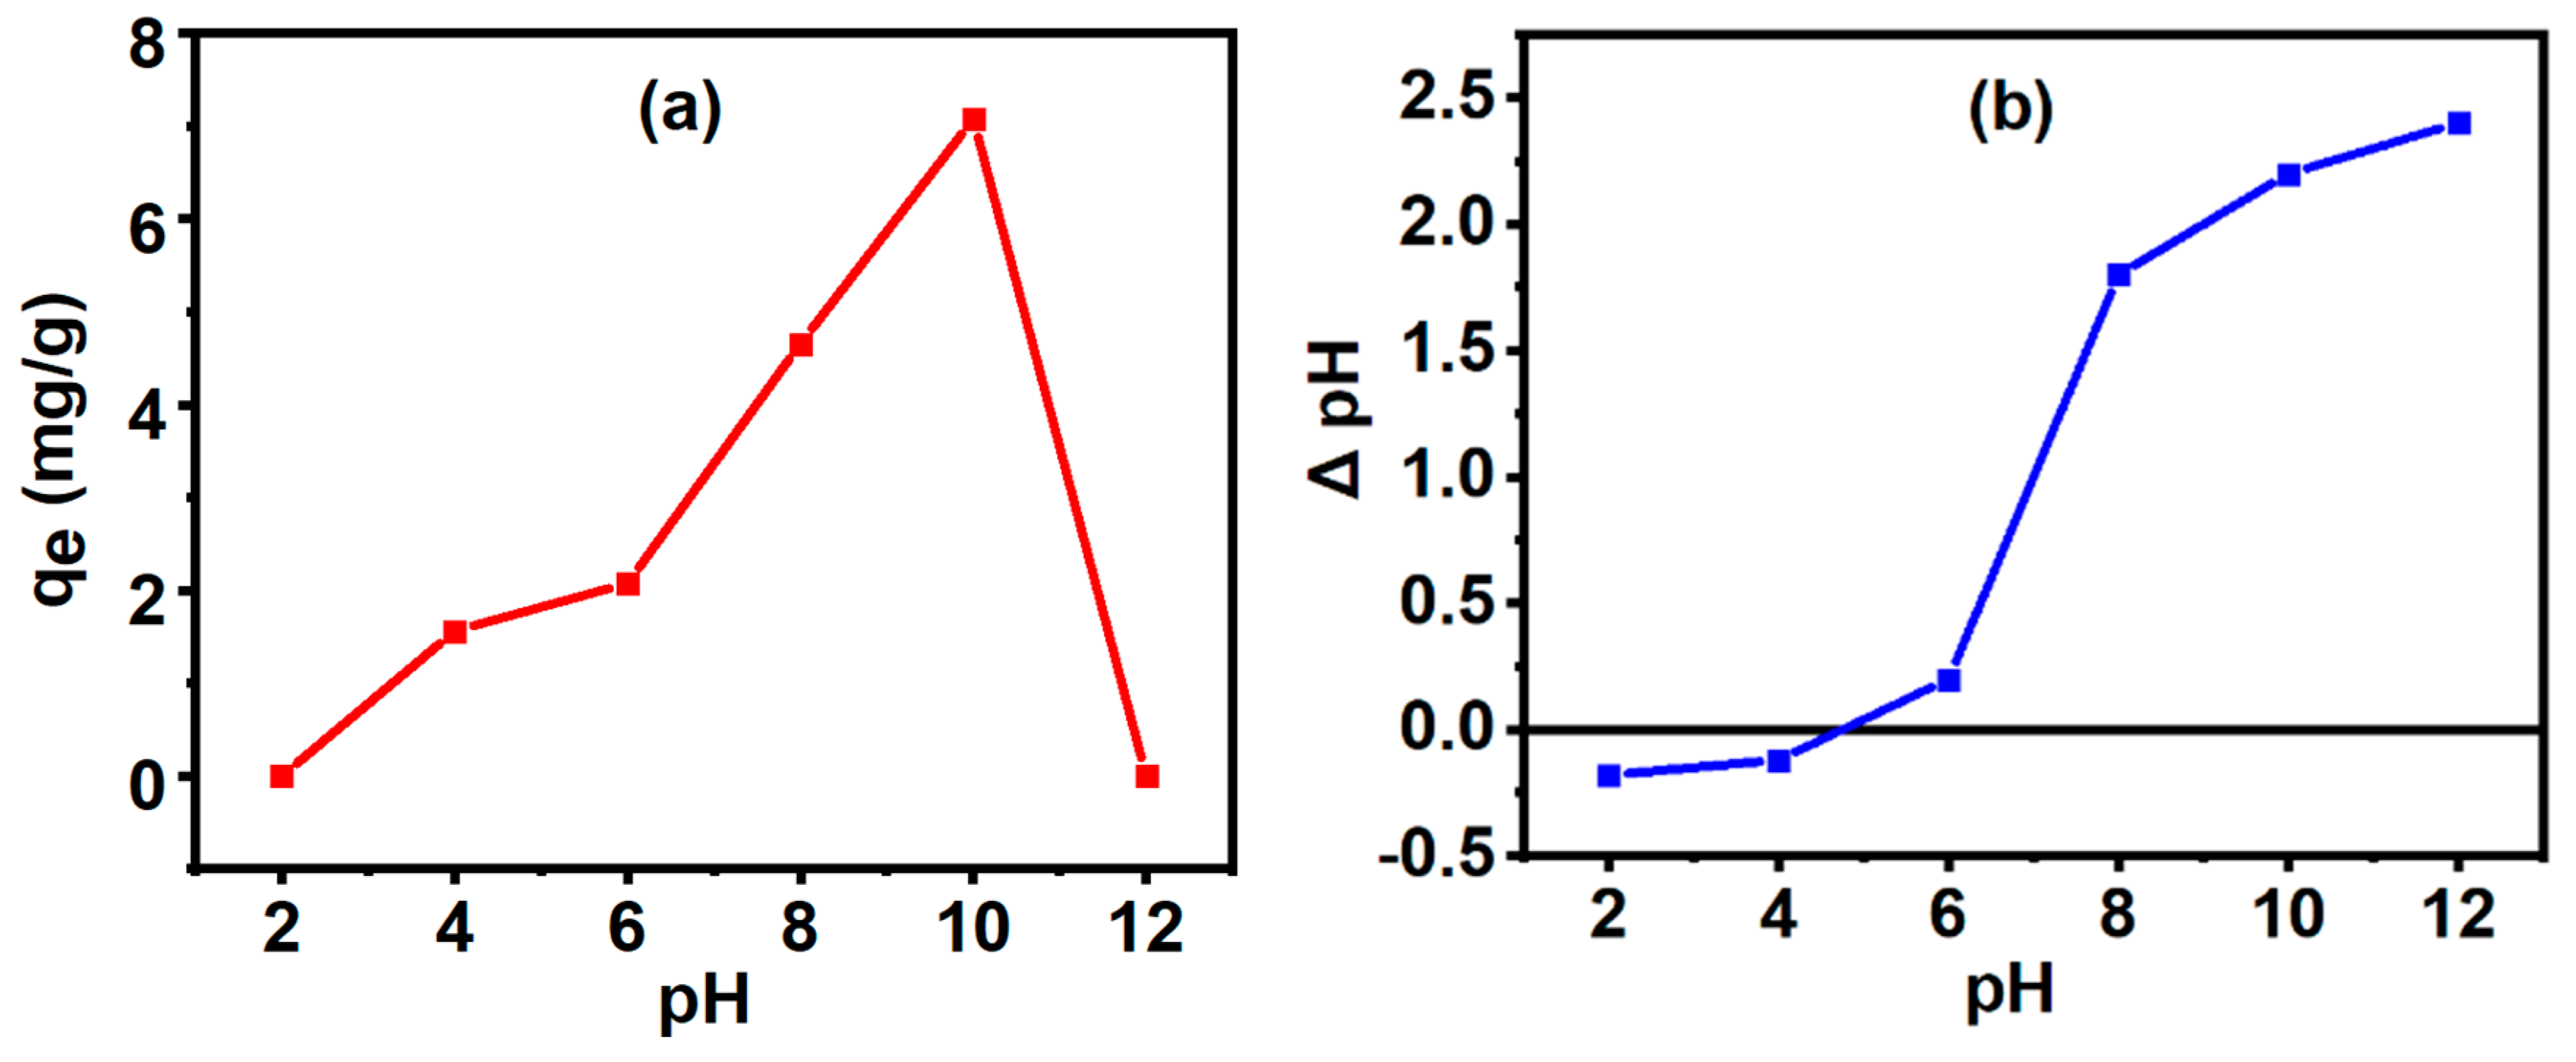
Figure 7.
Variation of adsorption capacity of Fe3O4/Fe2TiO5/TiO2 on (a) different concentrations of MB (b) different dosages of adsorbent.
Figure 7.
Variation of adsorption capacity of Fe3O4/Fe2TiO5/TiO2 on (a) different concentrations of MB (b) different dosages of adsorbent.
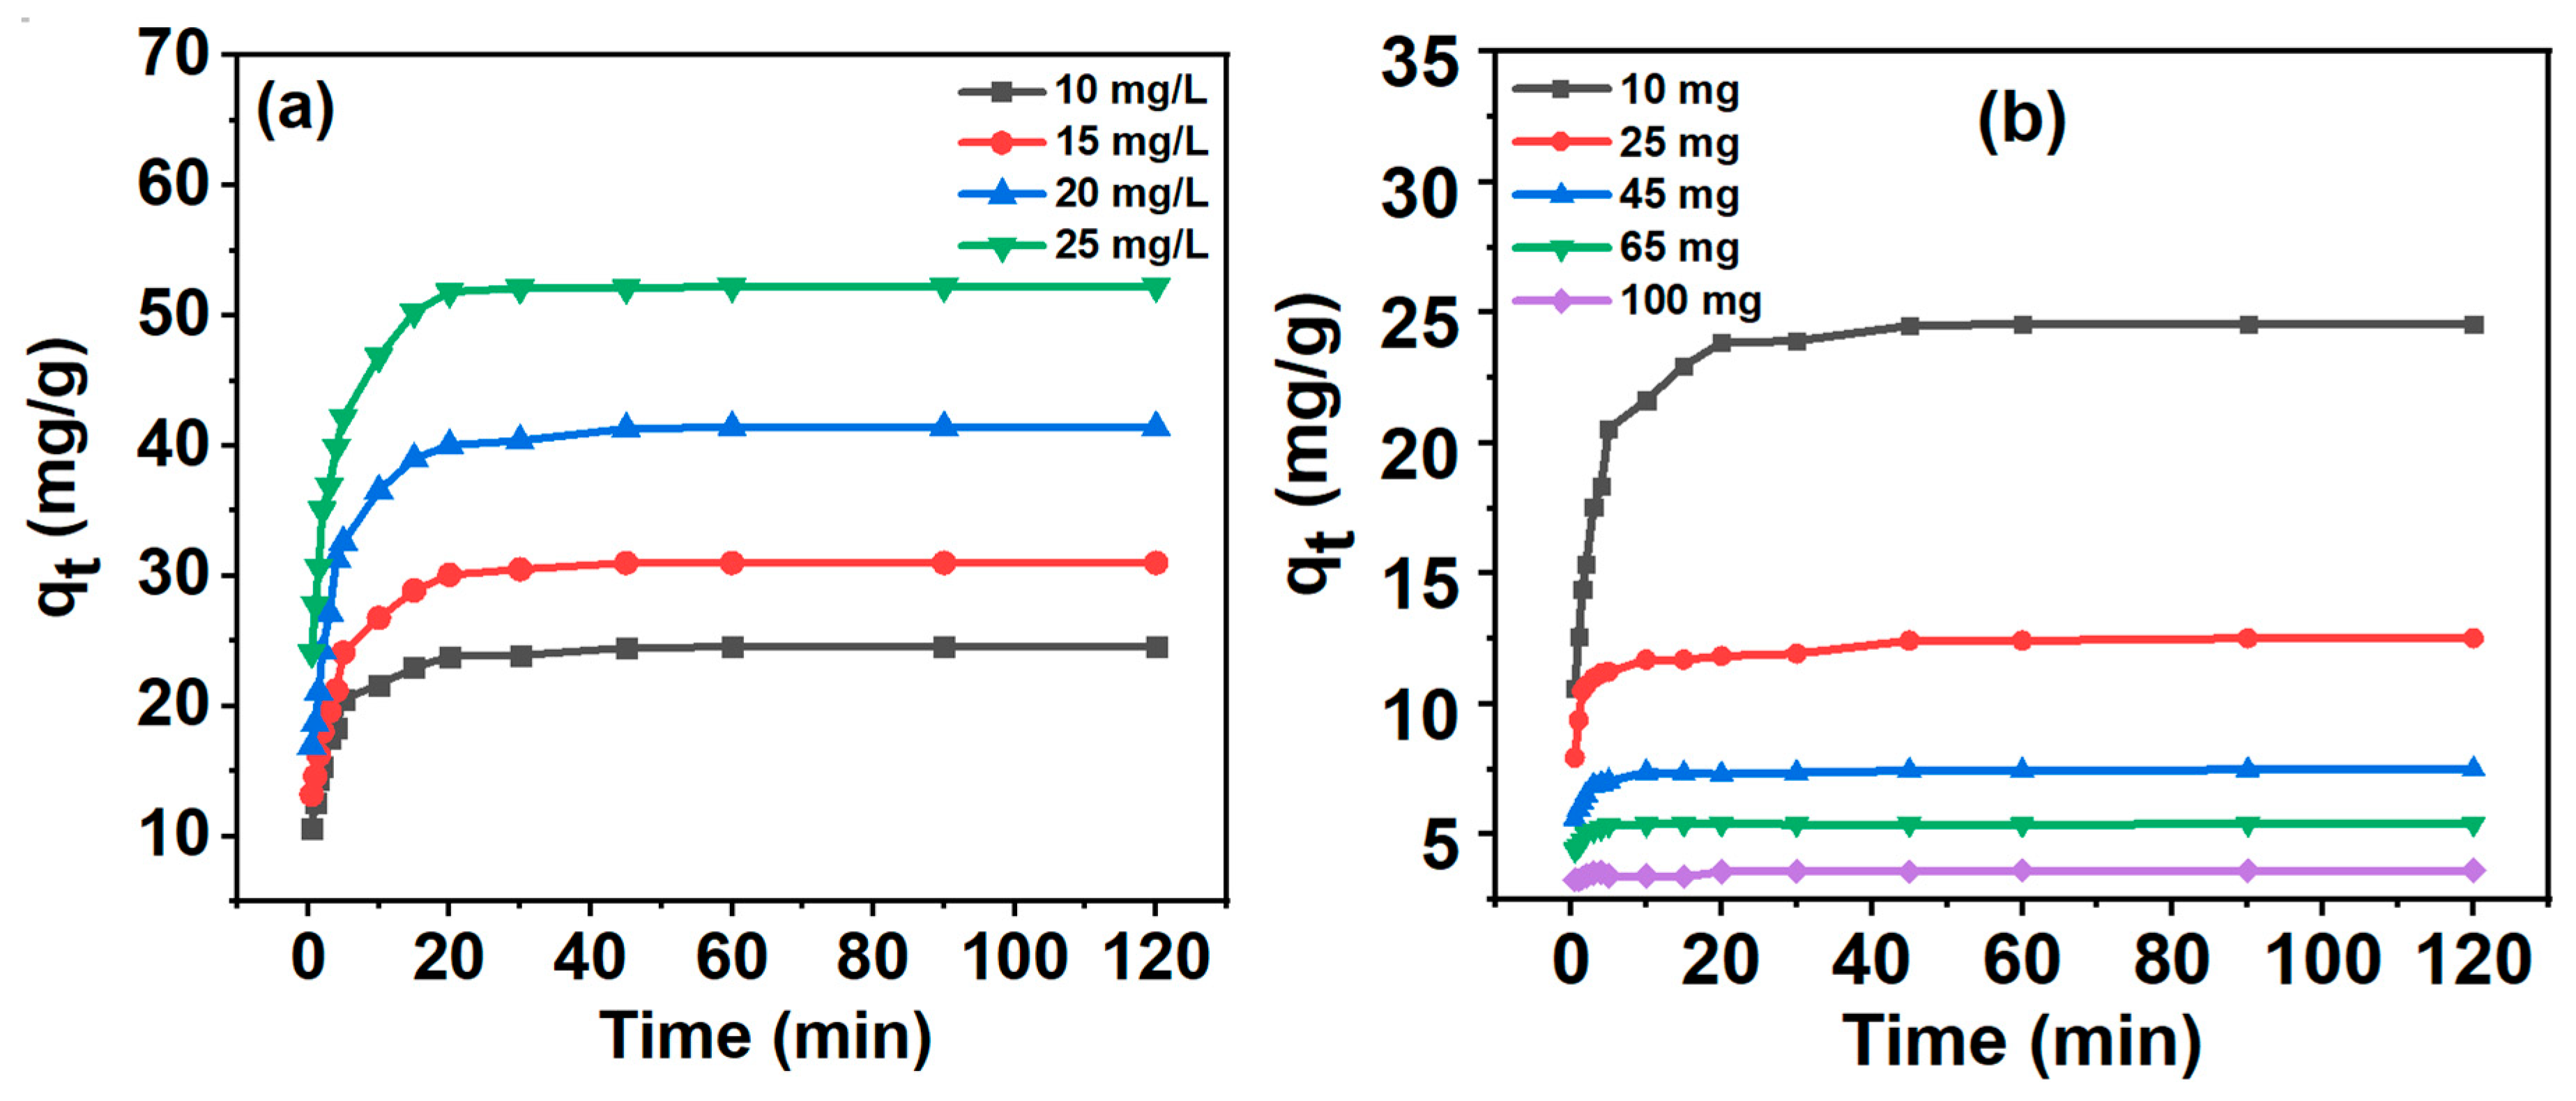
Figure 8.
Effect of Fe3O4/Fe2TiO5/TiO2 dosage on MB adsorption capacity.
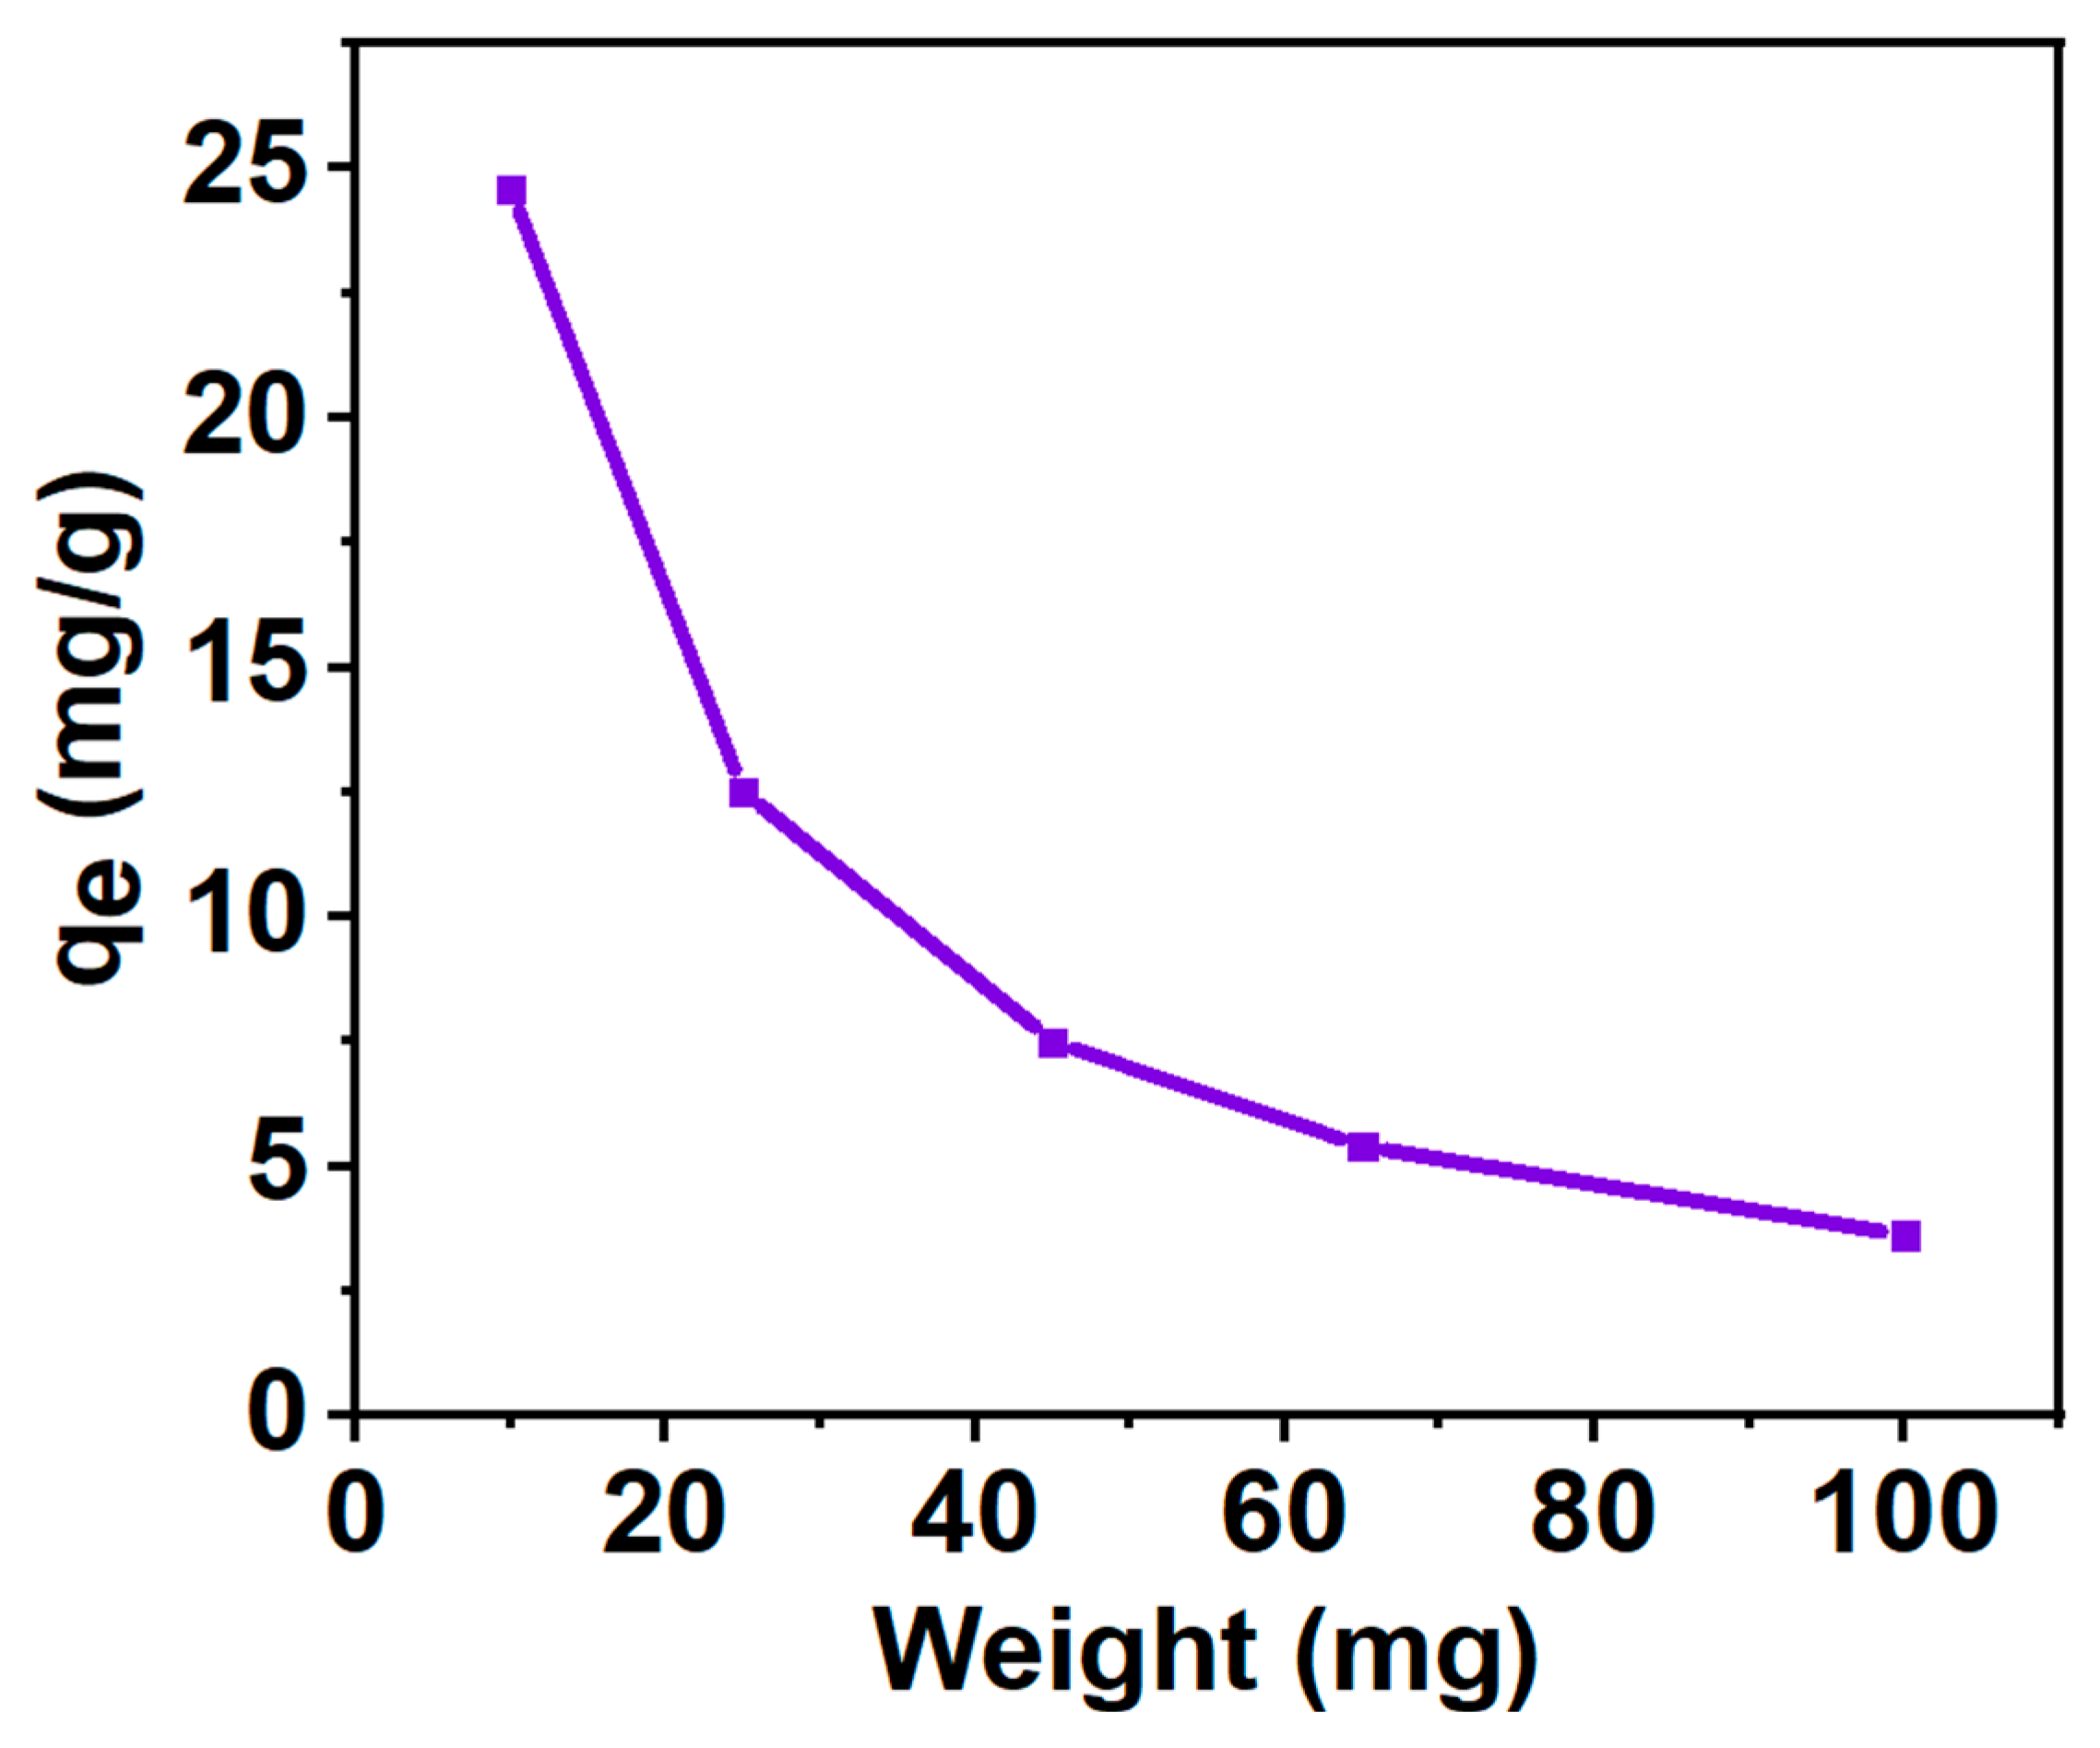
Figure 9.
(a) Pseudo-first order and (b) Pseudo-second-order kinetics model for adsorption of MB to Fe3O4/Fe2TiO5/TiO2 nanocomposite.
Figure 9.
(a) Pseudo-first order and (b) Pseudo-second-order kinetics model for adsorption of MB to Fe3O4/Fe2TiO5/TiO2 nanocomposite.
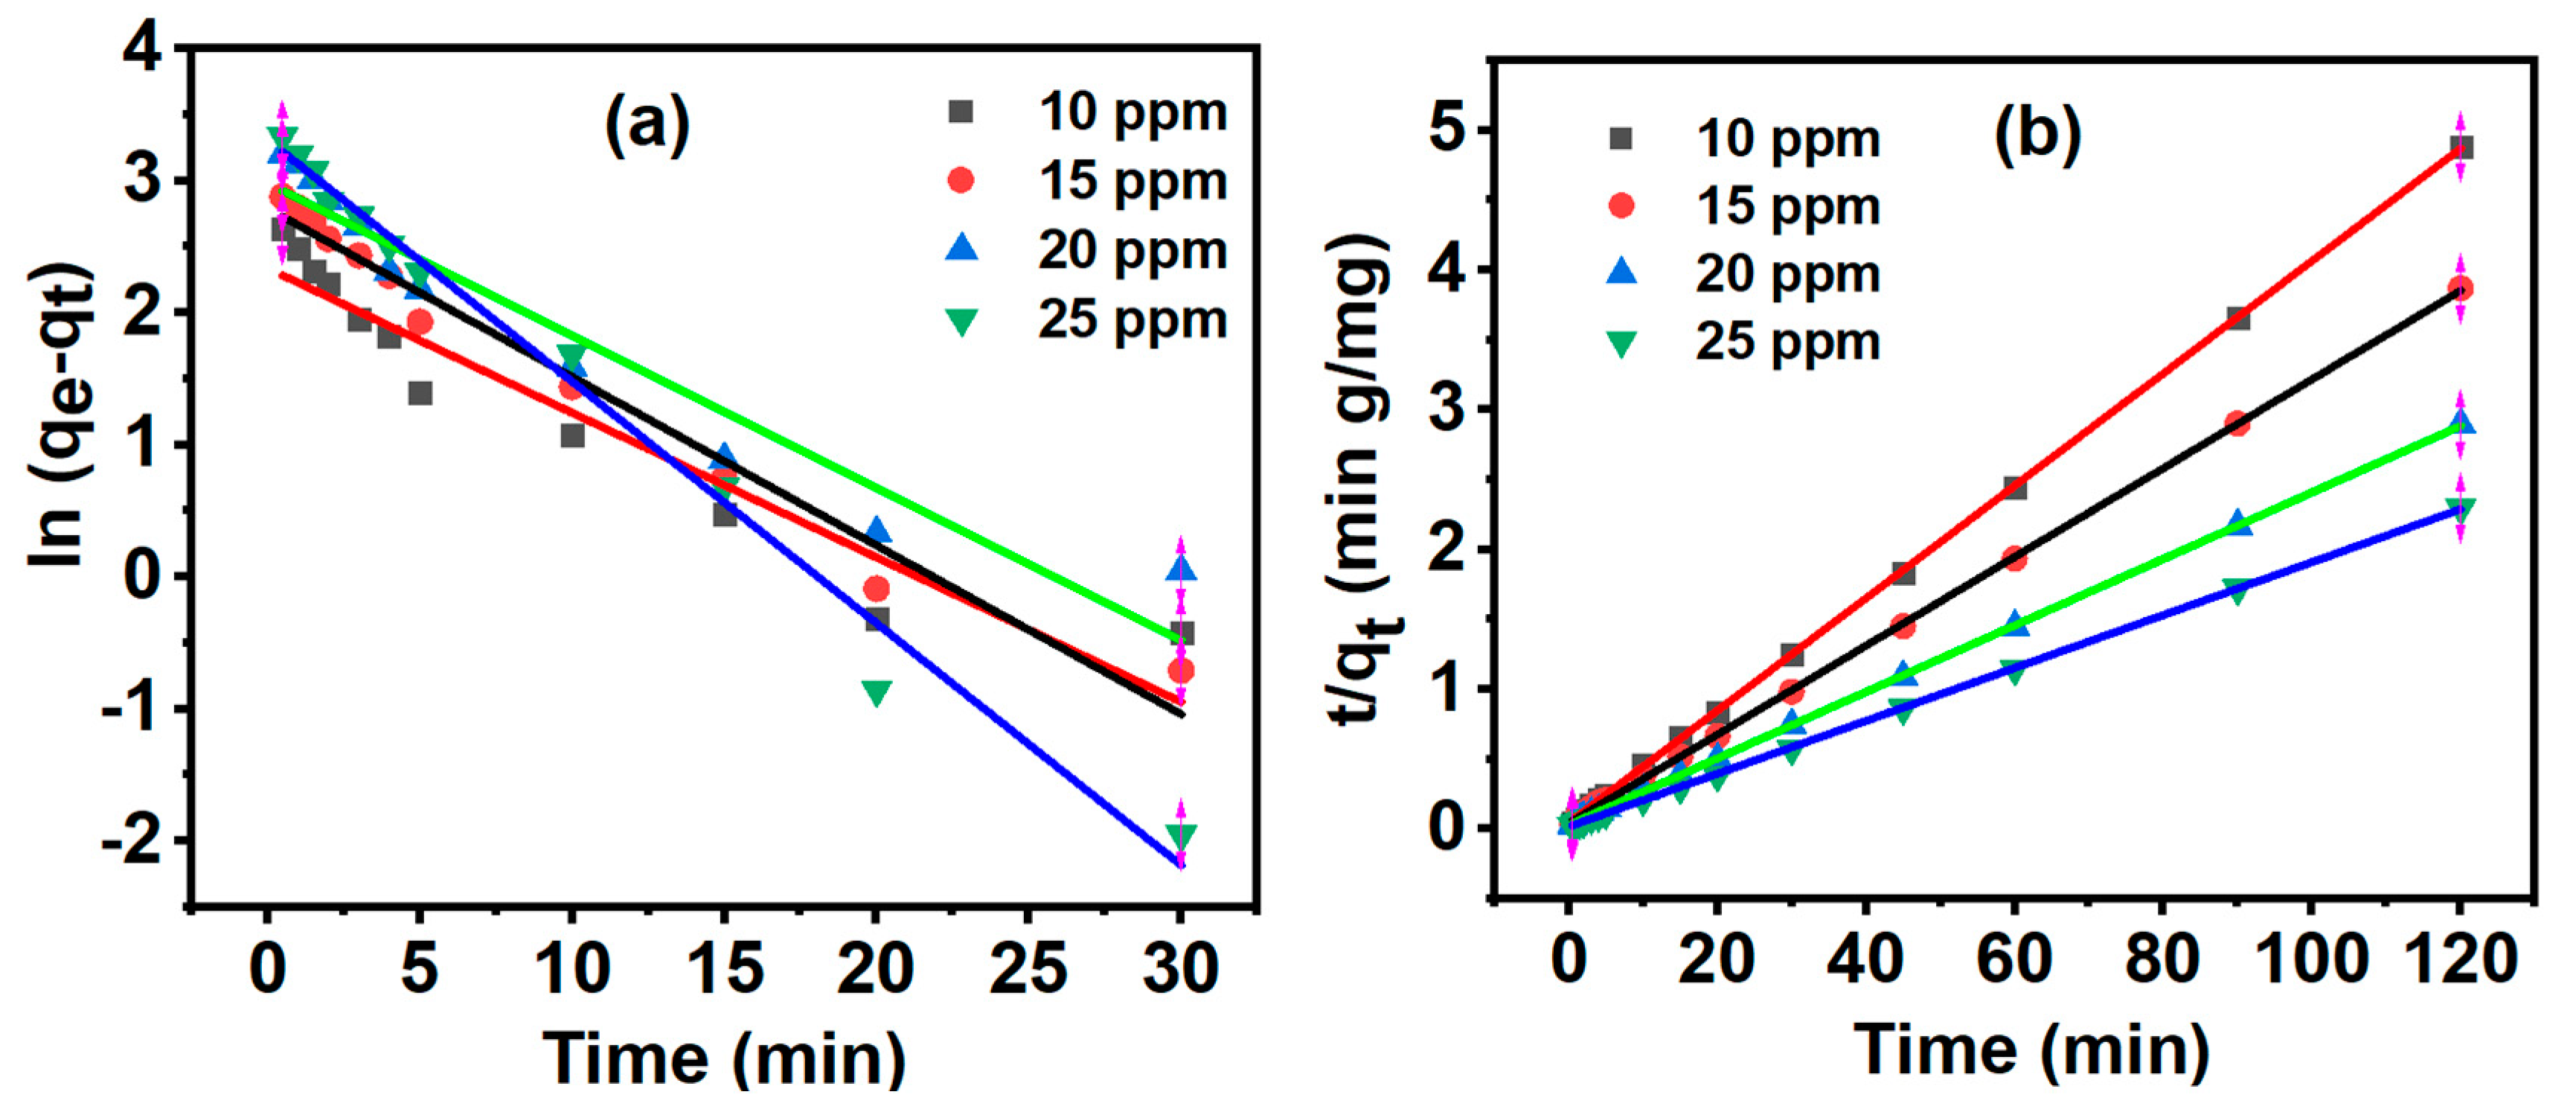
Figure 10.
Intraparticle diffusion model for adsorption of MB to Fe3O4/Fe2TiO5/TiO2 nanocomposite.
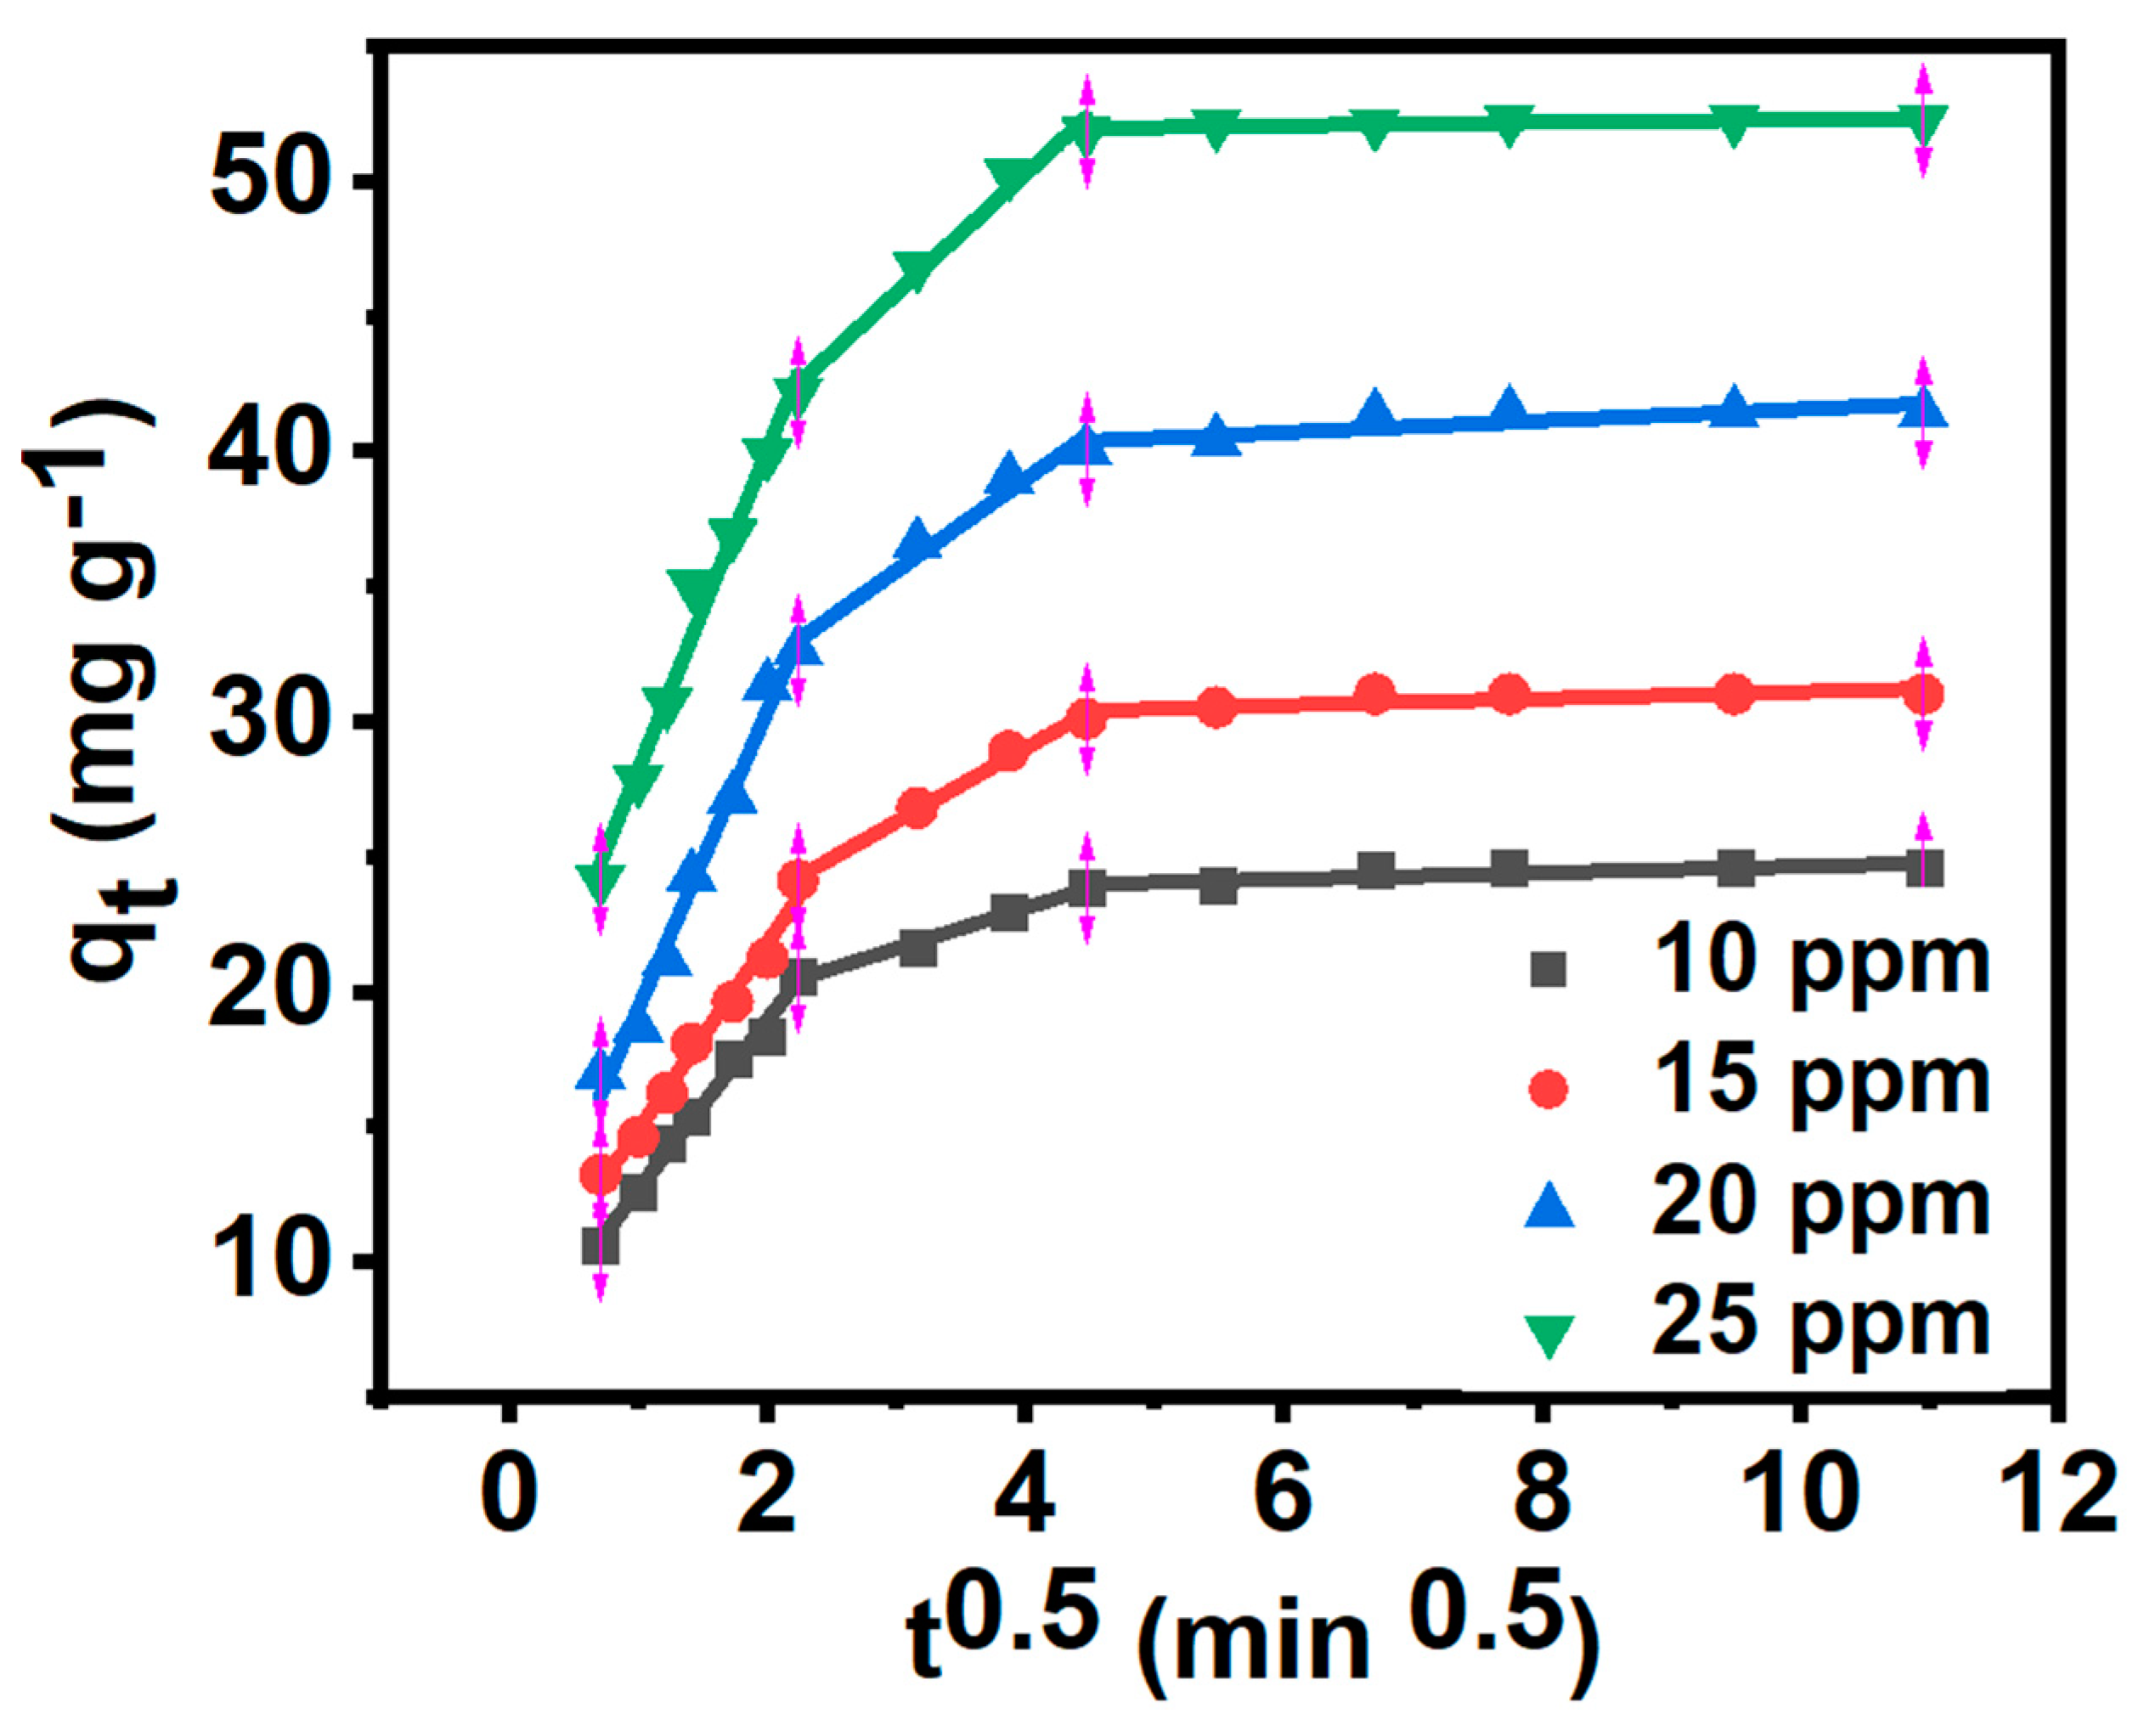
Figure 12.
Elovich model for adsorption of MB to Fe3O4/Fe2TiO5/TiO2 nanocomposite.
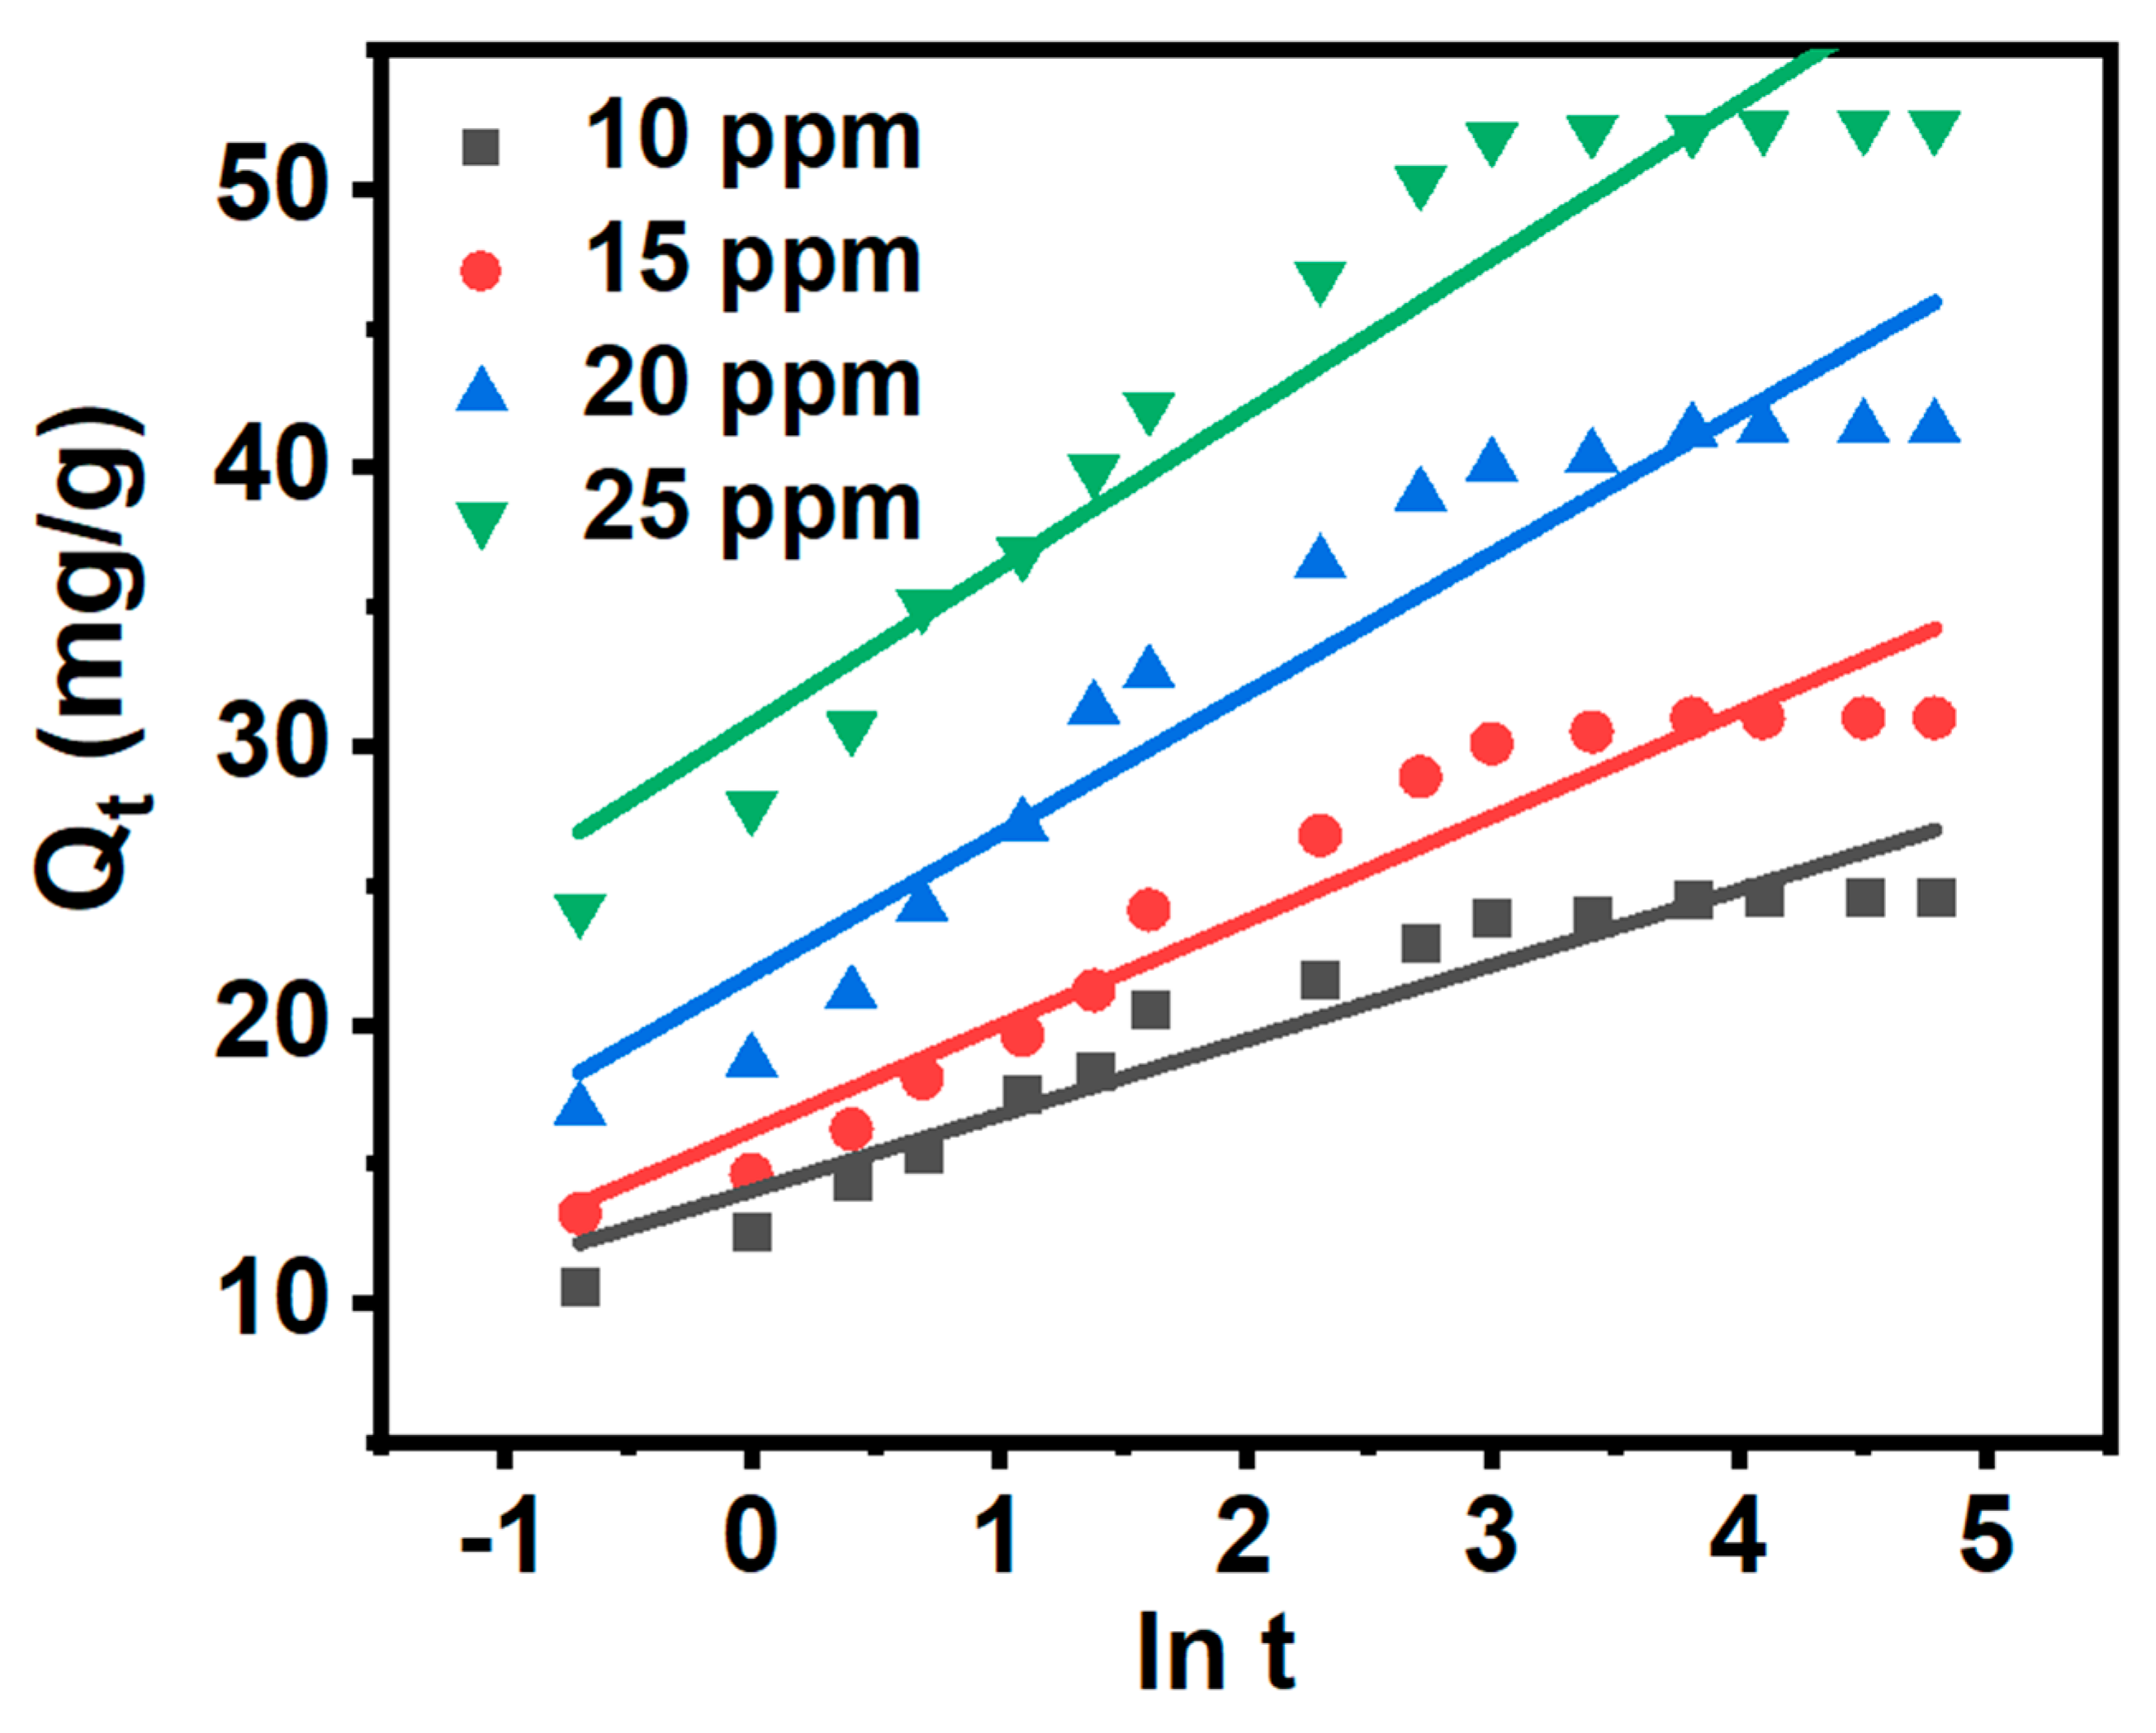
Figure 13.
(a) Langmuir, (b) Freundlich and (c) Temkin (d) Dubinin adsorption isotherm models of MB adsorption onto Fe3O4/Fe2TiO5/TiO2 nanocomposite.
Figure 13.
(a) Langmuir, (b) Freundlich and (c) Temkin (d) Dubinin adsorption isotherm models of MB adsorption onto Fe3O4/Fe2TiO5/TiO2 nanocomposite.
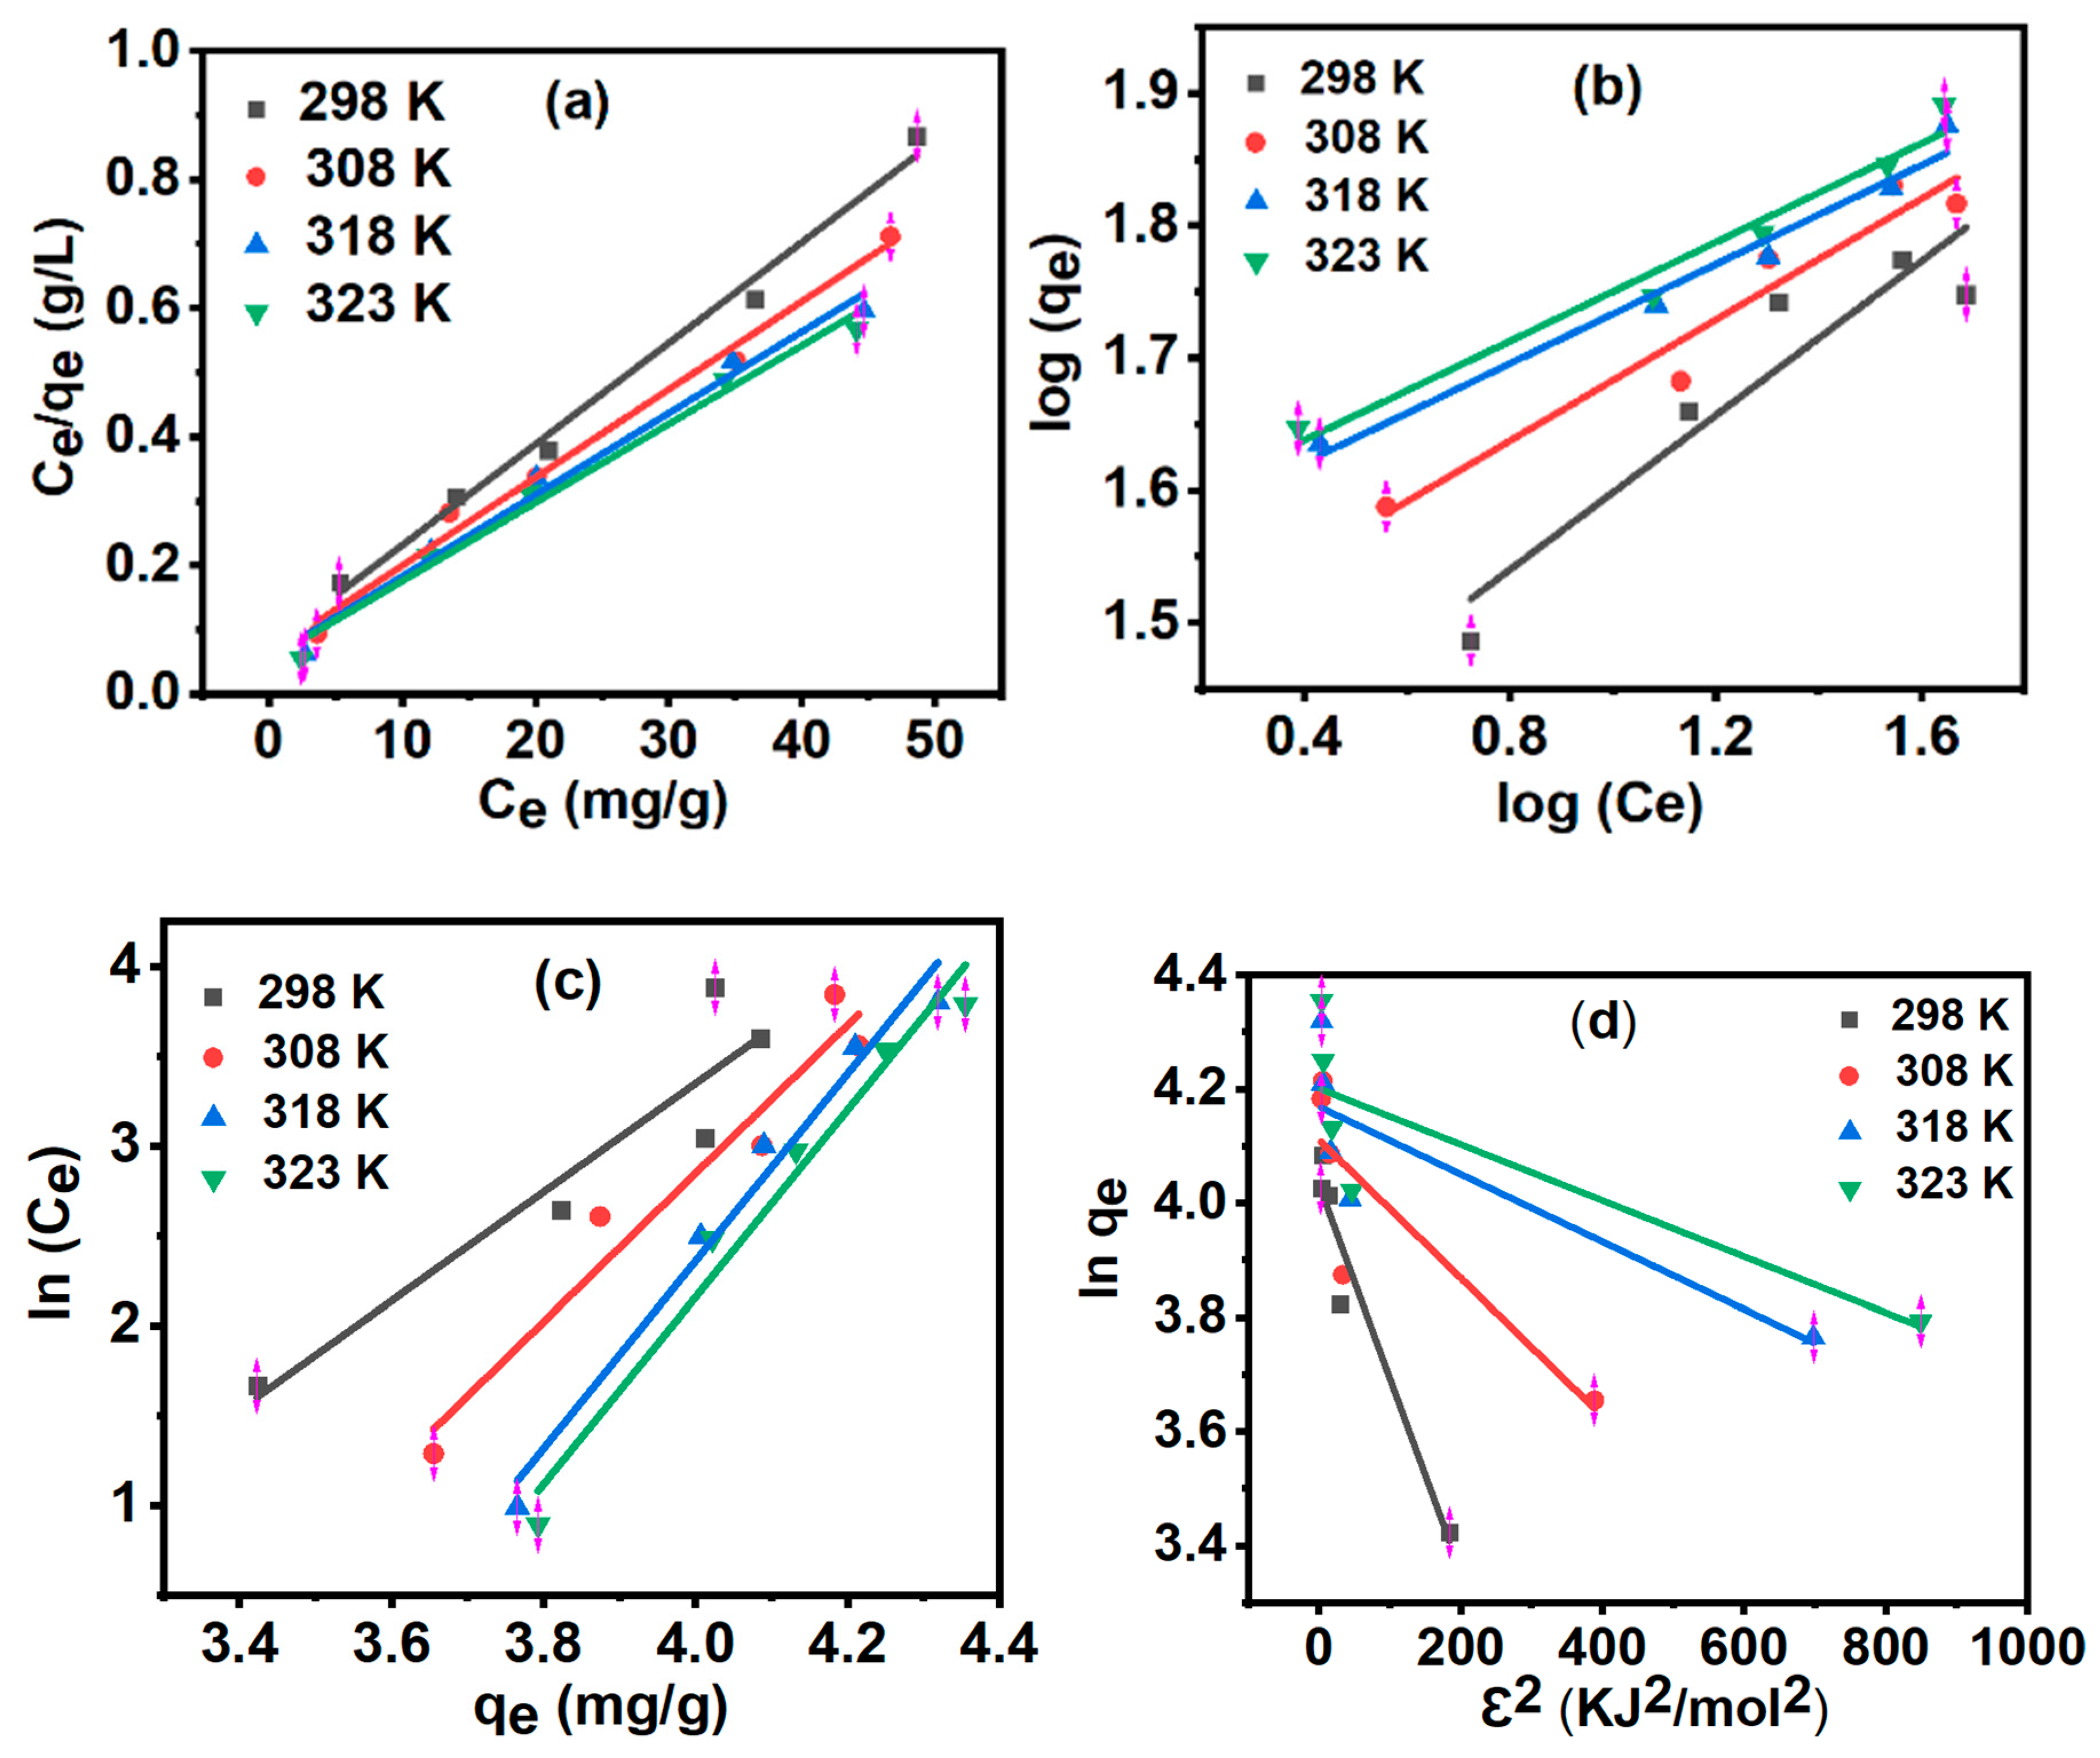
Figure 14.
Van’t Hoff plots of MB adsorption onto Fe3O4/Fe2TiO5/TiO2 nanocomposite.
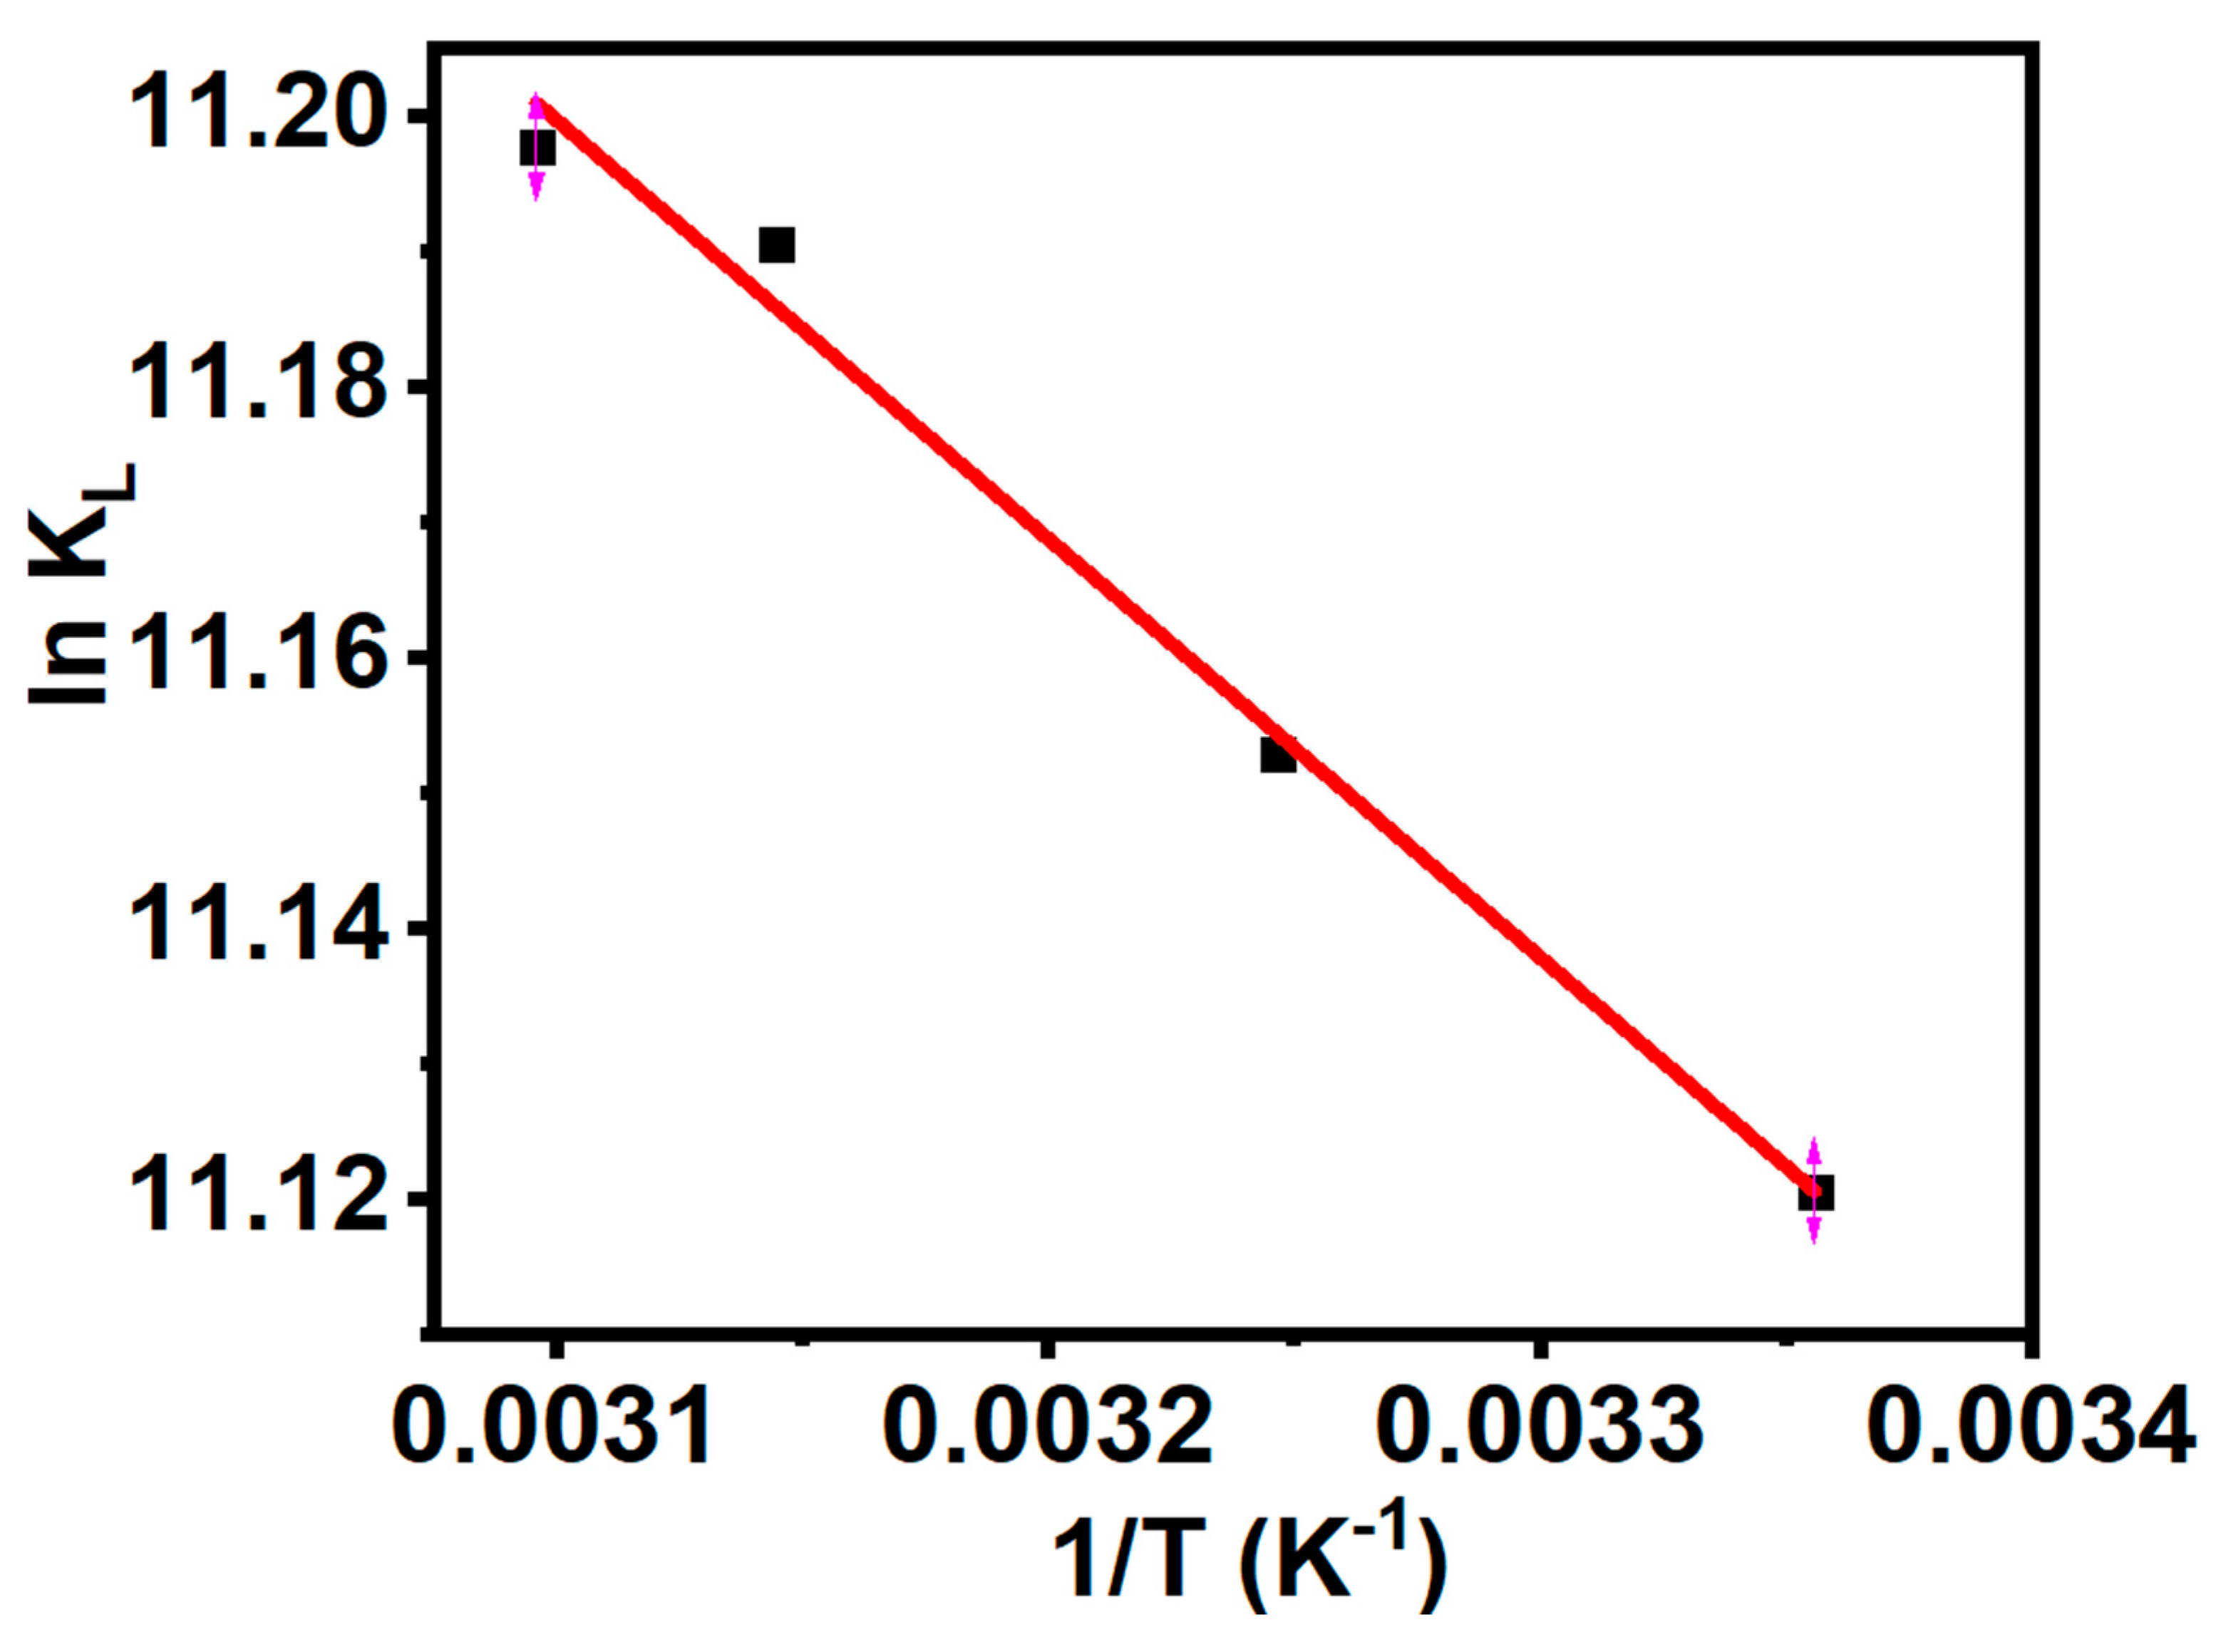
Figure 15.
(a) Pseudo-second-order kinetic model plotted for the adsorption of MB at four different temperatures and (b) Arrhenius plots constructed for the adsorption of Fe3O4/Fe2TiO5/TiO2.
Figure 15.
(a) Pseudo-second-order kinetic model plotted for the adsorption of MB at four different temperatures and (b) Arrhenius plots constructed for the adsorption of Fe3O4/Fe2TiO5/TiO2.
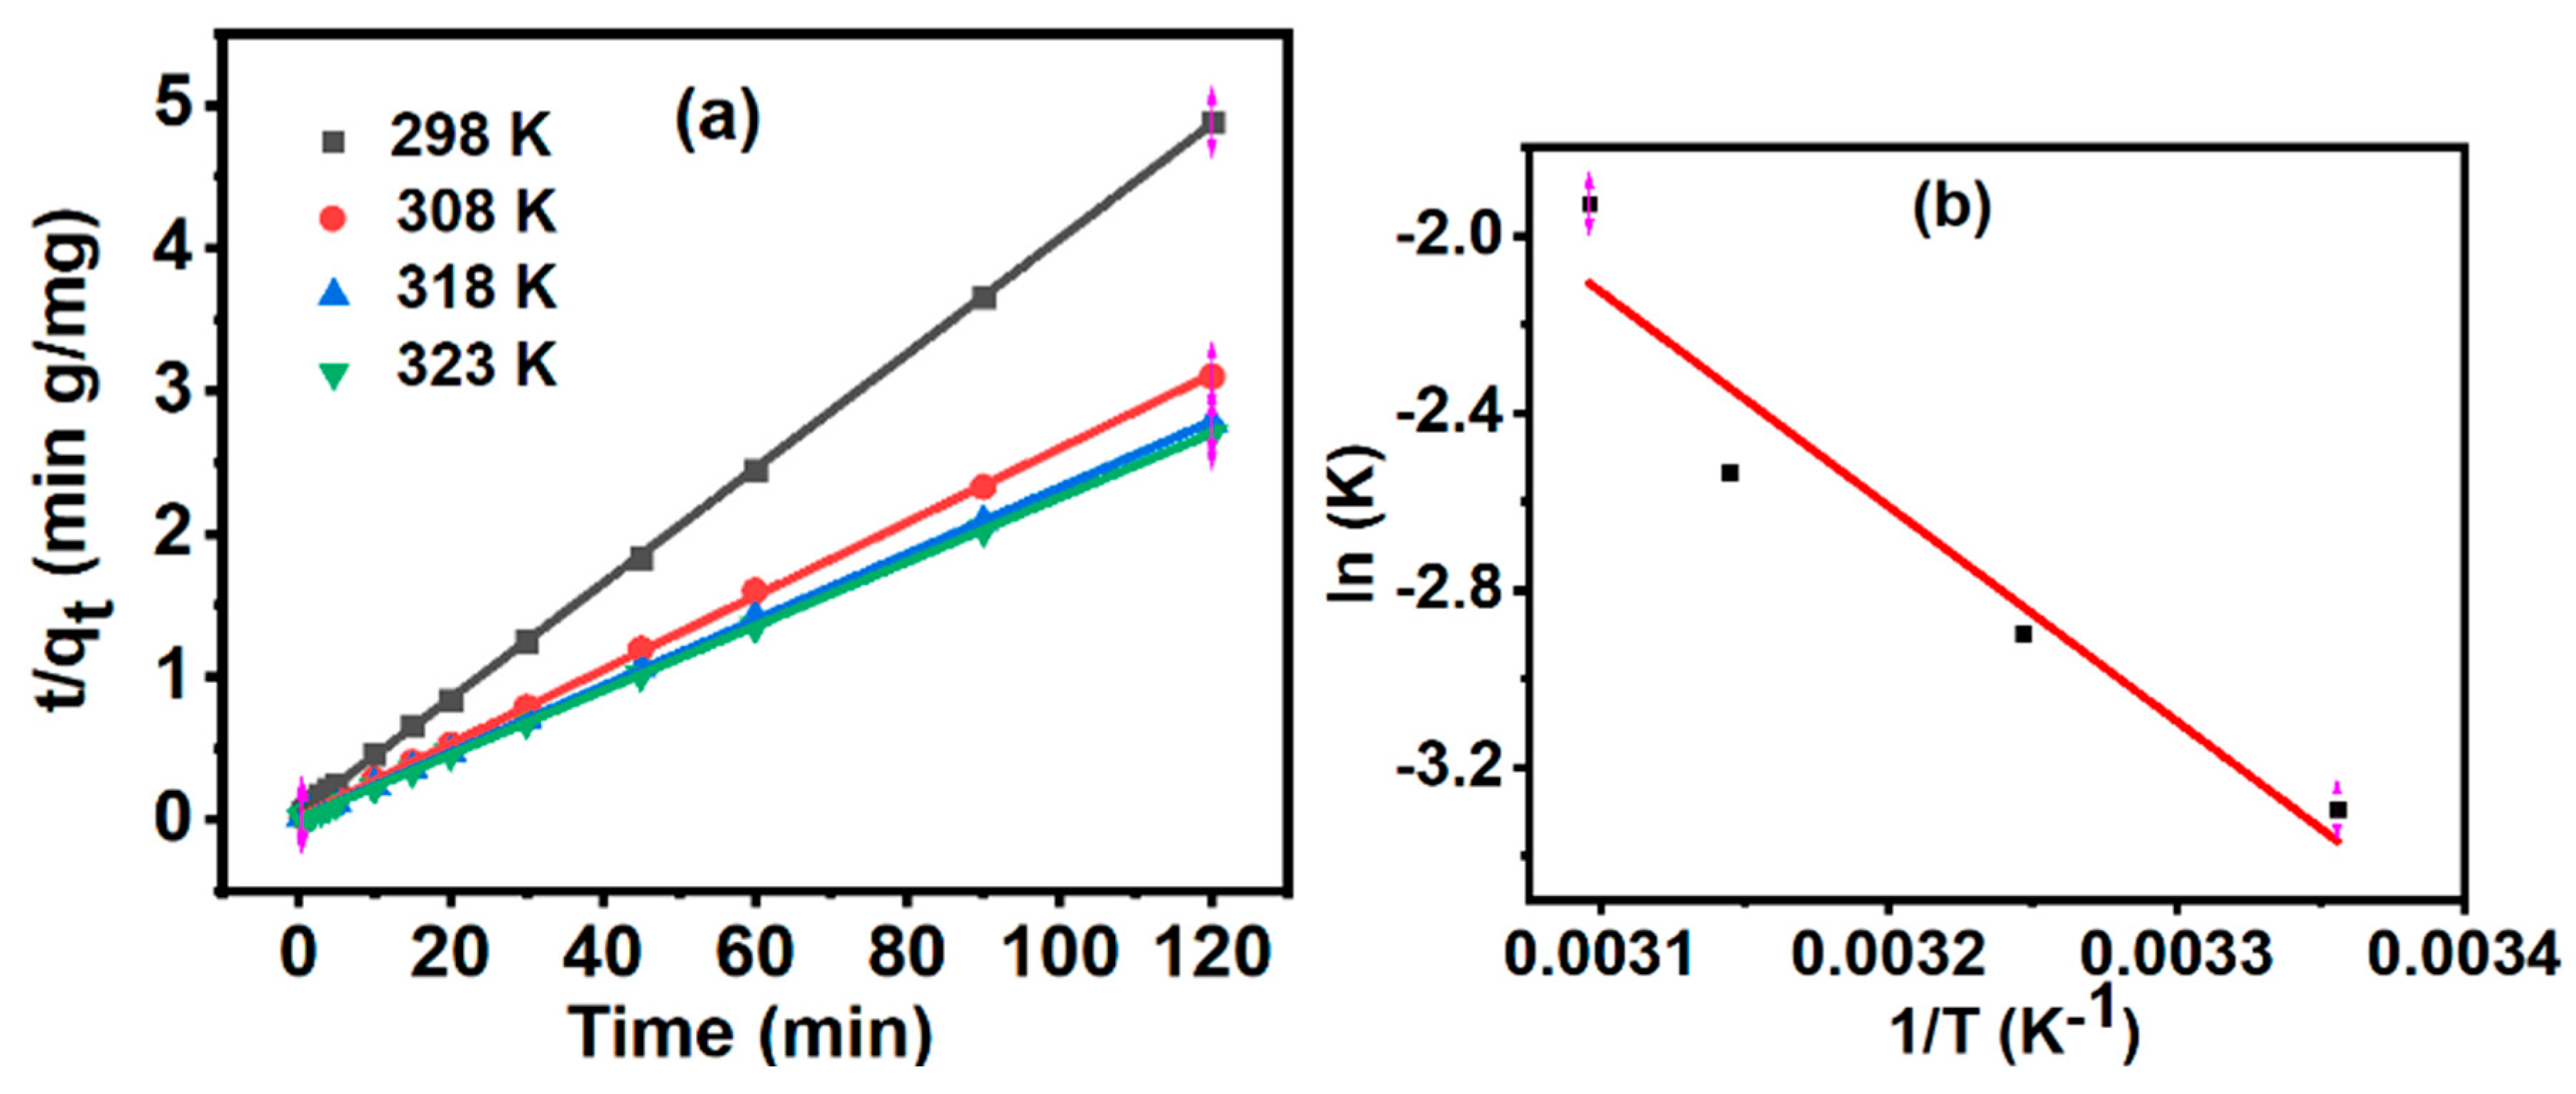
Figure 16.
(a) C/C0 vs time (b) equilibrium adsorption capacity of five adsorption-desorption cycles.
Figure 16.
(a) C/C0 vs time (b) equilibrium adsorption capacity of five adsorption-desorption cycles.
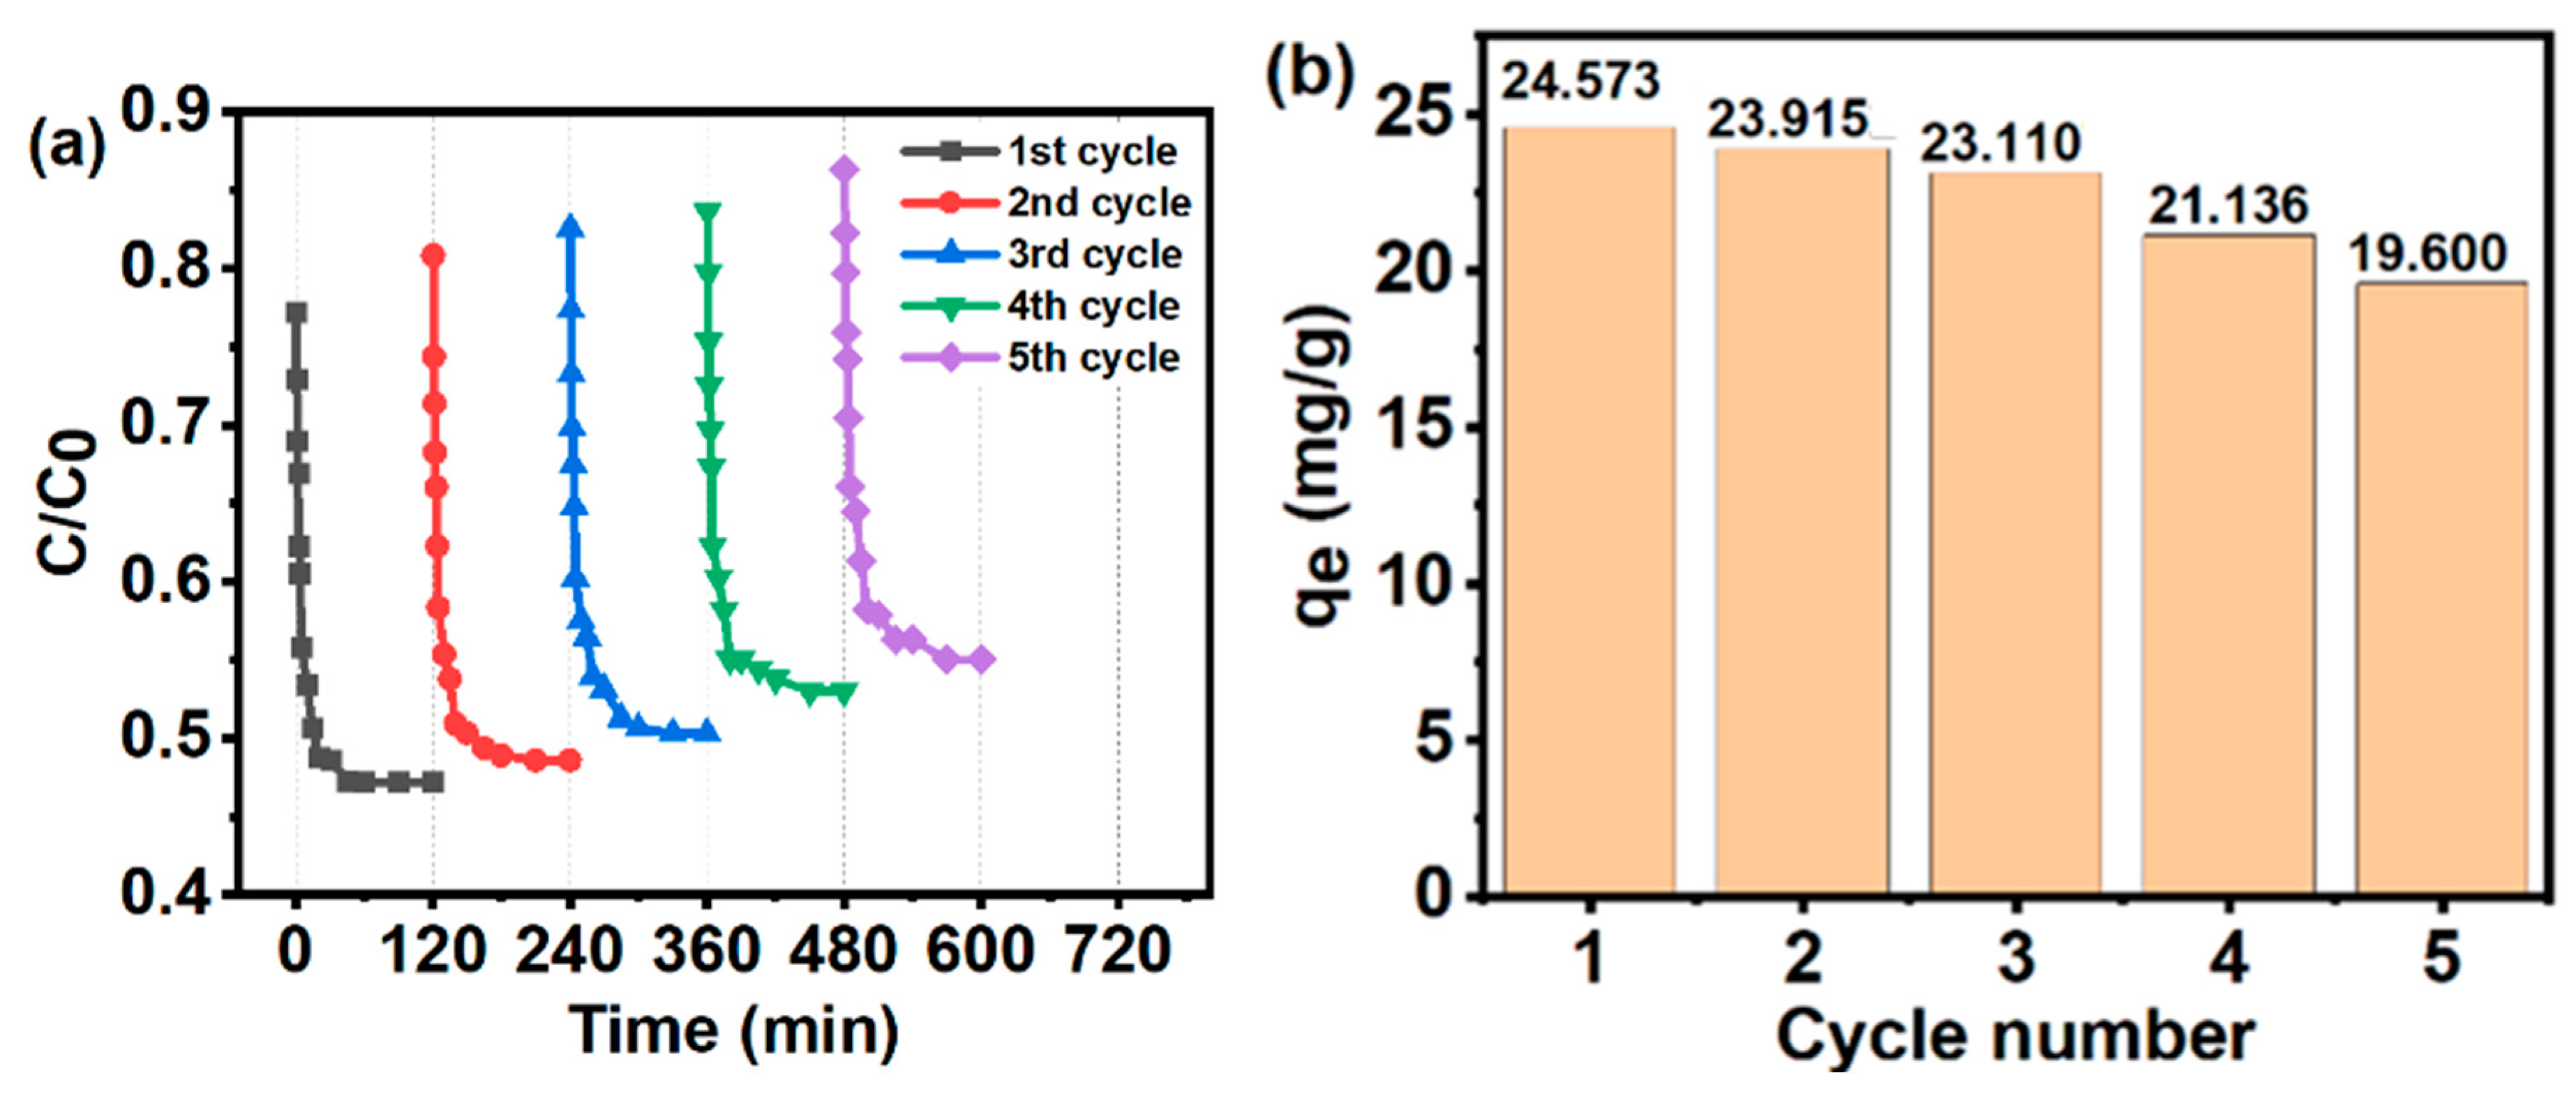
Table 1.
XRF analysis of Fe3O4/Fe2TiO5/TiO2 nanocomposite.
| Material | Al2O3 (%) | SiO2 (%) |
CaO (%) |
TiO2 (%) |
Cr2O3 (%) | MnO2 (%) | FeO (%) |
ZnO (%) |
|---|---|---|---|---|---|---|---|---|
| Fe3O4/Fe2TiO5/TiO2 nanocomposite | 0.92 | 2.81 | 0.30 | 26.05 | 0.11 | 1.45 | 68.30 | 0.19 |
Table 2.
Structural properties of the composite revealed by XRD analysis.
| Component | Peak position | Crystalline plane | Full width at half maximum (FWHM) | Integrated peak area | Crystalline size (nm) | Interplanar distance (nm) |
|---|---|---|---|---|---|---|
|
Octahedral Fe3O4 |
30.39 | 220 | 0.674 | 30.524 | 12.2 | 0.293 |
| 35.79 | 311 | 1.412 | 206.007 | 5.91 | 0.250 | |
| 57.55 | 511 | 5.062 | 156.543 | 1.78 | 0.160 | |
| 63.17 | 440 | 2.777 | 205.933 | 3.35 | 0.147 |
Table 3.
Textural parameters of Fe3O4/Fe2TiO5/TiO2 nanocomposite.
| Surface area SBET (m² g-1) | Average pore size (nm) | Pore Volume, Vpore (cm3g-1 ) | C value |
|---|---|---|---|
| 292.182 | 153 | 0.202 | 94.309 |
Table 4.
Kinetic parameters for adsorption of methylene blue to Fe3O4/Fe2TiO5/TiO2 nanocomposite.
| Pseudo first order model | Pseudo second order model | |||||||
| MB concentration (mg/L) | qe, exp (mg g-1) | qe, exp (mg g-1) | k1 (min-1) | qe, exp (mg g-1) | k2 (g mg-1 min-1) | |||
| 10 | 24.573 | 10.361 | 0.109 | 0.919 | 24.863 | 0.037 | 0.999 | |
| 15 | 31.012 | 16.300 | 0.127 | 0.977 | 31.476 | 0.024 | 0.999 | |
| 20 | 41.443 | 19.700 | 0.115 | 0.933 | 42.016 | 0.019 | 0.999 | |
| 25 | 52.259 | 27.400 | 0.183 | 0.986 | 52.826 | 0.020 | 0.999 | |
Table 5.
Rate constants and intercept values of the intra-particle diffusion model for the sorption of MB onto Fe3O4/Fe2TiO5/TiO2 nanocomposite.
Table 5.
Rate constants and intercept values of the intra-particle diffusion model for the sorption of MB onto Fe3O4/Fe2TiO5/TiO2 nanocomposite.
|
MB concentration (mg/L) |
intraparticle diffusion model | ||||||||
| ki,1 (mg g−1 min−1/2) | C1 (mg g−1) | ki,2 (mg g−1 min−1/2) | C2 (mg g−1) | ki,3 (mg g−1 min−1/2) | C3 (mg g−1) | ||||
| 10 | 6.269 | 6.391 | 0.991 | 1.498 | 17.102 | 0.991 | 0.119 | 23.435 | 0.691 |
| 15 | 6.925 | 7.959 | 0.985 | 2.717 | 18.140 | 0.994 | 0.124 | 29.843 | 0.622 |
| 20 | 11.026 | 8.346 | 0.987 | 3.385 | 25.427 | 0.975 | 0.213 | 39.424 | 0.691 |
| 25 | 11.838 | 16.375 | 0.981 | 4.412 | 32.626 | 0.986 | 0.056 | 51.722 | 0.679 |
Table 7.
Parameters calculated by Langmuir, Freundlich, Temkin and Dubinin−Radushkevich adsorption isotherm models for the adsorption of MB onto Fe3O4/Fe2TiO5/TiO2 nanocomposite.
Table 7.
Parameters calculated by Langmuir, Freundlich, Temkin and Dubinin−Radushkevich adsorption isotherm models for the adsorption of MB onto Fe3O4/Fe2TiO5/TiO2 nanocomposite.
| Curve | 298 K | 308 K | 318 K | 323 K |
|---|---|---|---|---|
| Langmuir | ||||
| qm (mg/g) | 63.694 | 73.046 | 78.802 | 81.900 |
| KL (L/mg) | 0.211 | 0.218 | 0.226 | 0.228 |
| R2 | 0.990 | 0.990 | 0.985 | 0.985 |
| Freundlich | ||||
| KF (mg/g) | 3.658 | 3.533 | 3.366 | 3.648 |
| 1/n | 0.291 | 0.228 | 0.187 | 0.186 |
| n | 3.433 | 4.378 | 5.341 | 5.358 |
| R2 | 0.938 | 0.971 | 0.987 | 0.985 |
| Temkin | ||||
| KT (L/g) | 0.055 | 0.036 | 0.028 | 0.027 |
| B (J/mol) | 857.626 | 944.870 | 978.052 | 994.678 |
| R2 | 0.880 | 0.943 | 0.976 | 0.971 |
| Dubinin−Radushkevich | ||||
| qm (mg/g) | 56.355 | 60.972 | 64.630 | 66.741 |
| K (mol2 /KJ-2) | 0.003 | 0.001 | 0.001 | 0.001 |
| Em (KJ/mol) | 17.175 | 28.748 | 41.130 | 45.128 |
| R2 | 0.939 | 0.744 | 0.728 | 0.708 |
Table 8.
Thermodynamic Parameters for MB adsorption onto Fe3O4/Fe2TiO5/TiO2 nanocomposite.
| Van’t Hoff Plot | |
| ∆G (KJ/mol) | -27.552 (298 K) |
| -28.562 (308 K) | |
| -29.573 (318 K) | |
| -30.079 (323 K) | |
| ∆H (KJ/mol) | 2.571 |
| ∆S (J/mol/K) | 101.086 |
| Activation energy (KJmol-1) | 40.306 |
| Pre-exponential factor (A) | 401989 |
Table 9.
Variation of Adsorption Capacity and Pseudo-Second-Order Rate Constants with Temperature.
| Temperature (K) | Pseudo second order rate constant, K2 (g mg-1 min-1) | Qe (mg g−1) |
| 298 | 0.037 | 24.573 |
| 308 | 0.055 | 38.677 |
| 318 | 0.079 | 43.178 |
| 323 | 0.145 | 44.373 |
Table 10.
A comparison of the adsorbent capacities of different adsorbents.
| Adsorbent | Adsorption Dosage (mg) |
Adsorption Capacity (mg/g) | Reference |
|---|---|---|---|
| Iron Oxide Magnetic Nanoparticles Coated with Sugarcane Bagasse | 600 | 37.45 | [66] |
| titanium dioxide/polyurethane nanocomposite modified by sodium dodecyl sulfate | 200 | 20.12 | [67] |
| Fe3O4/Graphene Oxide Nanocomposite | 50 | 135.10 | [68] |
| Graphene nanosheet/Fe3O4 | 10 | 44 | [69] |
| Graphene oxide/Fe3O4/chitosan nanocomposite | 10 | 30 | [70] |
| Fe3O4/Fe2TiO5/TiO2 nanocomposite | 10 | 23.573 | This study |
Disclaimer/Publisher’s Note: The statements, opinions and data contained in all publications are solely those of the individual author(s) and contributor(s) and not of MDPI and/or the editor(s). MDPI and/or the editor(s) disclaim responsibility for any injury to people or property resulting from any ideas, methods, instructions or products referred to in the content. |
© 2024 by the authors. Licensee MDPI, Basel, Switzerland. This article is an open access article distributed under the terms and conditions of the Creative Commons Attribution (CC BY) license (http://creativecommons.org/licenses/by/4.0/).
Copyright: This open access article is published under a Creative Commons CC BY 4.0 license, which permit the free download, distribution, and reuse, provided that the author and preprint are cited in any reuse.


