
Submitted:
28 February 2025
Posted:
03 March 2025
You are already at the latest version
Abstract
The discharge of textile effluents containing dyes poses severe environmental risks. This study aimed to develop a Fe_3 O_4–HTM (magnetite–heat-activated termite mound) composite via the coprecipitation method for the adsorption of Basic Blue 41 (BB41) dye from textile wastewater under batch conditions. The Fe_3 O_4–HTM composite was characterized using BET (surface area), XRD (crystalline structure), FTIR (functional groups), and SEM (microstructure) analyses, confirming the successful synthesis of Fe_3 O_4–HTM. Comprising 80% HTM by mass, the composite demonstrates economic viability. Using batch experiments and a Box-Behnken design, the adsorption performance of Fe_3 O_4–HTM for BB41 dye removal from aqueous solutions was evaluated. Optimization of the sorption process revealed that a dosage of 2.6 g/L, a contact time of 47.5 minutes, a temperature of 60°C, and an initial dye concentration of 100 mg/L resulted in a BB41 dye removal efficiency of 98%. Additionally, Fe_3 O_4–HTM effectively removed BB41 dye from real wastewater samples, achieving a removal efficiency exceeding 80%, highlighting the improved sorption properties of the modified termite mound. The spent Fe_3 O_4–HTM was easily separated from the treated solution using an external magnet and successfully recovered. Its reusability demonstrated a dye removal efficiency of 78% after four cycles, without compromising its magnetic properties. Overall, the magnetically separable Fe_3 O_4–HTM composite shows significant potential for the treatment of textile wastewater.
Keywords:
Activated termite mound
; BB41 dye
; Fe3O4 –HTM composite
; Response surface methodology
1. Introduction
Wastewater discharge from industrial areas, such as textile, paper, and food sectors, containing dyes, is a significant environmental problem contributing to water pollution [1]. Currently, there are over ten thousand types of synthetic dyes, with the majority being used by the textile industry, making it a major polluter due to the composition and quantity of effluent [2]. In the textile dyeing process, 10–15% of unfixed dye is discharged into the environment as wastewater, primarily into water bodies [3]. For instance in Ethiopia, pollution of water bodies by textile industries, from which textile dye effluents emerged , are detected mostly in lakes [4,5]. The presence of dyes in effluents are highly noticeable predominantly basic ones, have an effect upon the aesthetic of environment, hinder light penetration and diminish the amount of dissolved oxygen content in water bodies, thereby blocking photosynthesis and affects growth of aquatic species [6]. Furthermore, the blockage of soil pores by dye effluent may result in a decrease in soil production [7]. Overall, the low biodegradability of dyes and their harmful impacts on humans and ecosystems raise concerns about water sources. Therefore, dye-bearing industrial effluents need to undergo adequate treatment before being released into the environment [2].
In recent times, the removal of dyes have been investigated by several methods such as physicochemical, biological techniques ,adsorption technology, and hybrid treatment systems [8,9]. However, these approaches have a number of drawbacks, including poor performance, high expense, and the production of hazardous by products, operational delays, and ineffectiveness in removing certain contaminants [9,10,11,12]. Among them, adsorption is the most commonly employed method for treating textile effluents contaminated with colors because of its affordability, effectiveness, and simplicity in altering adsorbents [8,13,14] . Activated carbon has gained popularity as an adsorbent and is frequently used to depollute dye-laden wastewater. [15,16] . However, due to its high cost and regeneration issues, researchers are exploring more cost-effective substitute adsorbents [17,18].
Termite mounds (TM) are natural formations created by termites using a mixture of organic matter and mineral elements sourced from the surrounding soil. These mounds play a significant role in enhancing the quality of soil by enhancing its carbon content, clay content, and overall nutrient levels [19,20]. The termite nest has a better nutrient composition and chemical makeup than the nearby soil, both physically and chemically [21] . Mound mainly contains silicon, aluminium, iron and titanium oxides, which are essential elements for adsorption [22]. The structural properties, as well as the mechanical and chemical stability of the termite hill, establish it as a highly promising adsorbent for the treatment of industrial wastewater [20]. Previous applications have demonstrated its effectiveness in removing inorganic pollutants such as arsenic, cadmium, fluoride, and chromium [19,23,24,25]. Furthermore, termite mound composites have been utilized as a support for heterogeneous catalysts with zinc oxide and nanoparticles to remove anionic and cationic dyes [20,26]. Nevertheless, one of the disadvantages of using bare termite mound as adsorbent is phase separation problem. After adsorption of the pollutant, filtration or centrifugation, which is another expensive process that consume time, inefficient separation technique, was used to separate the termite mound from the pollutant in aqueous media.
In the present study, these issues were addressed by coating the termite mound with magnetite () to improve its magnetic characteristics, which in turn improved the sorption capabilities and solved the separation problem. is a non-toxic, readily produced, insoluble in water substance with a large specific surface area and greater saturation magnetization [27,28]. In spite of these advantages, as adsorbent are very much susceptible to agglomeration and chemical dissolution [29,30]. In order to prevent this adsorbent was coated with HTM (heat activated termite mound). Thus, the limitations of both adsorbents, namely, termite mound and , were addressed by synthesising composite from and termite mound by Chemical coprecipitation. Co-precipitation route, in which and aqueous salt solutions are precipitated by addition of a base, has been usually opted for synthesis of due to its easiness and huge volume production of [31] . In coprecipitation route, nitrogen gas is introduced into the reaction mixture to prevent oxidation of to and as precipitating agent is usually preferred as it does not leave ionic residue. Up to now, there hasn’t been any published research on the use of –HTM composite to remove BB41 dyes from textile effluent. Therefore, this study aimed to synthesize –HTM composite using coprecipitation of iron oxide salts and heat activated termite mound. The study involved characterization of –HTM composite through BET, SEM, FTIR, and XRD. Additionally, the study aimed to determine the adsorption performance of the composite on BB41, a representative cationic dye commonly used in textile industries, using RSM optimization based on Box-Behnken design. Furthermore, the study explored the applicability of the adsorbent in real textile wastewater and the reusability of the adsorbent.
2. Materials and Methods
2.1. Materials
The sample termite mound in the study was sourced termite mound located from Mojo, Ethiopia. Before treatment, the raw termite mound was washed with distilled water several times to get neutral pH after which it was dried at 105 for 24 hours. Subsequently, it was pounded with a mortar and pestle and sieved through a 75 μm pore size mesh. Using this method, 200 g of dried termite mounds were heated to 450 for three hours the result of which was labeled as H-TM. The reagents and chemicals employed in this experiment were all of analytical grade. In the adsorption investigations, BB 41 dye were used, which is an azo-cationic dye. Preparation of a 1000 , stock solution was conducted by dissolving weighed volumes of BB 41 dye in 1000 mL of deionized water. The required initial pH was achieved using NaOH or HCl solutions. The chemical structure of BB41 dye is outlined in Figure 1. The characteristic of the Basic Blue 41 dye is expressed on Table 1.
| Parameters | Characteristic |
| Chemical name | Basic Blue 41 |
| Apparent color | Blue |
| Chemical formula | C20H26N4O6S2 |
| Molecular weight | 482.57 g-1 mol |
| λmax | 617 nm |
| Chemical structure | 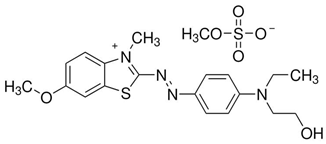 |
2.2. Synthesis of Fe3O4-HTM Composite
Fe3O4-HTM composite was synthesized through the co-precipitation of 9.5 g (), 3.6 g (), along with heat-activated termite mound (H-TM) ranging from 2-200 g, the solution of which were dissolved in 400 mL of deionized water. The resulting solution was agitated using magnetic stirrer at 80℃under a nitrogen gas atmosphere without the presence of oxygen. After one hour, 50 mL of (25%) was added, and agitated for an extra 60 minutes. The solution was then cooled to 25°C, decanted with a magnet, and rinsed five times with hot water (80°C). The resulting composite were underwent drying at 70℃for a day and kept in a desiccator and for adsorption studies [32].
2.3. Characterizations of -TM Composite
Determination of the specific surface area and total pore volume of were Fe3O4-HTM composite were evaluated via the Brannuer-Emmett-Teller (BET) (SA-9600 Series, Tokyo, Japan) device. Fourier Transform- infrared (FT-IR) spectrometer (Perkin Elmer, Annapolis, MD, USA) was employed to recognise the functional groups existing in –HTM composite using KBR disk .The –HTM composite’s crystalline phase was identified through the application of the XRD (XRD 7000, Tokyo, Japan). The morphological analysis of –HTM composite was studied employing Scanning electron microscopy (SEM) (INSPECT, F50, USA).–HTM composite’s internal structure was examined using a working distance of 10–50 μm and a voltage of 10–20 kV.
2.4. Adsorption Experiments
The batch sorption tests involved diluting the stock solution () to obtain the required concentrations for the BB 41 dye solution. The initial dye concentration, adsorbent dosage, contact time, and solution temperature for the adsorption tests were set at 10-100 , 10 to 90 minutes, 40–60 , and 1-3 , respectively, with the pH maintained at 5. A digital pH meter was utilized to precisely measure and adjusts the pH levels of the solutions using either 0.1 M NaOH or 0.1 M HCl solution. The solutions were agitated in a temperature-controlled shaker at 121 rpm. Afterward, the adsorbent was separated from the solution by applying external magnet. After equilibrium time, the amount of BB 41 dye left in solution were analysed using a UV-visible spectrophotometer (Hitachi Model 100-40) at maximum wavelength of 617 nm. The percentage of dye removal (R %) was calculated using Equation (1).
where () and () are BB 41 dye concentrations at the initial and at equilibrium, respectively.
The BB 41 dye amount in the adsorbent phase was calculated using equation. (2): where is the amount of dye uptake (,) at equilibrium, and the initial and equilibrium concentrations () of BB 41 dye in solution, V the volume of the solution (L), and M mass of the adsorbent (g).
is the amount of dye uptake () at time t, BB 41 dye concentrations () at time t. A solution of 50, BB 41 dye was prepared in distilled water. The absorption of various concentrations of BB 41 dye was measured at the dye’s maximum wavelength (= 617 nm). The calibration curve shown in Figure 1 was obtained by plotting absorbance versus concentration of BB 41 at . The samples’ concentrations were estimated using a linear regression equation (4),
Where A is absorbance and Ce is BB 41 dye concentrations at equilibrium, at = 0.997 derived by drawing a calibration curve for BB 41 dye across a concentration range (0.0-50 ,). All adsorption tests were conducted in triplicate, and the average results were used to analyse the data.
2.5. Experimental Design Using BBD
The removal of BB 41 dye from aqueous solution was optimized using –HTM composite and Box-Behnken experimental design [33]. The study examined independent variables, which included temperature (40–60 ℃), dye concentration (10-100 ), adsorbent dose (1–3), and contact time (10–90 min), with pH 5 maintained as a constant, as maximum adsorption was found at this pH. Three codes were assigned to the factor levels: 0 for the medium or central point, 1 for high, and −1 for low. The BBD with levels and independent variables is shown in Table 2. These parameters and ranges were determined through literature review and preliminary investigations. The BBD model, which considers factorial and center point, resulted in a total of 29 combinations of runs. Equation (4) presents a second-order polynomial model developed to correlate the dependent and independent variable.
Where Y is the predicted dependent variable, is the coefficient of intercept, is coefficient of the linear variable, is the quadratic coefficient of , is the interaction coefficient of and, and is the residual term .
ANOVA analysis (R2, adjusted R2, F-test and VIF), residuals analysis and normal plots were employed to assess the statistical significance. To evaluate significance of the regression coefficients the f and p value were used at the confidence level of 95.
2.6. Real textile Wastewater Sample
The effectiveness of the synthesized –HTM composite was thoroughly evaluated for its ability to remove the BB 41 dye from contaminated wastewater samples. This investigation aimed to assess the material’s potential as an efficient adsorbent in wastewater treatment applications, particularly in the context of dye pollution. As the result, a sample of wastewater was taken from the inlet of DH GEDA blanket factory, Yarn dyeing, textile wastewater treatment plant in Ethiopia. Before analysis, the sample was kept at 4 °C in an amber glass bottle. It was characterized for total suspended solids, EC, pH, and chemical oxygen demand before and after treatment.
2.7. Desorption and Regeneration Study
The regenerative property of the BB 41 dye loaded –HTM was evaluated in an aqueous solution with the following conditions: 50 BB 41 dye solution, 2 –HTM dose, shaking at 121 rpm, pH 5 for 47.5 minutes. The composite was dried in an oven set at 80 °C for 24 hours after being separated by magnetic decantation. The dried BB 41 dye-loaded –HTM was shaken at 121 rpm for 90 minutes in 400 mL of a 0.15, 0.2, and 0.35 M NaOH solution in order to conduct desorption. The amount of BB 41 dye desorbed from the used adsorbent was determined by measuring the concentration of BB 41 dye present in the supernatant solution. BB 41 dye desorbed from the spent adsorbent into the solution was then determined by quantifying the concentration of BB 41 dye in the supernatant solution. Adsorption and desorption of –HTM adsorbent to treat BB 41 dye continued for four cycle. The result was recorded to determine the regeneration efficiency of–HTM.
3. Result and Discussion
3.1. Characterization of ––HTM Composite
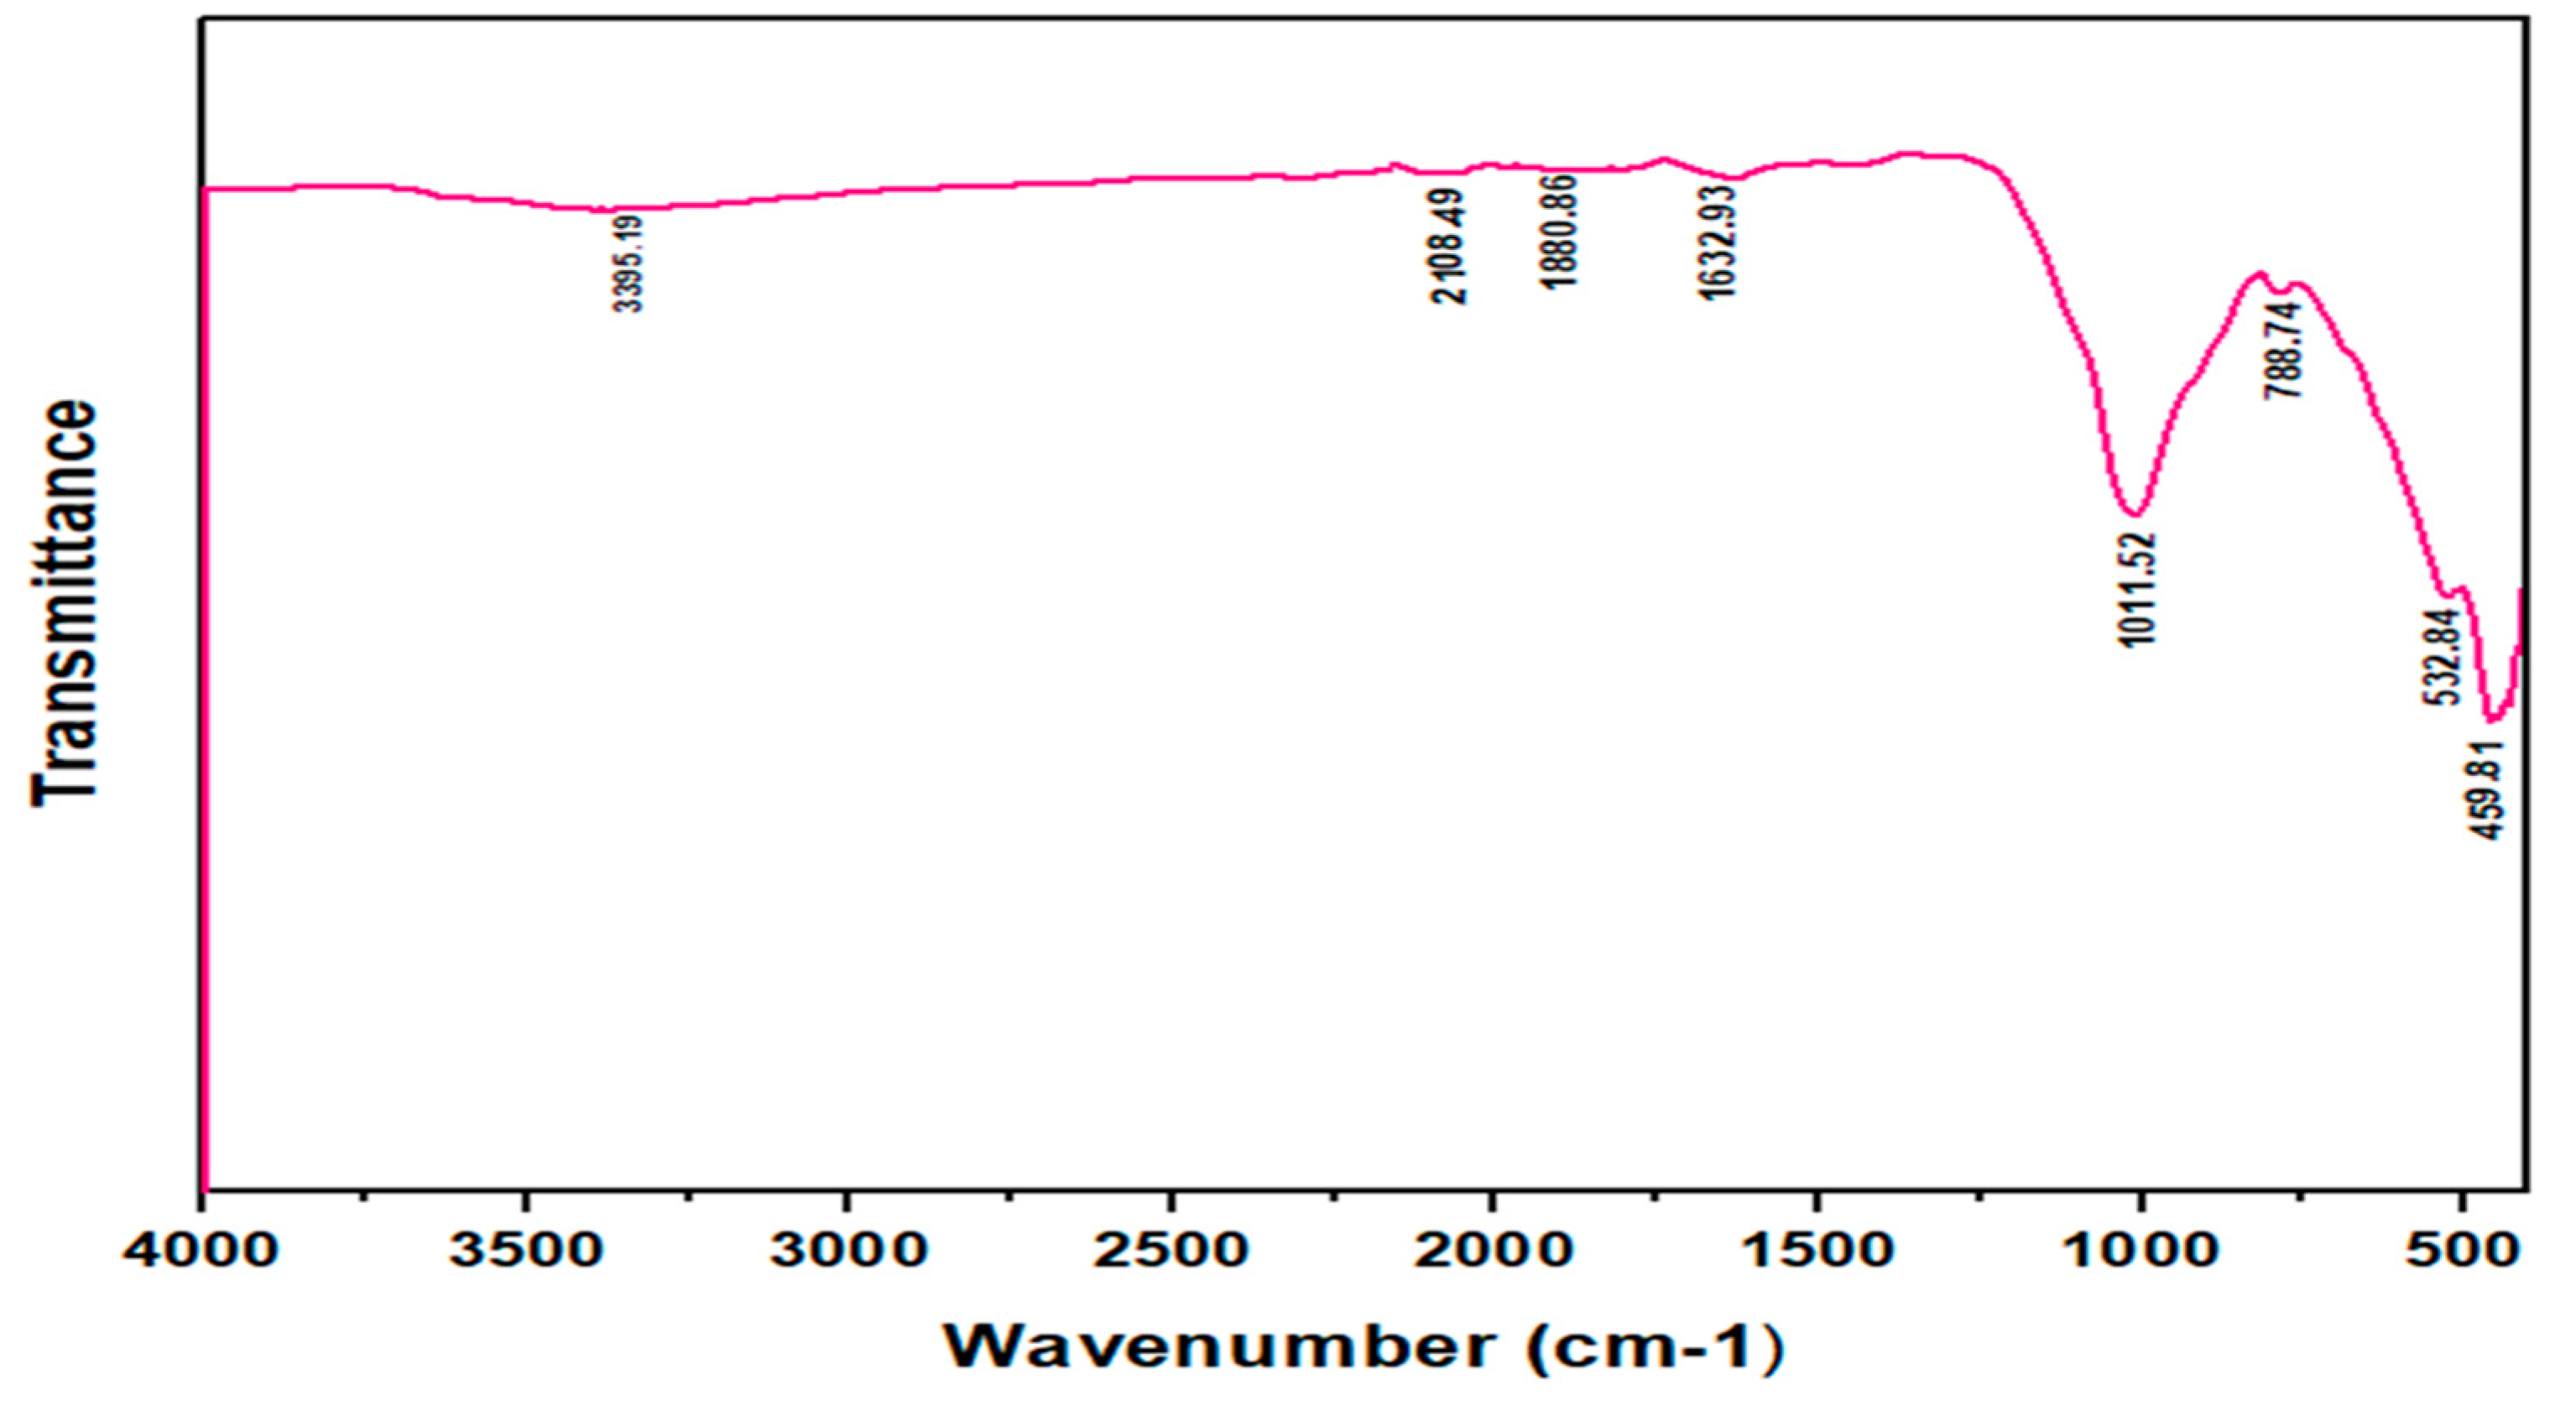
According to BET analysis result the specific surface area of –HTM was found to be 60.05. According to the results of the BET analysis, the specific surface area of –HTM was determined to be 60.05 m²/g. This measurement indicates the surface area available for chemical reactions or interactions per gram of the material, highlighting its potential applications for adsorption. The specific surface areas of composite were significantly higher than that of the natural termite mound (31.5 m²g⁻¹), likely due to magnetic particles on the mound’s surface [34]. The total pore volume has increased due to the higher iron oxide content in the composite (0.03) compared to the natural termite mound (0.01 ). This may be due to the development of a secondary pore structure during the precipitation of iron oxide particles. FTIR analysis was conducted to thoroughly investigate and identify the various functional groups present on the surface of –HTM. The presence of 2800 and 3700 indicates -OH stretching [35]. The broad bands observed at 3616 in the termite mound are indicative of the presence of water molecules associated with the stretching modes of hydroxyl (O–H) groups. The absorption bands observed at 1,010.00 and 910.49 can be attributed to the stretching vibrations of the Si–O bond. These characteristic peaks are indicative of the presence of silicon-oxygen linkages, which play a crucial role in various chemical structures and materials. The wavenumbers 752.07 and 782.41 signify the presence of silicon-oxygen (Si–O) bonds in quartz, while the band observed at 689.03 is attributed to the bending of silicon-oxygen-silicon (Si–O–Si) linkages within the termite mound [36]. A significant reduction of this band was noted for the modified materials following the formation of the composite. Furthermore, the FT-IR spectra indicate the presence of three distinct bands located at 535 , 1630 , and 3359 in the FT-IR spectrum of Fe3O4 nanoparticles [30]. The spectral band at 535 is attributed to the vibrational modes of the Fe-O bonds within the crystalline lattice of . Additionally, the FT-IR spectrum exhibits characteristic bands corresponding to hydroxyl groups at 1630 and 3359 [37]. The characteristic bands of both the termite mound were also identified in the spectrum of the -HTM composite, revealing that the preparation of the composite by means of the chemical coprecipitation process was successful.
Figure 2.
FTIR spectra of –HTM composite.
The X-ray diffraction (XRD) patterns of the -HTM composite samples are presented in Figure 3, offering a comprehensive analysis of their crystalline structure and phase characteristics. The crystalline structures of the H-TM sample, identified through XRD analysis (ICDD PDF-2 247 Release 2016 RDB), include tridymite (59.92°), aluminosilicate (25.53°), kaolinite (13.68°), cristobalite (20.07° and 68.15°), quartz (26.67° and 50.15°), illite (8.76°), and alumina (60.16°). A similar composition has also been reported for termite mounds [34]. The presence of tridymite, quartz, and cristobalite structures signifies the existence of [38]. , aluminium oxide, brookite ((Goethite (), (), CaO (), ( were also found in trace amount in H-TM sample from XRD analysis . The diffraction peaks observed at 2θ = 43.60, 35.67, 57.40, 29.85, and 54.14 correspond to the characteristic patterns identified in the maghemite standard γ-. These findings contribute to a comprehensive understanding of the magnetism exhibited by the composite material[39]. The X-ray diffraction analysis of pure iron oxide, presented in Figure 3, revealed the presence of a cubic iron oxide phase characterized by diffraction peaks at d-values of 256, 2.52, 2.93, 2.09, and 1.61 Å. This analysis suggests the presence of maghemite, which is identified by a lattice parameter of Ao = 0.835 nm [40]. The XRD analyses of show the presence of maghemite (γ-) and magnetite (), making the prepared iron oxides magnetic. This indicates the magnetic properties of iron oxide have remained unchanged.
The morphology of the -HTM composite and heat activated termite mound (HTM) were studied by SEM. Naked HTM possess smooth surfaces structure as depicted from Figure 4 (a). As shown from the Figure 4 (b) the surface of -HTM become rough, indicating its surface is heterogeneous. On the surface of -HTM composite tiny pores be seen, which likely have a significant role in adsorbing of BB41 dye from the aqueous solution. The small white spots were indicative of iron oxide particles that were dispersed across the surface of the termite mound.
3.2. Effect of HTM Amount on Preparation of –HTM Composite
Magnetic Fe3O4-HTM composite were synthesized by co-precipitation of 9.5 g (), 3.6 g () and 50 ml (25 %) with 2,4,8,16,20 g heat-activated termite mound (H-TM) dissolved in 400 mL of deionized water. To determine the effect of the amount of termite mound employed in the preparation of the magnetic –HTM adsorbent, adsorption of BB41 dye were carried out in batch process. Batch adsorption was conducted in the following condition (initial concentration of 50, 0.2 g of adsorbent dosage, room temperature, for 3 hours, and shaking speed of 121 rpm). The results indicate that as the quantity of termite mound used in the synthesis of composite increased from 2g to 16g, Removal BB41 dye (%) increased from 59.23% to 96.89% after which the figure remained almost unchanged (Figure 6). The percentage of dye removal with small amount of termite mound was very small, indicating the presence of aggregation of iron oxide, not getting adequate dispersion, implying low adsorption [23]. On the other hand, when the amount of termite mound was increased for synthesising Fe3O4-HTM, removal BB41 dye (%) increased meaning Fe3O4 efficiently dispersed on the surface of termite mound signifying higher adsorption [41]. Therefore, this study overcomes the disadvantages of naked adsorbent, agglomeration [31]. However, It was noted that the magnetic properties of the –HTM , prepared by using 20 g termite mound, were declined. Consequently, the optimal quantity of termite mound required for the synthesis of -HTM was determined at 16 grams. The -HTM utilized in the subsequent phase of the study was prepared using this specified amount. For this reason, the amount of termite mound suitable for the synthesis of -HTM was determined as 16 g and the -HTM used in the next step of the study were prepared using this amount.
3.3. Magnetization Property
The magnetic properties of the dried -HTM adsorbent are depicted in Figure 7(a), demonstrating its attraction to an external magnet. According to the result, -HTM composite was synthesized through the coprecipitation of 9.5 g ), 3.96 g, () (molar ratio 1.75:1), 16 g termite mound, and 50 mL in 400 mL of deionized water. The result yielded 20 g of -HTM adsorbent, of which 16 g accounted for heat activated termite mound. This resulted in the termite mound constituting 80% of the –HTM by mass, highlighting the economic feasibility of the study [42]. Notably, despite the termite mound making up 80% of the adsorbent’s mass, it still exhibits attraction to an external magnet. This is attributed to the presence of iron oxide in natural termite mound, as verified by X-ray diffraction (XRD) results and a prior study indicating that 26.08 of the termite mound consists of iron oxide () [43]. While Figure 7(b) illustrates the magnetic of properties Fe3O4-HTM adsorbent after adsorbing BB41 dye molecule, showing the efficient separation of treated water from the spent –HTM adsorbent loaded with BB41 dye. Furthermore, the bulk magnetization was observed to decline with an increase weight of termite mound in the composite, with the order of 248 20 g. This decline is attributed to the presence of other foreign matter within the termite mound composition.
3.4. Development of BBD Model Equation and Statistical Analysis
The sorption of BB 41 dye by –HTM adsorbent was maximized using four key independent variables: adsorbent dosage, solution temperature ,initial dye concentration, and contact time. The BBD model was used to examine the individual and interacting effects of these independent variables. Table 3 shows the experimental and predicted removal percentage of BB 41 dye.
Equation (6) depicts empirical model in which the relation between BB 41 dye removal percentage (dependant factor) by –HTM adsorbent and independent factors in form of coded factors was generated by software.
The adequacy of quadratic modelof BB 41 dye removal by –HTM was determined using model summary statistics and Analysis of variance (ANOVA).
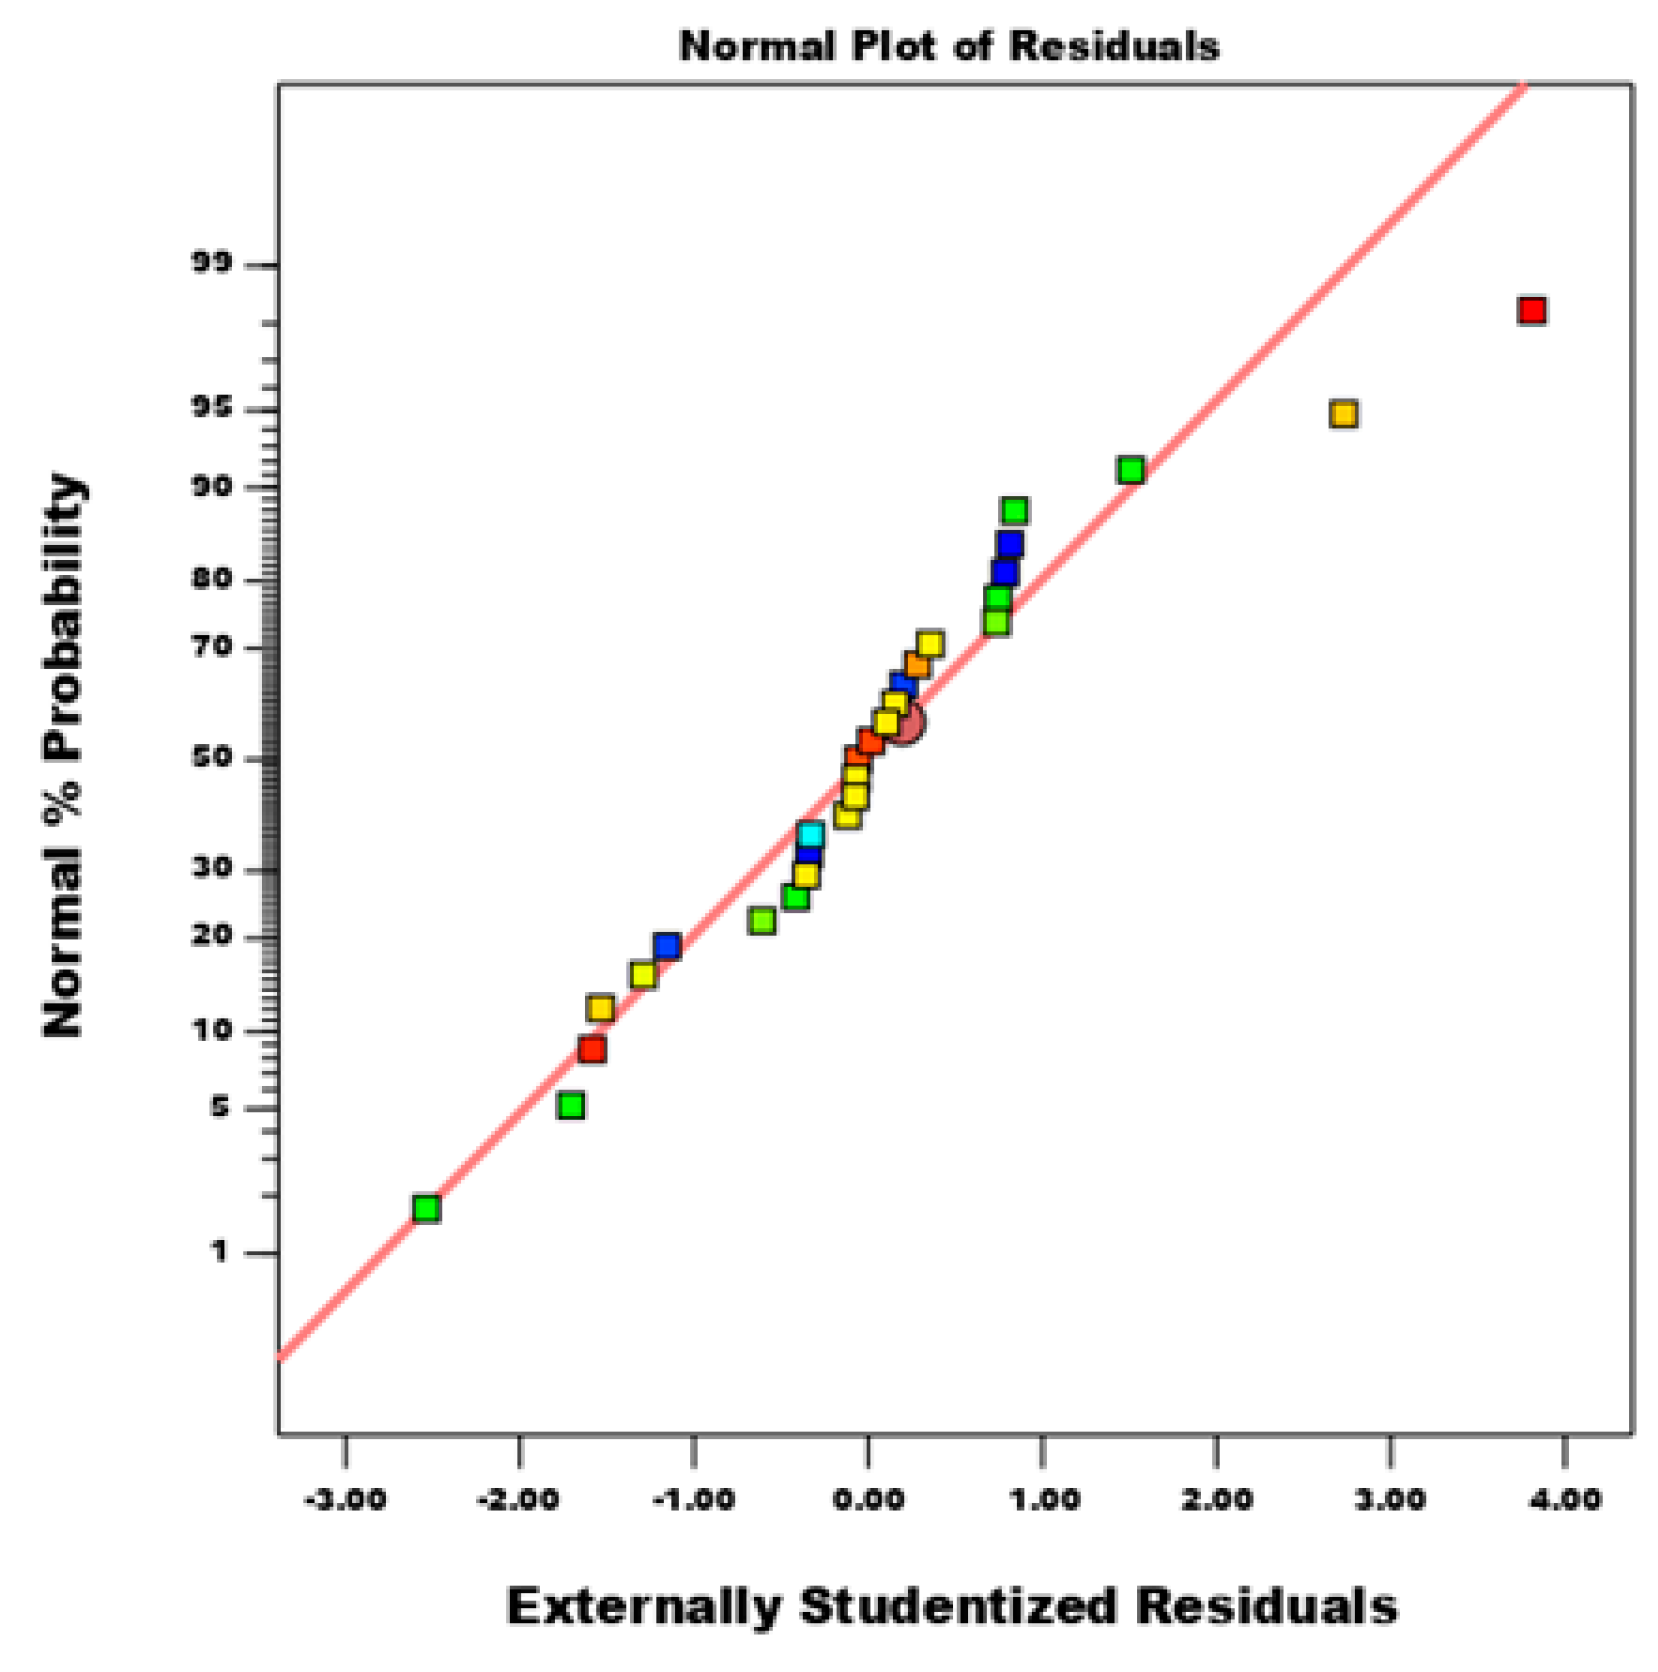
Table 4 illustrates the adequacy of quadratic model confirmed by the F value of ANOVA and R² value of model summary statistics. Overall the model is significant because of larger F (139.27) value, checked by its associated p value ( [44]. This proposes that the model is compatible and sufficient for explaining how –HTM adsorbs BB 41 dye (Table 3). In addition, The effectiveness of the model was evaluated using model summary statistics in which the predicting the removal percentage () of BB 41 dye account for 98 of the variations indicated by high correlation coefficients (R2 = 0.98 for –HTM). The adjusted R2 (0.98) is acceptable for showing good agreement with the predicted R2 (0.96) as their difference 0.2. Moreover, the adequacy of the model was appraised by assessing the predicted versus actual plot, and normal plot of residual. A graph was plotted to compare predicted response values with actual response values in order to identify any values that the model does not easily predict. In Figure 9, the actual versus predicted responses were plotted, showing values are around the center line of the graph, majority of which easily predicted through the model. The normal plot of residual of –HTM shown in Figure 8 indicates the residuals points are a normal distributed, resembling a straight line [44].
Figure 8.
Actual versus predicted dye removal.
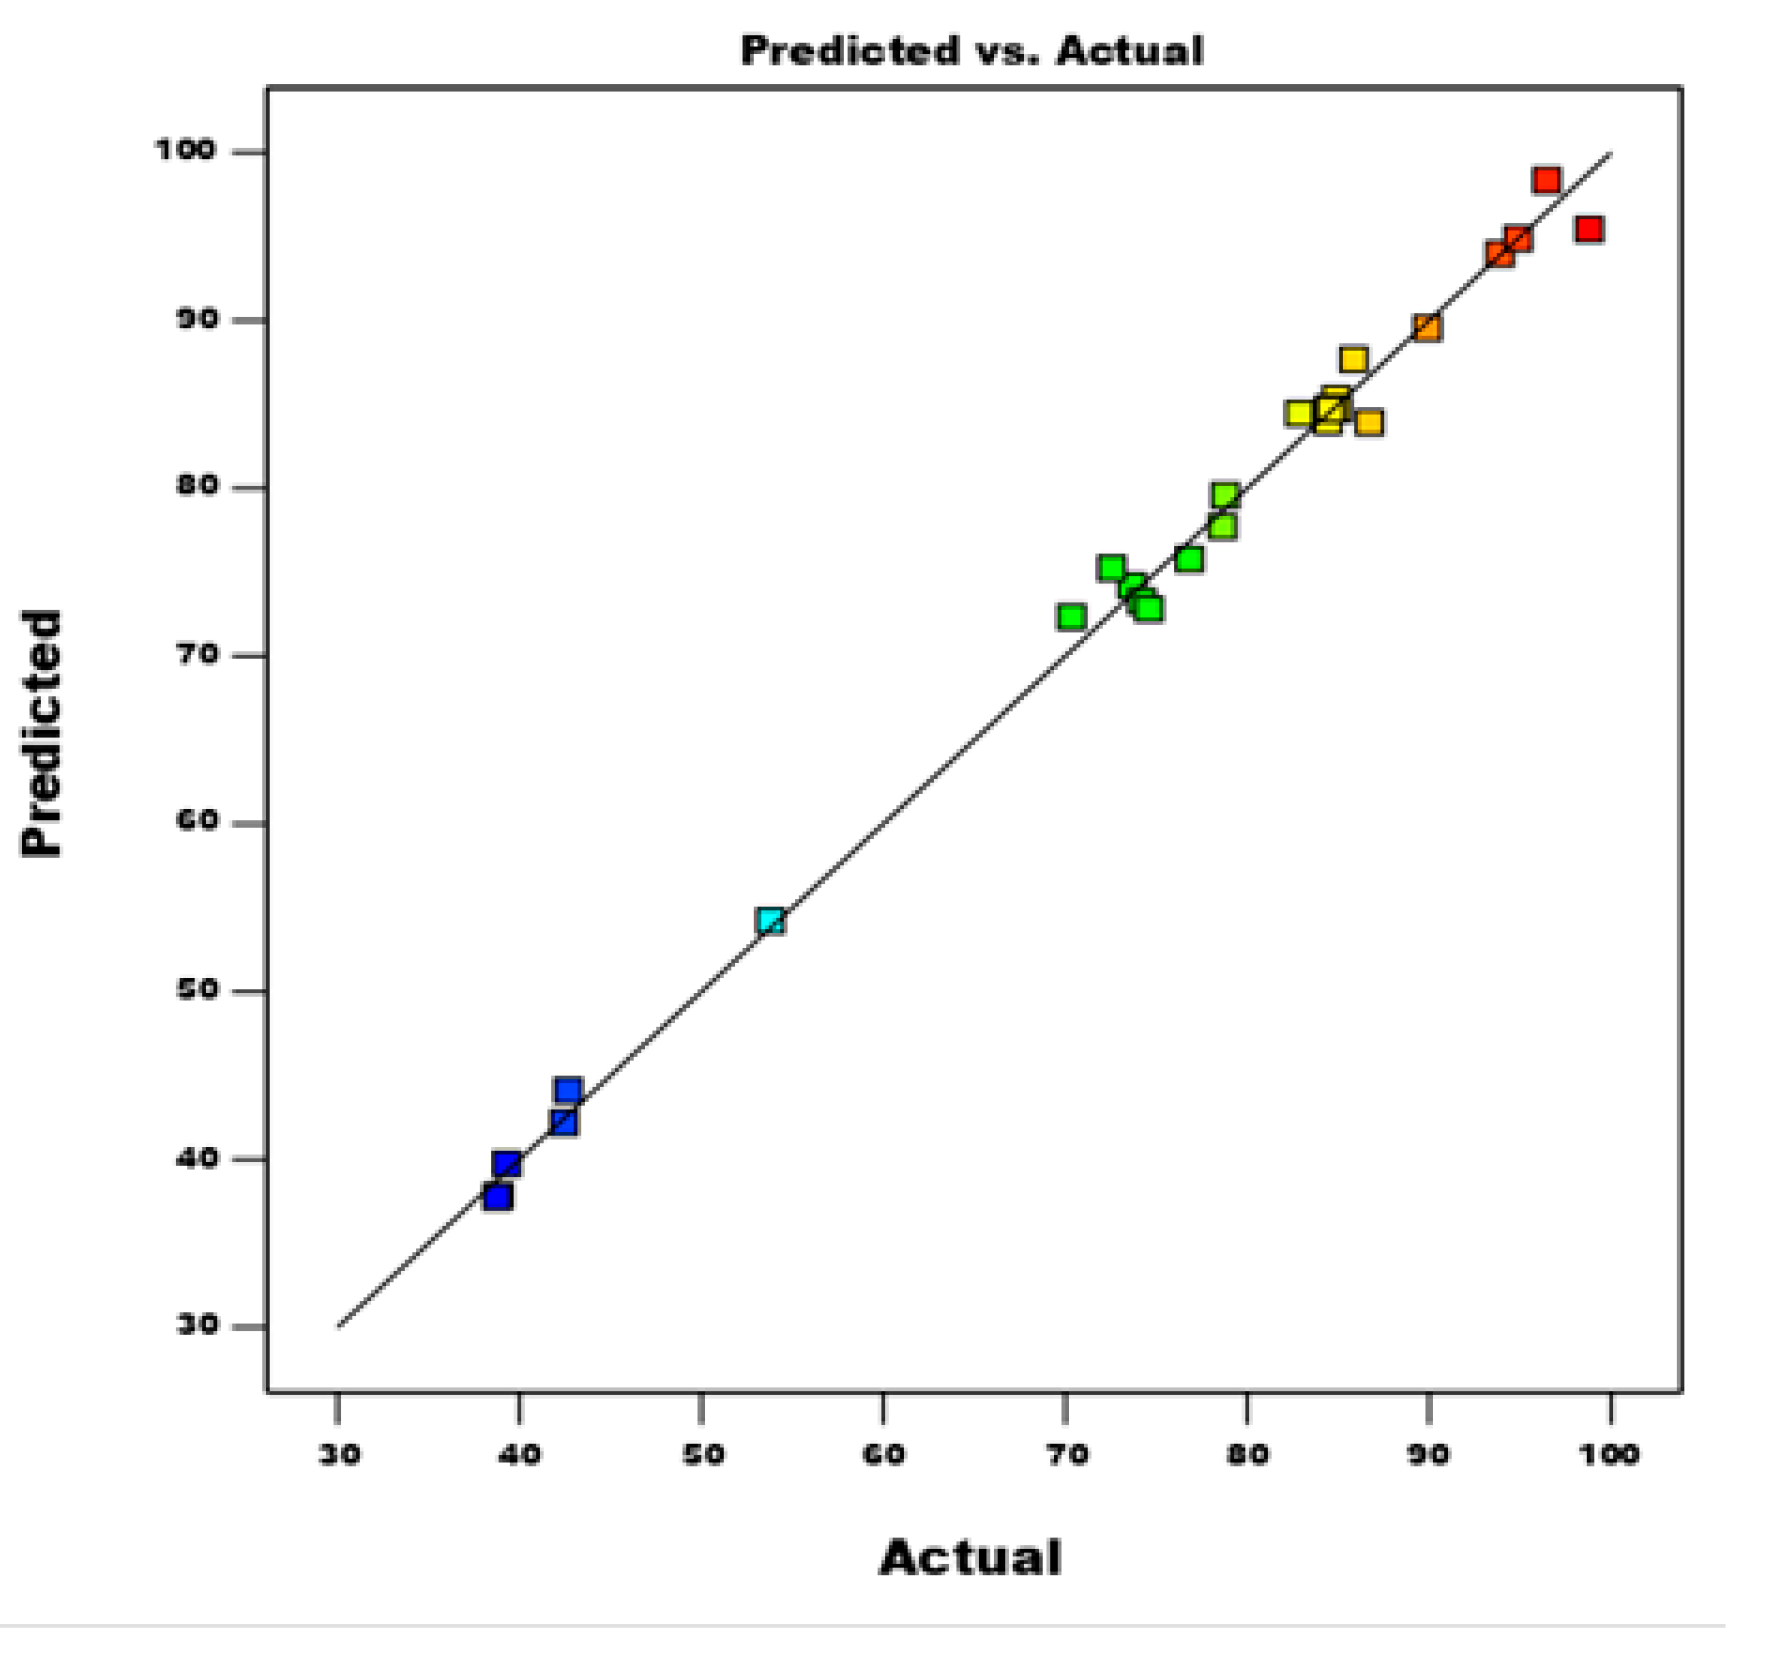
Figure 9.
Normal probability graph dye removal.
The simplified fitted quadratic equation of BB 41 dye % when insignificant terms are avoided shown in Equation (7).
3.4.1. Significance Level of Model Terms
The coefficient estimates (shown in Table 5) of –HTM show that the predicted change in response for each unit increase in factor value, assuming all other factors remain constant. The Table displays the coefficient values, standard errors, F values, and significance levels. It indicated that the linear coefficients A (adsorbent dose), B (concentration), C (contact time), and D (temperature), the quadratic coefficients A2, B2, and C2, and the interaction coefficients BC (concentration and contact time), CD (contact time and temperature), and AB (dose and concentration) were all found to be statistically significant at a 95 confidence level.
Based on Table 4 the model is significant as F-value is 181.88. As shown from Table 5 model terms (A, B, C, D, AB, BC, CD, A², B², and C²) are significant because the P-values 0.05. In addition , Lack of Fit value is insignificant for the p-value 0.62 being 0.05 because the model is wanted to be to fitted [45].
3.4.2. The Effect of of Different Factors and Their Interactions on the Process of Dye Adsorption
The key variables that need to must be accounted for in order to achieve the maximum removal percentage of BB 41 dye are A (adsorbent dose), B (concentration), C (contact duration), and D (temperature), are shown in Figure 10. The effects of these four parameters are compared at a specific position in the design space using a perturbation plot (Mudhoo and Sillanpää, 2021). Overall shown from Figure 10, the BB 41 dye removal percentage increased with increased contact time, adsorbent dose, and temperature. However, with an increase in the initial BB 41 dye amount (), the removal percentage declined over the ranges of value given. The highest BB 41 dye removal percentage be seen with the adsorbent dose while the lowest be seen contact time .The steeper slope of the dose of Fe3O4–HTM compared to the other factors suggests that the result, or dye removal, is particularly prone to even slight changes in this element. By contrast, the contact time showed a much flattened out curve, indicating that this factor had less of an effect on the response. Moreover, the moderate curve and reverse direction of initial BB 41 dye amount curves suggested that the factor had a lesser effect and a converse relationship with the response.
Figure 11 depicts 3D and contour plots showing the interaction effect of temperature and time on the percentage removal of BB 41 dye, with dye concentration and dose set at 70 and 2.02 , respectively. Overall as illustrated from Figure 11, it is evident that there was a substantial increase in the percentage of BB 41 dye removal with rising temperature up to 60 given, as well as with increased contact time (min). However, it is noteworthy that temperature had a greater impact compared to contact time. The percentage of BB 41 dye removal started at a low level but steadily increased over the given ranges of values. As the solution’s temperature increased from 40 to 58 and contact time increased (5-65 min) at the same time setting dye concentration and dose remain stable to be 70 and 2.02 , removal of BB 41 dye increased considerably from 77.93%to reach a peak of 95.34%. The increase in temperature resulted in a corresponding increase in the removal percentage of the dye. This could be attributed to the higher temperature enhancing the movement of the BB 41 dye ions, leading to faster diffusion towards –HTM adsorbent. This, in turn, accelerated the adsorption rate and contributed to a higher dye removal percentage. In contrast, the effect of temperature of the solution was higher than contact time on removal percentage of dye tested by F- test for F- value of temperature (174.41) is higher than contact time (57.45) as depicted from Table 5 [46].
Figure 12-shows the 3D and contour plots of BB 41 dye removal over the change of the initial dye concentration(10 to 100 ) and contact time (5 to 90 min) while the adsorbent dosage and Temperature of the solution were held constant at 2.2 and 55, respectively. Overall, there was slight increase in the proportion of BB 41 dye removal with increasing contact time over the 90 min given, while, with regards to increasing the amount of initial BB 41 dye, it dropped. While dye concentration increased from 10 to 65 and time increased (5-65 min) at the same time whereas the adsorbent dosage and temperature of the solution were held at 2.2 and 55 , removal of BB 41 dye increased from 83.94 %to reach a peak of 91.04 %.On increasing the initial BB 41 dye concentration from 10 to 100 , the sorption percentage of the dye declined gradually owing to the saturation of adsorptive sites in the –HTM adsorbent. However, as the contact time increased, adsorption efficiency also increased until all –HTM site was fully occupied after which the figure remain stable [47].
Figure 13 illustrates the interactive effect of the initial dye concentration (10 to 100 ) and the adsorbent dosage (1 to 3 ) on the dye removal (%) while the contact time and the temperature of the solution kept constant at 47.5 min and 71°c, respectively. Overall, there was a considerable increase in the percentage of BB 41 dye removal with increasing –HTM dose over the 3, while, with regards to increasing the amount of initial BB 41 dye , it declined. The highest percentage of BB 41 dye removal with contact time and the temperature kept constant at 47.5 min and 71°c ( temperature of real textile effluent) respectively , at initial concentration of BB 41 dye 75 ( real textile effluent concentration) at adsorbent dose2.5 were to reach a peak of 92.34 % . As the initial concentration of BB 41 dye increased from 10 to 75 and adsorbent dose increased (1-2.5 ) simultaneously , removal of BB 41 dye increased from 46.94 % to 92.34 % . As the initial concentrations of BB 41 dye rose from 10 to 100 , the adsorption percentage decreased. This drop in the adsorption percentage with high-level BB 41 dye concentrations was attributed to the saturation of the adsorbent’s adsorptive sites [34]. Overall, the findings showed that BB 41 dye removal by –HTM depended on the range of dye concentration from 10 to 100.
The removal of dye () rose with a higher adsorbent dose 1 to 3, as shown in Figure 13. With the increased dosage of –HTM, more binding and reactive sites were accessible, leading to enhanced BB 41 uptake for dye removal () [48]. this noticeable improvement in dye removal () was assessed by the higher F value [49]. Overall, the findings showed that BB 41 dye removal by –HTM was dependent on the adsorbent dosage across the range of 1 to 3.
3.4.3. Process Parameters Optimization and Model Validation
The objective of this study was to determine the maximum removal of BB 41 dye within a specific range of independent parameters. Numerical optimization was utilized to determine the maximum dye removal efficiency () and targets of input parameter values defined as in range, using quadratic models. To achieve this goal, the lower and maximum boundaries are set between -1 and +1. The results of the numerical optimization for the –HTM adsorption of BB 41 dye are shown in Table 5. –HTM numerical optimization findings show that the maximum efficiency of removal () is 98.34 when the input parameters are set in the range of the initial BB 41 dye concentration of 100 , the adsorbent dosage of 2.6 , the contact time of 47.5 minutes, and the solution temperature of 60 . Three tests were conducted at optimal levels of the process variable after which the average values were recorded (96.89) and compared with the predicted value (99.34%) in Table 6. The BB 41 dye removal percentages from validation experiments were found to be within 95 % the predicted values, indicating the model’s reliability.
3.5. Application in Real Textile Waste Water
Adsorption studies were carried out under optimal circumstances identified in earlier stages of the investigation to assess the applicability of the suggested adsorption to real wastewater samples. The pH, EC, total suspended solids, and chemical oxygen demand of the wastewater sample were 7.6, 1840, 1660, and 610, respectively. According to the results obtained, COD amount was reduced from 610 to 118.95610, achieving over 80COD removal for all experimented concentrations of BB41 dye. The resultant COD value is below the Ethiopian environmental protection COD discharge standard (250 ). A slight reduction in adsorption efficiency was observed compared to synthetic wastewater. This finding is attributed to low competition of ions present in the real wastewater sample with BB41 dye.
3.6. Reusability of Composite
The stability of the -HTM adsorbent was evaluated through four consecutive studies using a BB41 dye solution with a concentration of 100 , a temperature of 60, a dosage of 2.6 , and a pH of 5 for 70 minutes. The removal efficiencies for the first and last cycles were 96.89 and 76.586, respectively (seen from Figure 14). The reduced effectiveness of the reused adsorbent may be due to inadequate adhesion to the adsorbent structure, which could lead to the washing away of active functional species [23] . However, the adsorbent showed good chemical stability and reusability for adsorption without any loss in performance. The result suggests enhancement of the bare adsorbent i.e. chemical dissolution were attained by coating it with a heat-activated termite mound (HTM). The overall result indicates great potential for the -HTM adsorbent as an effective adsorbent for BB41 dye molecules in an aqueous solution.
4. Conclusions
The study aimed to synthesize –HTM composite for sorptive removal of BB41 dyes from real textile wastewater effluent. The synthesized-HTM composite, 80 % of which by mass is heat activated termite mound, was used for adsorptive removal of BB41 dye which suggests that economic feasibility of composite. XRD, SEM, and FTIR analyses verified the presence of iron oxide particles in the –HTM composite and validated the presence of the magnetite phase in composites. The study used a Box–Behnken design to investigate the adsorption performance of -HTM magnetic composites for the maximum removal of basic blue 41 (BB41) dye from aqueous solution. Regression analysis indicated a good agreement with the experimental data to the quadratic model with (R2) value of 0.97. The adsorption process was found to be dependent on –HTM dose, contact time, temperature and initial dye concentration. -HTM demonstrated the best dye removal performance, effectively eliminating over 80 of COD containing BB41 dye from a real wastewater sample. The -HTM adsorbent exhibited adequate magnetic properties, enabling successful separation of dye-loaded -HTM adsorbent from treated liquid phase solution using an external magnet and recovery of -HTM. Reusability analysis showed that the -HTM composite successfully removed the BB41 dye from aqueous solution after four consecutive applications without losing its magnetic nature. Overall, the limitation of separation of spent pristine termite mound adsorbent from treated solution and the shortcomings of adsorbent, agglomeration and chemical dissolution, were enhanced by synthesizing –HTM composite. The results of the study suggest further exploration of -HTM for practical applications in the treatment of BB41 dye from the textile industry.
Supplementary Materials
There is no supplemntary material as i have included all the essential datas with in the article.
Author Contributions
Conceptualization E.A., and B.L. ; Supervision E.A.,A.W. and B.L.; Investigation, A.M.; Writing original draft preparation, A.M.; Writing-review and editing, A.M. ,E.A.,B.L, and A.W. All authors have read and agreed to the published version of the manuscript.
Funding
This research did not receive any specific grant from funding agencies in the public, commercial, or not-for-profit sectors.
Data Availability Statement
No new data has been generated.
Acknowledgements
The authors would like to thank the Wollo University as host, Addis Ababa Science and Technology for the lab facility, and ExiST Center JiT for the review process support provided.
Conflict of Interest
The authors declare that they have no known competing financial interests or personal relationships that could have appeared to influence the work reported in this paper.
References
- Zhou, Y.; Lu, J.; Zhou, Y.; Liu, Y. Recent Advances for Dyes Removal Using Novel Adsorbents: A Review. Environmental Pollution 2019, 252, 352–365. [Google Scholar] [CrossRef]
- Samsami, S.; Mohamadizaniani, M.; Sarrafzadeh, M.-H.; Rene, E.R.; Firoozbahr, M. Recent Advances in the Treatment of Dye-Containing Wastewater from Textile Industries: Overview and Perspectives. Process Safety and Environmental Protection 2020, 143, 138–163. [Google Scholar] [CrossRef]
- Nithya, R.; Thirunavukkarasu, A.; Sathya, A.B.; Sivashankar, R. Magnetic Materials and Magnetic Separation of Dyes from Aqueous Solutions: A Review. Environ Chem Lett 2021, 19, 1275–1294. [Google Scholar] [CrossRef]
- Bashaye, T. The Physico-Chemical Studies of Wastewater in Hawassa Textile Industry. J Environ Anal Chem 2015, 02. [Google Scholar] [CrossRef]
- Mehari, A.K.; Gebremedhin, S.; Ayele, B. Effects of Bahir Dar Textile Factory Effluents on the Water Quality of the Head Waters of Blue Nile River, Ethiopia. International Journal of Analytical Chemistry 2015, 2015, 1–7. [Google Scholar] [CrossRef]
- Lellis, B.; Fávaro-Polonio, C.Z.; Pamphile, J.A.; Polonio, J.C. Effects of Textile Dyes on Health and the Environment and Bioremediation Potential of Living Organisms. Biotechnology Research and Innovation 2019, 3, 275–290. [Google Scholar] [CrossRef]
- Khattab, T.A.; Abdelrahman, M.S.; Rehan, M. Textile Dyeing Industry: Environmental Impacts and Remediation. Environ Sci Pollut Res 2020, 27, 3803–3818. [Google Scholar] [CrossRef]
- Li, W.; Mu, B.; Yang, Y. Feasibility of Industrial-Scale Treatment of Dye Wastewater via Bio-Adsorption Technology. Bioresource Technology 2019, 277, 157–170. [Google Scholar] [CrossRef]
- Solayman, H.M.; Hossen, Md.A.; Abd Aziz, A.; Yahya, N.Y.; Leong, K.H.; Sim, L.C.; Monir, M.U.; Zoh, K.-D. Performance Evaluation of Dye Wastewater Treatment Technologies: A Review. Journal of Environmental Chemical Engineering 2023, 11, 109610. [Google Scholar] [CrossRef]
- Su, C.X.-H.; Low, L.W.; Teng, T.T.; Wong, Y.S. Combination and Hybridisation of Treatments in Dye Wastewater Treatment: A Review. Journal of Environmental Chemical Engineering 2016, 4, 3618–3631. [Google Scholar] [CrossRef]
- Katheresan, V.; Kansedo, J.; Lau, S.Y. Efficiency of Various Recent Wastewater Dye Removal Methods: A Review. Journal of Environmental Chemical Engineering 2018, 6, 4676–4697. [Google Scholar] [CrossRef]
- Donkadokula, N.Y.; Kola, A.K.; Naz, I.; Saroj, D. A Review on Advanced Physico-Chemical and Biological Textile Dye Wastewater Treatment Techniques. Rev Environ Sci Biotechnol 2020, 19, 543–560. [Google Scholar] [CrossRef]
- De Gisi, S.; Lofrano, G.; Grassi, M.; Notarnicola, M. Characteristics and Adsorption Capacities of Low-Cost Sorbents for Wastewater Treatment: A Review. Sustainable Materials and Technologies 2016, 9, 10–40. [Google Scholar] [CrossRef]
- Rashid, R.; Shafiq, I.; Akhter, P.; Iqbal, M.J.; Hussain, M. A State-of-the-Art Review on Wastewater Treatment Techniques: The Effectiveness of Adsorption Method. Environ Sci Pollut Res 2021, 28, 9050–9066. [Google Scholar] [CrossRef] [PubMed]
- Moosavi, S.; Lai, C.W.; Gan, S.; Zamiri, G.; Akbarzadeh Pivehzhani, O.; Johan, M.R. Application of Efficient Magnetic Particles and Activated Carbon for Dye Removal from Wastewater. ACS Omega 2020, 5, 20684–20697. [Google Scholar] [CrossRef]
- Azam, K.; Shezad, N.; Shafiq, I.; Akhter, P.; Akhtar, F.; Jamil, F.; Shafique, S.; Park, Y.-K.; Hussain, M. A Review on Activated Carbon Modifications for the Treatment of Wastewater Containing Anionic Dyes. Chemosphere 2022, 306, 135566. [Google Scholar] [CrossRef]
- Foo, K.Y.; Hameed, B.H. An Overview of Dye Removal via Activated Carbon Adsorption Process. Desalination and Water Treatment 2010, 19, 255–274. [Google Scholar] [CrossRef]
- Gu, W.; Yushin, G. Review of Nanostructured Carbon Materials for Electrochemical Capacitor Applications: Advantages and Limitations of Activated Carbon, Carbide-derived Carbon, Zeolite-templated Carbon, Carbon Aerogels, Carbon Nanotubes, Onion-like Carbon, and Graphene. WIREs Energy & Environment 2014, 3, 424–473. [Google Scholar] [CrossRef]
- Fufa, F.; Alemayehu, E.; Lennartz, B. Sorptive Removal of Arsenate Using Termite Mound. Journal of Environmental Management 2014, 132, 188–196. [Google Scholar] [CrossRef]
- Yusuff, A.S.; Azeez, T.M.; Babatunde, E.O. Titania-Termite Hill Composite as a Heterogeneous Catalyst: Preparation, Characterization, and Performance in Transesterification of Waste Frying Oil. International Journal of Chemical Reactor Engineering 2020, 0. [Google Scholar] [CrossRef]
- Apori, S.O.; Murongo, M.; Hanyabui, E.; Atiah, K.; Byalebeka, J. Potential of Termite Mounds and Its Surrounding Soils as Soil Amendments in Smallholder Farms in Central Uganda. BMC Res Notes 2020, 13, 397. [Google Scholar] [CrossRef]
- Fufa, F. Experimental Evaluation of Activated Termite Mound for Fluoride Adsorption. IOSR 2016, 10, 119–132. [Google Scholar] [CrossRef]
- Abdus-Salam, N.; Itiola, A.D. Potential Application of Termite Mound for Adsorption and Removal of Pb(II) from Aqueous Solutions. J IRAN CHEM SOC 2012, 9, 373–382. [Google Scholar] [CrossRef]
- Araújo, B.R.; Reis, J.O.M.; Rezende, E.I.P.; Mangrich, A.S.; Wisniewski, A.; Dick, D.P.; Romão, L.P.C. Application of Termite Nest for Adsorption of Cr(VI). Journal of Environmental Management 2013, 129, 216–223. [Google Scholar] [CrossRef] [PubMed]
- Fufa, F. Experimental Evaluation of Activated Termite Mound for Fluoride Adsorption. IOSR 2016, 10, 119–132. [Google Scholar] [CrossRef]
- Yusuff, A.S.; Bello, K.A.; Azeez, T.M. Photocatalytic Degradation of an Anionic Dye in Aqueous Solution by Visible Light Responsive Zinc Oxide-Termite Hill Composite. Reac Kinet Mech Cat 2020, 131, 537–554. [Google Scholar] [CrossRef]
- Wang, L.; Shi, C.; Wang, L.; Pan, L.; Zhang, X.; Zou, J.-J. Rational Design, Synthesis, Adsorption Principles and Applications of Metal Oxide Adsorbents: A Review. Nanoscale 2020, 12, 4790–4815. [Google Scholar] [CrossRef]
- Jabbar, K.Q.; Barzinjy, A.A.; Hamad, S.M. Iron Oxide Nanoparticles: Preparation Methods, Functions, Adsorption and Coagulation/Flocculation in Wastewater Treatment. Environmental Nanotechnology, Monitoring & Management 2022, 17, 100661. [Google Scholar] [CrossRef]
- Liu, S.; Yu, B.; Wang, S.; Shen, Y.; Cong, H. Preparation, Surface Functionalization and Application of Fe3O4 Magnetic Nanoparticles. Advances in Colloid and Interface Science 2020, 281, 102165. [Google Scholar] [CrossRef]
- Aragaw, T.A.; Bogale, F.M.; Aragaw, B.A. Iron-Based Nanoparticles in Wastewater Treatment: A Review on Synthesis Methods, Applications, and Removal Mechanisms. Journal of Saudi Chemical Society 2021, 25, 101280. [Google Scholar] [CrossRef]
- Mudhoo, A.; Sillanpää, M. Magnetic Nanoadsorbents for Micropollutant Removal in Real Water Treatment: A Review. Environ Chem Lett 2021, 19, 4393–4413. [Google Scholar] [CrossRef]
- Maity, D.; Agrawal, D.C. Synthesis of Iron Oxide Nanoparticles under Oxidizing Environment and Their Stabilization in Aqueous and Non-Aqueous Media. Journal of Magnetism and Magnetic Materials 2007, 308, 46–55. [Google Scholar] [CrossRef]
- Ferreira, S.L.C.; Bruns, R.E.; Ferreira, H.S.; Matos, G.D.; David, J.M.; Brandão, G.C.; Da Silva, E.G.P.; Portugal, L.A.; Dos Reis, P.S.; Souza, A.S.; et al. Box-Behnken Design: An Alternative for the Optimization of Analytical Methods. Analytica Chimica Acta 2007, 597, 179–186. [Google Scholar] [CrossRef] [PubMed]
- Ayanda, O.S.; Odo, E.A.; Malomo, D.; Sodeinde, K.O.; Lawal, O.S.; Ebenezer, O.T.; Nelana, S.M.; Naidoo, E.B. Accelerated Decolorization of Congo Red by Powdered Termite Mound. CLEAN Soil Air Water 2017, 45, 1700537. [Google Scholar] [CrossRef]
- Rawat, S.; Ahammed, M.M. Clay-Moringa Seedcake Composite for Removal of Cationic and Anionic Dyes. Chemosphere 2024, 350, 141083. [Google Scholar] [CrossRef]
- Liu, H.; Chen, W.; Liu, C.; Liu, Y.; Dong, C. Magnetic Mesoporous Clay Adsorbent: Preparation, Characterization and Adsorption Capacity for Atrazine. Microporous and Mesoporous Materials 2014, 194, 72–78. [Google Scholar] [CrossRef]
- Ozkaya, T.; Toprak, M.S.; Baykal, A.; Kavas, H.; Köseoğlu, Y.; Aktaş, B. Synthesis of Fe3O4 Nanoparticles at 100°C and Its Magnetic Characterization. Journal of Alloys and Compounds 2009, 472, 18–23. [Google Scholar] [CrossRef]
- Taher, T.; Munandar, A.; Mawaddah, N.; Syamsuddin Wisnubroto, M.; Siregar, P.M.S.B.N.; Palapa, N.R.; Lesbani, A.; Wibowo, Y.G. Synthesis and Characterization of Montmorillonite – Mixed Metal Oxide Composite and Its Adsorption Performance for Anionic and Cationic Dyes Removal. Inorganic Chemistry Communications 2023, 147, 110231. [Google Scholar] [CrossRef]
- Mahmud, N.; Benamor, A. Magnetic Iron Oxide Kaolinite Nanocomposite for Effective Removal of Congo Red Dye: Adsorption, Kinetics, and Thermodynamics Studies. Water Conserv Sci Eng 2023, 8, 35. [Google Scholar] [CrossRef]
- Dehmani, Y.; Mobarak, M.; Oukhrib, R.; Dehbi, A.; Mohsine, A.; Lamhasni, T.; Tahri, Y.; Ahlafi, H.; Abouarnadasse, S.; Lima, E.C.; et al. Adsorption of Phenol by a Moroccan Clay/ Hematite Composite: Experimental Studies and Statistical Physical Modeling. Journal of Molecular Liquids 2023, 386, 122508. [Google Scholar] [CrossRef]
- Aydin, S.; Aydin, M.E.; Beduk, F.; Ulvi, A. Removal of Antibiotics from Aqueous Solution by Using Magnetic Fe3O4/Red Mud-Nanoparticles. Science of The Total Environment 2019, 670, 539–546. [Google Scholar] [CrossRef] [PubMed]
- Panda, S.K.; Aggarwal, I.; Kumar, H.; Prasad, L.; Kumar, A.; Sharma, A.; Vo, D.-V.N.; Van Thuan, D.; Mishra, V. Magnetite Nanoparticles as Sorbents for Dye Removal: A Review. Environ Chem Lett 2021, 19, 2487–2525. [Google Scholar] [CrossRef]
- Fufa, F.; Alemayehu, E.; Lennartz, B. Sorptive Removal of Arsenate Using Termite Mound. Journal of Environmental Management 2014, 132, 188–196. [Google Scholar] [CrossRef] [PubMed]
- Li, Z.; Lu, D.; Gao, X. Optimization of Mixture Proportions by Statistical Experimental Design Using Response Surface Method - A Review. Journal of Building Engineering 2021, 36, 102101. [Google Scholar] [CrossRef]
- Baş, D.; Boyacı, İ.H. Modeling and Optimization I: Usability of Response Surface Methodology. Journal of Food Engineering 2007, 78, 836–845. [Google Scholar] [CrossRef]
- Shojaei, S.; Shojaei, S. Optimization of Process Conditions in Wastewater Degradation Process. In Soft Computing Techniques in Solid Waste and Wastewater Management; Elsevier, 2021; pp. 381–392. ISBN 978-0-12-824463-0. [Google Scholar]
- Zarezadeh-Mehrizi, M.; Badiei, A. Highly Efficient Removal of Basic Blue 41 with Nanoporous Silica. Water Resources and Industry 2014, 5, 49–57. [Google Scholar] [CrossRef]
- Akbal, F. Adsorption of Basic Dyes from Aqueous Solution onto Pumice Powder. Journal of Colloid and Interface Science 2005, 286, 455–458. [Google Scholar] [CrossRef]
- Bezerra, M.A.; Santelli, R.E.; Oliveira, E.P.; Villar, L.S.; Escaleira, L.A. Response Surface Methodology (RSM) as a Tool for Optimization in Analytical Chemistry. Talanta 2008, 76, 965–977. [Google Scholar] [CrossRef]
Figure 1.
Calibration curve and chemical structure of basic blue 41.
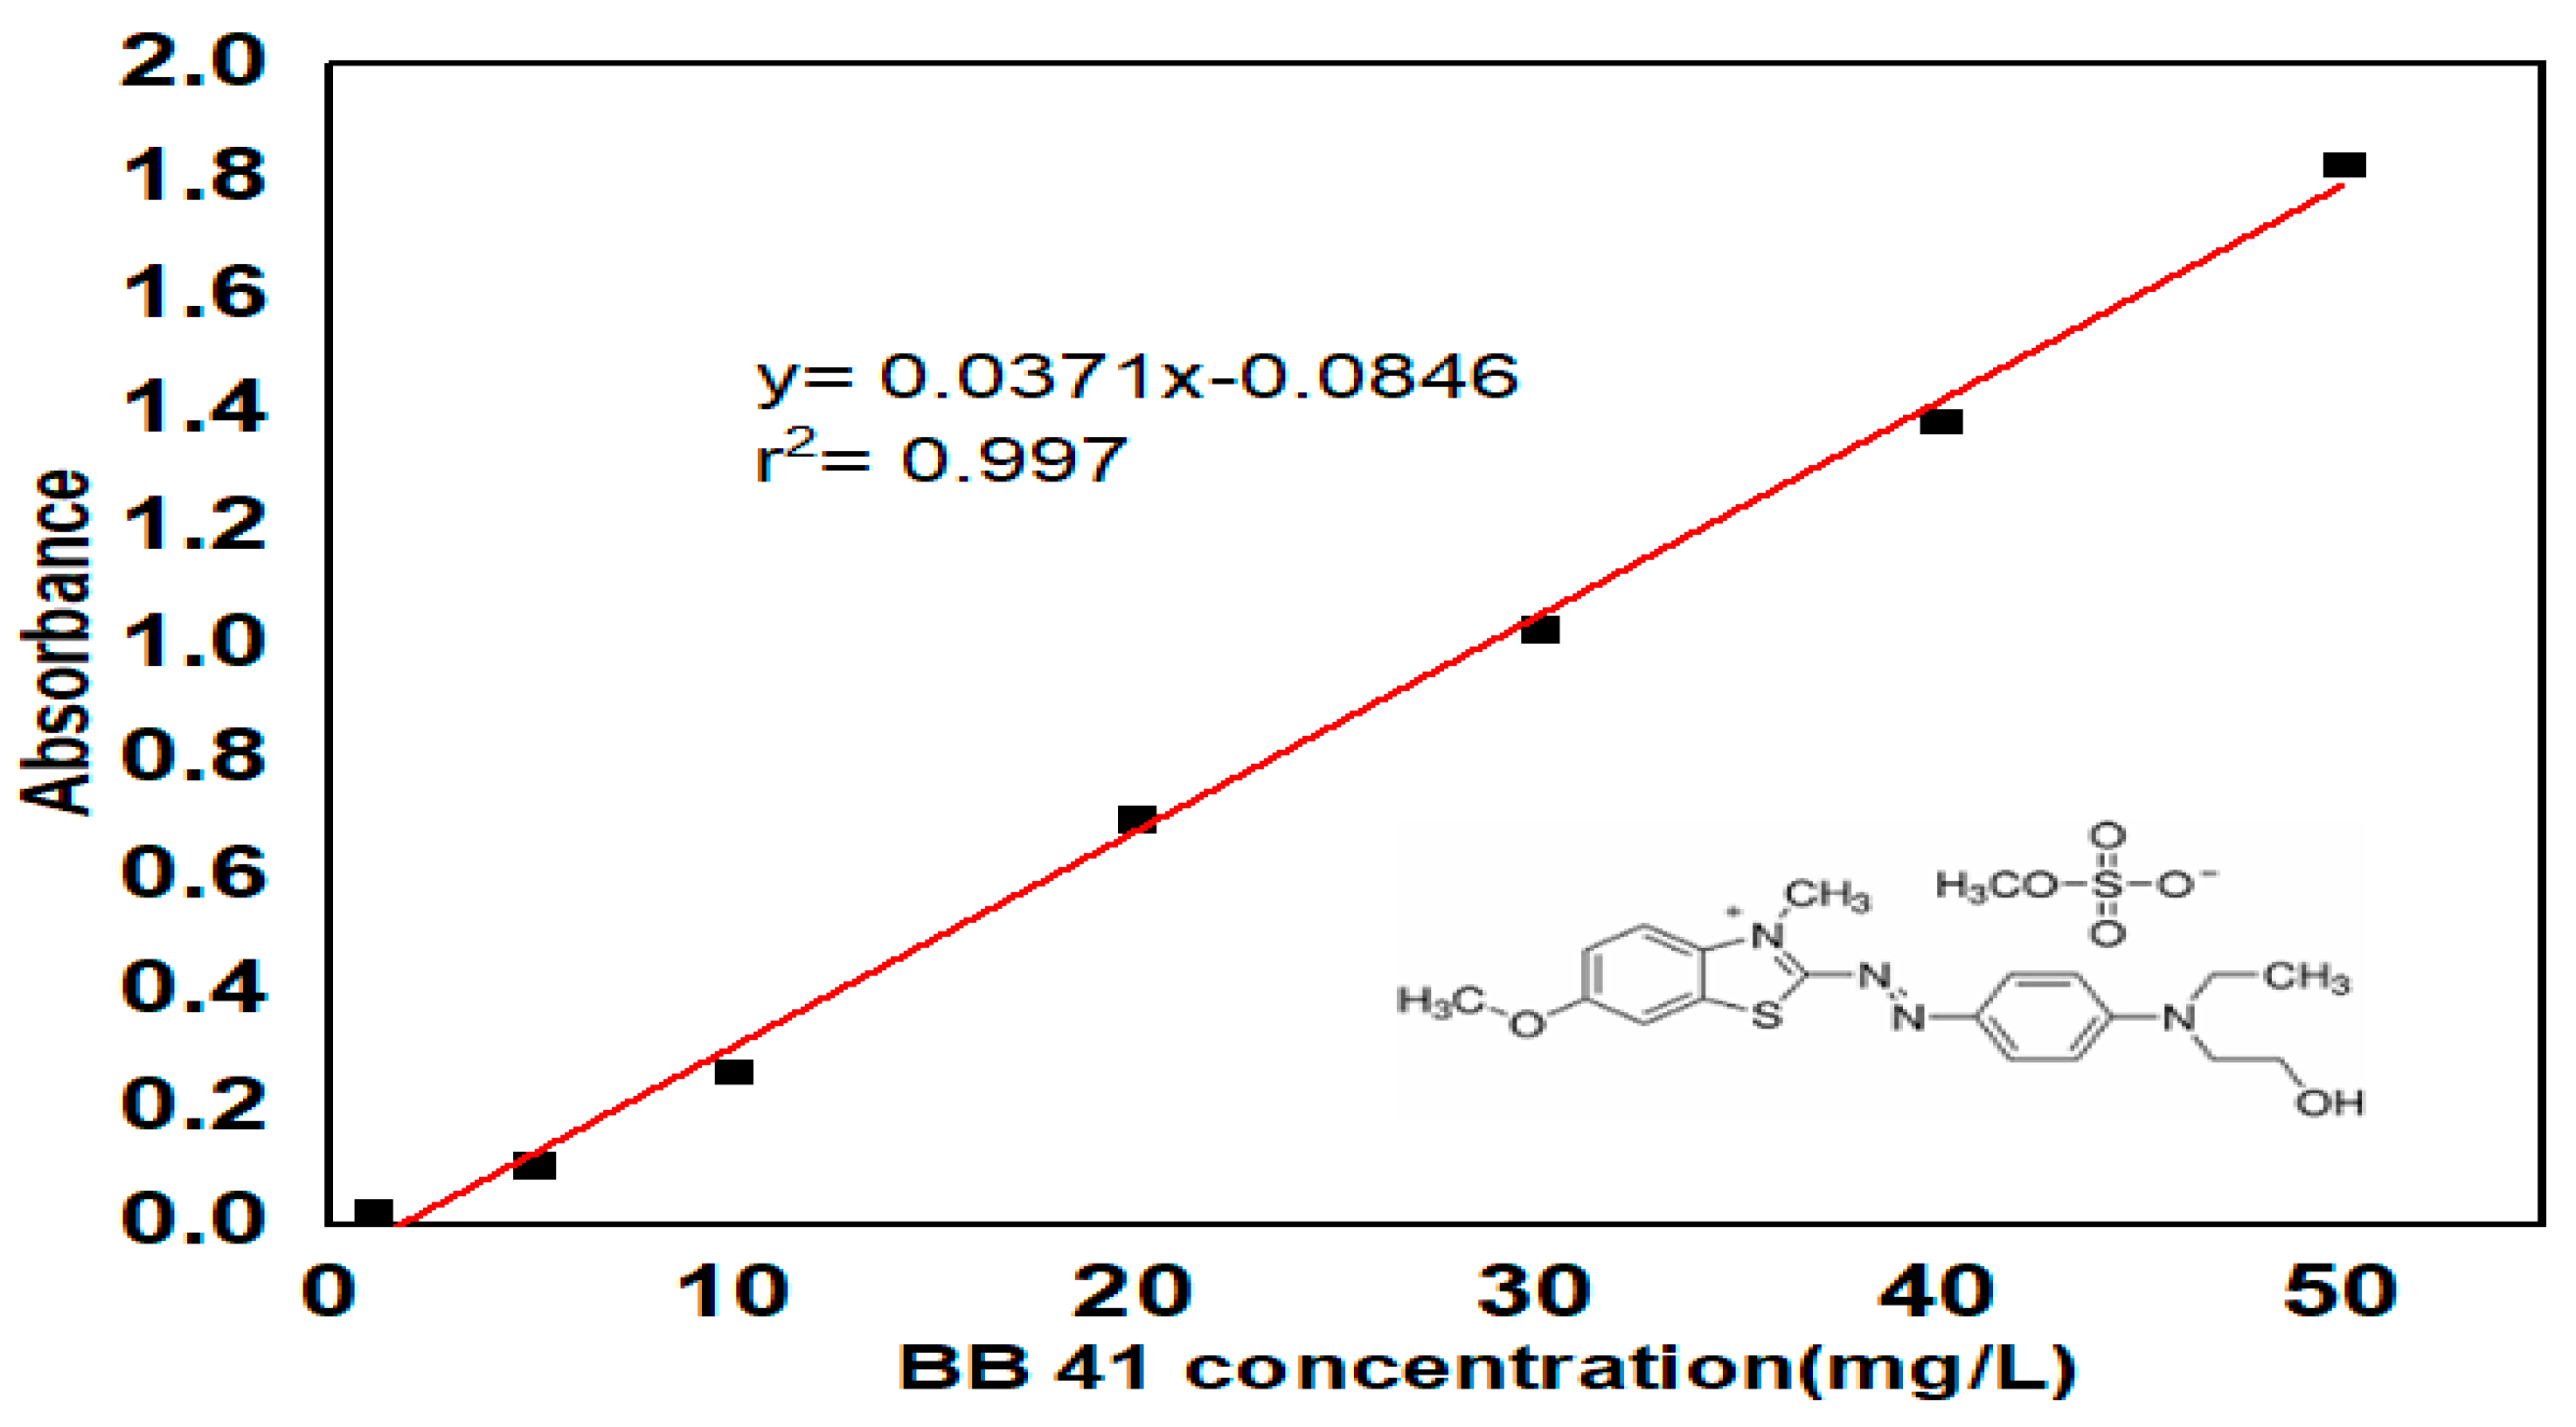
Figure 3.
XRD pattern of –HTM composite.
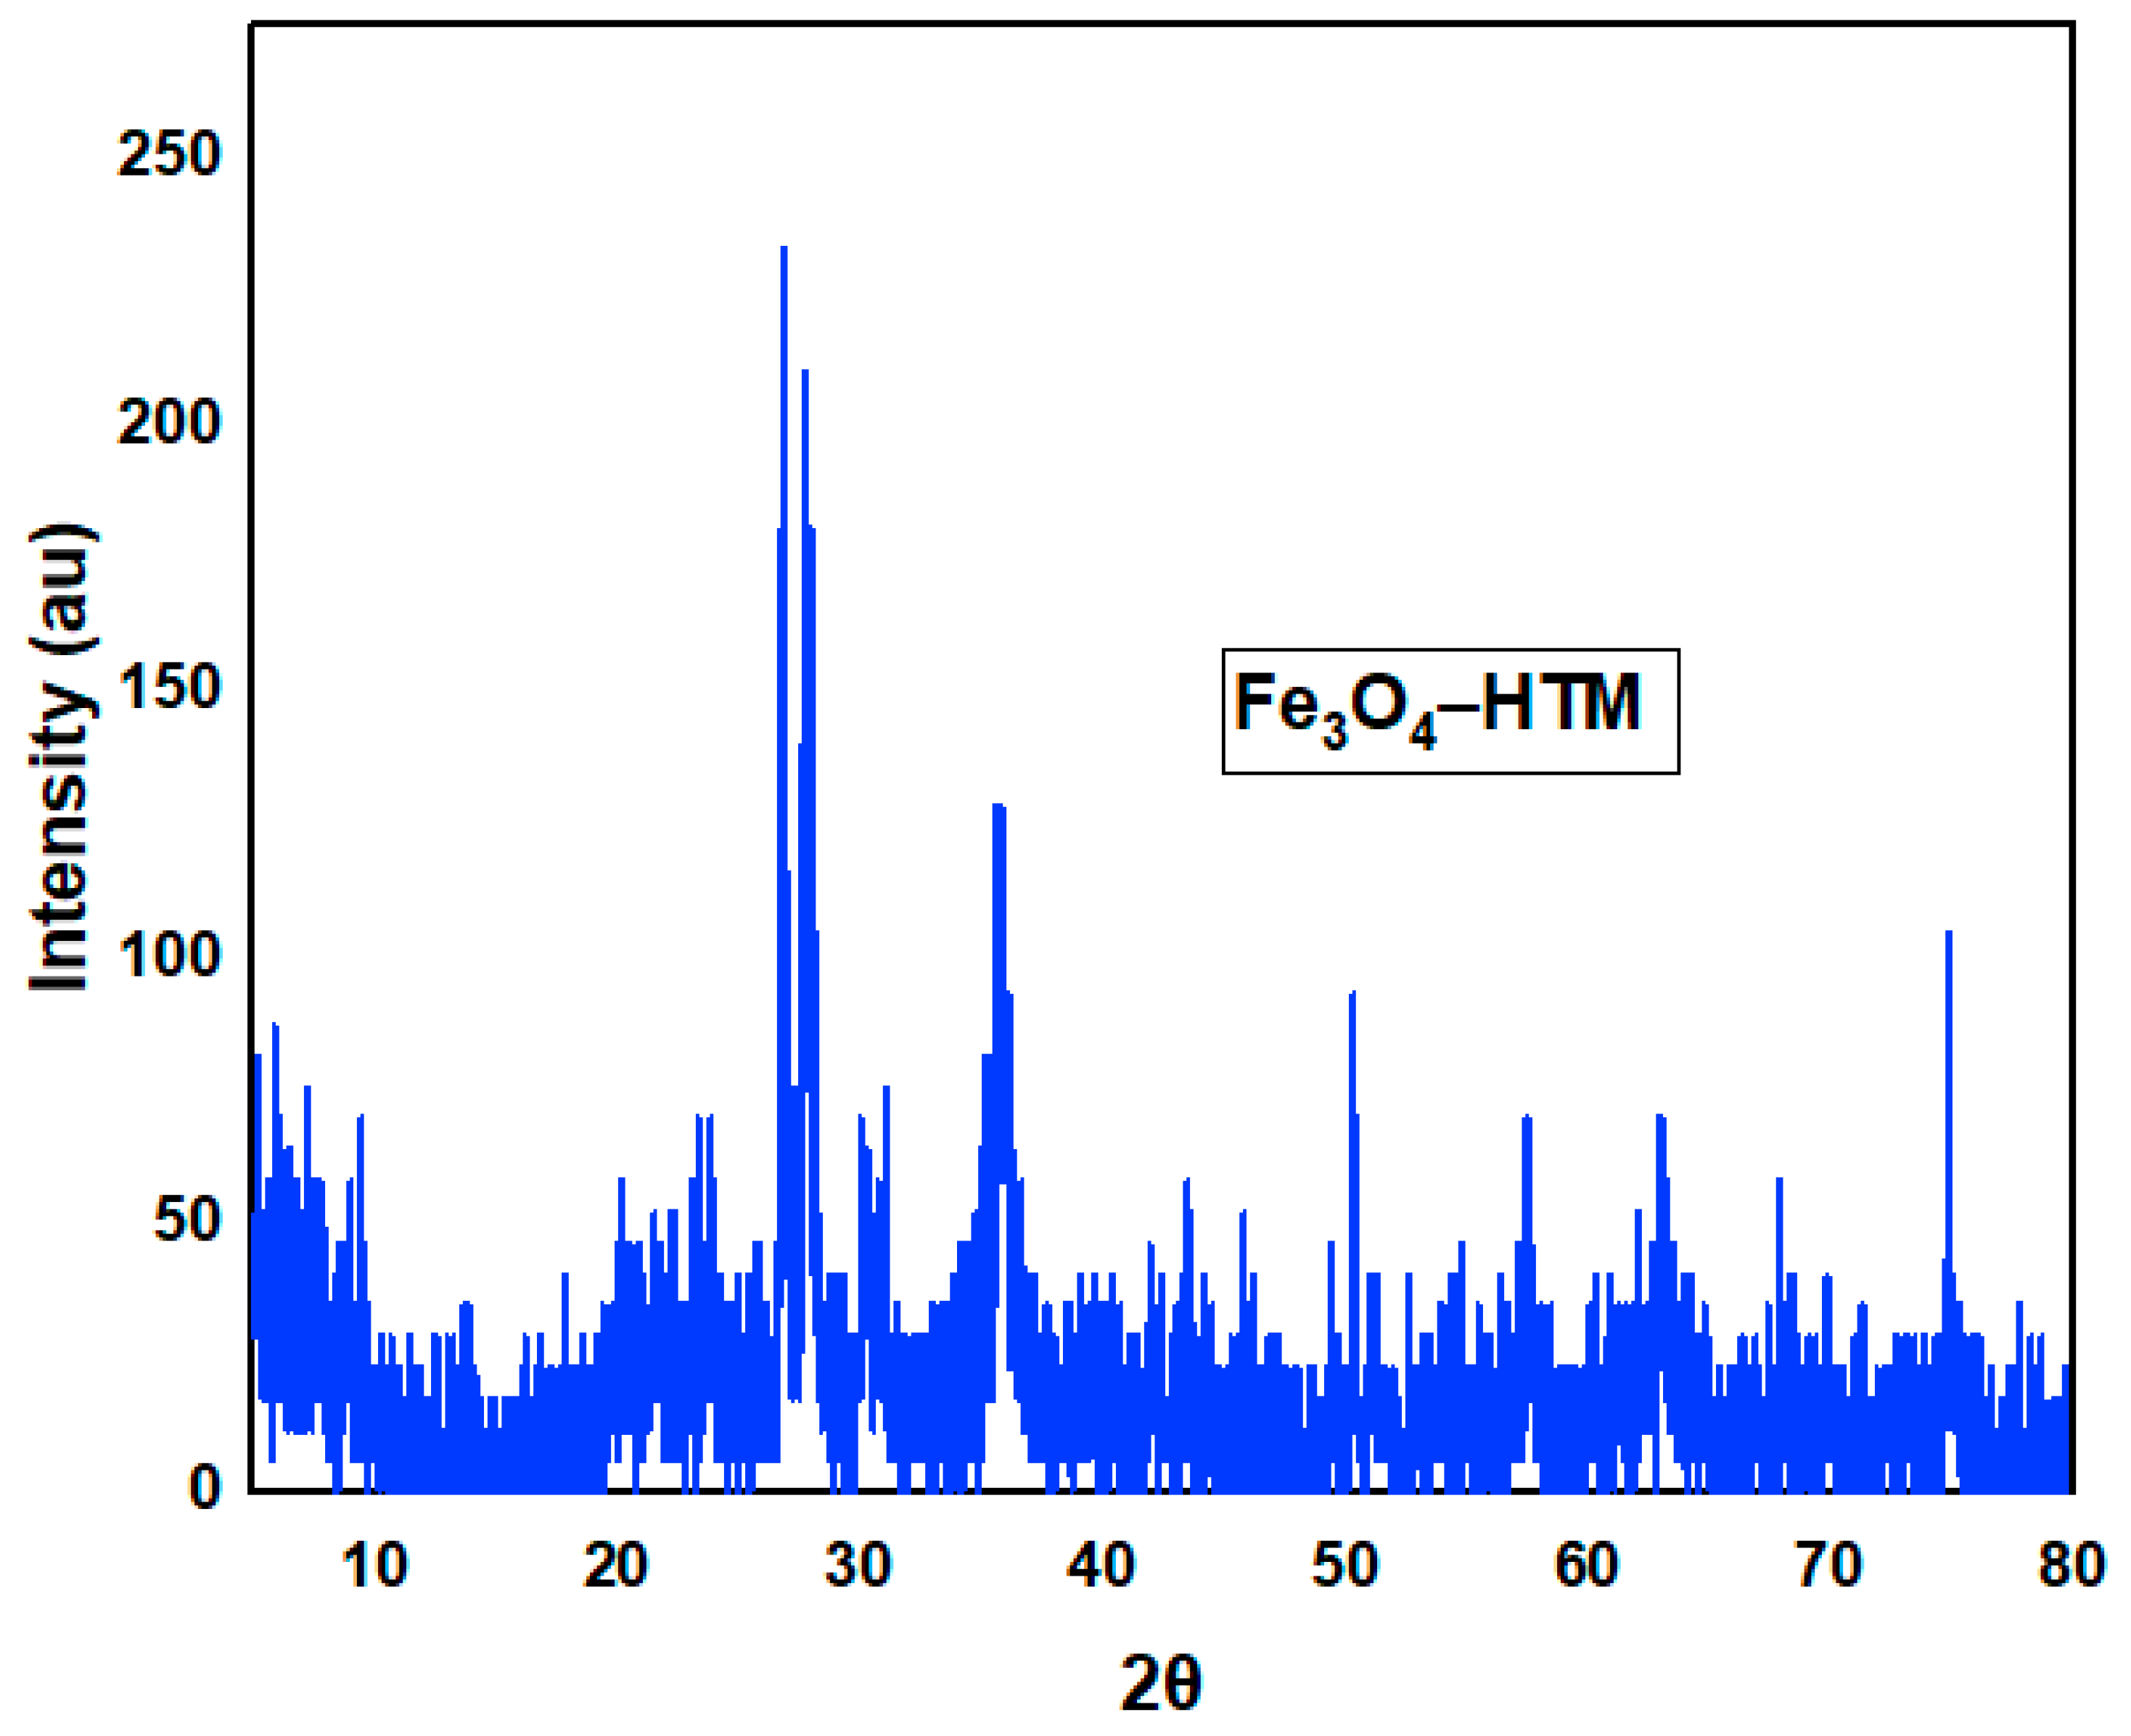
Figure 4.
SEM micrograph of (a) HTM, (b) –HTM.
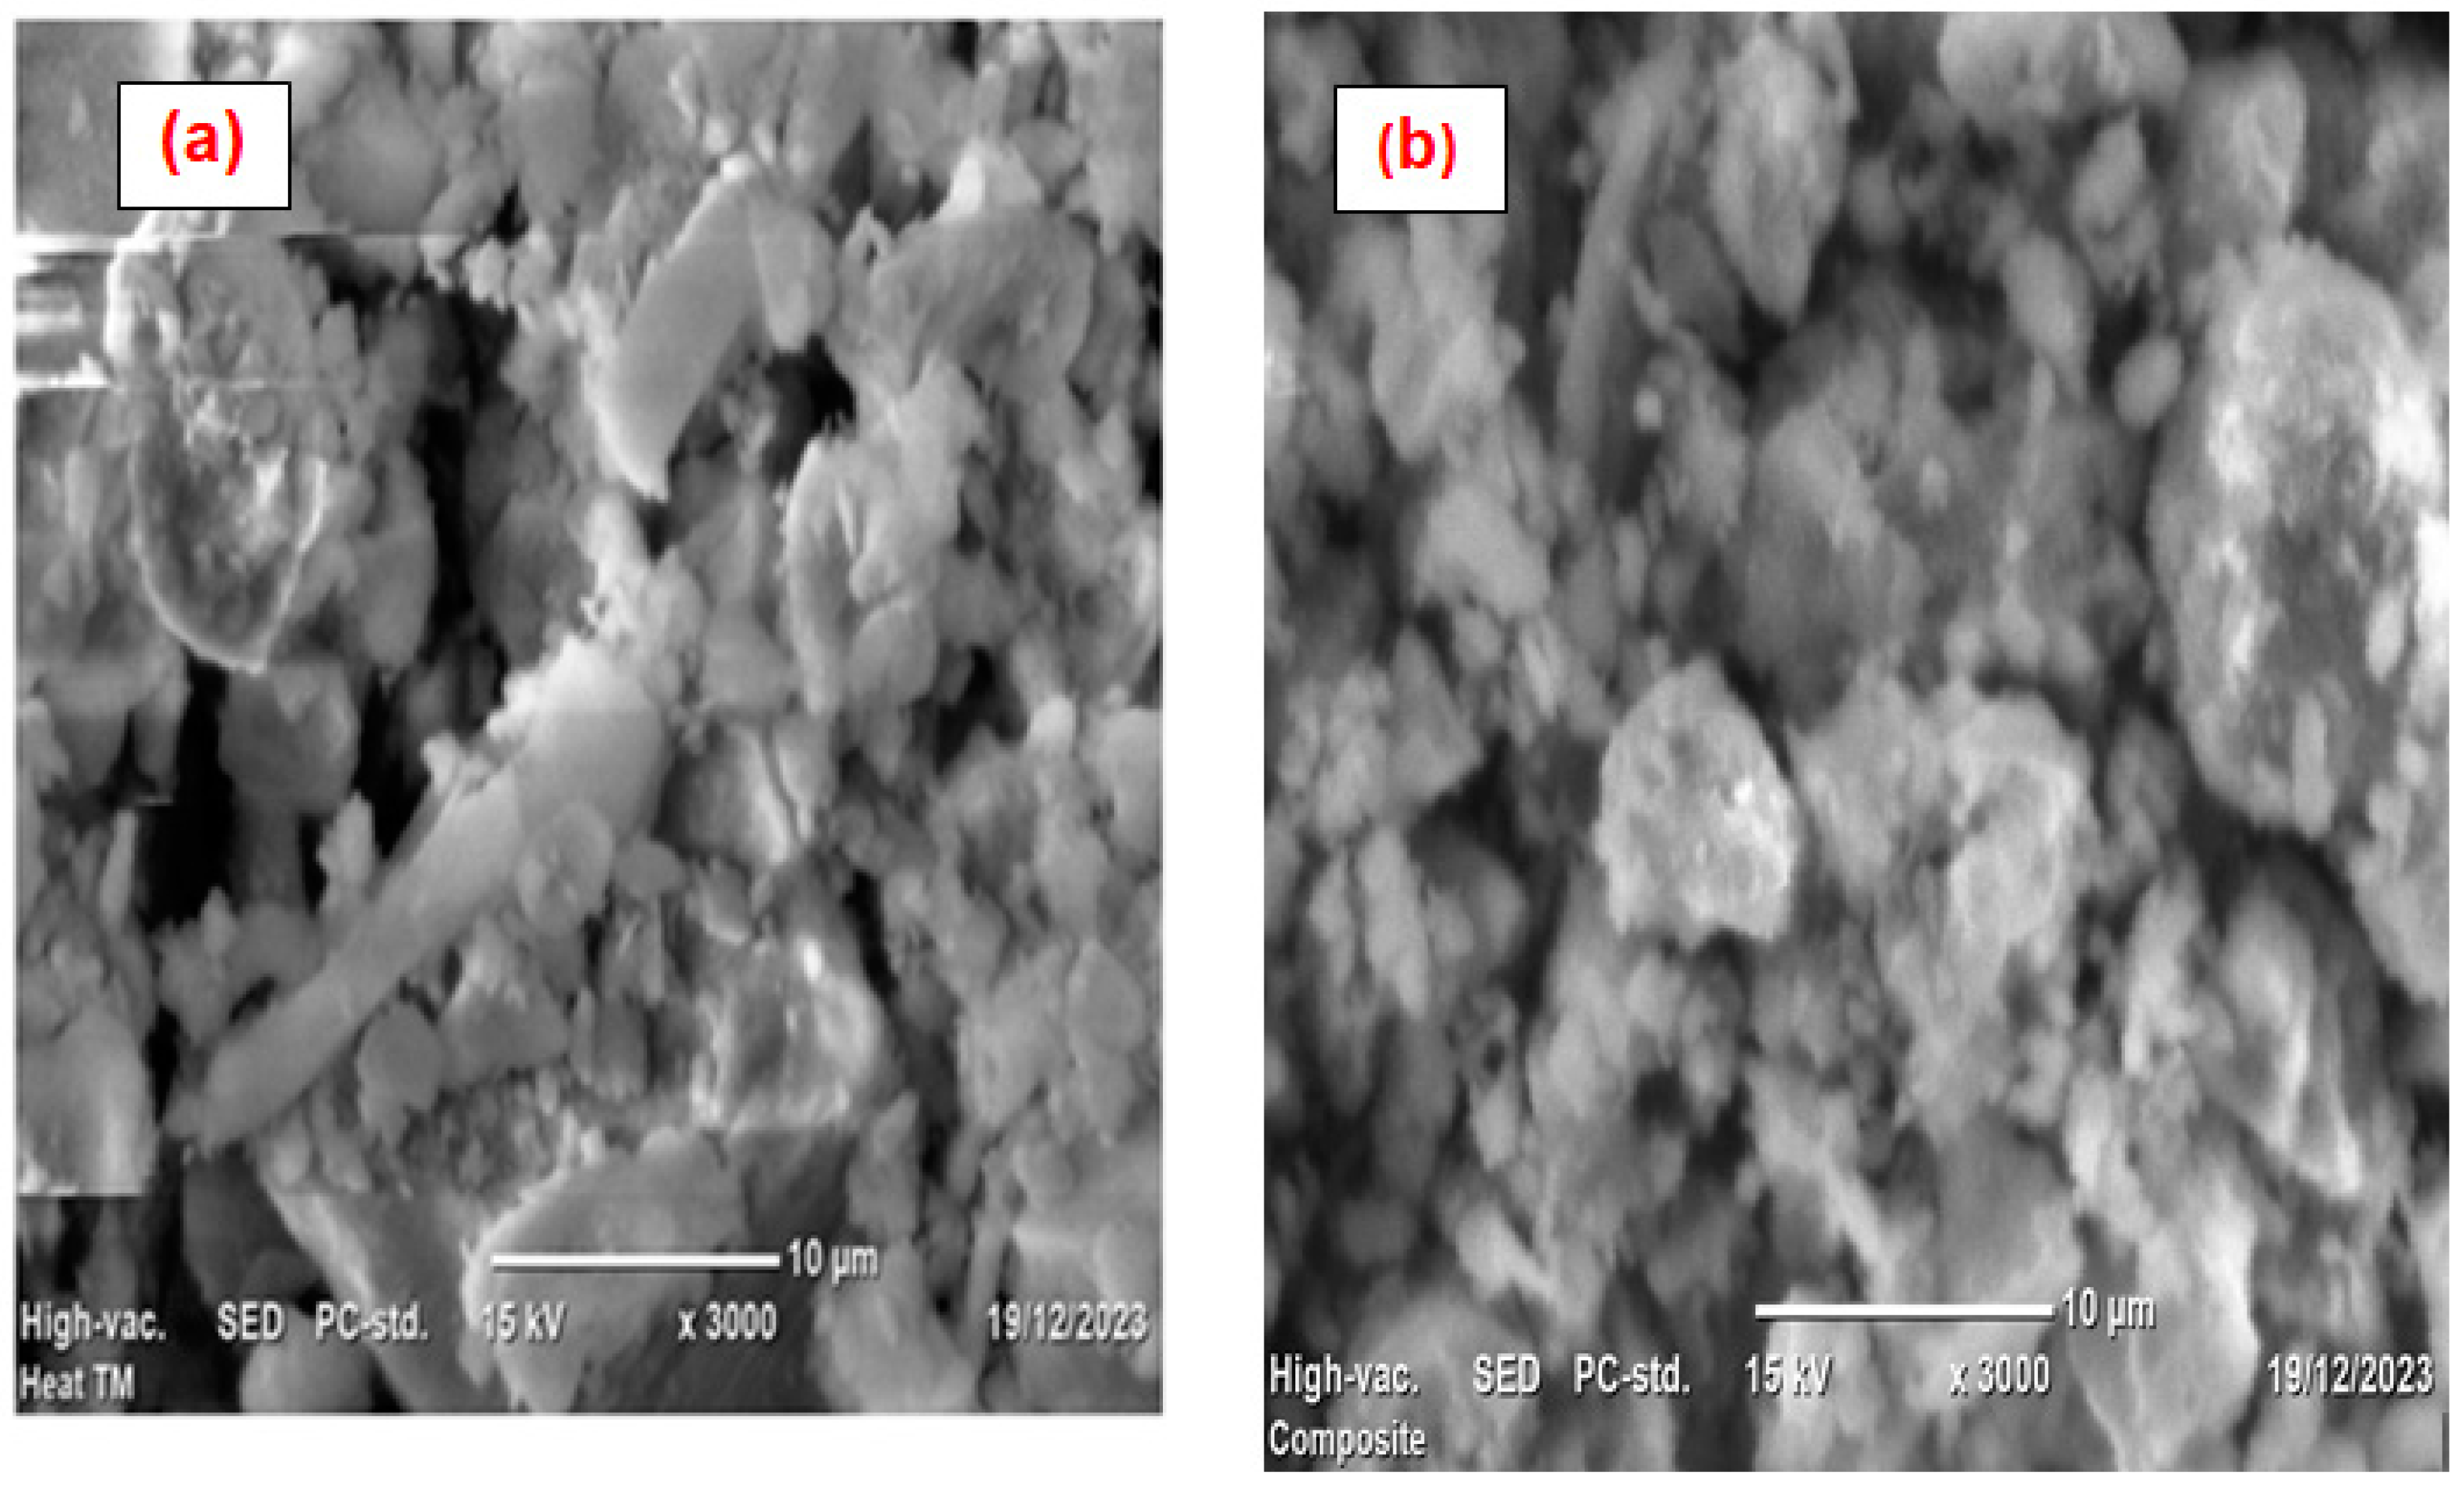
Figure 6.
The percentage removal of BB41 dye with the amount of HTM.
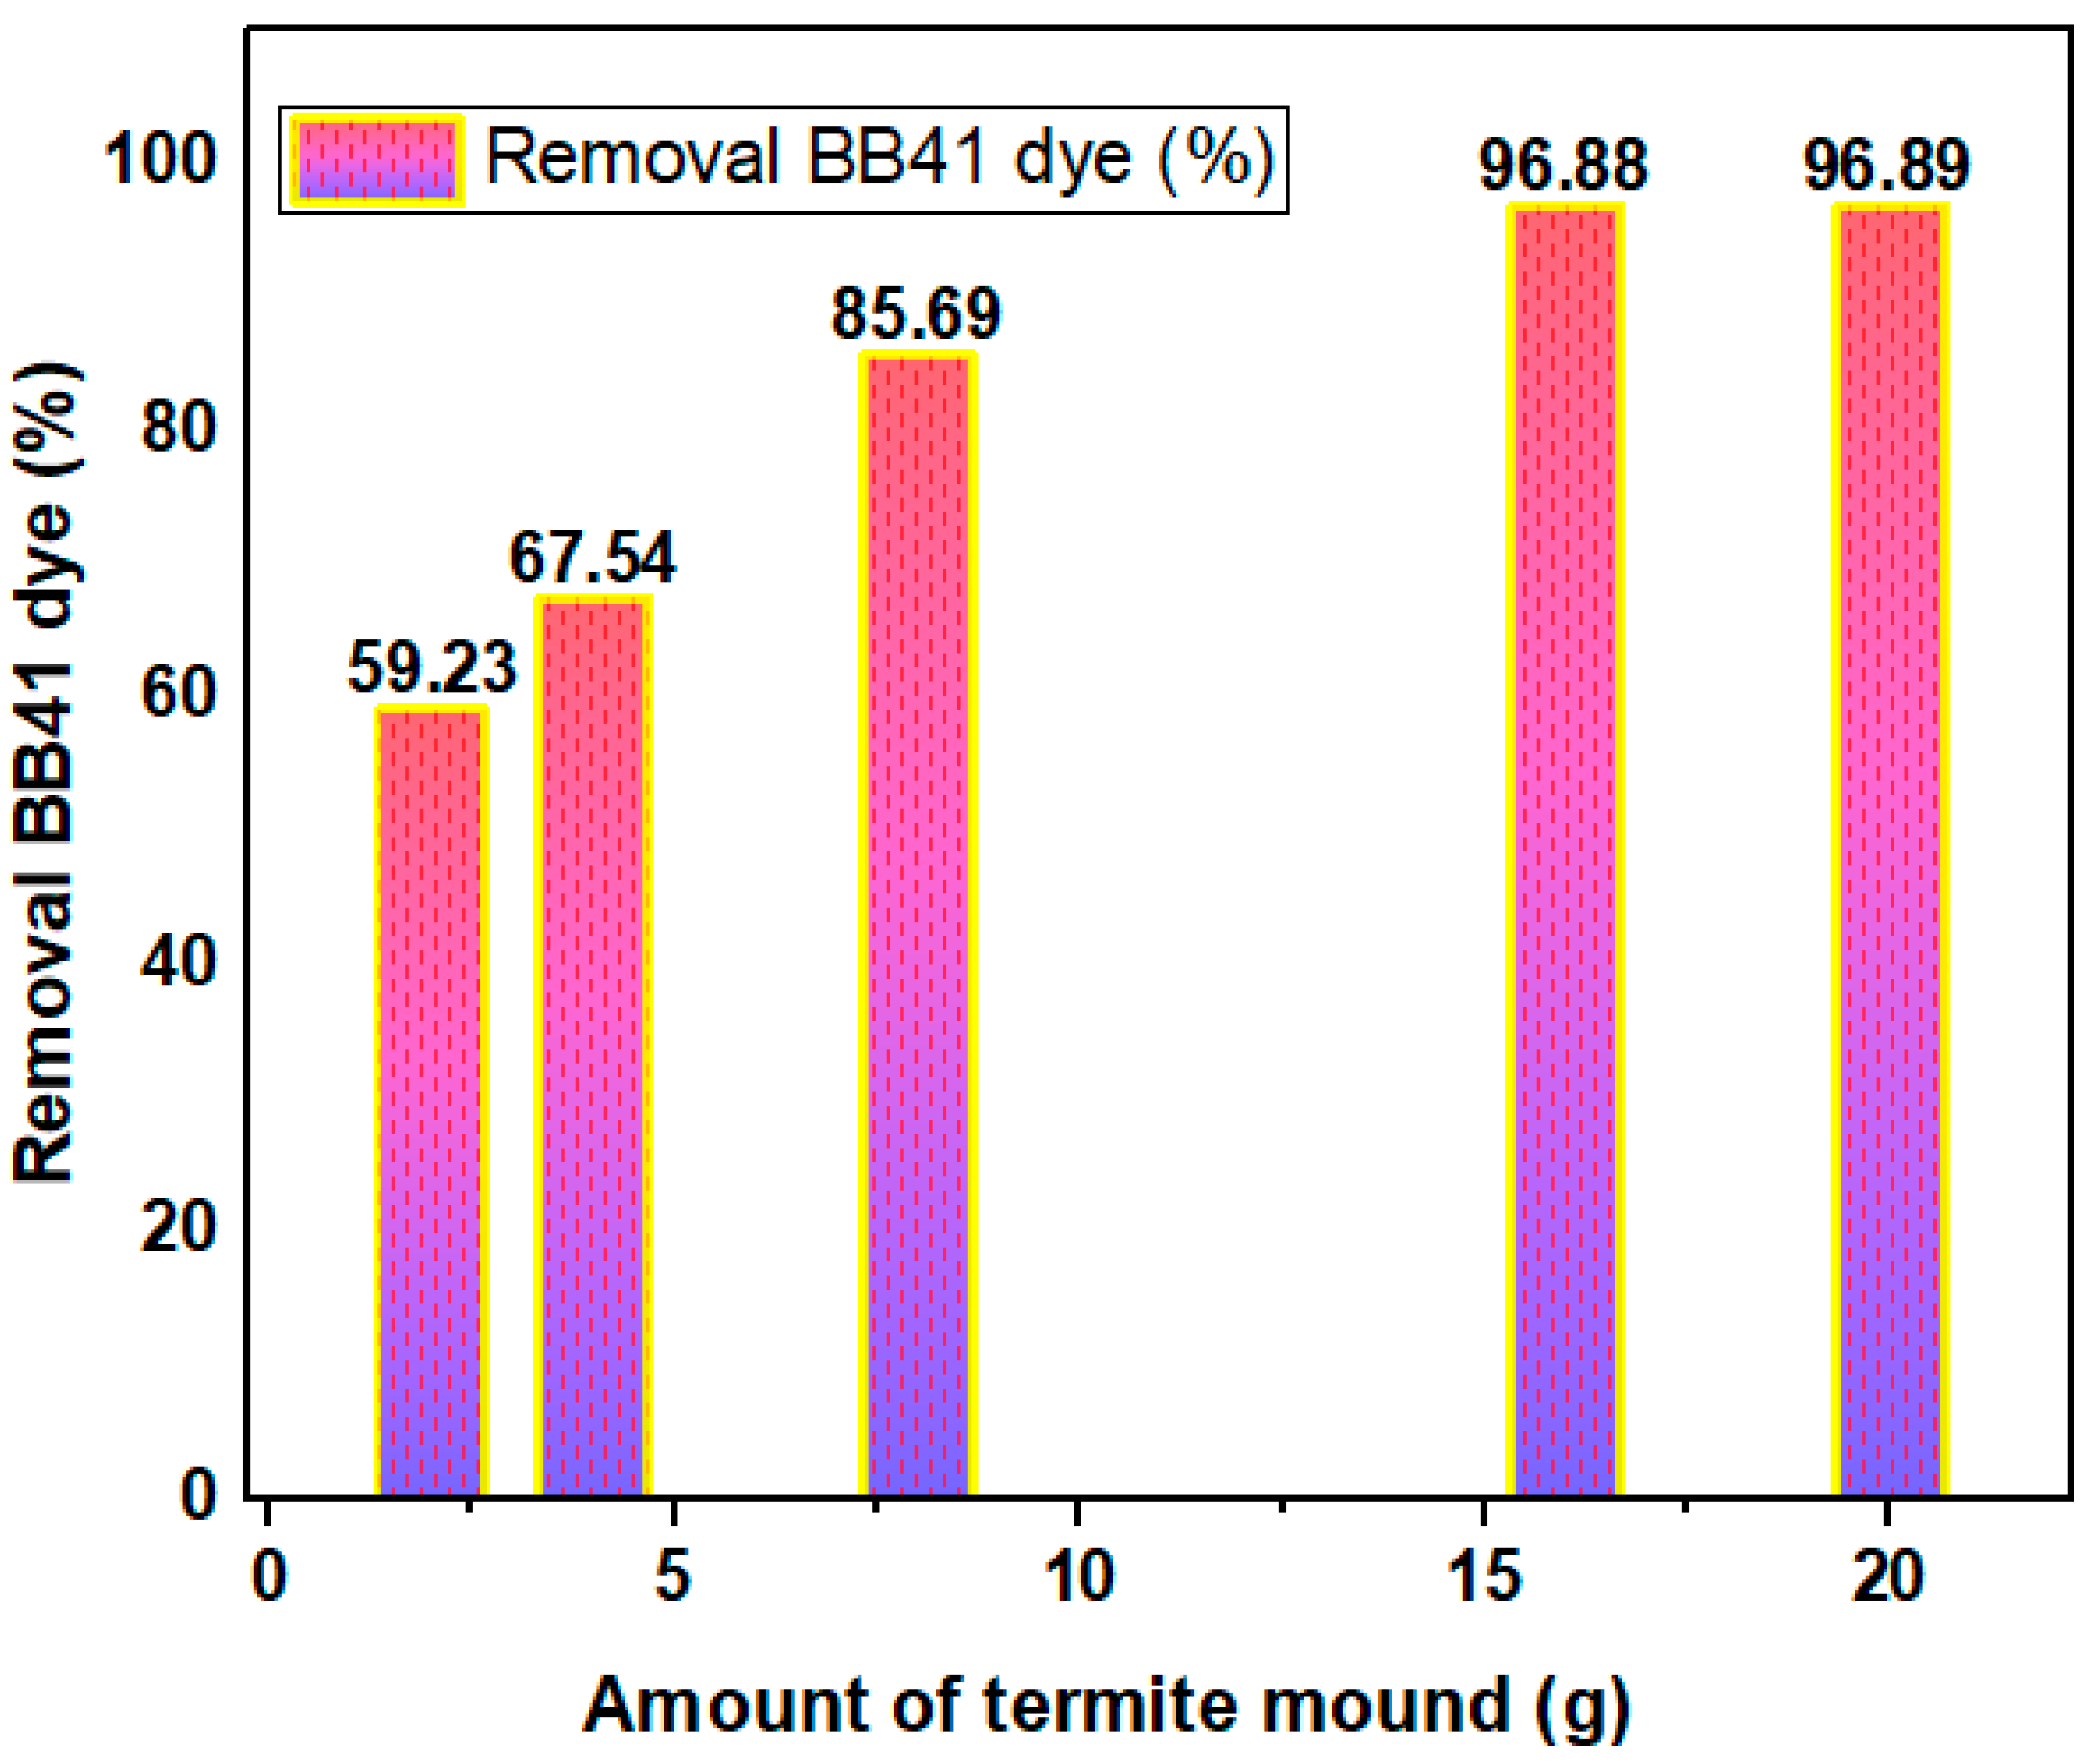
Figure 7.
(a). Magnetic property of dried –HTM. Figure 7 (b). separation of magnetic –HTM loading BB 41 dye from treated solution.
Figure 7.
(a). Magnetic property of dried –HTM. Figure 7 (b). separation of magnetic –HTM loading BB 41 dye from treated solution.
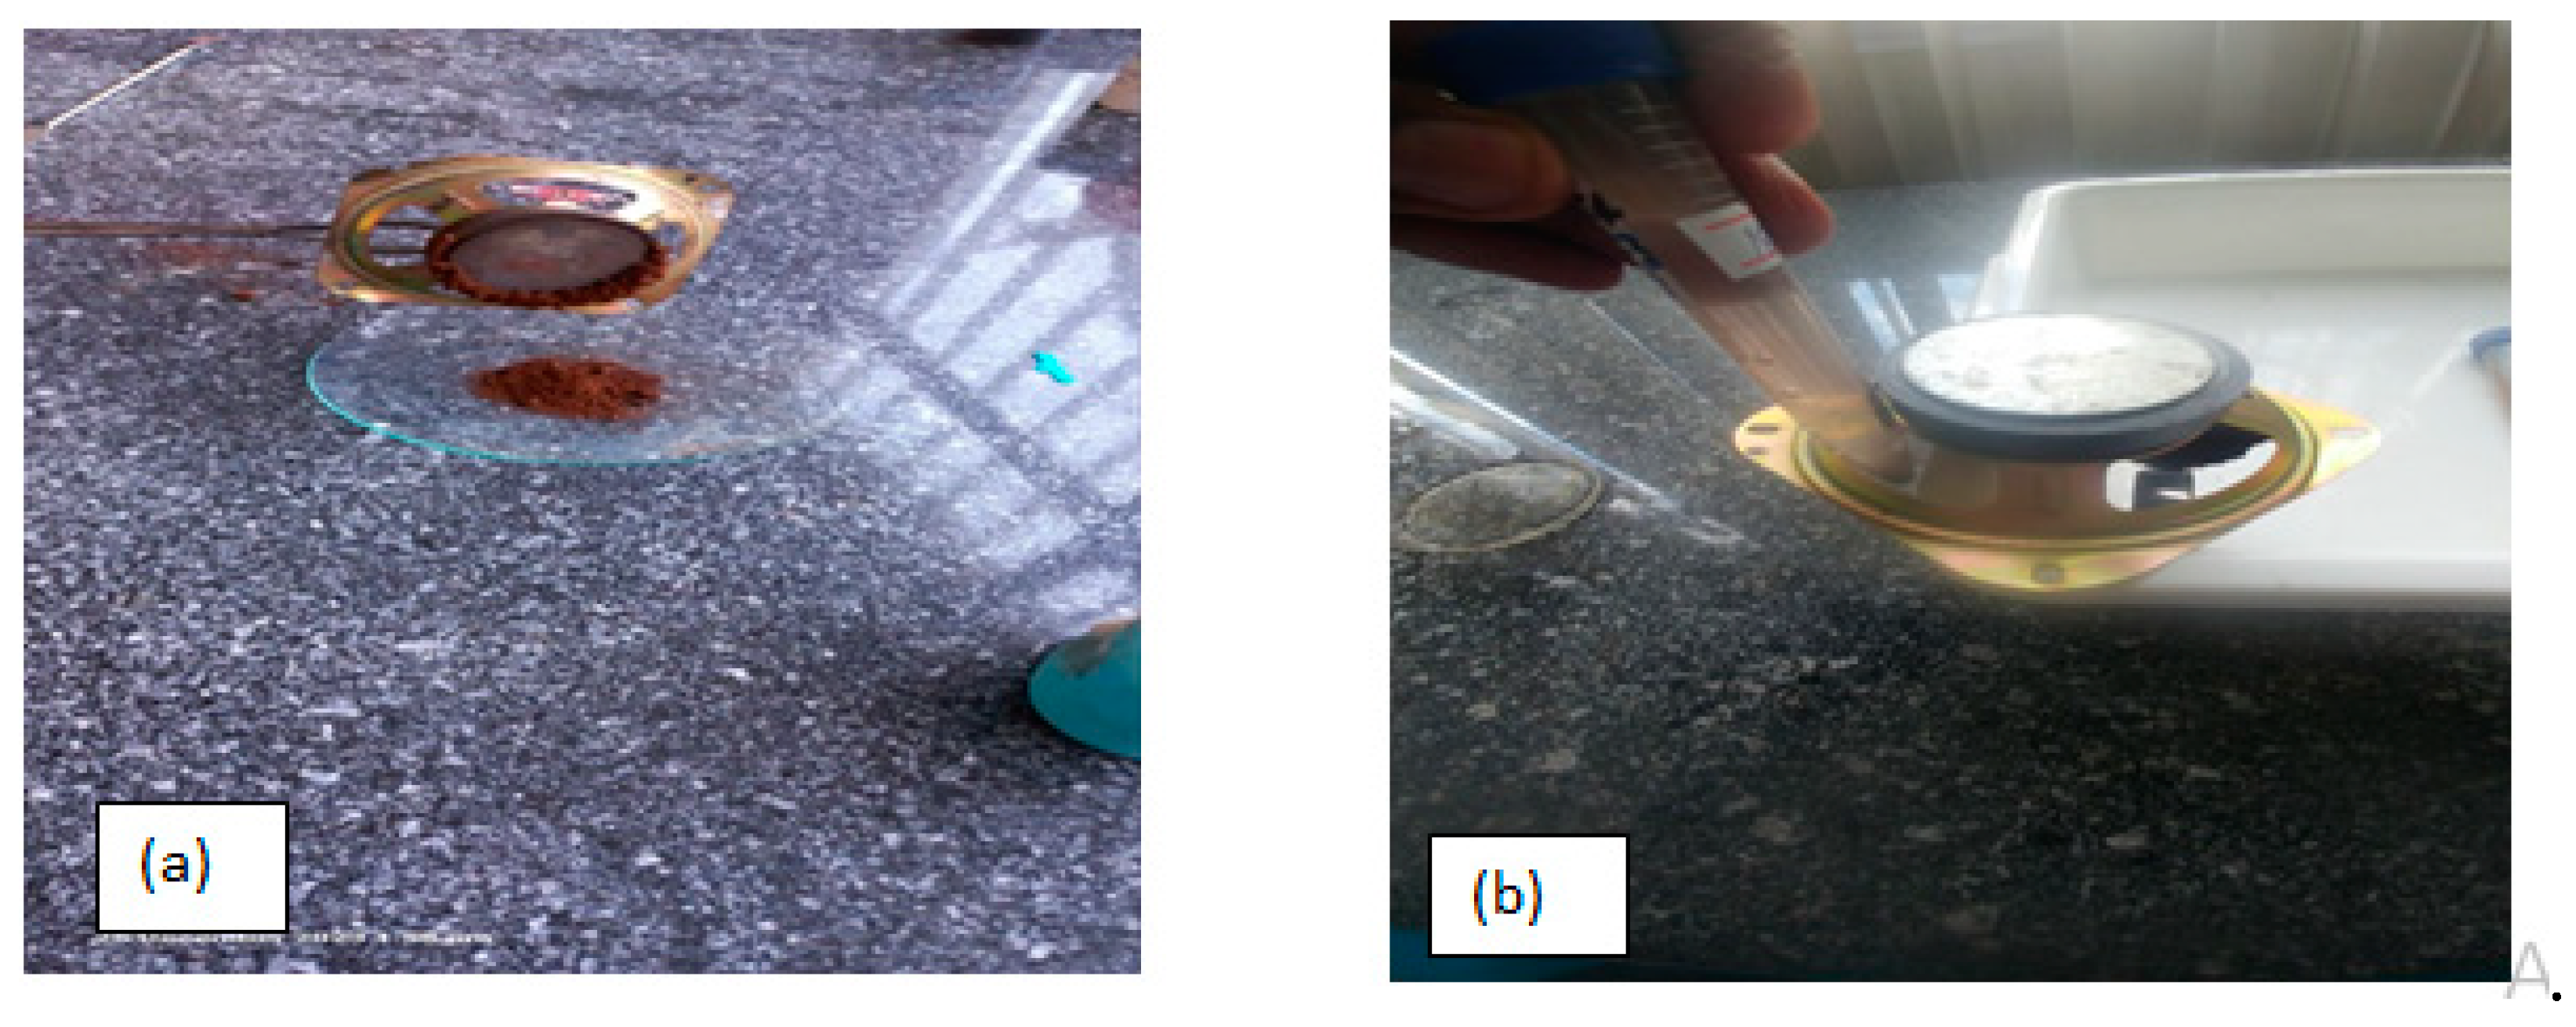
Figure 10.
Pertuation plot for removal of BB 41 dye using –HTM.
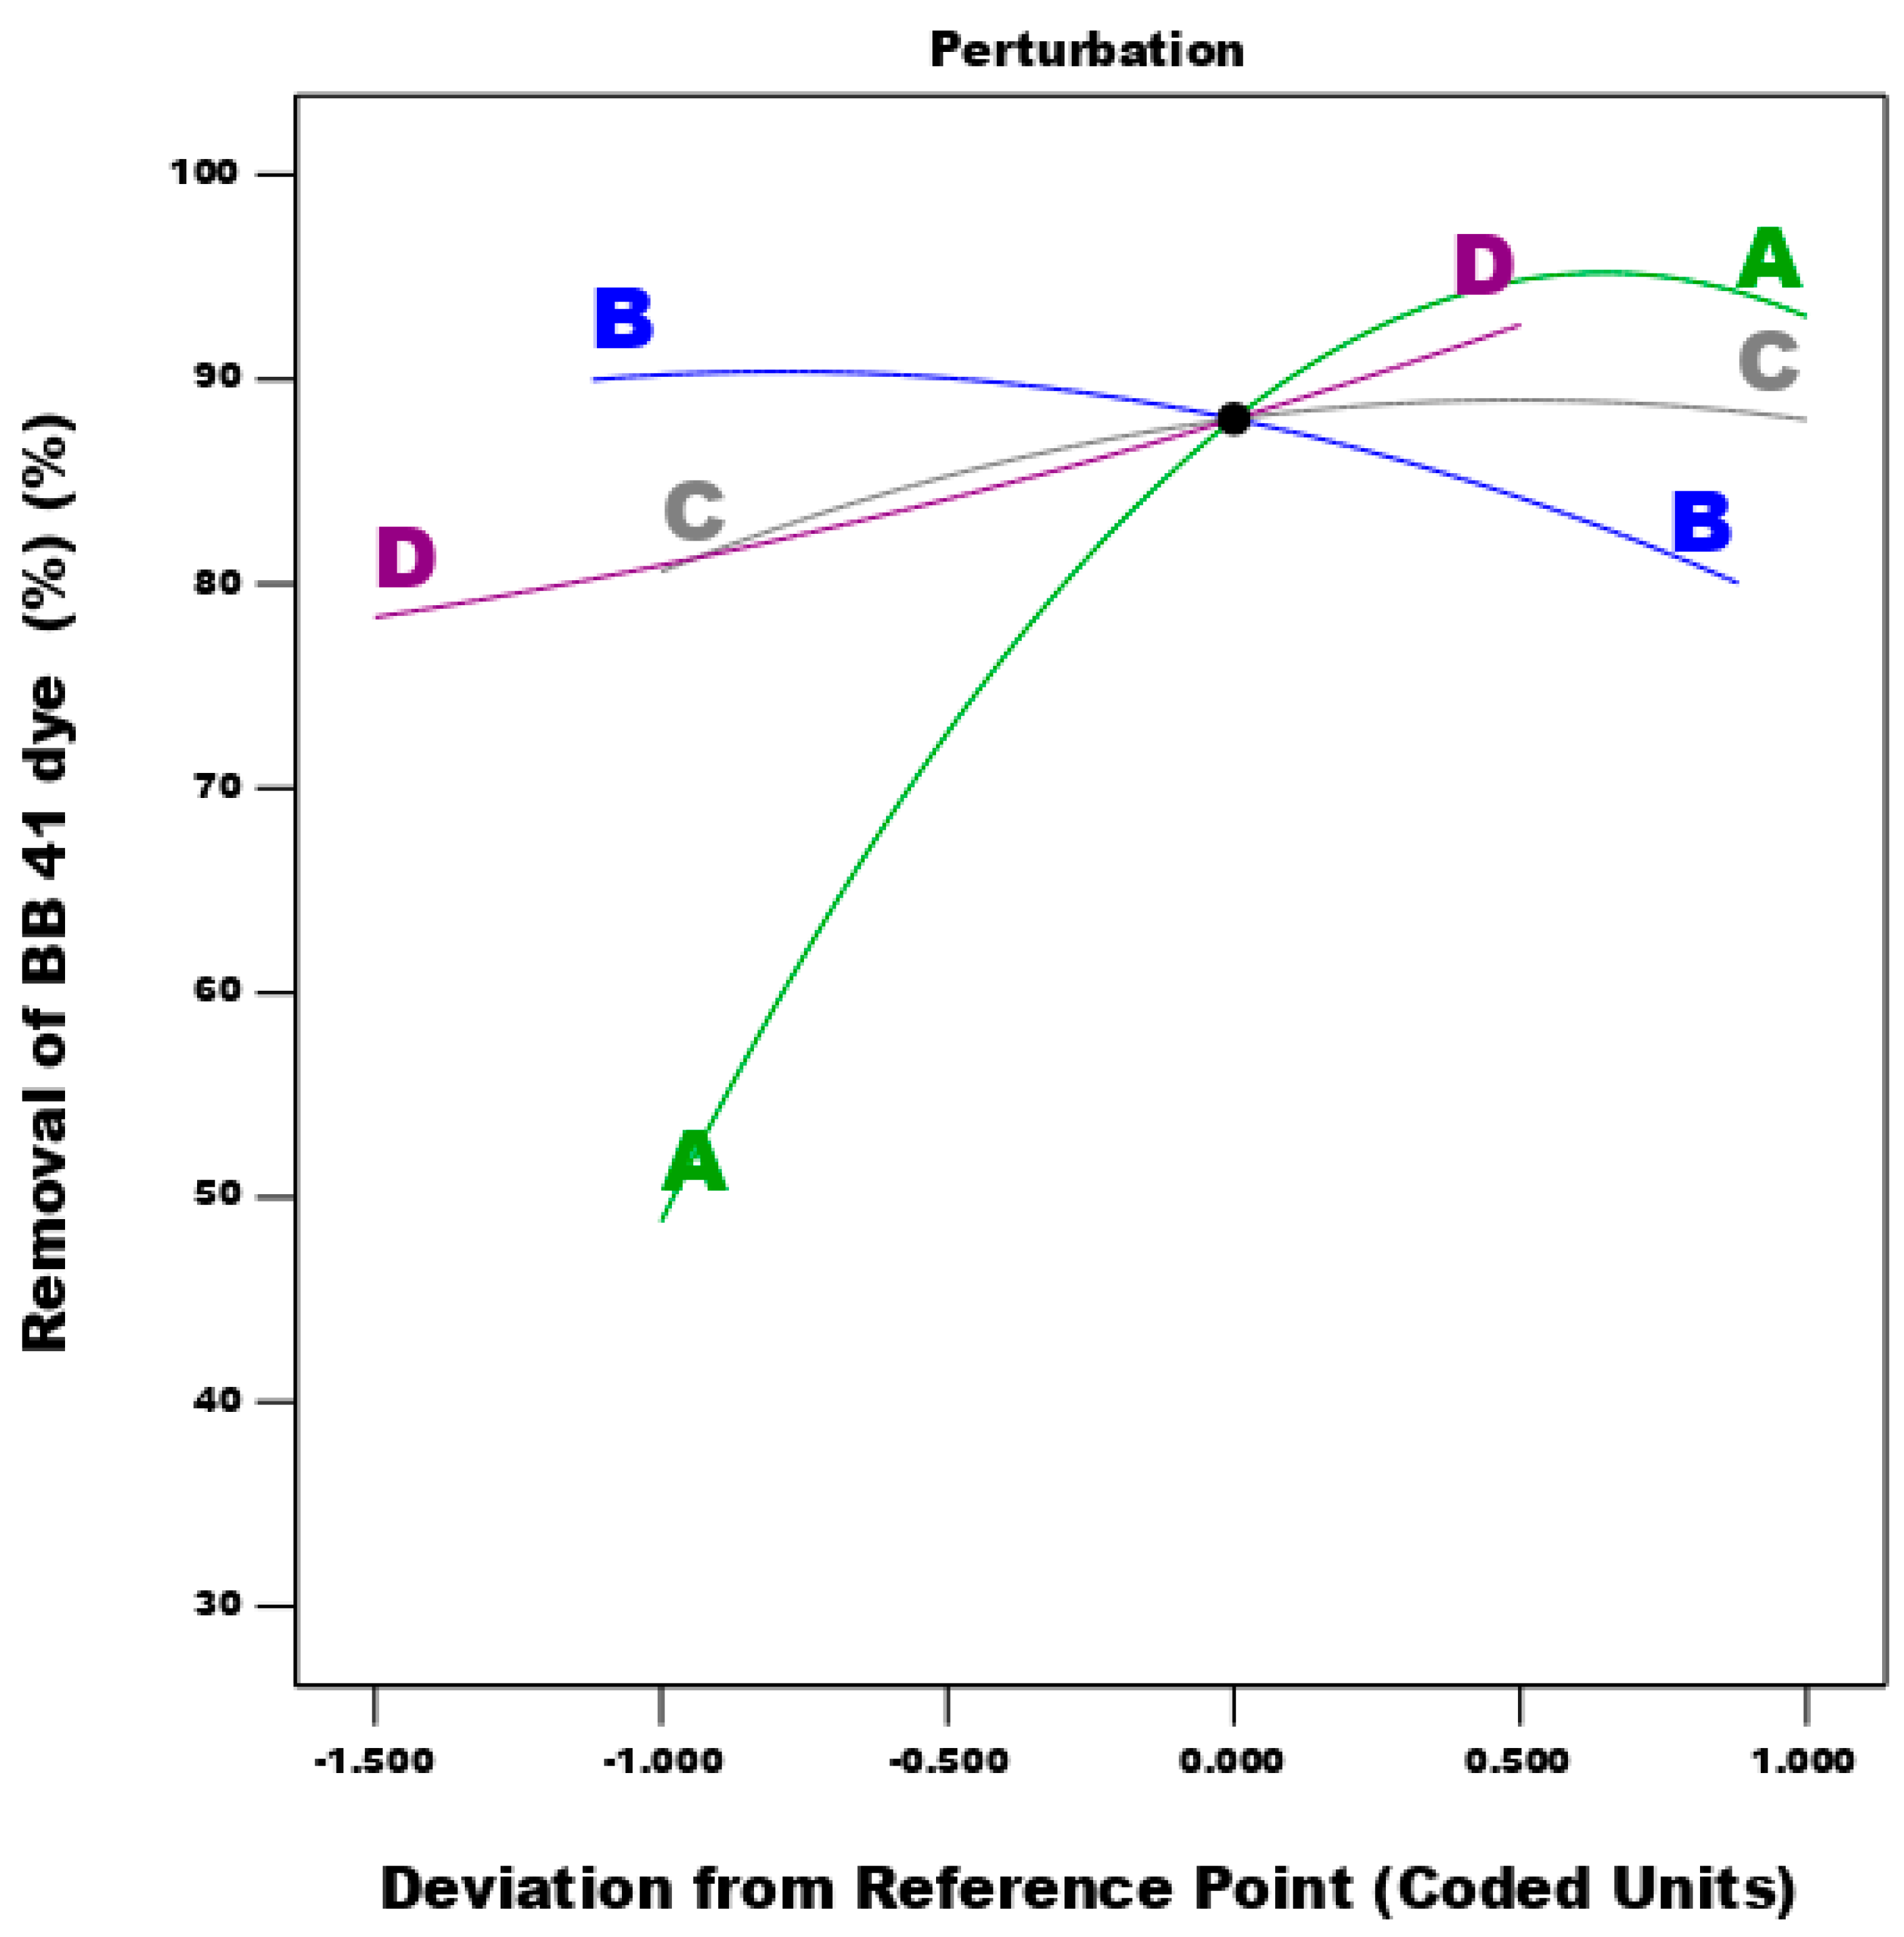
Figure 11.
3D and contour plot for dye removal by –HTM on interaction effect of the temperature and time.
Figure 11.
3D and contour plot for dye removal by –HTM on interaction effect of the temperature and time.
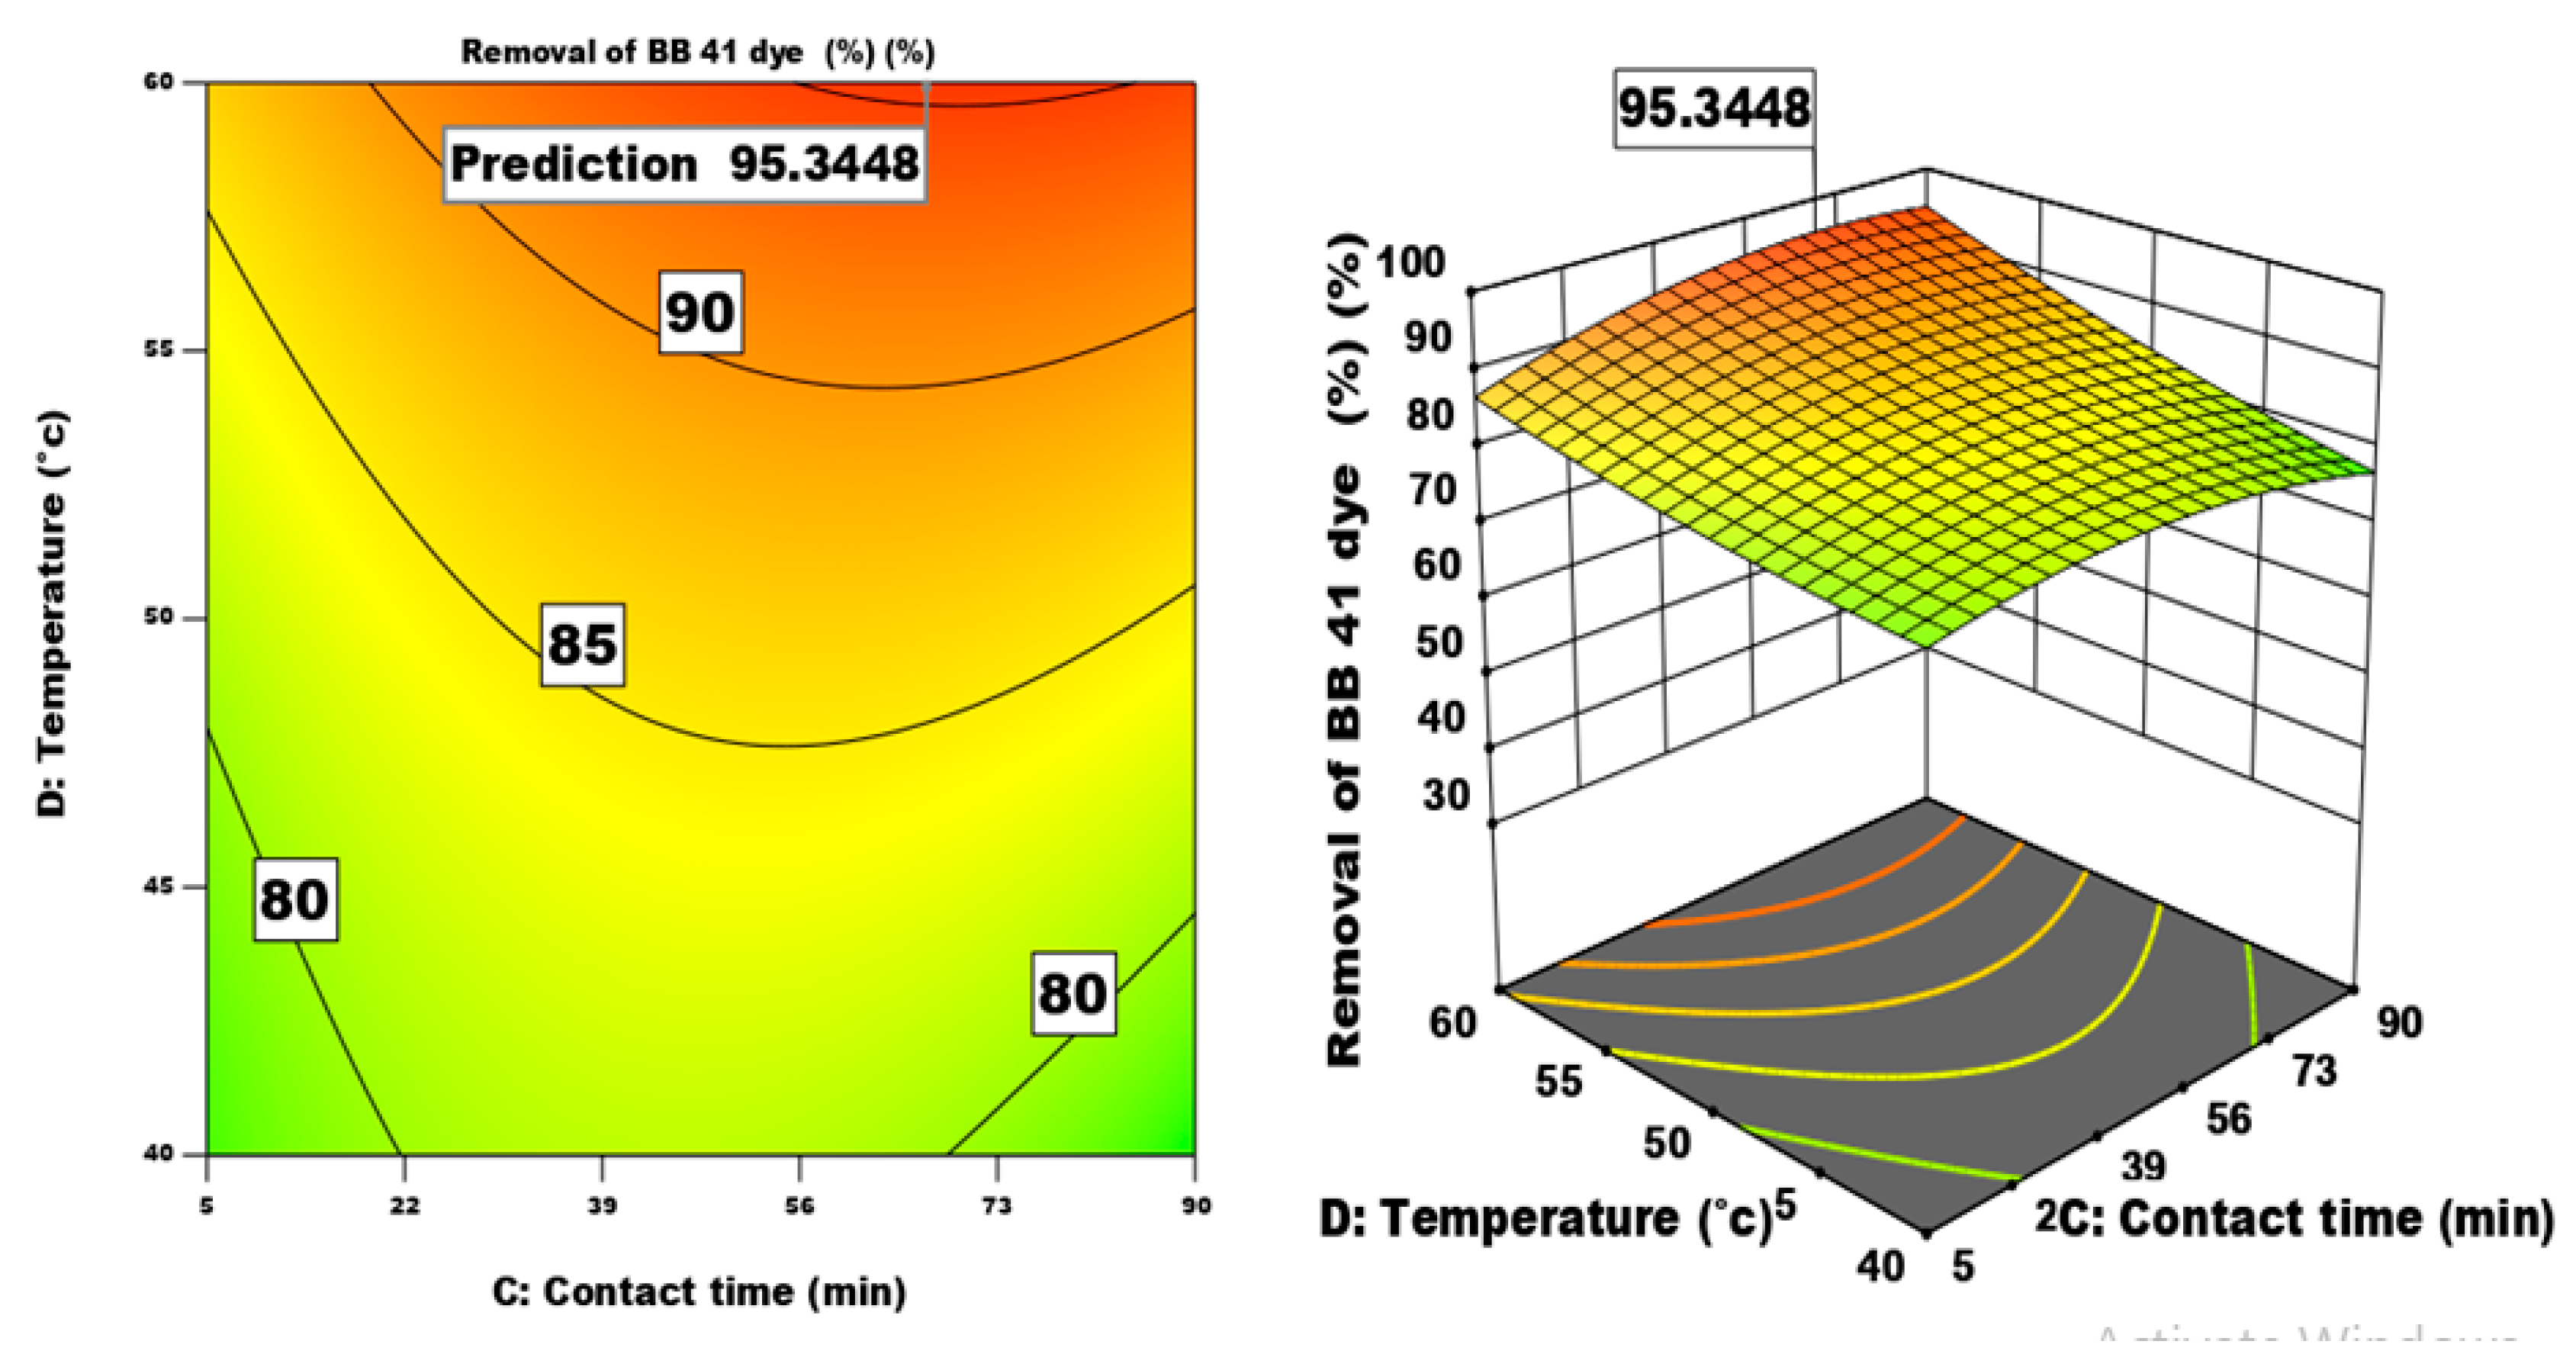
Figure 12.
Shows the response surface and contour plots of BB 41 dye removal over the change of the initial dye concentration and contact time.
Figure 12.
Shows the response surface and contour plots of BB 41 dye removal over the change of the initial dye concentration and contact time.
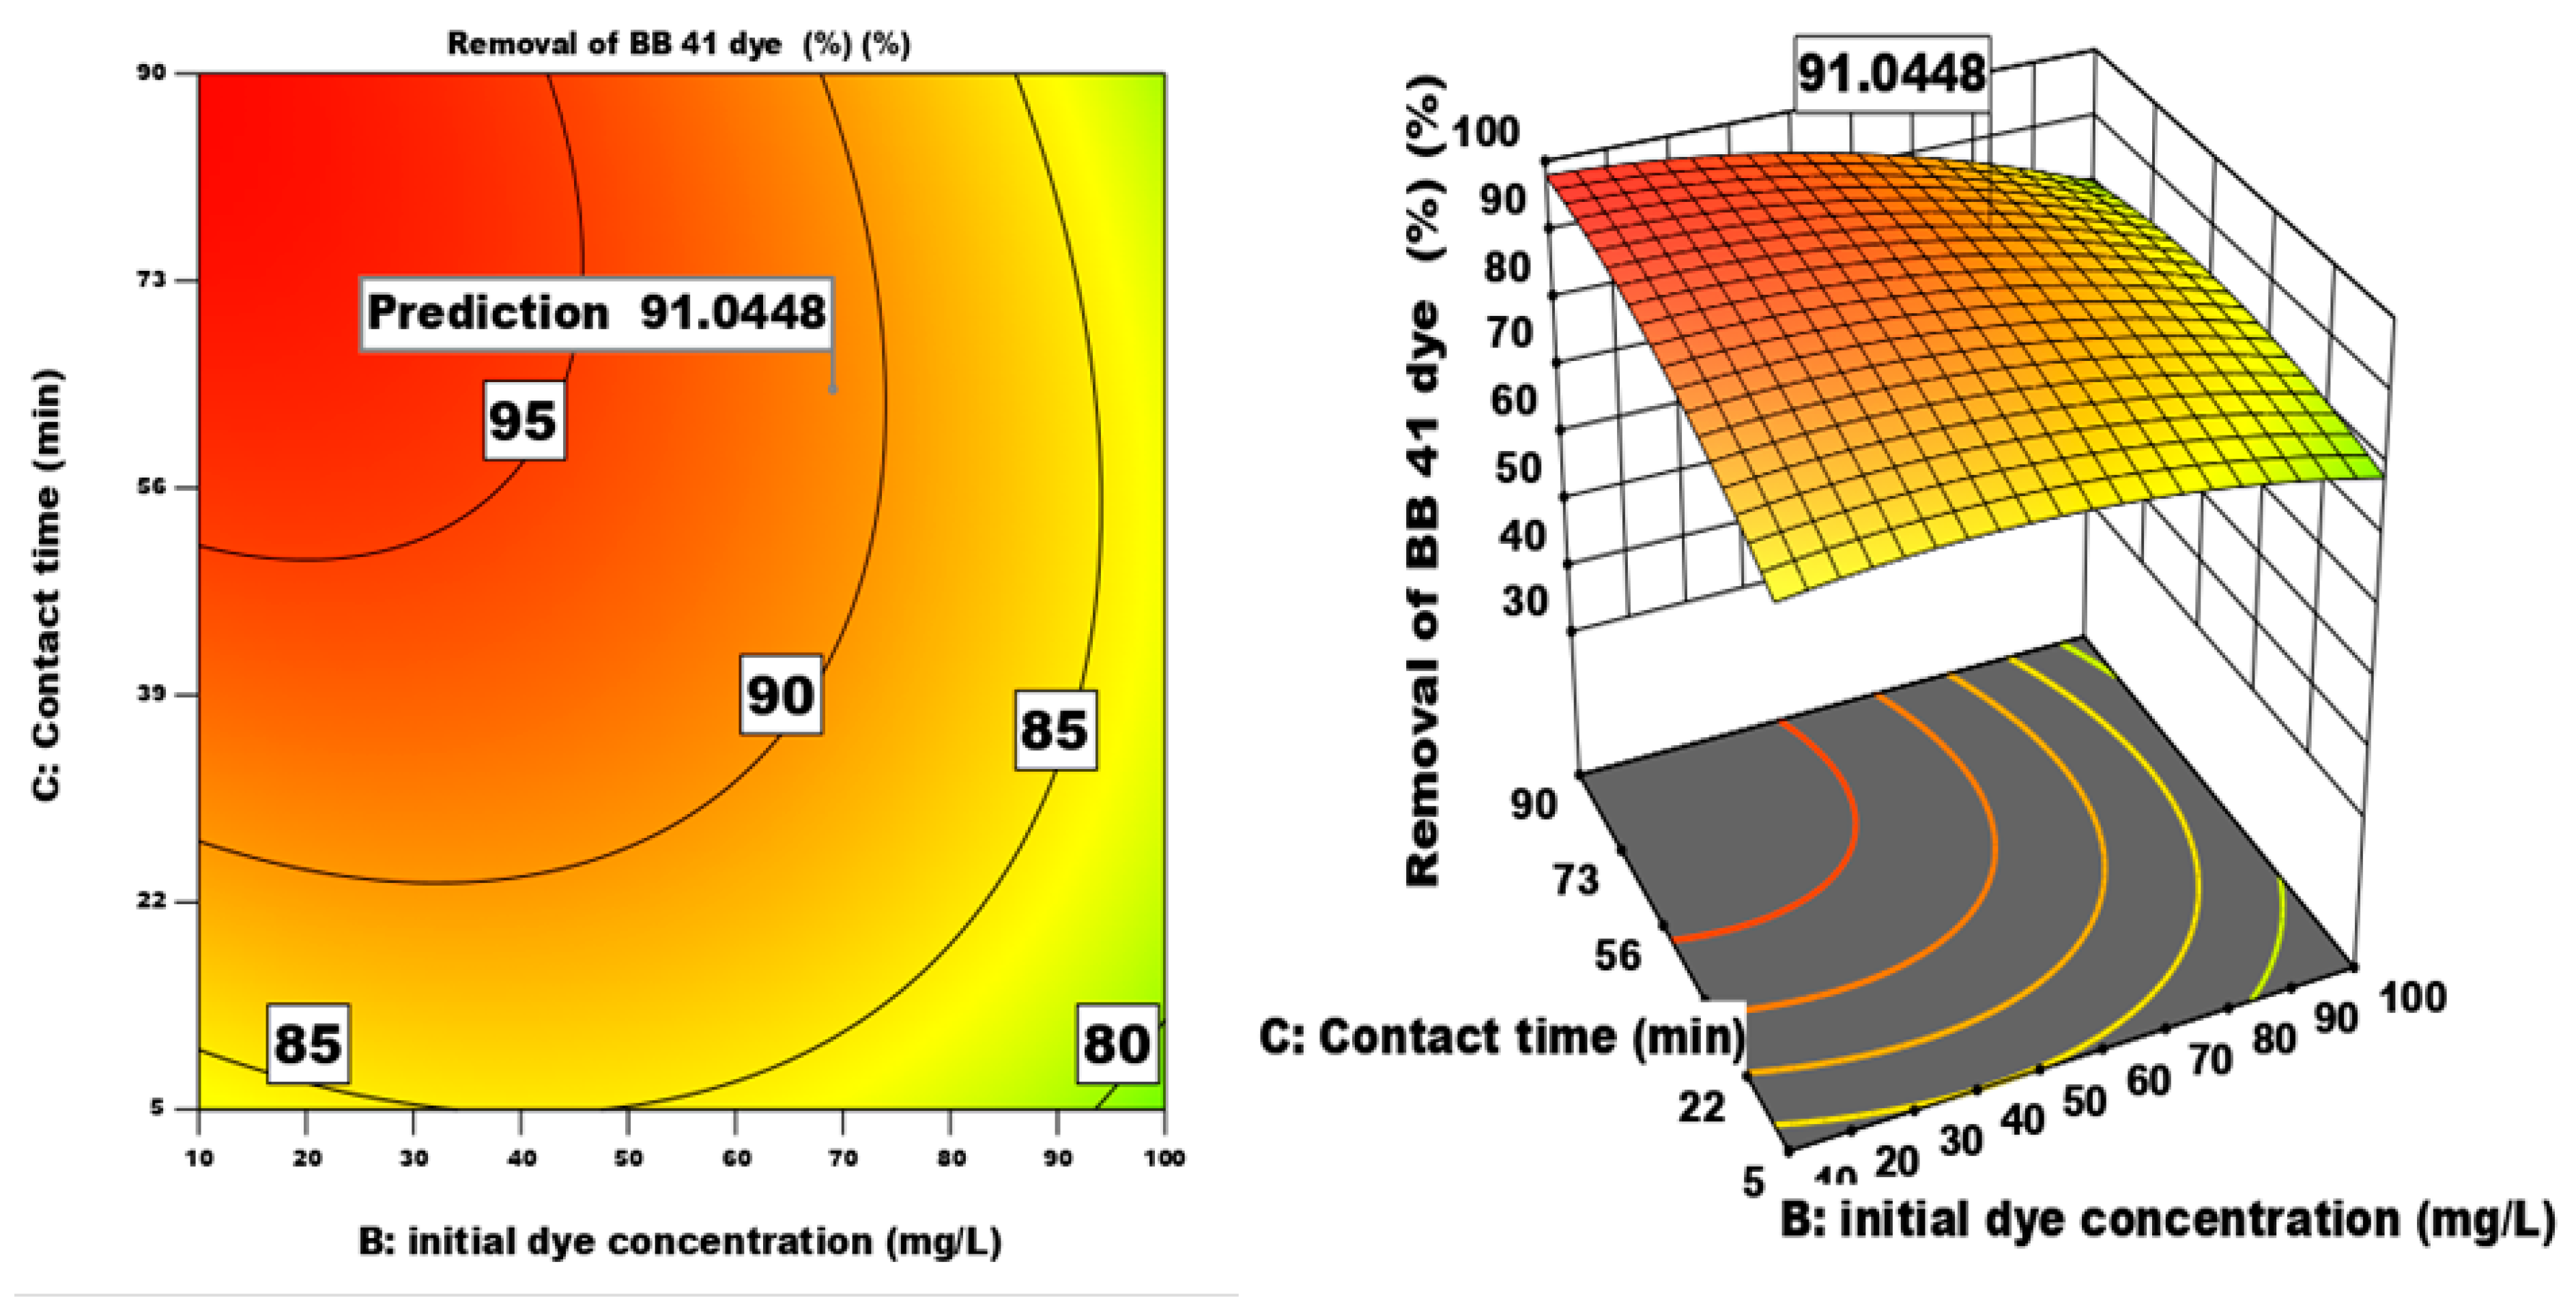
Figure 13.
Contour and 3D plots of –HTM dye removal on varying initial dye concentration and adsorbent dosage.
Figure 13.
Contour and 3D plots of –HTM dye removal on varying initial dye concentration and adsorbent dosage.
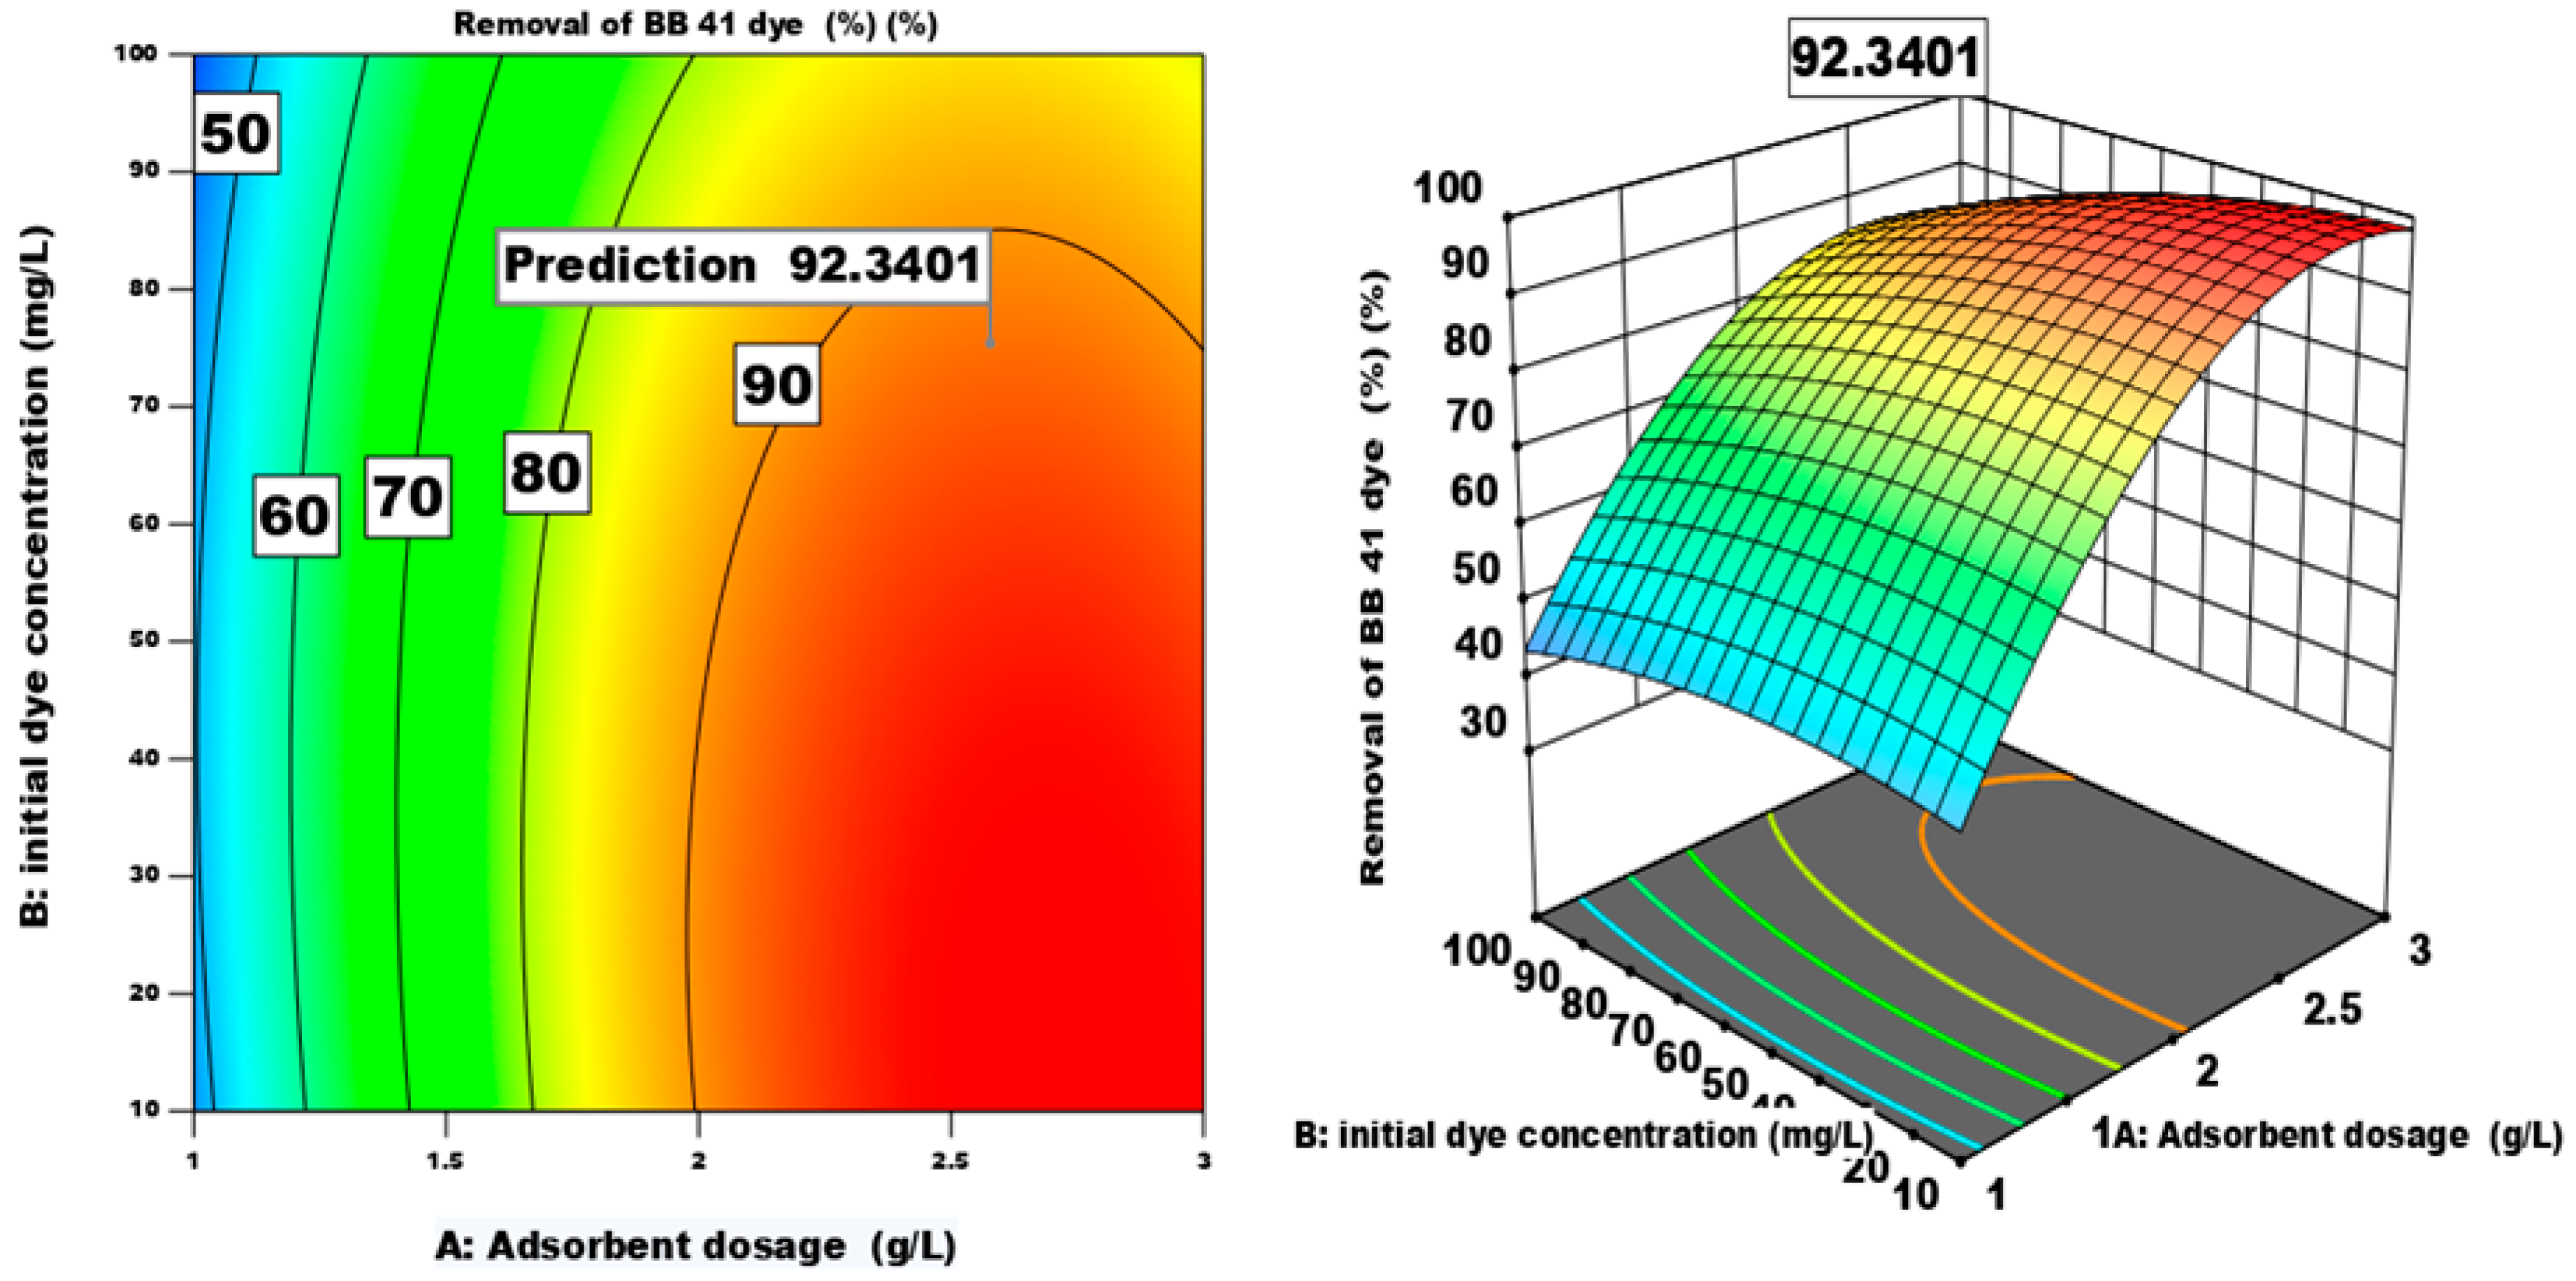
Figure 14.
Reusability of the -HTM adsorbent.
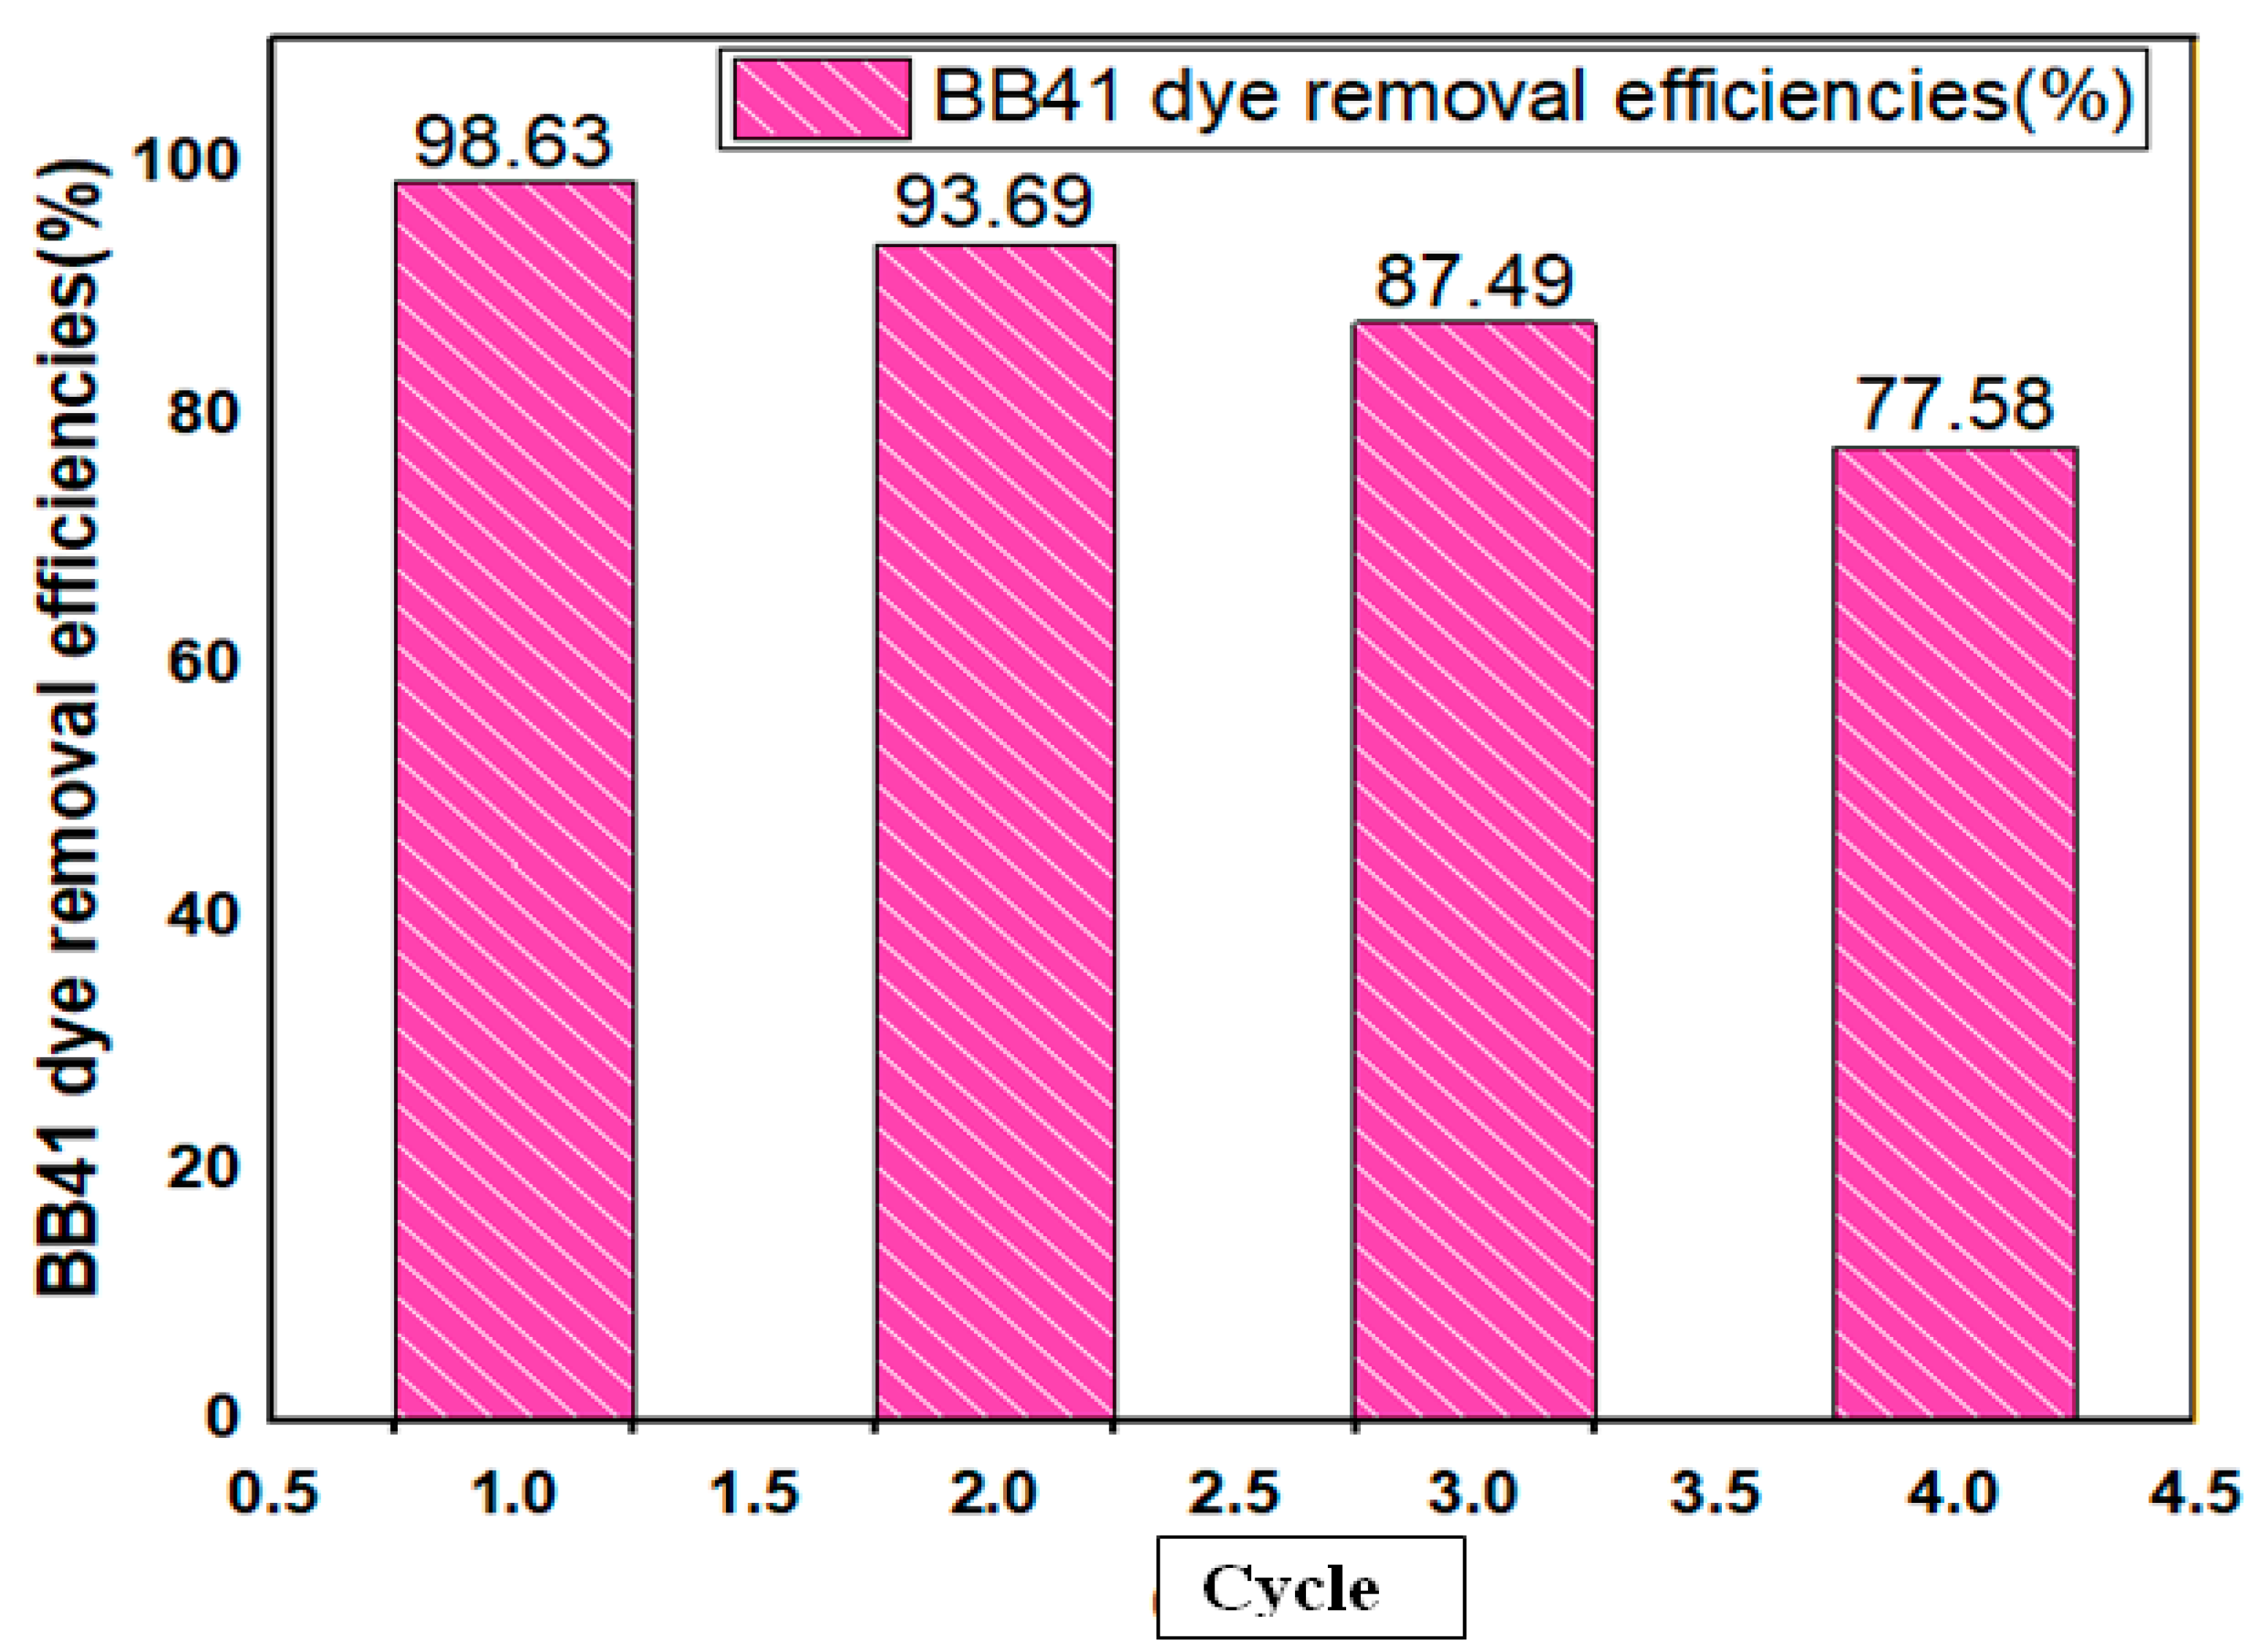

Table 2.
Variables considered in the experiment, along with their ranges and levels for the removal of BB 41 dye.
Table 2.
Variables considered in the experiment, along with their ranges and levels for the removal of BB 41 dye.
| Factor | Name | Units | -1 | 0 | 1 |
|---|---|---|---|---|---|
| A | Dosage | 1 | 2 | 3 | |
| B | Concentration | 10 | 55 | 100 | |
| C | Temperature | 40 | 50 | 60 | |
| D | Time | Min | 5 | 47.5 | 90 |
Table 3.
Predicted and experimental values of BB 41 dye removal percentage by –HTM adsorbent.
| Factor 1 | Factor 2 | Factor 3 | Factor 4 | Response 1 | ||
|---|---|---|---|---|---|---|
| Run | A:–HTM dosage | B:initial BB 41 dye concentration | C:Contact time | D:Temperature | % BB 41 dye removal by –HTM | |
| min | ||||||
| Exp. | Pred. | |||||
| 1 | 2 | 100 | 5 | 50 | 74.21 | 73.27 |
| 2 | 2 | 55 | 90 | 40 | 76.83 | 75.77 |
| 3 | 1 | 55 | 47.5 | 60 | 53.8 | 54.22 |
| 4 | 2 | 10 | 90 | 50 | 85.86 | 87.68 |
| 5 | 3 | 55 | 5 | 50 | 86.72 | 83.91 |
| 6 | 2 | 55 | 47.5 | 50 | 84.57 | 84.70 |
| 7 | 2 | 100 | 47.5 | 60 | 84.43 | 83.97 |
| 8 | 2 | 55 | 47.5 | 50 | 84.98 | 84.70 |
| 9 | 2 | 100 | 90 | 50 | 74.6 | 72.80 |
| 10 | 2 | 10 | 47.5 | 60 | 98.81 | 95.43 |
| 11 | 1 | 55 | 5 | 50 | 38.78 | 37.76 |
| 12 | 3 | 10 | 47.5 | 50 | 93.89 | 93.96 |
| 13 | 1 | 10 | 47.5 | 50 | 42.46 | 42.20 |
| 14 | 2 | 55 | 47.5 | 50 | 84.58 | 84.70 |
| 15 | 2 | 55 | 5 | 40 | 73.67 | 74.20 |
| 16 | 2 | 55 | 47.5 | 50 | 84.49 | 84.70 |
| 17 | 3 | 55 | 47.5 | 40 | 84.89 | 85.35 |
| 18 | 2 | 100 | 47.5 | 40 | 70.35 | 72.34 |
| 19 | 3 | 100 | 47.5 | 50 | 78.8 | 79.57 |
| 20 | 1 | 55 | 47.5 | 40 | 38.87 | 37.88 |
| 21 | 2 | 55 | 47.5 | 50 | 84.89 | 84.70 |
| 22 | 2 | 10 | 47.5 | 40 | 78.65 | 77.72 |
| 23 | 1 | 55 | 90 | 50 | 42.69 | 44.11 |
| 24 | 2 | 55 | 90 | 60 | 94.89 | 94.87 |
| 25 | 3 | 55 | 47.5 | 60 | 96.48 | 98.35 |
| 26 | 2 | 10 | 5 | 50 | 72.56 | 75.23 |
| 27 | 2 | 55 | 5 | 60 | 82.89 | 84.46 |
| 28 | 1 | 100 | 47.5 | 50 | 39.31 | 39.75 |
| 29 | 3 | 55 | 90 | 50 | 89.91 | 89.54 |
Table 4.
Model summary statistics and Analysis of variance (ANOVA) of quadratic models of BB 41 dye removal percentage adsorbed by –HTM.
Table 4.
Model summary statistics and Analysis of variance (ANOVA) of quadratic models of BB 41 dye removal percentage adsorbed by –HTM.
| Source | Sum of Squares | df | Mean Square | F-value | p-value | remark |
|---|---|---|---|---|---|---|
| Sequential Model Sum of Squares | ||||||
| Mean vs Total | 1.636E+05 | 1 | 1.636E+05 | |||
| Linear vs Mean | 7258.40 | 4 | 1814.60 | 19.58 | < 0.0001 | |
| 2FI vs Linear | 109.00 | 6 | 18.17 | 0.1546 | 0.9856 | |
| Quadratic vs 2FI | 2063.16 | 4 | 515.79 | 139.27 | < 0.0001 | Suggested |
| Cubic vs Quadratic | 45.74 | 8 | 5.72 | 5.61 | 0.0249 | Aliased |
| Residual | 6.11 | 6 | 1.02 | |||
| Total | 1.730E+05 | 29 | 5966.78 | |||
| Source | Std. Dev. | R² | Adjusted R² | Predicted R² | PRESS | remark |
| Model Summary Statistics | ||||||
| Linear | 9.63 | 0.7655 | 0.7264 | 0.6565 | 3257.00 | |
| 2FI | 10.84 | 0.7770 | 0.6530 | 0.368 | 5984.52 | |
| Quadratic | 1.92 | 0.97 | 0.98 | 0.96 | 297.86 | Suggested |
| Cubic | 1.01 | 0.9994 | 0.9970 | 0.9100 | 853.41 | Aliased |
Table 5.
Coefficient of estimate and their F and P-values.
| Source | Sum of Squares | df | Mean Square | F-value | p-value | |
|---|---|---|---|---|---|---|
| Model | 9430.56 | 14 | 673.61 | 181.88 | < 0.0001 | significant |
| A-Adsorbent dosage | 6292.00 | 1 | 6292.00 | 1698.92 | < 0.0001 | |
| B-initial dye concentration | 212.77 | 1 | 212.77 | 57.45 | < 0.0001 | |
| C-Contact time | 107.70 | 1 | 107.70 | 29.08 | < 0.0001 | |
| D-Temperature | 645.92 | 1 | 645.92 | 174.41 | < 0.0001 | |
| AB | 35.64 | 1 | 35.64 | 9.62 | 0.0078 | |
| AC | 0.1296 | 1 | 0.1296 | 0.0350 | 0.8543 | |
| AD | 2.79 | 1 | 2.79 | 0.7530 | 0.4001 | |
| BC | 41.67 | 1 | 41.67 | 11.25 | 0.0047 | |
| BD | 9.24 | 1 | 9.24 | 2.50 | 0.1365 | |
| CD | 19.54 | 1 | 19.54 | 5.28 | 0.0376 | |
| A² | 1902.02 | 1 | 1902.02 | 513.57 | < 0.0001 | |
| B² | 89.17 | 1 | 89.17 | 24.08 | 0.0002 | |
| C² | 91.10 | 1 | 91.10 | 24.60 | 0.0002 | |
| D² | 12.19 | 1 | 12.19 | 3.29 | 0.0911 | |
| Residual | 51.85 | 14 | 3.70 | |||
| Lack of Fit | 51.66 | 10 | 5.17 | 108.83 | 0.62 | insignificant |
| Pure Error | 0.1899 | 4 | 0.0475 | |||
| Cor Total | 9482.41 | 28 |
Table 6.
Goals and optimum values of variables and dye removal efficiency).
| Variables | Goal | Optimum value Fe3O4–HTM |
|---|---|---|
| Dosage | in range | 2.6 |
| Concentration | in range | 100 |
| Temperature | in range | 60 |
| Time (min) | in range | 47.5 |
| Removal efficiency predicted () | maximum | 99.34 |
| Removal efficiency experimental () | maximum | 98.63 |
Disclaimer/Publisher’s Note: The statements, opinions and data contained in all publications are solely those of the individual author(s) and contributor(s) and not of MDPI and/or the editor(s). MDPI and/or the editor(s) disclaim responsibility for any injury to people or property resulting from any ideas, methods, instructions or products referred to in the content. |
© 2025 by the authors. Licensee MDPI, Basel, Switzerland. This article is an open access article distributed under the terms and conditions of the Creative Commons Attribution (CC BY) license (https://creativecommons.org/licenses/by/4.0/).
Copyright: This open access article is published under a Creative Commons CC BY 4.0 license, which permit the free download, distribution, and reuse, provided that the author and preprint are cited in any reuse.


