
Submitted:
03 March 2025
Posted:
04 March 2025
You are already at the latest version
Abstract
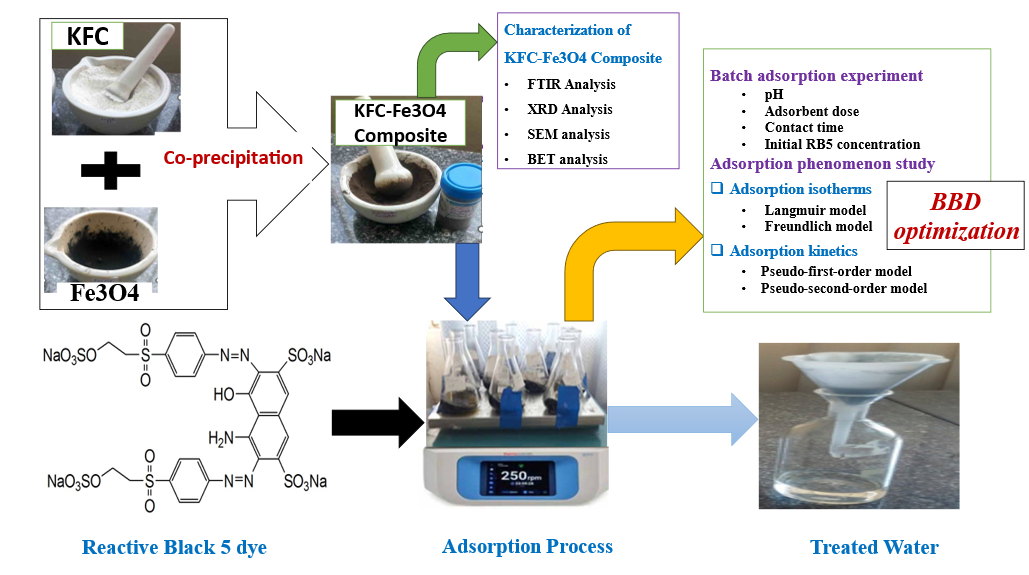
Pollution from industrial wastewater containing dyes poses a significant health concern in many countries, necessitating advanced remediation techniques. This study explores using a magnetized Kaolin filter cake (KFC)-Fe3O4 composite, synthesized through a co-precipitation method, as an adsorbent for removing Reactive Black 5 (RB5) from aqueous solutions. This method enables quick and easy separation of the adsorbent, resulting in no secondary pollution. The synthesized adsorbent was characterized using X-ray diffraction (XRD), scanning electron microscopy (SEM), Fourier-transform infrared spectroscopy (FTIR), and Brunauer-Emmett-Teller (BET) techniques to analyze its crystalline nature, microstructures, functional group, and surface area respectively. The efficiency of the adsorbent for dye removal in a batch system was examined by studying various parameters, including pH, contact time, adsorbent dosage, and initial dye concentration. To optimize the RB5 removal procedure, a Box-Behnken design (BBD) was employed under response surface methodology (RSM). The pseudo-second-order model best described the adsorption kinetics, while the Langmuir equation accurately described the isotherm. The maximum adsorption capacity was determined to be 92.84 mg/g. Thermodynamic studies revealed that the adsorption of RB5 onto the Kaolin filter cake-Fe3O4 composite is spontaneous and endothermic. Notably, the adsorption activity of RB5 by KFC-Fe3O4 composite remained effective even after five successive cycles. Overall, the Kaolin filter cake-Fe3O4 composite is a highly efficient adsorbent for treating aqueous solutions containing dyes, with easy separation from the solution using a magnet after the reaction.
Keywords:
Box-Behnken design
; composite
; coprecipitation
; kaolin filter cake
; reactive black 5 dye
Graphical abstract
1. Introduction
Environmental pollution has increased in the current global scenario due to different toxicants discharged from industrial sectors such as textile, agriculture, cosmetics, and pharmaceuticals. The textile industry is the largest generator of dying effluents because of the high-water consumption during various processing operations such as bleaching, dyeing, printing, and stiffening. However, 20% of the dye is lost during the dying process due to poor levels of dye fixation to fiber [1]. Dyeing effluents have a serious environmental impact because disposal of these effluents into the receiving water body causes damage to aquatic biota or humans by mutagenic and carcinogenic effects [2]. Color has different negative effects when present in water, it alters the transparency and gas solubility of water effluents, interferes with the growth of living substances, and obstructs photosynthesis. Out of all types of dyes azo dyes are preferably used for dyeing in the textile industries due to their ability to form colloidal dispersion and having low solubility in water [3]. Azo dyes are further classified as direct, acidic, basic, vat, disperse, and reactive dyes, etc [4,5]. Azo dyes are the largest class of dyes, with the greatest variety of colors containing sulfonate groups as substituents, and are called sulfonated azo dyes. Azo groups in conjugation with aromatic substituents or ionizable groups make a complex structure that leads to a huge expression of variation of colors in dyes [6,7]. Most industries, including textiles, pharmaceuticals, paper and pulp, etc., have been found to use reactive dyes most frequently. Reactive dyes are non-biodegradable and require new technologies for their removal from polluted water.
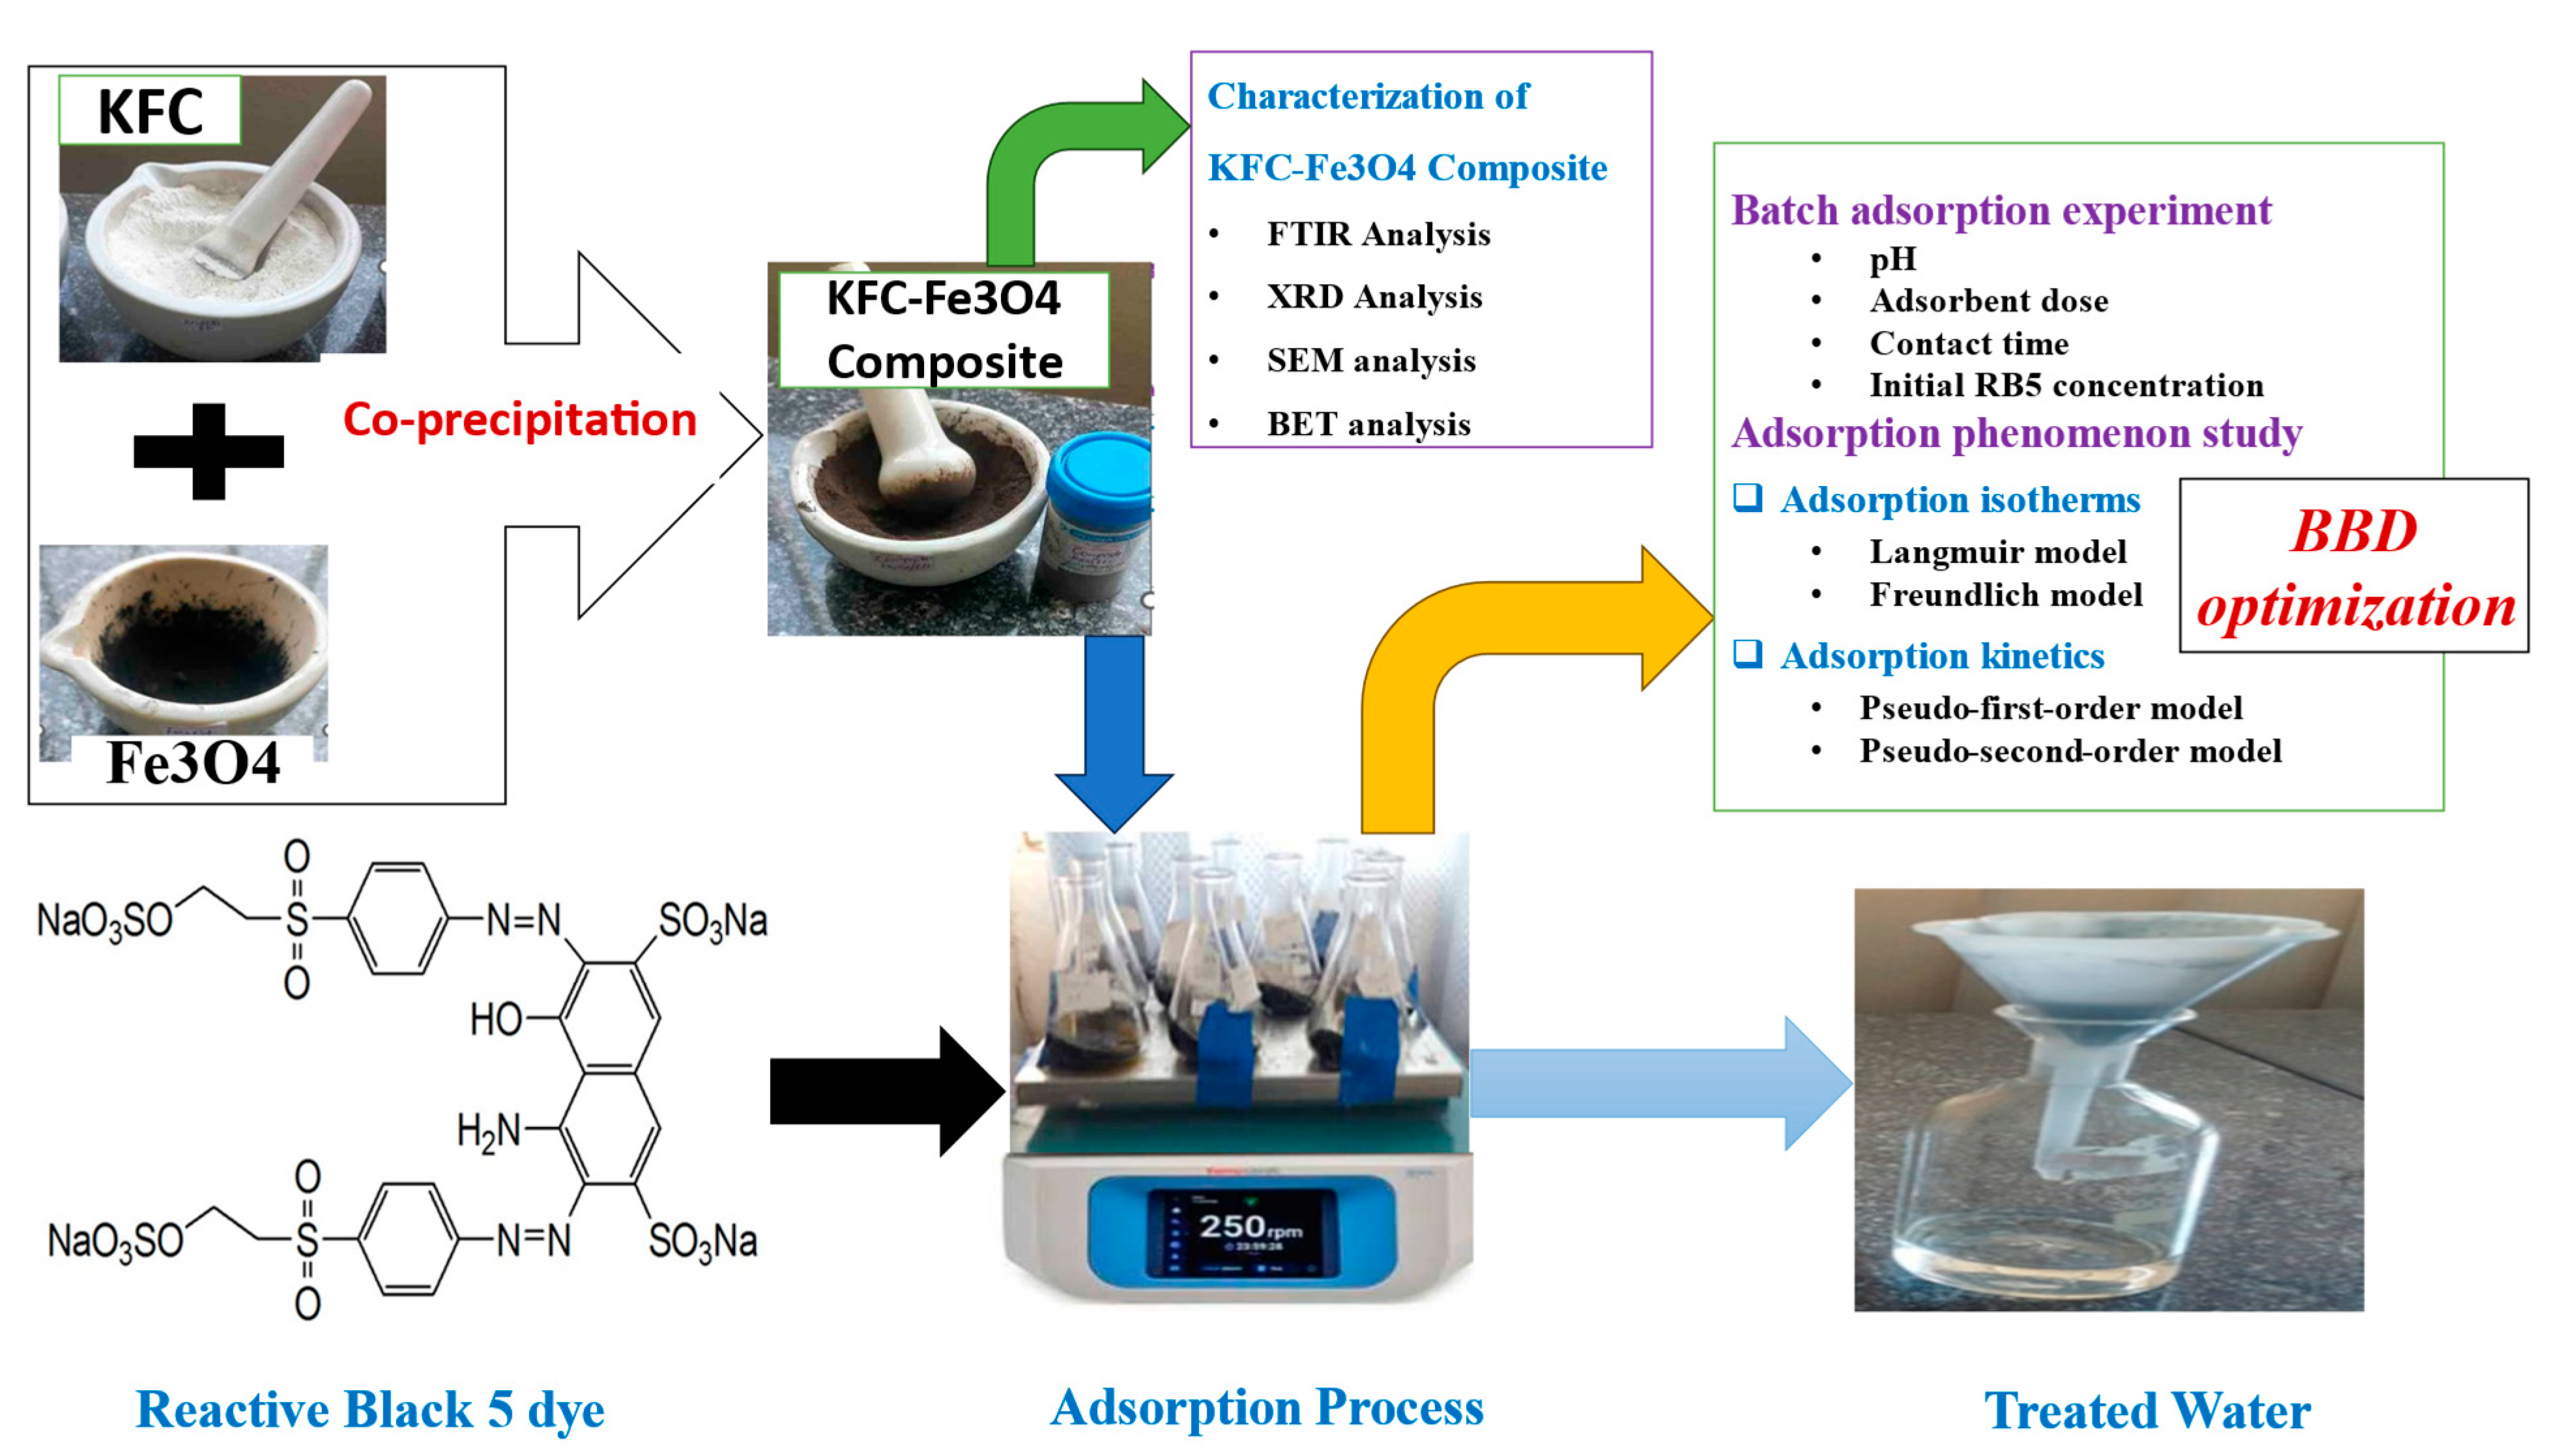
Reactive black 5 (CAS No. 17095-24-8) is a black powder categorized as an anionic azo dye due to the presence of an anionic functional group of =NaO3S- with the molecular formula: C26H21N5Na4O19S6, molar mass: 991.82 g·mol-1, density: 1.21 g/cm3, solid, melting point >300 oC (573 K), and it is soluble in water, with a maximum absorption wavelength (λmax) of 597 nm. RB5 dye (Figure 1) is a carcinogenic water-soluble azo dye that is widely used in textile industries, manufacturing printing paper, and research laboratories [8]. RB5 is widely used in the textile industry for dyeing cotton, cellulosic fibers, wool, and nylon. It is also utilized in paper manufacturing and various research applications [9]. Among the dyes, dyes have an “azo” functionalization category, as water-soluble dyes are the most problematic dyes [10,11]. Therefore, the treatment of wastewater containing dyestuff is very essential before discharge. Usually, a combination of different methods is needed to remove textile azo dyes. Adsorption is one of the crucial techniques in removing dyes from contaminated wastewater which is generally preferred to other ways, due to additional features such as fastness, simplicity, low cost, non-toxic, simple design, and high-efficiency performance [1,12]. The key factor in adsorption phenomena is to select an optimum adsorbent with the highest capacity as well as the fastest kinetics for pollution removal [13,14]. Different adsorbents are used to remove dyes, some of which include magnetic nanoparticles, natural adsorbents, activated carbon [12], silica gel, sawdust, peat, ash, bentonite, and kaolin [15]. Some study shows that adsorbents like activated carbon are efficient in removing a wide range of pollutants from water and wastewater however; it’s a costly adsorbent [16]. As a result, there is a search for new, innovative, and cost-effective adsorbents for the purification of effluents containing dyes [17,18]. An adsorbent is considered cost-effective if it requires little processing, is abundant in nature, and is a by-product waste material resulting from an industry [19].
Many researchers have studied clay minerals like kaolin [15], red mud, natural and modified attapulgite clay [20,21], bentonite [22] as a potential adsorbent for the removal of dyes from aqueous solution. Clay materials are those aluminosilicate minerals and their tetrahedral and octahedral layers are seen to incorporate different ions [20]. They have typical characteristics of high specific surface area, high ion exchange capacity, chemical and mechanical stability, and layered structure, which make them good adsorbents. Additionally, the modified clay materials have more surface area and porosity which makes them effective [23,24,25]. Kaolin [Al2Si2O5(OH)4] is a common phyllosilicate mineral belonging to a large general group known as the clays. The main constituent mineral in kaolin is kaolinite; kaolin may usually contain quartz, mica, and other less frequent minerals [26]. Although kaolin is primarily used in the cement and construction industry, it can also be used as a raw material to produce alum (aluminum sulfate) [18] and silica [27].
For better adsorption, the clay should have a large surface area that activation i.e. chemical and physical activations can achieve. The chemical activation is conducted using an acid solution, while calcination (700°C) is applied for physical activation [25]. The application of clay as an adsorbent has drawbacks i.e., it is difficult to separate the solid phase from the aqueous solution after the adsorption process. To solve this problem, combining clay with magnetic material could be chosen. The magnetic property that is produced by magnetic material was needed to facilitate the separation process between the clay and liquid phase using an external magnetic field after the adsorption process [10,28,29]. As a type of magnetic material, iron oxide (Fe3O4) can be composed in clay [26,29]. It forms a ferromagnetic regularity with the highest magnetization saturation (Ms) value of 92 emu/g [29]. Coprecipitation methods can conduct the synthesizing of magnetic composite material [30,31,32,33]. Magnetic nanoparticles have a couple of specific properties, such as the ease of synthesis of nanoparticles, large surface area, a superparamagnetic property that makes these particles respond to the external magnetic field and, in the absence of an external field, lose their magnetic properties; they don’t need the filtration process and centrifuge steps during the extraction process and the ability to extract large volumes of samples and removal of various organic and inorganic environmental pollutants [7,31]. Several investigations have been carried out to evaluate the magnetic composites' performance in water treatment by adsorption such as the adsorption of Cu(II) on magnetic starch-g-polyamide-doxime//Fe3O4 nanocomposites [32], removal of crystal violet from aqueous solutions by adsorption on magnetic nanocomposite hydrogels and laponite RD [34], removal of congo red dye by Fe3O4@MgAl-LDH composite [28], removal of heavy metals by magnetic nano-Fe3O4-dioctyl phthalate [21], etc.
No research has been cited on applying KFC-Fe3O4 composite for RB5 dye removal from aqueous media. Thus, the current work aims to enhance the physicochemical characteristics of Kaolin filter cake (KFC) a residue of kaolin as an adsorbent, and to combine this with the extraordinary properties of nano iron oxide to produce a locally abundant and low-cost adsorbent with high adsorption capacity and readily separable for wastewater treatment. The KFC had similar chemical compositions compared to that of the kaolin. The only difference was the amount of the major components silica and alumina. To this end, activated KFC/Fe3O4 nanocomposite was synthesized by chemical co-precipitation method to test its feasibility as an adsorbent in the removal of RB5 dye from aqueous solutions. The adsorbent was characterized using Brunauer Emmett Teller ( BET ), X-ray diffraction (XRD), Fourier transform infrared spectroscopy (FTIR), and scanning electron microscopy (SEM). Batch experiments were used to evaluate the effect of adsorbent dose, pH, contact time, and initial concentration on the adsorption characteristics of nanocomposites was studied, and the experimental data obtained from the equilibrium studies were fitted to the Langmuir and Freundlich adsorption models. In addition, the kinetics of the adsorption process was also studied. Factor parameters were optimized using Box-Behnken experimental design (BBD) in response surface methodology (RSM). Furthermore, the regeneration and reuse of adsorbent were evaluated. The research outcome would provide a low-cost magnetic-based nanocomposite to remove RB5 dye in an eco-friendly way and effectively. Hence, this work introduces adsorption for RB5 textile dye removal and provides a novel approach toward a reusable and easily separate magnetic adsorbent.
2. Materials and Methods
2.1. Materials and Reagents
Different mechanical size reduction equipment (jaw crusher, disk mill, sieves); and classical thermal equipment (Hot air oven and muffle furnace) were used for adsorbent preparation. Also, analytical equipment and glassware such as analytical balance, pH meter, centrifuge, hot plate with a magnetic stirrer, measuring cylinder, test tubes, and pipette were frequently used for batch adsorption experiments. Ferric chloride (FeCl3·6H2O, central lab, AASTU, Ethiopia), iron sulfate (FeSO4·7H2O central lab, AASTU, Ethiopia), and ammonia hydroxide solution (NH4OH) were used as starting materials. Reactive black 5(RB5) dye with MF: C26H21N5Na4O19S6, MW: 991.82 g· mol-1 was collected from KTSC (Kombolcha, Ethiopia) and used as received. Stock solutions (1 g L-1) of RB5 were prepared and the desired concentrations for adsorption experiments were obtained by diluting the stock solution with deionized water. The solution pH was attained by adding NaOH (0.01 mol/L) or HCl (0.01 mol/L). All reagents used in this study were of analytical grade.
2.2. Preparation and Activation of Kaolin Filter Cake (KFC)
Kaolin filter cake was collected from Awash Melkassa Chemical Factory, Ethiopia. KFC is the solid waste formed by the substances retained on a filter during the production process of Aluminum Sulphate from the raw material kaolin. The chemical factory has five main sections (suspension reaction and neutralization, filtration, evaporation, crystallization, and grinding). Among these sections, a solid waste filter cake was generated during the filtration unit operation. The solid of KFC waste was dried at 80 °C for 24 hours. After that, the KFC was crushed using a jaw crusher (BB50), and disk mill (Pulvisette 13), and sieved using standard sieves (ISO9001) with sizes of less than 0.075 mm. The adsorbents (raw powder and calcined) were prepared from the KFC. The Calcined adsorbent was prepared by treating filter cake kaolin at 700◦C for 2 hrs. in a muffle furnace (Nabertherm B180). Finally, the two adsorbents were packed in airtight plastic bags and stored in a safe environment.
2.3. Synthesis of KFC-Fe3O4 Nanocomposite
Co-precipitation is a simple and practical method of creating a magnetic composite from aqueous salt solutions by adding a base as a room-temperature precipitating agent. The primary benefit of the precipitation technique is the large-scale synthesis of nanoparticles. Using in situ chemical co-precipitation, a magnetic KFC-Fe3O4 nanocomposite was created using ferrous and ferric phosphate salts in an alkaline aqueous solution. The procedure involved dissolving 6.5 g of KFC, 8.4 g of FeCl3·6H2O, and 4.6 g of FeSO4·7H2O in 500 mL of distilled water, aggressively stirring with a mechanical stirrer on the hot plate, and heating the mixture to 80 ◦C for two hours. A 25 M NH4OH solution was added dropwise to the resultant mixture while agitated with a magnetic stirrer until the pH reached 10–11. After separating the black precipitate with a strong magnet and repeatedly rinsing it with deionized water, it was dried overnight at 80 °C in an oven. The nanocomposite was then dried for two hours at 80 °C after being cleaned with distilled water. After that, the dried magnetic nanocomposite was ground to a fine powder (0.075mm) using electrical grinder tools followed by calcination at 700 ◦C for 2 h under air atmosphere.
2.4. Characterization of Synthesized KFC-Fe3O4 NCs
Fourier-transform infrared (PerkinElmer 65 FTIR) spectroscopy was conducted to observe the functional groups, stretching vibrations, and absorption peaks present on the surface of nanocomposites. Scanning electron microscopy (SEM INSPECT F 50) analysis was performed to study the morphology of the KFC-Fe3O4 NCs. Furthermore, the crystalline property of the KFC-Fe3O4 NCs was characterized using X-ray powder diffraction ((XRD-X-ray tube cu40kv, 40 mA, Olympus BTXH). The specific surface area of the adsorbent was determined using the adsorption and desorption of the liquid nitrogen. The Bru-nauer–Emmett–Teller (BET) method was applied for this specific surface area determination (Horiba Instrument Inc. SA-9600).
2.5. Point of Zero Charge (pHpzc)
The salt addition process measured the KFC-Fe3O4 NCs point of zero charge (pHpzc). To determine pHpzc, the pH was adjusted from 1–12 by adding 0.1 N NaOH and HCl. Then, 0.5 g of adsorbent was added to each solution and kept for 24 h with intermittent shaking. The final pH (pHf) of the solution was noted and the difference between the final and initial pH (change in pH) (Y-axis) was plotted versus the initial pH (X-axis). The intersection point of the curve yield was pHpzc [28].
2.6. Batch Adsorption Experiment
All adsorption experiments were carried out in 1,000 mL Erlenmeyer flask containing both RB5 and KFC-Fe3O4 composite. The mixtures were continuously stirred (150 rpm) at room temperature in different time intervals (20–120 min). Then adsorbent was separated from the mixture solution by permanent magnet. The concentration of the RB5 in each sample was measured using a spectrophotometer ( UV-spectrophotometer (DR 5000) at 597 nm by a calibration curve [35]. In order to study effects of various parameters, experiments were conducted at different amounts of pH (3 to 9), adsorbent (1.5 to 3.5 g), contact time (40 to 80 min.), and initial dye concentrations (30 to 100 mg/L). The removal efficiency and removed amount of dye by KFC-Fe3O4 composite were calculated by Equation (1) and (2), respectively.
where, Co and Ce were initial and equilibrium concentrations of RB5 dye in the solution (mg/L), m was the adsorbent mass (g) used, and V was the volume of the solution (L).
2.7. Experimental Design
For the optimization process, a Box-Behnken design (BBD) was used to determine the optimal operational conditions for RB5 dye removal by CKFC-Fe3O4 nanocomposite within 4 input parameters (pH, adsorbent dose, contact time, and initial dye concentration). The software Design Expert (13.0, StatEase, USA) was used to construct the adsorption study and statistically interpret the results [36]. Table 1 illustrates 3 ranges (i.e.,-1, 0, and +1) of explored factors. The preliminary tests were used to determine the coded values of the parameters and the parameters to be employed in the adsorption optimization. The quadratic model employed for fitting the components (independent factors and RB5 removal) of the model is illustrated in Eq. (3).
where y is the response variable, bo is the intercept constant, 4 is the number of variables, ε the residual expressed as the difference between the calculated and experimental results, xi and xj are variables, bii the coefficient of quadratic parameters, and bij is the coefficient of the interacting parameters.
2.8. Adsorption Isotherm and Kinetic Models
Isotherm models show the equilibrium amount of adsorbate available in the solution and the amount of adsorbate available on the surface of the adsorbent. Langmuir and Freundlich are the most commonly used adsorption isotherms. Langmuir adsorption isotherm assumes that the adsorption occurs at specific homogenous sites and is the most suitable for monolayer adsorption [37], while the Freundlich adsorption isotherm model assumes that the formation of multilayer and heterogeneous systems due to the non-uniform distribution of adsorption affinities and is not confined within the formation of monolayers [11]. Equation (4) represents the linear form of Langmuir’s to determine the adsorption parameters.
where qmax represents the maximum adsorption capacity (mg/g) and KL (L/mg) is Langmuir’s isotherm constant, showing the binding affinity between dye and KFC.
Equation (5) represents the linear form of Freundlich’s isotherm
where, Kf is Freundlich’s constant and is used to measure the adsorption capacity, and 1/n is the adsorption intensity. The value of 1/n demonstrates the adsorption process is either favorable (0.1 < 1/n < 0.5) or unfavorable (1/n > 2).
The rate at which the adsorbate (RB5 dye) was adsorbed on the surface of the adsorbent (CKFC) was studied using kinetics models, namely pseudo-first-order and second-order kinetic models. These kinetics models show the adsorbent's efficacy, indicating how fast or slow it adsorbs the adsorbate.
The pseudo 1st order is represented in Eq. (10):
where qt represents the adsorption capacity (mg/g) at time t while K1 (min-1) is the equilibrium rate constant.
Pseudo 2nd order is represented in Eq. (11):
where K2 (g mg-1min-1) is the equilibrium rate constant. The values of linear coefficient regression (R2) were used to predict the most suited isotherm and kinetic model for the adsorption process [35].
3. Results and Discussion
3.1. Characterization of KFC-Fe3O4 Composite
The point of zero charge (pHpzc) is the pH of the kaolin filter cake at which the net surface charge is zero. The pHpzc of calcined Kaolin filter cake (CKFC) and CKFC-Fe3O4 composite was observed to be 7.1, and 7.4, respectively, as presented in Figure 2. Below this pH value, the adsorbents attain a net positive charge because of functional group protonation resulting in strong electrostatic attractions among anionic dye and adsorbents. Beyond this pH value, the sorbent’s surface acquires a negative charge. Thus, the sorption of anionic pollutants (dye) was preferred at pH < pHpzc where sorbent surfaces become positively charged [38]. These results follow the findings of [29].
The BET-specific surface area of the KFC–Fe3O4 composite is vital in characterizing material properties, especially in domains such as catalysis, adsorption, and material science [39]. Various approaches have been utilized to ascertain specific surface area, including acid-base titration, and nitrogen adsorption-desorption (BET) adsorption methods [20]. The BET method (Brunauer-Emmett-Teller), is widely employed for its dependability in assessing SSA, particularly in porous materials [40]. This technique involves measuring nitrogen gas adsorption at different pressures to generate adsorption isotherms. The BET of the studded calcined KFC and KFC-Fe3O4 composite adsorbent was found to be 36 m2/g and 136 m2/g, respectively. The presence of Fe3O4 on the KFC increased the surface area of the composite. Normally, increasing surface area leads to increased active sites available for adsorption, thereby increasing adsorption capacity. According to the above data, the KFC-Fe3O4composite possesses a great degree of porosity, a significant pore volume, and a sizable specific surface area; they provide a considerable number of active sites that may bind with RB5 molecules leading to a higher adsorption capacity.
The Fourier Transform infrared (FTIR) spectroscopy is a significant analytical technique used to analyze the vibrations characteristic of each functional group in a molecule. The FTIR spectra of RKFC, CKFC, and the CKFC-Fe3O4 Composite are presented in Figure 3, spanning a frequency range of 4000–400 cm⁻¹. The corresponding band assignments are detailed in Table 3. The overall FTIR spectrum is divided into two main regions: 4000–1100 cm⁻¹ (the functional group region) and 1100–400 cm⁻¹ (the fingerprint region). In the O–H stretching region, both the raw and acid-treated clay exhibit three distinct bands at 3619, 3649, and 3690 cm⁻¹, corresponding to Al–OH stretching. The inner hydroxyl groups between the tetrahedral and octahedral sheets contribute to the absorption peak at 3619 cm⁻¹. A strong band at 3690 cm⁻¹ is associated with in-phase symmetric stretching, while a weaker absorption band at 3649 cm⁻¹ is attributed to out-of-plane stretching vibrations. The band observed at 3690 cm⁻¹ is linked to the amount of water physisorbed on the surface of the clay. There was little variation in the peak pattern for the acid-treated kaolin. The analysis revealed that acid treatment led to a decrease in peak intensity, indicating that protons penetrated the clay mineral layers. This penetration caused damage to the structural hydroxyl groups, resulting in dihydroxylation and the leaching of aluminum ions from the octahedral layer [41]. The Fourier Transform Infrared (FTIR) data for the activated kaolinite/Fe3O4 composite show that the peaks at 3619, 3649, and 3690 cm⁻¹ become significantly weaker or nearly vanish, suggesting a transformation in the structure. These results can be interpreted as a consequence of Fe³⁺ ions replacing Al³⁺ ions in the crystal structure of the kaolin.
Figure 4 displays the XRD profiles of the raw kaolin, activated kaolin, and KFC-Fe3O4 composite respectively. The raw clay shows well-defined reflections at 2u values of 12, 25, and 27 corresponding to the d values of 7.365, 3.557, and 2.715 Å respectively. These peaks match the reflections from plane [001], which are typical representative peaks of kaolinite. After treatment of the clay with heat, the peak intensity of the clay was found to slightly decrease. This is attributed to the structural disorder that happened due to the acid leaching, which affects the crystalline character of the clay. The XRD results for the Fe3O4/kaolin composite show three peaks at 2u of 24, 26, and 35 corresponding to d values of 3.617, 3.33, and 2.516 Å respectively which may relate to the magnetite phase. The d spacing showed contraction than the original clay. This indicates that most of Fe3O4 is attached to the clay surface.
The structural morphology of the CKFC and KFC-Fe3O4 composite, as revealed by the SEM images in Figure 5, indicates that the synthesized composite exhibits a rough texture due to the Fe3O4 particles covering its surface. The particle diameter ranges from 16.6 to 33.3 nm, and this unique morphology, characterized by a plethora of pores on the irregular composite surface, significantly enhances the surface area, thereby facilitating the adsorption process. This morphology differs from the iron oxide dispersed nanoparticles, with a diameter range of 17.05 to 34.09 nm.
3.2. Effect of Different Adsorption Parameters
The levels of the main adsorption parameters such as PH, adsorbent dose, contact time, and initial RB5 dye concentration were scoped based on the effects on the adsorption process following the one-factor-at-a-time method. To scrutinize the adsorption of dye on the surface of the CKFC-Fe3O4 adsorbent, pH from 3.0 to 9.0, the adsorbent dose from 1.5 to 3.5 g, the contact time in the range of 40–80 min, and initial RB5 dye concentration from 30 to 1000 mg/L were considered.
3.2.1. Effect of pH
The pH of the solution is one of the main variables affecting the adsorption process; especially in the case of anionic and cationic dyes where the adsorption relies on the electrostatic attraction between the anions and cations produced and the charged surface of the adsorbent [29]. To investigate the pH effect in the present work four values of pH were tested (3, 4.5, 7.5, and 9) at a fixed adsorbent mass, and initial dye concentration. KFC is mainly constituted of Al and Si oxides which form hydroxide complexes in solution; the acidic or basic dissociation of these complexes at the solid-liquid interface causes the formation of either positive or negative charge on the surface depending on the solution pH surrounding the oxide particle [42]. In acidic media, surfaces are probably positively charged due to the abundant presence of H+; this leads to the electrostatic attraction between the anions of the RB5 dye and the adsorbent surface. In the case of anionic dyes, the pH of the solution should be lower than pHpzc because dye ions are well adsorbed by the positive charge of dye adsorbents. Therefore, the pH solution should be lower than pH 7.4 (pH < pHpzc) to obtain high adsorption efficiencies by all dye adsorbent materials. Moreover, these results agreed with other studies that anionic dyes were highly adsorbed at low pH or acidic pH because of the electrostatic interactions on the positive surface charge of dye-adsorbent materials [32]. The adsorbed amount of RB5 dye increased with increasing pH from 3 to 7 of the aqueous solution. When the pH increased from 7 to 9, the adsorption decreased for RB5 dye. When the pH of the aqueous solution was increased from 3 to 9, the removal efficiency of the RB5 decreased from 98.28 to 81.68% as shown in Figure 6. As a consequence, the optimum pH of the solution for RB5 was determined as pH 6.
3.2.2. Effect of Adsorbent Dose
As shown in Figure 7, the effects of the KFC-Fe3O4 composite adsorbent dosage were investigated at various levels (1.5, 2, 2.5, 3, and 3.5 g). The decolorization rate was 87.62% when a 1.5 g initial adsorbent dosage was used. These results highlight the fact that color removal is less successful at lower adsorbent doses. The KFC-Fe3O4 composite surface could not have enough accessible adsorption sites at a low dose to effectively absorb and remove pollutants from wastewater. The adsorbent's poor adsorption ability at this dosage is hence responsible for the lower removal rates. The clearance rate increased significantly to 93.84% when the adsorbent dose was increased to 2 g. This indicates that the efficacy of pollutant removal is greatly increased by a higher dose of adsorbent. More binding sites for pollutants result from having more KFC-Fe3O4 composite available, which boosts adsorption capacity and improves removal rates. The adsorbent seems to be more effective at decolorizing RB5 at this dosage. The decolorization rates then improved further, reaching an astounding 98.28% when the adsorbent dose was raised to 2.5g. These results show that increasing the adsorbent dose still has a beneficial effect on color removal efficiency within the range studied. Increased surface area and active sites for adsorption are provided by the greater dosage, which improves pollutant removal [43]. while the decrease in the amount of adsorbed dye is caused by unsaturation of adsorption sites during the adsorption process generated by the higher adsorbent amount in a fixed solution volume; and inter-particle interaction, such as aggregation, resulting from high adsorbent dose, leading to the diminution of the total surface area available for adsorption and the increasing of the diffusion path length travelled by the dye molecules.
3.2.3. Effect of Contact Time
The study of RB5 dye removal as a function of time via adsorption on the KFC material was conducted. Figure 8 depicts how contact time affects the dye solution on batch adsorption. When equilibrium is established after 60 min, the adsorption rate stabilizes after initially increasing quickly. The increment of removal efficiency as a function of time implies that adsorption requires time to take place. According to [18] study, the adsorption mass transfer phenomenon involves three main steps: external diffusion, internal diffusion, and attachment to the active site. As a result, it demands a certain period to adsorb a given amount of adsorbate and of course until all the surface available is taken up or equilibrium is attained. The significant availability of free active sites at the start of the adsorption process may have contributed to this result. The adsorption time sufficient to remove most of the adsorbate may be short or long depending on the type of adsorbent and adsorbate the behavior of adsorption [18].
3.2.4. Effect Initial RB5 Dye Concentration
The efficiency of the CKFC for the adsorption of RB5 dye is highly dependent on the initial dye concentration, as can be observed in Figure 9 increasing the number of initial RB5 dye concentrations from (80 to 120)mg/L increases the dye's adsorption capacity until the process reaches saturation. At this point, no further adsorption occurs due to the dye's binding sites being filled with dyes. On the other hand, the dye's adsorption capacity diminishes with increasing concentration due to early saturation of the adsorbent surface's adsorption sites. The saturation of the KFC active sites implies a decline in removal effectiveness at higher dye concentrations [21].
3.3. Box-Behnken Design (BBD) Analysis
To maximize the RB5 dye removal from textile wastewater, adsorbent dosage, pH, contact time, and initial dye concentration were examined. The RSM design combinations obtained from BBD using Design Expert 13 software were applied to the independently selected parameters. This paper used four factors and three-level BBD to evaluate and optimize the CKFC preparation process variables on the removal of RB5 textile dye. As seen in the table, a total number of 29 experimental runs was required for executing the RSM. Results that were observed and predicted by BBD are given in Table 2.
The equation generated from the fitted surface response quadratic models for the removal of RB5 (R%) is shown in Eq. 12. The equation shows the mathematical relation between the independent variables as a function of RB5 dye removal :
R % = 98.28 – 13.55A +
1.17B + 0.215C – 0.1725D – 1.08AB + 1.28AC + 1.31AD + 0.055BC – 3.51BD +
1.09CD – 17.32A2 – 4.76B2 – 1.62C2 – 3.05D2
where R % is the RB5 removal percentage, A the pH, B is the adsorbent dose, C is the contact time, D is the initial dye concentration, AB, AC, AD, BC, BD, CD, A2, B2, C2, and D2 refer to the interaction effects of adsorbent parameters. In the equation, positive signs in front of the terms show a synergistic effect while negative signs show an antagonistic effect. As shown in Eq. 12, the pH and initial RB5 concentration are inversely proportional to the removal percentage, but the adsorbent dose and contact time are directly proportional to the RB5 removal percentage.
3.3.1. Significance of Model Terms
ANOVA is used to examine how well the model fits the data. Using ANOVA, different models were tested via sequential model sum of squares. Additionally, a summary of model statistics was analyzed to check the adequacy and appropriateness of various models representing the percentage RB5 removal efficiency by CKFC-Fe3O4 adsorbent. Table 3 illustrates the significance of the model and its model terms for RB5 removal.
The Model F-value of 3593.69 implies the model is significant. There is only a 0.01% chance that an F-value this large could occur due to noise. P-values less than 0.0500 indicate model terms are significant. In this case, A, B, C, AB, AC, AD, BD, CD, A², B², C², and D² are significant model terms. Values greater than 0.1000 indicate the model terms are not significant. The Lack of Fit F-value of 0.74 implies the Lack of Fit is not significant relative to the pure error. There is a 68.14% chance that a Lack of Fit F-value this large could occur due to noise. Non-significant lack of fit is good, we want the model to fit.
3.3.2. Fit Summary
Statistical analysis was used to evaluate the accuracy and adequateness of the model using sequential model sum of squares and model summary statistics were carried out [44]. The sequential model sum of squares for RB5 removal is shown in Table 4. According to the result of Table 6 the quadratic model was suggested because of the larger F value (5836.99) and p-value which was less than 0.05. In addition, the model summary statistics shown in Table 3 suggested a quadratic model for RB5 removal as adjusted R-squared (0.9994) and the predicted R-squared (0.9988) values were in reasonable agreement being their difference is less than 0.2 [45].
The observed points between actual and predicted plots revealed that the experimental values were distributed relatively near the straight line and showed a satisfactory correlation between these values as shown in Figure 10(a). The normal probability plots of the standardized residuals in Figure 10(b) demonstrated that there was no abnormality in this study. The residuals versus predicted values of RB5 removal rates are shown, the residuals were randomly scattered around the straight line, which was an indication of a fit of the experimental data with the predicted ones [46].
3.3.3. Perturbation Plot
The Perturbation plot shows all variables at the time to determine which variable has more or less effect on the response. Figure 11 shows the Perturbation plot at 5.56 pH, a dose of 1.93 g, a contact time of 45.24 min, and 42.94 mgL-1 initial concentration. According to graph A, the PH has a steeper slope indicating a larger effect on RB5 removal which is confirmed by a larger F (25909.29) value as shown in Table 3. On the other hand, the contact time (graph C) and initial concentration (graph D) have shown insignificant effects on RB5 adsorption, ultimately resulting in decreased adsorption. This is due to the minimal F value of 6.52 for graph C and 4.2 for graph D which is depicted in Table 3.
3.4. Process Parameter Optimization for RB5 Removal
The independent and dependent variables that influenced the percentage of RB5 removal were examined using the three-dimensional plot. The response of the process variable plots in three dimensions with the two input variables.
3.4.1. pH and Adsorbent Dose
Figure 12 shows how the pH significantly affects the dye removal. The 3D graph showed that with increasing pH and sorbent dose, the sorbent’s sorption capacity increases. Because there are more active sites available on the sorbent surface, a higher percentage of color removal was achieved by keeping the reaction time or contact time constant. At pH 5.5 and 2.5 g of adsorbent, the best color removal of 91.1% was accomplished. It was observed that the protonation of the adsorption sites at low pH (3) causes the surface of the sorbent effective for anionic dye removal due to electrostatic interactions, dipole moments, and hydrogen bonding. The protons at the interface (sorbate–sorbent) repel the cationic pollutants and attract the anionic ones, decreasing the removal of cationic dyes from wastewater; however, an increase in pH lowers the concentration of (H+) ions in the solution, favoring cation adsorption on the anionic adsorption sites of sorbents with strong electrostatic interactions. The pHzc of the modified KFC-Fe3O4 composite was found to be 7.4.
3.4.2. pH and Contact Time
By maintaining the sorbent dose constant, it was possible to study the interactive effect of pH and the contact time on percent dye removal. It was discovered that as pH and the contact time increase, the number of sorbent active sites available increases, and removal efficiency follows suit. Although the optimal dye removal was achieved at pH 3 in 30 minutes which can be seen in Figure 13, this may be because there are more active sites that are available for sorption further increase which will hinder the active sites for upcoming dye molecules. However, the percentage removal obtained at pH 5.5 is 91% because at low pH, the sorbent’s surface is protonated, which attracts anionic dyes to occupy the available active sites [47].
3.4.3. pH and Initial RB5 Concentration
The interaction effect of pH and initial concentration on the removal efficiency of CKFC adsorbent in the case of adsorption of dye molecules is shown in Figure 14. As expected, the removal efficiency depends more on the dye concentration for a constant adsorption time of 60 min and an adsorbent dose of 3.5 g. The effectiveness was to increase up to 95.8% when the dye concentration was reduced to 120 mg/L. While the amount of adsorbent is kept at 3.5 g. Adsorption is a surface phenomenon, a higher dye concentration exceeds the surface area present on the adsorbent of 3.5g and, therefore, some dye molecules will remain adsorbed or not be removed from the synthetic solution.
3.4.4. Adsorbent Dose and Initial RB5 Concentration
Figure 15 illustrates the interactive effect of the adsorbent dosage (1.5 to 3.5 g ) and the initial dye concentration (30 to 100 mg/L) on the dye removal (%) while the contact time and the temperature of the solution kept constant at 60 min. Overall, there was a considerable increase in the percentage of RB5 dye removal with increasing KFC-Fe3O4 dose over the 2.5 g, while, with regards to increasing the amount of initial RB5 dye mg/L, it declined. As the initial concentrations of RB5 dye rose from 30 to 100 mg/L, the adsorption percentage decreased. This drop in the adsorption percentage with high-level RB5 dye concentrations was attributed to the saturation of the adsorbent's adsorptive sites [48]. Overall, the findings showed that RB5 dye removal by KFC-Fe3O4 composite depended on the range of dye concentration from 30 to 100 mg/L. The removal of dye () rose with a higher adsorbent dose of 1.5 to 2.5 g, as shown in Figure 15. With the increased dosage of KFC-Fe3O4, more binding and reactive sites were accessible, leading to enhanced RB5 uptake for dye removal () [49] . This noticeable improvement in dye removal () was assessed by the higher F value [46]. Overall, the findings showed that RB5 dye removal by KFC-Fe3O4 was dependent on the adsorbent dosage across the range of 1.5 to 2.5 g.
3.4.5. Contact Time and Initial RB5 Concentration
Figure 16 depicts how the removal efficiency of the CKFC adsorbent varies with the variation of contact time and initial RB5 dye concentration at pH 6 and 3.5 g of adsorbent dose. The removal efficiency increases when the adsorption time increases from 40 to 80 min and the initial dye concentration decreases from 60 to 120 mg/L. As the model predicted, the removal efficiency increased slowly to 92.8% as adsorption time further varied to 80 min and the initial concentration decreased to 80 mg/L. As a result, initial dye concentration played a significant role in the removal efficiency. High efficiency at low concentrations would mean that the activated adsorbent assumed more room for the adsorption of RB5 dye.
3.5. Kinetic, Equilibrium and Thermodynamic Studies
3.5.1. Adsorption Kinetics
According to the kinetic data research, the KFC-Fe3O4 Composite's faster RB5 dye uptake capability was caused by the inter-grain porosity of the composite materials at the right ratios, which increased the specific surface area. Three kinetic models—the pseudo-first-order (PFO) and pseudo-second-order (PSO) models, respectively—are used to analyze the time-dependent experimental data for RB5 adsorption. The kinetic models' computed parameters and fitting graphs are given in Table 5 and Figure 17. The coefficient of determination (R2 = 0.9999) values of pseudo-second-order are superior to that of pseudo-first-order and intraparticle-diffusion models. Similarly, the theoretically calculated adsorption capacity (qe. calc) for the pseudo-second-order (mg/g) is found to be closer to the experimental qe value (26.38 mg/g) as compared to qe. calc of pseudo–first–order model (23.002 mg/g). Furthermore, the pseudo-second-order kinetic experiment result shows a smaller chi-square (X2) of 0.048, PSO is the best representative of the kinetic model. The PSO results confirm that chemisorption is the dominant mechanism for the RB5 dye uptake process on KFC-Fe3O4 Composite adsorbents [29].
3.5.2. Adsorption Isotherms
An adsorption isotherm provides useful information about adsorption capacity, binding affinity, and the surface properties of the adsorbent, which helps understand the binding mechanism of adsorbate with the adsorbent. In this study, two theoretical models, Langmuir and Freundlich’s isotherms were used to examine the adsorption behavior of CKFC-Fe3O4 Composite for RB5 dye uptake as shown in Figure 18(a) and (b). Langmuir’s isotherm describes the monolayer adsorption of dye wastewater onto the CKFC-Fe3O4 surface having a finite number of adsorption sites whereas Freundlich’s isotherm supports that adsorption occurs on the heterogenous surface of the adsorbent [37]. The results presented in Table 6 demonstrate that Langmuir’s isotherm was the best fitted because the value of the linear regression coefficient (R2 > 0.998) of this isotherm was observed to be higher than that with Freundlich isotherm (R2 > 0.955) it verified the monolayer adsorption of RB5 dye on CKFC-Fe3O4 Composite. The maximum adsorption capacity of CKFC for RB5 was 92.84 mg/g. The values of the separation factor (RL) for CKFC-Fe3O4 Composite are less than one which favors the adsorption phenomenon. The comparison of the RB5 dye adsorption capacity of CKFC-Fe3O4 Composite with other different biosorbents reported in the literature has been presented in Table 7.
3.5.3. Adsorption Thermodynamic Studies
Thermodynamic studies were carried out at different temperatures between 298 K and 328K. A linear plot of ln KL against 1/T was used to calculate the values of ΔH (enthalpy change, kJ mol⁻¹) and ΔS (entropy change, J mol⁻¹ K⁻¹). The information for the maximal adsorption capacity (qm), ΔS, ΔH, and ΔG at various temperatures are provided in Table 8. A negative value of Gibbs free energy (ΔGo) shows the thermodynamic feasibility and spontaneity of the adsorption process. The positive value of enthalpy change (ΔHo) confirmed the endothermic nature of the lead adsorption process. A positive value of entropy (ΔSo) indicates the increased randomness at the solid-solution interface during the fixation of adsorbates on the active site of the adsorbent. Compared to other adsorbents KFC-Fe3O4 composite had a higher adsorption capacity than the other materials evaluated.
3.6. Reusability of the KFC-Fe3O4 Composite
The reusability and stability of materials used as adsorbents are critical for their commercial application in water treatment [51]. An adsorption-desorption study was conducted to evaluate the reusability of KFC-Fe3O4 composite in removing RB5 dye over six cycles. Figure 20 shows that adsorbents retained high adsorption efficiency but experienced a decline with each cycle. KFC-Fe3O4 composite dropped from 98.24% efficiency in the first cycle to 94.83% in the sixth cycle. This reduction may be due to damage to some active sites from the adsorbed RB5 molecules. The higher efficiency of the KFC-Fe3O4 composite after six cycles suggests greater stability, making composites viable options for RB5 dye adsorption in commercial applications. The magnetic separation of these nanocomposites further enhances their practicality.
4. Conclusions
The KFC-Fe3O4 composite demonstrates significant efficiency in the adsorption of the anionic Reactive Black 5 dye from aqueous solutions. A comprehensive array of characterization techniques, including BET, FTIR, XRD, and SEM analyses, was employed to evaluate the performance of the adsorbent derived from KFC-Fe3O4. The CKFC adsorbent exhibited the highest potential for the absorption of RB5 dye. 98.28% removal efficiency was achieved under specific operating conditions including a pH of 6, an adsorbent dosage of 2.5 g, a contact time of 60 minutes, and an initial RB5 dye concentration of 70 mg/L. Kinetic studies revealed that the adsorption process is best described by pseudo-second-order models, while equilibrium data conform to Langmuir's isotherm model. Thermodynamic analyses indicate that the adsorption process is both spontaneous and endothermic. Furthermore, the ANOVA response confirms the reliability of the data, achieving a robust correlation coefficient (R²) of 0.99. Importantly, the KFC-Fe3O4 composite can be reused for up to six cycles while retaining its high removal performance, thereby establishing its viability as a cost-effective adsorbent for RB5 dye removal. Thus, kaolin filter cake, sourced from industrial solid waste, represents a practical, low-cost, and locally available solution for the treatment of colored industrial wastewater. This approach holds significant potential for scaling to an industrial level and serves as a sustainable material for environmental remediation.
Author Contributions
Investigation, A.B.; supervision, E.A.; writing original draft, A.B.; writing review and editing, A.B., E.A., and Z.W. All authors have read and agreed to the published version of the manuscript.
Data Availability Statement
All relevant data are included in the paper or its Supplementary Information.
Acknowledgements
The authors gratefully acknowledge the Addis Ababa Science and Technology University (AASTU) for the financial support. The Environmental Engineering Department of AASTU, for the laboratory services, and Kombolcha Textile Share Company (KTSC) are also thanked for supplying dyes and textile dye effluent for the research work. Also, the authors would like to thank the Department of Textile Engineering, School of Textile, Leather and Fashion Engineering, Kombolcha Institute of Technology (KIoT), Woll University: for providing me the opportunity to pursue my PhD.
Conflicts of Interest:
The authors declare that they have no conflict of interest
References
- Alnasrawy, S.T. Adsorption Efficiency, Isotherms, and Kinetics for Cationic Dye Removal Using Biowaste Adsorbent. J. Hazard. Toxic Radioact. Waste 2023, 27, 04022040. [Google Scholar] [CrossRef]
- Vojnović, B.; Cetina, M.; Franjković, P.; Sutlović, A. Influence of Initial pH Value on the Adsorption of Reactive Black 5 Dye on Powdered Activated Carbon: Kinetics, Mechanisms, and Thermodynamics. Molecules 2022, 27, 1349. [Google Scholar] [CrossRef]
- Balarak, D.; Al-Musawi, T.J.; Mohammed, I.A.; Abasizadeh, H. The Eradication of Reactive Black 5 Dye Liquid Wastes Using Azolla Filiculoides Aquatic Fern as a Good and an Economical Biosorption Agent. SN Appl. Sci. 2020, 2, 1015. [Google Scholar] [CrossRef]
- Kalkan, E.; Nadaroğlu, H.; Celebi, N.; Tozsin, G. Removal of Textile Dye Reactive Black 5 from Aqueous Solution by Adsorption on Laccase-Modified Silica Fume. Desalination Water Treat. 2014, 52, 6122–6134. [Google Scholar] [CrossRef]
- Nure, J.F.; Mengistu, A.; Abewaa, M.; Angassa, K.; Moyo, W.; Phiri, Z.; Mafa, P.J.; Kuvarega, A.T.; Nkambule, T.T. Adsorption of Black MNN Reactive Dye from Tannery Wastewater Using Activated Carbon of Rumex Abysinicus. J. Taiwan Inst. Chem. Eng. 2023, 151, 105138. [Google Scholar]
- Farrokhzadeh, S.; Razmi, H.; Jannat, B. Study of Reactive Red 195 Anionic Dye Adsorption on Calcined Marble Powder as Potential Eco-Friendly Adsorbent. Hum. Health Halal Metr. 2020, 1, 42–56. [Google Scholar] [CrossRef]
- Mokue Mafo, S.G.; Nanssou Kouteu, P.A.; Tchuifon Tchuifon, D.R.; Fotsop, C.G.; Zue Mve, M.; Teikam Kenda, G.; Bopda, A.; Tiotsop Kuete, H.-I.; Sadeu Ngakou, C.; Ndifor-Angwafor, N.G.; et al. Low-Cost Magnetic Carbons-Based Rubber Seed Husks Materials for Highly Efficient Removal for Reactive Black 5 and Reactive Blue 19 Textile Dyes from Wastewater. Int. J. Environ. Anal. Chem. 2023, 0, 1–25. [Google Scholar] [CrossRef]
- Jalali Sarvestani, M.R.; Doroudi, Z. Removal of Reactive Black 5 from Waste Waters by Adsorption: A Comprehensive Review. J. Water Environ. Nanotechnol. 2020, 5, 180–190. [Google Scholar] [CrossRef]
- Suryawan, I.W.; Helmy, Q.; Notodarmojo, S. Textile Wastewater Treatment: Colour and COD Removal of Reactive Black-5 by Ozonation. IOP Conf. Ser. Earth Environ. Sci. 2018, 106, 012102. [Google Scholar] [CrossRef]
- Alula, M.T.; Spende, H.; Aragaw, T.A.; Alene, A.N.; Aragaw, B.A.; Madiba, M. A Highly Stable Silver Nanoparticle Loaded Magnetic Nanocomposite as a Recyclable Catalysts. J. Clust. Sci. 2023, 34, 2205–2214. [Google Scholar] [CrossRef]
- Srivastava, A.; Rani, R.; Kumar, S. Optimization, Kinetics, and Thermodynamics Aspects in the Biodegradation of Reactive Black 5 (RB5) Dye from Textile Wastewater Using Isolated Bacterial Strain, Bacillus Albus DD1. Water Sci. Technol. 2022, 86, 610–624. [Google Scholar] [CrossRef] [PubMed]
- Antunes, M.L.P.; Conceição, F.T.; Navarro, G.R.B.; Fernandes, A.M.; Durrant, S.F. Use of Red Mud Activated at Different Temperatures as a Low Cost Adsorbent of Reactive Dye. Eng. Sanit. E Ambient. 2021, 26, 805–811. [Google Scholar] [CrossRef]
- Alemayehu, E.; Melak, F.; Sharma, S.K.; Van Der Bruggen, B.; Lennartz, B. Use of Porous Volcanic Rocks for the Adsorptive Removal of Copper. Water Environ. J. 2017, 31, 194–201. [Google Scholar] [CrossRef]
- Sarma, G.K.; Gupta, S.S.; Bhattacharyya, K.G. Removal of Hazardous Basic Dyes from Aqueous Solution by Adsorption onto Kaolinite and Acid-Treated Kaolinite: Kinetics, Isotherm and Mechanistic Study. SN Appl. Sci. 2019, 1. [Google Scholar] [CrossRef]
- Mustapha, S.; Tijani, J.; Ndamitso, M.; Abdulkareem, A.; Shuaib, D.; Mohammed, A.K. Adsorptive Removal of Pollutants from Industrial Wastewater Using Mesoporous Kaolin and Kaolin/TiO2 Nanoadsorbents. Environ. Nanotechnol. Monit. Manag. 2021, 15, 100414. [Google Scholar] [CrossRef]
- Mandale, P.; Kulkarni, K.; Jadhav, K.; Kulkarni, A.; Mahajan, R. Adsorption of Malachite Green Dye from Aqueous Solution on Bioadsorbent as Low-Cost Adsorbent. Mater. Today Proc. 2024. [Google Scholar] [CrossRef]
- Muisa, N.; Nhapi, I.; Ruziwa, W.; Manyuchi, M.M. Utilization of Alum Sludge as Adsorbent for Phosphorus Removal in Municipal Wastewater: A Review. J. Water Process Eng. 2020, 35, 101187. [Google Scholar] [CrossRef]
- Temesgen, F.; Kalifa, M.; Jembere, A.; Genet, M. Spent Kaolin Filter Cake as an Effective Adsorbent for the Removal of Hexavalent Chromium [Cr (VI)] From Aqueous Solution: Comparative Study of Wastewater Treatment Methods. South Afr. J. Chem. Eng. 2021, 38. [Google Scholar] [CrossRef]
- Abate, G.Y.; Alene, A.N.; Habte, A.T.; Getahun, D.M. Adsorptive Removal of Malachite Green Dye from Aqueous Solution onto Activated Carbon of Catha Edulis Stem as a Low Cost Bio-Adsorbent. Environ. Syst. Res. 2020, 9, 29. [Google Scholar] [CrossRef]
- Azha, S.F.; Shahadat, M.; Ismail, S.; Ali, S.W.; Ahammad, S.Z. Prospect of Clay-Based Flexible Adsorbent Coatings as Cleaner Production Technique in Wastewater Treatment, Challenges, and Issues: A Review. J. Taiwan Inst. Chem. Eng. 2021, 120, 178–206. [Google Scholar] [CrossRef]
- Ike, J.I.; Babayemi, A.K.; Egbosiuba, T.C.; Jin, C.G.; Mustapha, S.; Yusuff, A.S.; Yadav, V.K.; Igwegbe, C.A. Treated Kaolin Clay Incorporated with Nickel Nanoparticles for Enhanced Removal of Crystal Violet and Methyl Orange from Textile Wastewater. ACS Appl. Eng. Mater. 2024, 2, 1031–1046. [Google Scholar] [CrossRef]
- Amin, M.T.; Alazba, A.A.; Shafiq, M. Adsorptive Removal of Reactive Black 5 from Wastewater Using Bentonite Clay: Isotherms, Kinetics and Thermodynamics. Sustainability 2015, 7, 15302–15318. [Google Scholar] [CrossRef]
- Co-Precipitation Synthesis of Clay-Magnetite Nanocomposite for Adsorptive Removal of Synthetic Dye in Wastewater of Benang Bintik Batik. Mol. J. Ilm. Kim. 2022, 17, 261–261. [CrossRef]
- Gahlot, R.; Taki, K.; Kumar, M. Efficacy of Nanoclays as the Potential Adsorbent for Dyes and Metal Removal from the Wastewater: A Review. Environ. Nanotechnol. Monit. Manag. 2020, 14, 100339. [Google Scholar] [CrossRef]
- Kassa, A.E.; Shibeshi, N.T.; Tizazu, B.Z.; Prabhu, S.V. Characteristic Investigations on Ethiopian Kaolinite: Effect of Calcination Temperature on Pozzolanic Activity and Specific Surface Area. Adv. Mater. Sci. Eng. 2022, 2022, e2481066. [Google Scholar] [CrossRef]
- Jawad, A.H.; Abdulhameed, A.S. Facile Synthesis of Crosslinked Chitosan-Tripolyphosphate/Kaolin Clay Composite for Decolourization and COD Reduction of Remazol Brilliant Blue R Dye: Optimization by Using Response Surface Methodology. Colloids Surf. Physicochem. Eng. Asp. 2020, 605, 125329. [Google Scholar] [CrossRef]
- Dissanayake, R.E.A.; Premarathne, I.M.; Iqbal, S.S.; Priyantha, N.; Iqbal, M.C.M. Synthesis, Characterization, and Textile Dye Adsorption Studies of a Kaolin-Based Polymer Layer Silicate Composite. Int. J. Environ. Sci. Technol. 2022, 19, 9519–9534. [Google Scholar] [CrossRef]
- Jawad, A.H.; Malek, N.N.A.; Abdulhameed, A.S.; Razuan, R. Synthesis of Magnetic Chitosan-Fly Ash/Fe3O4 Composite for Adsorption of Reactive Orange 16 Dye: Optimization by Box–Behnken Design. J. Polym. Environ. 2020, 28, 1068–1082. [Google Scholar] [CrossRef]
- Magdy, A.; Fouad, Y.O.; Abdel-Aziz, M.H.; Konsowa, A.H. Synthesis and Characterization of Fe 3 O 4 /Kaolin Magnetic Nanocomposite and Its Application in Wastewater Treatment. J. Ind. Eng. Chem. 2017, 56, 299–311. [Google Scholar] [CrossRef]
- Fito, J.; Abewaa, M.; Nkambule, T. Magnetite-Impregnated Biochar of Parthenium Hysterophorus for Adsorption of Cr(VI) from Tannery Industrial Wastewater. Appl. Water Sci. 2023, 13, 78. [Google Scholar] [CrossRef]
- Jawad, A.H.; Sahu, U.K.; Jani, N.A.; ALOthman, Z.A.; Wilson, L.D. Magnetic Crosslinked Chitosan-Tripolyphosphate/MgO/Fe3O4 Nanocomposite for Reactive Blue 19 Dye Removal: Optimization Using Desirability Function Approach. Surf. Interfaces 2022, 28, 101698. [Google Scholar] [CrossRef]
- Mirzapour, P.; Kamyab Moghadas, B.; Tamjidi, S.; Esmaeili, H. Activated Carbon/Bentonite/Fe3O4 Nanocomposite for Treatment of Wastewater Containing Reactive Red 198. Sep. Sci. Technol. 2021, 56, 2693–2707. [Google Scholar] [CrossRef]
- Sacko, A.; Nure, J.F.; Nyoni, H.; Mamba, B.; Nkambule, T.; Msagati, T.A.M. The Application of Tannic Acid-Coated Magnetite Nanoparticles for Recovery of Microplastics from the Water System. Water Conserv. Sci. Eng. 2024, 9, 41. [Google Scholar] [CrossRef]
- Masuku, M.; Nure, J.F.; Atagana, H.I.; Hlongwa, N.; Nkambule, T.T. Advancing the Development of Nanocomposite Adsorbent through Zinc-Doped Nickel Ferrite-Pinecone Biochar for Removal of Chromium (VI) from Wastewater. Sci. Total Environ. 2024, 908, 168136. [Google Scholar] [PubMed]
- Hasan, M.; Al Biruni, M.T.; Azad, S.; Ahmed, T. Adsorptive Removal of Dye from Textile Wastewater Employing Moringa Oleifera Leaves Biochar as a Natural Biosorbent. Biomass Convers. Biorefinery 2022. [Google Scholar] [CrossRef]
- Mutambyi, V.; Jean Nepo, H.; Rugabirwa, B.; Kwisanga, C.; Beakou, B.H.; Munyegaju, J.; Uwitonze, N.; Nyandwi, V.; Mushirabwoba, B. Removal of Reactive Black 5 from Simulated Textile Effluents by an Electrocoagulation Process: Optimization by Response Surface Methodology. Water Pract. Technol. 2023, 18, 3048–3064. [Google Scholar] [CrossRef]
- Seleman, M.; Sime, T.; Ayele, A.; Sergawie, A.; Nkambule, T.; Fito, J. Isotherms and Kinetic Studies of Copper Removal from Textile Wastewater and Aqueous Solution Using Powdered Banana Peel Waste as an Adsorbent in Batch Adsorption Systems. Int. J. Biomater. 2023, 2023, 1–10. [Google Scholar] [CrossRef]
- Hamri, N.; Imessaoudene, A.; Hadadi, A.; Cheikh, S.; Boukerroui, A.; Bollinger, J.-C.; Amrane, A.; Tahraoui, H.; Tran, H.N.; Ezzat, A.O.; et al. Enhanced Adsorption Capacity of Methylene Blue Dye onto Kaolin through Acid Treatment: Batch Adsorption and Machine Learning Studies. Water 2024, 16, 243. [Google Scholar] [CrossRef]
- Ribeiro, A.C.; Barbosa de Andrade, M.; Quesada, H.B.; Bergamasco Beltran, L.; Bergamasco, R.; Calado Santos Sobral da Fonseca, M.M.; da Costa Neves Fernandes de Almeida Duarte, E. Physico-Chemical and Electrostatic Surface Characterisation of Mica Mineral and Its Applicability on the Adsorption of Safranin Orange and Reactive Black 5 Dyes. Environ. Technol. 2022, 43, 3765–3778. [Google Scholar] [CrossRef]
- Souhassou, H.; Fahoul, Y.; El Mrabet, I.; Iboustaten, E.; Assila, O.; Nahali, L.; Mertah, O.; Kherbeche, A. Optimization of Basic Red 29 Dye Removal onto a Natural Red Clay Using Response Surface Methodology. J. Iran. Chem. Soc. 2024, 21, 275–291. [Google Scholar] [CrossRef]
- Caponi, N.; Collazzo, G.C.; Jahn, S.L.; Dotto, G.L.; Mazutti, M.A.; Foletto, E.L. Use of Brazilian Kaolin as a Potential Low-Cost Adsorbent for the Removal of Malachite Green from Colored Effluents. Mater. Res. 2017, 20, 14–22. [Google Scholar] [CrossRef]
- Khunjan, U.; Kasikamphaiboon, P. Green Synthesis of Kaolin-Supported Nanoscale Zero-Valent Iron Using Ruellia Tuberosa Leaf Extract for Effective Decolorization of Azo Dye Reactive Black 5. Arab. J. Sci. Eng. 2021, 46, 383–394. [Google Scholar] [CrossRef]
- De Luca, P.; B. Nagy, J. Treatment of Water Contaminated with Reactive Black-5 Dye by Carbon Nanotubes. Materials 2020, 13, 5508. [Google Scholar] [CrossRef]
- Bello, A.M.; Muhammad, N.A.; Hamisu, A. RSM Optimized Adsorption of Eriochrome Black T Dye onto Alumina Nanoprticles: Isotherm and Kinetics Studies. Phys. Chem. Res. 2023, 11, 315–326. [Google Scholar] [CrossRef]
- Sawood, G.M.; Mishra, A.; Gupta, S.K. Optimization of Arsenate Adsorption over Aluminum-Impregnated Tea Waste Biochar Using RSM–Central Composite Design and Adsorption Mechanism. J. Hazard. Toxic Radioact. Waste 2021, 25, 04020075. [Google Scholar] [CrossRef]
- Belachew, N.; Fekadu, R.; Ayalew Abebe, A. RSM-BBD Optimization of Fenton-Like Degradation of 4-Nitrophenol Using Magnetite Impregnated Kaolin. Air Soil Water Res. 2020, 13, 1178622120932124. [Google Scholar] [CrossRef]
- Njuhou, S.; Mouafon, M.; Pountouenchi, A.; Njindam, O.R.; Lecomte-Nana, G.L.; Njoya, D. Rice Husks and Kaolin Based Ceramic Membrane for Filtration of Slaughterhouse Wastewater: Optimization Study Using Response Surface Methodology (RSM) and Responses Interdependence Analysis. Trans. Indian Ceram. Soc. 2023, 82, 143–155. [Google Scholar] [CrossRef]
- López-Rodríguez, D.; Micó-Vicent, B.; Jordán-Núñez, J.; Bonet-Aracil, M.; Bou-Belda, E. Uses of Nanoclays and Adsorbents for Dye Recovery: A Textile Industry Review. Appl. Sci. 2021, 11, 11422. [Google Scholar] [CrossRef]
- Hidayat, E.; Mohamad Sarbani, N.M.B.; Yonemura, S.; Mitoma, Y.; Harada, H. Application of Box–Behnken Design to Optimize Phosphate Adsorption Conditions from Water onto Novel Adsorbent CS-ZL/ZrO/Fe3O4: Characterization, Equilibrium, Isotherm, Kinetic, and Desorption Studies. Int. J. Mol. Sci. 2023, 24, 9754. [Google Scholar] [CrossRef]
- Aragaw, T.A.; Angerasa, F.T. Synthesis and Characterization of Ethiopian Kaolin for the Removal of Basic Yellow (BY 28) Dye from Aqueous Solution as a Potential Adsorbent. Heliyon 2020, 6, e04975. [Google Scholar] [CrossRef]
- Mouni, L.; Belkhiri, L.; Bollinger, J.-C.; Bouzaza, A.; Assadi, A.; Tirri, A.; Dahmoune, F.; Madani, K.; Remini, H. Removal of Methylene Blue from Aqueous Solutions by Adsorption on Kaolin: Kinetic and Equilibrium Studies. Appl. Clay Sci. 2018, 153, 38–45. [Google Scholar] [CrossRef]
Figure 1.
The structural formula of the Reactive Black 5 dye (RB5).
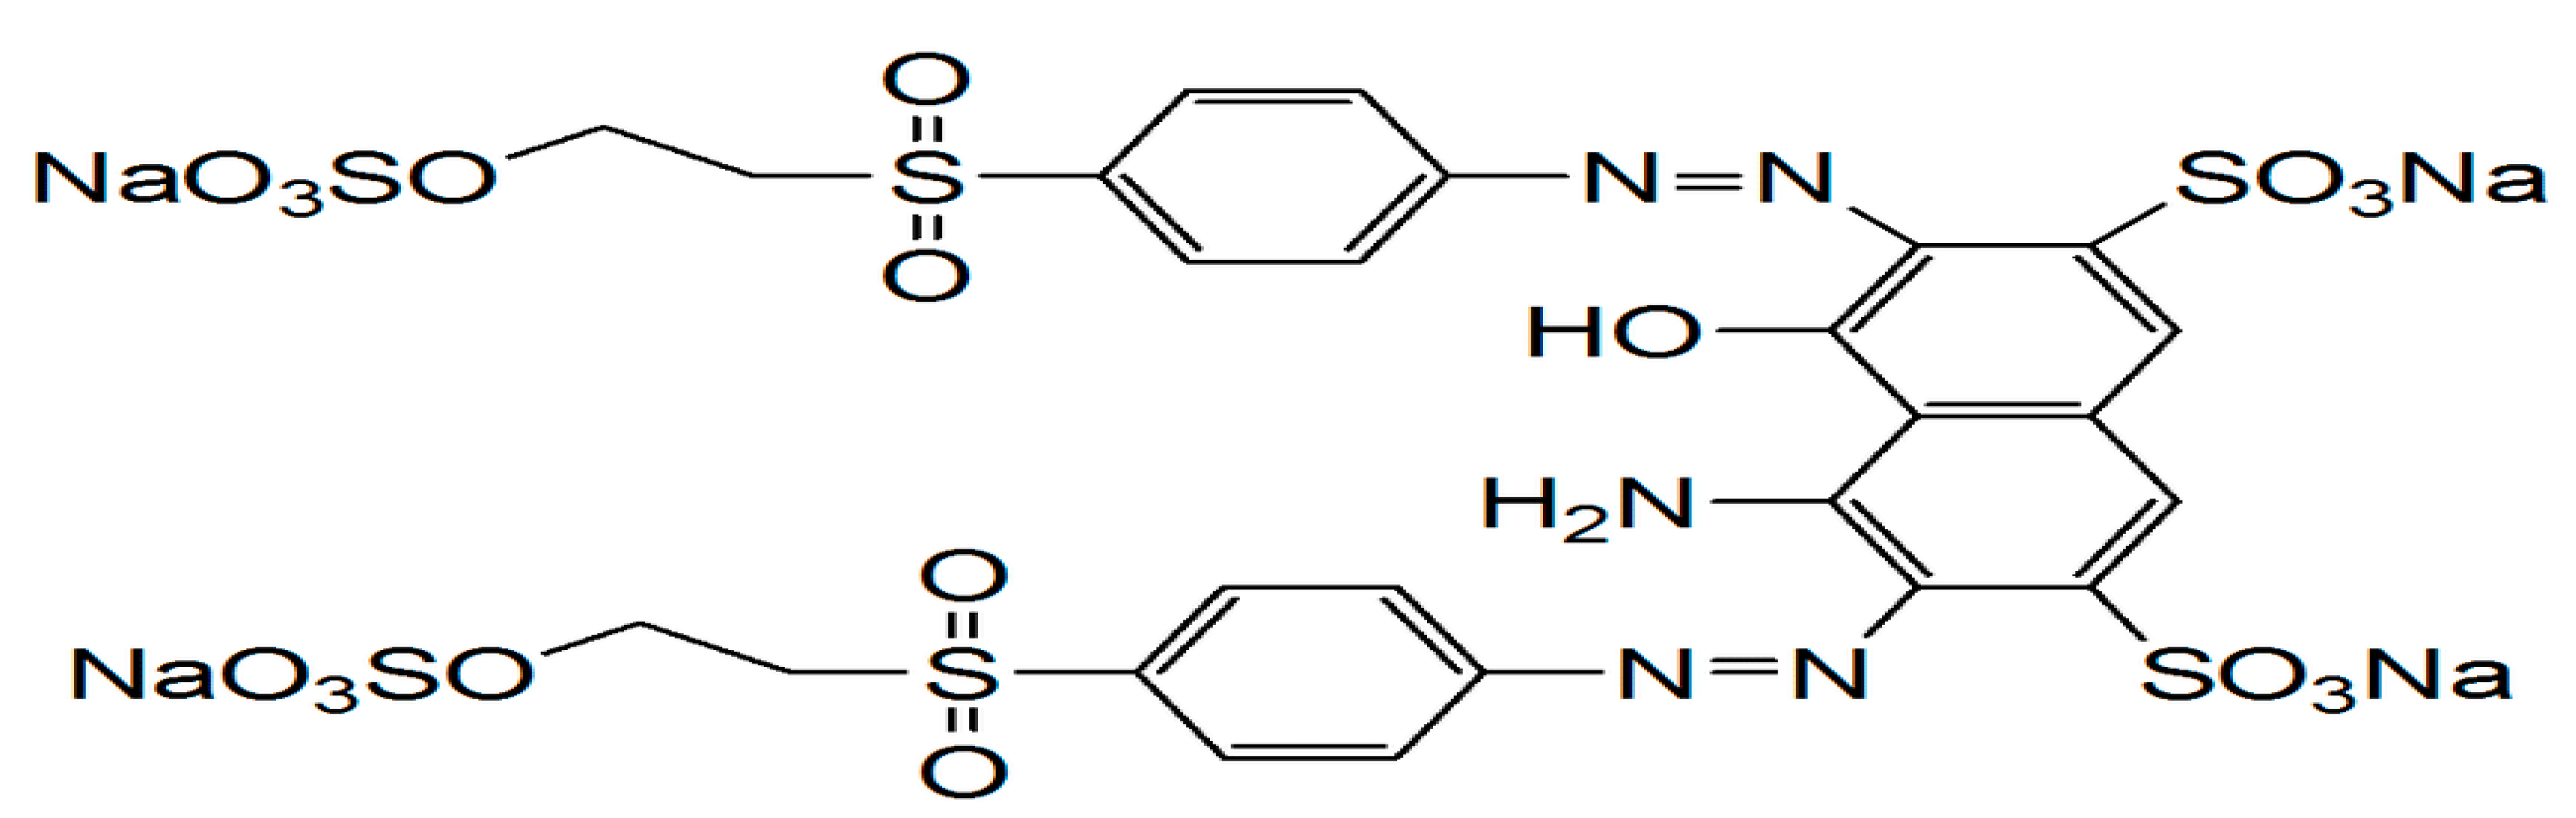
Figure 2.
Point of Zero charges for KFC-Fe3O4 nanocomposite.
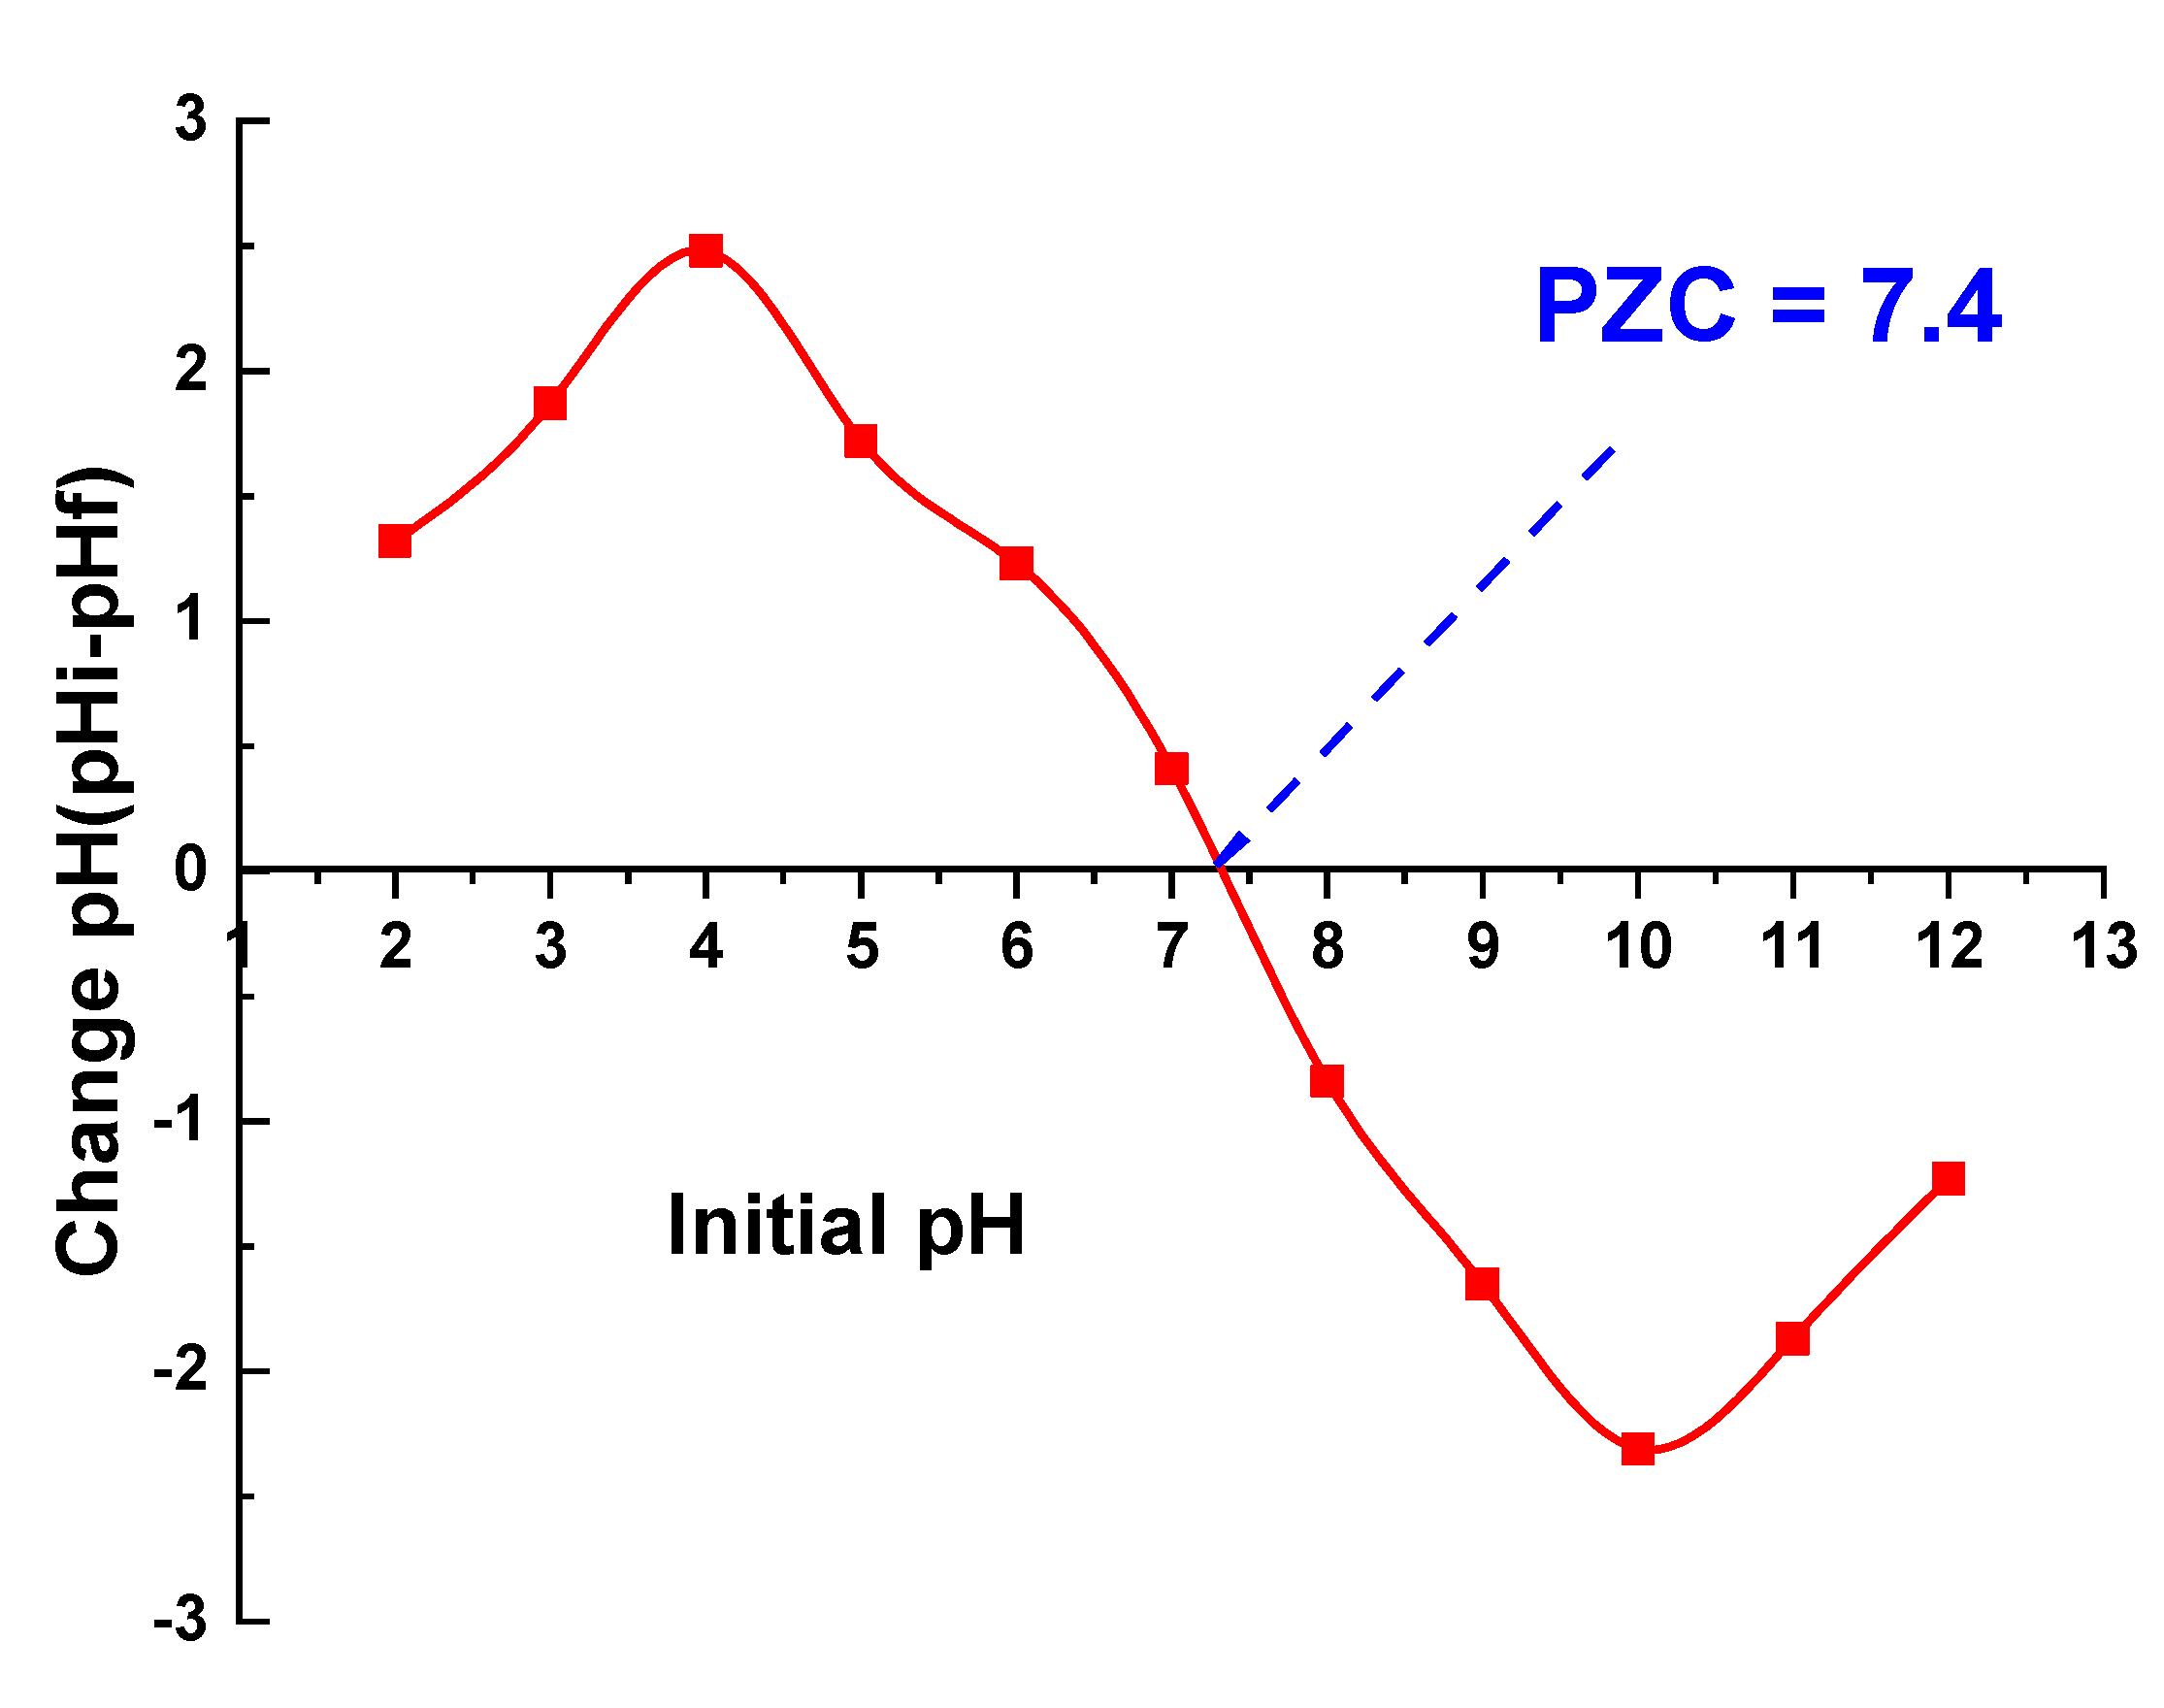
Figure 3.
FTIR analysis for KFC-Fe3O4 composite before and after adsorption.
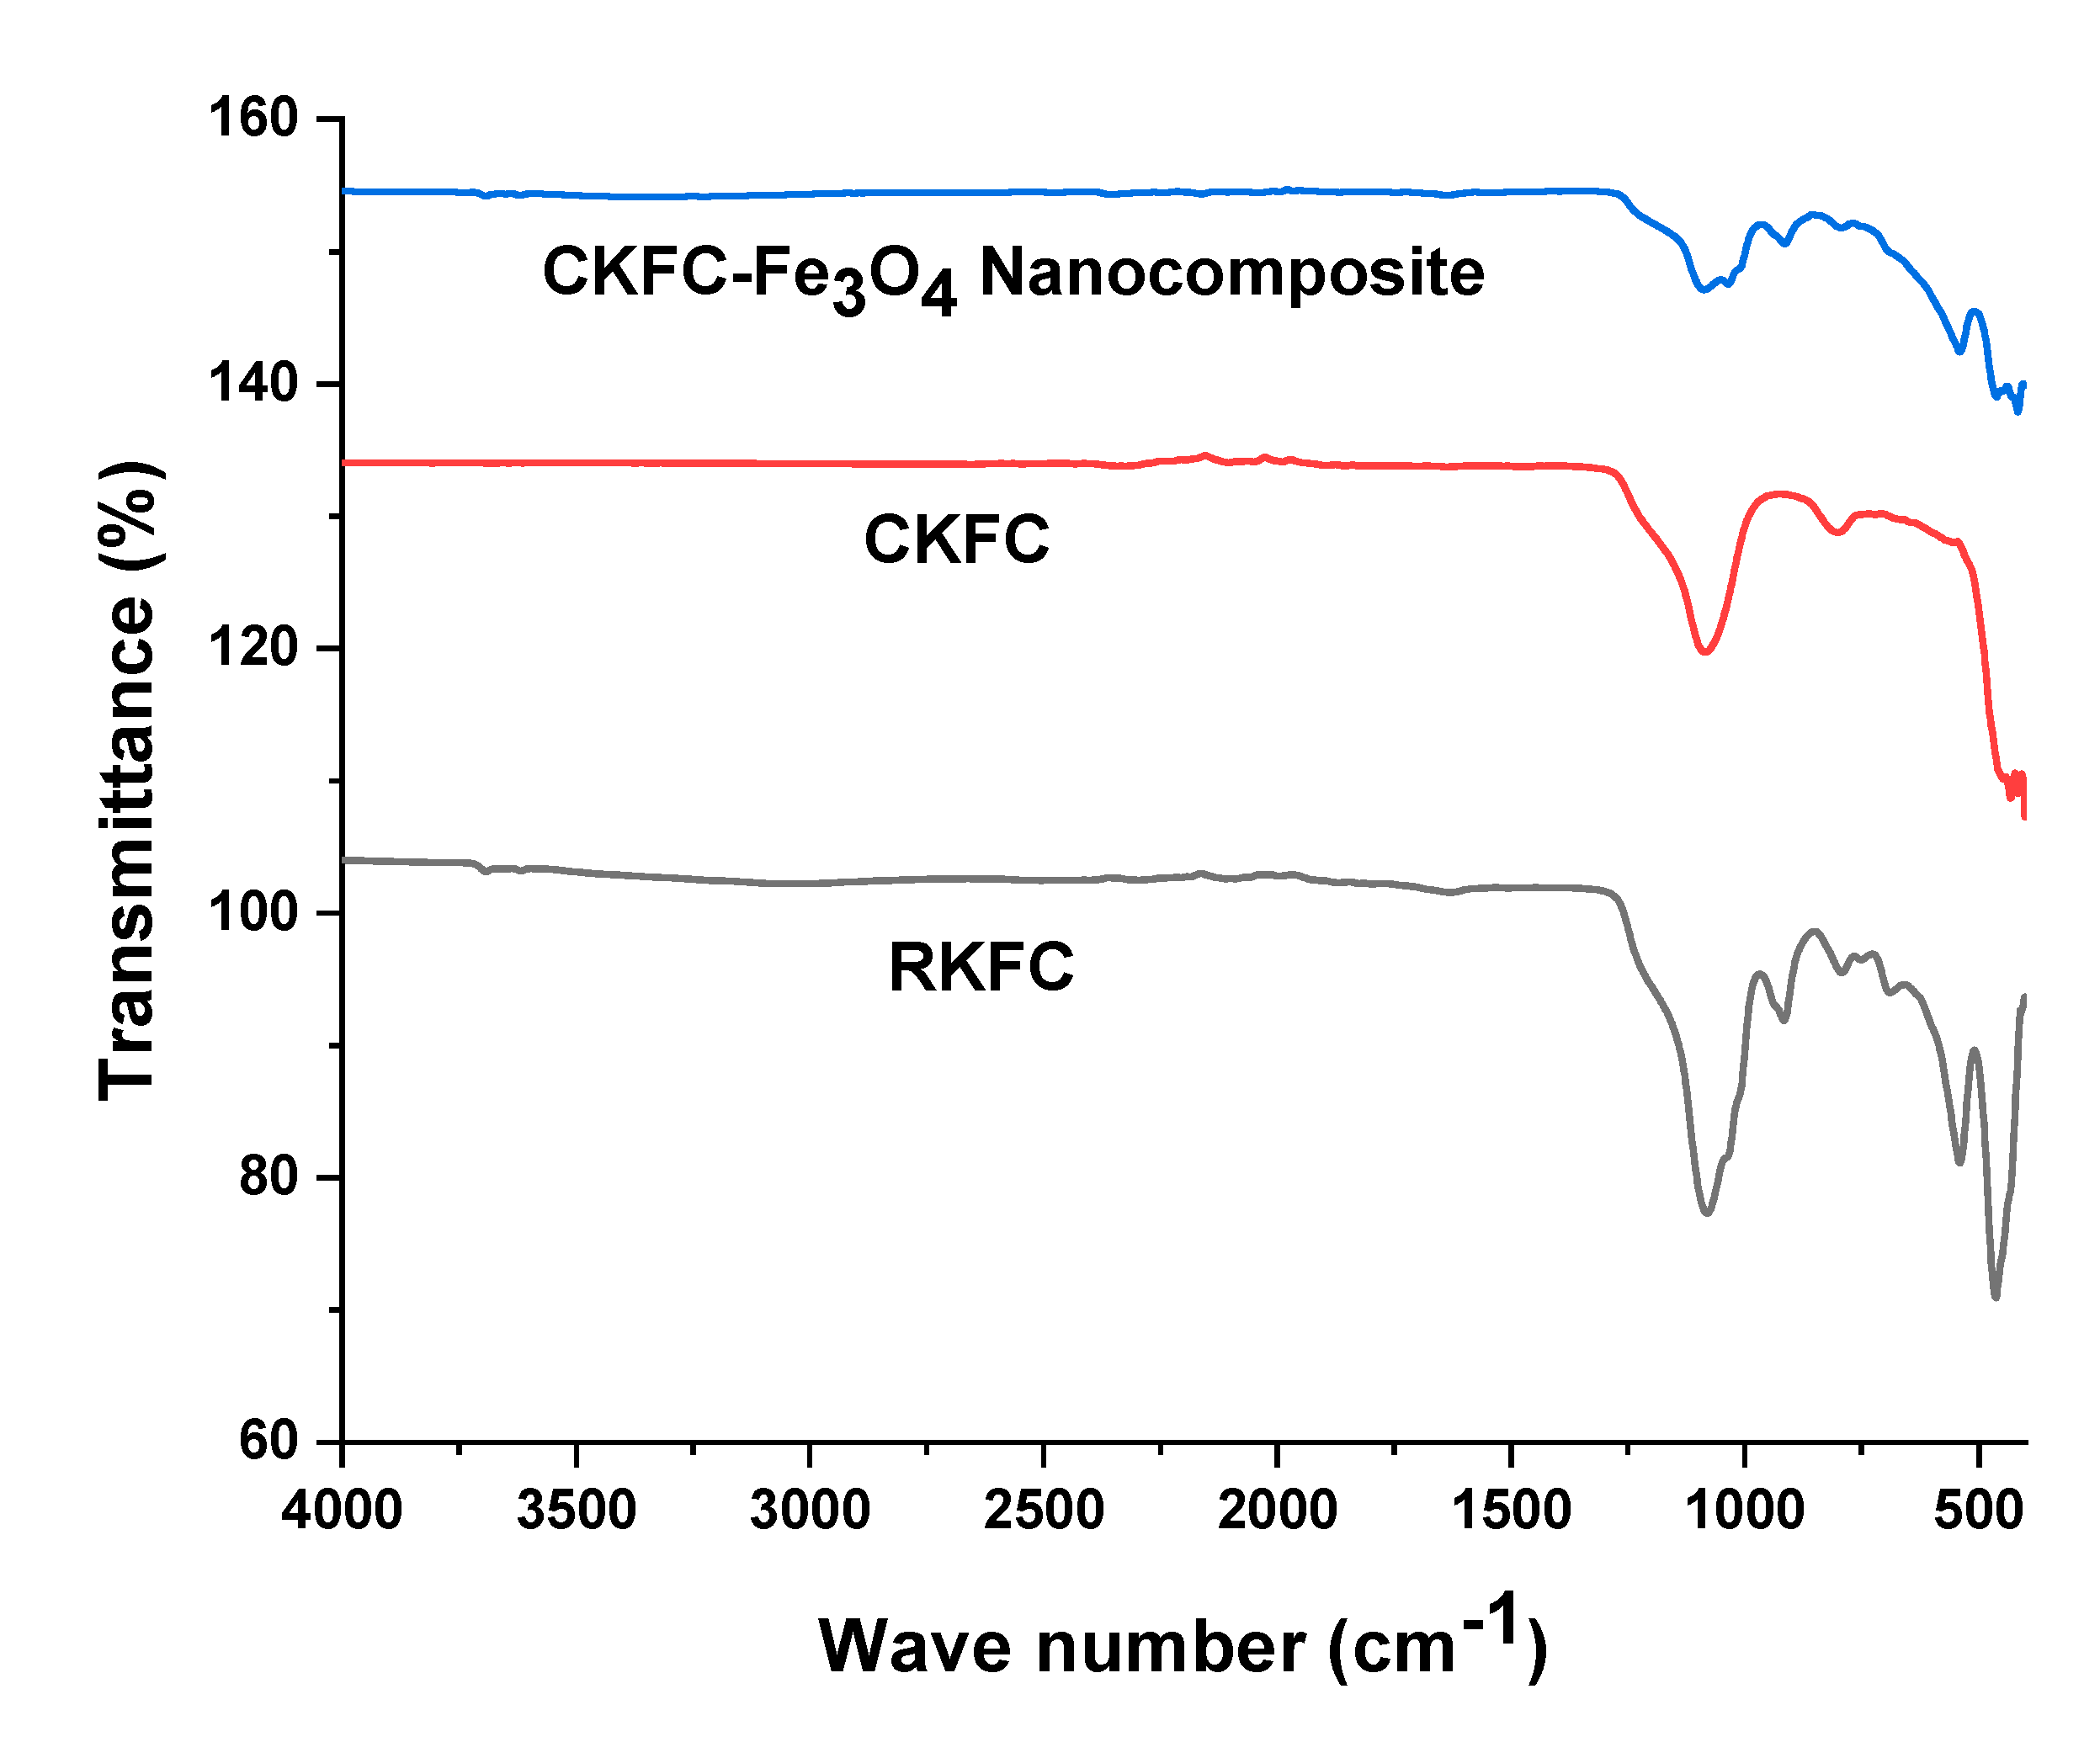
Figure 4.
X-ray diffraction analysis for Raw, Calcined, and CKFC-Fe3O4 adsorbents.
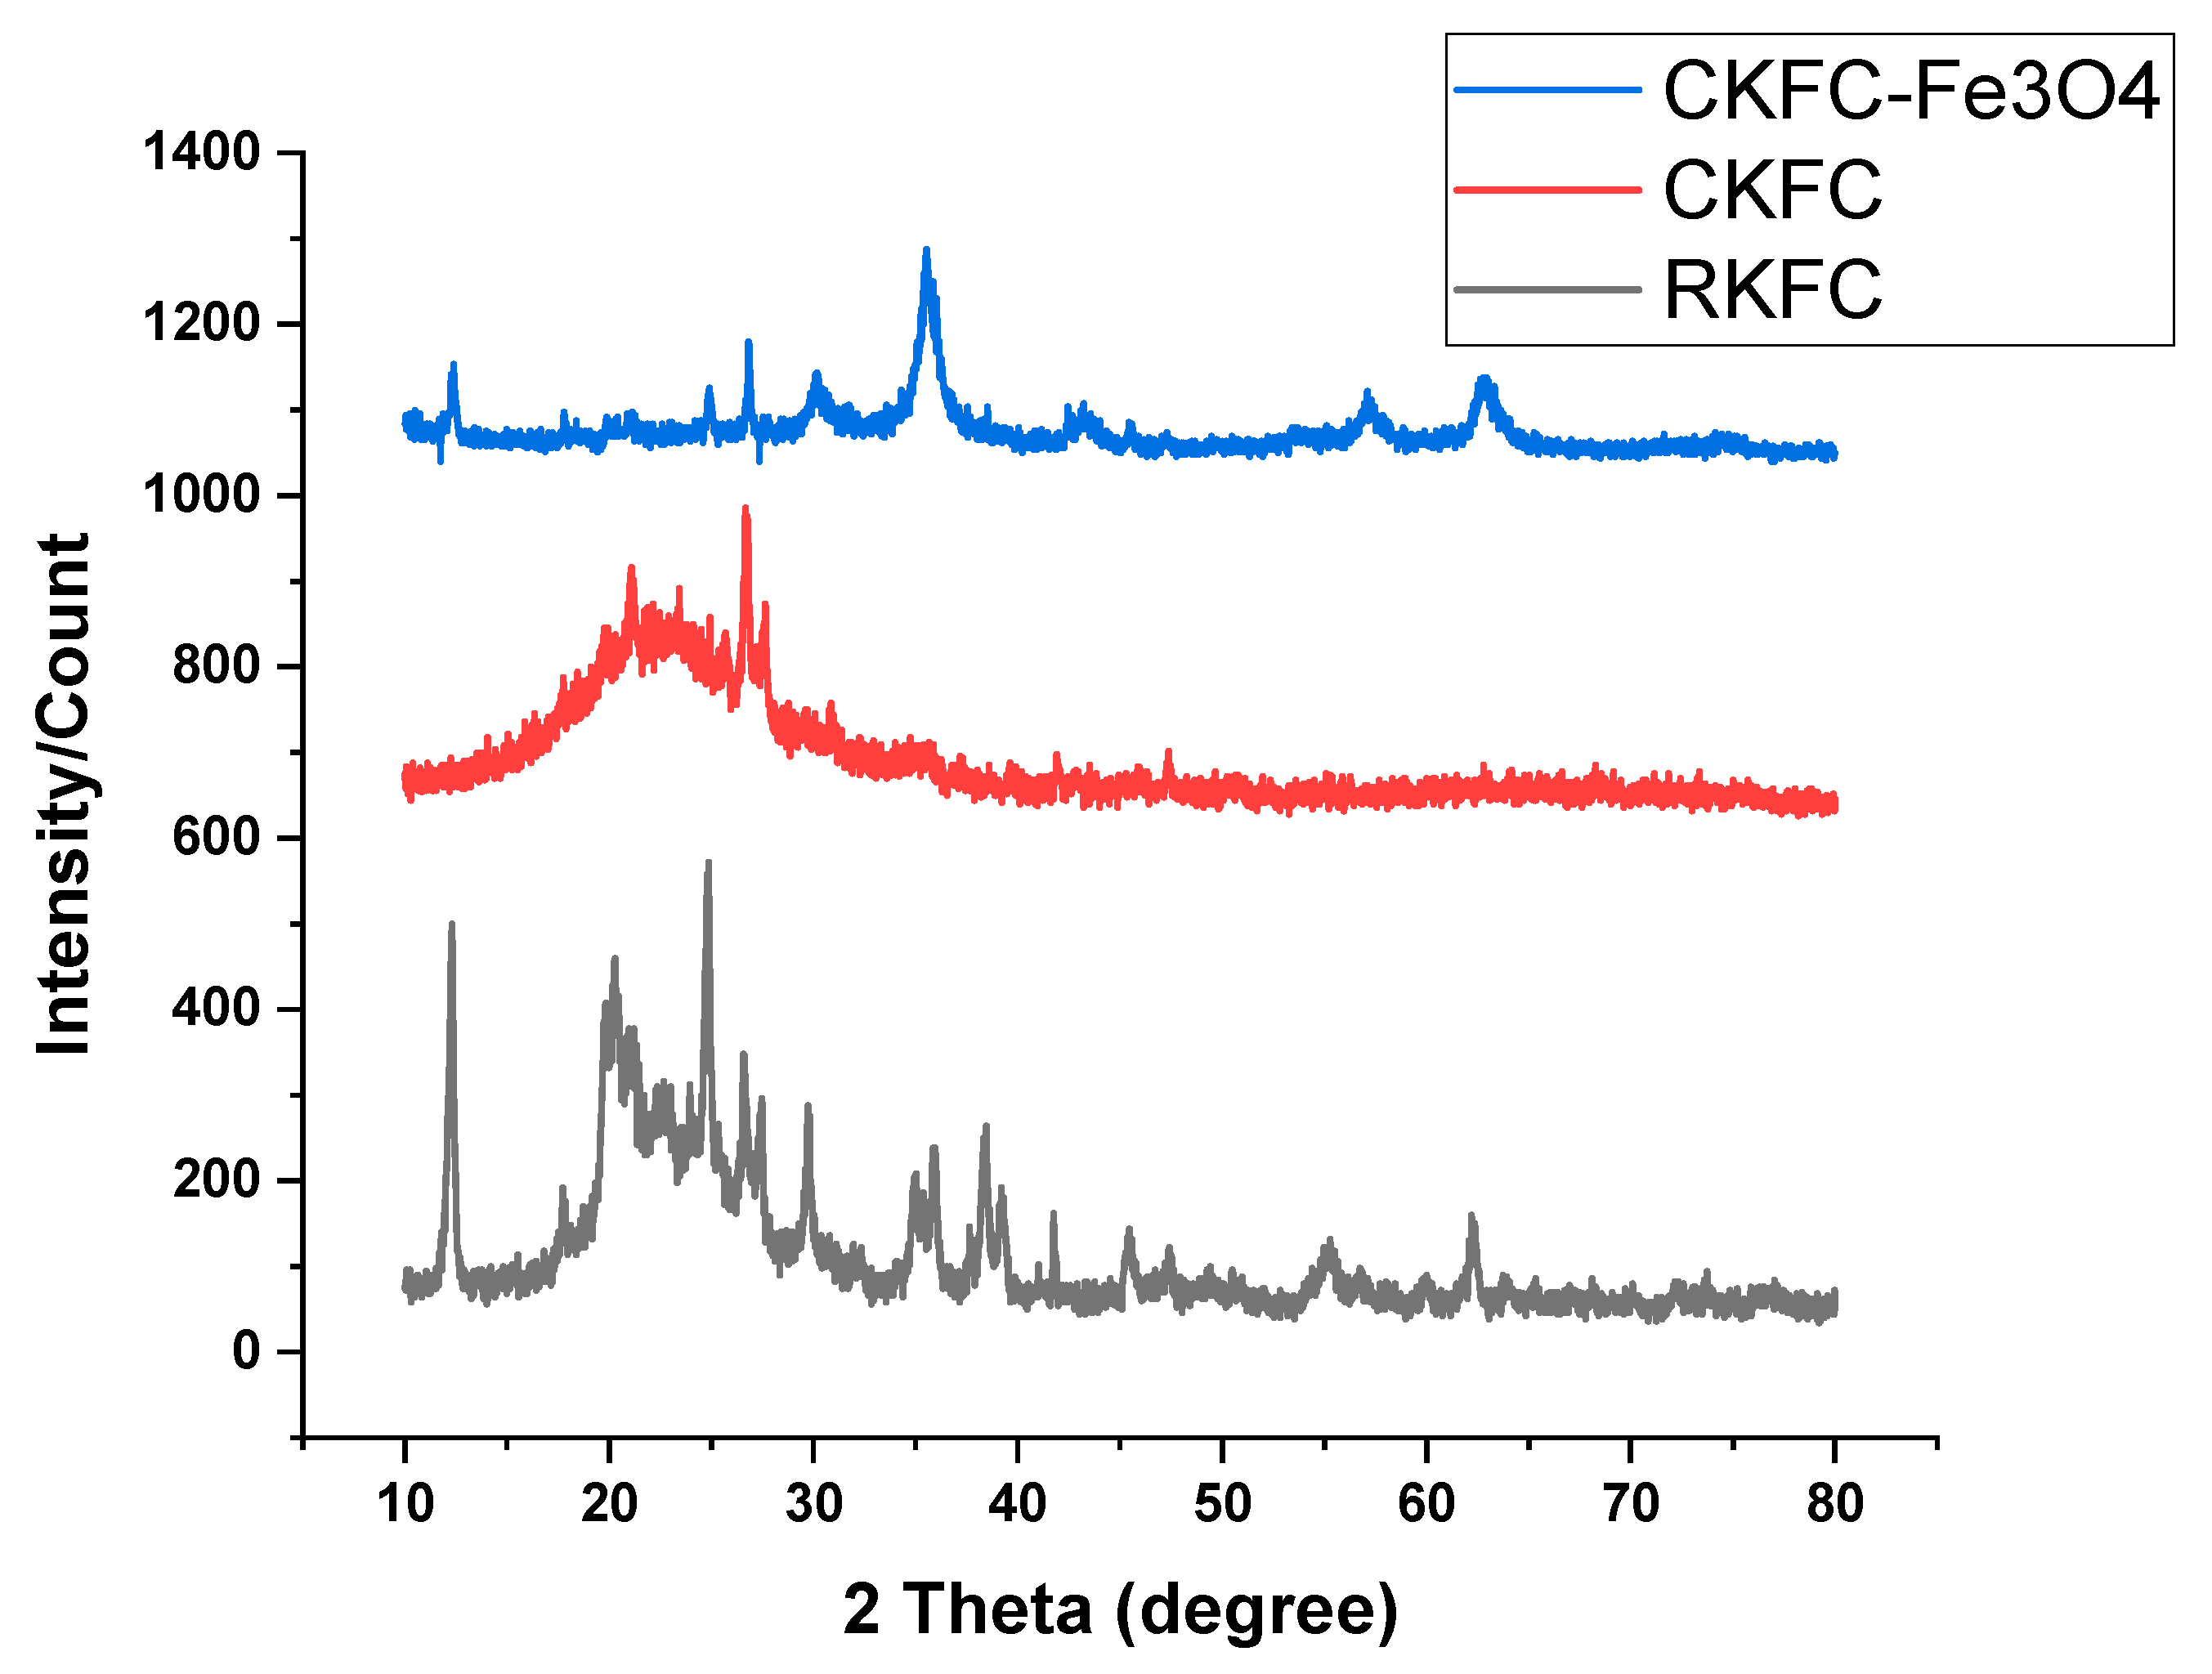
Figure 5.
SEM analysis of CKFC (a) and KFC-Fe3O4 composite (b).
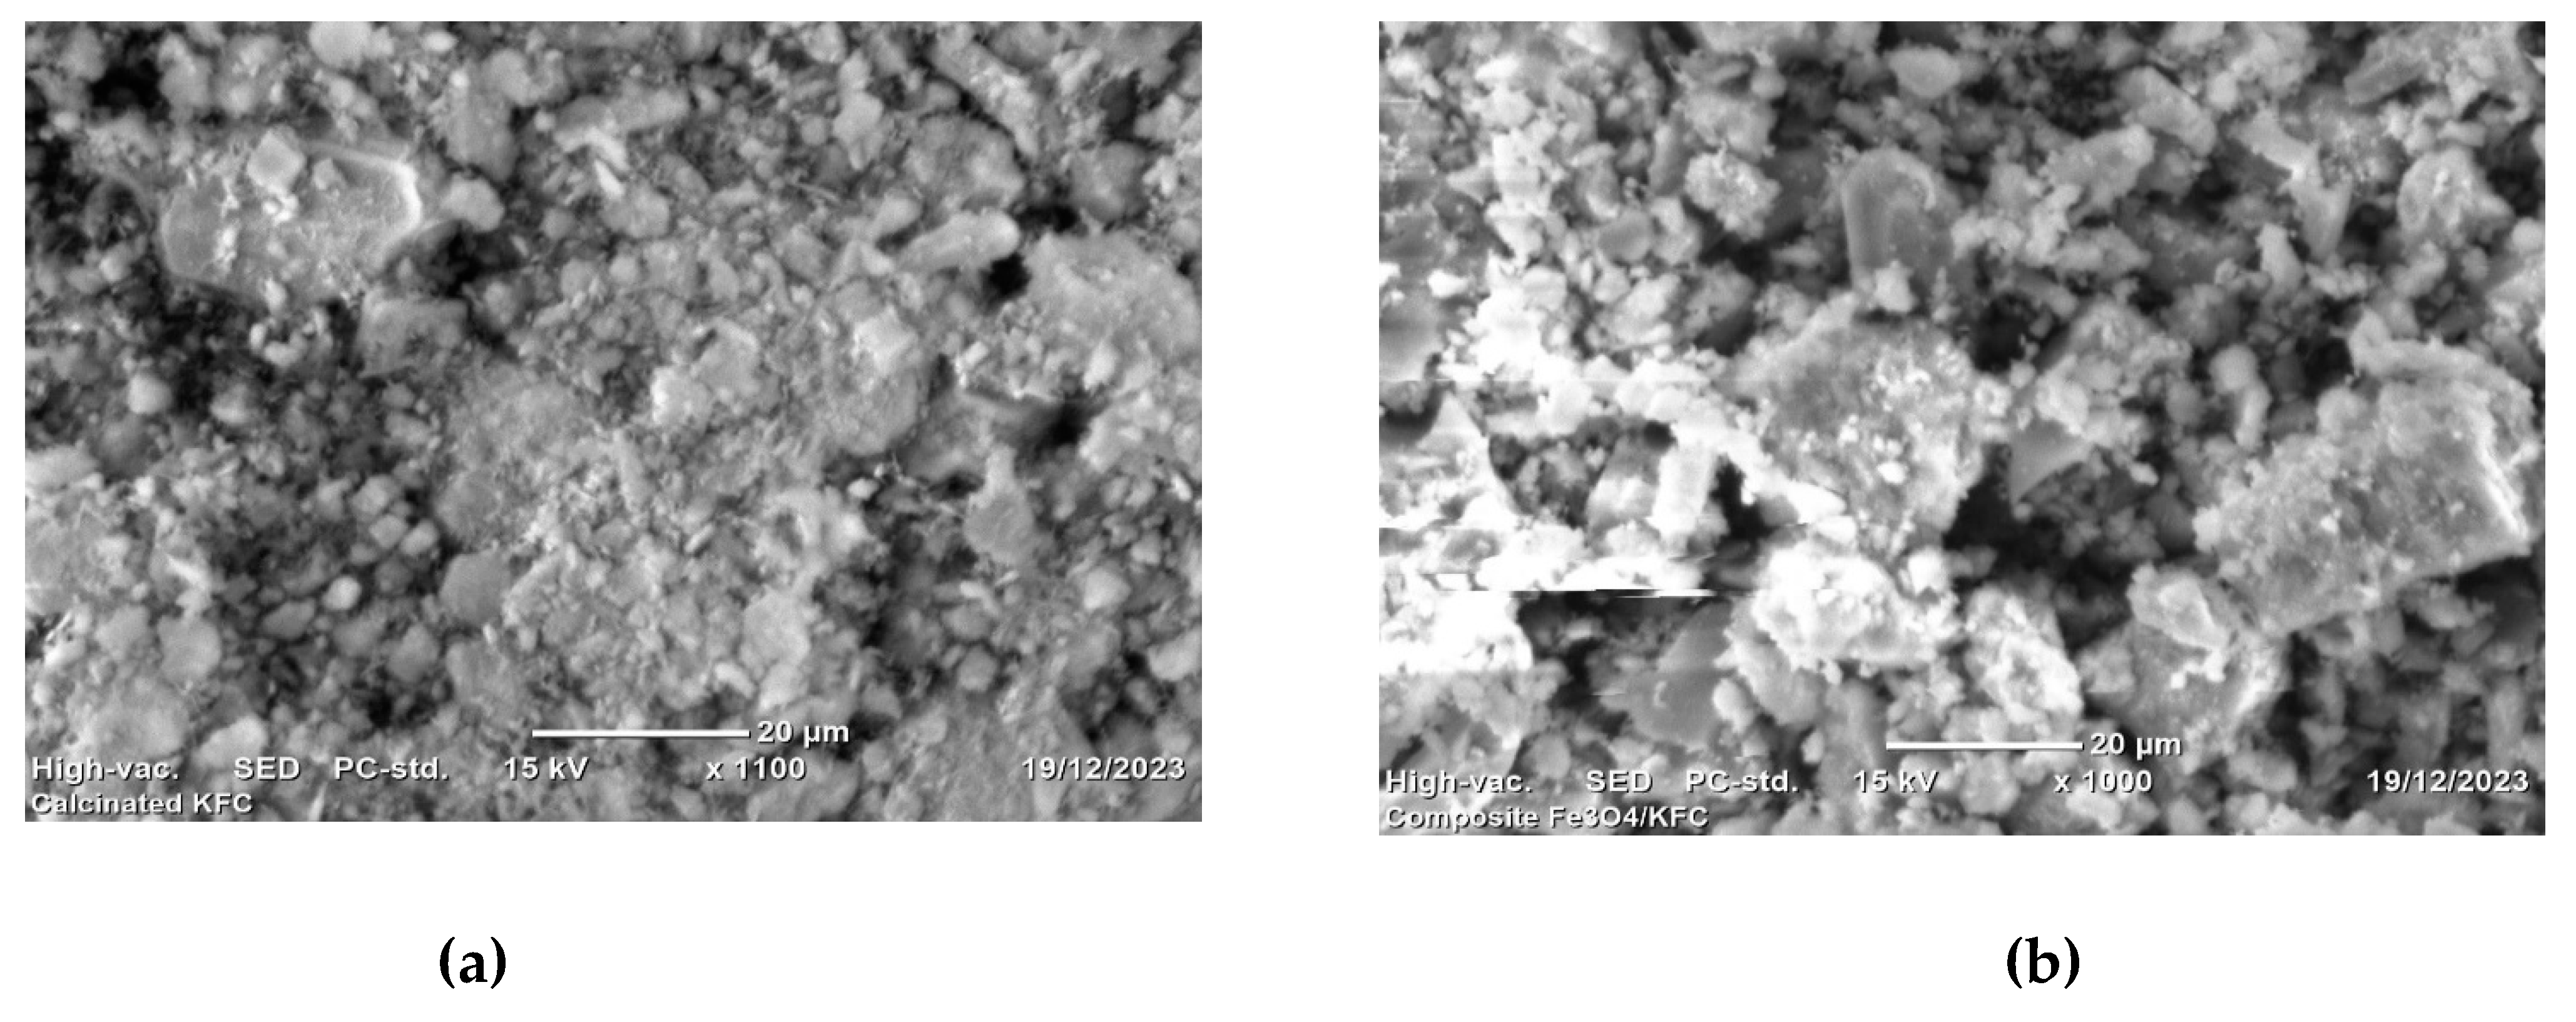
Figure 6.
Effect of pH on the percentage of RB5 dye removal.
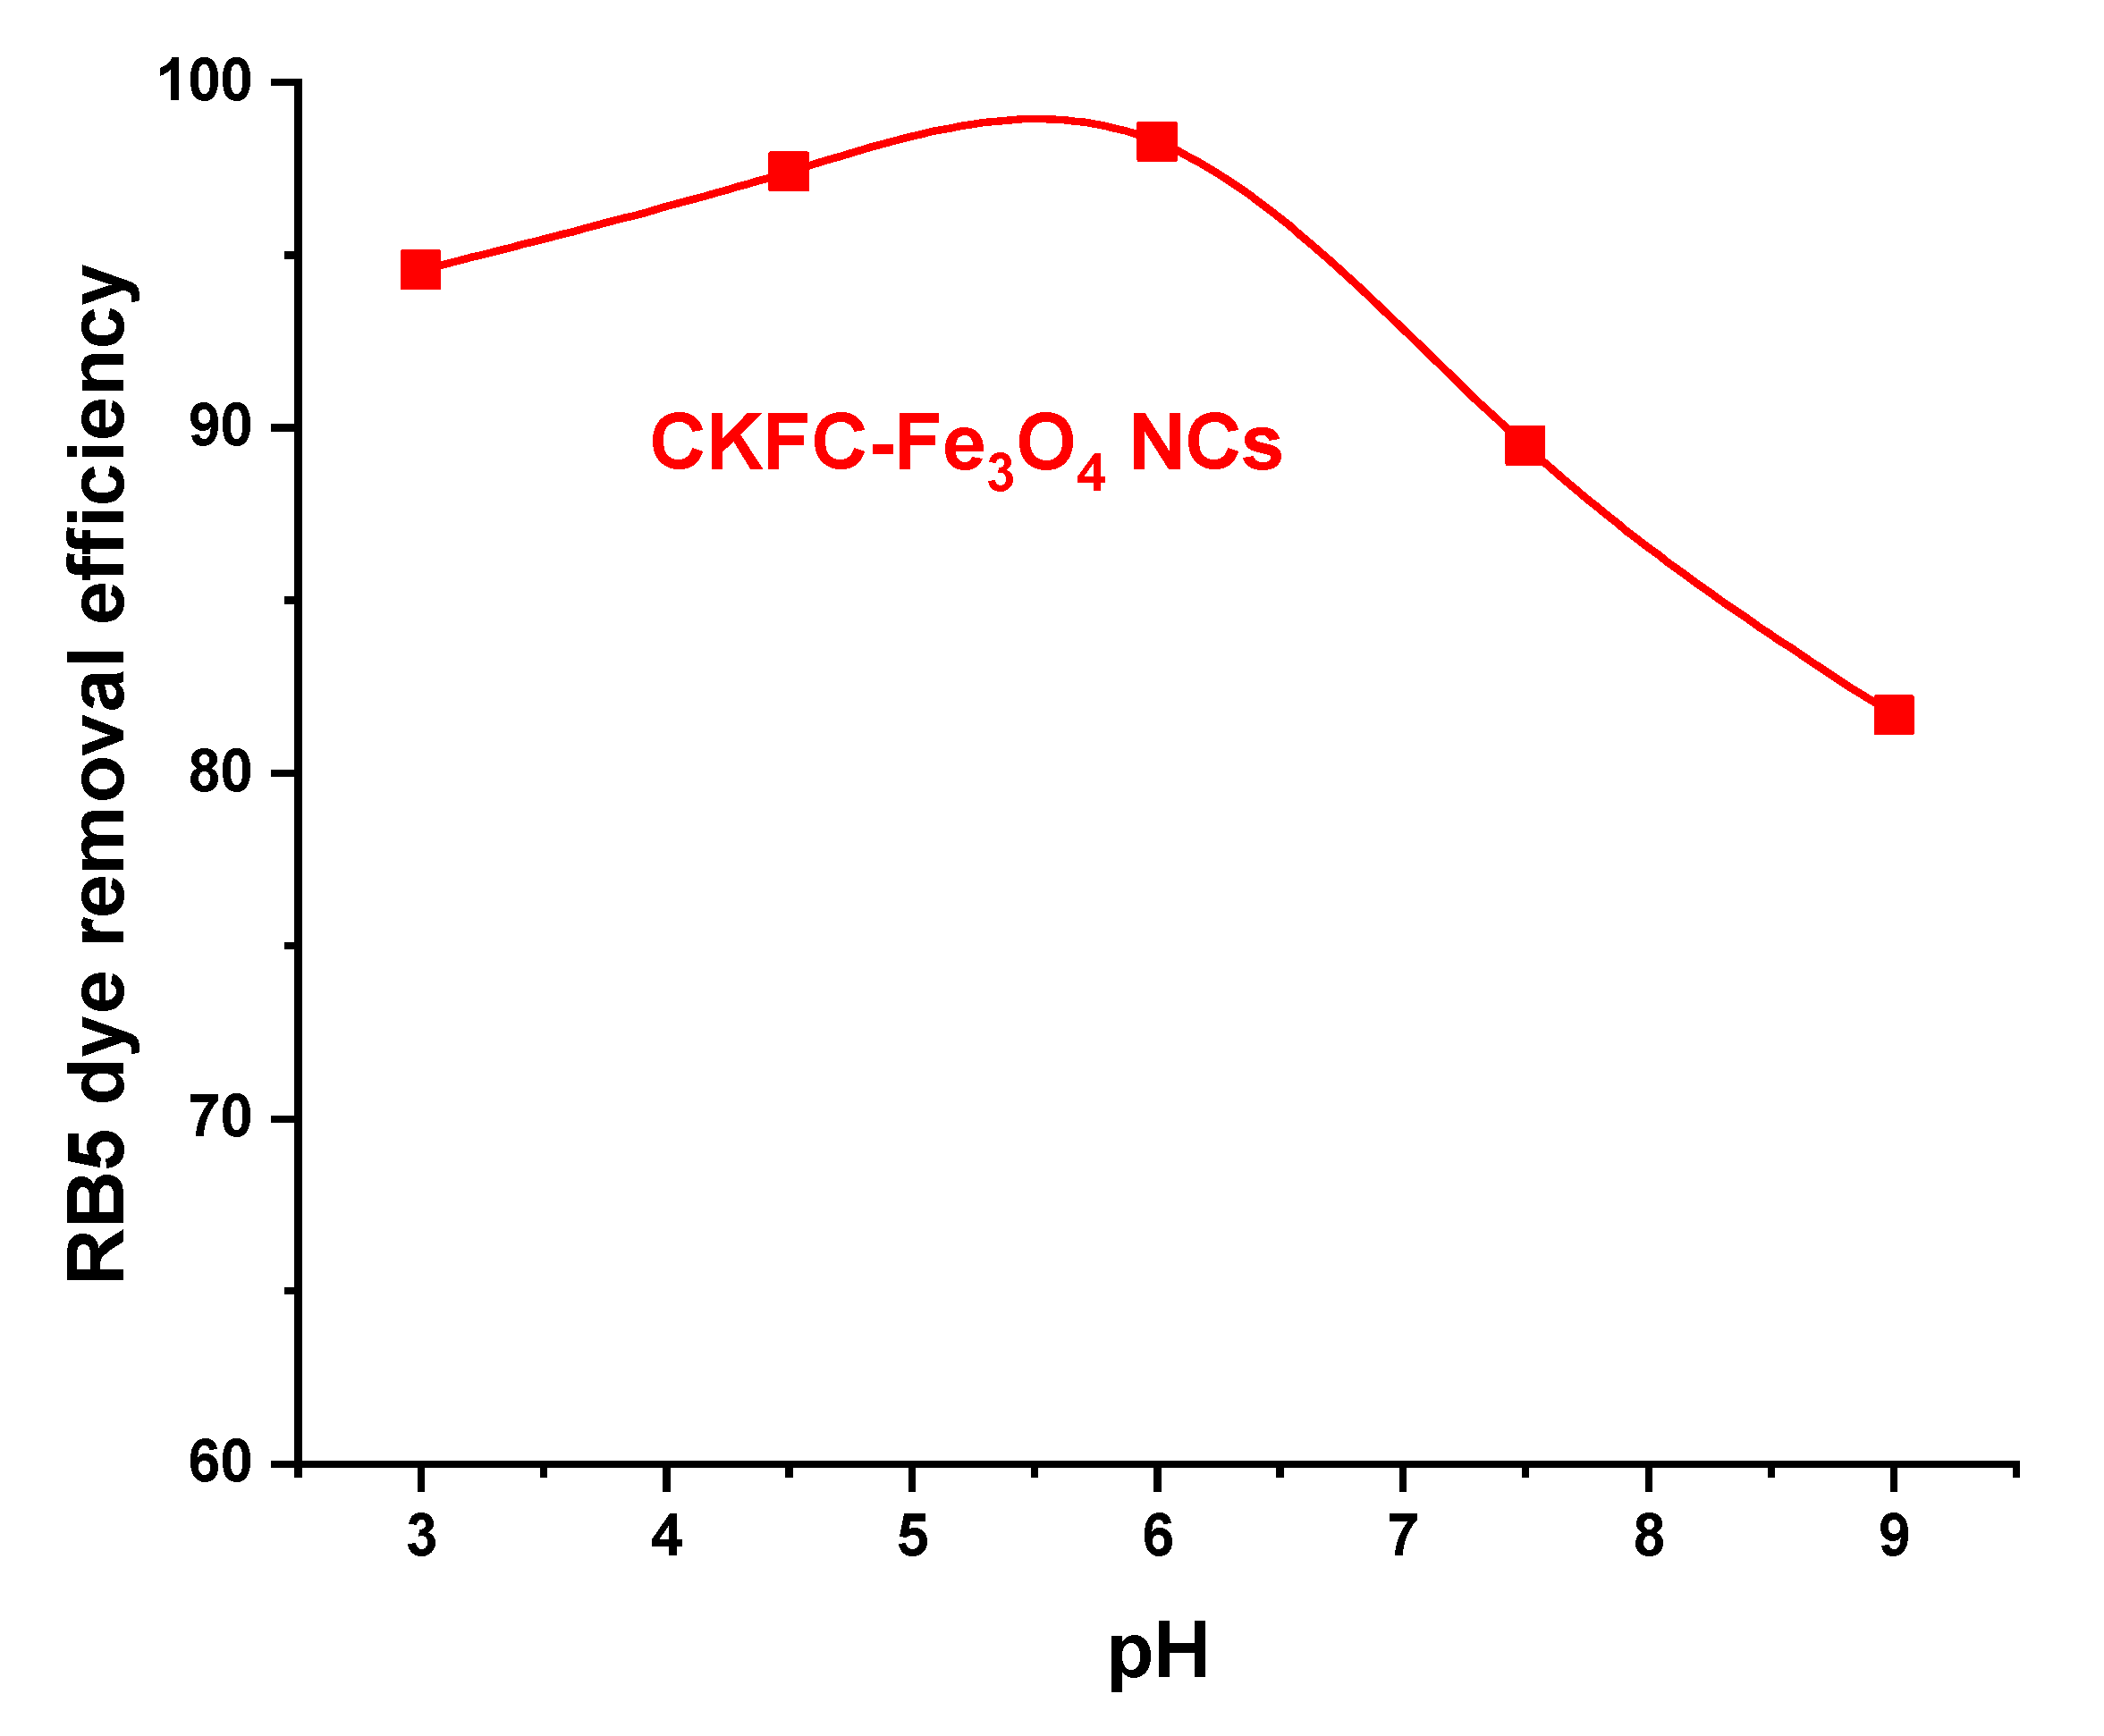
Figure 7.
Effect of adsorbent dose on the percentage of RB5 dye removal.
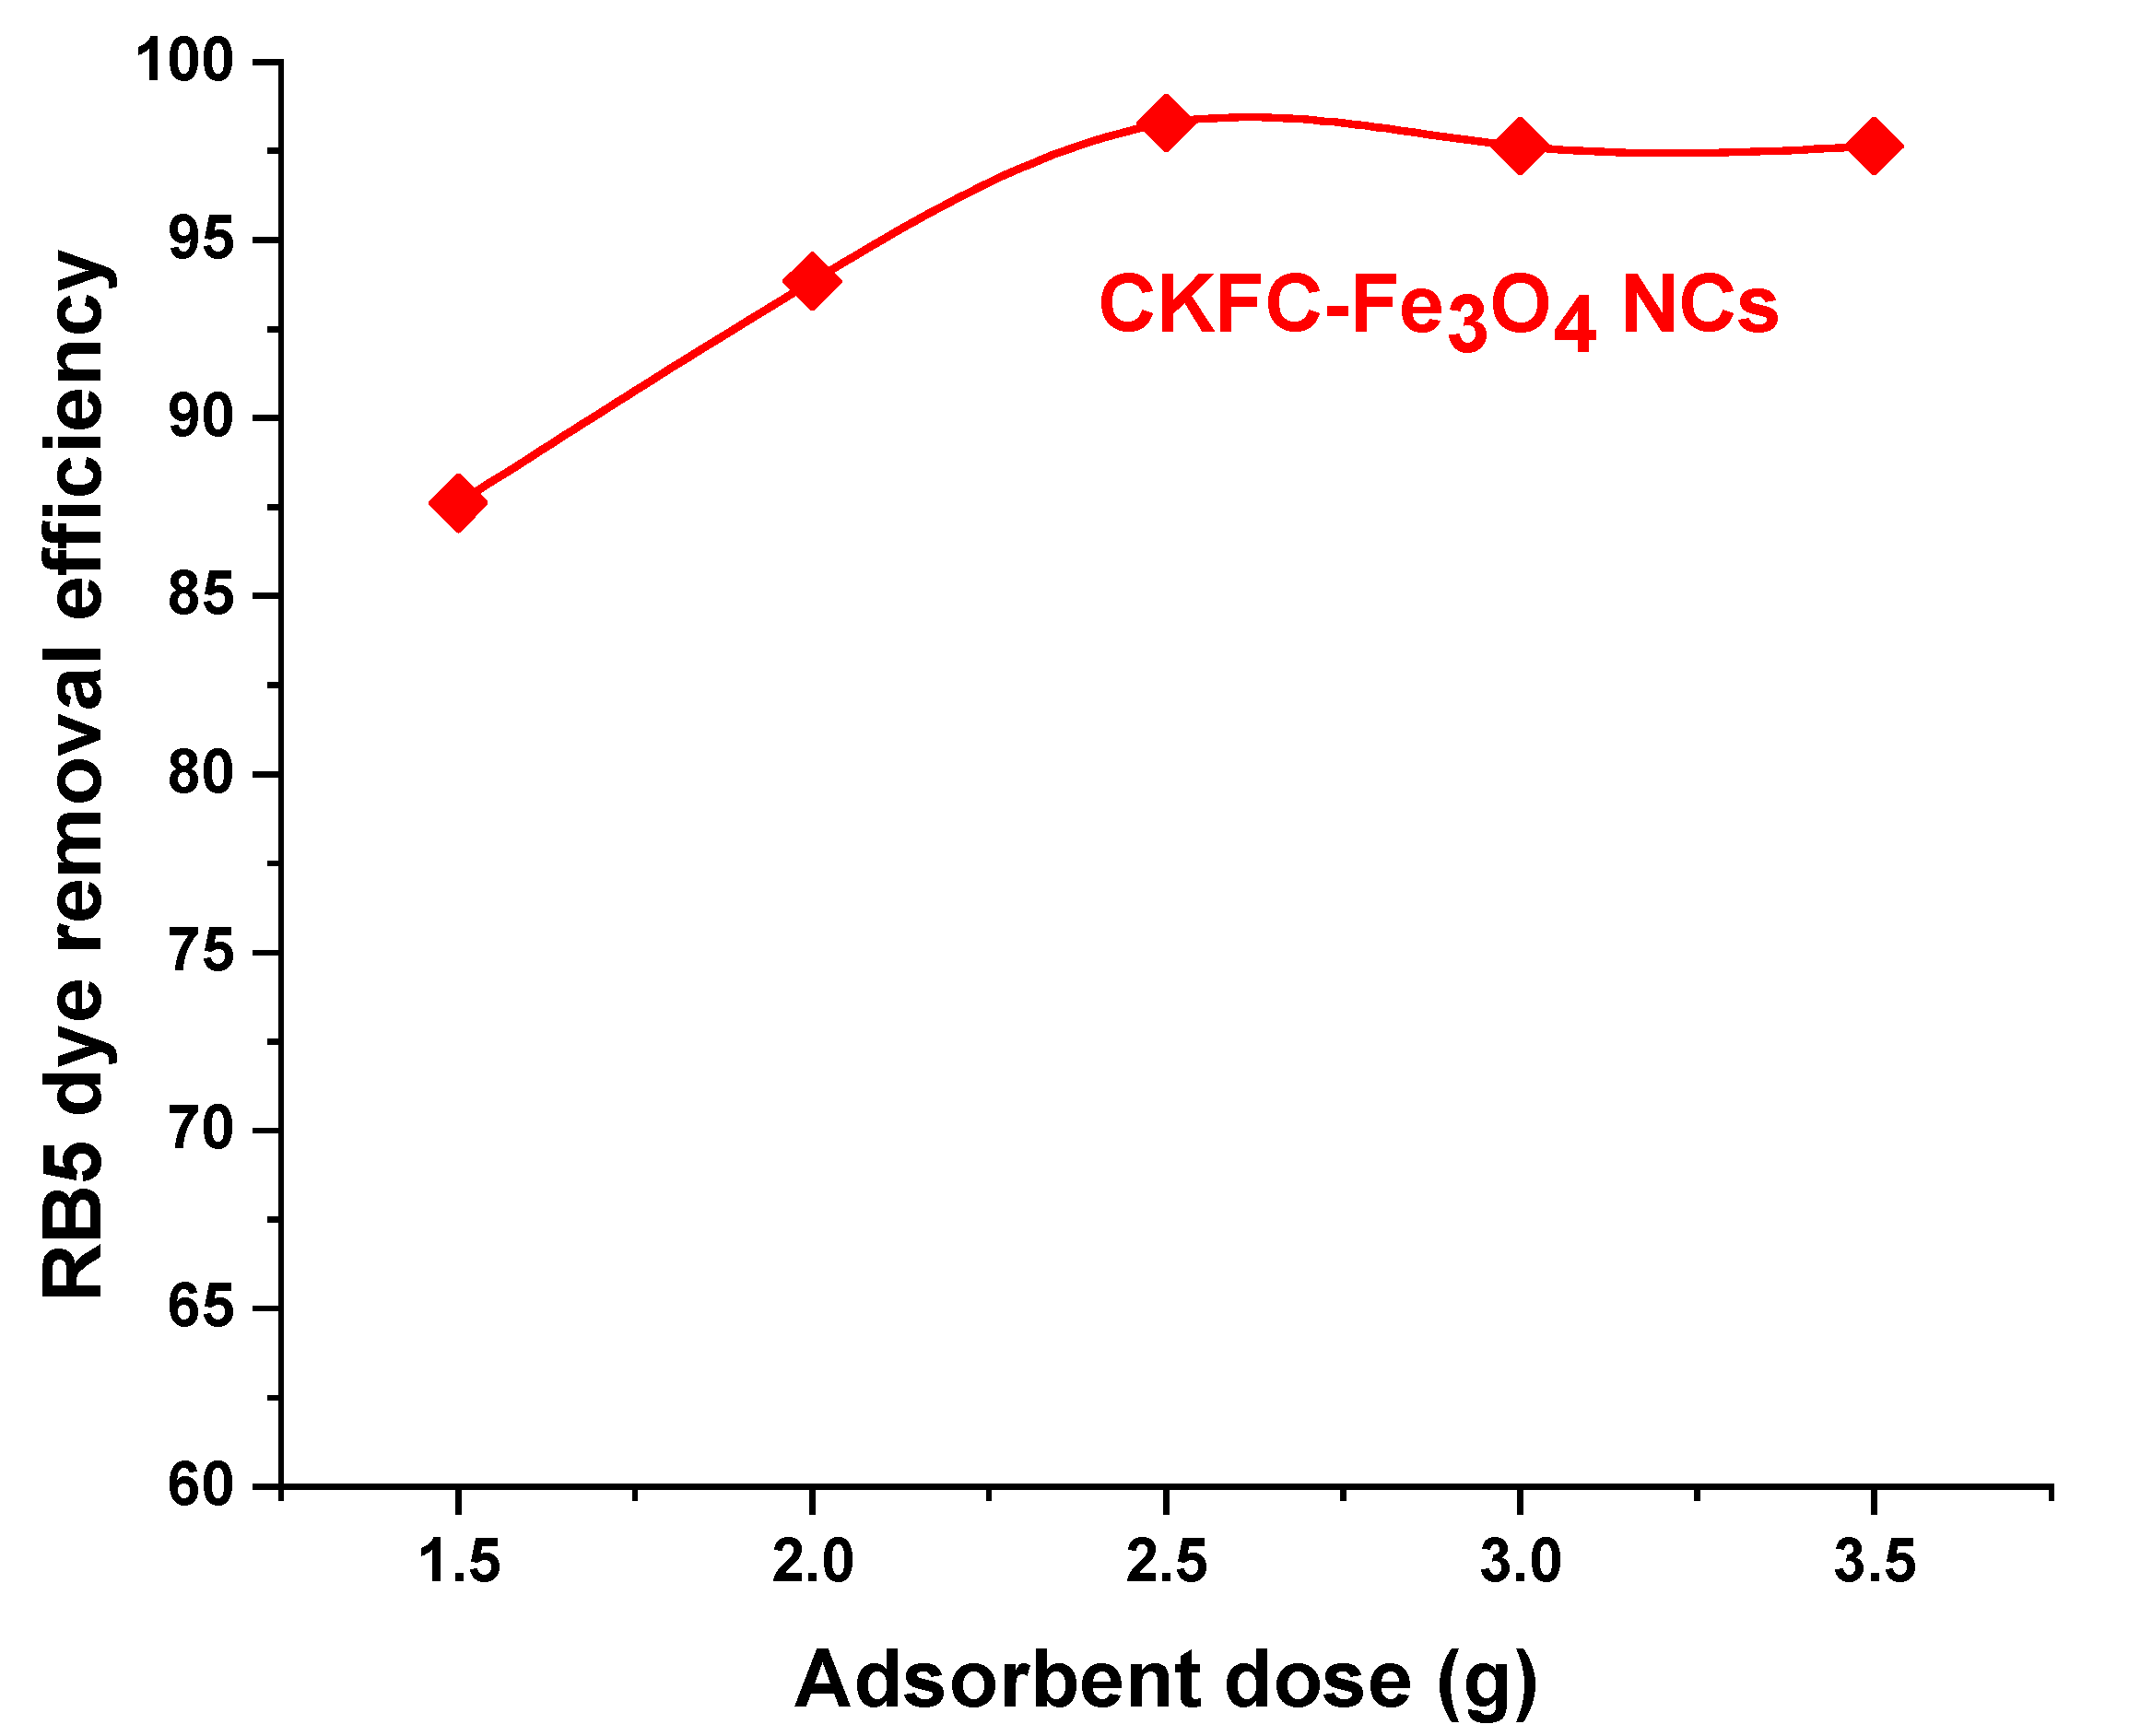
Figure 8.
Effect of contact time on the percentage of RB5 dye removal.
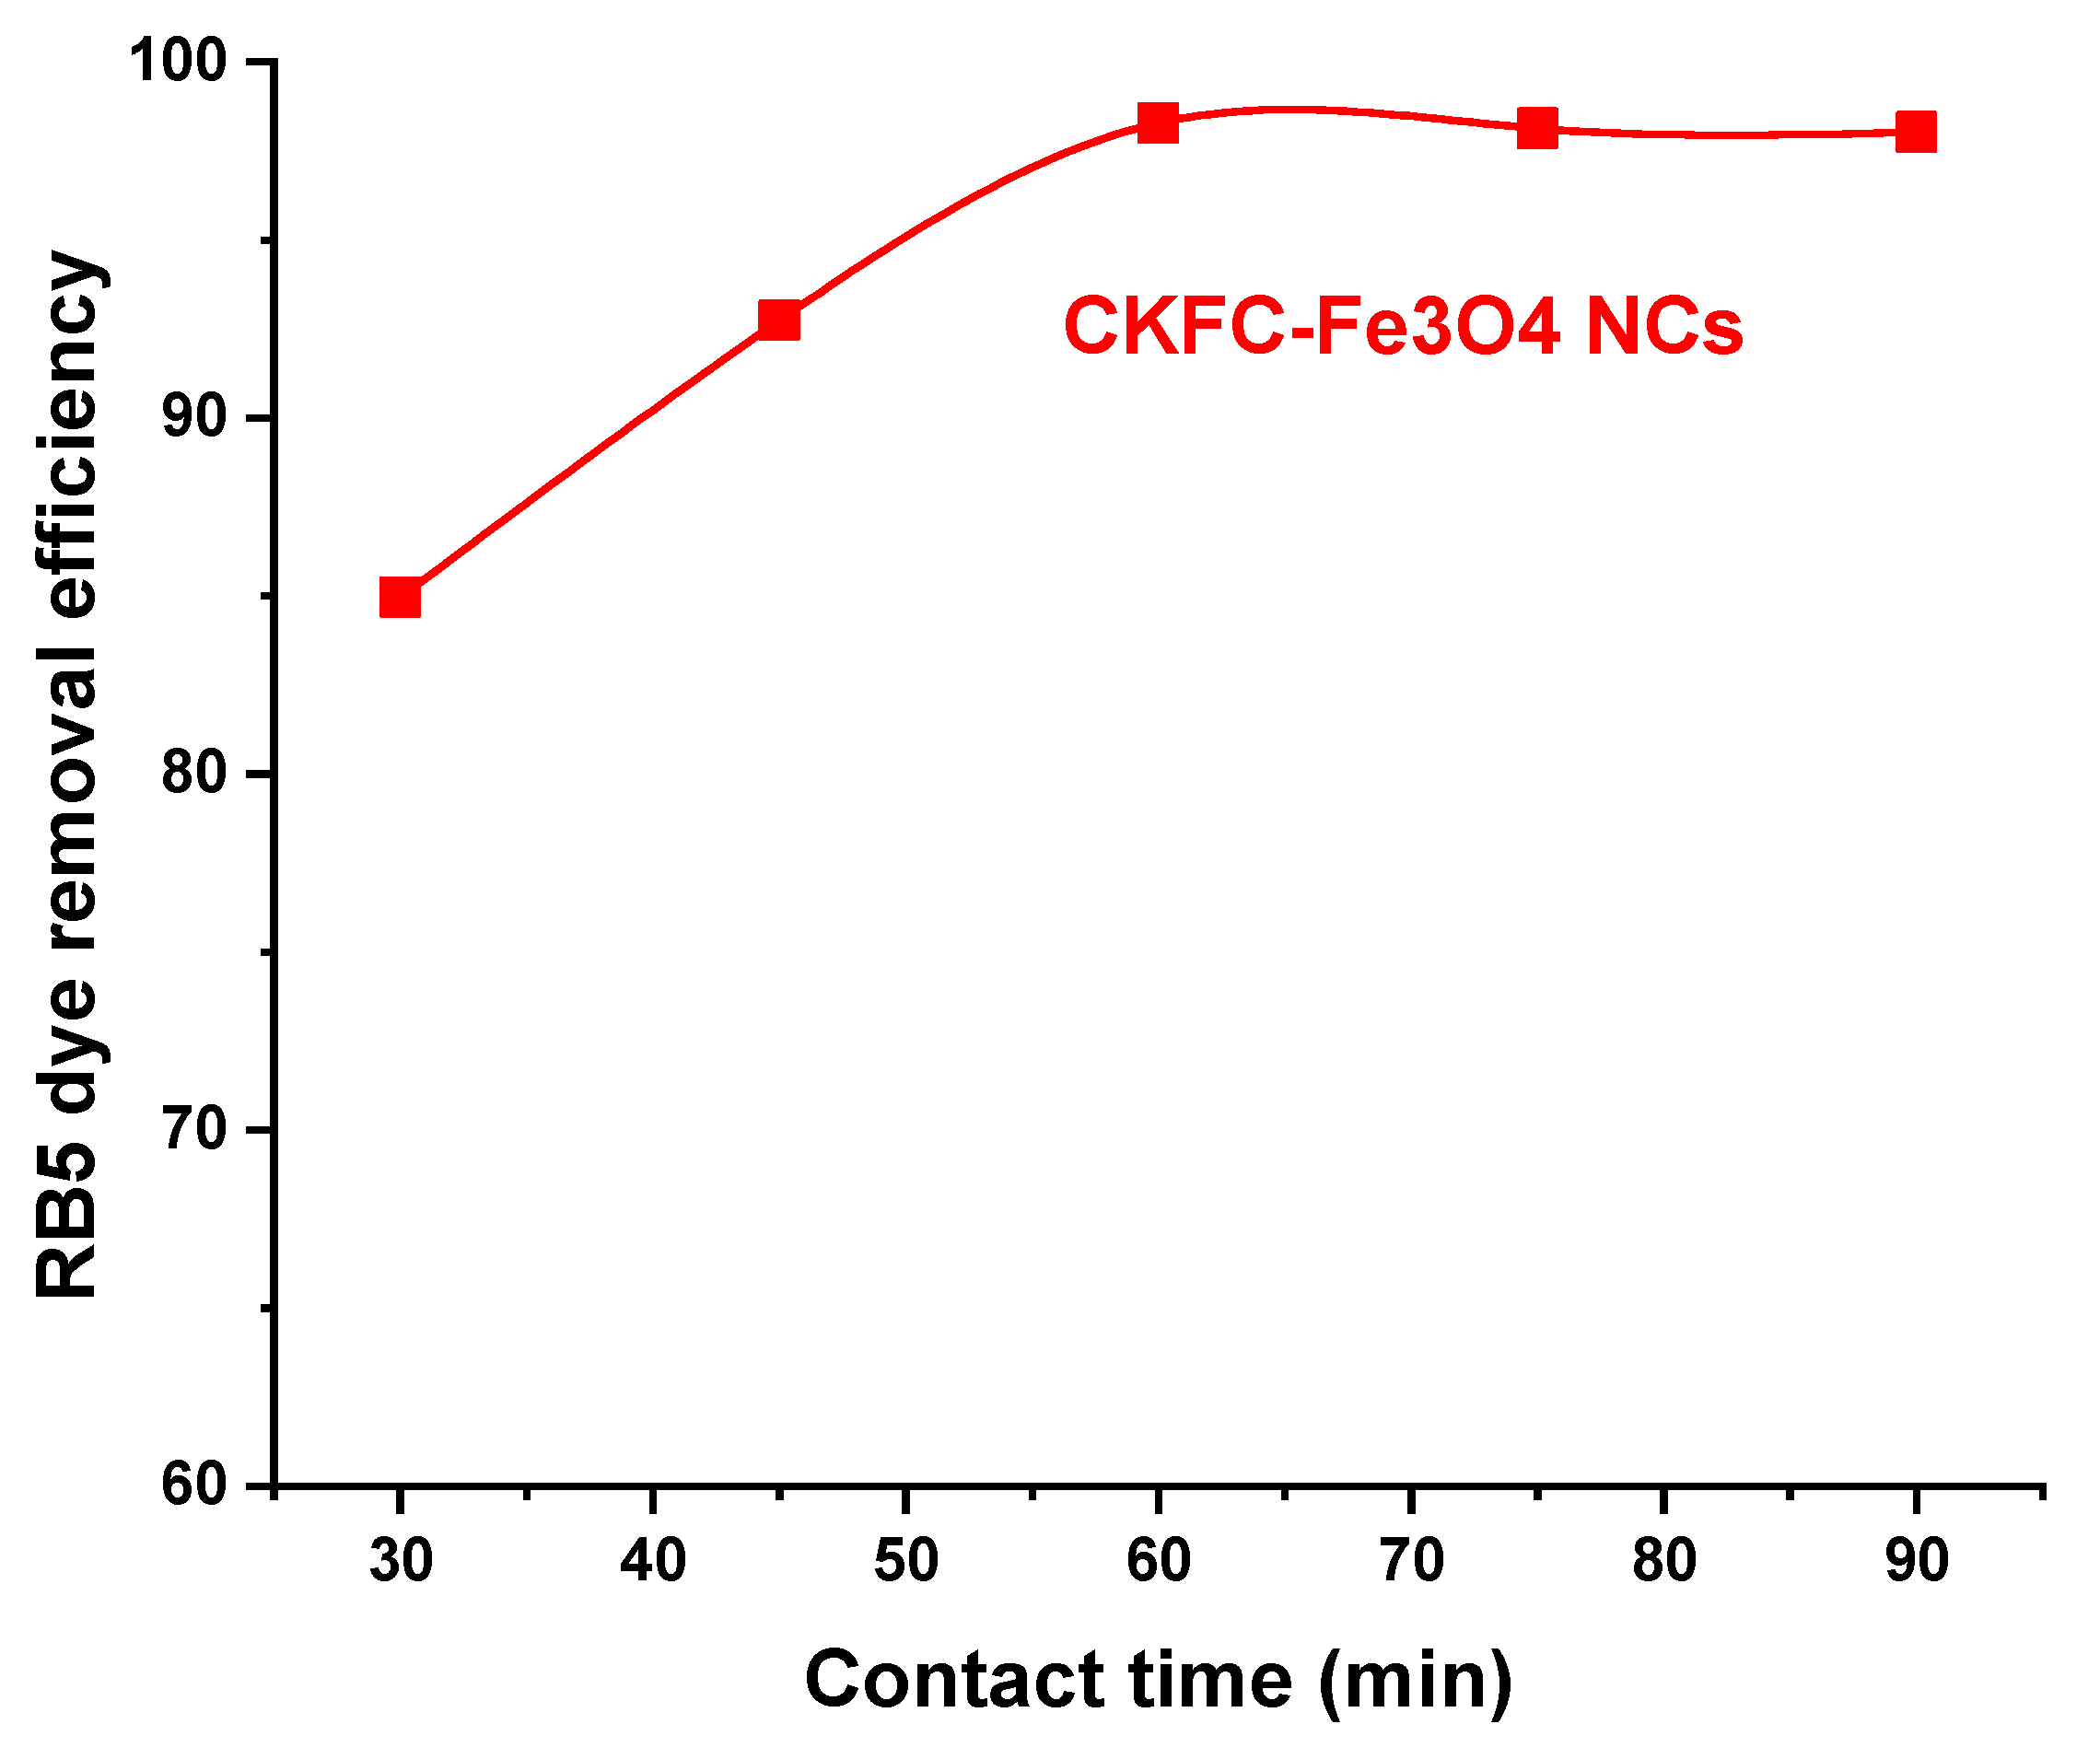
Figure 9.
Effect of initial dye concentration on the percentage of RB5 dye removal.
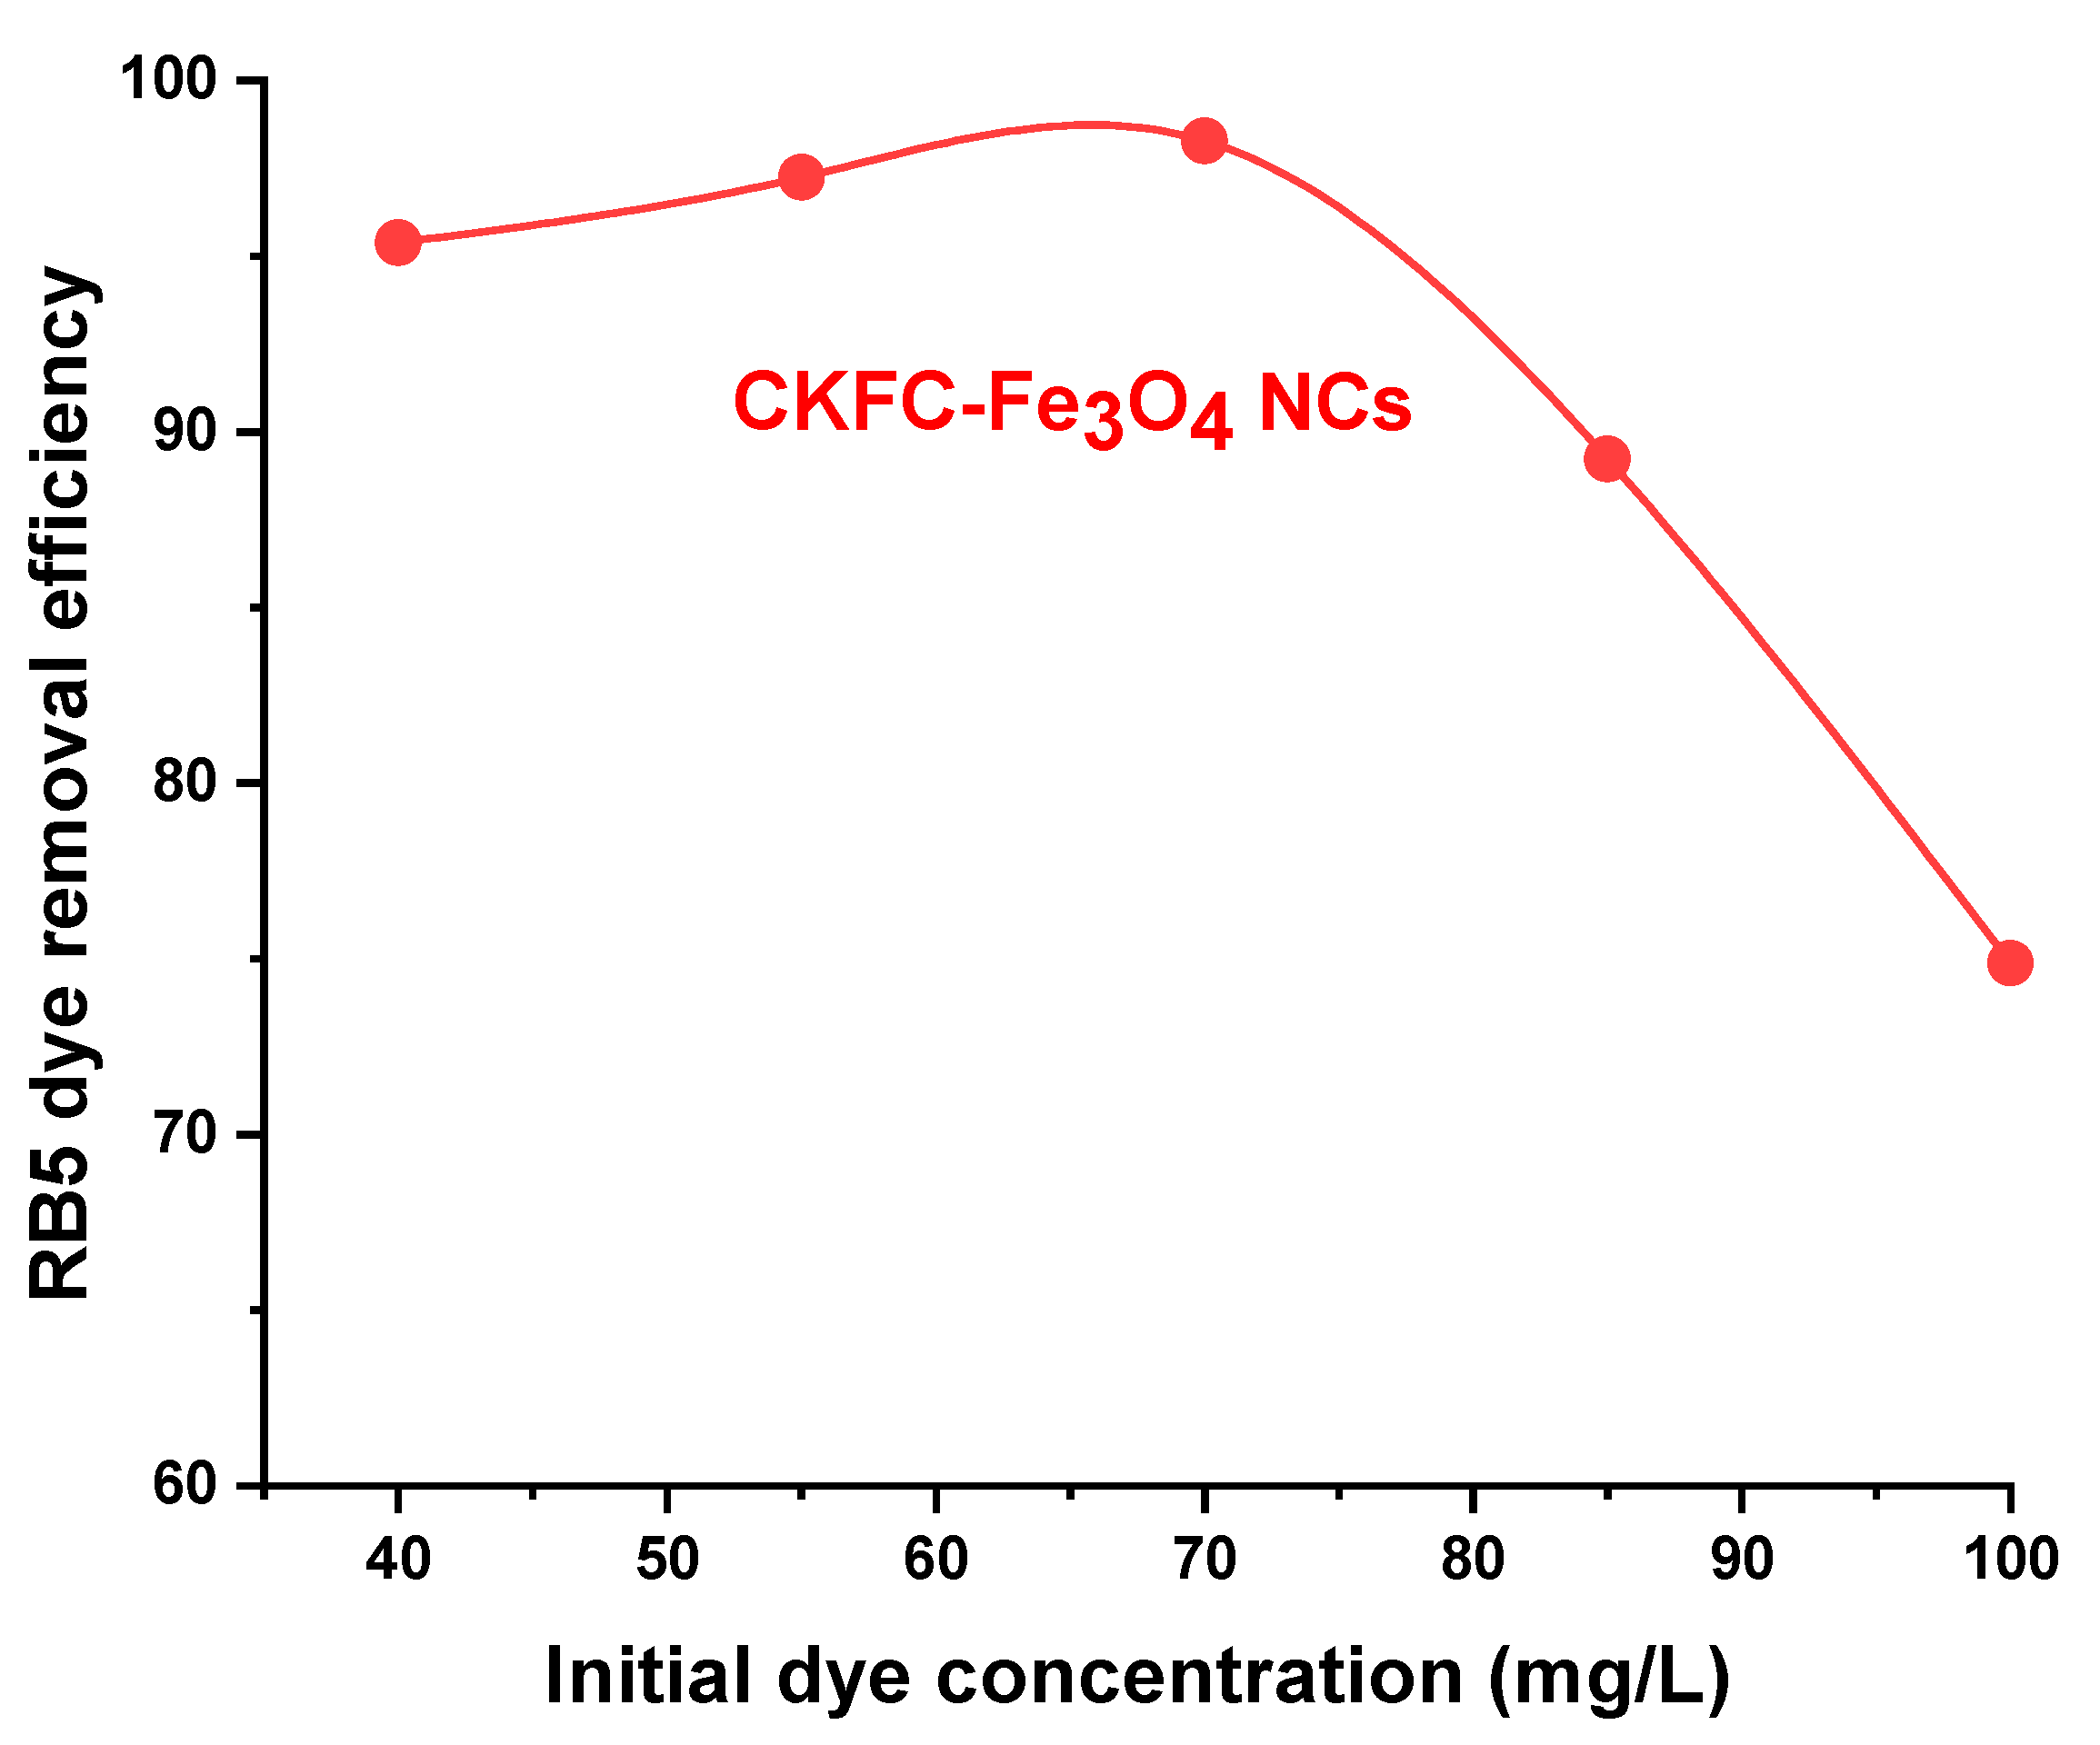
Figure 10.
(a) Normal probability plot, (b) Prediction vs. actual probability of RB5 removal percentage.
Figure 10.
(a) Normal probability plot, (b) Prediction vs. actual probability of RB5 removal percentage.
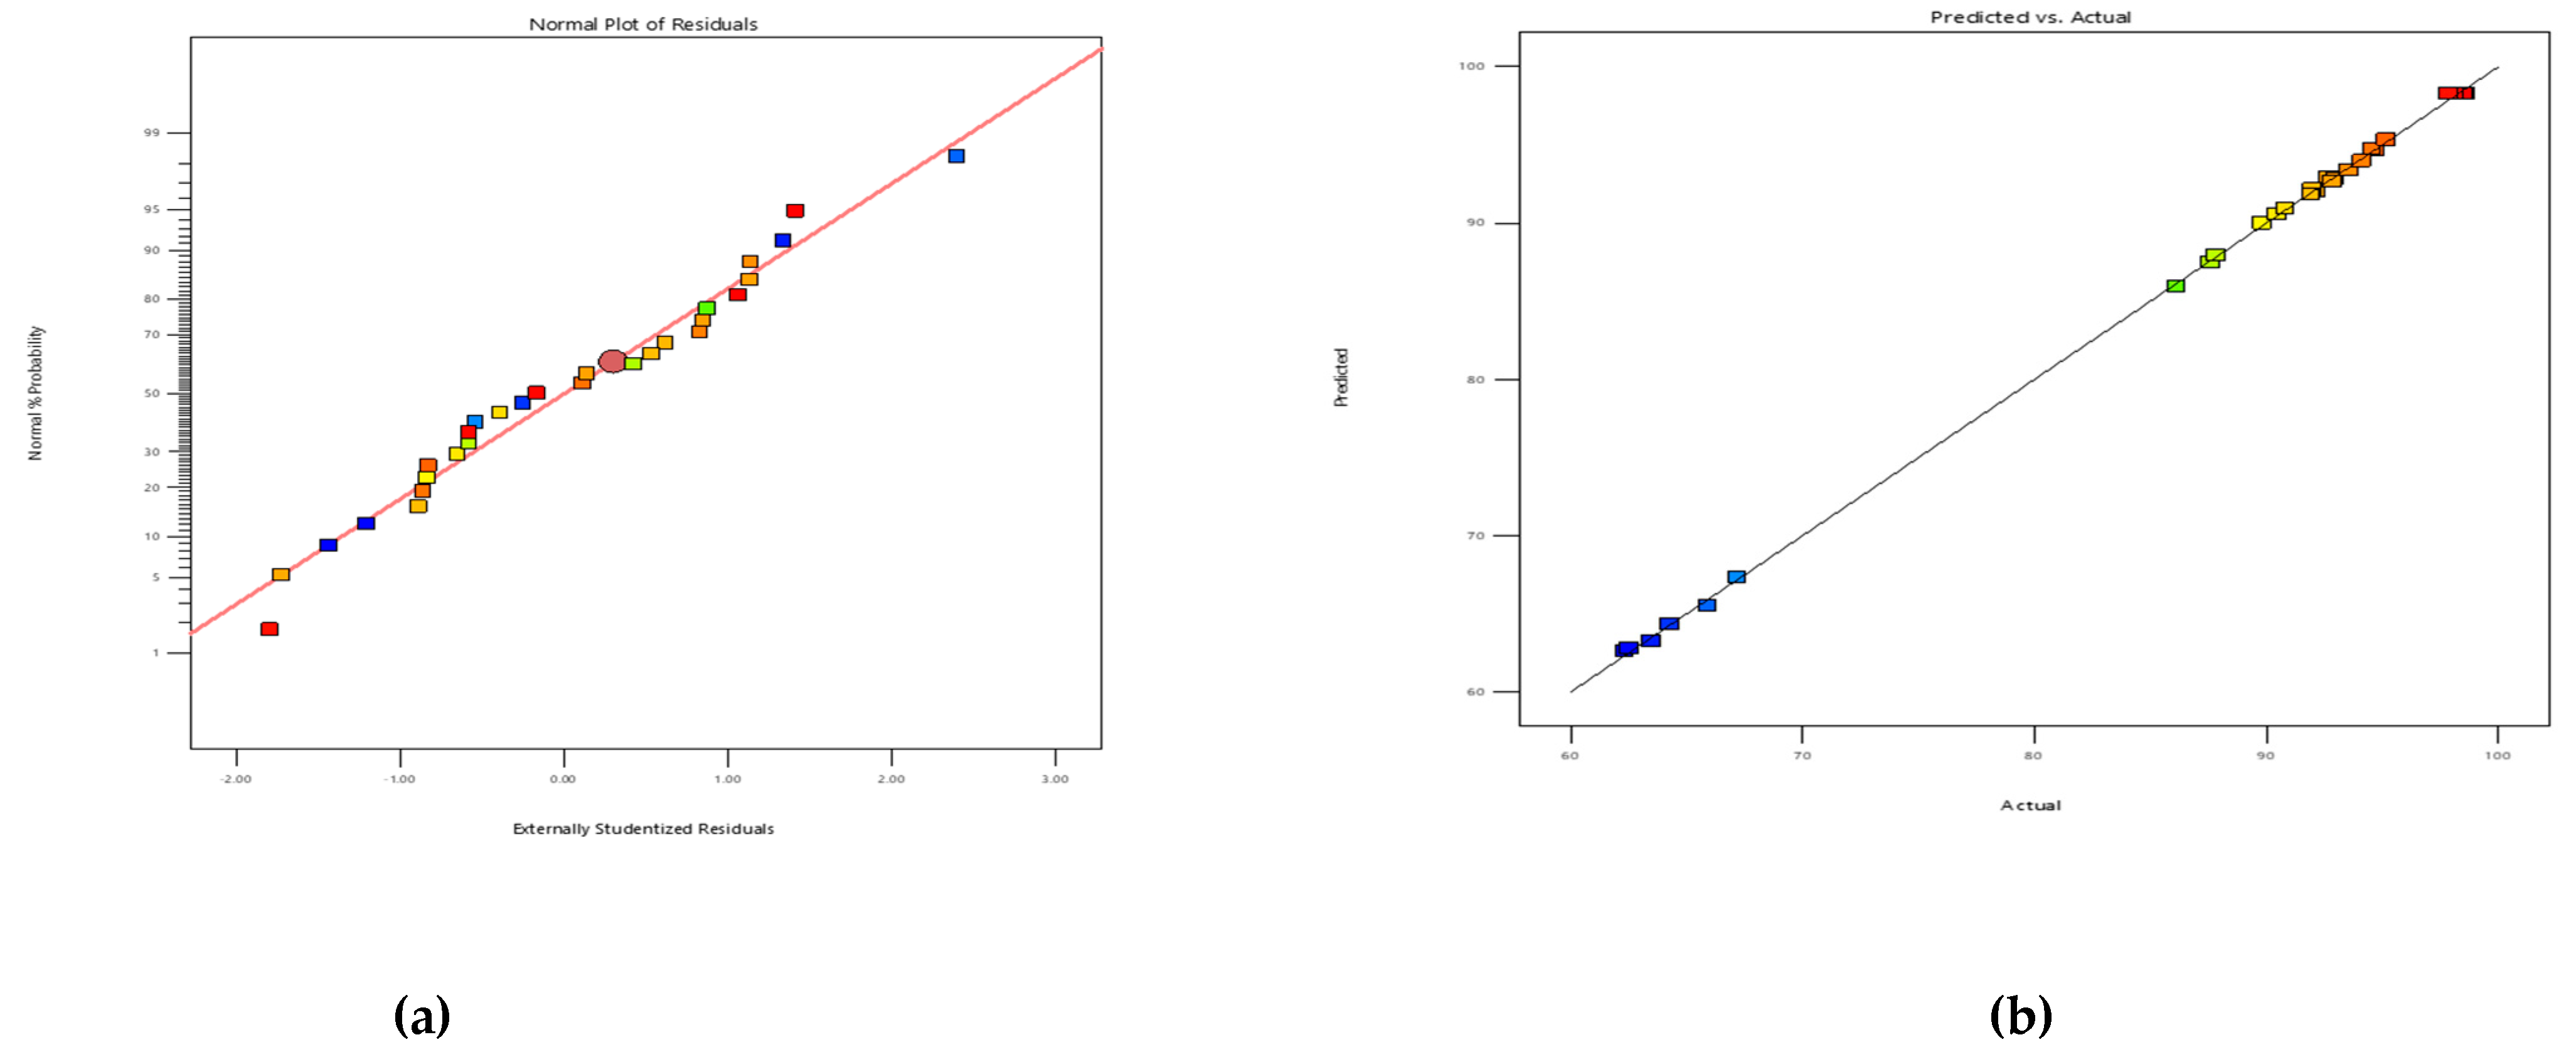
Figure 11.
Perturbation plot.
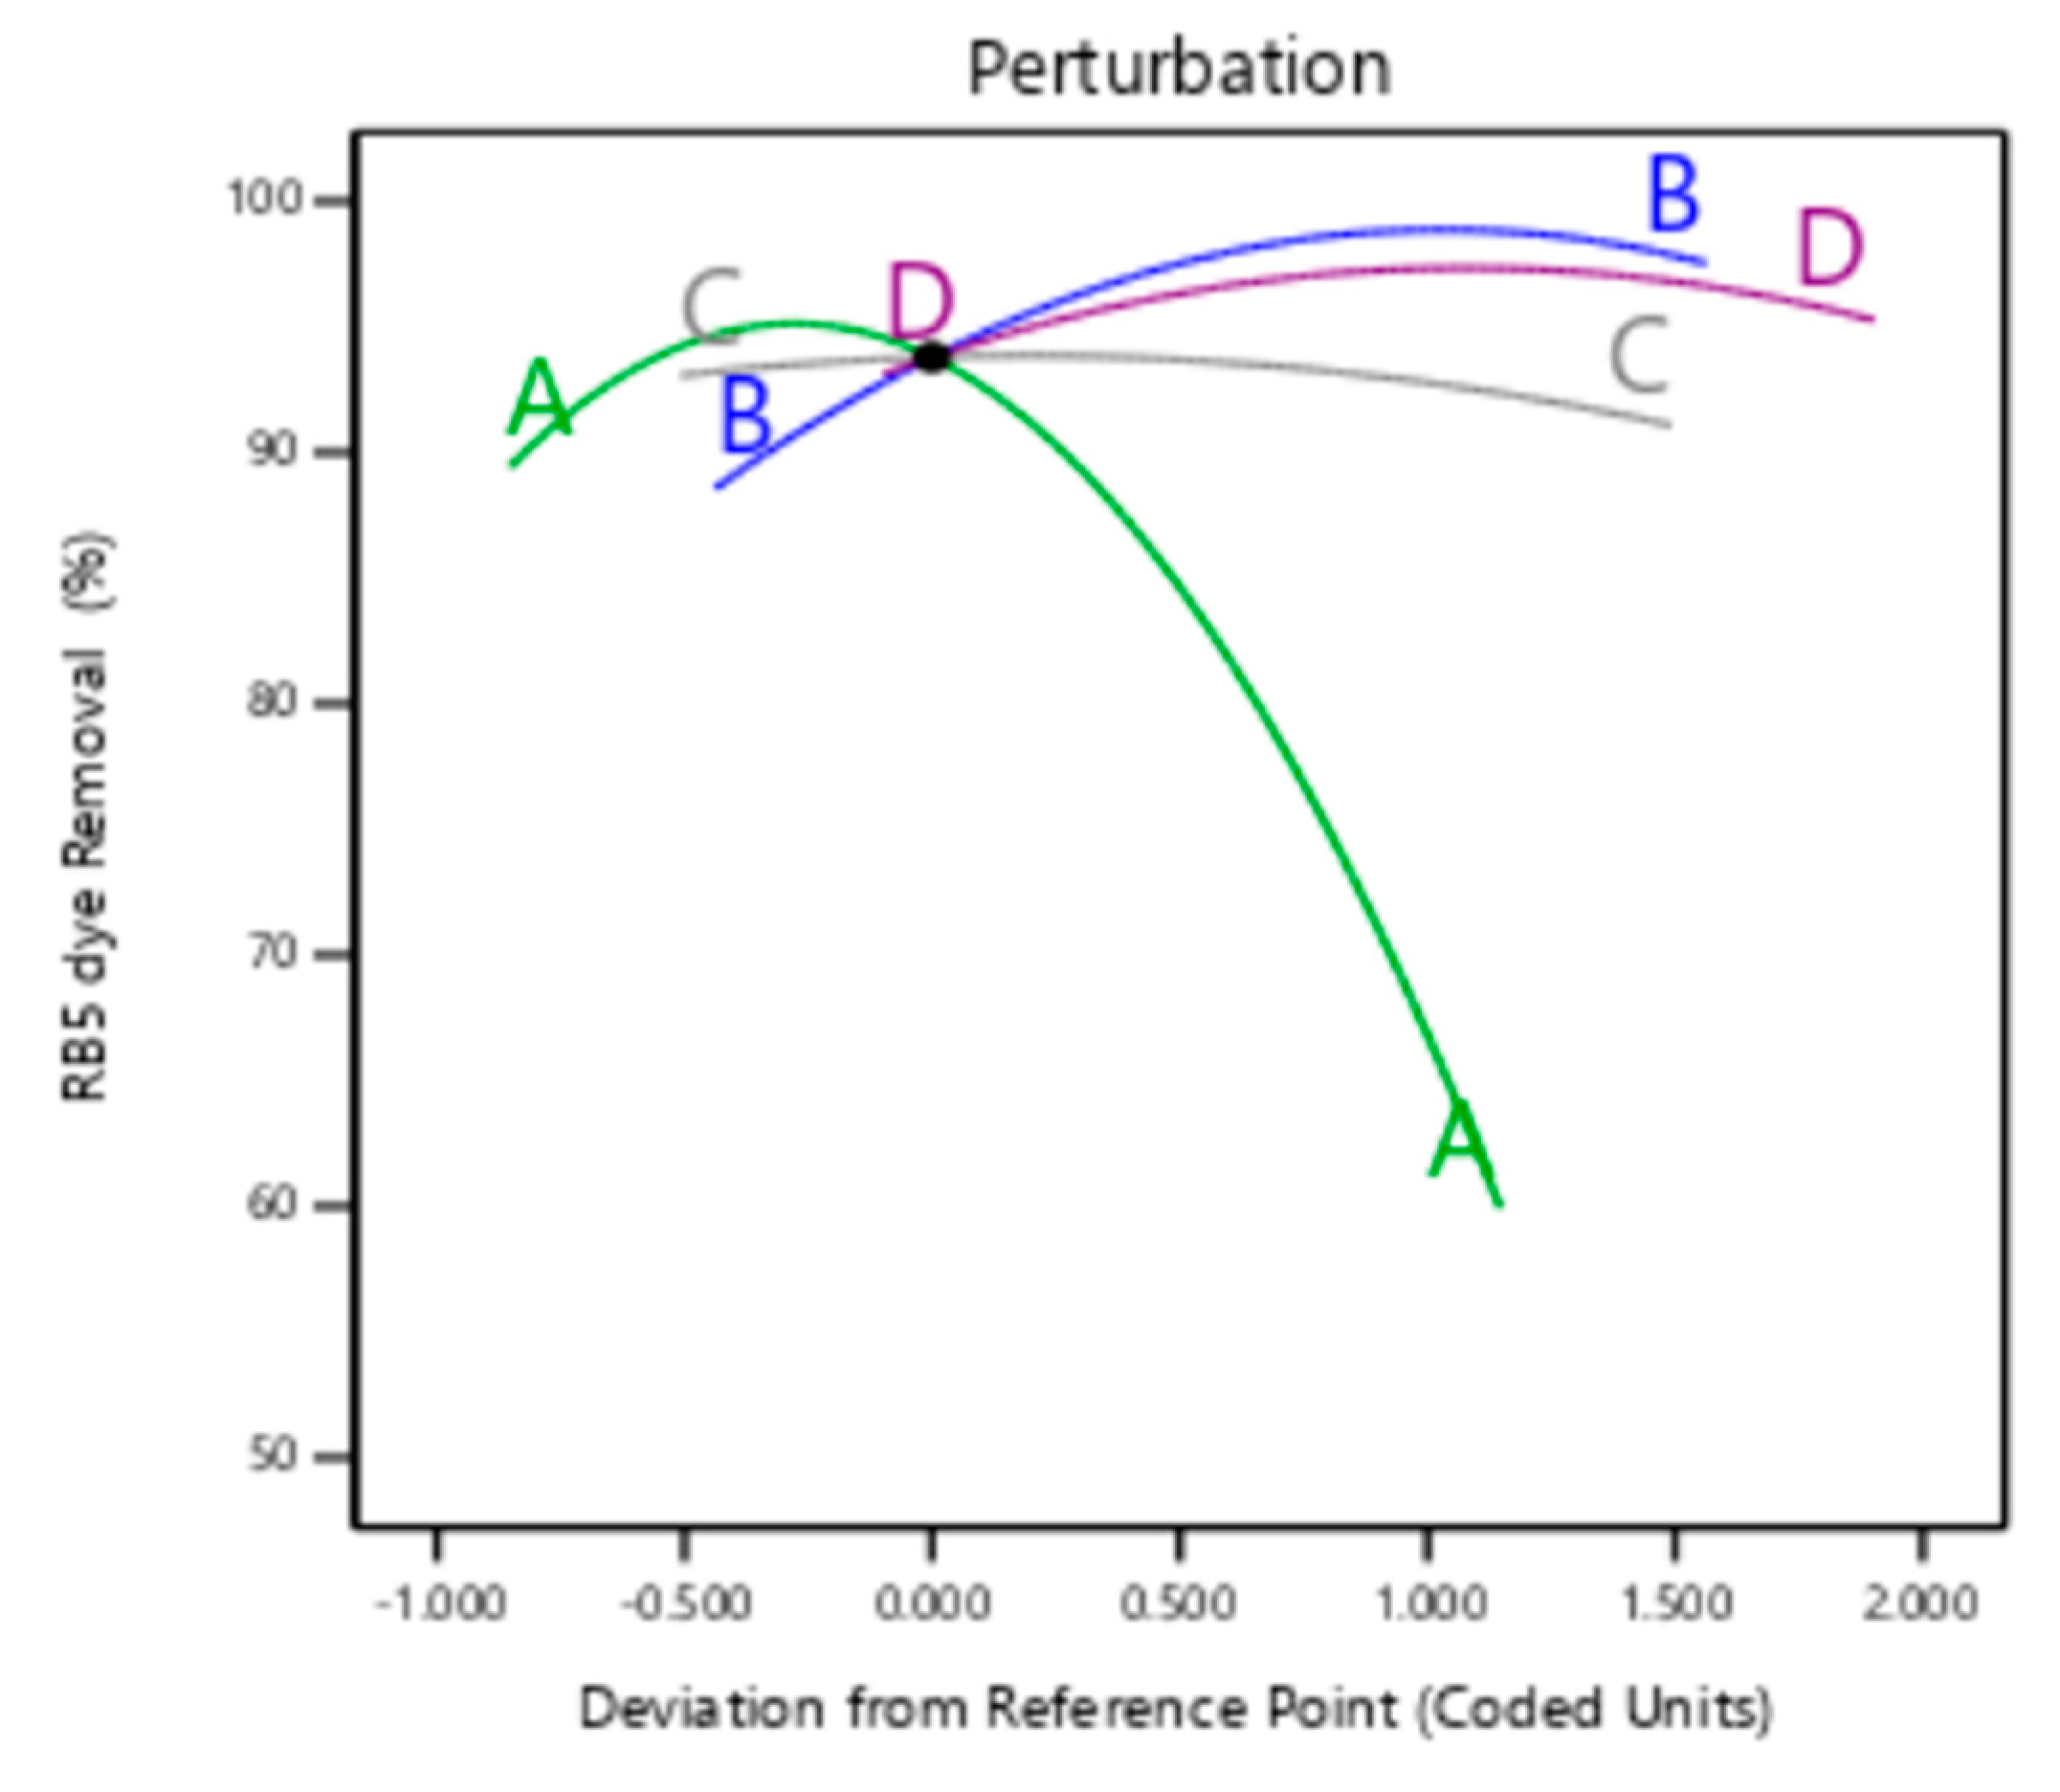
Figure 12.
Interaction effects of pH and adsorbent dose.
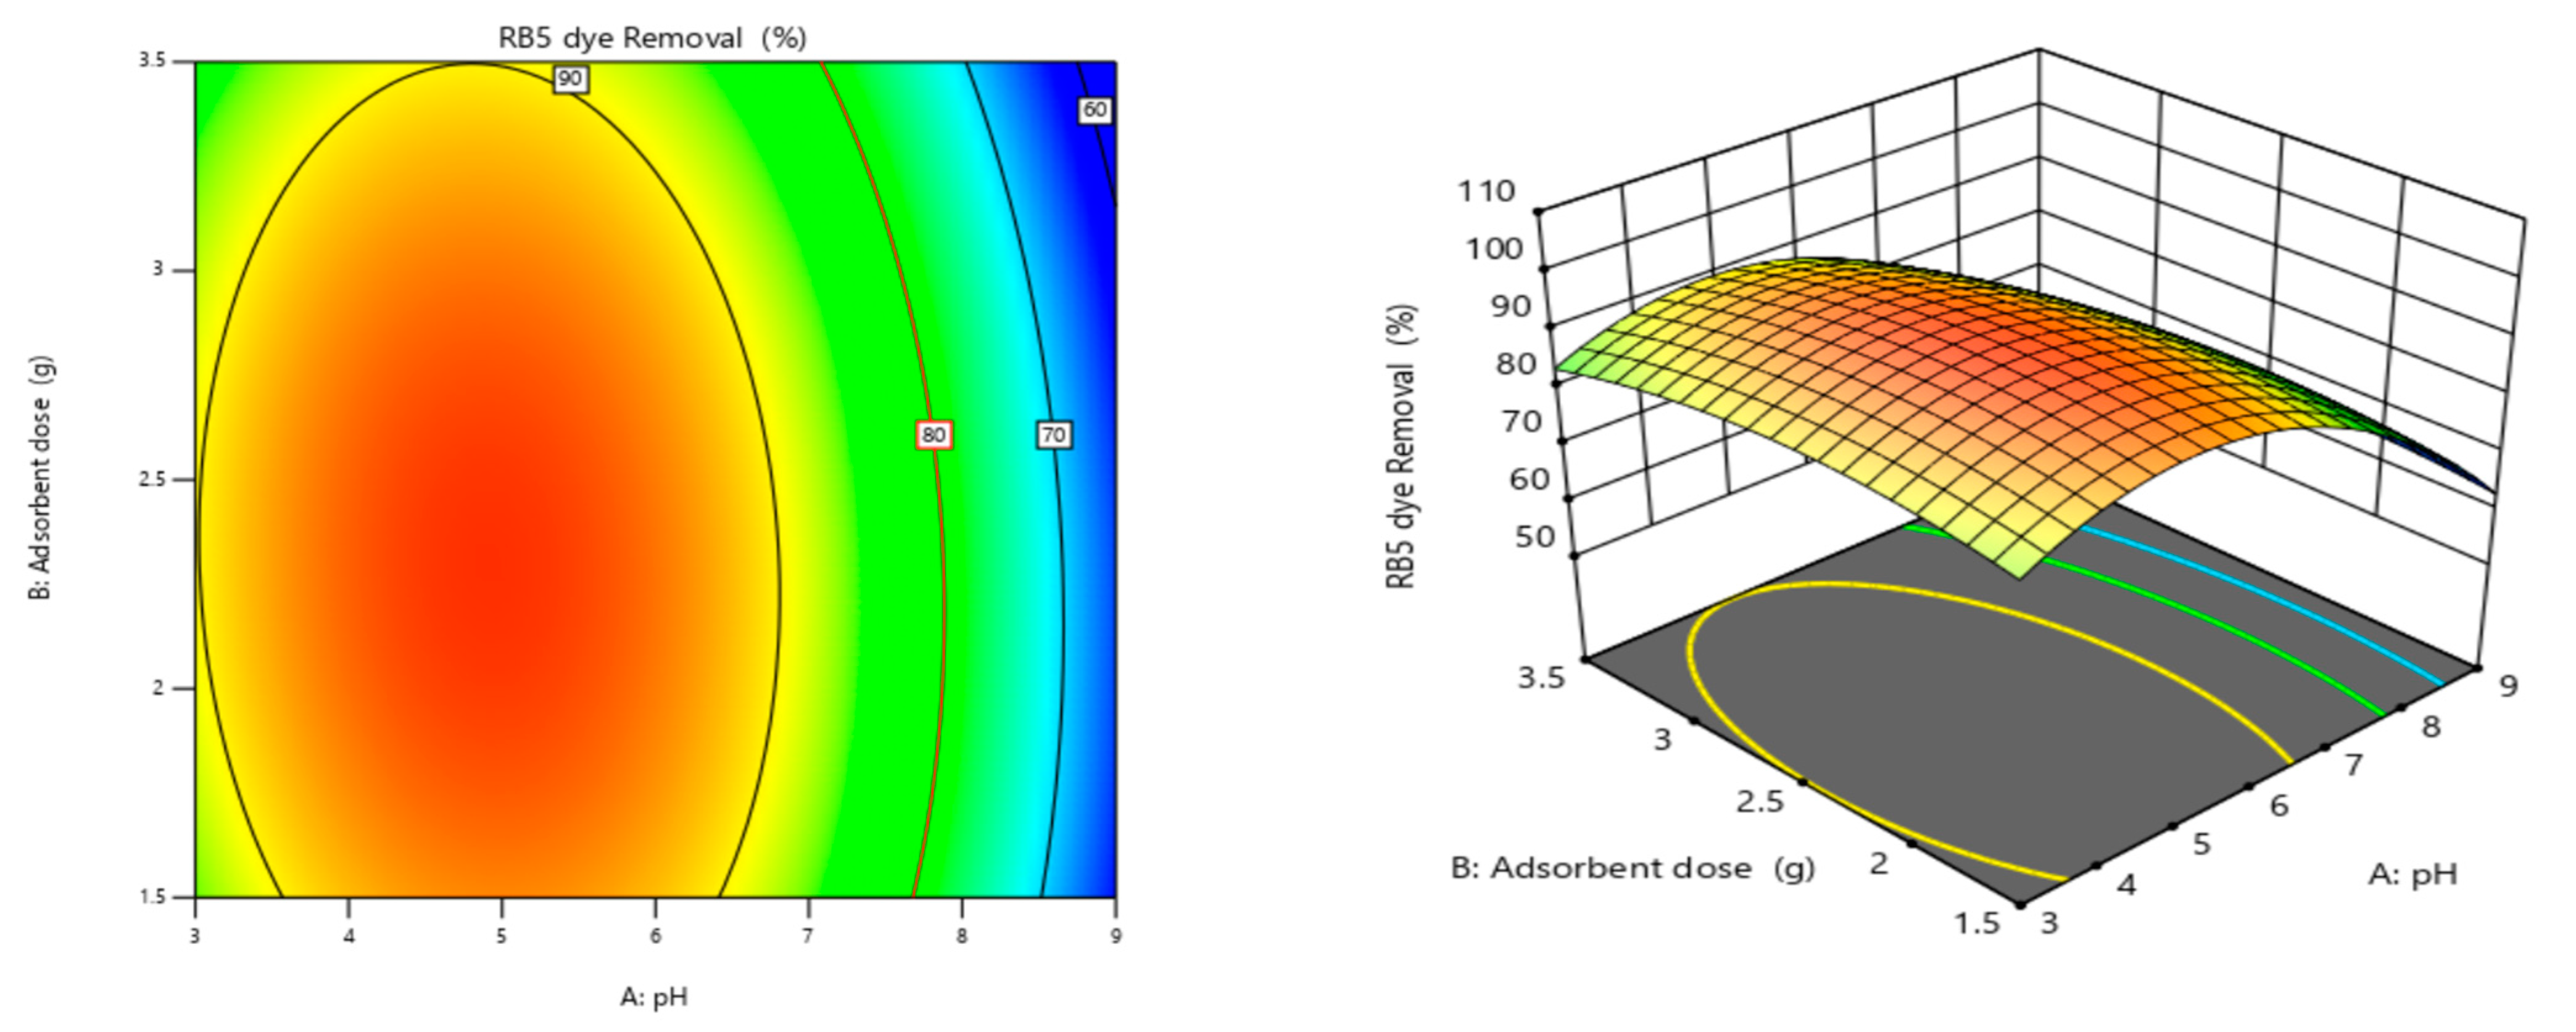
Figure 13.
Interaction effects of pH and contact time.
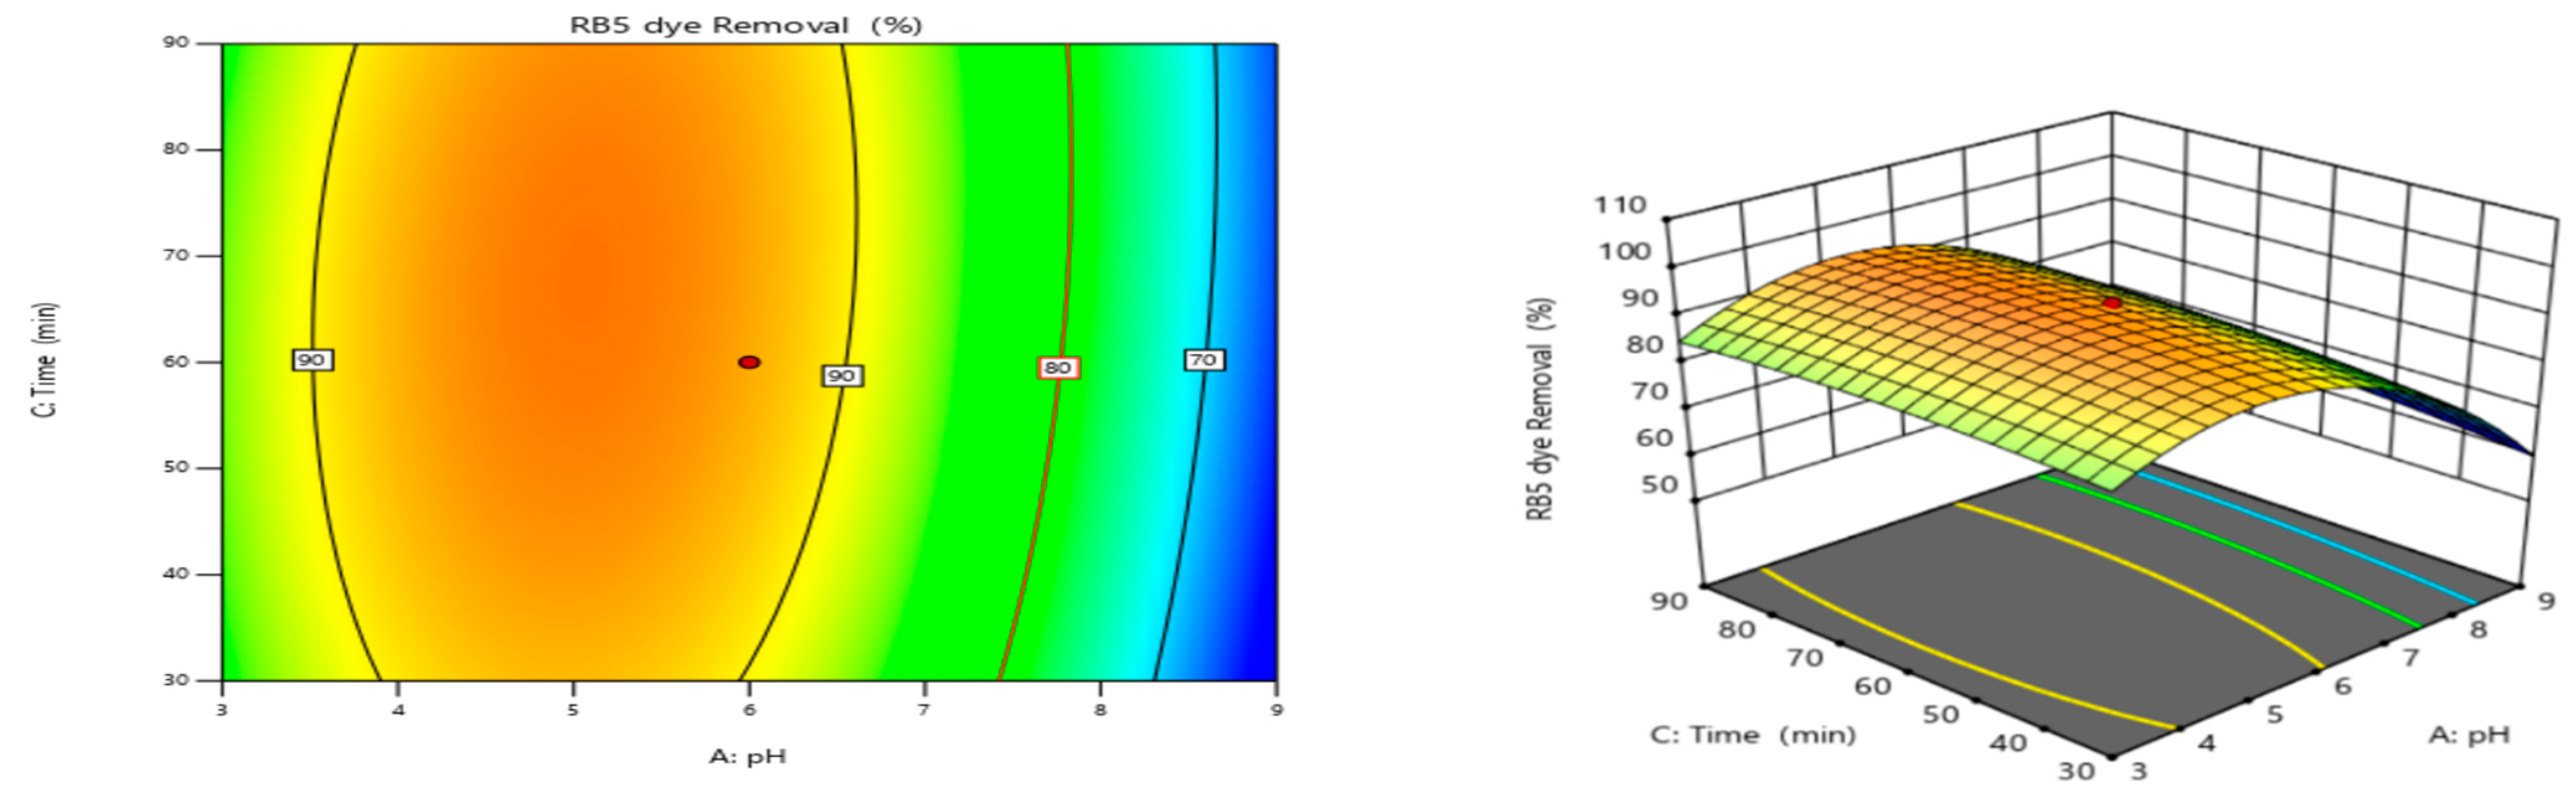
Figure 14.
Interaction effects of pH and initial RB5 concentration.
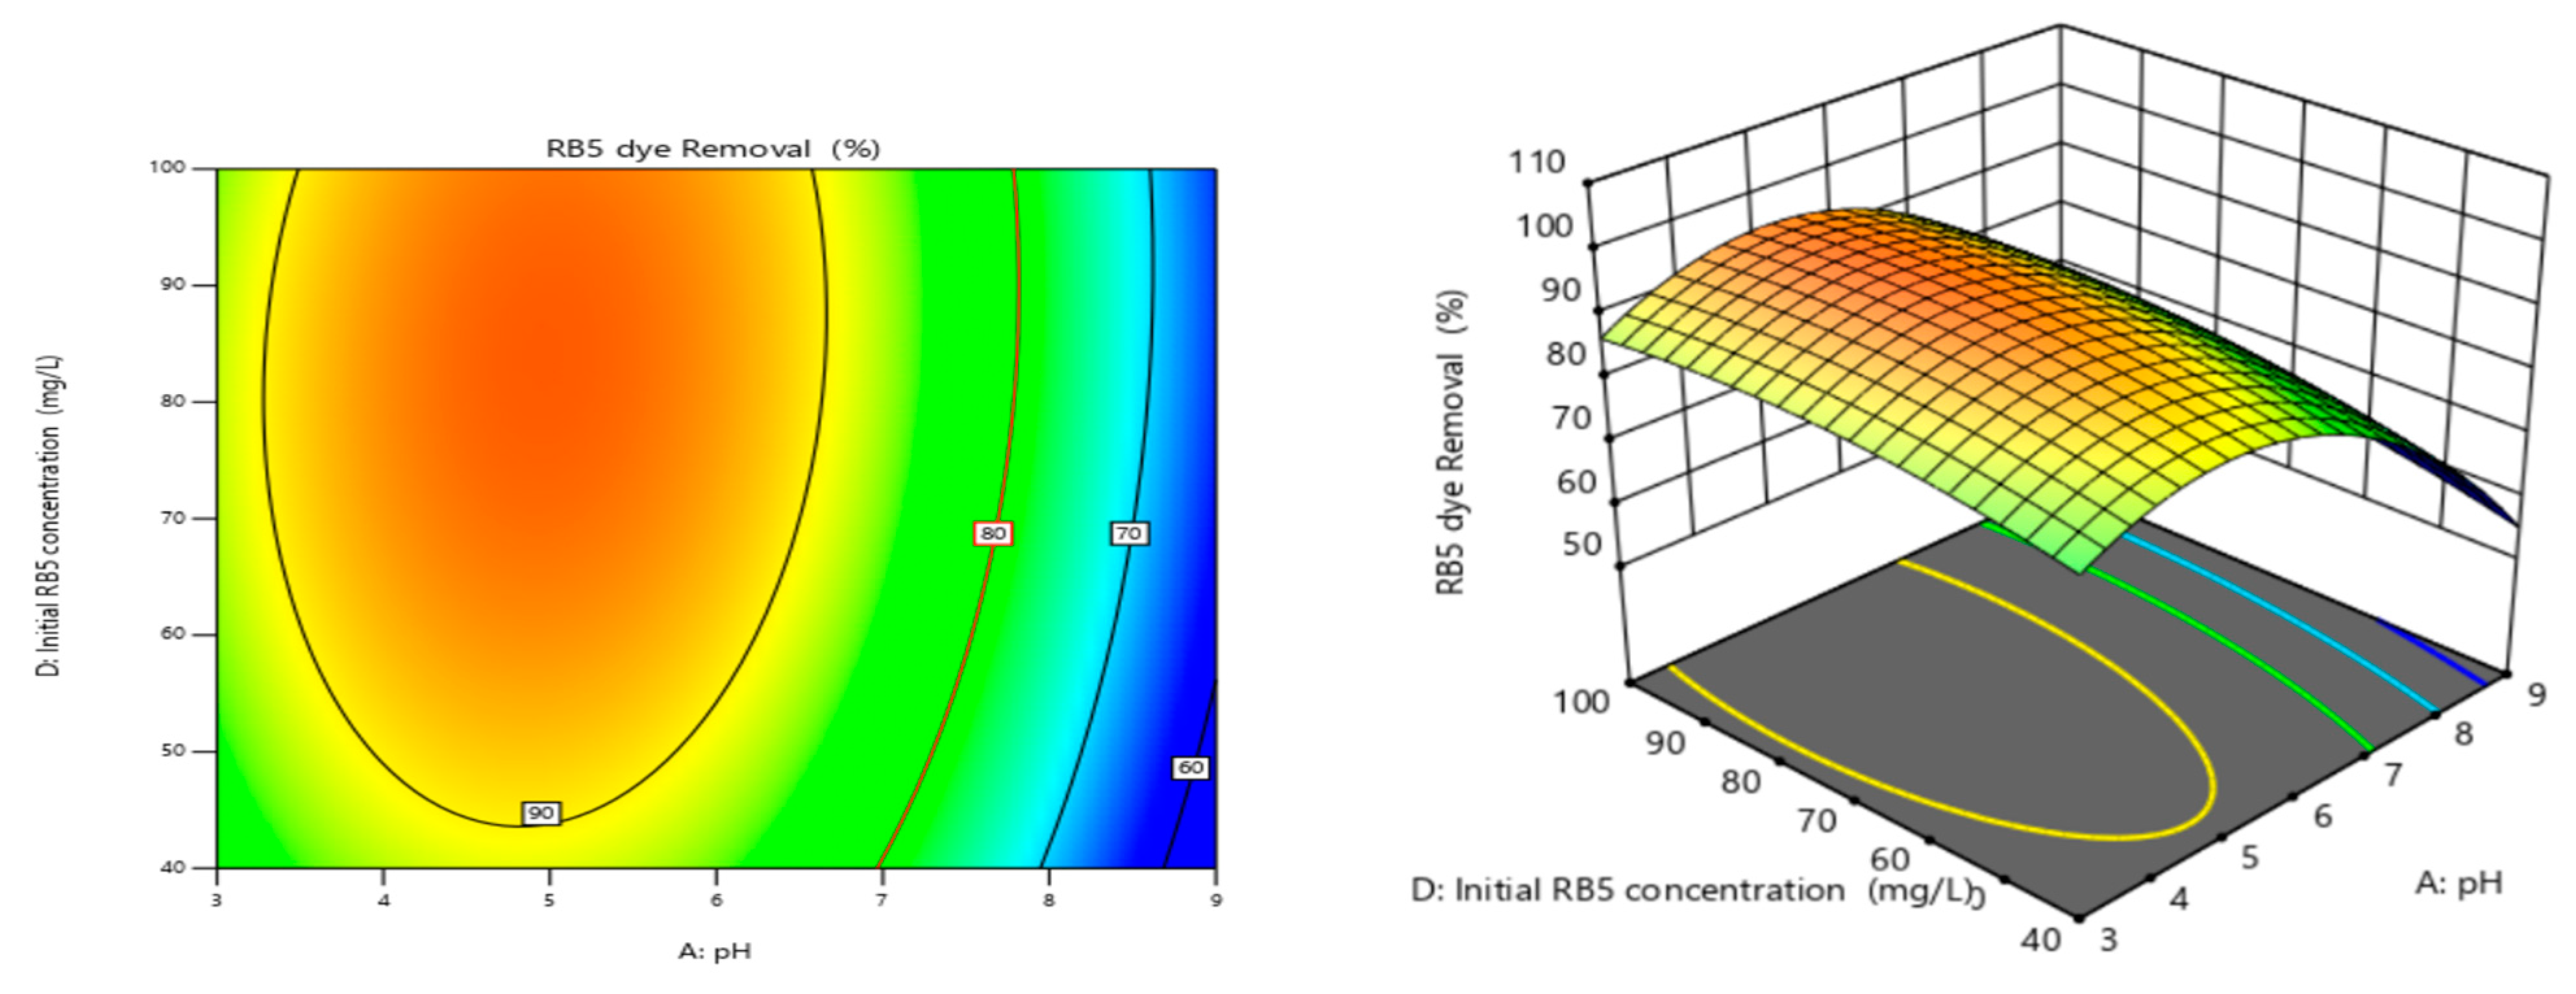
Figure 15.
Interaction effect of adsorbent dose and initial RB5 concentration.
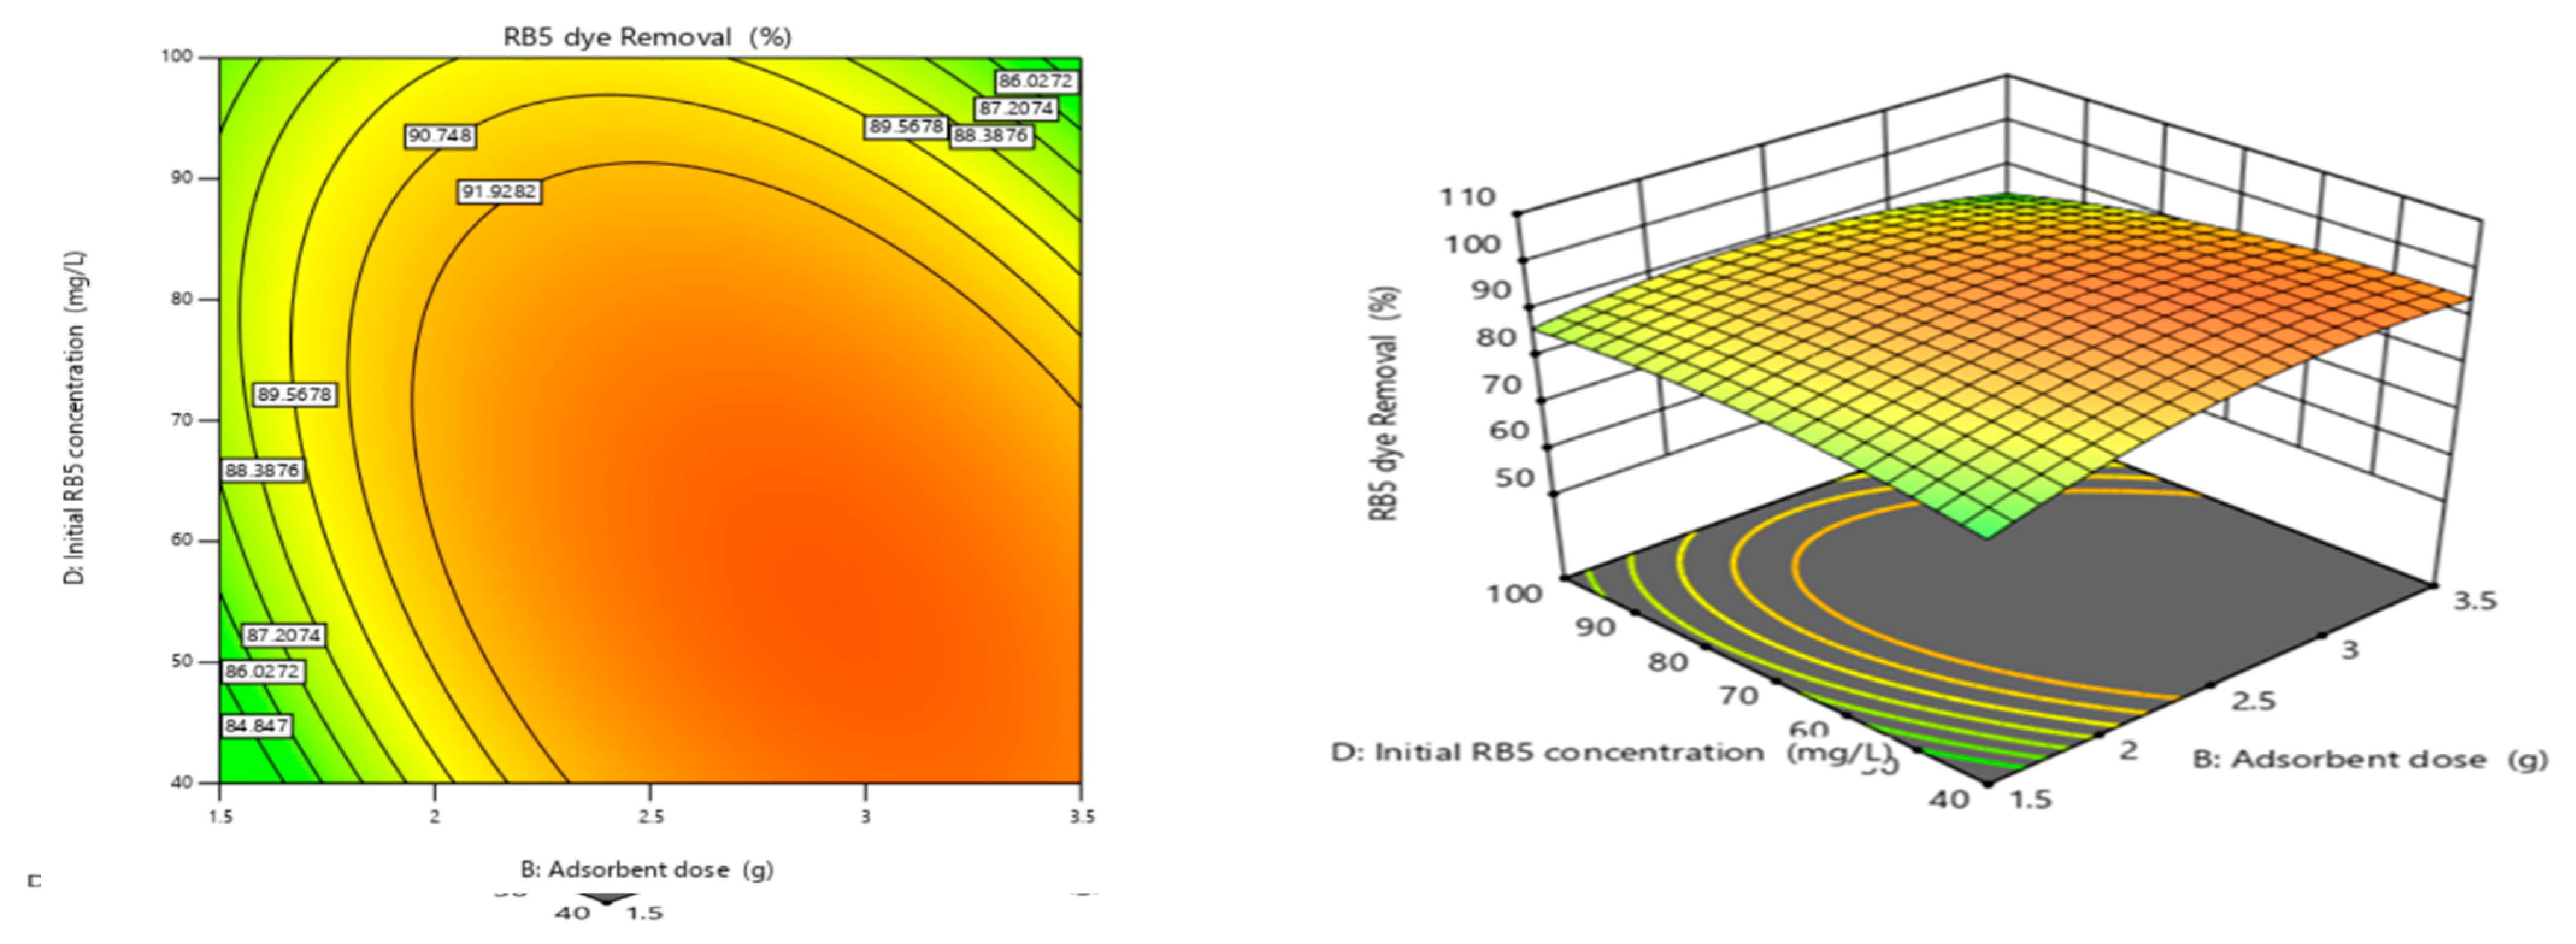
Figure 16.
Interaction effect of contact time and initial RB5 concentration.
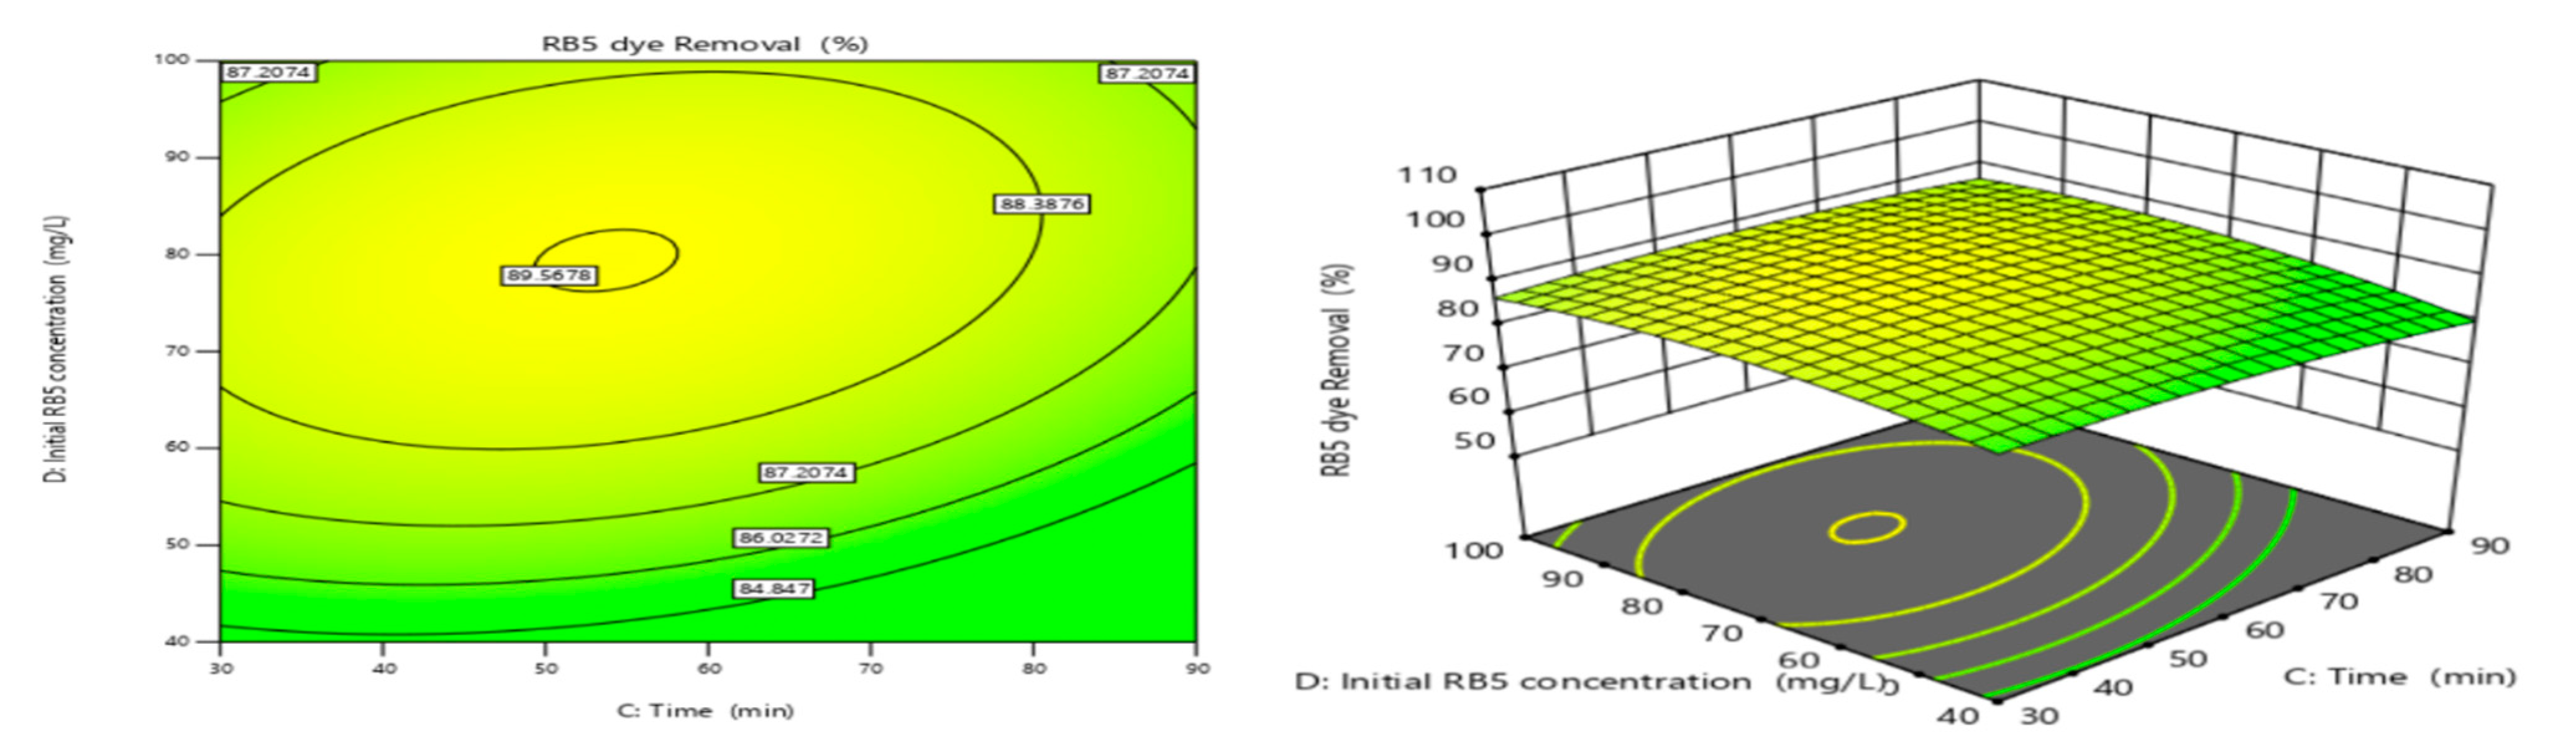
Figure 17.
The fitting of PFO (a) and PSO (b) kinetic models.
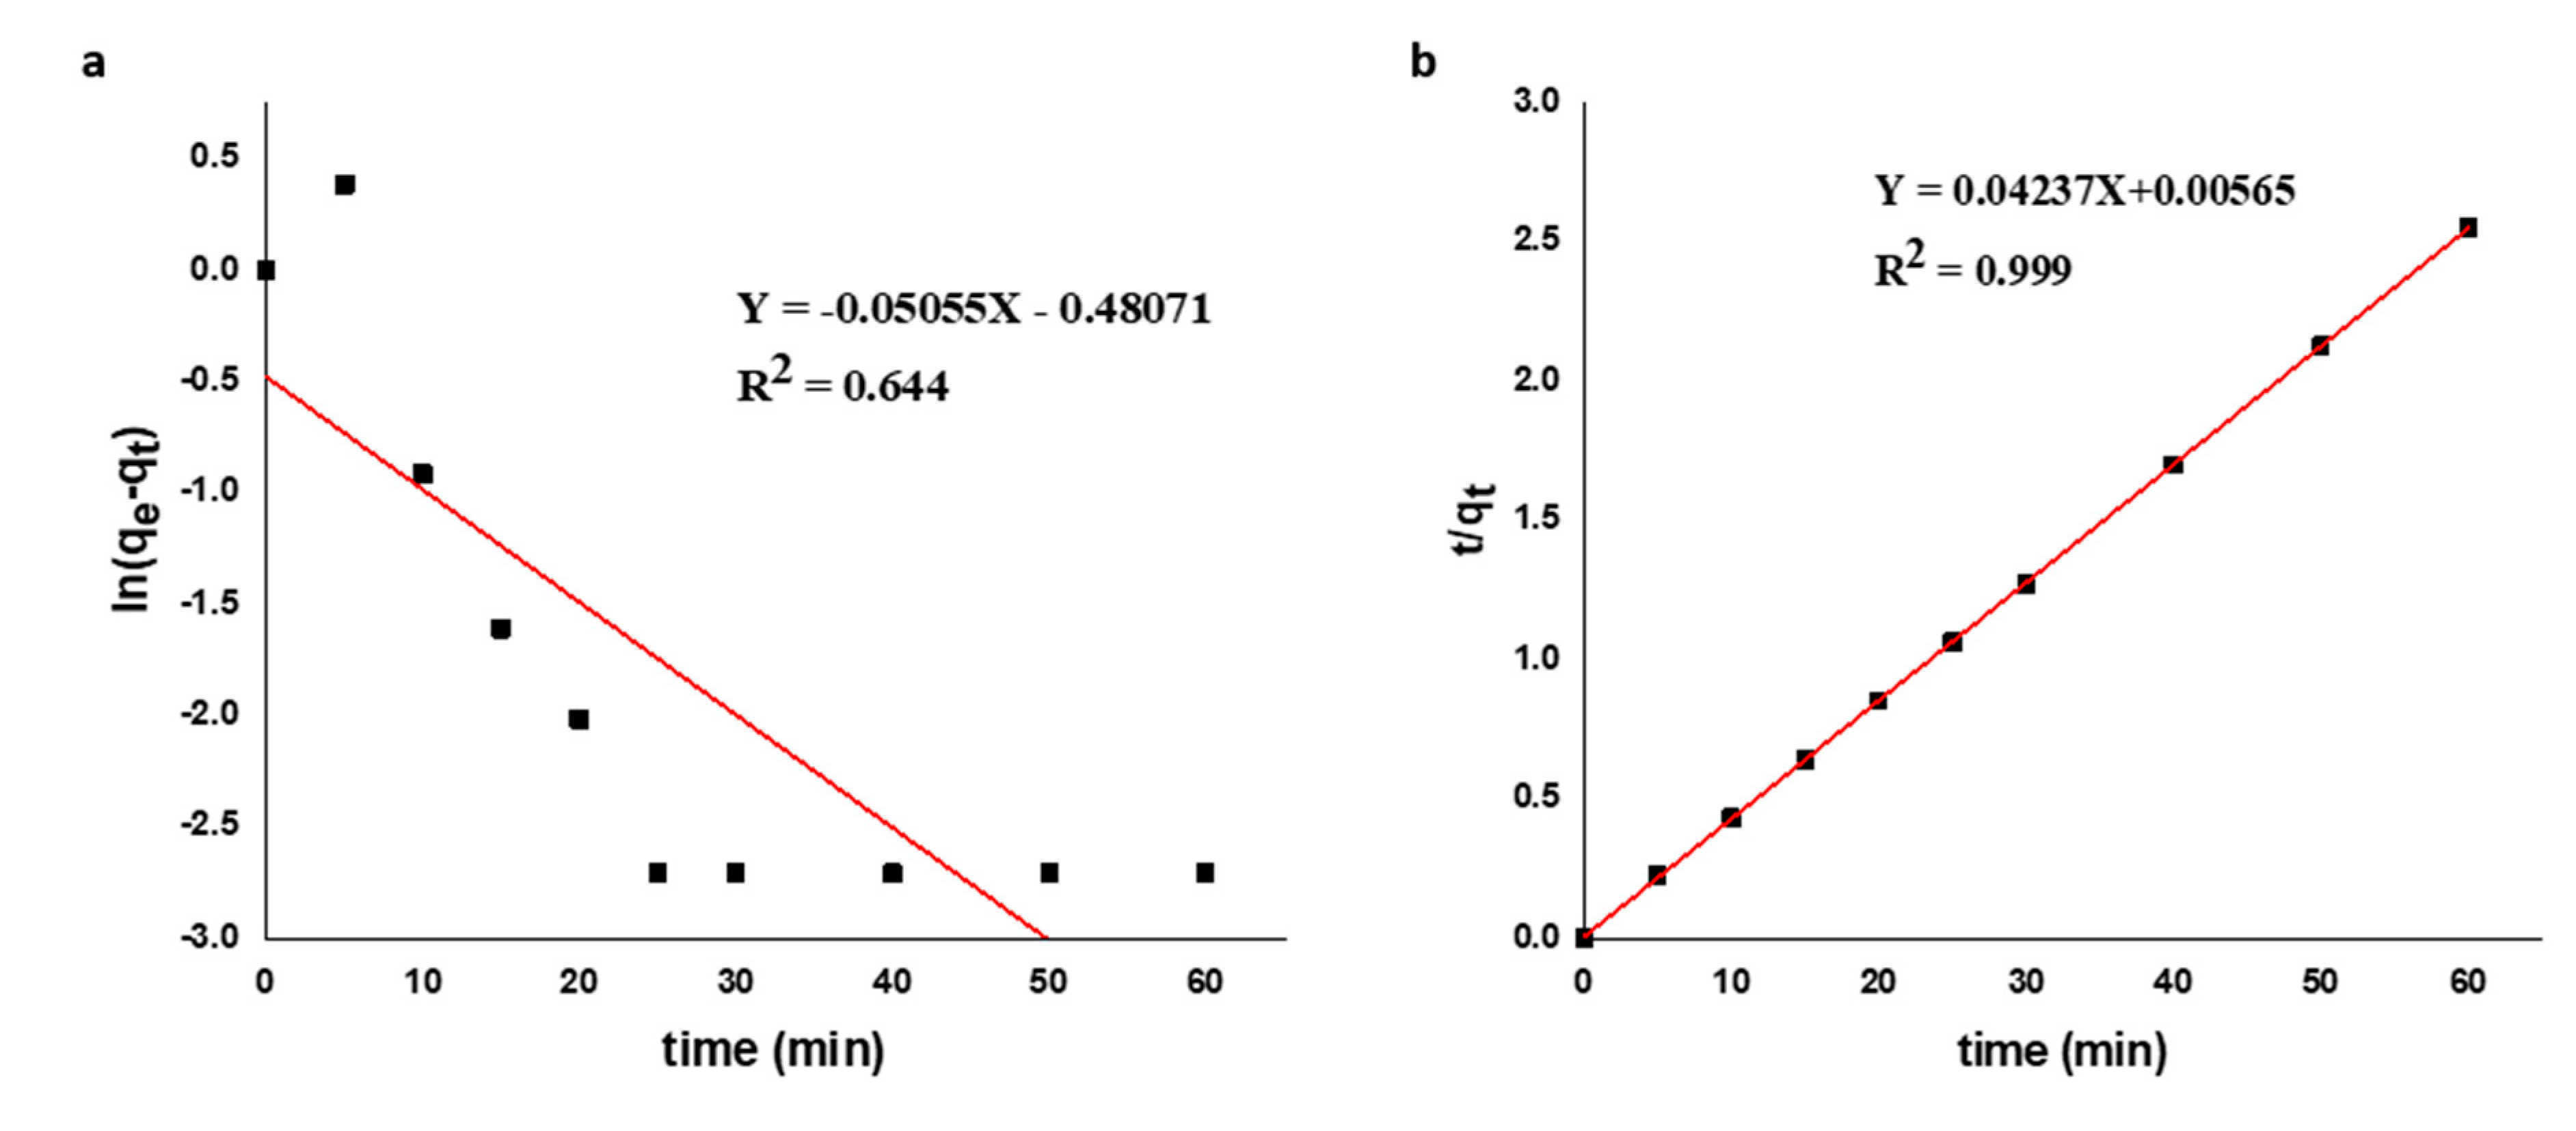
Figure 18.
Langmuir (a) and Freundlich’s (b) isotherms.
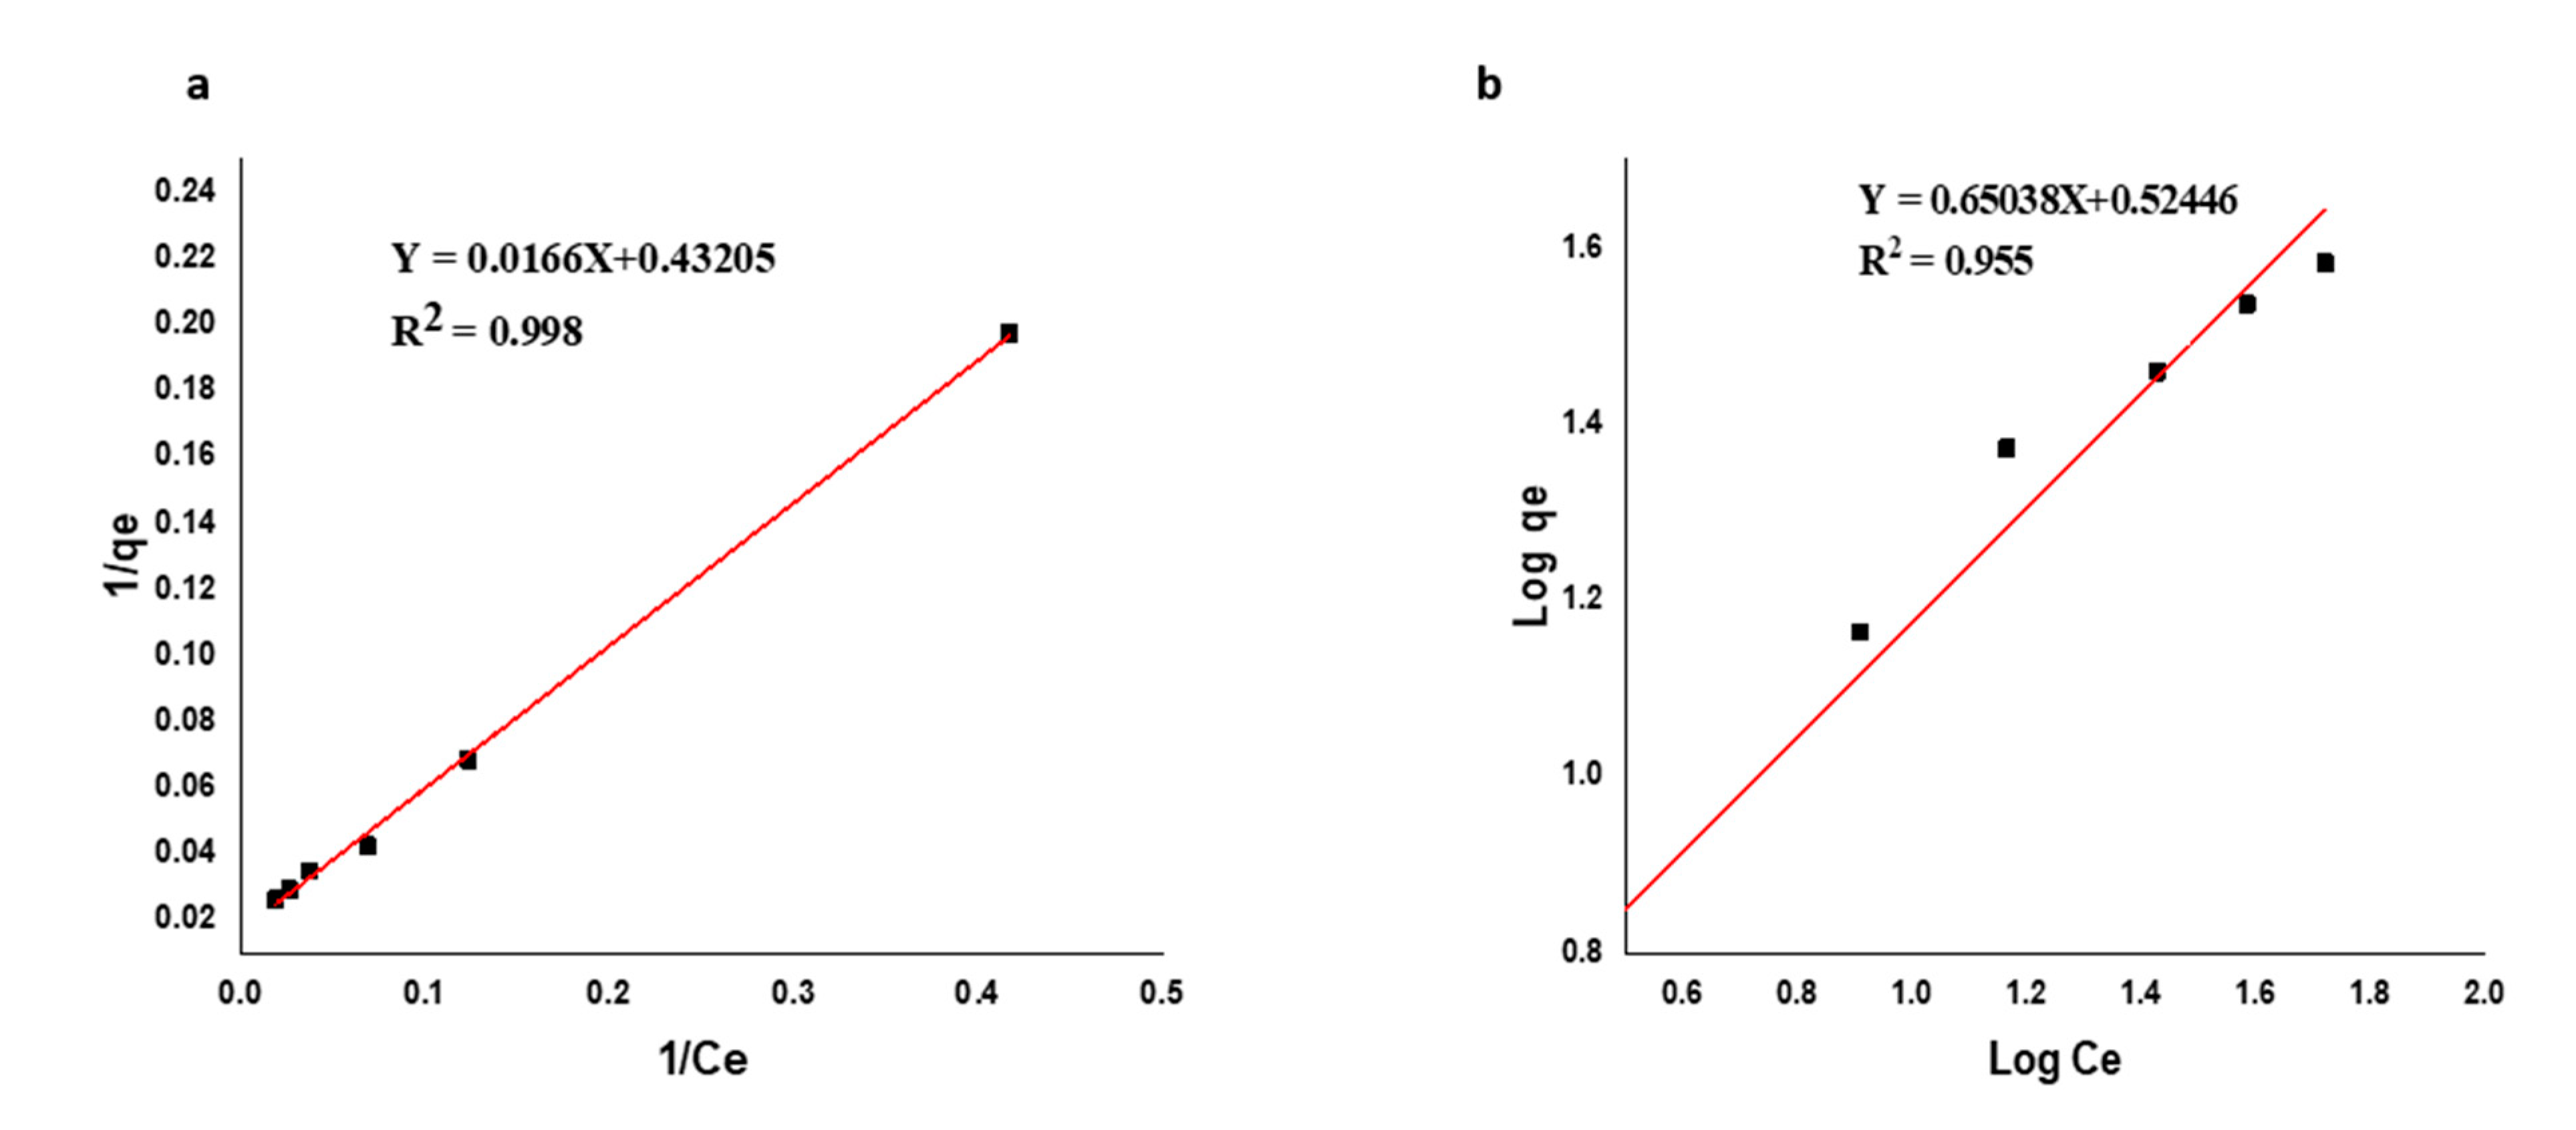
Figure 19.
Estimation of thermodynamic parameters for the Reactive Black 5 dye adsorption on the KFC-Fe3O4 composite.
Figure 19.
Estimation of thermodynamic parameters for the Reactive Black 5 dye adsorption on the KFC-Fe3O4 composite.
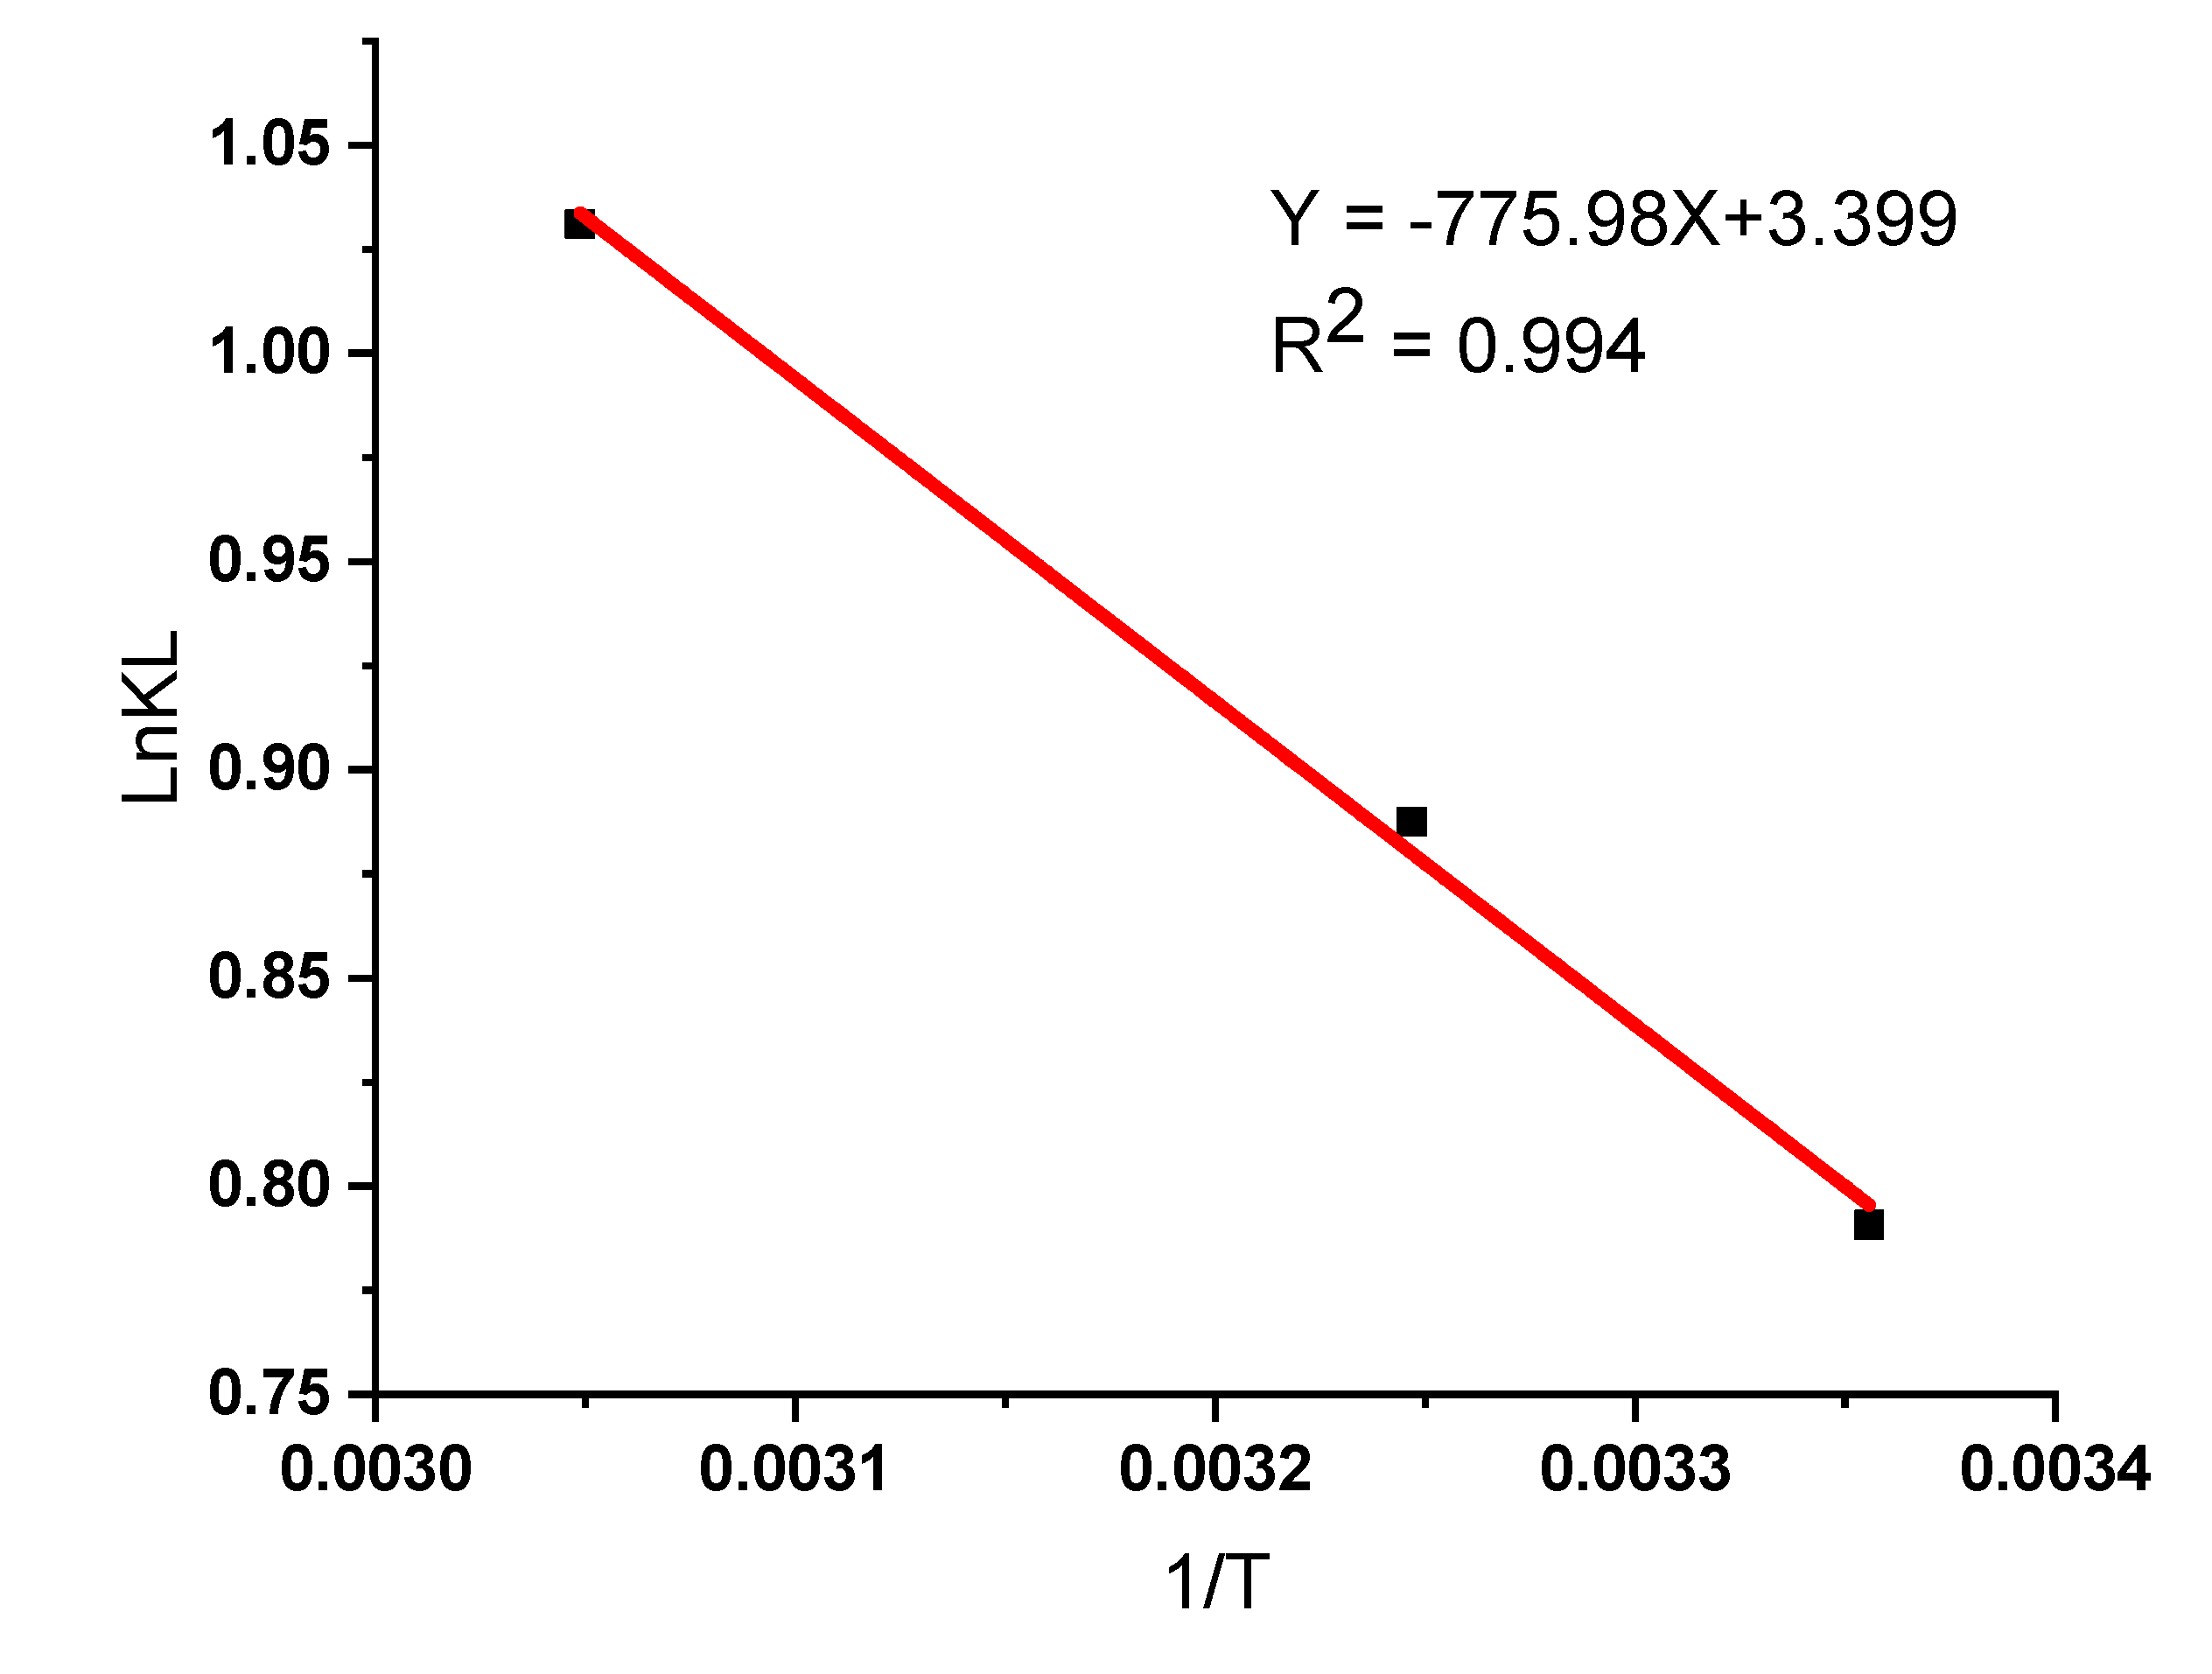
Figure 20.
RB5 removal (%) with KFC-Fe3O4 Adsorbent as a function of regeneration cycles.
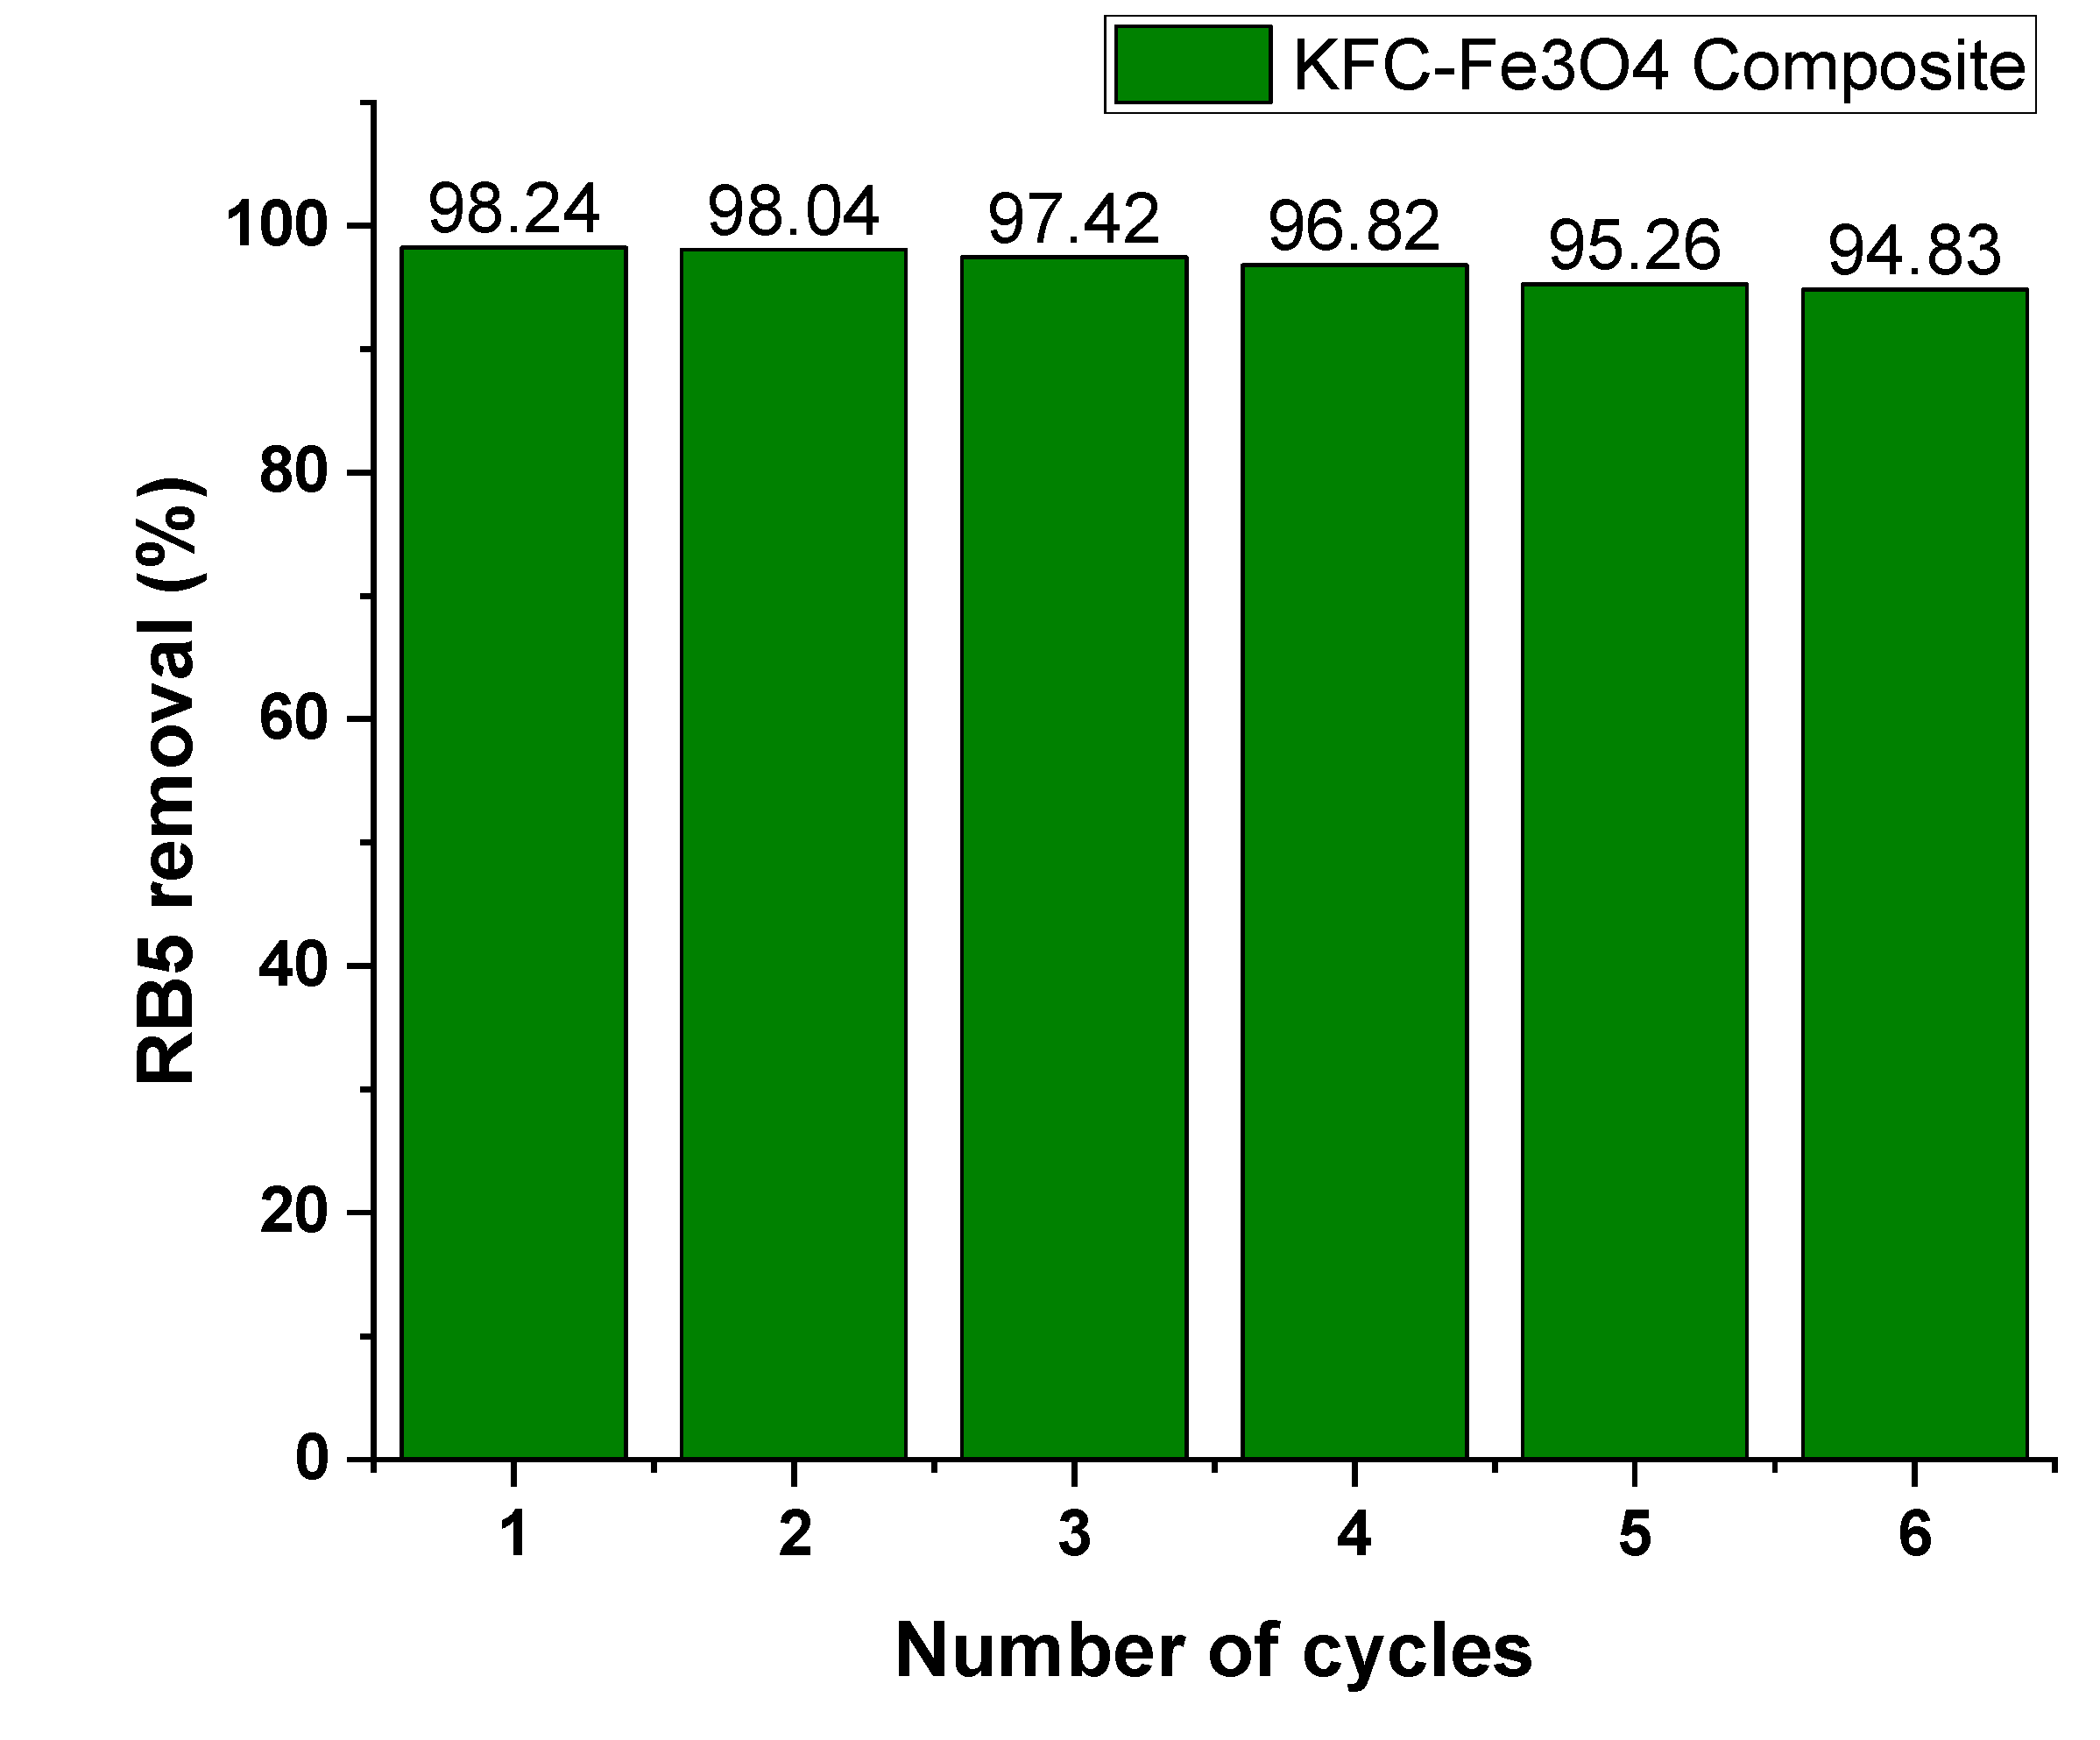

Table 1.
Codes and actual variables and their levels in BBD.
| Codes | Variables | Low (- 1) | Center (0) | High (+1) |
| A | pH | 3 | 6 | 9 |
| B | Adsorbent dose (g) | 1.5 | 2.5 | 3.5 |
| C | Contact time (min) | 40 | 60 | 80 |
| D | Initial dye concentration (mg/L) | 30 | 70 | 100 |
Table 2.
Experimental matrix based on BBD approach for designing experiments and corresponding quadratic model response .
Table 2.
Experimental matrix based on BBD approach for designing experiments and corresponding quadratic model response .
| Run | A: pH | B: Adsorbent dose (g) | C: Time (min) | D: Initial RB5 concentration (mg/l) | RB5 Removal (%) | Predicted RB5 Removal (%) |
| 1 | 6 | 3.5 | 30 | 70 | 92.97 | 92.81 |
| 2 | 3 | 3.5 | 60 | 70 | 92.13 | 92.01 |
| 3 | 6 | 1.5 | 60 | 40 | 86.12 | 85.95 |
| 4 | 9 | 2.5 | 30 | 70 | 64.26 | 64.31 |
| 5 | 6 | 2.5 | 60 | 70 | 98.56 | 98.28 |
| 6 | 6 | 3.5 | 90 | 70 | 93.56 | 93.35 |
| 7 | 6 | 2.5 | 90 | 100 | 94.58 | 94.74 |
| 8 | 6 | 1.5 | 90 | 70 | 90.82 | 90.90 |
| 9 | 3 | 1.5 | 60 | 70 | 87.58 | 87.50 |
| 10 | 9 | 2.5 | 60 | 100 | 65.89 | 65.50 |
| 11 | 6 | 1.5 | 30 | 70 | 90.45 | 90.58 |
| 12 | 6 | 2.5 | 60 | 70 | 98.13 | 98.28 |
| 13 | 3 | 2.5 | 60 | 40 | 92.64 | 92.94 |
| 14 | 9 | 1.5 | 60 | 70 | 62.31 | 62.57 |
| 15 | 3 | 2.5 | 30 | 70 | 94.12 | 93.96 |
| 16 | 6 | 2.5 | 30 | 40 | 94.68 | 94.66 |
| 17 | 6 | 1.5 | 60 | 100 | 92.85 | 92.64 |
| 18 | 9 | 2.5 | 90 | 70 | 67.19 | 67.29 |
| 19 | 6 | 3.5 | 60 | 40 | 95.17 | 95.33 |
| 20 | 3 | 2.5 | 60 | 100 | 89.82 | 89.98 |
| 21 | 9 | 2.5 | 60 | 40 | 63.47 | 63.23 |
| 22 | 6 | 2.5 | 60 | 70 | 98.24 | 98.28 |
| 23 | 3 | 2.5 | 90 | 70 | 91.94 | 91.84 |
| 24 | 6 | 2.5 | 30 | 100 | 91.97 | 92.14 |
| 25 | 6 | 2.5 | 90 | 40 | 92.94 | 92.91 |
| 26 | 6 | 2.5 | 60 | 70 | 97.85 | 98.28 |
| 27 | 9 | 3.5 | 60 | 70 | 62.52 | 62.74 |
| 28 | 6 | 3.5 | 60 | 100 | 87.84 | 87.95 |
| 29 | 6 | 2.5 | 60 | 70 | 98.64 | 98.28 |
Table 3.
ANOVA for Quadratic model.
| Source | Sum of Squares | df | Mean Square | F-value | p-value | |
| Model | 4277.79 | 14 | 305.56 | 3593.69 | < 0.0001 | significant |
| A-pH | 2202.96 | 1 | 2202.96 | 25909.29 | < 0.0001 | |
| B-Adsorbent dose | 16.47 | 1 | 16.47 | 193.75 | < 0.0001 | |
| C-Time | 0.5547 | 1 | 0.5547 | 6.52 | 0.0229 | |
| D-Initial RB5 concentration | 0.3571 | 1 | 0.3571 | 4.20 | 0.0597 | |
| AB | 4.71 | 1 | 4.71 | 55.38 | < 0.0001 | |
| AC | 6.53 | 1 | 6.53 | 76.78 | < 0.0001 | |
| AD | 6.86 | 1 | 6.86 | 80.73 | < 0.0001 | |
| BC | 0.0121 | 1 | 0.0121 | 0.1423 | 0.7117 | |
| BD | 49.42 | 1 | 49.42 | 581.25 | < 0.0001 | |
| CD | 4.73 | 1 | 4.73 | 55.64 | < 0.0001 | |
| A² | 1945.25 | 1 | 1945.25 | 22878.36 | < 0.0001 | |
| B² | 147.04 | 1 | 147.04 | 1729.36 | < 0.0001 | |
| C² | 16.94 | 1 | 16.94 | 199.26 | < 0.0001 | |
| D² | 60.54 | 1 | 60.54 | 711.96 | < 0.0001 | |
| Residual | 1.19 | 14 | 0.0850 | |||
| Lack of Fit | 0.7734 | 10 | 0.0773 | 0.7421 | 0.6814 | not significant |
| Pure Error | 0.4169 | 4 | 0.1042 | |||
| Cor Total | 4278.98 | 28 |
Table 4.
Results of sequential model sums of squares and model summary statistics RB5 removal efficiency.
Table 4.
Results of sequential model sums of squares and model summary statistics RB5 removal efficiency.
| Source | Sum of Squares | df | Mean Square | F-value | p-value | |
| Mean vs Total | 2.206E+05 | 1 | 2.206E+05 | |||
| Linear vs Mean | 2220.34 | 4 | 555.09 | 6.47 | 0.0011 | |
| 2FI vs Linear | 72.26 | 6 | 12.04 | 0.1091 | 0.9942 | |
| Quadratic vs 2FI | 1985.18 | 4 | 496.29 | 5836.99 | < 0.0001 | Suggested |
| Cubic vs Quadratic | 0.7129 | 8 | 0.0891 | 1.12 | 0.4580 | Aliased |
| Residual | 0.4775 | 6 | 0.0796 | |||
| Total | 2.249E+05 | 29 | 7754.04 | |||
| Model summary statistics | ||||||
| Source | Std. Dev. | R² | Adjusted R² | Predicted R² | PRESS | |
| Linear | 9.26 | 0.5189 | 0.4387 | 0.3169 | 2922.87 | |
| 2FI | 10.50 | 0.5358 | 0.2779 | -0.2191 | 5216.64 | |
| Quadratic | 0.2916 | 0.9997 | 0.9994 | 0.9988 | 5.11 | Suggested |
| Cubic | 0.2821 | 0.9999 | 0.9995 | 0.9978 | 9.37 | Aliased |
Table 5.
Kinetic parameters for the RB5 adsorption.
| Order of reaction | Parameters | CKFC-Fe3O4 Composite | RKFC |
| qe, exp (mg/gm) | 23.53 | 9.20 | |
| Pseudo-first-order | qe, cal (mg/g) | 0.51 | 0.85 |
| k1 (min-1) | -7.60×10⁻⁴ | -9.75×10⁻⁴ | |
| R2 | 0.5448 | 0.6205 | |
| Pseudo-second-order | qe, cal (mg/g) | 23.60 | 9.32 |
| k2 (g mg-1min-1) | 0.32 | 0.17 | |
| R2 | 0.9999 | 0.9996 |
Table 6.
Isotherm parameters for RB5 adsorption on CKFC.
| Type of isotherm | Parameters | RKFC | CKFC-Fe3O4 Composite |
| Langmuir | qmax (mg/g) | 60.04 | 92.84 |
| KL (L/mg) | 0.0147 | 0.0283 | |
| RL | 0.5748 | 0.4138 | |
| R2 | 0.9996 | 0.9998 | |
| Freundlich | Kf | 2.37 | 4.45 |
| 1/n | 0.5864 | 0.5300 | |
| R2 | 0.9167 | 0.9250 |
Table 7.
Comparison of the adsorption capacity of CKFC towards RB5 dyes with different ACs.
| Adsorbents | Dye | qmax (mg/g) | References |
| Residue from the aluminum industry | RB5 | 0.98 | [8] |
| NaOH-treated activated sludge | RB5 | 118.2 | [2] |
| Beneficiated Kaolin | BY 28 | 1.896 | [50] |
| Natural untreated clay | BY 28 | 76.92 | [20] |
| KFC-Fe3O4 Composite | RB5 | 92.84 | This Study |
Table 8.
Thermodynamic parameter for RB5 dye adsorption on the KFC-Fe3O4 composite.
| Adsorbent | Temp(K) | KL | ΔGo(KJmol-1) | ΔHo(KJmol-1) | ΔSo(KJmol-1) | R2 |
| KFC-Fe3O4Composite | 298 | 2.205 | -1.95908 | 6.4524 | 28.2632 | 0.9942 |
| 308 | 2.429 | -2.27258 | ||||
| 328 | 2.804 | -2.81166 |
Disclaimer/Publisher’s Note: The statements, opinions and data contained in all publications are solely those of the individual author(s) and contributor(s) and not of MDPI and/or the editor(s). MDPI and/or the editor(s) disclaim responsibility for any injury to people or property resulting from any ideas, methods, instructions or products referred to in the content. |
© 2025 by the authors. Licensee MDPI, Basel, Switzerland. This article is an open access article distributed under the terms and conditions of the Creative Commons Attribution (CC BY) license (http://creativecommons.org/licenses/by/4.0/).
Copyright: This open access article is published under a Creative Commons CC BY 4.0 license, which permit the free download, distribution, and reuse, provided that the author and preprint are cited in any reuse.


