
Submitted:
19 November 2024
Posted:
20 November 2024
You are already at the latest version
Abstract
This research explores the synthesis and application of carbon-based adsorbents derived from olive stones and almond shells as low-cost biomass precursors through carbonization at 600°C combined with chemical activation using KOH, H3PO4 and ZnCl2 with carbon/activating agent (C/A) ratios of 1:2 and 1:4 (w/w) at 850°C for the removal of Cu2+ and Pb2+ ions from aqueous solutions. The carbons produced were characterized using different techniques including SEM-EDX, FTIR, XRD, BET analysis, CHNS elemental analysis and point of zero charge determination. Batch-mode adsorption experiments were carried out at adsorbent doses of 2 and 5 g L-1, initial metal concentrations of 100 and 500 mg L-1 and natural pH (around 5) with agitation at 350 rpm and 25°C for 24 h. KOH-activated carbons, especially at a 1:4 (w/w) ratio, exhibited superior adsorption performance mainly due to their favorable surface characteristics and functionalities. The greatest adsorption efficiency reached 100% (101.41-101.68 mg g-1) for Pb2+ at 500 mg L-1 and 5 g L-1 dosage, and 84.63-86.29% (41.69-42.52 mg g-1) for Cu2+ at 100 mg L-1 and 2 g L-1 dosage. The results of this study will help advance knowledge in the design and optimization of adsorption processes for heavy metal removal, benefiting industries seeking green technologies to mitigate environmental pollution.
Keywords:
biomass
; carbon adsorbents
; chemical activation
; copper lead adsorption
1. Introduction
Heavy metals' increasing contamination of water bodies poses a serious environmental threat, particularly due to the toxic nature of metals such as copper (Cu²⁺) and lead (Pb²⁺). These metals, commonly found in wastewater and leach liquor streams from mining, metallurgy, battery manufacturing, electronics production, and industrial discharge, are non-biodegradable, persistent, and harmful to both the environment and human health [1,2]. Elevated levels of Cu²⁺ and Pb²⁺ in water sources can lead to bioaccumulation in living organisms, resulting in severe health issues such as neurological disorders, kidney damage, and other chronic conditions [2,3,4].
Moreover, the global rise in electronic waste (e-waste) has become a critical environmental challenge, with waste printed circuit boards (PCBs) representing a significant portion due to their complex composition and the hazardous substances they contain [5]. PCBs are integral components in electronic devices such as computers, smartphones, and televisions, and they are often rich in valuable and toxic metals including Cu²⁺ and Pb²⁺ [6,7,8]. Improper disposal or recycling of PCBs can result in the release of these toxic metals into the environment, especially into soil and water systems, through leachates from landfills or unsuitable industrial processing, creating significant environmental and public health risks [9,10]. Therefore, removing these metals from wastewater and PCB leachates is crucial for protecting the environment and recovering valuable resources.
Among the various treatment methods for heavy metal removal, adsorption has gained widespread recognition due to its high efficiency, simplicity, and ability to remove a wide range of pollutants [11,12]. Activated carbon is widely recognized as a highly effective adsorbent for removing heavy metals from aqueous solutions owing to its well-developed porosity, extensive surface area, diverse surface chemistry properties, strong surface reactivity, and significant adsorptive capacity [2,13]. However, traditional activated carbon is often derived from non-renewable sources such as coal, making its production costly and environmentally unsustainable.
In recent years, the focus has shifted towards the use of biomass-derived activated carbons as an eco-friendly and cost-effective alternative, including orange peels [3], date palm leaflets and seeds [14,15], pinewood sawdust [16], and pistachio green hulls [17] among others for the removal of Cu²⁺ and Pb²⁺ from aqueous solutions. Carbonization and activation processes can convert biomass materials into highly porous carbons with tailored surface properties suitable for adsorption applications. Moreover, using biomass waste as a precursor for activated carbon production aligns with the principles of waste valorization and circular economy, making it an environmentally responsible approach [18].
The adsorption capacity of activated carbons has been greatly influenced by the type of raw materials, the methods used in their production, and the specific conditions during fabrication [19]. The carbonization process is typically performed prior to precursor activation, where the material is exposed to pyrolysis, a thermal treatment that enhances its carbon content [20]. During pyrolysis, moisture, hydrogen, volatiles and aromatics with low molecular weight are released, forming a stable carbon-rich structure [21]. The carbonaceous material obtained from pyrolysis normally has limited porosity as most pores are occupied by tar-like substances [21]. Therefore, an activation process is necessary to enhance and develop the specific and desired carbon properties. Activation treatment is applied physically or chemically to improve porosity and develop oxygen-containing functional groups on the surface of activated carbons [22]. KOH, ZnCl2 and H3PO4 as chemical activating agents and CO2 and steam as physical activating agents can be employed to activate the carbonaceous materials. Comparing physical and chemical activation techniques for preparing activated carbon and assessing their adsorption performance, chemical activation was found to yield superior results, particularly in terms of total pore volume, specific surface area, and porosity enhancement [23].
This work is focused on the preparation of carbon-based adsorbents from olive stones (OS) and almond shells (AS) as low-cost, eco-friendly, and available biomass precursors in order to analyze and evaluate their future potential for the removal of Cu2+ and Pb2+ from wastewater or leach liquor streams. Utilizing biomass materials as precursors for carbon production promotes sustainability while addressing the dual environmental challenges of e-waste management and wastewater treatment. The influence of the type of activating agent (KOH, H3PO4, or ZnCl2) and the carbon/activating agent (C/A) ratio were examined to achieve better adsorption characteristics for each individual metal. A detailed characterization of the biomass-derived carbons was carried out to provide insights into the physical and chemical properties of the adsorbents, such as surface area, pore structure, functional groups, and crystallinity, which are critical for understanding their adsorption behavior.
2. Materials and Methods
2.1. Materials
Olive stones and almond shells, provided by Fertínez Company (Jaén, Spain) and Biogramasa Company (Granada, Spain), respectively, were utilized as biomass precursors for fabricating carbons. Potassium hydroxide (KOH 85%, Panreac), zinc chloride (ZnCl2 98%, Scharlau) and phosphoric acid (H3PO4 85%, Panreac) were used as activating agents. Hydrochloric acid (HCl 37%, Panreac) and sodium hydroxide (NaOH 98%, Sigma Aldrich) were employed to eliminate the excess of activating agents after activation and to determine the point of zero charge of carbons. Cu2+ and Pb2+ aqueous solutions were prepared by dissolving copper nitrate trihydrate (Cu(NO3)2·3H2O 99%, Fluka) and lead nitrate (Pb(NO3)2 99.5%, Scharlau), respectively, in double distilled water. All chemical reagents were of analytical grade.
2.2. Fabrication of Biomass-Derived Carbons
A total of 14 carbon materials were produced using olive stones and almond shells under various conditions outlined in Table 1. A specific mass of the precursor (200 g of olive stones and 140 g of almond shells) was first placed in an alumina recipient and subjected to pyrolysis inside an oven (Nabertherm GmbH- Germany) under a flow of N2 (34 L h-1) with a temperature ramp of 5°C min-1 until reaching a temperature of 600°C, which was kept for 1 h.
KOH, ZnCl2 and H3PO4 were then used as activating agents to activate the materials obtained from the carbonization process. The KOH and ZnCl2-activated carbons were produced by mixing the biochar with the corresponding quantities of KOH and ZnCl2 through milling, achieving C/A ratios of 1:2 and 1:4 (w/w). Subsequently, the mixtures obtained were introduced into the oven and pyrolyzed at 850°C for 2 h with the same temperature ramp and N2 flow rate as on the carbonization process (5°C min-1 and 34 L h-1, respectively). The materials, once cooled, were rinsed with 0.5 M HCl aqueous solutions, followed by double deionized water until a constant pH was achieved. To fabricate H3PO4-activated carbons, a certain volume of 85% H3PO4 solution was mixed with distilled water to obtain the corresponding C/A ratios (1:2 and 1:4 (w/w)). Then, a specific mass of pre-milled carbonized materials was put in contact with the diluted H3PO4 solution with a solid/liquid ratio of 100 g L-1 and agitated at room temperature for 6 h. The materials obtained were then pyrolyzed in the oven using the procedure previously described for KOH and ZnCl2 activation. After cooling, H3PO4-activated carbons were washed using double distilled water until constant pH. After the washing stage, all the biomass-based carbons prepared were dried at 105°C for 24 h.
2.3. Characterization of Biomass-Derived Carbons
The carbons prepared in this study were characterized through various approaches that enable the analysis of metal adsorption data. BET surface area and porosity determination was carried out using a volumetric sorption analyzer (Micromeritics ASAP 2020), analyzing N2 adsorption-desorption measurements at -196.15°C, together with CO2 adsorption data at 0°C. Previously, the carbons were degassed under vacuum at 300°C for 8 h, employing a temperature ramp of 10°C min-1. The specific surface area was determined from N2 and CO2 adsorption isotherms using the BET equation. The total pore volume was obtained based on the quantity of N2 adsorbed at a relative pressure close to saturation (P/P₀ ≈ 0.99), ensuring a representative measure of the entire porosity network. To thoroughly characterize the porosity, the pore size distribution and total pore volume were further refined using the two-dimensional non-local density functional theory (2D-NLDFT) model, analyzing both CO2 and N2 adsorption data simultaneously. This model was selected for its precision in differentiating micropores (≤ 2 nm) from mesopores (2–50 nm), leveraging a two-dimensional adsorption framework to account for surface heterogeneity and pore connectivity effects. The micropore volume was then calculated by subtracting the combined mesopore and macropore (≥ 50 nm) volumes from the total pore volume.
Scanning electron microscopy combined with energy-dispersive X-ray spectroscopy (SEM-EDX) was employed to investigate the carbons' morphological characteristics and surface chemical composition. SEM imaging was carried out using a high-resolution field emission scanning electron microscope (FESEM, Ultra-Plus Zeiss), enabling detailed surface analysis. Elemental mapping and point analysis were performed at multiple locations across the carbon surface to ensure homogeneity in the composition profiles.
The samples were exposed to a high-precision CHNS elemental analyzer (Thermo Flashsmart) to determine the carbon (C), hydrogen (H), nitrogen (N), sulfur (S), and oxygen (O) (calculated by difference) percentages. The analysis was conducted in a dynamic flash combustion mode, where the samples were introduced into a high-temperature reactor in the presence of pure oxygen.
X-ray diffraction (XRD) technique was employed to characterize the crystallinity of the samples, and the diffraction measurements were performed using an Empyrean1 diffractometer from the Panalytical brand. X-rays were generated from a sealed tube with a Cu anode (λ(Kα1) = 1.5406 Å), and the radiation emitted by the sample was obtained using a solid-state "PIXcel3D" detector. The electron diffraction patterns were collected in the angular range of 5° < 2Ɵ < 80° with a step size of 0.04° and a counting time of 1.75 s per step. The HighScore Plus Software Version 3.0d was used for data processing.
Fourier-transform infrared (FTIR) spectroscopy (VARIAN FTIR 670 spectrometer) was used to characterize the chemical bonds and surface functional groups generated on the surface of carbons. The sample pellets were prepared by mixing carbon with potassium bromide (KBr) using a carbon/KBr ratio of 0.4:600 (mg/mg), and the FTIR spectra were obtained within a wide spectral range of 400 – 4000 cm-1, allowing for the analysis of a variety of chemical bonds.
To determine the point of zero charge (pHpzc) of the carbons, several flasks were filled with aqueous solutions (10 mL) of 0.01 M NaCl, adjusted to various pH levels (ranging from 2 to 12) by adding varying concentrations of NaOH and HCl (0.1–2 M). After setting the desired pH, 10 mg of the sample was introduced into each flask and shaken at 350 rpm and 25°C using an orbital air bath shaker (VWR Cienytech) for 48 h to achieve adsorption equilibrium. The final pH was then recorded, and the pHpzc was identified as the intersection of the curve plotting ∆pH (initial pH – final pH) versus initial pH, with the x-axis representing initial pH.
2.4. Adsorption Experiments
Metal adsorption experiments were carried out in batch mode to assess the capability of the prepared carbon-based adsorbents to remove Cu2+ and Pb2+ ions from aqueous solutions by analyzing their metal adsorption capacity and efficiency. Stock solutions of Cu2+ and Pb2+ (1000 mg L-1) were first prepared by dissolving precise amounts of Cu(NO3)2.3H2O and Pb(NO3)2 in double distilled water. Then, they were subjected to dilution to obtain the working solutions at specified concentrations. The sorption experiments were conducted in an orbital air bath shaker using 25 mL of the metal solution at initial concentrations of 100 or 500 mg L-1, which was mixed with the corresponding amount of the adsorbent at adsorption doses of 2 or 5 g L-1 and maintained at natural pH, an agitation rate of 350 rpm and 25°C for 24 h. After reaching adsorption equilibrium, the carbon materials were separated from solutions by filtration, and the metal concentration of filtrates was determined through flame atomic absorption spectrometry (FAAS, GBC Scientific). All the experiments were carried out in triplicate to guarantee the consistency of adsorption data, and the mean value was calculated for data analysis. Adsorption capacity and efficiency at equilibrium of carbons prepared were calculated using Equations (1) and (2), respectively.
where qe represents the amount of metal adsorbed at equilibrium (mg g-1); Ci is the initial metal concentration at t (time) = 0 (mg L-1); Ce is the final concentration of metals in solution at equilibrium (mg L-1); V is the volume of metal solution (L); m represents the mass of adsorbent used (g) and AE denotes the adsorption efficiency of the adsorbents at equilibrium (%).
2.5. Statistical Analysis
As mentioned earlier, all adsorption experiments were performed in triplicate, and the results were averaged. The presence of significant differences in the values of adsorption capacity and efficiency of carbons for Cu2+ and Pb2+ ions were evaluated using one-way analysis of variance (ANOVA), depending on the existence of variance equality and applying the Tukey or T3 Dunnett tests. All statistical analyses were carried out at the 95% confidence level using IBM SPSS Statistics 25 software.
3. Results and Discussion
3.1. Carbon Characterization
The carbons' physical, chemical, and structural characteristics were analyzed through different techniques. The surface morphological features of the carbons were assessed using SEM, and the corresponding images are shown in Figure 1. These figures illustrate the surface texture and porosity variations of non-activated and activated carbons produced using various activating agents at C/A ratios of 1:2 (w/w) and 1:4 (w/w). The results demonstrate the contrasting morphological characteristics and pore structures after activating carbons, especially for the KOH-activated ones, indicating specific modifications in the external surface and the presence of small-sized pores. Hence, a higher degree of porosity and cavities was observed for activated carbons than for non-activated ones. Moreover, the carbons activated with KOH exhibited a more porous texture than the H3PO4 and ZnCl2-activated carbons with scattered cracks generated on their surface, which could result in an enhancement in the number of active surface sites and efficient adsorption of adsorbate molecules [24]. The KOH-activated carbons displayed a significantly porous structure and altered morphology, featuring a monolithic framework and expanded carbon matrix lattices, which could be driven by the mobility and reactivity of metallic potassium (K), as evidenced by the SEM images shown in Figure 1 and Figure 2 (images B and C). The carbons activated with H3PO4 exhibited a uniform structure with certain surface modifications, characterized by the formation of small porous regions and randomly distributed pores and craters, which could be due to the diffusion and reaction of H3PO4 during thermochemical activation process at 850°C, as depicted in Figure 1 and Figure 2 (images D and E) [25]. Some primary pores and an altered porous framework were also identified for ZnCl2-activated carbons (Figure 1 and Figure 2 (images F and G)). All the activated carbons are characterized by the presence of mesopores and a significant proportion of micropores embedded within their surface structure, demonstrating a clear alignment with prior research findings [26,27,28].
Moreover, the EDX analysis offers the corresponding surface chemical composition, as presented in Table 2. The findings reveal minor quantities of K, P, Zn, and Cl on the surface of KOH, H3PO4, and ZnCl2- activated carbons, respectively, indicating the effective incorporation of these compounds during the fabrication process. KOH-activated carbons were found to have the lowest content of C and the highest content of O, especially for the carbon fabricated from olive stones with a C/A ratio of 1:4 (w/w) (OSACK2, 53.79% and 35.11% of C and O, respectively). This spatial distribution implies the establishment of chemical bonds, particularly carbon- and oxygen-containing functional groups, with the aromatic structure of the carbon, highlighting the effective integration of these elements at the molecular level [29].
Based on the N2 adsorption-desorption isotherms at -196.15°C, shown in Figure 3, certain differences in the shape and magnitude of the isotherms can be observed depending on the activating agent used to produce the carbon adsorbents. Regarding N2 adsorption capacity, activated carbons treated with KOH demonstrated a high amount of N2 adsorbed on the surface, indicating that these materials possess the largest surface area. In all cases, the N2 adsorption-desorption isotherms fall under type I, which suggests a significant presence of microporosity in the solids. The isotherms of the KOH-activated carbons display a slightly different shape compared to non-activated ones and those activated with other agents, particularly showing a broader knee. This suggests that the microporosity is generated by micropores in the highest range of pore diameter (supramicroporosity), while the carbons activated with H3PO4 and ZnCl2 appear to have smaller pores. Moreover, the use of olive stone as a precursor tends to generate a narrower knee, especially when using a 1:2 (w/w) C/A ratio.
On the other hand, the plateau in the isotherms for KOH-activated carbons does not reach a constant value, and a slight increase in the amount of N2 adsorbed could indicate the presence of a certain degree of mesoporosity.
Regarding the amount of activating agent used during the fabrication process, it is evident that the isotherms for KOH-activated carbons change noticeably as the quantity of KOH is increased, with the knee extending over a larger relative pressure range and an increase in the magnitude of adsorbed nitrogen. Activated carbons treated with ZnCl2 exhibited a similar trend to that observed for KOH-activated carbons, with an increase in the amount of N2 adsorbed, whereas no influence was observed for H3PO4-activated carbons.
CO2 adsorption isotherms at 0°C were obtained to supplement the conclusions drawn from the N2 adsorption studies at -196.15°C. The experimental data (Figure 4) show that KOH-activated carbons achieve higher CO2 adsorption values, although this difference is mainly observed in the high-pressure range. The presence of ultramicropores is associated with the amount of CO2 adsorbed [30], but preferably at relative pressures below 0.02. Carbons activated with H3PO4 exhibit similar isotherms, suggesting a similar microporosity. For carbons activated with ZnCl2, a substantial increase in the amount of CO2 adsorbed is observed as the C/A ratio increases, matching the behavior seen in the N2 adsorption studies.
As previously discussed, the experimental data obtained for N2 and CO2 adsorption were used to generate the information presented in Table 3. As mentioned earlier, the use of KOH tends to produce carbons with significantly greater surface areas (determined using N2), which increase as more KOH is used in the activation process for both biomass precursors. This is consistent with the well-known ability of KOH activation to develop a highly porous network, resulting in substantial increases in both microporosity and mesoporosity. Considering the effect of the activating agent on surface area magnitude, the trend observed was KOH > H3PO4 > ZnCl2 for almond shell-based carbons and KOH > ZnCl2 > H3PO4 for olive stone-based carbons. While KOH and ZnCl2 allow the modification of the surface area value when the C/A ratio is varied, H3PO4 does not show that influence. H3PO4 and ZnCl2-activated carbons yielded moderate increases in surface area, promoting micropore formation without significantly enlarging mesopores.
Moreover, total pore volume and pore size provide further insight into the structural transformations induced by activation. The KOH-activated carbons had the highest total pore volumes compared to non-activated, H3PO4 and ZnCl2-activated carbons (Table 3). This trend highlights that KOH activation increases surface area and substantially amplifies the overall pore volume, enhancing the material’s capacity to retain adsorbates. The greatest average pore diameter was obtained for KOH-treated samples in the range of 4.59 to 5.34 nm, indicating the introduction of wider mesopores alongside micropores. This bimodal pore size distribution is advantageous for applications requiring both high surface area for adsorption and mesoporous channels for rapid molecular transport.
XRD analysis was employed to provide a more detailed understanding of the changes in the crystalline structure of biomass-derived carbon adsorbents, and the corresponding patterns are presented in Figure 5. From the figure, two prominent diffraction peaks can be observed at around 23-25° and 43.6° for non-activated carbons and H3PO4 and ZnCl2-activated carbons from both precursors, representing the existence of the (002) and (100) crystal planes of the graphite layer, respectively, caused by weekly crystalline phases [31]. The peak observed at around 23-25° confirms the hexagonal and developed aromatic crystallite characteristics, whereas the broad and weak band at about 43.6° represents the microcrystalline and amorphous nature of the carbons with a very low degree of graphitization [26,32]. However, different patterns were detected for KOH-activated carbons, especially for the carbons activated with a C/A ratio of 1:4 (w/w). The (002) diffraction plane characteristic of graphite is missing in all KOH-activated carbons, which may be due to the structural disintegration of the carbon matrix, potentially leading to the disruption of the graphite-like ordering [33]. On the other hand, compared to the other carbons, the intensity of the (100) plane peak (43.8°) was significantly reduced for KOH-activated carbons, particularly for those with a 1:4 (w/w) ratio, which almost disappeared, signifying a diminishing degree of graphitization order within the samples [34]. In addition, the diffraction peak observed at roughly 21.5° is likely associated with cellulose. In comparison, the peak at 26.3° is due to the presence of crystalline inorganic phases, which can be associated with the trace elements found within the KOH-activated carbons [34]. The sharp peaks observed in KOH-activated carbons with a ratio of 1:4 (w/w) may be ascribed to the formation of additional chemical species within the interlayers of the collapsed hexagonal graphite (carbon) framework [33].
FTIR analysis was carried out to provide insight into the surface chemistry and functional groups present on the surface of carbons prepared in this study. The FTIR spectra of samples exhibited several characteristic peaks, indicating the presence of a variety of functional groups, as depicted in Figure 6. The peak observed at around 3433 cm⁻¹ is typically attributed to the O-H stretching vibrations of hydroxyl groups, including those associated with alcohols, phenols, and carboxylic acids [2,35]. Non-activated and KOH-activated carbons exhibited a broader intensity at this peak compared to H3PO4 and ZnCl2-activated carbons, suggesting a significant concentration of O–H groups due to their alkaline nature. This observation aligns with the pHpzc data of the carbons, as presented in Table 4, corroborating the consistency between the spectral findings and the surface charge characteristics of the materials. The band located at about 3136-3149 cm⁻¹ can be assigned to the N–H stretching mode observed in compounds such as amines or to the O–H bond [33,36]. Moreover, the dual peaks detected at 2920 cm⁻¹ and 2852-2862 cm⁻¹ correspond to the stretching vibrations associated with aliphatic C–H bonds [37], whereas the peaks obtained within the spectral region of 1711-1733 cm⁻¹ are indicative of the C=O stretching vibrations, which are characteristic of carbonyl functionalities found in compounds such as esters and carboxylic acids [33]. The transmittance bands at roughly 1595-1637 cm⁻¹ can be ascribed to the in-plane deformation vibrations of the N=H bond or the C=C stretching vibrations, particularly those inherent to aromatic rings [34]. A sharp peak was detected at 1404 cm⁻¹, which correspond to bending vibrations of alkyl C–H bonds, reflecting the presence of methyl (–CH₃) or methylene (–CH₂–) groups [38]. The prominent and well-defined band at 1099 cm⁻¹ observed in non-activated, KOH- and H3PO4-activated carbons contrasted with the relatively weak and broad peak detected at 1124 cm⁻¹ in ZnCl2-activated carbons that can be attributed to C–O stretching vibrations, typically associated with alcohols, phenols, ethers, or esters [39,40]. Furthermore, the peaks identified at 796 cm⁻¹ and 470 cm⁻¹ in non-activated, KOH- and H3PO4-activated carbons are likely attributed to out-of-plane bending vibrations of aromatic C–H bonds [33]. The peaks appearing at 1099 cm-1 and 470 cm-1 in carbons activated with H3PO4 can also be assigned to the stretching vibrations of the O–P–O and P=O bands, respectively [41]. In contrast, the characteristics peak observed at 592 cm⁻¹ for ZnCl2-activated carbons can be ascribed to Zn–O stretching vibrations [42].
Point of zero charge (pHpzc) is a key property in understanding how carbon-based materials interact with different ions in aqueous solutions, which reflects the acidity or basicity of the material's surface. The pHpzc is the pH at which the material's surface has a neutral net charge. If the pH of the solution is below the pHpzc, the surface of the carbon material will be positively charged. On the contrary, if the pH is above the pHpzc, the surface will be negatively charged [43]. The point of zero charge of the carbons prepared are given in Table 4. As observed, non-activated and KOH-activated carbons possess pHpzc values within a range of 7.3-8.4, indicating that their surface is in slightly basic conditions. This could be due to the introduction of electron-donating groups such as amine or hydroxyl groups on the carbon surface [44]. In contrast, the carbons activated with H3PO4 exhibited the lowest pHpzc values (2.9-3.5), suggesting that phosphorus modification greatly increases the surface acidity. ZnCl2-activated carbons showed intermediate pHpzc values (5.5-6.2), confirming that zinc modification makes the surface slightly acidic but not as much as phosphorus, as zinc oxide is amphoteric and can behave as both an acid and a base [45].
The CHNS elemental analysis provides valuable insights into the changes in elemental composition following chemical activation of olive stone and almond shell-derived carbons, and the corresponding results are given in Table 5. These changes are critical as they influence the surface chemistry and the potential applications of the activated carbons. As observed in Table 5, the non-activated carbons (OSC and ASC) exhibited the highest carbon contents, 83.36%, and 83.14%, respectively, with comparable hydrogen, nitrogen, and oxygen levels. These high carbon percentages reflect the inherent carbon-rich nature of the biochar produced from biomass prior to activation. The KOH activation induced a pronounced carbon content reduction alongside a significant oxygen level increase, a trend consistently observed across both OSACK and ASACK series samples. For instance, within the OSACK series, the carbon content declined markedly from 83.36% in OSC to 66.44% in OSACK1 and further to 55.02% in OSACK2, while oxygen levels increased from 14.40% in OSC to 32.02% and 43.64% in OSACK1 and OSACK2, respectively. Similar patterns were observed in the ASACK series, where carbon content in ASACK1 and ASACK2 was reduced to 66.48% and 56.72%, with corresponding oxygen amounts rising to 32.23% and 41.75%. The substantial decrease in carbon content and concurrent oxygen increase, which is consistent with the findings obtained from the EDX analysis (Table 2), suggests the incorporation of oxygen-containing functional groups, likely as a result of KOH strong oxidizing effect, which enhances pore development and functional group introduction [46]. Activation with H3PO4 also reduced the carbon content (70.60%-74.18%), albeit not as drastically as KOH activation, and introduced a moderate increase in oxygen amount (23.54%-27.20%). The less pronounced carbon depletion and oxygenation in H3PO4-activated carbons suggest that H3PO4 is milder compared to KOH, promoting the formation of phosphorus-containing functional groups that enhance surface polarity without significant carbon loss [47]. The ZnCl2-activated carbons demonstrated the highest carbon contents among the activated samples, containing 80.65%-82.12%. This indicates that ZnCl2 is less aggressive in depleting carbon compared to KOH and H3PO4, likely because ZnCl2 primarily acts as a dehydrating agent, promoting carbonization and cross-linking without extensive oxygen incorporation [48]. Correspondingly, the relatively low oxygen contents (15.57%-17.41%) were obtained for ZnCl2-activated carbons. In addition, the significantly low hydrogen and nitrogen contents could be associated with promoting carbon and oxygen-dominant structures, possibly through gasification reactions that remove other elements [49].
3.2. Cu2+ Adsorption Performance of Biomass-Derived Carbons
The Cu2+ adsorption efficiency (AE) and capacity (qe) of non-activated and activated carbons were assessed under varying conditions, specifically, at two Cu2+ concentrations (100 and 500 mg L⁻¹) and two adsorbent dosages (2 and 5 g L⁻¹), to identify the most effective adsorbent for the removal of Cu2+ ions from aqueous solutions (Table 6). Variations in adsorption performance across carbons activated with KOH, H3PO4 and ZnCl2 reveal the influence of activation method and surface characteristics acquired on Cu2+ removal efficiency. As observed, the non-activated carbons (OSC and ASC) displayed relatively lower AE and qe values than KOH and H3PO4-activated carbons under all conditions essayed. At a low Cu2+ concentration (100 mg L-1) with an adsorbent dosage of 2 g L-1, OSC and ASC achieved moderate AE values of 29.92% and 43.25%, with qe values of 14.75 mg g-1 and 21.32 mg g-1, respectively. However, increasing the adsorbent dosage to 5 g L-1 at 100 mg L-1, AE slightly increased (33.44% for OSC and 51.40% for ASC), but significantly lower qe values (7.21 mg g-1 and 11.10 mg g-1), a similar trend to previous studies [50]. At 500 mg L-1, both OSC and ASC showed a drop in AE (12.81% and 13.06% at 2 g L-1; 8.80% and 15.33% at 5 g L-1) with correspondingly lower qe values, indicating that non-activated carbons struggle with efficient Cu2+ removal at high initial concentrations, likely due to limited active sites [51]. ASC's superior Cu2+ adsorption efficiency compared to OSC, particularly at the lower concentration of 100 mg L⁻¹, may be ascribed to its relatively larger average pore size (Table 3).
KOH-activated carbons were found to possess superior adsorption characteristics among all samples, especially for the carbons fabricated with a C/A ratio of 1:4 (w/w) (OSACK2 and ASACK2) with the highest AE and qe, underscoring the effectiveness of KOH activation in enhancing Cu2+ adsorption potential. At 100 mg L-1 Cu2+ concentration and 2 g L-1 dosage, OSACK2 and ASACK2 achieved notable AEs of 86.29% and 84.63% with elevated qe values of 42.52 mg g-1 and 41.69 mg g-1, respectively. Increasing the dosage to 5 g L-1 further raised the AE to near-complete levels (99.86% and 98.18%), although the qe values decreased to 21.58 mg g-1 and 21.20 mg g-1. At the higher Cu2+ concentration (500 mg L-1), KOH-activated carbons maintained effective performance, particularly for OSACK2 and ASACK2, which exhibited AEs of 26.88% and 24.92% at 2 g L-1, with qe values of 66.62 mg g-1 and 62.33 mg g-1, respectively. The adsorption efficiencies nearly doubled when the dosage increased to 5 g L-1 (48.65% and 45.15% for OSACK2 and ASACK2, respectively), with the high associated qe values of 49.40 mg g-1 and 45.83 mg g-1, respectively, indicating that KOH activation effectively creates high-energy adsorption sites that accommodate greater Cu2+ loadings. The findings also demonstrated that the C/A ratio profoundly affects the structural and chemical characteristics of the carbon activated by KOH, thereby influencing its Cu2+ adsorption performance. With increasing the C/A ratio from 1:2 (w/w) to 1:4 (w/w), the amount of copper adsorbed increased, especially evident under two specific conditions: 100 mg L-1 with 2 g L-1 adsorbent dose and 500 mg L-1 with 5 g L-1 adsorbent dose, as confirmed by the analysis of significant differences. As shown in Table 3, the surface area and total pore volume of KOH-activated carbon increased substantially with a higher C/A ratio for both precursors, as the activating agent helped to create a more porous framework by etching and expanding existing pores. This high porosity facilitates Cu2+ ion diffusion into the carbon matrix, thus improving the adsorption capacity [52]. Furthermore, the C/A ratio directly impacted the diversity of functional groups on the carbon surface, which plays a critical role in Cu2+ binding through chemisorption mechanisms [24]. EDX and CHNS elemental analyses (Table 2 and Table 5) revealed a considerably high oxygen content on the surface of KOH-activated carbons, particularly in the olive stone-derived activated carbon produced at a 1:4 (w/w) ratio. This oxygen concentration could be associated with a significant presence of oxygen-containing functional groups, which exhibit a strong affinity for metal ions, enhancing adsorption through ion exchange and surface complexation mechanisms [53].
The carbons activated with H3PO4 showed moderate adsorption performance, with AE and qe values falling between non-activated and KOH-activated carbons. For instance, at 100 mg L-1 Cu2+ concentration and 2 g L-1 dosage, OSACP2 and ASACP1 recorded AE values of 38.97% and 44.12%, with qe values of 19.17 mg g-1 and 21.73 mg g-1, respectively. When the dosage increased to 5 g L-1, AE improved to 50.05% and 58.77%, although qe decreased to 10.33 mg g-1 and 12.13 mg g-1, respectively. A similar trend was identified using higher Cu2+ concentration, achieving lower AE and qe values. This implies that while H3PO4 activation moderately enhances adsorption sites, it is less effective than KOH at producing the high-affinity sites required for larger Cu2+ loadings. The almond shell-derived activated carbon fabricated at a 1:2 (w/w) ratio (ASACP1) demonstrated slightly more favorable adsorption performance among the H3PO4-activated carbons, especially at a Cu2+ concentration of 100 mg L-1 and an adsorbent dose of 5 g L-1, which may be attributed to its relatively higher surface area and pore volume (Table 3). Moreover, increasing the C/A ratio from 1:2 (w/w) to 1:4 (w/w) did not result in a substantial enhancement in adsorption capability for either precursor, suggesting no significant differences in adsorption efficacy between these two ratios, as outlined in Table 6. This outcome may be attributed to the lack of significant surface chemistry and pore structure alterations despite the increased C/A ratio.
ZnCl2-activated carbons had the lowest AE and qe values among the non-activated and activated carbons. For example, at 100 mg L-1 Cu2+ concentration and 2 g L-1 dosage, OSACZ1 and OSACZ2 achieved AEs of only 23.70% and 22.56%, with corresponding qe values of 12.33 mg g-1 and 11.80 mg g-1, respectively. A similar behavior was observed when the dosage increased to 5 g L-1, where AE slightly improved but qe remained low, indicating limited adsorption efficiency. At 500 mg L-1, ZnCl2-activated samples displayed poor adsorption performance (e.g., 7.73% and 4.32% AE for OSACZ1 and OSACZ2, respectively, using an adsorbent dosage of 2 g L-1), highlighting ZnCl2 activation's limitations in creating high-capacity adsorption sites for copper. This result suggests that ZnCl2 may primarily enhance microporosity rather than the specific types of active sites that favor Cu2+ ion adsorption.
In general, KOH-activated carbons (especially OSACK2 and ASACK2) demonstrated the highest Cu2+ adsorption efficiency and capacity, making them suitable for high-performance Cu2+ adsorption applications. This suggests that KOH activation produces a more suitable porous structure and surface chemistry that enhances interactions with Cu2+ ions. H3PO4 activation resulted in moderate improvements in adsorption, suitable for applications with lower concentration requirements, while ZnCl2 activation was less effective for Cu2+ adsorption under the tested conditions. These results highlight the importance of activation method selection for optimizing carbon materials for specific heavy metal adsorption applications.
Based on previous analysis about the influence of average pore size upon Cu2+ adsorption in the different carbon-based adsorbents and considering possible size exclusion phenomena, an evaluation of the role of each pore type (total, mesopore and micropore) was carried out observing a clear impact of mesopore volume upon adsorption efficiency and capacity for all the adsorbents obtained. Figure 7 shows examples of this type of influence, and it is possible to observe that an increase in mesopore volume in the adsorbent enhances Cu2+ adsorption. This behavior is not observed for micropore volume, indicating that pore size plays an important role and also concluding that part of the specific surface area of adsorbent is not available for metal adsorption.
3.3. Pb2+ Adsorption Performance of Biomass-Derived Carbons
As in the previous section, adsorption efficiency (AE, %) and capacity (qe, mg g-1) of biomass-derived carbons were evaluated for removing Pb2+ ions from aqueous solutions under different concentrations (100 mg L-1 and 500 mg L-1) and adsorbent dosages (2 g L-1 and 5 g L-1), and the corresponding data are presented in Table 7. At 100 mg L-1 Pb2+ initial concentration and 2 g L-1 adsorbent dosage, KOH-activated carbons displayed the highest adsorption efficiency (AE=100%) and adsorption capacity (qe=52.25-52.28 mg g-1), showing their potential for high removal rates at low dosages. This performance indicates that these activated carbons possess a high surface area and effective pore distribution for Pb2+ adsorption. Other carbons, like non-activated (OSC and ASC) and H3PO4-activated carbons (OSACP and ASACP series), also exhibited high AE values of 62.58-75.56% and 73.04-79.28%, respectively, but with slightly lower qe values (34.55-41.45 mg g-1 and 37.83-41.18 mg g-1, respectively). This demonstrates that while these carbons are effective for Pb2+ removal, their adsorption capacity is lower than those of KOH-activated carbons, possibly due to a less favorable pore structure (in agreement with data in Figure 8) or fewer available functional groups.
Increasing the adsorbent dosage to 5 g L-1 at the same Pb2+ concentration decreased qe across all samples. Apart from KOH-activated carbons (OSACK and ASACK series), ASC was found to be the only carbon with complete adsorption level (AE=100%). In contrast, a slight increase in adsorption efficiency was observed for other carbons (73.28%, 83.82-89.65%, and 68.05-78.90% for OSC, H3PO4-activated carbons, and ZnCl2-activated carbons, respectively).
At the highest concentration (500 mg L-1) and lower adsorbent dosage (2 g L-1), the carbons activated with KOH at a C/A ratio of 1:4 (w/w) (OSACK2 and ASACK2) showed notable adsorption performance with AE values of 75.14% and 72.83%, respectively, and the highest qe values (186.16 and 182.69 mg g-1). This indicates a strong capacity for Pb2+ adsorption at higher initial metal concentrations, likely facilitated by the adsorbent’s high surface area and well-developed porosity. OSACK1 and ASACK1 also demonstrated good performance with AE values around 56% and qe values near 140 mg g-1, suggesting that they effectively accommodate higher Pb2+ loads even at moderate dosages. In comparison, the non-activated carbons and carbons activated with H3PO4 and ZnCl2 had lower AE values (27.02-33.35%, 34.20-39.40%, and 20.54-26.88%, respectively) and qe values ranging from 71.21 to 88.06 mg g-1, 85.45 to 97.94 mg g-1, and 51.77 to 67.59 mg g-1, respectively, indicating reduced effectiveness at high Pb2+ concentrations. This likely points to limitations in available surface area or pore structure for these specific carbons.
At an increased dosage of 5 g L-1 and 500 mg L-1 Pb2+ concentration, OSACK2 and ASACK2 again reached maximum AE values (100%) with high qe values of around 101 mg g-1. These results suggest that these carbons exhibit strong metal uptake potential regardless of adsorbent dosage, making them highly efficient in Pb2+ removal under varying operational conditions. The improvement in AE across all carbons such as OSACK1 (97.61%), ASACK1 (93.58%), and OSACP2 (62.84%) reflects the advantage of higher adsorbent dosage in enhancing adsorption efficiency for systems with high Pb2+ concentrations. The enhanced AE and qe values of KOH-activated carbons compared to other carbons can be attributed to their higher surface area, pore volume, and pore size, as indicated in Table 3 and supported by Figure 8, as well as the presence of more surface functionalities, particularly oxygen-containing functional groups, that facilitate Pb2+ adsorption. The findings further revealed that the carbon materials synthesized in this study exhibited a significantly enhanced capacity for Pb2+ ion recovery compared to Cu2+, implying a pronounced selectivity for Pb2+ over Cu2+ in these materials. This behavior may be attributed to the larger ionic radius of Pb2+ compared to Cu2+, which results in a stronger attraction and binding affinity of Pb+2 ions to the functional groups present on the surface of carbons, especially oxygen-containing functional groups such as hydroxyl (OH) and carboxyl (COOH) groups, due to intensified electrostatic interactions [54,55].
The data also indicate that base and chemical activation are effective strategies for enhancing adsorption performance. However, the optimal conditions for maximum Pb2+ removal vary across carbon types, likely due to specific interactions between Pb2+ ions and carbon surface properties. The high efficiency of OSACK and ASACK series carbons, especially those activated with a 1:4 (w/w) ratio, highlights their potential as viable options for Pb2+ removal applications, particularly at high pollutant concentrations and moderate dosages.
4. Conclusions
In this study, biomass-based carbon adsorbents were produced from olive stones and almond shells using various activating agents such as KOH, H3PO4, and ZnCl2. The activation method influenced the physical and chemical properties of the biomass-derived carbons, leading to differences in surface area, pore structure, and functional group distributions that impact their adsorption capabilities. Compared to H3PO4- and ZnCl2-activated carbons with a high degree of microporosity, activation with KOH yielded carbons with highly developed micro and mesoporous structures, greater surface area and pore size, and more introduction of oxygen-containing functional groups, exhibiting significant potential for the removal of heavy metal ions, specifically Cu²⁺ and Pb²⁺, from aqueous solutions. KOH-activated carbons prepared using a C/A ratio of 1:4 (w/w) from both precursors (OSACK2 and ASACK2) were found to have the highest adsorption performance for the removal of Cu2+ and Pb2+, achieving adsorption efficiencies of 84.63-86.29% (41.69-42.52 mg g-1) at 100 mg L-1 and 2 g L-1 dosage and 100% (101.41-101.68 mg g-1) at 500 mg L-1 and 5 g L-1 dosage, respectively. Moreover, the carbons activated with H3PO4 and ZnCl2 did not significantly influence adsorption, likely due to their specific texture, surface properties, and adsorption potential. The results also indicated that the carbons fabricated in this work have a significantly higher capacity for Pb2+ adsorption than for Cu2+ adsorption. This research aims to contribute to sustainable e-waste and wastewater management by developing biomass-derived activated carbons as cost-effective, renewable adsorbents for heavy metal removal. The study offers an environmentally friendly solution to the growing problem of heavy metal pollution, specifically targeting wastewater and leach liquors from waste PCB processing. By valorizing biomass waste into high-performance adsorbents, the research aligns with circular economy principles, reduces the environmental footprint of both e-waste and wastewater treatment, and provides a scalable method for mitigating the adverse effects of toxic metal contamination.
Author Contributions
Conceptualization, V.R., D.G.-D., M.S.F. and J.G.-Á.; methodology, V.R., D.G.-D. and M.S.F.; Validation, V.R.; formal analysis, V.R.; investigation, V.R. and C.H.P.; data curation, V.R. and C.H.P.; writing—original draft preparation, V.R.; writing—review and editing, V.R., D.G.-D., M.S.F., M.L. and J.G.-Á.; Visualization, V.R.; supervision, D.G.-D., M.S.F. and J.G.-Á.; Project administration, M.L. and J.G.-Á; funding acquisition, M.L. and J.G.-Á. All authors have read and agreed to the published version of the manuscript.
Funding
This work is part of I+D+i project Reference PID2021-122923NB-I00 financed by MCIN/AEI /10.13039/501100011033 / FEDER, UE.
Data Availability Statement
The data presented in this study are available from the authors.
Conflicts of Interest
The authors declare no conflicts of interest.
References
- Gutwiński, P.; Cema, G.; Ziembińska-Buczyńska, A.; Wyszyńska, K.; Surmacz-Górska, J. Long-term effect of heavy metals Cr(III), Zn(II), Cd(II), Cu(II), Ni(II), Pb(II) on the anammox process performance. J. Water Process Eng. 2021, 39, 101668. [Google Scholar] [CrossRef]
- Demiral, H.; Güngör, C. Adsorption of copper(II) from aqueous solutions on activated carbon prepared from grape bagasse. J. Clean. Prod. 2016, 124, 103–113. [Google Scholar] [CrossRef]
- Neisan, R.S.; Saady, N.M.C.; Bazan, C.; Zendehboudi, S.; Albayati, T.M. Adsorption of copper from water using TiO2-modified activated carbon derived from orange peels and date seeds: Response surface methodology optimization. Heliyon 2023, 9, e21420. [Google Scholar] [CrossRef] [PubMed]
- Jaishankar, M.; Tseten, T.; Anbalagan, N.; Mathew, B.B.; Beeregowda, K.N. et al., Toxicity, mechanism and health effects of some heavy metals, Interdiscip Toxicol. 2014, 7, 60–72. [CrossRef]
- Hadi, P.; Gao, P.; Barford, J.P.; Mckay, G. Novel application of the nonmetallic fraction of the recycled printed circuit boards as a toxic heavy metal adsorbent. J. Hazard. Mater. 2013, 252–253, 166–170. [Google Scholar] [CrossRef]
- Wang, H.; Zhang, S.; Li, B.; Pan, D.; Wu, Y.; Zuo, T. Recovery of waste printed circuit boards through pyrometallurgical processing: A review. Resour. Conserv. Recycl. 2017, 126, 209–218. [Google Scholar] [CrossRef]
- Ning, C.; Lin, C.S.K.; Hui, D.C.W.; McKay, G. Waste printed circuit board (PCB) recycling techniques. Top. Curr. Chem. 2017, 375, 43. [Google Scholar] [CrossRef] [PubMed]
- Rahimi, V.; Inzulza-Moraga, E.A.; Gómez-Díaz, D.; Freire, M.S.; González-Álvarez, J. Screening of variables affecting the selective leaching of valuable metals from waste motherboards’ PCBs. Environ. Sci. Pollut. Res. 2024, 31. [Google Scholar] [CrossRef]
- Hossain, R.; Nekouei, R.K.; Mansuri, I.; Sahajwalla, V. Sustainable recovery of Cu and Sn from problematic global waste: Exploring value from waste printed circuit boards. ACS Sustain. Chem. Eng. 2019, 7, 1006–1017. [Google Scholar] [CrossRef]
- Rao, M.D.; Singh, K.K.; Morrison, C.A.; Love, J.B. Optimization of process parameters for the selective leaching of copper, nickel and isolation of gold from obsolete mobile phone PCBs. Clean. Eng. Technol. 2021, 4, 100180. [Google Scholar] [CrossRef]
- Rajendran, S.; Priya, A.K.; Kumar, P.S.; Hoang, T.K.A.; Sekar, K.; Chong, K.Y.; et al. A critical and recent developments on adsorption technique for removal of heavy metals from wastewater-A review. Chemosphere 2022, 303, 135146. [Google Scholar] [CrossRef]
- Zhang, Y.; Yue, X.; Xu, W.; Zhang, H.; Li, F. Amino modification of rice straw-derived biochar for enhancing its cadmium (II) ions adsorption from water. J. Hazard. Mater. 2019, 379, 120783. [Google Scholar] [CrossRef]
- Yu, Z.; Weiying, L.; Wanqi, Q.; Sheng, C.; Qiaowen, T.; Zhongqing, W.; et al. The comprehensive evaluation model and optimization selection of activated carbon in the O3-BAC treatment process. J. Water Process Eng. 2021, 40, 101931. [Google Scholar] [CrossRef]
- Alhawtali, S.; El-Harbawi, M.; El Blidi, L.; Alrashed, M.M.; Alzobidi, A.; Yin, C.-Y. Date Palm Leaflet-Derived Carbon Microspheres Activated Using Phosphoric Acid for Efficient Lead (II) Adsorption. C-J. Carbon Res. 2024, 10, 26. [Google Scholar] [CrossRef]
- Azmi, S.N.H.; Al-Balushi, M.; Al-Siyabi, F.; Al-Hinai, N.; Khurshid, S. Adsorptive removal of Pb(II) ions from groundwater samples in Oman using carbonized Phoenix dactylifera seed (Date stone). J. King. Saud. Univ. Sci. 2020, 32, 2931–2938. [Google Scholar] [CrossRef]
- Gao, X.; Wu, L.; Xu, Q.; Tian, W.; Li, Z.; Kobayashi, N. Adsorption kinetics and mechanisms of copper ions on activated carbons derived from pinewood sawdust by fast H3PO4 activation. Environ. Sci. Pollut. Res. 2018, 25, 7907–7915. [Google Scholar] [CrossRef] [PubMed]
- Teğin, İ.; Öc, S.; Saka, C. Adsorption of copper (II) from aqueous solutions using adsorbent obtained with sodium hydroxide activation of biochar prepared by microwave pyrolysis. Biomass Conv. Bioref. 2024, 14. [Google Scholar] [CrossRef]
- Hoang, A.T.; Kumar, S.; Lichtfouse, E.; Cheng, C.K.; Varma, A.S.; Senthilkumar, N.; et al. Remediation of heavy metal polluted waters using activated carbon from lignocellulosic biomass: An update of recent trends. Chemosphere 2022, 302, 134825. [Google Scholar] [CrossRef]
- Ali, I.; Asim, M.; Khan, T.A. Low cost adsorbents for the removal of organic pollutants from wastewater. J. Environ. Manage. 2012, 113, 170–183. [Google Scholar] [CrossRef]
- González-García, P.; Centeno, T.A.; Urones-Garrote, E.; Ávila-Brande, D.; Otero-Díaz, L.C. Microstructure and surface properties of lignocellulosic-based activated carbons. Appl. Surf. Sci. 2013, 265, 731–737. [Google Scholar] [CrossRef]
- Mariana, M.; Khalil, A.; Mistar, E.M.; Yahya, E.B.; Alfatah, T.; Danish, M.; Amayreh, M. Recent advances in activated carbon modification techniques for enhanced heavy metal adsorption. J. Water Process Eng. 2021, 43, 102221. [Google Scholar] [CrossRef]
- Pérez-Mayoral, E.; Matos, I.; Bernardo, M.; Fonseca, I.M. New and advanced porous carbon materials in fine chemical synthesis. Emerging precursors of porous carbons. Catalysts 2019, 9, 133. [Google Scholar] [CrossRef]
- Song, M.; Jin, B.; Xiao, R.; Yang, L.; Wu, Y.; Zhong, Z.; et al. The comparison of two activation techniques to prepare activated carbon from corn cob. Catalysts 2013, 48, 250–256. [Google Scholar] [CrossRef]
- Razak, M.R.; Yusof, N.A.; Haron, M.J.; Ibrahim, N.; Mohammad, F.; Kamaruzaman, S.; et al. Iminodiacetic acid modified kenaf fiber for waste water treatment. Int. J. Biol. Macromol. 2018, 112, 754–760. [Google Scholar] [CrossRef] [PubMed]
- Chen, J.; Zhang, L.; Yang, G.; Wang, Q.; Li, R.; Lucia, L.A. Preparation and characterization of activated carbon from hydrochar by phosphoric acid activation and its adsorption performance in prehydrolysis liquor. Bioresources 2017, 12, 5928–5941. [Google Scholar] [CrossRef]
- Sarwar, A.; Ali, M.; Khoja, A.H.; Nawar, A.; Waqas, A.; Liaquat, R.; et al. Synthesis and characterization of biomass-derived surface-modified activated carbon for enhanced CO2 adsorption. J. CO2 Util. 2021, 46, 101476. [Google Scholar] [CrossRef]
- Yakout, S.M.; El-Deen, G.S. Characterization of activated carbon prepared by phosphoric acid activation of olive stones. Arab. J. Chem. 2016, 9, S1155–S1162. [Google Scholar] [CrossRef]
- Chomiak, K.; Gryglewicz, S.; Kierzek, K.; Machnikowski, J. Optimizing the properties of granular walnut-shell based KOH activated carbons for carbon dioxide adsorption. J CO2 Util. 2017, 21, 436–443. [Google Scholar] [CrossRef]
- Zhou, J.; Yang, P.; Kots, P.A.; Cohen, M.; Chen, Y.; Quinn, C.M.; et al. Tuning the reactivity of carbon surfaces with oxygen-containing functional groups. Nat. Commun. 2023, 14, 2293. [Google Scholar] [CrossRef]
- Serafin, J.; Narkiewicz, U.; Morawski, A.W.; Wróbel, R.J.; Michalkiewicz, B. Highly microporous activated carbons from biomass for CO2 capture and effective micropores at different conditions. J. CO2. Util. 2017, 18, 73–79. [Google Scholar] [CrossRef]
- Li, Q.; Liu, S.; Peng, W.; Zhu, W.; Wang, L.; Chen, F.; et al. Preparation of biomass-derived porous carbons by a facile method and application to CO2 adsorption. J. Taiwan Inst. Chem. Eng. 2020, 116, 128–136. [Google Scholar] [CrossRef]
- Liu, X.; Sun, Y.; Liu, J.; Sun, C.; Liu, H.; Xue, Q.; et al. Potassium and zeolitic structure modified ultra-microporous adsorbent materials from a renewable feedstock with favorable surface chemistry for CO2 capture. ACS Appl. Mater. Interfaces 2017, 32, 26826–26839. [Google Scholar] [CrossRef]
- Sher, F.; Iqbal, S.Z.; Albazzaz, S.; Ali, U.; Mortari, D.A.; Rashid, T. Development of biomass derived highly porous fast adsorbents for post-combustion CO2 capture. Fuel 2020, 282, 118506. [Google Scholar] [CrossRef]
- Wang, K.; Zhao, N.; Lei, S.; Yan, R.; Tian, X.; Wang, J.; et al. Promising biomass-based activated carbons derived from willow catkins for high performance supercapacitors. Electrochim. Acta 2015, 166, 1–11. [Google Scholar] [CrossRef]
- Piccirillo, C.; Moreira, I.S.; Novais, R.M.; Fernandes, A.J.S.; Pullar, R.C.; Castro, P.M.L. Biphasic apatite-carbon materials derived from pyrolysed fish bones for effective adsorption of persistent pollutants and heavy metals. J. Environ. Chem. Eng. 2017, 5, 4884–4894. [Google Scholar] [CrossRef]
- Vol, S.; Ban, I.; Derofenik, M.; Buksek, H.; Gyergyek, S.; Petrinic, I.; et al. Microwave synthesis of poly(acrylic) acid-coated magnetic nanoparticles as draw solutes in forward osmosis. Materials 2023, 16, 4138. [Google Scholar] [CrossRef] [PubMed]
- Hao, G.P.; Li, W.C.; Qian, D.; Lu, A.H. Rapid synthesis of nitrogen-doped porous carbon monolith for CO2 capture. Adv. Mater. 2010, 22, 853–857. [Google Scholar] [CrossRef]
- Daffalla, S.B.; Mukhtar, H.; Shaharun, M.S. Properties of activated carbon prepared from rice husk with chemical activation. Int. J. Glob. Environ. Issues 2012, 12, 107–129. [Google Scholar] [CrossRef]
- Liou, T.H.; Wu, S.J. Characteristics of microporous/mesoporous carbons prepared from rice husk under base- and acid-treated conditions. J. Hazard. Mater. 2009, 171, 693–703. [Google Scholar] [CrossRef]
- Zhao, H.; Zhong, H.; Jiang, Y.; Li, H.; Tang, P.; Li, D.; et al. Porous ZnCl2-activated carbon from shaddock peel: Methylene blue adsorption behavior. Materials 2022, 15, 895. [Google Scholar] [CrossRef]
- Zhang, J.; Xia, X.; Li, K.; Shen, Y.; Xue, Y. New insights into temperature-induced mechanisms of copper adsorption enhancement on hydroxyapatite-in situ self-doped fluffy bread-like biochar. Chem. Eng. J. 2024, 479, 147657. [Google Scholar] [CrossRef]
- Alanazi, A.G.; Habila, M.A.; ALOthman, Z.A.; Badjah-Hadj-Ahmed, A.Y. Synthesis and characterization of zinc oxide nanoparticle anchored carbon as hybrid adsorbent materials for effective heavy metals uptake from wastewater. Crystals 2024, 14, 447. [Google Scholar] [CrossRef]
- Chen, W.-S.; Chen, Y.-C.; Lee, C.H. Modified activated carbon for copper ion removal from aqueous solution. Processes 2022, 10, 150. [Google Scholar] [CrossRef]
- Al-Degs, Y.S.; El-Barghouthi, M.I.; El-Sheikh, A.H.; Walker, G.M. Effect of solution pH, ionic strength, and temperature on adsorption behavior of reactive dyes on activated carbon. Dyes Pigm. 2008, 77, 16–23. [Google Scholar] [CrossRef]
- Kikuchi, Y.; Qian, Q.; Machida, M.; Tatsumoto, H. Effect of ZnO loading to activated carbon on Pb (II) adsorption from aqueous solution. Carbon 2006, 44, 195–202. [Google Scholar] [CrossRef]
- Rahimi, V.; Ferreiro-Salgado, A.; Gómez-Díaz, D.; Freire, M.S.; González-Álvarez, J. Evaluating the performance of carbon-based adsorbents fabricated from renewable biomass precursors for post-combustion CO2 capture. Sep. Purif. Technol. 2024, 344, 127110. [Google Scholar] [CrossRef]
- Siipola, V.; Tamminen, T.; Källi, A.; Lahti, R.; Romar, H.; Rasa, K., et al. Effects of biomass type, carbonization process, and activation method on the properties of bio-based activated carbons. Biores 2018, 13, 5976–6002. [CrossRef]
- Liu, Z.; Huang, Y.; Zhao, G. Preparation and characterization of activated carbon fibers from liquefied wood by ZnCl2 activation. Biores 2016, 11, 3178–3190. [Google Scholar] [CrossRef]
- Singh, G.; Kim, I.Y.; Lakhi, K.S.; Srivastava, P.; Naidu, R.; Vinu, A. Single step synthesis of activated bio-carbons with a high surface area and their excellent CO2 adsorption capacity. Carbon 2017, 116, 448–455. [Google Scholar] [CrossRef]
- Rukayat, O.O.; Usman, M.F.; Elizabeth, O.M.; Abosede, O.O.; Faith, I.U. Kinetic adsorption of heavy metal (copper) on rubber (Hevea Brasiliensis) leaf powder. S. Afr. J. Chem. Eng. 2021, 37, 74–80. [Google Scholar] [CrossRef]
- Darweesh, M.A.; Elgendy, M.Y.; Ayad, M.I.; Ahmed, A.M.; Elsayed, N.M.K.; Hammad, W.A. Adsorption isotherm, kinetic, and optimization studies for copper (II) removal from aqueous solutions by banana leaves and derived activated carbon. S. Afr. J. Chem. Eng. 2022, 40, 10–20. [Google Scholar] [CrossRef]
- Girgis, B.S.; Alaya, M.N.; Sherif, I.E.; Fathy, N.A. Development of porosity and copper (II) ion adsorption capacity by activated nano-carbon xerogels in relation to treatment schemes. Adsorpt. Sci. Technol. 2011, 29, 943–961. [Google Scholar] [CrossRef]
- Chen, H.; Pan, Y.; Zhang, W.; Long, A.; Chen, M.; Xiao, X.; et al. Adsorption-desorption of copper (II) by temperature-sensitive nano-biochar@PNIPAM/alginate double-network composite hydrogel: Enhanced mechanisms and application potentials. Chem. Eng. J. 2024, 495, 153356. [Google Scholar] [CrossRef]
- Dowlatshahi, S.; Torbati, A.R.H.; Loloei, M. Adsorption of copper, lead and cadmium from aqueous solutions by activated carbon prepared from saffron leaves. Environ. Health Eng. Manag. J. 2014, 1, 37–44, http://ehemj.com/article-1-43-en.html. [Google Scholar]
- Zhou, X-Y; Wu, Y-W.; Cai, Q.; Mi, T-G.; Zhang, B.; Zhao, L.; et al. Interaction mechanism between lead species and activated carbon in MSW incineration flue gas: Role of different functional groups. Chem. Eng J. 2022, 436, 135252. [CrossRef]
Figure 1.
SEM images of carbons produced from olive stones. (A) OSC; (B) OSACK1; (C) OSACK2; (D) OSACP1; (E) OSACP2; (F) OSACZ1; (G) OSACZ2.
Figure 1.
SEM images of carbons produced from olive stones. (A) OSC; (B) OSACK1; (C) OSACK2; (D) OSACP1; (E) OSACP2; (F) OSACZ1; (G) OSACZ2.
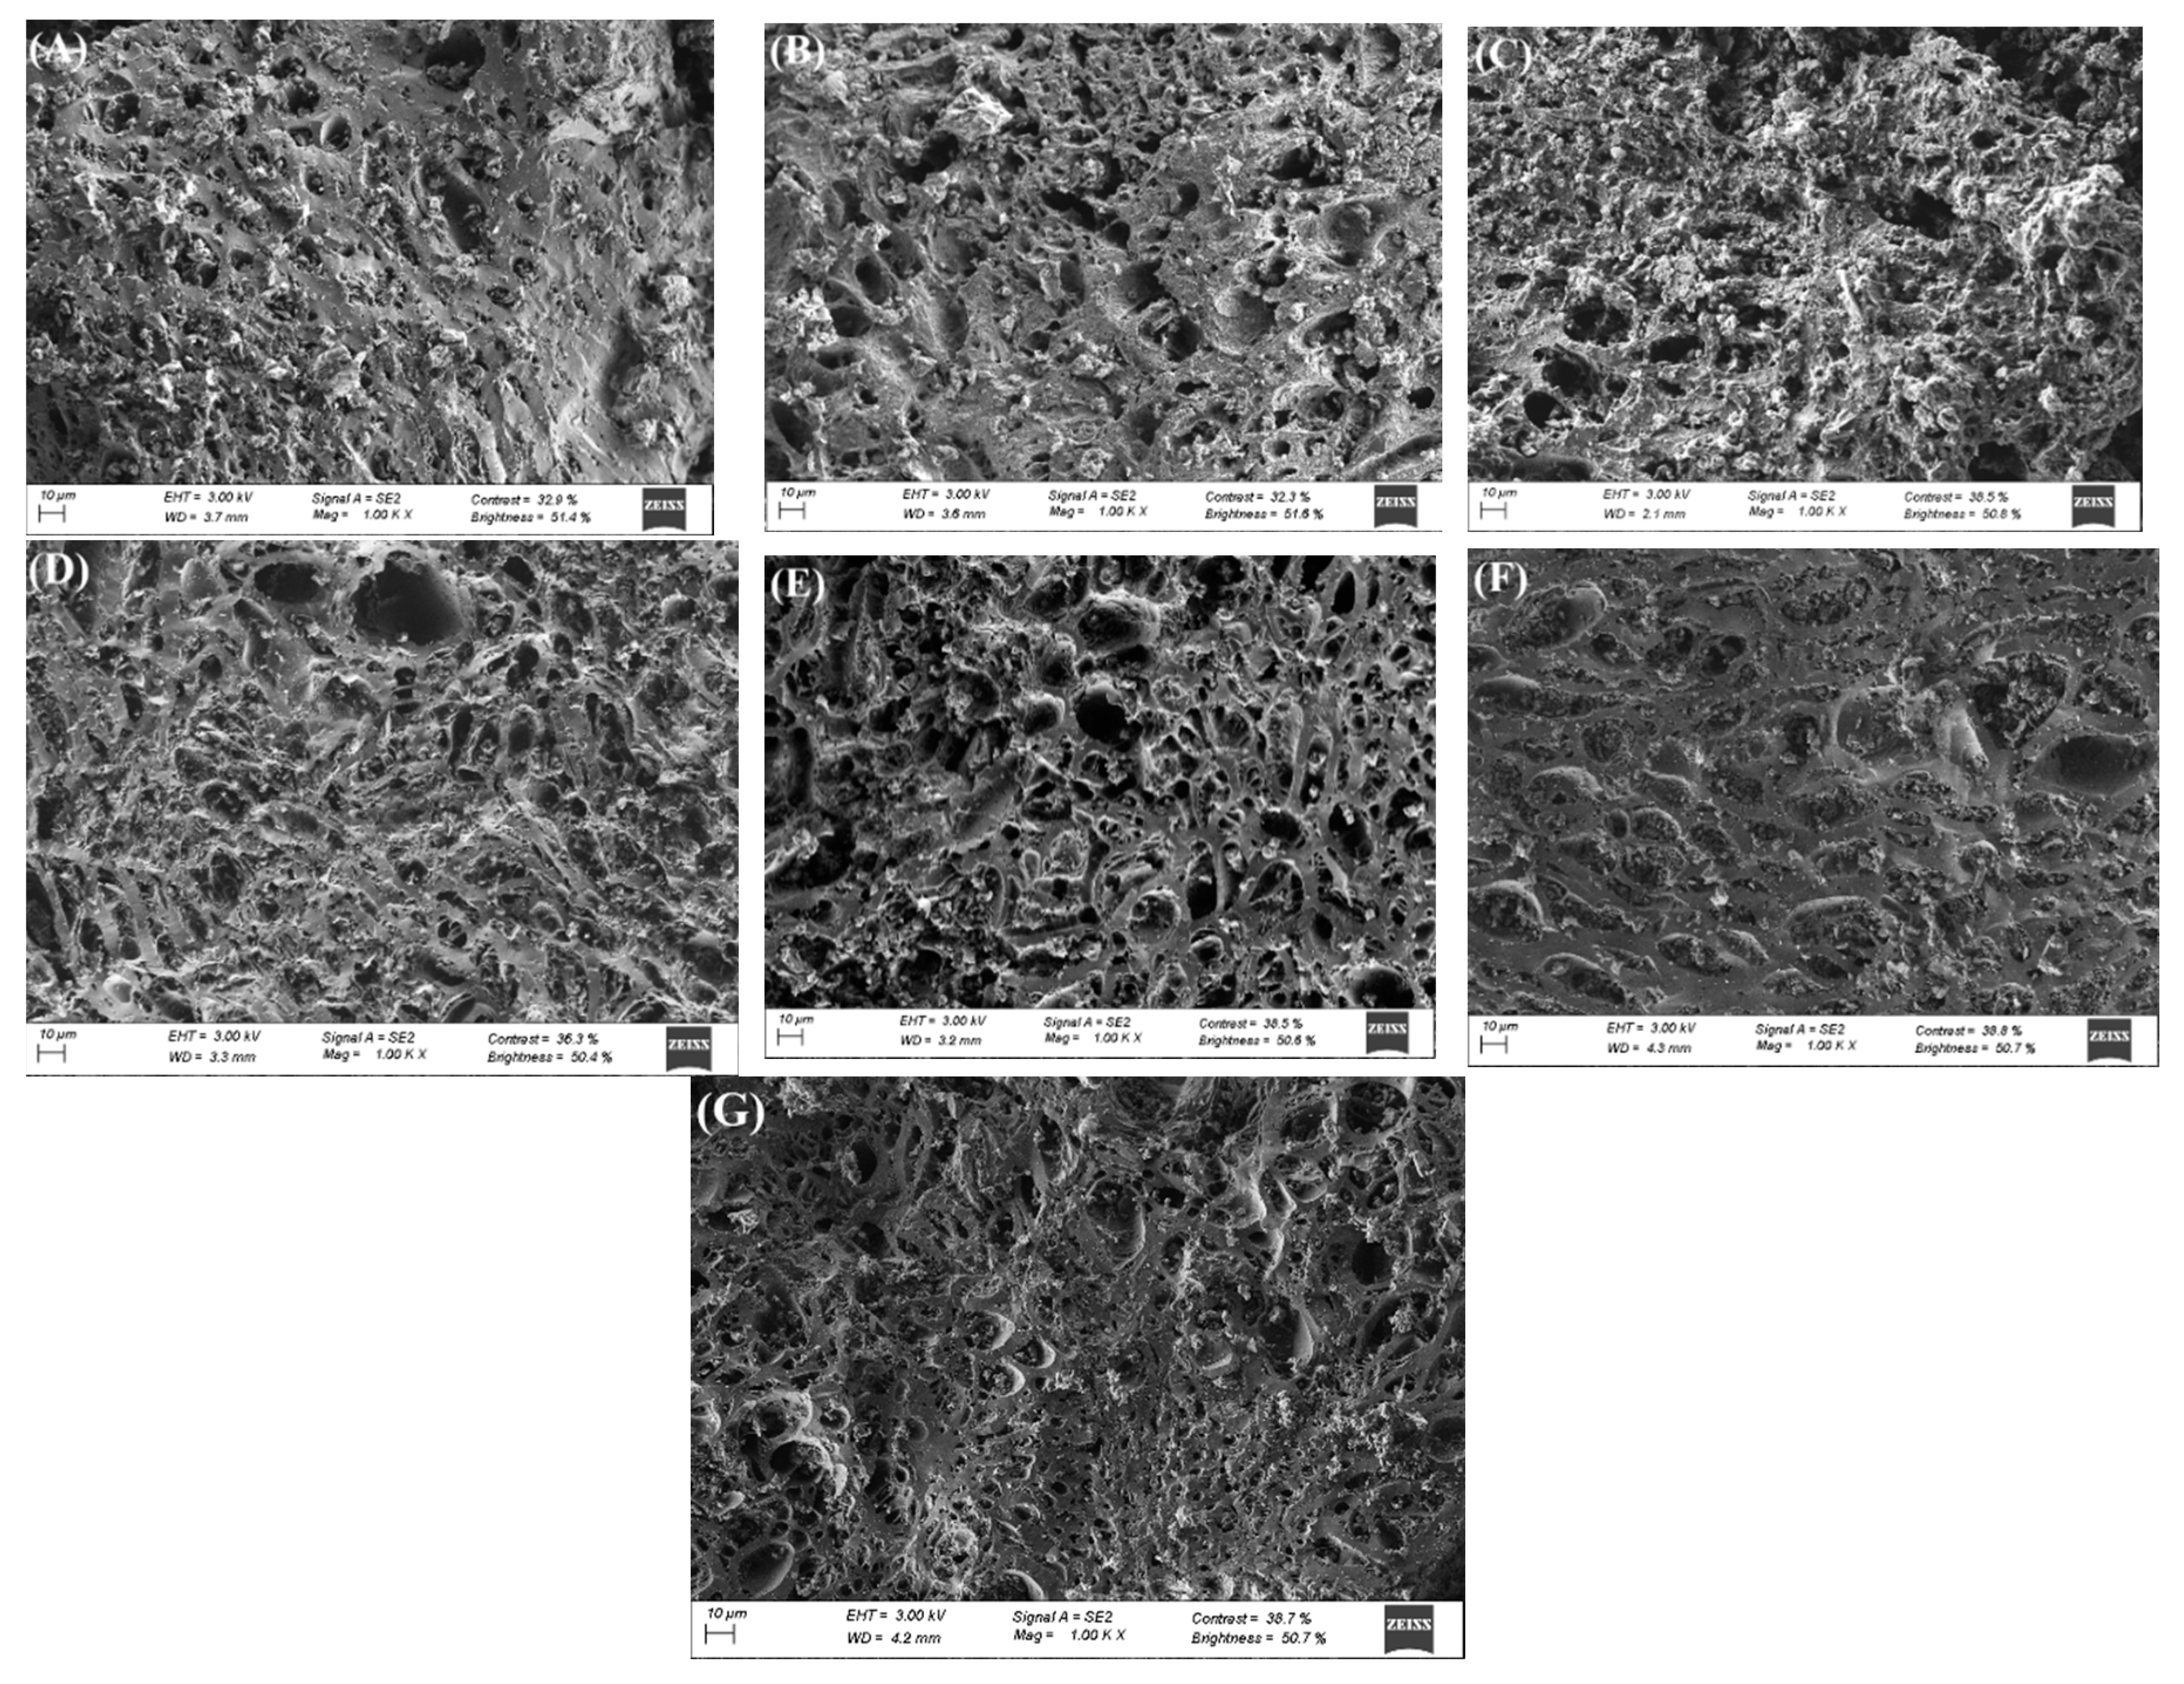
Figure 2.
SEM images of carbons produced from almond shells. (A) ASC; (B) ASACK1; (C) ASACK2; (D) ASACP1; (E) ASACP2; (F) ASACZ1; (G) ASACZ2.
Figure 2.
SEM images of carbons produced from almond shells. (A) ASC; (B) ASACK1; (C) ASACK2; (D) ASACP1; (E) ASACP2; (F) ASACZ1; (G) ASACZ2.
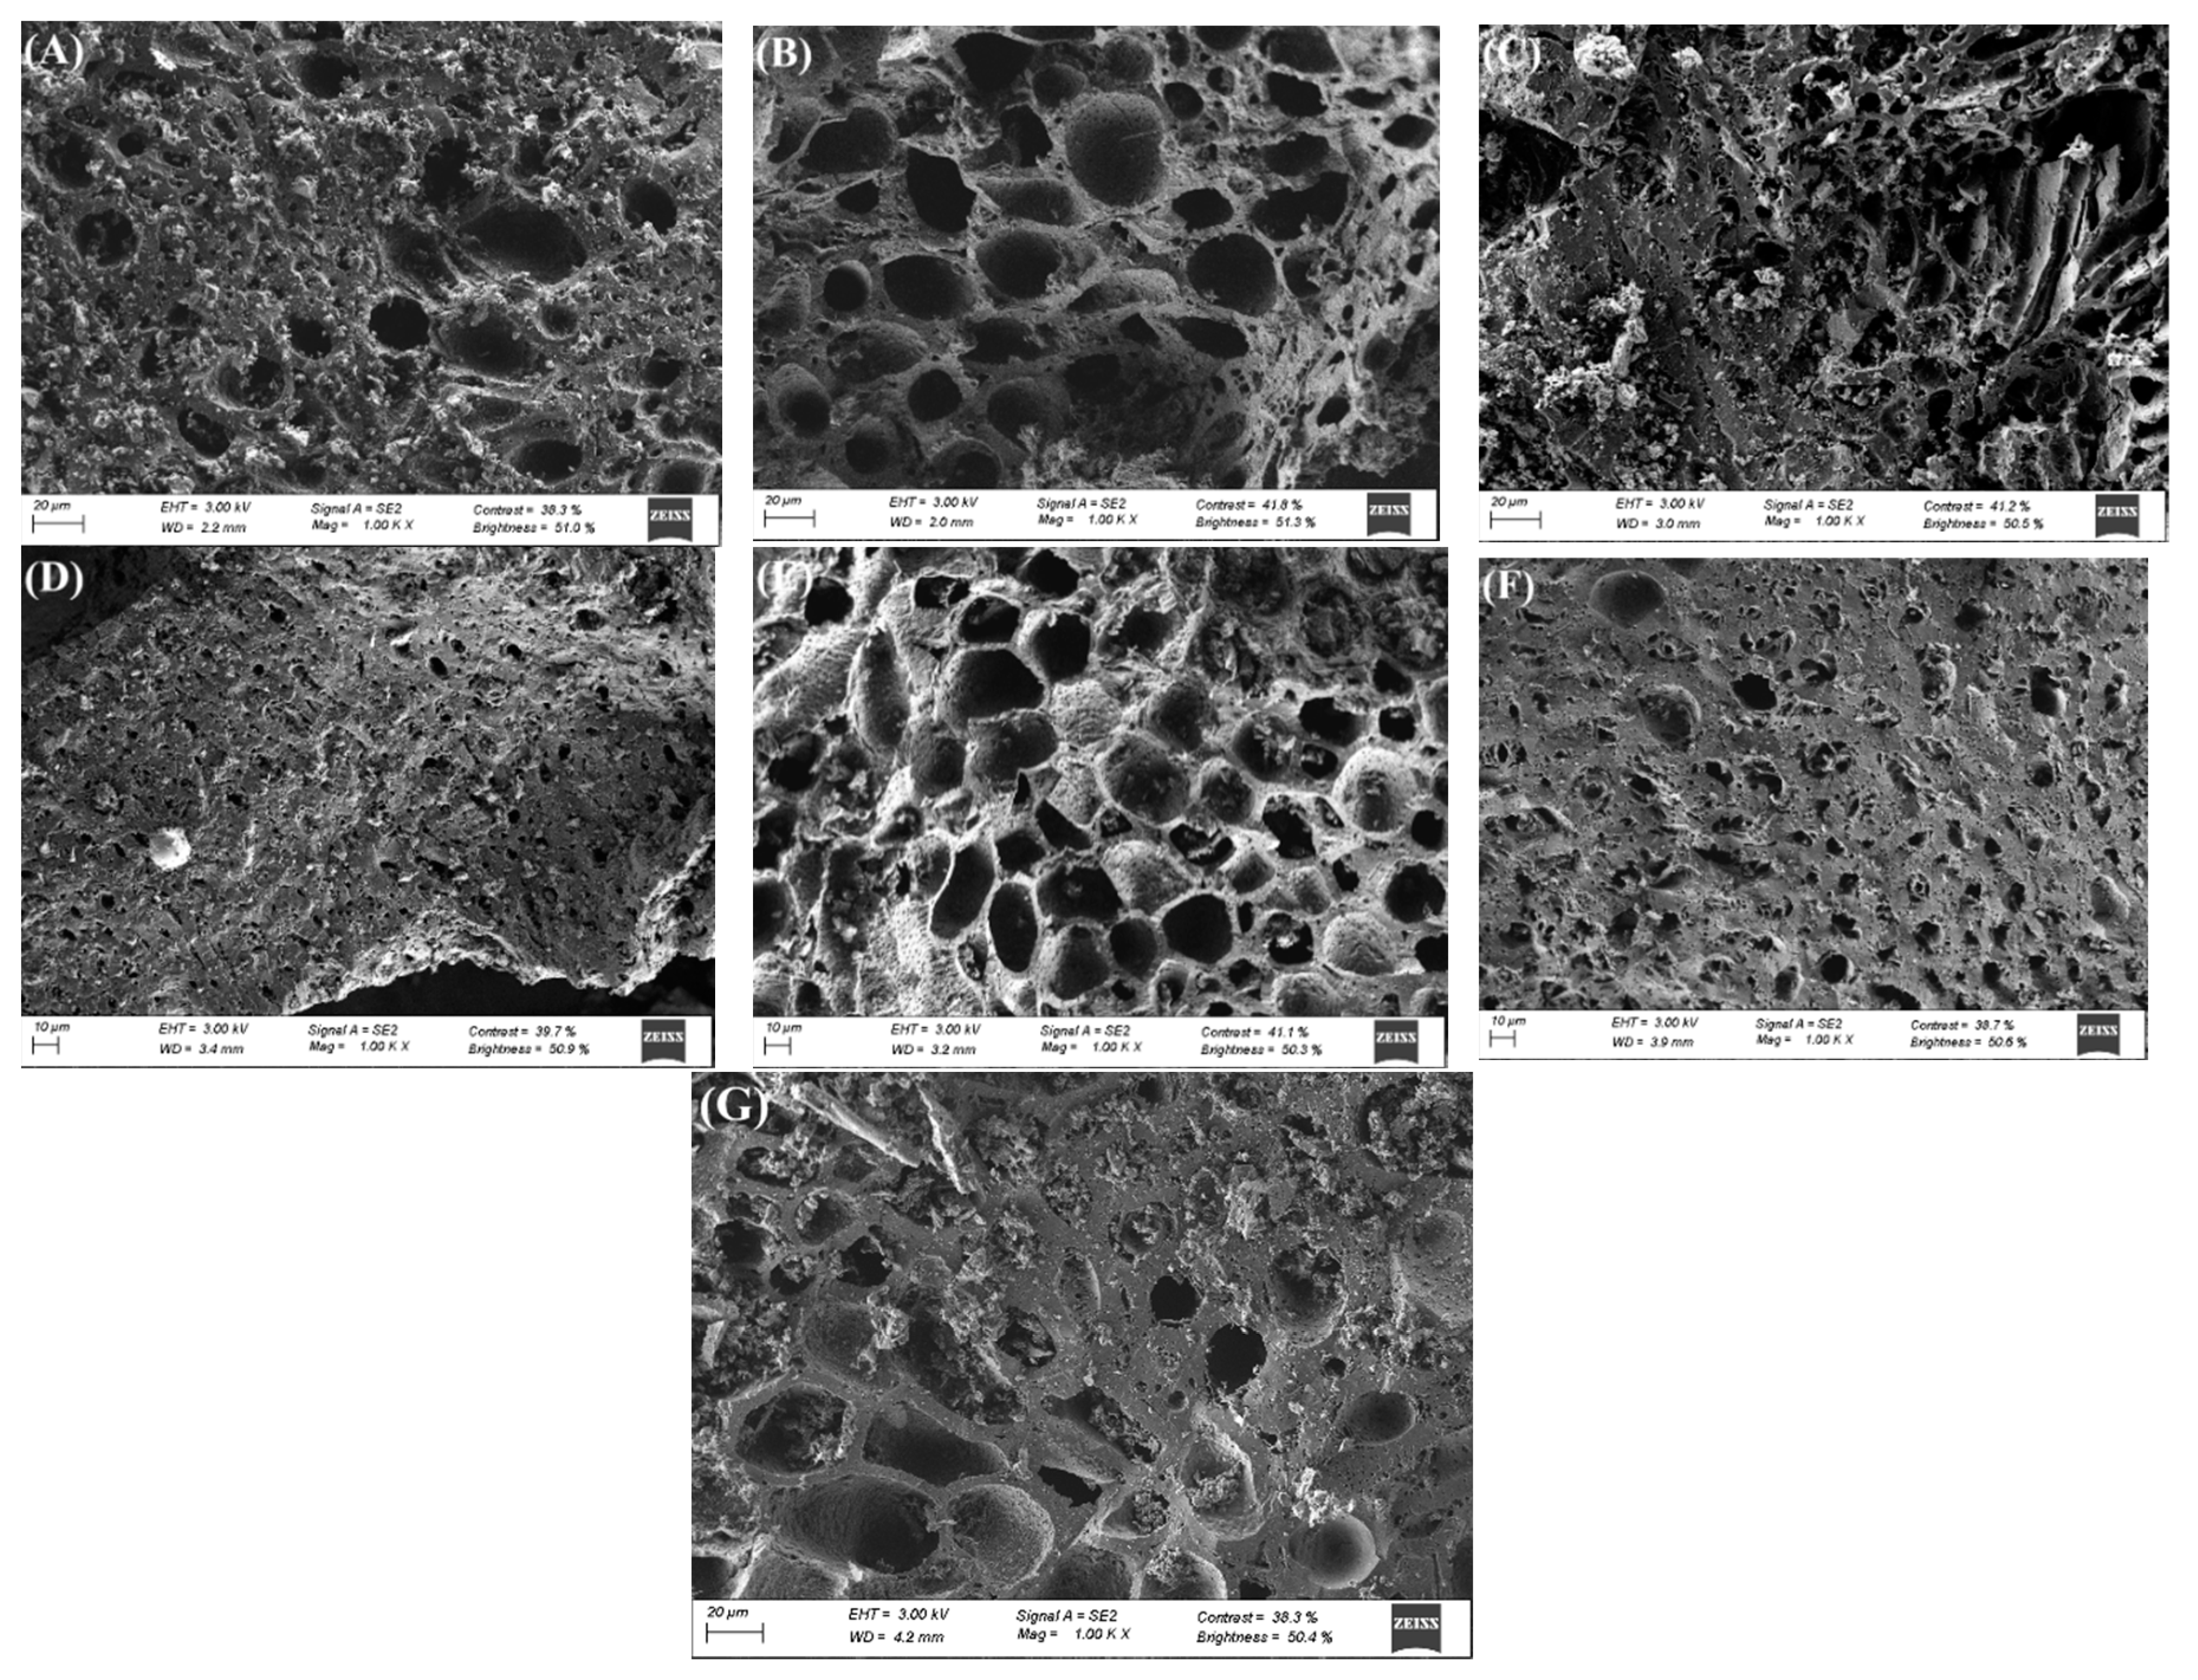
Figure 3.
N2 adsorption-desorption isotherms at -196.15°C for carbons produced from biomass precursors. (A) and (C) almond shell-based carbons; (B) and (D) olive stone-based carbons.
Figure 3.
N2 adsorption-desorption isotherms at -196.15°C for carbons produced from biomass precursors. (A) and (C) almond shell-based carbons; (B) and (D) olive stone-based carbons.
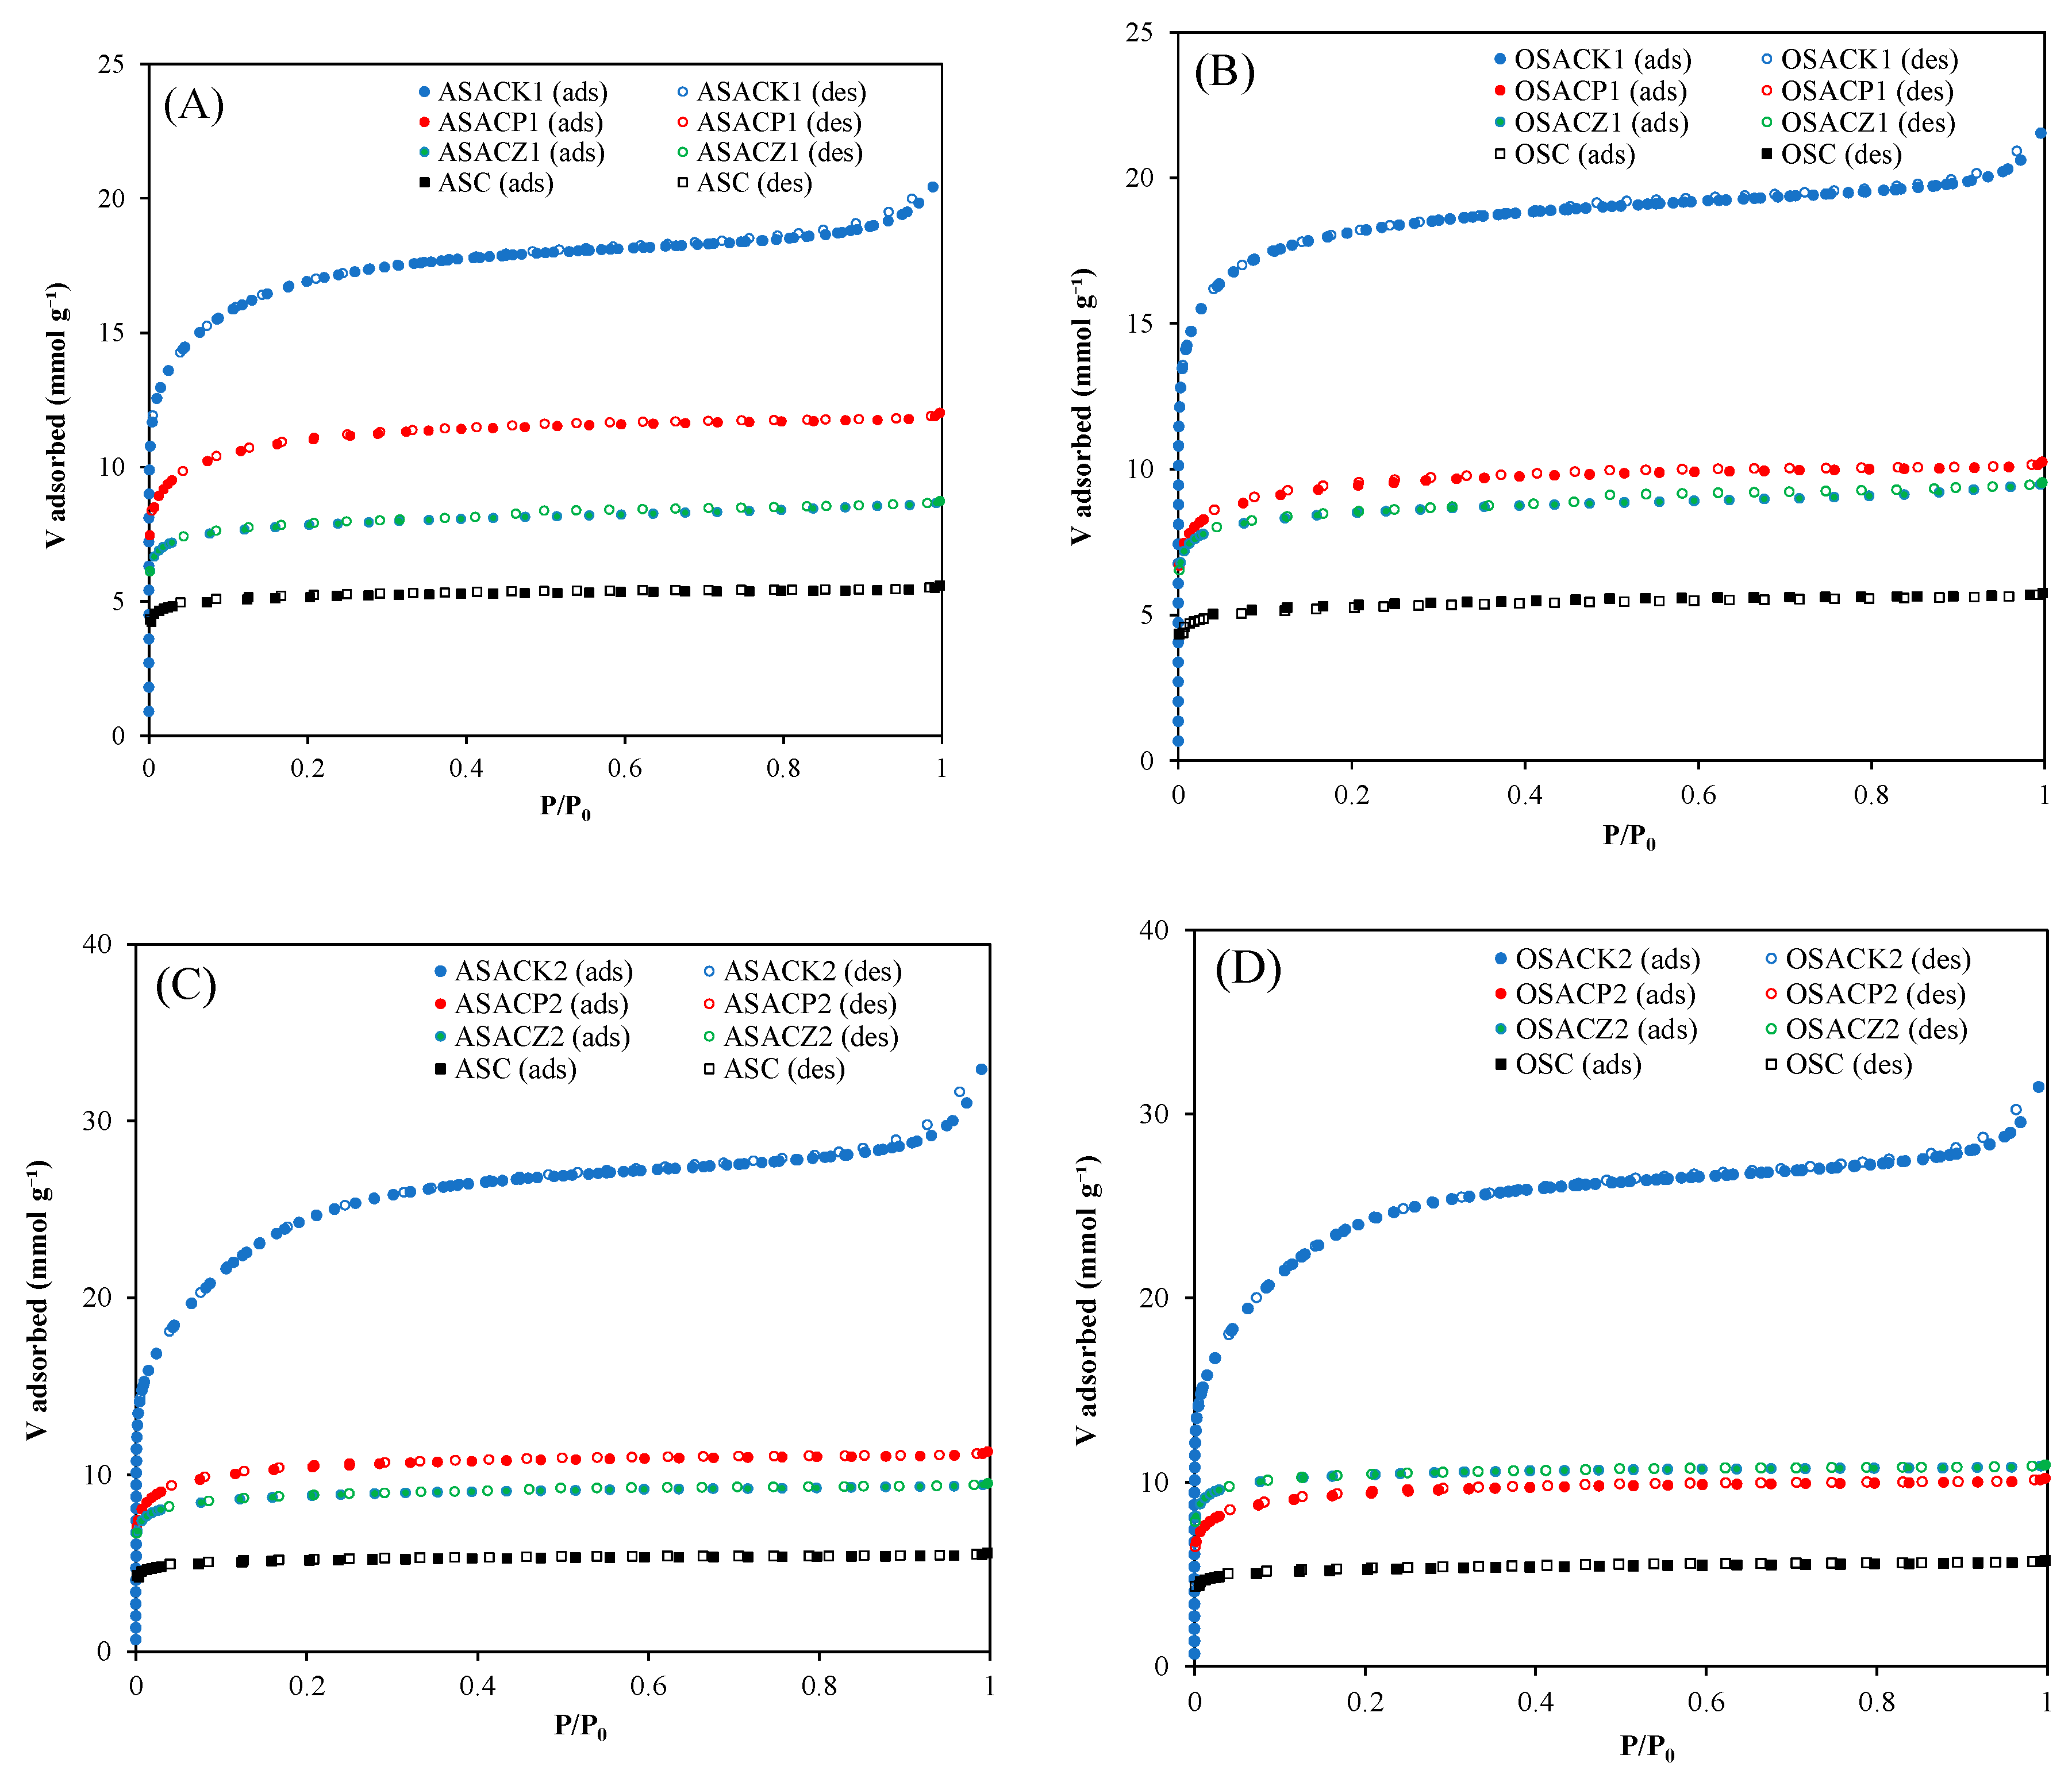
Figure 4.
CO2 adsorption isotherms at 0°C. (A) olive stone-based carbons; (B) almond shell-based carbons.
Figure 4.
CO2 adsorption isotherms at 0°C. (A) olive stone-based carbons; (B) almond shell-based carbons.
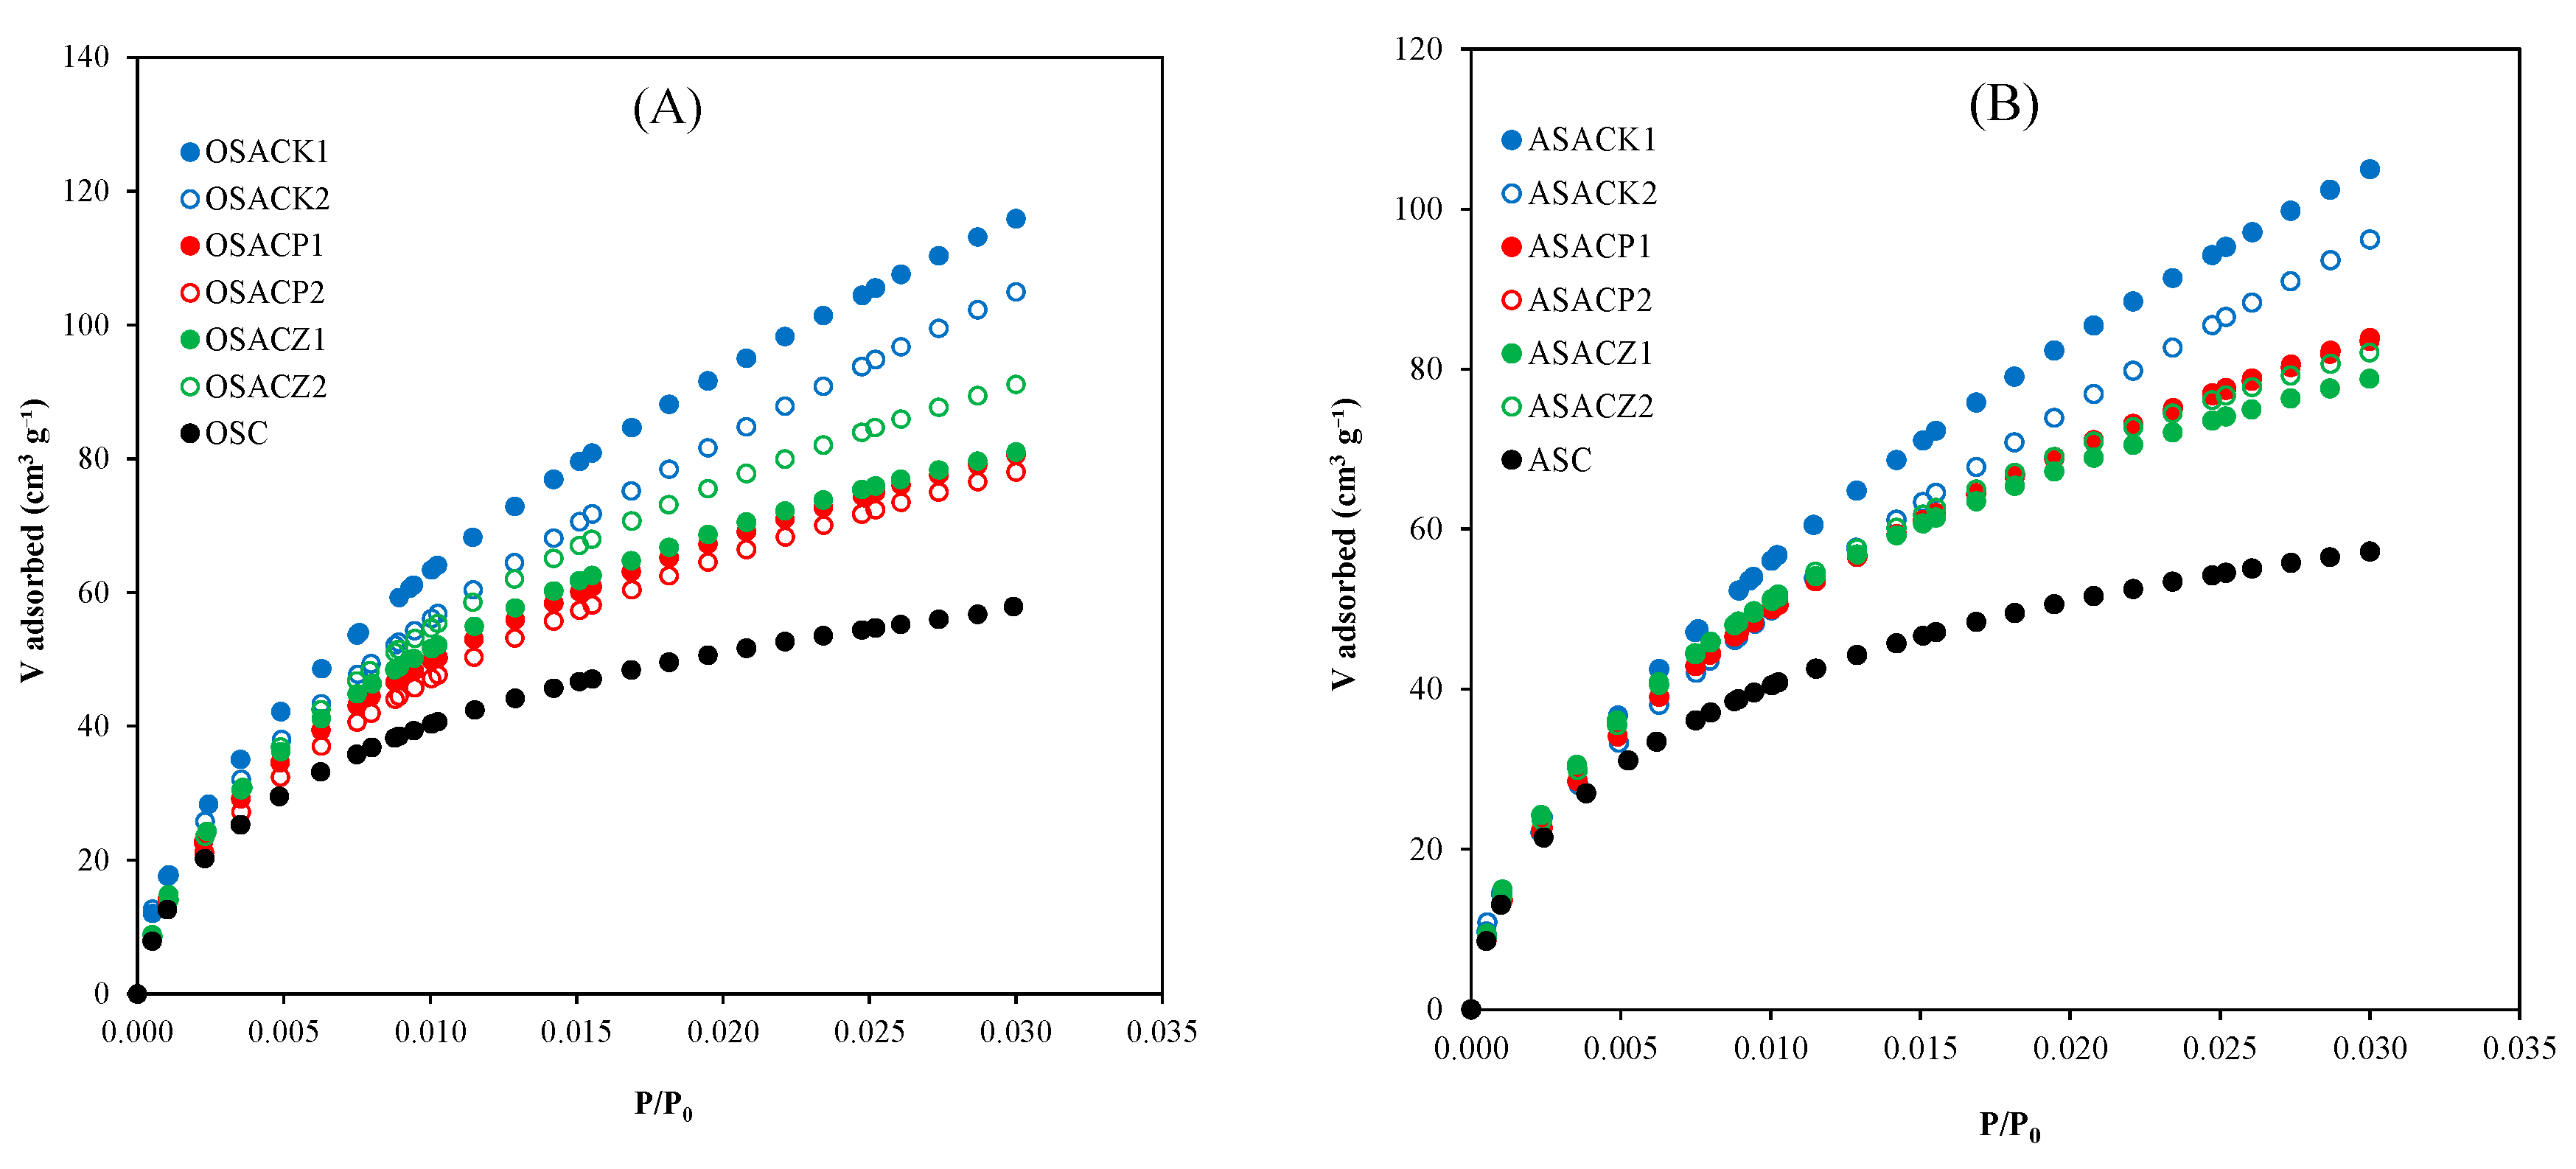
Figure 5.
XRD patterns of carbons produced from biomass precursors. (A) non-activated carbons; (B) KOH-activated carbons; (C) H3PO4-activated carbons; (D) ZnCl2-activated carbons.
Figure 5.
XRD patterns of carbons produced from biomass precursors. (A) non-activated carbons; (B) KOH-activated carbons; (C) H3PO4-activated carbons; (D) ZnCl2-activated carbons.
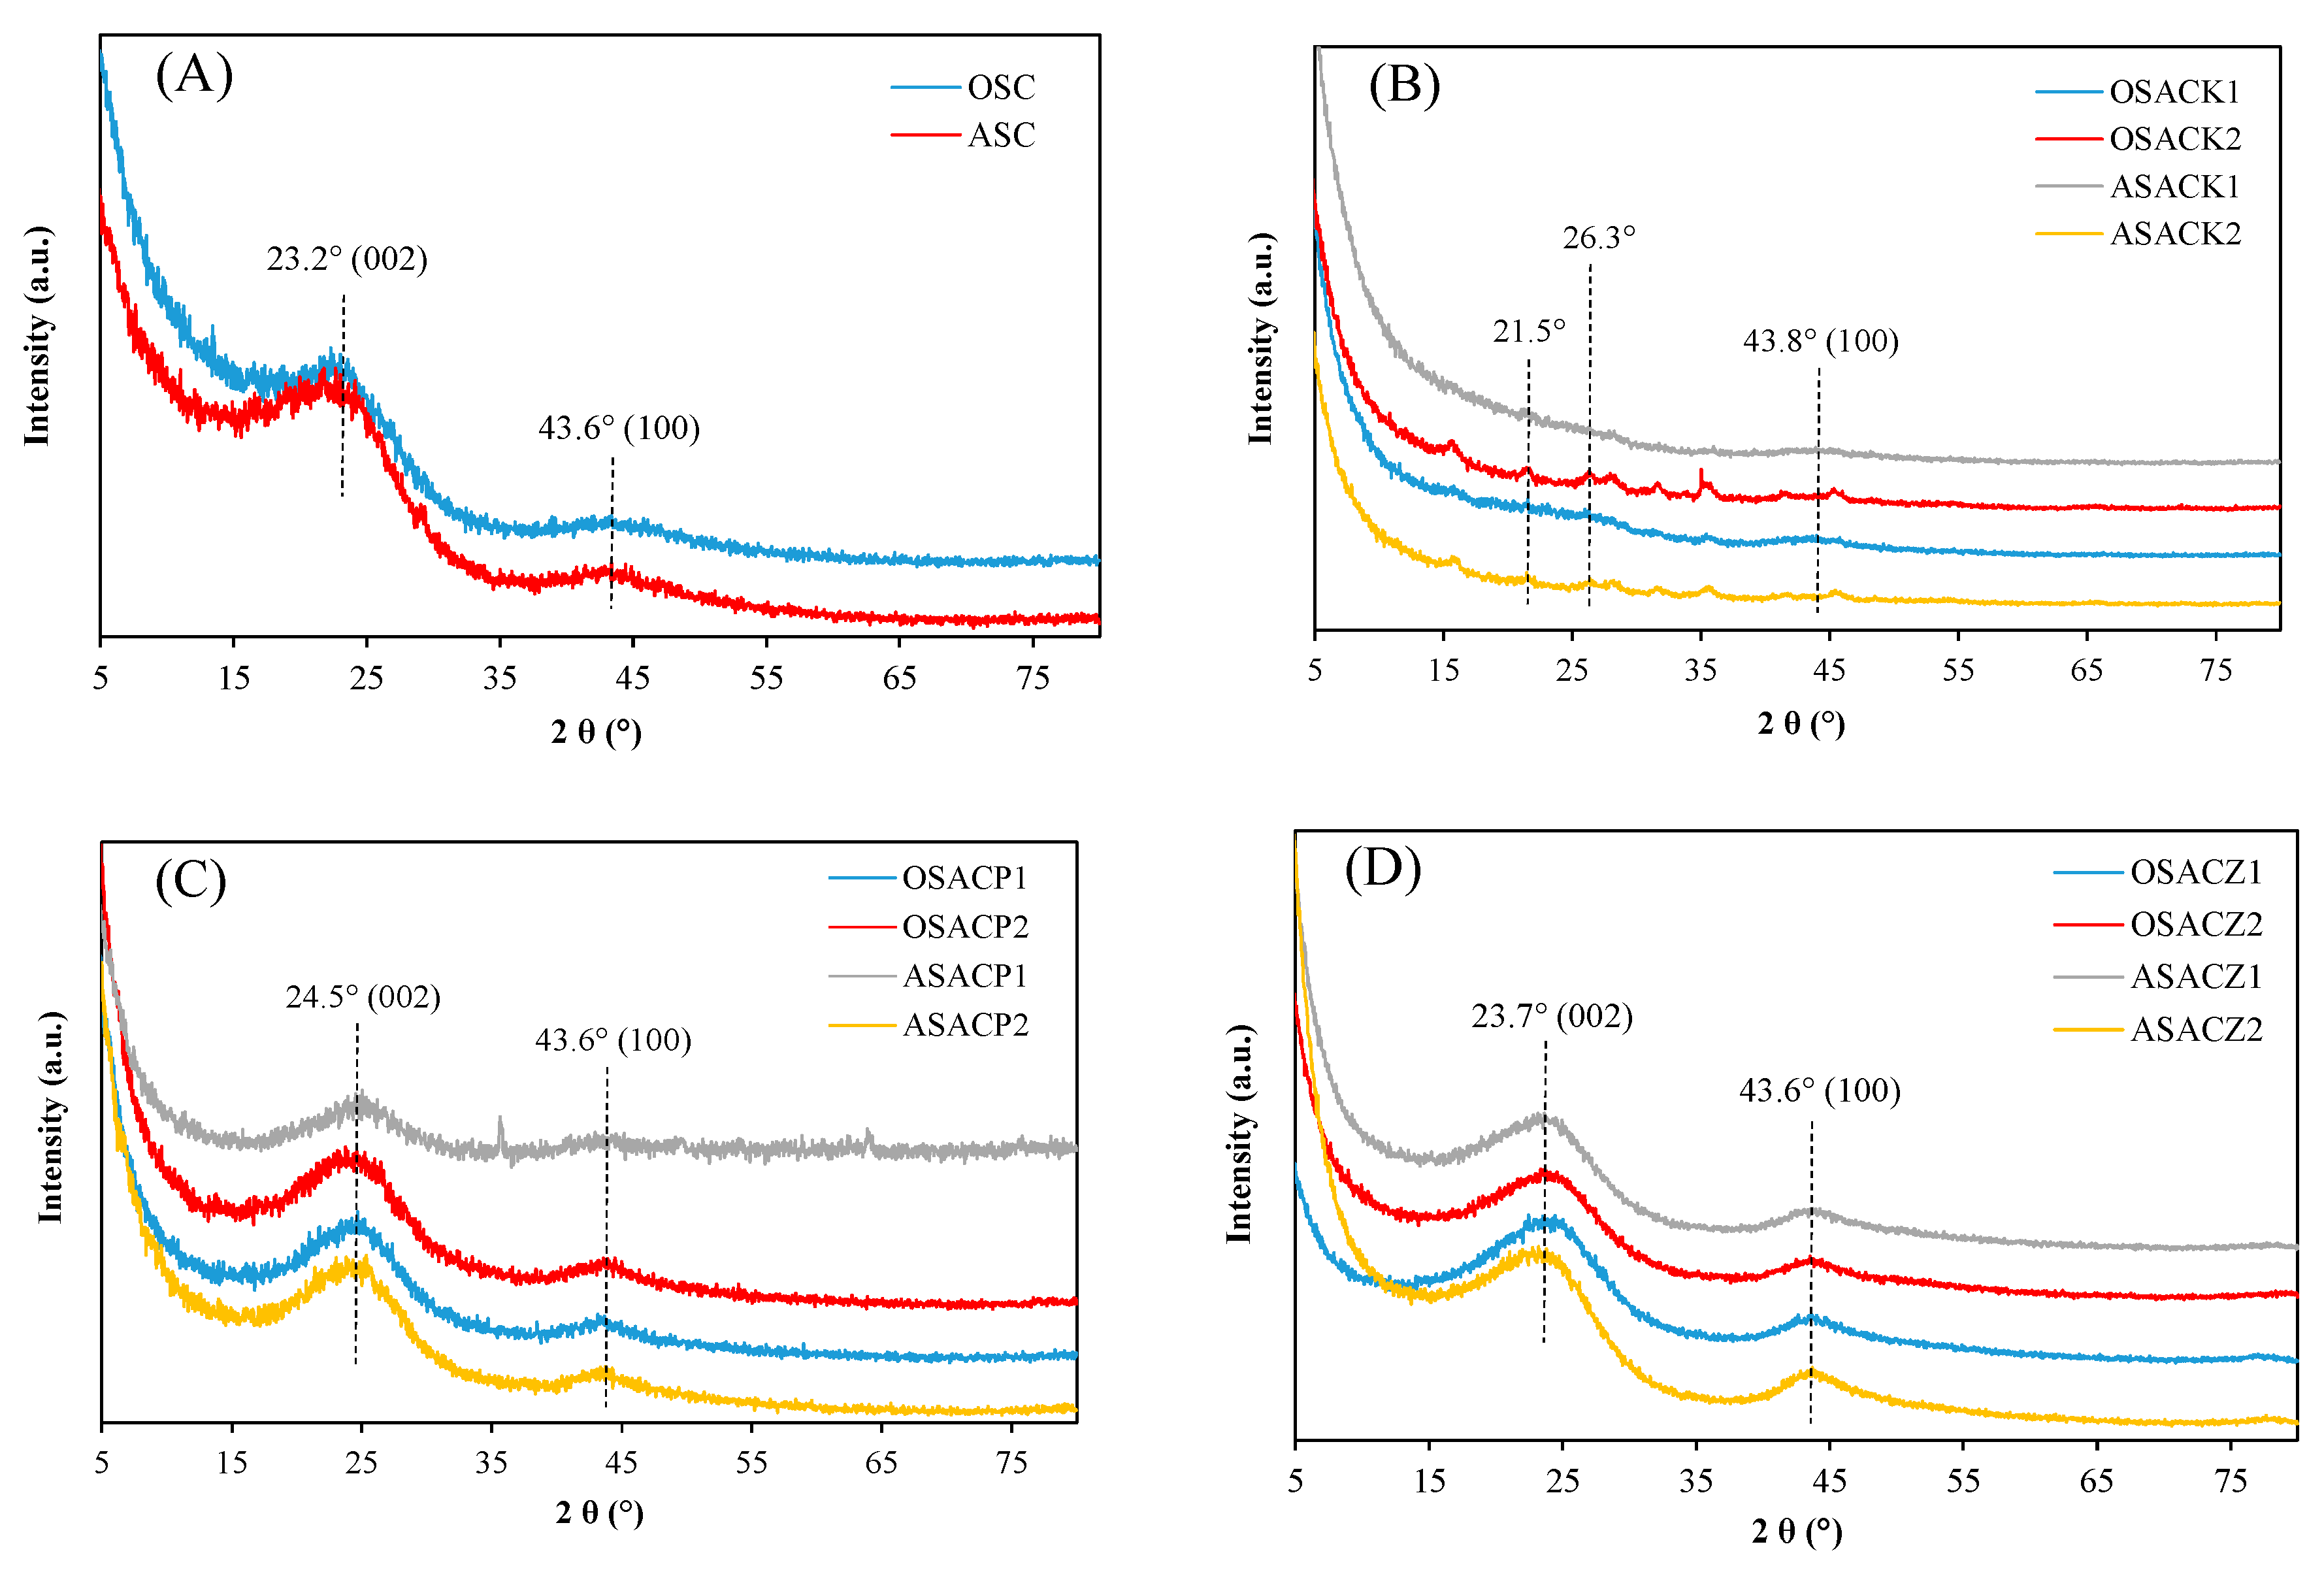
Figure 6.
FTIR spectra of carbons produced from biomass precursors. (A) non-activated carbons; (B) KOH-activated carbons; (C) H3PO4-activated carbons; (D) ZnCl2-activated carbons.
Figure 6.
FTIR spectra of carbons produced from biomass precursors. (A) non-activated carbons; (B) KOH-activated carbons; (C) H3PO4-activated carbons; (D) ZnCl2-activated carbons.
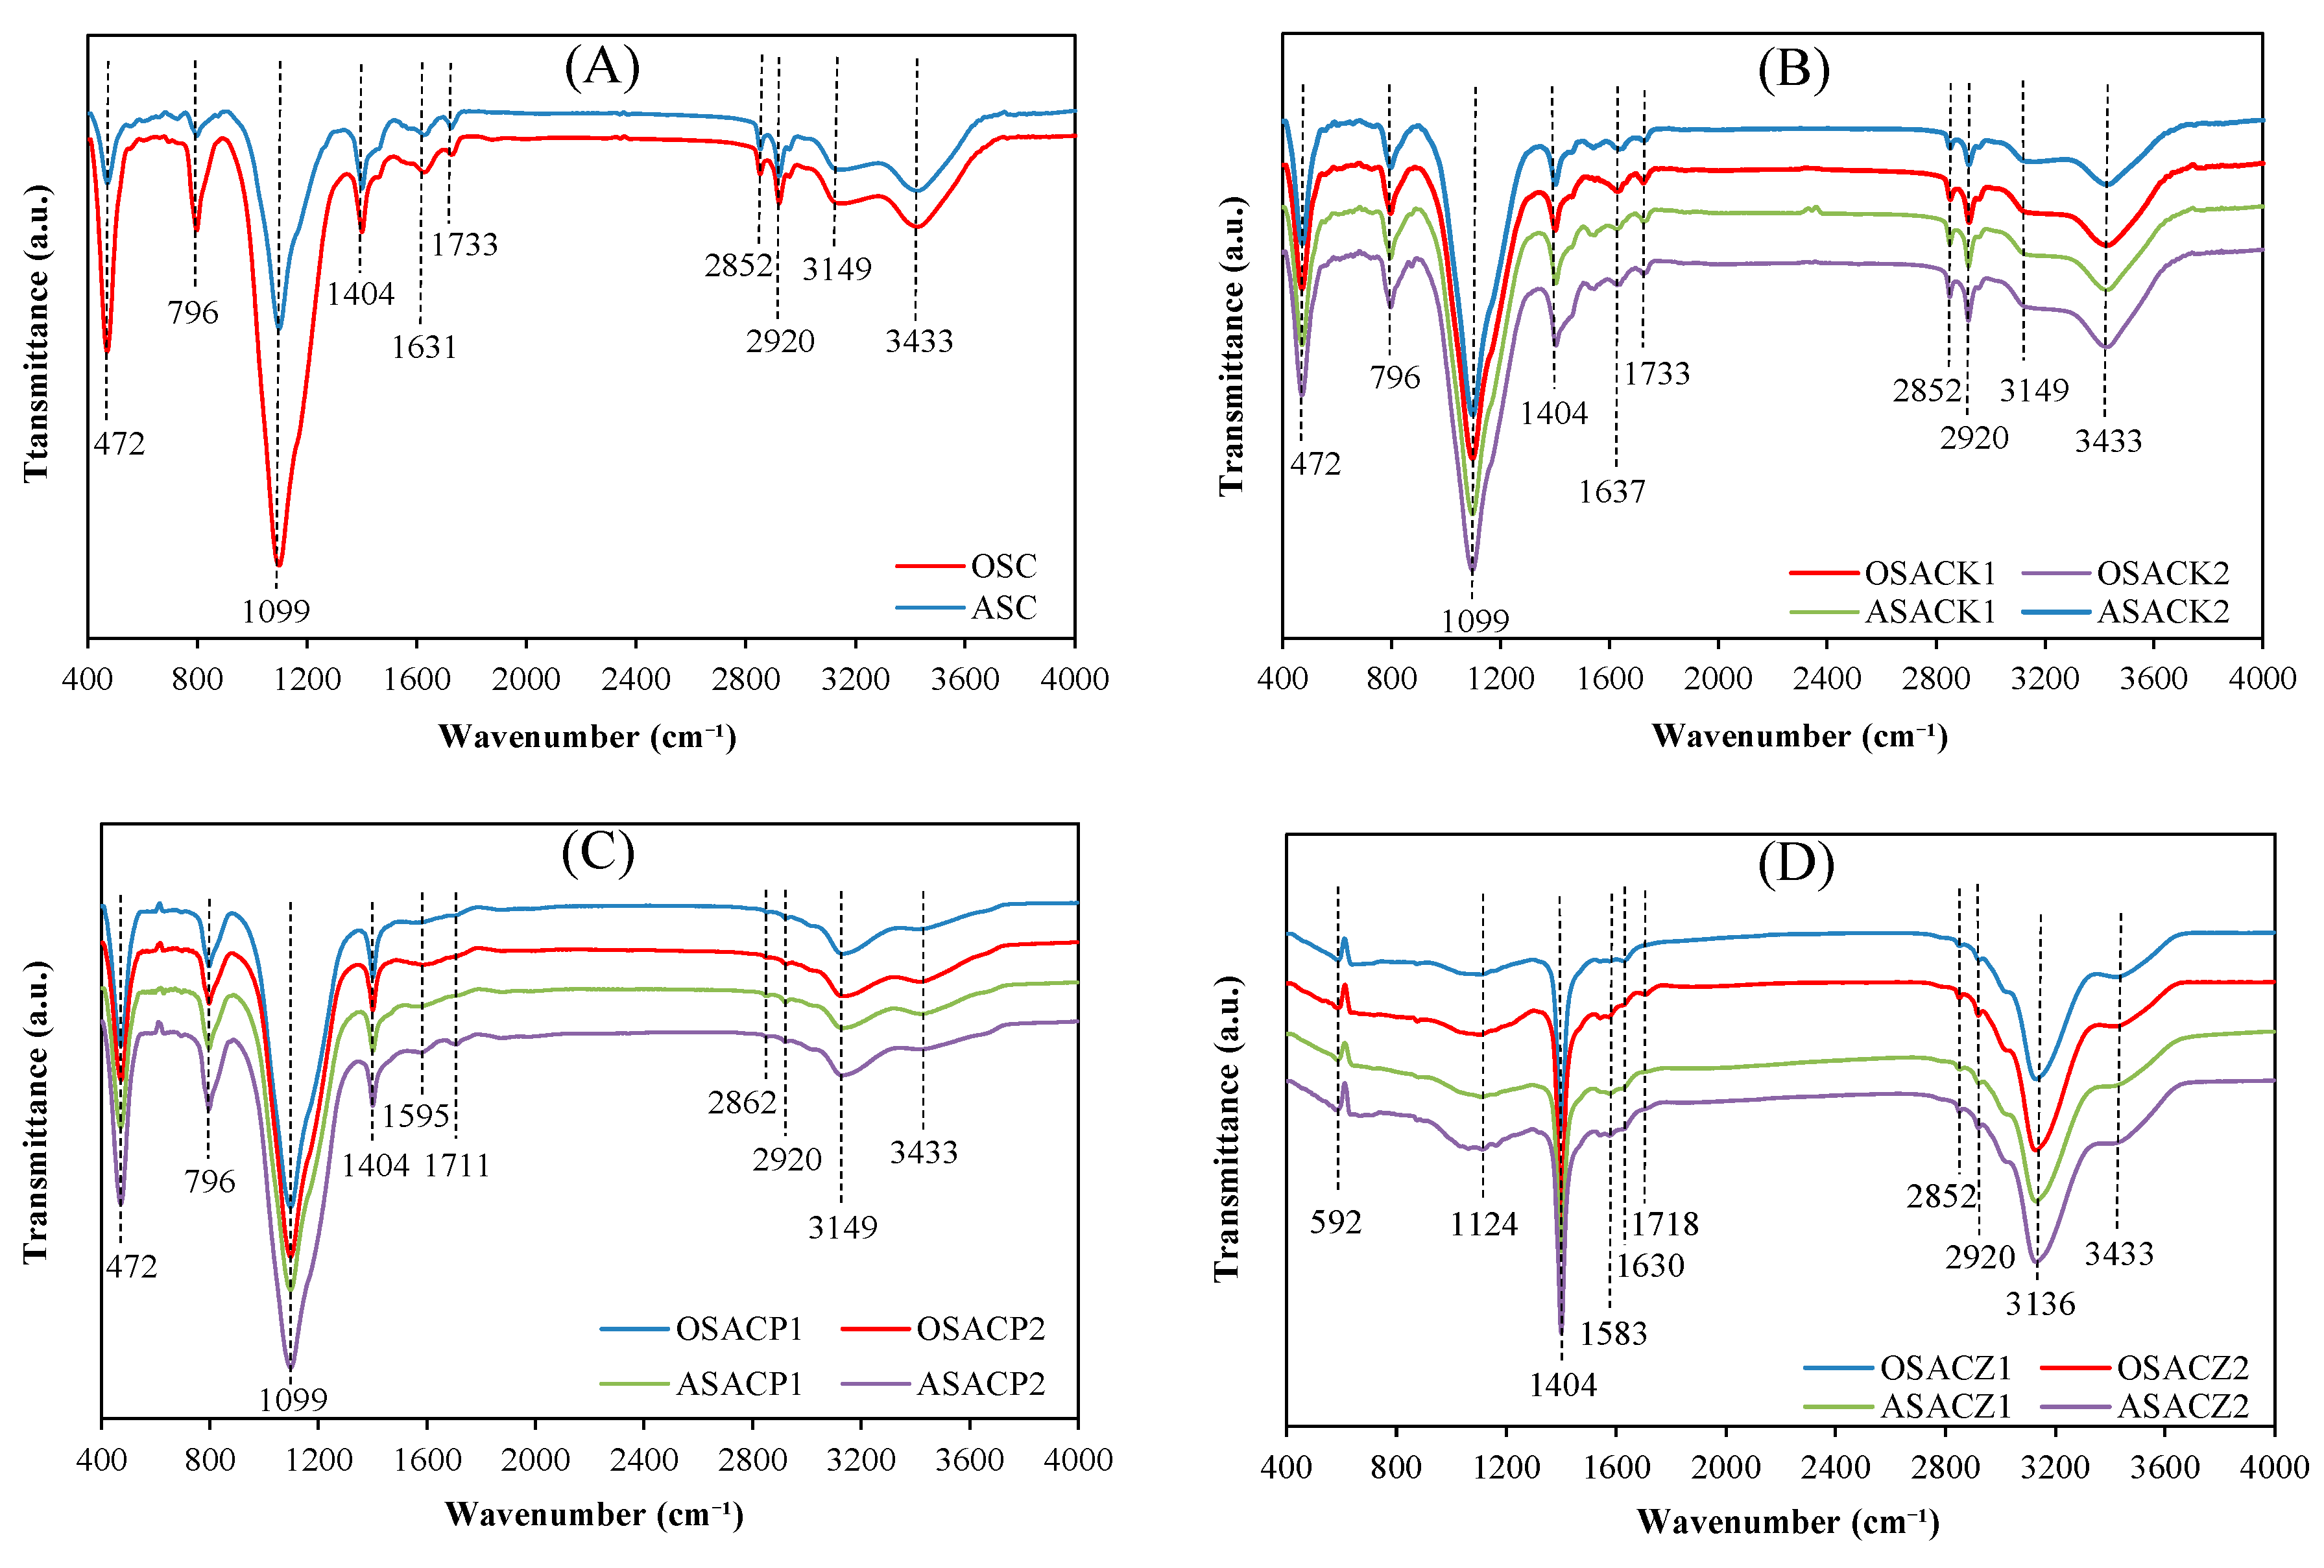
Figure 7.
Effect of mesopore volume upon adsorption efficiency (initial metal concentration of 500 mg L-1 and adsorbent dose of 2 g L-1).
Figure 7.
Effect of mesopore volume upon adsorption efficiency (initial metal concentration of 500 mg L-1 and adsorbent dose of 2 g L-1).
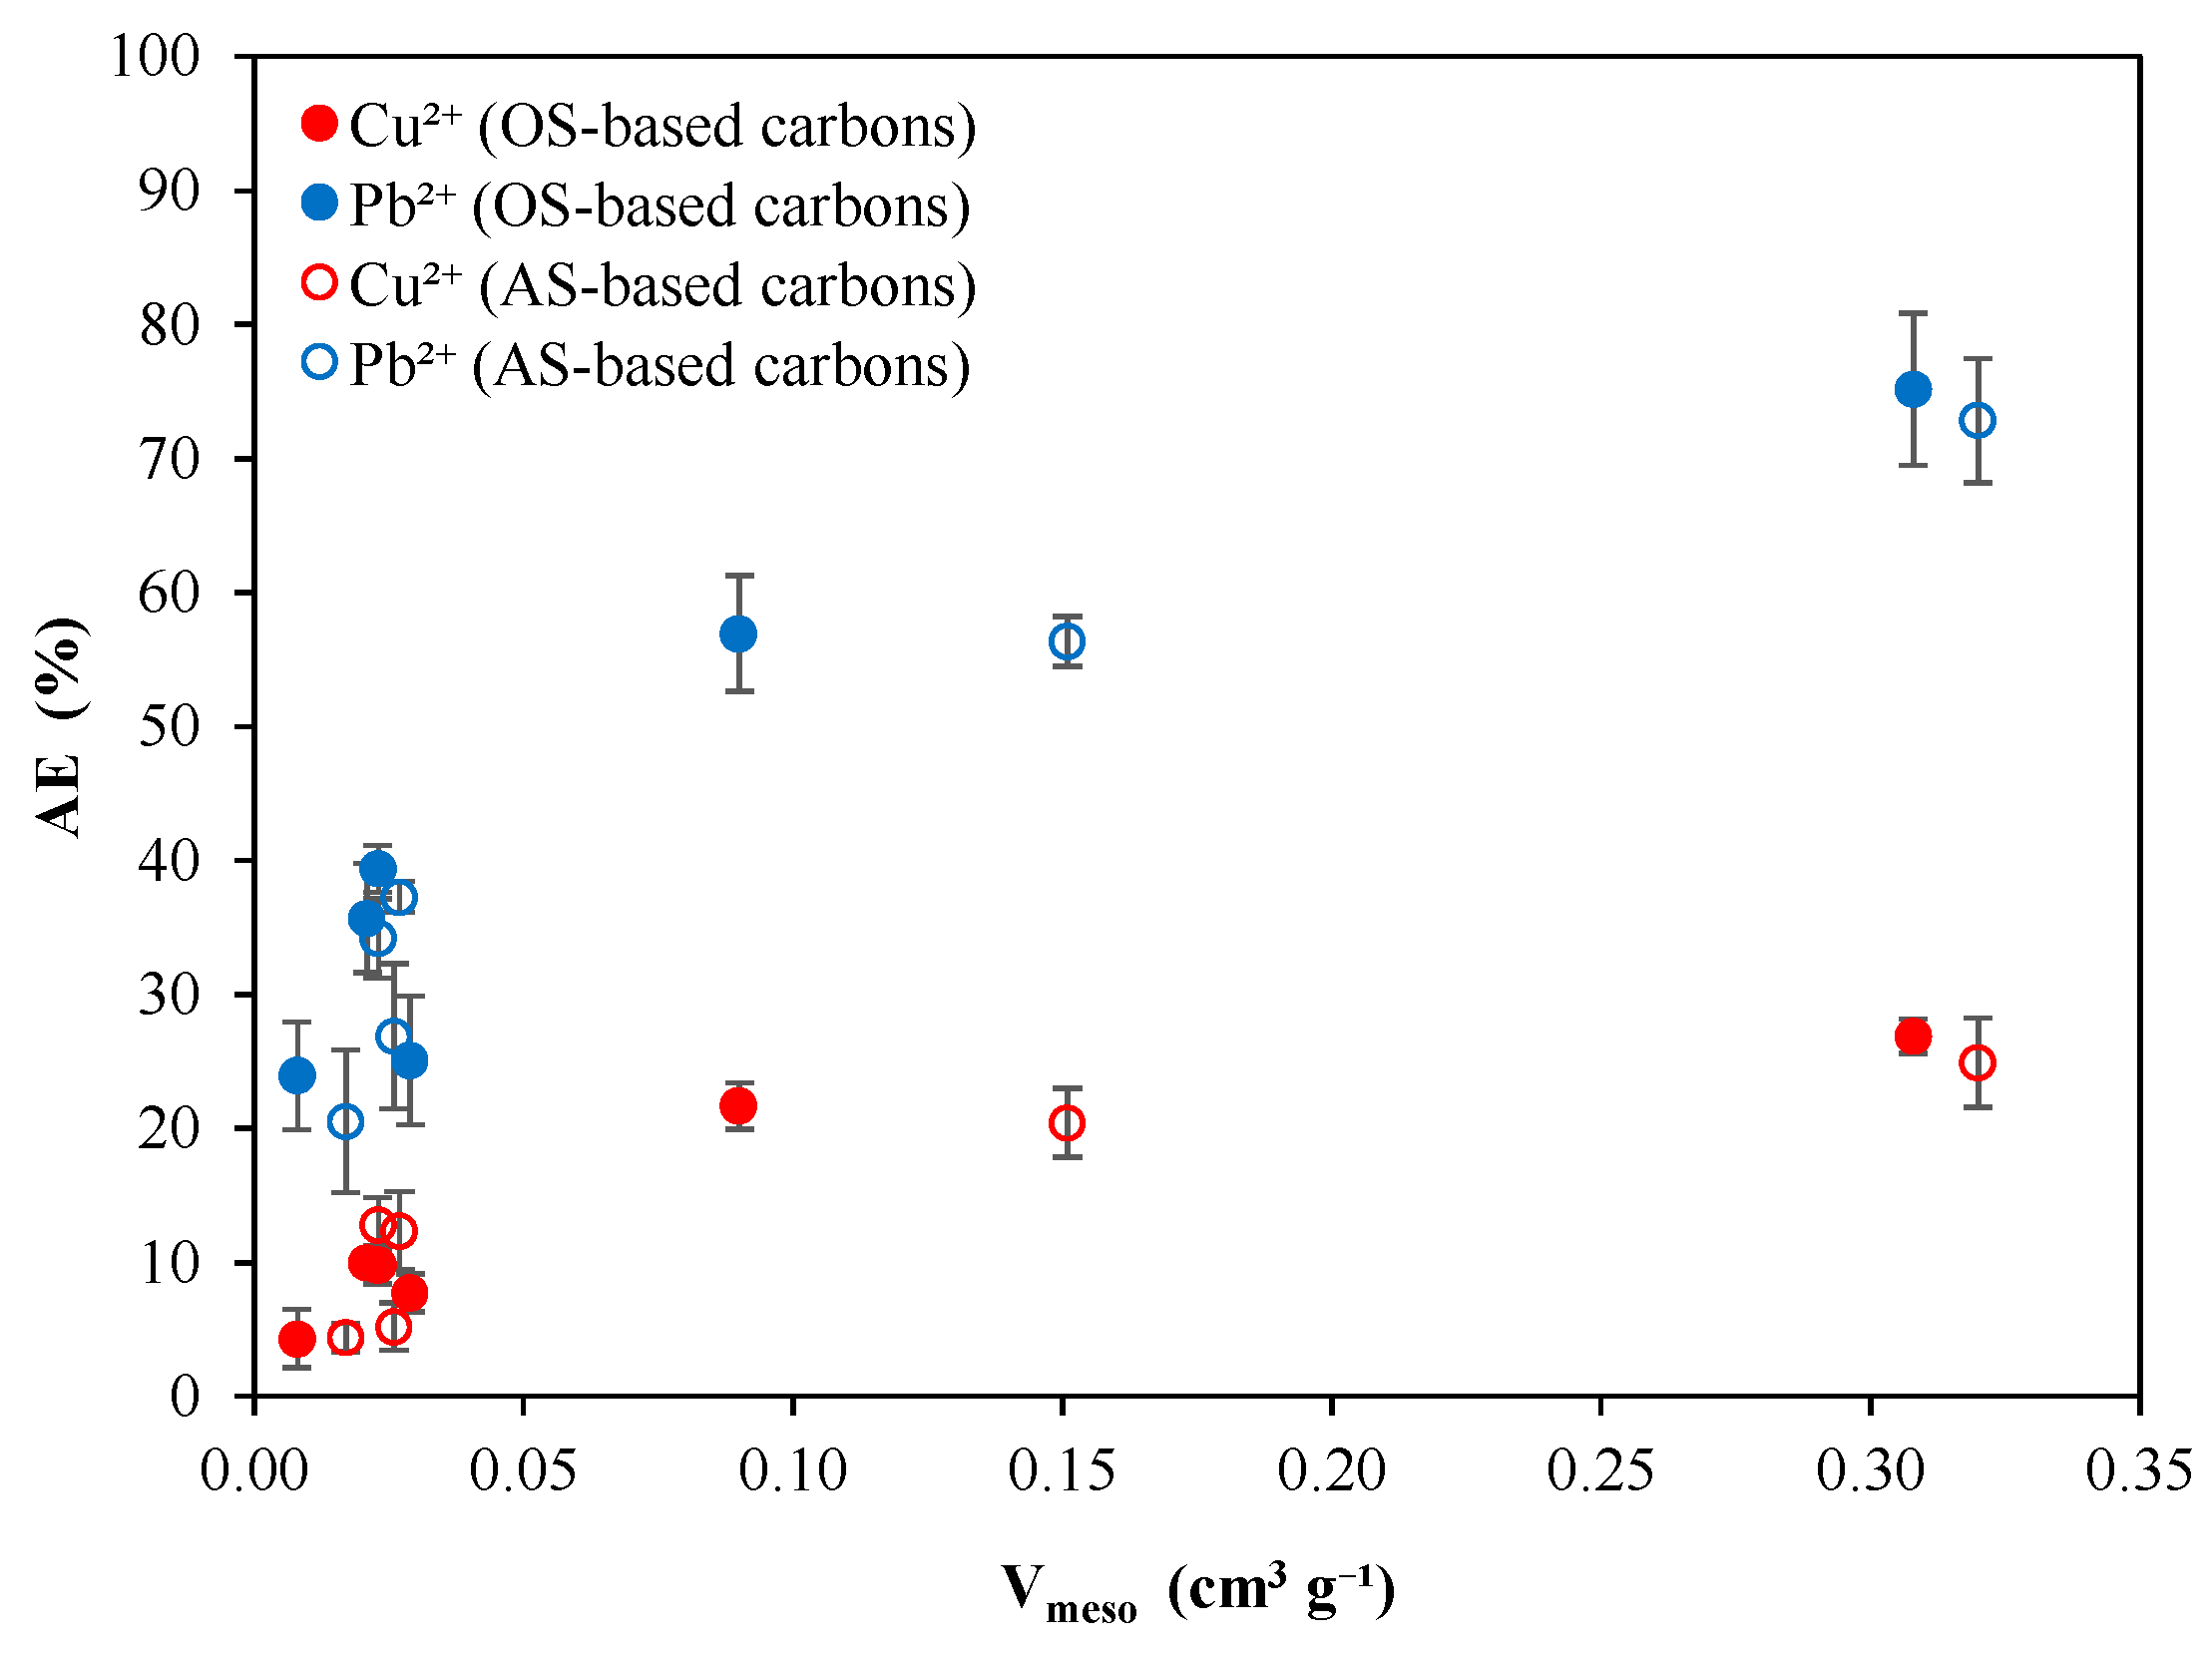

Table 1.
Carbons produced from biomass precursors for the removal of Cu2+ and Pb2+.
| Precursor | Carbon | Activating Agent | C/A Ratio (w/w) |
|---|---|---|---|
| Olive Stones | OSC | Non-activated | - |
| OSACK1 | KOH | 1:2 | |
| OSACK2 | 1:4 | ||
| OSACP1 | H3PO4 | 1:2 | |
| OSACP2 | 1:4 | ||
| OSACZ1 | ZnCl2 | 1:2 | |
| OSACZ2 | 1:4 | ||
| Almond Shells | ASC | Non-activated | - |
| ASACK1 | KOH | 1:2 | |
| ASACK2 | 1:4 | ||
| ASACP1 | H3PO4 | 1:2 | |
| ASACP2 | 1:4 | ||
| ASACZ1 | ZnCl2 | 1:2 | |
| ASACZ2 | 1:4 |
OSC: olive stones carbon; OSACK: olive stones KOH-activated carbon; OSACP: olive stones H3PO4-activated carbon; OSACZ: olive stones ZnCl2-activated carbon; ASC: almond shells carbon; ASACK: almond shells KOH-activated carbon; ASACP: almond shells H3PO4-activated carbon; ASACZ: almond shells ZnCl2-activated carbon.
Table 2.
EDX surface chemical composition of non-activated and activated carbons produced from biomass precursors.
Table 2.
EDX surface chemical composition of non-activated and activated carbons produced from biomass precursors.
| Carbon | % C | % O | % K | % Ca | % Al | % P | % Cl | Zn |
|---|---|---|---|---|---|---|---|---|
| OSC | 90.80 | 8.74 | 0.16 | 0.31 | - | - | - | - |
| OSACK1 | 66.67 | 26.44 | 2.96 | 0.47 | 3.47 | - | - | - |
| OSACK2 | 53.79 | 35.11 | 3.86 | 0.24 | 7.01 | - | - | - |
| OSACP1 | 84.29 | 14.51 | - | 0.08 | - | 1.12 | - | - |
| OSACP2 | 83.45 | 14.99 | - | 0.15 | - | 1.42 | - | - |
| OSACZ1 | 89.94 | 9.71 | - | - | 0.05 | - | 0.15 | 0.15 |
| OSACZ2 | 88.90 | 10.69 | - | - | 0.09 | - | 0.11 | 0.20 |
| ASC | 87.80 | 10.65 | 0.87 | 0.67 | - | - | - | - |
| ASACK1 | 72.03 | 23.52 | 1.60 | 0.40 | 2.36 | - | - | - |
| ASACK2 | 75.65 | 19.37 | 3.44 | 0.39 | 1.16 | - | - | - |
| ASACP1 | 82.80 | 16.73 | - | 0.15 | - | 0.32 | - | - |
| ASACP2 | 83.87 | 15.39 | - | 0.05 | - | 0.70 | - | - |
| ASACZ1 | 82.83 | 14.92 | - | 0.20 | 0.18 | - | 1.36 | 0.46 |
| ASACZ2 | 86.48 | 11.89 | - | 0.07 | 0.13 | - | 1.09 | 0.27 |
Table 3.
Textural characteristics of carbons produced from biomass precursors.
| P/P0 = 0.99 | DFT | 2DNLDFT | ||||||
|---|---|---|---|---|---|---|---|---|
| Carbon | SBET (N2) )m2 g-1) |
SBET (CO2) (m2 g-1) |
Vtotal (cm3 g-1) |
Dp (nm) |
Vtotal (cm3 g-1) |
Vmicro (cm3 g-1) |
Vmeso (cm3 g-1) |
micro Φ (%) |
| OSC | 427.5 | 294.8 | 0.197 | 1.84 | 0.183 | 0.171 | 0.012 | 93.4 |
| OSACK1 | 1443.5 | 760.8 | 0.747 | 5.34 | 0.676 | 0.575 | 0.090 | 85.1 |
| OSACK2 | 1955.3 | 672.8 | 1.091 | 4.72 | 1.024 | 0.695 | 0.308 | 67.9 |
| OSACP1 | 714.9 | 464.2 | 0.352 | 2.53 | 0.323 | 0.302 | 0.021 | 93.5 |
| OSACP2 | 711.8 | 458.0 | 0.351 | 2.53 | 0.322 | 0.299 | 0.023 | 92.9 |
| OSACZ1 | 712.0 | 459.2 | 0.328 | 2.87 | 0.304 | 0.275 | 0.029 | 90.5 |
| OSACZ2 | 849.5 | 546.0 | 0.377 | 2.31 | 0.348 | 0.340 | 0.008 | 97.7 |
| ASC | 405.3 | 298.2 | 0.190 | 2.73 | 0.177 | 0.170 | 0.007 | 96.0 |
| ASACK1 | 1350.1 | 713.6 | 0.733 | 5.04 | 0.729 | 0.578 | 0.151 | 79.3 |
| ASACK2 | 1979.4 | 662.4 | 1.142 | 4.59 | 1.033 | 0.686 | 0.320 | 66.4 |
| ASACP1 | 833.1 | 500.3 | 0.412 | 2.36 | 0.377 | 0.350 | 0.027 | 92.8 |
| ASACP2 | 791.2 | 496.5 | 0.388 | 2.48 | 0.355 | 0.332 | 0.023 | 93.5 |
| ASACZ1 | 635.5 | 441.1 | 0.300 | 2.80 | 0.278 | 0.252 | 0.026 | 90.6 |
| ASACZ2 | 719.6 | 473.0 | 0.327 | 2.25 | 0.302 | 0.285 | 0.017 | 94.4 |
SBET, Vtotal, Dp, Vmicro, Vmeso and Φ denote BET surface area, total pore volume, pore diameter, micropore volume, mesopore volume and porosity, respectively.
Table 4.
Point of zero charge of carbons produced from biomass precursors.
| Carbon | pHpzc |
|---|---|
| OSC | 7.3 |
| OSACK1 | 8.1 |
| OSACK2 | 8.4 |
| OSACP1 | 3.5 |
| OSACP2 | 2.9 |
| OSACZ1 | 6.1 |
| OSACZ2 | 5.5 |
| ASC | 7.7 |
| ASACK1 | 8.0 |
| ASACK2 | 8.4 |
| ASACP1 | 3.4 |
| ASACP2 | 3.4 |
| ASACZ1 | 6.2 |
| ASACZ2 | 5.9 |
Table 5.
CHNS elemental analysis of non-activated and activated carbons produced from biomass precursors.
Table 5.
CHNS elemental analysis of non-activated and activated carbons produced from biomass precursors.
| Carbon | % C | % H | % N | % O* |
|---|---|---|---|---|
| OSC | 83.36 | 2.00 | 0.24 | 14.40 |
| OSAC1 | 66.44 | 1.30 | 0.24 | 32.02 |
| OSAC2 | 55.02 | 1.16 | 0.18 | 43.64 |
| OSACP1 | 74.18 | 1.90 | 0.38 | 23.54 |
| OSACP2 | 70.66 | 1.79 | 0.35 | 27.20 |
| OSACZ1 | 80.70 | 1.20 | 0.69 | 17.41 |
| OSACZ2 | 81.70 | 1.67 | 0.22 | 16.41 |
| ASC | 83.14 | 2.02 | 0.30 | 14.54 |
| ASAC1 | 66.48 | 1.09 | 0.20 | 32.23 |
| ASAC2 | 56.72 | 1.42 | 0.11 | 41.75 |
| ASACP1 | 70.60 | 2.02 | 0.53 | 26.85 |
| ASACP2 | 73.38 | 2.08 | 0.43 | 24.11 |
| ASACZ1 | 82.12 | 1.40 | 0.91 | 15.57 |
| ASACZ2 | 80.65 | 1.72 | 0.60 | 17.03 |
* Calculated by difference.
Table 6.
Adsorption performance of biomass-derived carbons for the removal of Cu2+ from aqueous solutions.
Table 6.
Adsorption performance of biomass-derived carbons for the removal of Cu2+ from aqueous solutions.
| Ci=100 mg L-1 – AD=2 g L-1 | Ci=100 mg L-1 – AD=5 g L-1 | ||||||||
|---|---|---|---|---|---|---|---|---|---|
| Carbon | Activating Agent | C/A Ratio (w/w) | AE, % | qe, mg g-1 | AE, % | qe, mg g-1 | |||
| OSC | - | - | 29.92±1.15bc | 14.75±0.68bc | 33.44±2.16b | 7.21±0.33b | |||
| OSACK1 | KOH | 1:2 | 71.66±3.59e | 35.33±2.16e | 98.74±0.78f | 21.33±0.41f | |||
| OSACK2 | 1:4 | 86.29±2.73f | 42.52±1.42f | 99.86±0.13f | 21.58±0.60f | ||||
| OSACP1 | H3PO4 | 1:2 | 36.29±2.15cd | 17.87±1.33cd | 44.27±0.73c | 9.14±0.26c | |||
| OSACP2 | 1:4 | 38.97±1.07cd | 19.17±0.44cd | 50.05±1.76cd | 10.33±0.15cd | ||||
| OSACZ1 | ZnCl2 | 1:2 | 23.70±2.07ab | 12.33±0.94ab | 29.29±2.87ab | 5.82±0.65ab | |||
| OSACZ2 | 1:4 | 22.56±2.56ab | 11.80±1.58ab | 32.35±2.02b | 6.41±0.36b | ||||
| ASC | - | - | 43.25±2.65d | 21.32±1.22d | 51.40±0.90d | 11.10±0.35de | |||
| ASACK1 | KOH | 1:2 | 66.22±2.47e | 32.64±1.47e | 96.55±1.58f | 20.85±0.44f | |||
| ASACK2 | 1:4 | 84.63±1.35f | 41.69±0.55f | 98.18±2.23f | 21.20±0.10f | ||||
| ASACP1 | H3PO4 | 1:2 | 44.12±2.25d | 21.73±1.43d | 58.77±1.10e | 12.13±0.25e | |||
| ASACP2 | 1:4 | 42.15±3.08d | 20.70±0.86d | 54.95±0.82de | 11.34±0.31de | ||||
| ASACZ1 | ZcCl2 | 1:2 | 24.29±2.57ab | 12.49±0.86ab | 33.14±1.25b | 6.58±0.33b | |||
| ASACZ2 | 1:4 | 15.45±4.22a | 8.07±2.30a | 25.11±1.83a | 4.98±0.43a | ||||
| Ci=500 mg L-1 – AD=2 g L-1 | Ci=500 mg L-1 – AD=5 g L-1 | ||||||||
| Carbon | Activating Agent | C/A Ratio (w/w) | AE, % | qe, mg g-1 | AE, % | qe, mg g-1 | |||
| OSC | - | - | 12.81±0.44c | 32.01±1.78bcd | 8.80±1.98ab | 10.02±2.28ab | |||
| OSACK1 | KOH | 1:2 | 21.68±1.73d | 53.75±5.97e | 38.75±3.44fg | 39.34±3.20ef | |||
| OSACK2 | 1:4 | 26.88±1.3d | 66.62±5.40e | 48.65±3.56h | 49.40±2.82g | ||||
| OSACP1 | H3PO4 | 1:2 | 10.01±0.68abc | 24.40±1.91abc | 19.43±3.73cd | 19.67±3.87bc | |||
| OSACP2 | 1:4 | 9.84±1.41abc | 23.94±3.33abc | 22.14±1.99cd | 22.39±2.03c | ||||
| OSACZ1 | ZnCl2 | 1:2 | 7.73±1.39abc | 20.27±3.37abc | 6.57±1.34ab | 6.61±1.21a | |||
| OSACZ2 | 1:4 | 4.32±2.15a | 11.40±5.77a | 6.32±2.58ab | 6.34±2.48a | ||||
| ASC | - | - | 13.06±2.82c | 32.65±7.29cd | 15.33±2.00bc | 16.64±3.07bc | |||
| ASACK1 | KOH | 1:2 | 20.42±2.55d | 51.13±8.09de | 34.40±3.19ef | 34.95±3.27de | |||
| ASACK2 | 1:4 | 24.92±3.33d | 62.33±10.14e | 45.15±4.11h | 45.83±3.43fg | ||||
| ASACP1 | H3PO4 | 1:2 | 12.37±2.90bc | 29.82±5.82abc | 25.27±2.10de | 25.58±2.26cd | |||
| ASACP2 | 1:4 | 12.82±2.00c | 31.29±5.22abcd | 25.07±1.48cde | 25.36±1.52cd | ||||
| ASACZ1 | ZnCl2 | 1:2 | 5.21±1.78ab | 13.63±4.41abc | 6.82±3.09ab | 6.83±2.92a | |||
| ASACZ2 | 1:4 | 4.42±1.07a | 11.62±2.77ab | 1.34±0.95a | 1.35±0.96a | ||||
AE: adsorption efficiency at equilibrium; qe: adsorption capacity at equilibrium; Ci: cation initial concentration; AD: adsorbent dose; In each column and at each concentration different letters imply significant differences among means (p˂0.05).
Table 7.
Adsorption performance of biomass-derived carbons for the removal of Pb2+ from aqueous solutions.
Table 7.
Adsorption performance of biomass-derived carbons for the removal of Pb2+ from aqueous solutions.
| Ci=100 mg L-1 – AD=2 g L-1 | Ci=100 mg L-1 – AD=5 g L-1 | ||||||||
|---|---|---|---|---|---|---|---|---|---|
| Carbon | Activating Agent | C/A Ratio (w/w) | AE, % | qe, mg g-1 | AE, % | qe, mg g-1 | |||
| OSC | - | - | 62.58±5.70ab | 34.55±1.98abcd | 73.28±1.65ab | 16.34±0.37abc | |||
| OSACK1 | KOH | 1:2 | 100.00d | 52.25±2.15e | − | − | |||
| OSACK2 | 1:4 | 100.00d | 52.28±1.98e | − | − | ||||
| OSACP1 | H3PO4 | 1:2 | 75.97±2.83c | 39.59±0.72cd | 83.82±1.50cd | 17.99±1.33bcd | |||
| OSACP2 | 1:4 | 74.44±5.00c | 38.86±2.60cd | 86.94±2.07d | 18.64±1.33cd | ||||
| OSACZ1 | ZnCl2 | 1:2 | 58.97±2.85a | 30.82±1.33ab | 68.30±0.23a | 14.81±1.15ab | |||
| OSACZ2 | 1:4 | 63.47±2.59ab | 33.29±2.47abc | 76.38±2.97bc | 16.39±1.25abc | ||||
| ASC | - | - | 75.56±4.04c | 41.45±1.28d | 100.00e | 22.30±0.01e | |||
| ASACK1 | KOH | 1:2 | 100.00d | 52.28±1.98e | − | − | |||
| ASACK2 | 1:4 | 100.00d | 52.25±2.04e | − | − | ||||
| ASACP1 | H3PO4 | 1:2 | 79.28±3.67c | 41.18±2.62d | 89.65±2.91d | 19.25±1.51cde | |||
| ASACP2 | 1:4 | 73.04±1.86bc | 37.83±0.98bcd | 87.83±2.96d | 18.85±1.41cd | ||||
| ASACZ1 | ZcCl2 | 1:2 | 70.31±1.84bc | 36.80±2.06bcd | 78.90±2.66bc | 16.92±0.91abcd | |||
| ASACZ2 | 1:4 | 53.21±2.76a | 27.80±1.55a | 68.05±4.35a | 14.55±0.57a | ||||
| Ci=500 mg L-1 – AD=2 g L-1 | Ci=500 mg L-1 – AD=5 g L-1 | ||||||||
| Carbon | Activating Agent | C/A Ratio (w/w) | AE, % | qe, mg g-1 | AE, % | qe, mg g-1 | |||
| OSC | - | - | 27.02±3.05abc | 71.21±8.58a | 33.84±2.07a | 37.00±2.32a | |||
| OSACK1 | KOH | 1:2 | 56.94±4.29d | 141.77±14.37cd | 97.61±0.69e | 99.22±5.72d | |||
| OSACK2 | 1:4 | 75.14±5.69e | 186.16±18.96d | 100.00e | 101.41±5.24d | ||||
| OSACP1 | H3PO4 | 1:2 | 35.70±4.06bc | 89.07±14.03ab | 58.63±2.72cd | 61.32±2.40bc | |||
| OSACP2 | 1:4 | 39.40±1.73c | 97.94±8.45abc | 62.84±1.08d | 65.81±2.07c | ||||
| OSACZ1 | ZnCl2 | 1:2 | 25.06±4.79abc | 62.60±14.36a | 34.56±3.52a | 36.81±3.23a | |||
| OSACZ2 | 1:4 | 23.93±4.05ab | 59.81±12.25a | 32.58±2.18a | 34.13±2.60a | ||||
| ASC | - | - | 33.35±3.02abc | 88.06±8.39a | 47.23±1.42b | 51.67±1.60b | |||
| ASACK1 | KOH | 1:2 | 56.34±1.87d | 140.27±13.88bcd | 93.58±0.93e | 95.08±5.85d | |||
| ASACK2 | 1:4 | 72.83±4.67e | 182.69±21.56d | 100.00e | 101.68d | ||||
| ASACP1 | H3PO4 | 1:2 | 37.26±1.16bc | 92.88±8.49abc | 52.38±3.09bc | 55.21±3.03bc | |||
| ASACP2 | 1:4 | 34.20±2.96abc | 85.45±12.30a | 55.96±3.92cd | 59.47±2.73bc | ||||
| ASACZ1 | ZnCl2 | 1:2 | 26.88±5.41abc | 67.59±18.12a | 35.64±1.93a | 37.54±1.32a | |||
| ASACZ2 | 1:4 | 20.54±5.33a | 51.77±16.72a | 29.95±2.02a | 31.57±2.61a | ||||
AE: adsorption efficiency at equilibrium; qe: adsorption capacity at equilibrium; Ci: cation initial concentration; AD: adsorbent dose; In each column and at each concentration different letters imply significant differences among means (p˂0.05).
Disclaimer/Publisher’s Note: The statements, opinions and data contained in all publications are solely those of the individual author(s) and contributor(s) and not of MDPI and/or the editor(s). MDPI and/or the editor(s) disclaim responsibility for any injury to people or property resulting from any ideas, methods, instructions or products referred to in the content. |
© 2024 by the authors. Licensee MDPI, Basel, Switzerland. This article is an open access article distributed under the terms and conditions of the Creative Commons Attribution (CC BY) license (http://creativecommons.org/licenses/by/4.0/).
Copyright: This open access article is published under a Creative Commons CC BY 4.0 license, which permit the free download, distribution, and reuse, provided that the author and preprint are cited in any reuse.


