
Submitted:
18 October 2024
Posted:
18 October 2024
You are already at the latest version
Abstract
Microwave plasma-driven nitrogen fixation can occur at atmospheric pressure without greenhouse gas emissions. However, this method still faces the challenge of high energy consumption and low production. Plasma-catalyst combined systems are widely used to increase production and reduce energy consumption in nitrogen fixation. However, the efficacy of current catalysts remains limited. In this paper, the metal-organic framework materials CuBTC and ZIF-8 are combined with the atmospheric microwave plasma for nitrogen fixation. The experimental results show their better catalytic effect than the ordinary catalyst ZSM-5. The maximum nitrogen oxide concentration reaches 33400 ppm, and the lowest energy consumption is 2.05 MJ/mol. Compared to no catalyst, the nitrogen oxide production can be increased by 17.1%, and the energy consumption can be reduced by 14.6%. The transmission electron microscopy (TEM) images of the catalysts reveal obvious differences in the catalyst particle sizes. Notably, catalysts with smaller particle sizes attain higher NOx concentrations compared to their larger counterparts. To the knowledge of the authors, this is the first effort to study the synergistic effects of atmospheric microwave plasma and metal-organic framework materials on nitrogen fixation.
Keywords:
microwave plasma
; metal-organic framework materials
; nitrogen oxides
; synergistic effects
1. Introduction
As one of the fundamental elements of living organisms, nitrogen is essential for both the growth of plants and human production activities such as agricultural and chemical materials production [1,2]. The nitrogen element exists mostly in the form of N2 in air which cannot be directly absorbed by organisms [3]. In nature, nitrogen can be fixed through microbial action and lightning [4,5]. The nitrogen-containing compounds produced by these two methods cannot meet the needs of human life. The Haber-Bosch (H-B) process is the most commonly used industrial nitrogen fixation technology that can supply 40% of the global population with nitrogen demand annually. However, the H-B process heavily relies on fossil energy and causes high CO2 emissions, exacerbating the greenhouse effect [6,7]. Hence, it is necessary to find novel green and sustainable nitrogen fixation technologies.
Plasma is a quasi-electrically neutral system consisting of electrons, charged ions, and neutral particles, which can provide active species to facilitate difficult chemical reactions [8]. Plasma-based nitrogen fixation can occur in mild conditions, and it has a short startup time and a fast reaction rate. Moreover, the plasma can be driven by clean energy such as solar and wind energy, which is safe and has low pollution and emissions. Hence, it gains an increasing attention among the global scholars. Dielectric barrier discharge (DBD) [9], microwave discharge [10,11,12], spark discharge [13], and gliding arc discharge [14,15,16] are widely used to synthesize nitrogen oxides in air, and the gliding arc and microwave plasma have better performance among them. Malik et al. studied the nitrogen fixation by gliding arc, the product gas had no ozone when the air was used as the working gas and it achieved an energy consumption of 15.4 MJ/mol and a NOx yield of 0.1% [17]. A millimeter-scale sliding arc reactor operating at atmospheric pressure was proposed by Patil et al. for the synthesis of NOx [18]. The energy consumption for NOx generation was as low as 4.2 MJ/mol, and the NOx yield was about 1%. Vervloessem et al. proposed a novel atmospheric sliding arc plasma for generating NOx at different N2/O2 gas feed ratios with an energy consumption of 3.6 MJ/mol and a NOx yield of 1.5% [16]. Kelly and Bogaerts investigated a microwave plasma using a vortex gas flow to fix nitrogen from the air into NOx with the lowest energy consumption recorded of 2 MJ/mol at atmospheric pressure, for a total NOx yield of 3.8% [12]. Asisov et al. reported the lowest energy consumption of nitrogen fixation, achieved by utilizing a low-pressure electron cyclotron resonance (ECR) microwave discharge in N2/O2 mixtures in the early 1980s. Notably, they achieved a NOx production rate of 14% with an energy consumption of only 0.3 MJ/mol [19]. However, the results have never been reproduced up to now. Compared to the H-B process which has an energy consumption of 0.5 MJ/mol [20], it is necessary to study effective means to reduce the energy consumption of the plasma-driven nitrogen fixation.
Catalysts are widely introduced to combine with the plasma to increase NOx production and decrease the energy consumption of nitrogen fixation [21,22]. The synergistic effects of the plasma and catalysts have been shown by previous studies. Patil et al. added the γ-Al2O3 to DBD to fix nitrogen in air with an energy consumption of 18 MJ/mol and a NOx yield of 0.5 %. It was proved that the 5% WO3/-Al2O3 catalyst increased NOx yield by about 10% [23]. Xuekai Pei found that the catalyst increased NOx production even away from the plasma region, which suggested that the catalytic activation of downstream neutrals played an important role [24]. Mutel et al. reported a yield of 6% NO at an energy consumption of 0.84 MJ/mol in a microwave plasma at 66 mbar with the MoO3 catalyst [11]. Metal-organic framework (MOF) catalysts were used in the plasma-driven ammonia synthesis by Shah et al. who used Ni-MOF-74 as a catalyst for ammonia synthesis in synergy with the radio frequency (RF) plasma and it provided a higher ammonia yield of 0.23 g/kWh (on a per gram of catalyst basis) compared to Ni metal [25]. Most of the existing literature on plasma-driven nitrogen fixation combined with catalysts focused on the use of DBD and RF plasma [25,26,27,28,29]. Microwave plasma has the advantages of being electrode-free, having high energy efficiency, and long working life compared with DBD and RF plasmas. The MOF material has advantages over other catalysts, such as a large specific surface area, abundant active sites, and strong adsorption [30]. Therefore, the MOF material is combined with the atmospheric-pressure microwave plasma for nitrogen fixation in this paper.
Herein, we use CuBTC and ZIF-8 as the MOF catalysts to assist the atmospheric microwave plasma for nitrogen fixation. These two catalysts can effectively improve nitrogen fixation at different flow rates and microwave power, and the catalytic action is better than the general catalyst ZSM-5. And we investigate the TEM images of the catalysts to find out their difference in the particle sizes. The results indicate that CuBTC and ZIF-8, which exhibit higher concentrations of NOx, possess smaller particle sizes compared to ZSM-5.
2. Methods
2.1. Experiment System
Figure 1 shows the photograph of the atmospheric microwave plasma system for nitrogen fixation, which consists of a microwave generator, a circulator (MPWG22CIA01, Mapingtec, Chengdu, China), a water load (MPWG22WLA01, Mapingtec, Chengdu, China), a dual-directional coupler (MPWG22CPA01, Mapingtec, Chengdu, China), a tapered waveguide, a mass flow controller (MFC, KT-C2Z, Ketanyiqi, Zhengzhou, China), and a Fourier transform infrared (FTIR) spectrometer (Vertex 70, Bruker, Wolzbach, Germany). The microwave generator is composed of a water-cooled magnetron (2M265, MUEGGE, Reichelsheim, Germany) and a high-voltage DC power supply (wepex3000BX, Megmeet, Shenzhen, China) that drives the magnetron. The magnetron has a center frequency of 2.45 GHz with a maximum output power of 3 kW. The microwave power meter (KC9532, Measall Technology, Chengdu, China) is internally built into the microwave generator to detect the incident and reflected microwave power. Three ports of the circulator are connected to the microwave generator, the coupler, and the water load, respectively. The coupler is connected to the microwave power meter through two coaxial lines to couple the incident and reflected microwave power for measurement.
A quartz tube with an inner diameter of 25 mm, an outer diameter of 29 mm, and a length of 30 cm is inserted into the tapered waveguide to restrict the plasma. A condenser tube surrounds the quartz tube for cooling. When the plasma is excited, the gas passes through the catalyst and then is detected by the FTIR spectrometer above the quartz tube.
The gas flow rate is adjusted by the MFC which has a range from 1 L/min to 22 L/min. Air is taken as the working gas and it flows into the quartz tube in the form of a swirl to reduce the heat load of the quartz tube. The concentration of NOx is obtained by measuring the infrared absorption spectrum of the output gas using the FTIR spectrometer locating after the catalyst position. The catalyst is placed in the downstream area which is away from the plasma torch. This area consists of reactive oxygen and nitrogen species (RONS), and NO will react sufficiently with O2 to produce NO2, which can be seen in our measurement results in section 2.4.
2.2. Catalyst Characterization
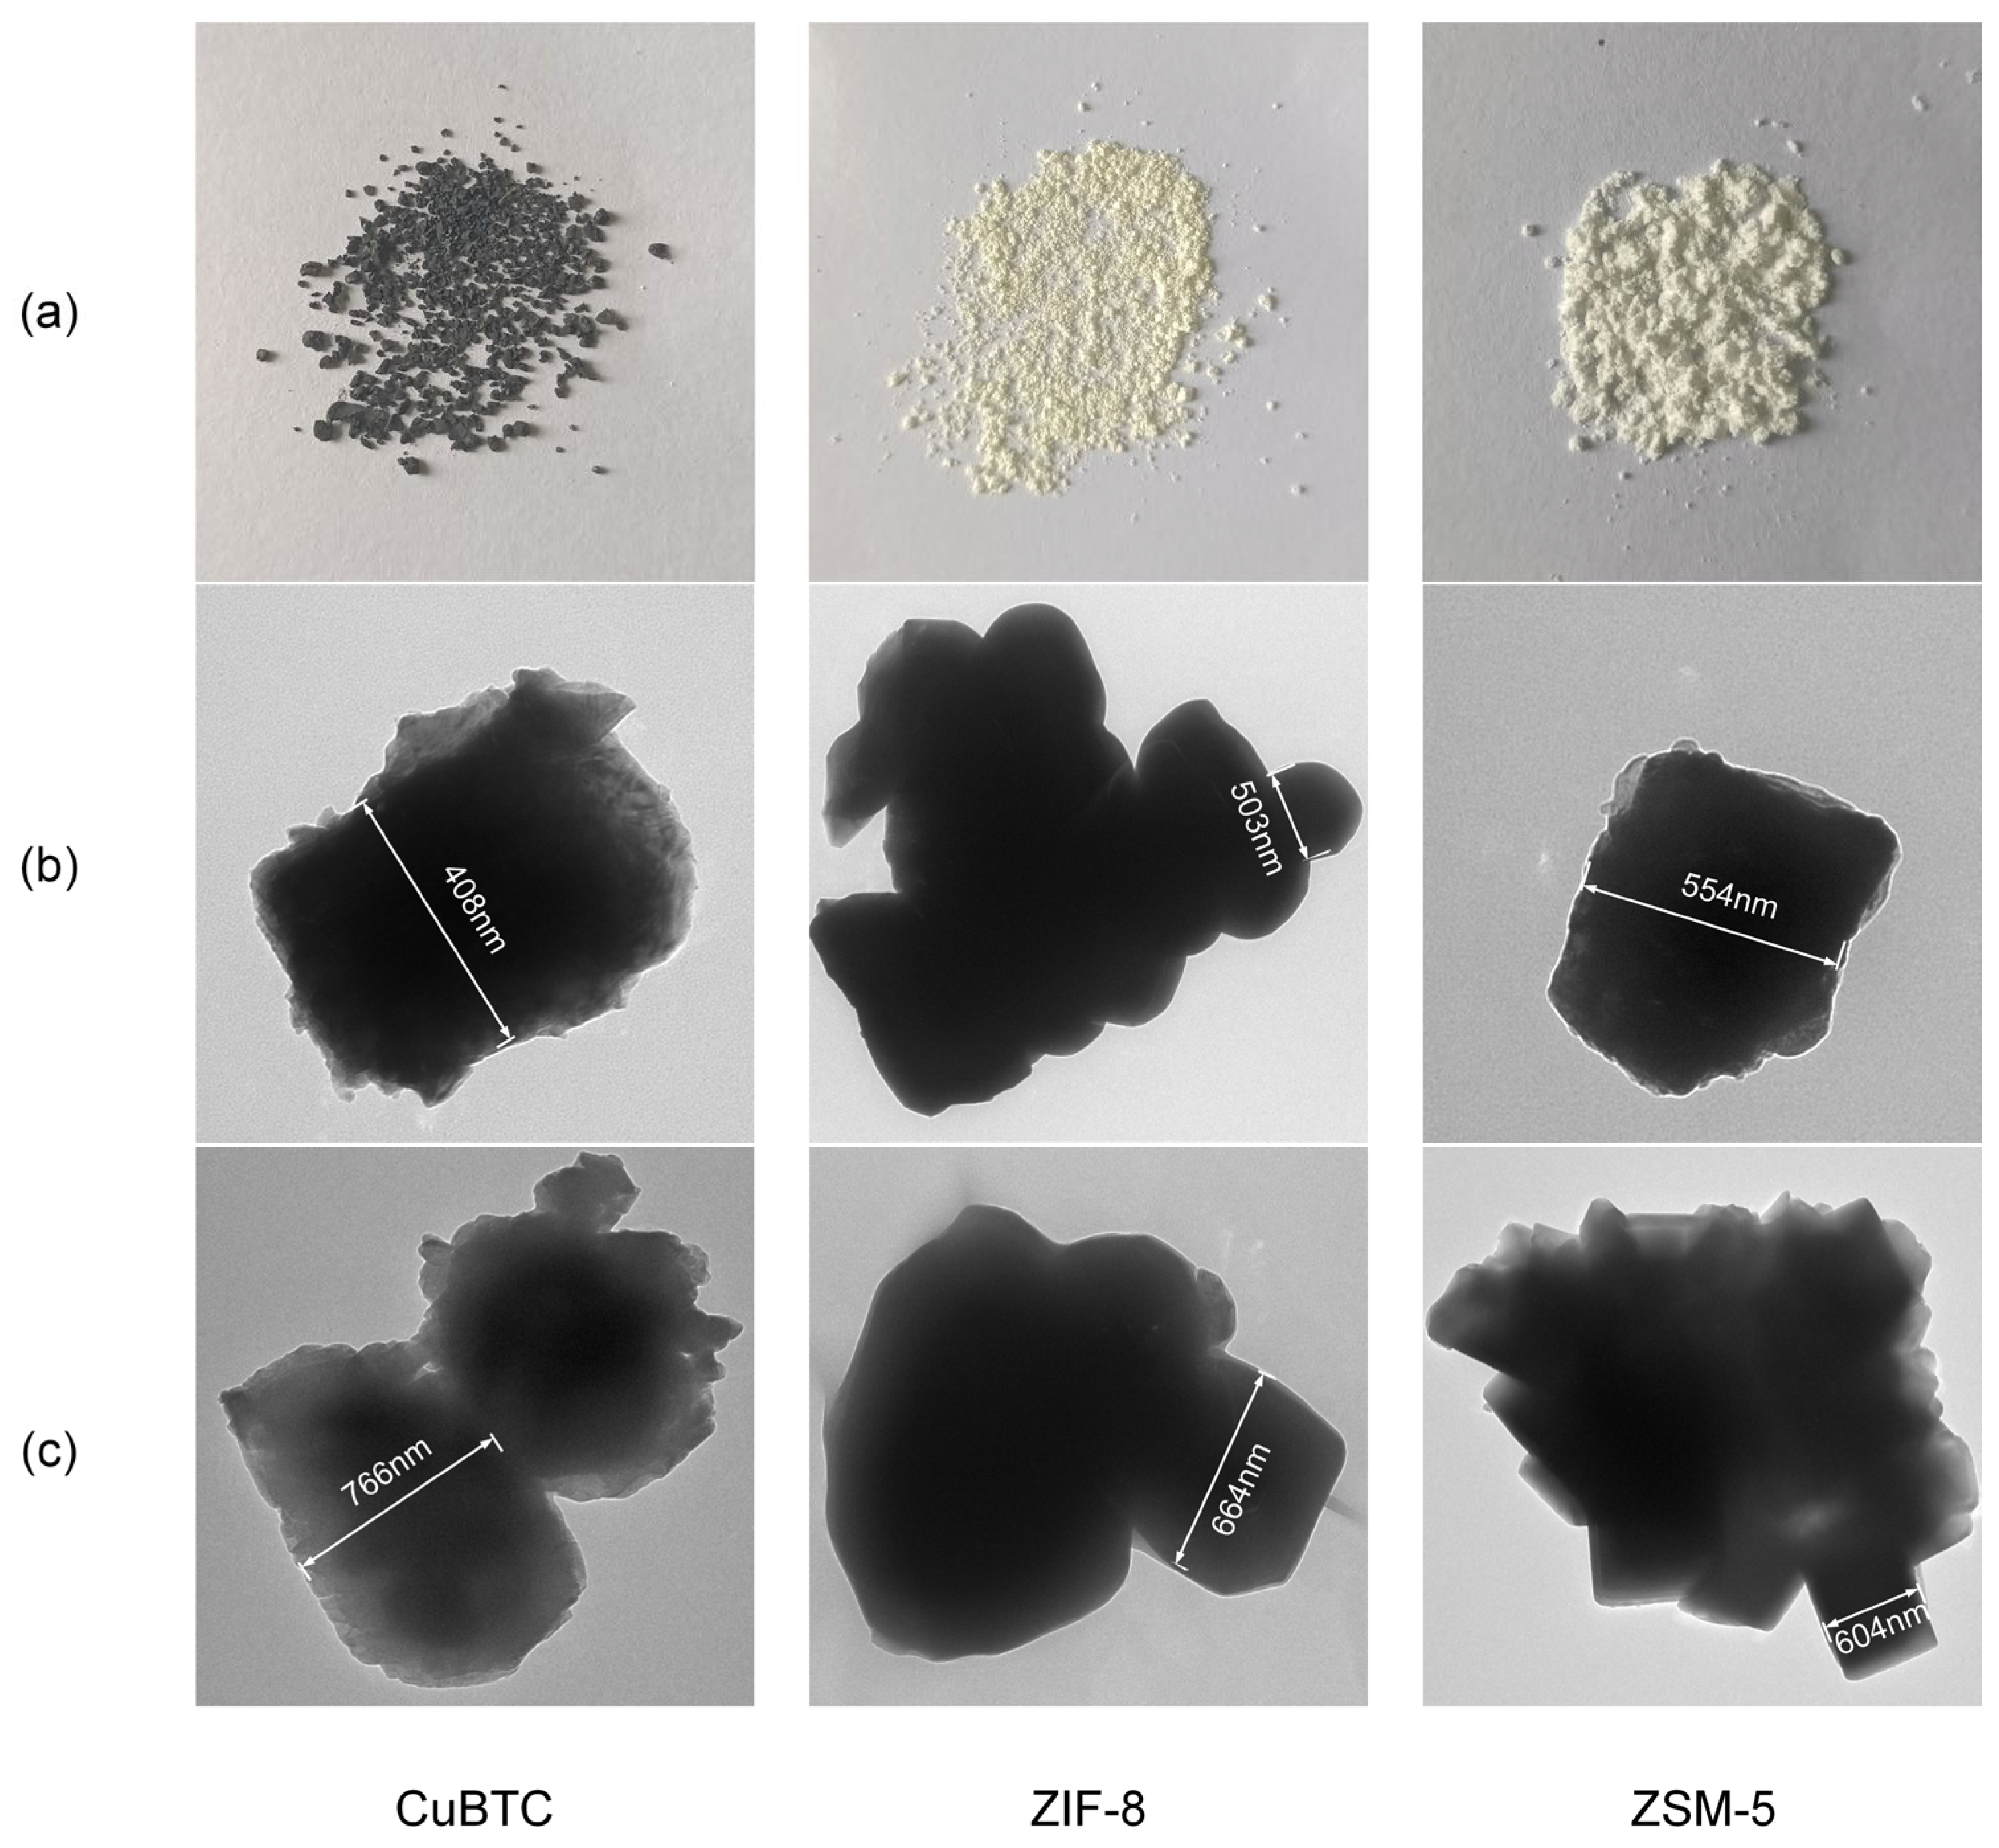
In this paper, three catalysts including CuBTC, ZIF-8, and ZSM-5 are used to assist the atmospheric microwave plasma for nitrogen fixation. Both CuBTC and ZIF-8 are MOF materials made by mechanochemical and aqueous methods, respectively. ZSM-5 is the zeolite catalyst. All the catalysts are made by XFNANO Company (Jiangsu, China). MOF catalysts are preheated before each experiment. The weight of catalysts used in each experiment remains at 200 mg. Figure 2 shows the pictures of three catalysts prior to usage.
CuBTC is in a light blue powder form composed of Cu and benzene-1,3,5-tricarboxylate with a pore size of 0.9 nm, and a specific surface area of about 457 m2/g. It needs to be heated at 600 ℃ for three hours before use. ZIF-8 is composed of Zn2+ and C4H5N2- with a pore size of 0.34~1.16 nm and a specific surface area of about 1,345 m2/g, which needs to be preheated at 1000 ℃ for ten hours. ZSM-5 is a kind of white powder with a silicon to aluminum ratio (SiO2/Al2O3) of 25-30 wt %. The specific surface area is 340 m2/g and the pore size is about 5 nm.
2.3. Catalyst Location Determination
In this work, the working temperature of both CuBTC and ZIF-8 should be below 1000 ℃ to avoid inactivation [31,32]. However, the gas temperature of the microwave plasma is usually higher than 1000 ℃, making it difficult to directly measure this high temperature [33]. Therefore, the temperature distribution of the plasma is simulated to determine a suitable location for placing the catalyst. Moreover, the simulation result is verified by measuring the temperature points below 1000 ℃ using a digital thermometer. For this measurement, the sensor of the thermometer was placed directly in the specific location of plasma to obtain the temperature value.
Figure 3 shows the temperature simulation model consisting of a condenser tube, a quartz tube, a condensing device, and a waveguide. Both the condenser tube and condensing device are used to cool the quartz tube when the plasma is generated.
The working gas flows into the quartz tube from its bottom which is 2.2 cm away from the center of the waveguide. In the simulation, we ignore the swirling form of the inlet gas in front of the quartz tube, and the gas flow in the quartz tube is assumed to be a laminar model. Then the fluid velocity can be solved by the Navier-Stokes equation [34].
whereis the fluid density with a unit of kg/m3, is the velocity vector of the fluid with a unit of m/s, denotes the net flow of momentum out of a unit volume space, indicates the stress tensor, is the pressure with a unit of Pa, is the viscous stress, and is the external force per unit volume of fluid. The plane F is set as the air inlet and plane A is the gas outlet. For the water flow, the planes B and C are set as the inlet and outlet of the condenser tube, while the planes D and E are assigned to be the inlet and outlet of the condensing device. The boundaries of the condenser tube, quartz tube, condensing device, and waveguide are all set as the wall boundaries which have zero velocities.
The gas temperature T is solved by the heat transfer function [35].
where is heat capacity with a unit of J/(kg·K), k is the thermal conductivity, is the temperature gradient, and Q is the heat source. The initial temperature at the plasma core located at the waveguide center is set to be 5300 ℃, which is a measured temperature of the atmospheric microwave air plasma [36]. The planes B, D, and F are all set as the inflow boundaries with an initial temperature of 19 ℃. The corresponding outflow boundaries are the planes C, E, and A, respectively. The outer boundaries of the condenser tube, quartz tube, condensing device, and waveguide are all set as the convection heat flux q, which is expressed as [37].
where h is the heat transfer coefficient of air with h = 10 W/(m2·K), and Text is the temperature of air assumed to be 19 ℃. The initial temperature of the simulation domain is also set as 19 ℃.
The commercial software COMSOL Multiphysics was adopted for the calculation in this paper. The free tetrahedral meshes with the maximum and minimum sizes of 13 mm and 0.13 mm, respectively, are generated for the simulation domain. The total mesh number is 873403 with 86641 unknowns. All the computations are calculated by a workstation with the configuration of Intel(R) Xeon(R) E5-2650 CPU at 2.3 GHz and RAM 96 GB based on the 64-bit Windows10 platform.
The x-z cross-section view of the simulated temperature distribution is shown in Figure 4. It is clear that the gas temperature in the quartz tube decreases gradually with the direction of airflow. The condensing equipment has a significant effect on cooling the quartz tube as the temperature inside the quartz tube in the waveguide is significantly higher than that in other areas of the waveguide. It can be seen from Figure 4 (b) that the temperature distribution in the x-y cross section of the quartz tube exhibits a divergent pattern with high central temperature and low edge temperature. Figure 5 shows the specific temperature values of the points on the z-axis. As z increases, the temperature will decrease. According to Figure 5, the gas temperature will be below 1000 ℃ when z is greater than 18 cm. Therefore, we measured the temperature values at z = 19.7, 20, 29, 40.5, and 50 cm shown as the red points in Figure 5. The measured temperatures are in good agreement with the simulation results. As the catalysts used in this paper can work at 600 ℃ [31,32], the location of z = 24 cm with a maximum temperature of 600 ℃ is selected as the catalyst position.
2.4. NOx Measurement
The infrared absorption spectra of the gases generated by microwave plasma in different conditions are detected to determine the NOx concentrations. Figure 6 shows the spectrum at the gas flow rates of 9 L/min and the microwave power of 450 W. It can be observed that the NOx mainly consists of NO2 and NO [38]. Moreover, the concentration of NO2 is much higher than that of NO since most of the NO will react with the oxidative species to produce NO2 at the measurement area. Thus, the total concentrations of NO2 and NO are determined as the NOx concentrations in this paper.
Figure 7(a) and (c) show the infrared absorption spectra of NO and NO2 with standard concentrations measured by FTIR. According to the absorption peaks at 1905 cm-1 for NO and 1627.8 cm-1 for NO2 [38], the calibration curves for NO and NO2 are built as shown in Figure 7(b) and (d) to determine their concentrations. The relationship between the concentration and absorbance of these two curves is approximately linear.
The energy consumption is calculated by the following formula,
where is the energy consumption with a unit of MJ/mol, P represents the microwave power, Lm is the molar volume of ideal gas at atmospheric pressure and room temperature which equals to 24.05 L/mol, is the NOx concentration with a unit of ppm (parts per million), and fl is the gas flow rate with a unit of L/min.
3. Experiment Results and Discussions
In the experiment, three different catalysts are placed in the same position determined in section 2.3, and the nickel foam is fixed there as the catalyst carrier due to its cheapness and high temperature resistance. The blank group indicates no nickel foam and catalyst packed downstream of the microwave plasma, and the nickel foam group which has no catalyst is taken as the control group. The NOx concentration and energy consumption are obtained at different microwave power and gas flow rates.
3.1. NOx Production
Figure 8 shows the NOx concentrations with gas flow rates ranging from 3 L/min to 13 L/min at four different microwave power. The NOx concentration in the blank group is similar to that in the control group, which indicates that the nickel foam has little effects on the production of NOx. The NOx concentrations are higher in the three catalysts than in the control group, showcasing that three catalysts can promote the synthesis of NOx. Among these catalysts, CuBTC and ZIF-8 have higher NOx concentrations than ZSM-5.
As the microwave power remains constant, the NOx concentration firstly increases and then decreases with the increment of gas flow rate. This is consistent with the trend of the visible length of the plasma changing with the gas flow rate [36]. When the gas flow rate is 3 L/min, the plasma torch is short leading to a small reaction area. As the gas flow rate slowly increases from 3 L/min to a medium flow rate range of 7 L/min to 9 L/min, the length of the plasma torch increases, which results in a bigger reaction area for NOx synthesis. When the gas flow rate is too high, the propagation distance of the surface wave that maintains the plasma becomes short, causing a decrement of the plasma torch length [39]. Moreover, the gas residence time is also getting smaller at high gas flow rates, hence, the NOx concentration is rapidly reduced. When the microwave power increases from 450 W to 700 W, the gas flow rate corresponding to the maximum NOx concentration increases from 5 L/min to 9 L/min. When the gas flow rate remains constant, the NOx concentration increases as the microwave power increases due to the increment of the specific energy input (SEI) which is written in Equation (5) [23]. As the energy gained per unit volume of gas increases, more N2 and O2 will participate in the reaction, thus increasing the NOx concentration.
When the microwave power is 700 W and the flow rate is 9 L/min with CuBTC, the maximum NOx concentration of 33400 ppm in the experiment is obtained. Comparing the results of CuBTC and blank group, the NOx concentration can be increased from 28000 ppm to 32800 ppm with a maximum increment of 17.1% under the condition of 9 L/min and 550 W.
3.2. Energy Consumption
Figure 9 shows the energy consumption of the nitrogen fixation under the same conditions with Figure 8. It is found that three catalysts can decrease the energy consumption of nitrogen fixation. As the gas flow rate increases while the microwave power keeps constant, the energy consumption will decrease. According to Equation (4), the energy consumption is inversely proportional to the NOx concentration and gas flow rate, and directly proportional to the microwave power. When the microwave power remains constant and the gas flow rate increases from 3 to 5 L/min, the energy consumption decreases rapidly because the NOx concentration increases as the gas flow rate. When the gas flow rate increases gradually from 5 L/min to a medium flow rate (7 to 9 L/min), the energy consumption reduces slowly due to the slow increment or even decrement of NOx concentration. When the microwave power is at high levels such as 650 W and 700 W, and the gas also flows at high rates of 11 and 13 L/min, the energy consumption almost levels off due to the very rapid decrement in NOx concentration.
At different microwave power and gas flow rates, the energy consumption with ZSM-5 is higher than that with CuBTC and ZIF-8. The minimum energy consumption obtained in the experiment is 2.05 MJ/mol, which is reduced by 10.1% compared to no catalyst. It is achieved by using CuBTC as the catalyst at the microwave power of 550 W and the gas flow rate of 13 L/min. Compared to the results of the blank group, the energy consumption in the experiment is reduced maximally by 14.6% using CuBTC at 9 L/min and 550 W.
3.3. Particle Size of the Catalysts
In order to find out the particle size of the catalysts before and after usage, this paper employs a transmission electron microscope (HT7800, Hitachi, Tokyo, Japan) to capture TEM images of the catalysts, as depicted in Figure 10. When compared to Figure 2, it is evident that CuBTC has undergone a transformation into the black color, indicating that Cu has been oxidized to CuO. Before usage, CuBTC exhibits the smallest particle size of approximately 408 nm, whereas ZIF-8 has a moderate particle size of about 503 nm, falling between CuBTC and ZSM-5, as illustrated in Figure 10(b). Comparing these results with Figure 8, it suggests that the NOx concentration produced in CuBTC and ZIF-8, which have smaller particle sizes, is greater than that in ZSM-5 with a larger particle size. This conclusion agrees well with the findings of Patil et al., as catalysts with smaller particle sizes generate a high-intensity localized electric field and result in a higher intensity of micro-discharges [23,40]. After the experiments, the particle sizes of CuBTC, ZIF-8, and ZSM-5 all increase, following the order: CuBTC > ZIF-8 > ZSM-5, as shown in Figure 10(c).
4. Conclusions
In this paper, the effect of MOF materials on nitrogen fixation by microwave plasma at atmospheric pressure is investigated. The experimental results show that the MOF materials of CuBTC and ZIF-8 can effectively increase NOx production and reduce energy consumption at different microwave power and gas flow rates, and the improvement effect surpasses that of the general catalyst ZSM-5. The maximum NOx concentration obtained in the experiment reaches 33,400 ppm and the minimum energy consumption is 2.05 MJ/mol. Compared to the results without the catalyst, the energy consumption is reduced by 14.6% and the NOx production is increased by 17.1%. The TEM results of the catalysts reveal that MOF materials, which exhibit higher concentrations of NOx, have smaller particle sizes in comparison to the general catalyst ZSM-5 prior to usage. Furthermore, all the catalyst particle sizes get enlarged after the nitrogen fixation experiments. This paper verifies the superiority of combining atmospheric microwave plasma with MOF catalysts for nitrogen fixation, benefiting to the industrial promotion of plasma-based nitrogen fixation technology.
Author Contributions
Conceptualization, W.X.; methodology, F.Z.; software, F.Z.; validation, S.W.; formal analysis, K.F. and S.W.; investigation, K.F.; resources, F.Z.; data curation, K.F. and S.W.; writing—original draft preparation, F.Z.; writing—review and editing, W.X.; visualization, F.Z.; supervision, W.X.; project administration, W.X.; funding acquisition, W.X. All authors have read and agreed to the published version of the manuscript.
Funding
This research was funded by the National Natural Science Foundation of China under grant number 62101146 and the Guizhou University Talent Project under grant number 2020-51.
Data Availability Statement
The original contributions presented in the study are included in the article, further inquiries can be directed to the corresponding author.
Conflicts of Interest
The authors declare no conflicts of interest.
References
- Galloway, N.J.; Cowling, B.E. Reactive Nitrogen and The World: 200 Years of Change. AMBIO. 2022, 31, 64–71. [Google Scholar] [CrossRef]
- Winter, L.R.; Chen, J.G. N2 Fixation by Plasma-Activated Processes. Joule. 2020, 5, 300–315. [Google Scholar] [CrossRef]
- Wilson, A.; Staack, D.; Farouk, T.; Gutsol, A.; Fridman, A.; Farouk, B. Self-rotating dc atmospheric-pressure discharge over a water-surface electrode: regimes of operation. Plasma Sources Sci. Technol. 2008, 17, 45001. [Google Scholar] [CrossRef]
- Chanway, C.P.; Anand, R.; Yang, H. Nitrogen Fixation Outside and Inside Plant Tissues. In Advances in Biology and Ecology of Nitrogen Fixation, Rijeka, Croatia, 29 January 2014, pp. 3–21.
- Bond, D.W.; Steiger, S.; Zhang, R.; Tie, X.; Orville, R.E. The importance of NOx production by lightning in the tropics. Orville. Atmos. Environ. 2002, 36, 1509–1519. [Google Scholar] [CrossRef]
- Patil, B.S.; Wang, Q.; Hessel, V.; Lang, J. Plasma N2 -fixation: 1900–2014. Catal. Today. 2015, 256, 49–66. [Google Scholar] [CrossRef]
- Zhang, J.; Li, X.; Zheng, J. Non-thermal plasma-assisted ammonia production: A review. Energy Convers. Manage. 2023, 293, 117482. [Google Scholar] [CrossRef]
- Tsone, I.; O’Modhrai, C.; Bogaerts, A.; Gorbanev, Y. Nitrogen Fixation by an Arc Plasma at Elevated Pressure to Increase the Energy Efficiency and Production Rate of NOx. ACS Sustainable Chem. Eng. 2023, 11, 1888–1897. [Google Scholar] [CrossRef]
- Gao, Y.; Zhou, M.; Hu, E.; Zhao, Y.; Yin, G.; Huang, Z. Hydrogen generation by dielectric barrier discharge plasma assisted ammonia decomposition. Energy Convers. Manage. 2024, 306, 118271. [Google Scholar] [CrossRef]
- Kim, T.; Song, S.; Kim, J.; Iwasaki, R. Formation of NOx from Air and N2/O2 Mixtures Using a Nonthermal Microwave Plasma System. Jpn. J. Appl. Phys. 2010, 49, 126201. [Google Scholar] [CrossRef]
- Mutel, B.; Dessaux, O.; Goudmand, P. Energy cost improvement of the nitrogen oxides synthesis in a low pressure plasma. Rev. Phys. Appl. 1984, 19, 461–464. [Google Scholar] [CrossRef]
- Seán, K.; Annemie, B. Nitrogen fixation in an electrode-free microwave plasma. Joule. 2021, 5, 3006–3030. [Google Scholar]
- Zhang, S.; Zong, L.; Zeng, X. Sustainable nitrogen fixation with nanosecond pulsed spark discharges: insights into free-radical-chain reactions. Green Chem. 2022, 24, 1534–1544. [Google Scholar] [CrossRef]
- Iqbal, M.; Hoon, L.D.; Khoe, D.D. A novel energy efficient path for nitrogen fixation using a non-thermal arc. RSC Adv. 2021, 11, 12729–12738. [Google Scholar]
- Lei, X.Y.; Cheng, H.; Nie, L.L.; Lu, X.P. Nitrogen Fixation as NOx Enabled by a Three-Level Coupled Rotating Electrodes Air Plasma at Atmospheric Pressure. Plasma Chem. Plasma Process. 2022, 1, 1–17. [Google Scholar] [CrossRef]
- Vervloessem, E.; Aghaei, M.; Jardali, F.; Hafezkhiabani, N.; Bogaerts, A. Plasma-Based N2 Fixation into NOx: Insights from Modeling toward Optimum Yields and Energy Costs in a Gliding Arc Plasmatron. ACS Sustainable Chem. Eng. 2020, 8, 9711–9720. [Google Scholar] [CrossRef]
- Malik, M.A.; Jiang, C.; Heller, R.; Lane, J.; Hughes, D.; Schoenbach, K.H. Ozone-free nitric oxide production using an atmospheric pressure surface discharge – A way to minimize nitrogen dioxide co-production. Chem. Eng. J. (Amsterdam, Neth.) 2016, 283, 631–638. [Google Scholar] [CrossRef]
- Patil, B.S.; Palau, J.R.; Hessel, V.; Lang, J.; Wang, Q. Plasma Nitrogen Oxides Synthesis in a Milli-Scale Gliding Arc Reactor: Investigating the Electrical and Process Parameters. Plasma Chem. Plasma Process. 2016, 36, 241–257. [Google Scholar] [CrossRef]
- Asisov, R.I.; Givotov, V.K.; Rusanov, V.D.; Fridman, A. Spin effects in elementary processes of high-energy chemistry. Khim. Vys. Energ. 1980, 14, 366. [Google Scholar]
- Rouwenhorst, K.H.R.; Jardali, F.; Bogaerts, A.; Lefferts, L. From the Birkeland-Eyde process towards energy-efficient plasma-based NOx synthesis: a techno-economic analysis. Energy Environ. Sci. 2023, 16, 6170–6173. [Google Scholar] [CrossRef] [PubMed]
- Peng, P.; Schiappacasse, C.; Zhou, N. Sustainable Non-Thermal Plasma-Assisted Nitrogen Fixation—Synergistic Catalysis. ChemSusChem. 2019, 12, 3702–3712. [Google Scholar] [CrossRef]
- Hollevoet, L.; Vervloessem, E.; Gorbanev, Y. Energy-Efficient Small-Scale Ammonia Synthesis Process with Plasma-Enabled Nitrogen Oxidation and Catalytic Reduction of Adsorbed NOx. ChemSusChem. (1 of 7). 2022, 15, e202102526. [Google Scholar] [CrossRef] [PubMed]
- Patil, B.S.; Cherkasov, N.; Lang, J.; Ibhadon, A.O.; Hessel, V.; Wang, Q. Low temperature plasma-catalytic NOx synthesis in a packed DBD reactor: Effect of support materials and supported active metal oxides. Appl. Catal. B 2016, 194, 123–133. [Google Scholar] [CrossRef]
- Pei, X.i; Li, Y.; Luo, Y. Nitrogen fixation as NOx using air plasma coupled with heterogeneous catalysis at atmospheric pressure. Plasma Processes Polym. 2023, 21, e2300135. [Google Scholar] [CrossRef]
- Javishk, S.; Ting, W.; Jolie, L.; Moises, A.C.; Maria, C.L. Nonthermal Plasma Synthesis of Ammonia over Ni-MOF-74. ACS Sustainable Chem. Eng. 2019, 7, 377–383. [Google Scholar]
- Wandell, R.J.; Wang, H.H.; Bulusu, R.K.M.; Gallan, R.O.; Locke, B.R. “Formation of nitrogen oxides by nanosecond pulsed plasma discharges in gas-liquid reactors. Plasma Chem. Plasma Process. 2019, 39, 643–666. [Google Scholar] [CrossRef]
- Liu, Y.; Wang, C.W.; Xu, X.F. Synergistic effect of Co-Ni bimetal on plasma catalytic ammonia synthesis. Plasma Chem. Plasma Process. 2022, 42, 267–282. [Google Scholar] [CrossRef]
- Gorky, F.; Lucero, J.M.; Crawford, J.M.; Blake, B.; Carreon, M.A.; Carreon, M.L. Plasma-induced catalytic conversion of nitrogen and hydrogen to ammonia over zeolitic imidazolate frameworks ZIF-8 and ZIF-67. ACS Appl. Mater. Interfaces. 2021, 13, 21338–21348. [Google Scholar] [CrossRef]
- Shah, J.; Wang, W.; Bogaerts, A.; Carreon, M.L. Ammonia synthesis by radio frequency plasma catalysis: revealing the underlying mechanisms. ACS Appl. Energy Mater. 2018, 1, 4824–4839. [Google Scholar] [CrossRef]
- Farha, O.K.; Eryazici, I.; Jeong, N.C. Metal−organic framework materials with ultrahigh surface areas: is the sky the limit? J. Am. Chem. Soc. 2012, 134, 15016–15021. [Google Scholar] [CrossRef]
- Qiu, W.; Wang, Y.; Li, C. Effect of Activation Temperature on Catalytic Performance of CuBTC for CO Oxidation. He. Chin. J. Catal. 2012, 33, 986–992. [Google Scholar] [CrossRef]
- Yan, Q.; Yan, C.; Lin, C.; Jiang, H. Metal–Organic-Framework-Derived Hollow N-Doped Porous Carbon with Ultrahigh Concentrations of Single Zn Atoms for Efficient Carbon Dioxide Conversion. Angew. Chem., Int. Ed. 2019, 131, 3549–3553. [Google Scholar]
- Huang, S.; Liu, C.; Jie, Z.; Zhang, G. Imaging Diagnostics and Gas Temperature Measurements of Atmospheric-Microwave-Induced Air Plasma Torch. IEEE Trans. Plasma Sci. 2020, 48, 2958–2958. [Google Scholar] [CrossRef]
- Ivorra, B. Application of the Laminar Navier–Stokes Equations for Solving 2D and 3D Pathfinding Problems with Static and Dynamic Spatial Constraints: Implementation and Validation in Comsol Multiphysics. J. Sci. Comput. 2018, 74, 1163–1187. [Google Scholar] [CrossRef]
- Wei, X.; Huang, K.; Zhang, W.; Yi, L. Modeling of Argon Plasma Excited by Microwave at Atmospheric Pressure in Ridged Waveguide. IEEE Trans. Plasma Sci. 2016, 44, 1075–1082. [Google Scholar]
- Xiao, W.; Liao, Y.; Wang, F. Determining Electron Density of Atmospheric Microwave Air Plasma Torch by Microwave Power Measurement. IEEE Trans. Plasma Sci. 2022, 50, 1781–1789. [Google Scholar] [CrossRef]
- Pitchai, K.; Chen, J.; Birla, S.; Gonzalez, R.; Jones, D.; Subbiah, J. A microwave heat transfer model for a rotating multi-component meal in a domestic oven: Development and validation. Food Eng. 2014, 128, 60–71. [Google Scholar] [CrossRef]
- Bahnamiri, O.S.; Verheyen, C.; Snyders, R.; Bogaerts, A.; Britun, N. Nitrogen fixation in pulsed microwave discharge studied by infrared absorption combined with modelling. Plasma Sources Sci. Technol. 2021, 30, 1–15. [Google Scholar] [CrossRef]
- Zhang, W.; Wu, L.; Tao, J.; Huang, K. Numerical Investigation of the Gas Flow Effects on Surface Wave Propagation and Discharge Properties in a Microwave Plasma Torch. IEEE Trans. Plasma Sci. 2019, 47, 271–277. [Google Scholar] [CrossRef]
- Neyts, C.E. Plasma-Surface Interactions in Plasma Catalysis. Plasma Chem. Plasma Process. 2016, 36, 185–212. [Google Scholar] [CrossRef]
Figure 1.
Photograph of the experiment system.
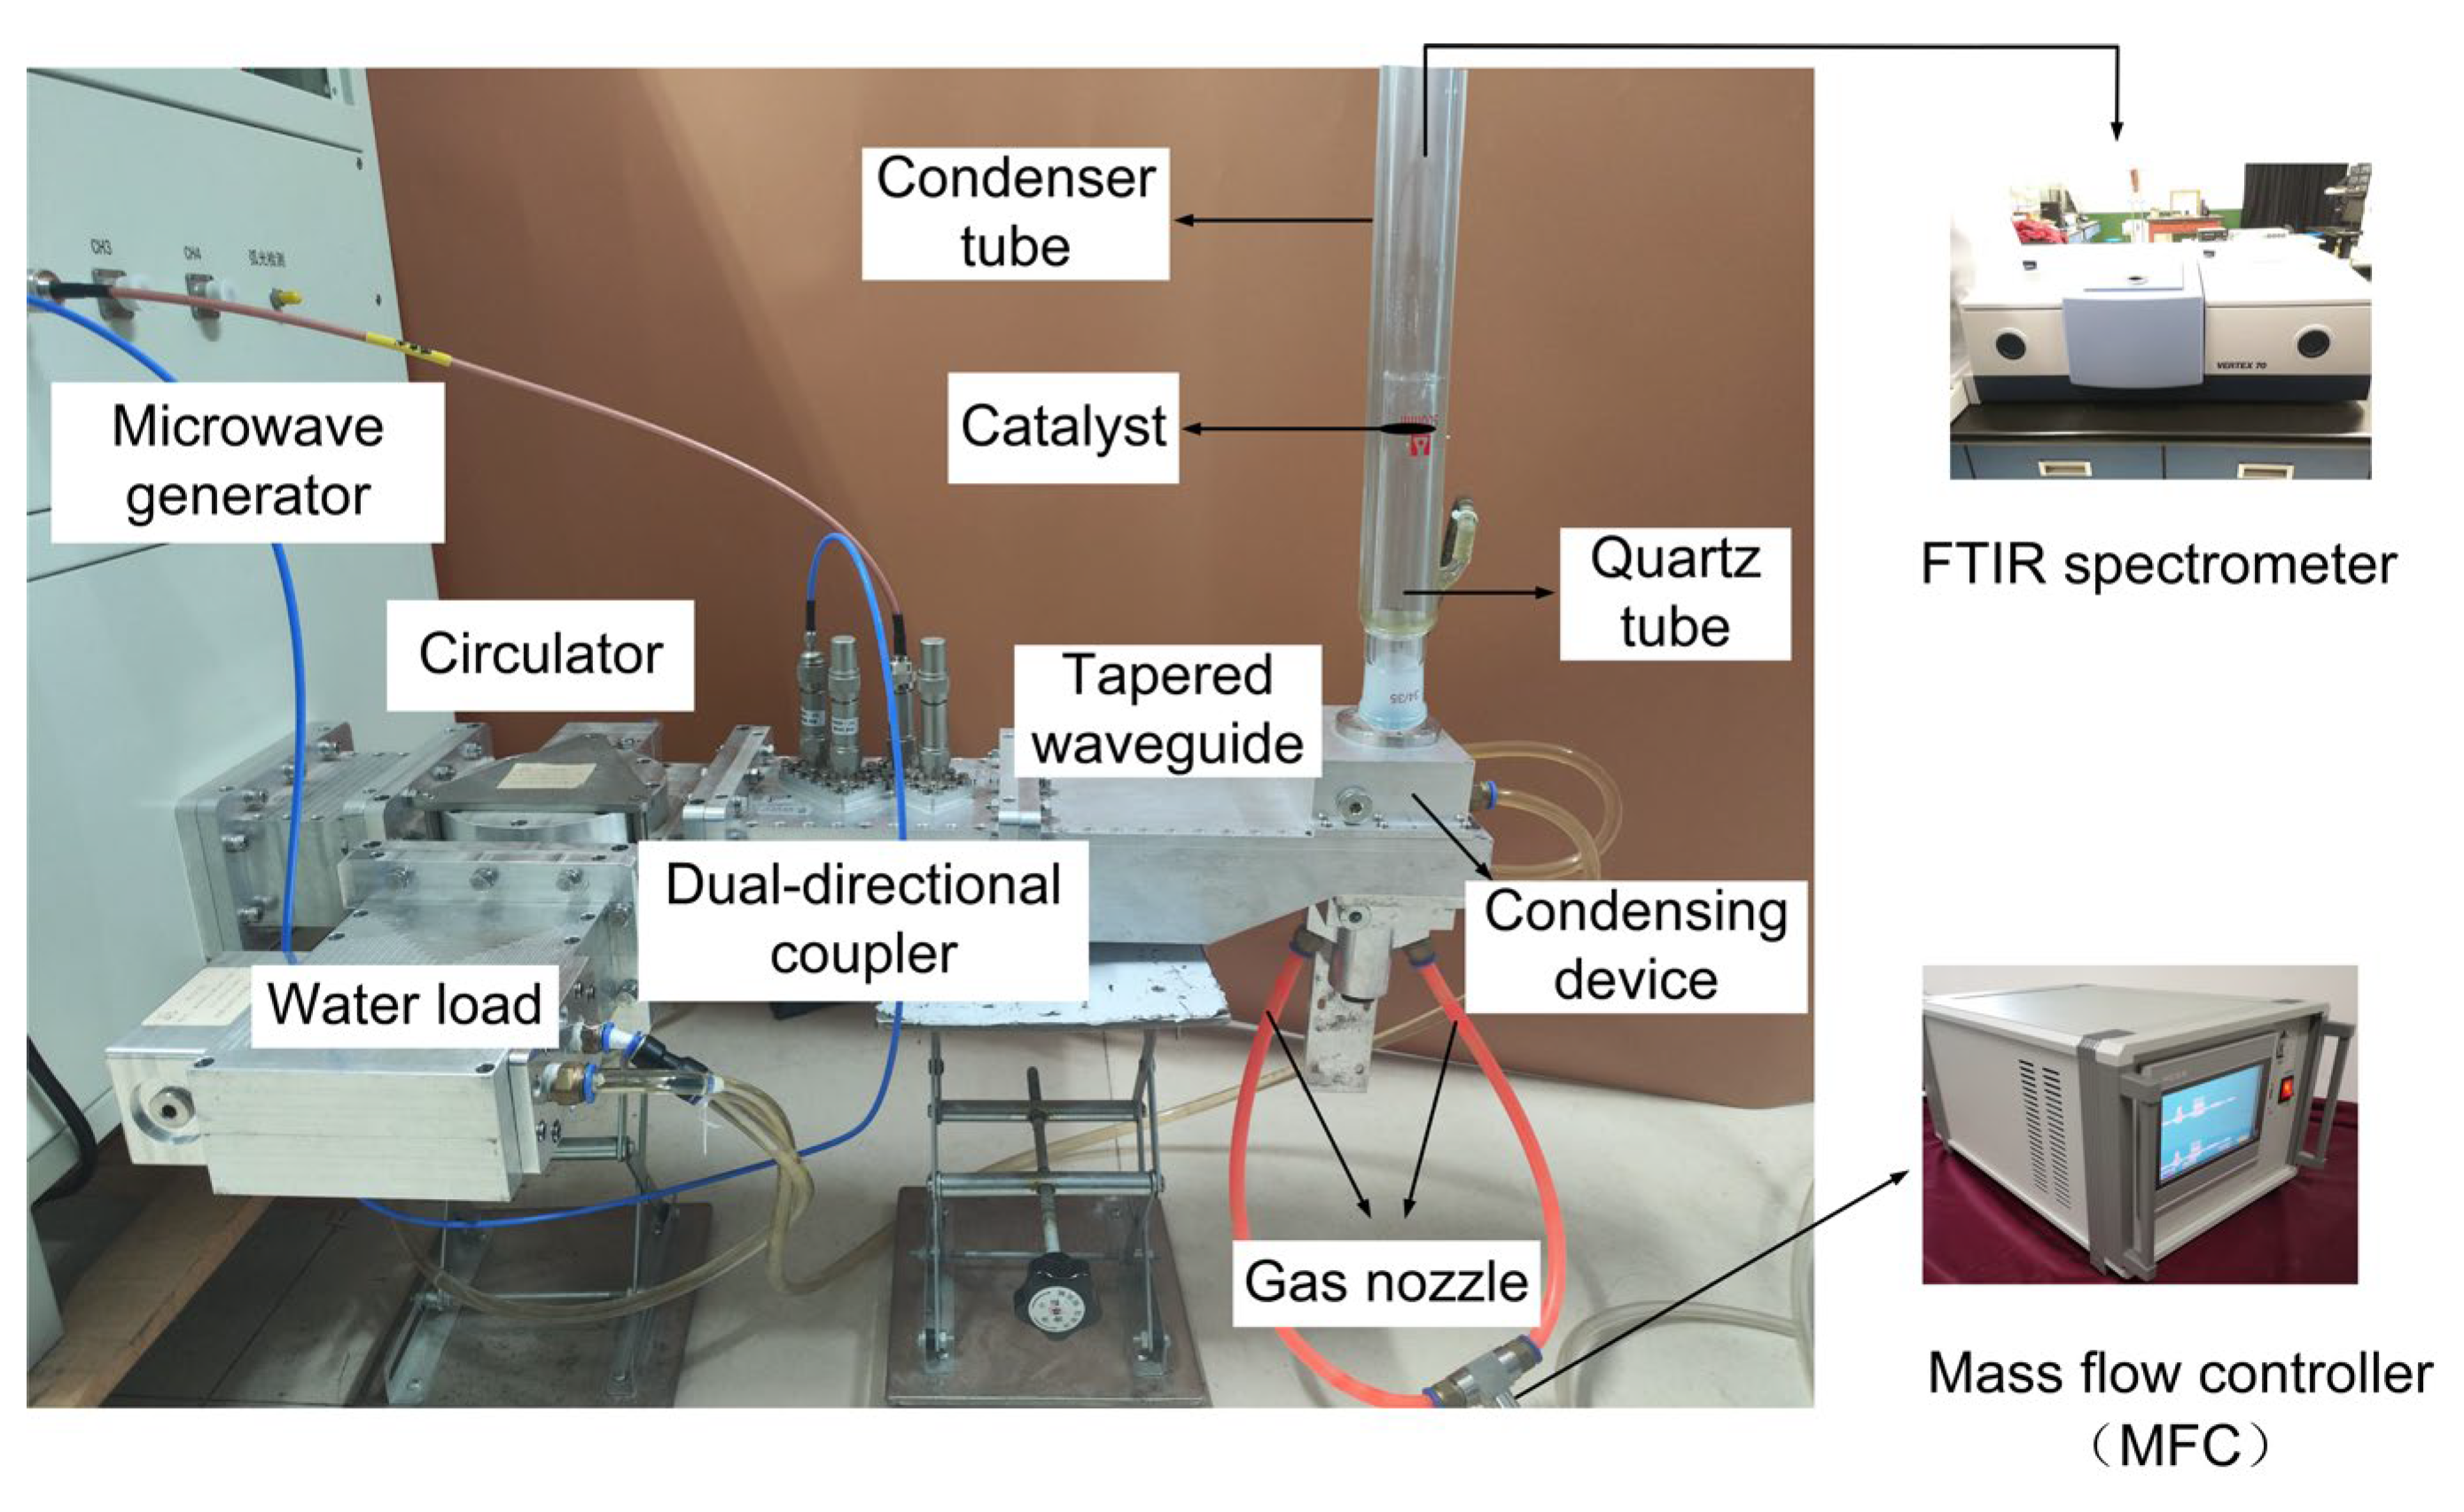
Figure 2.
Photographs of three catalysts prior to usage.
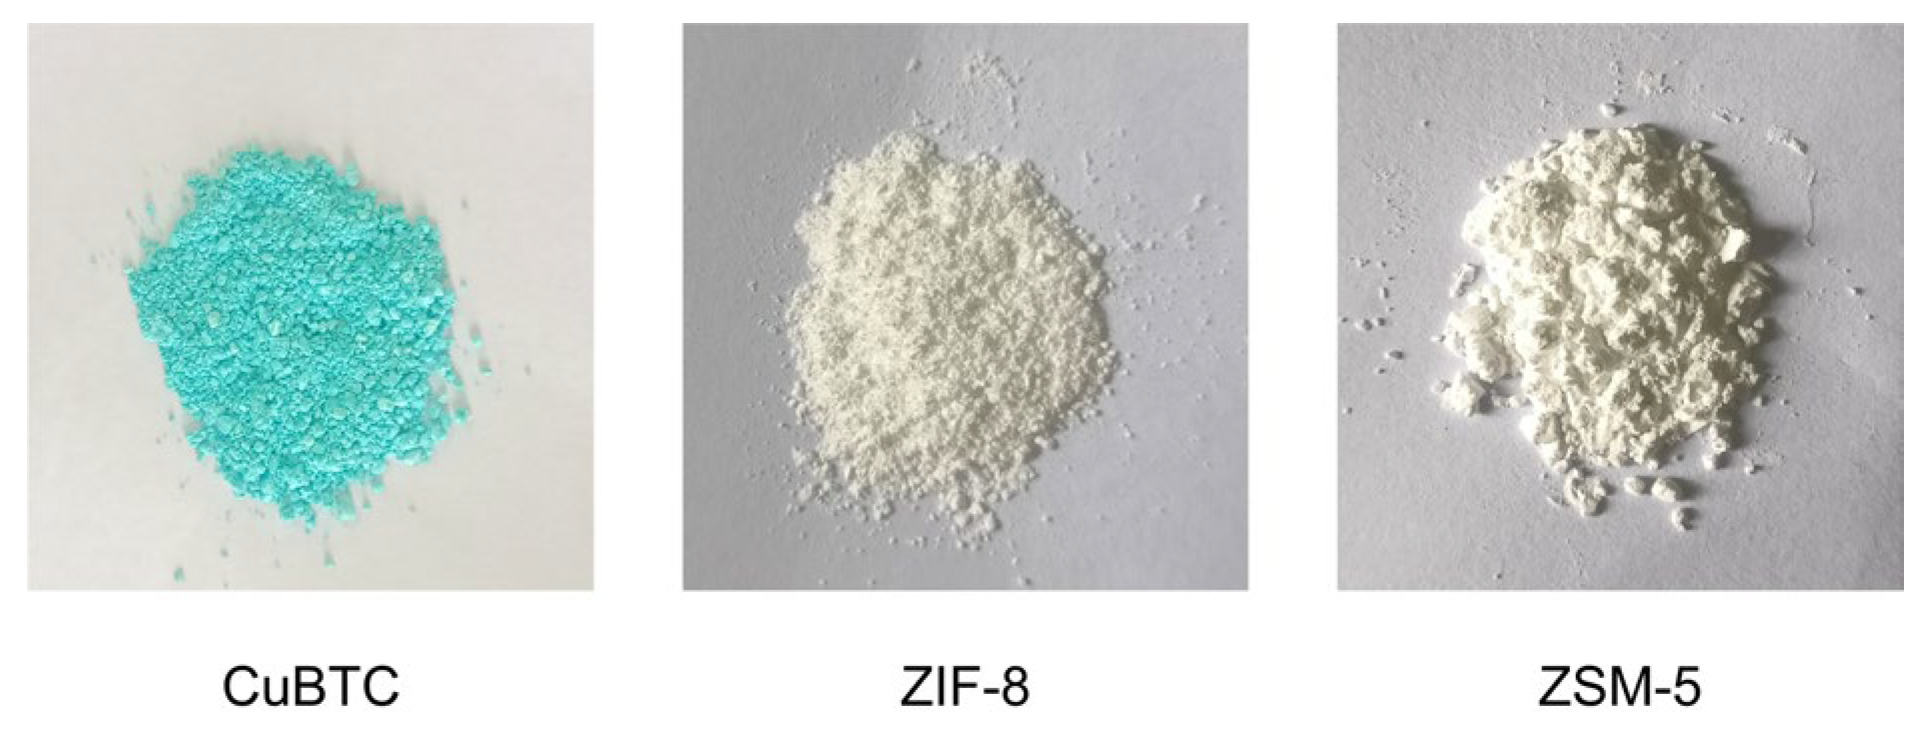
Figure 3.
Computational model of temperature distribution in plasma and its downstream area.
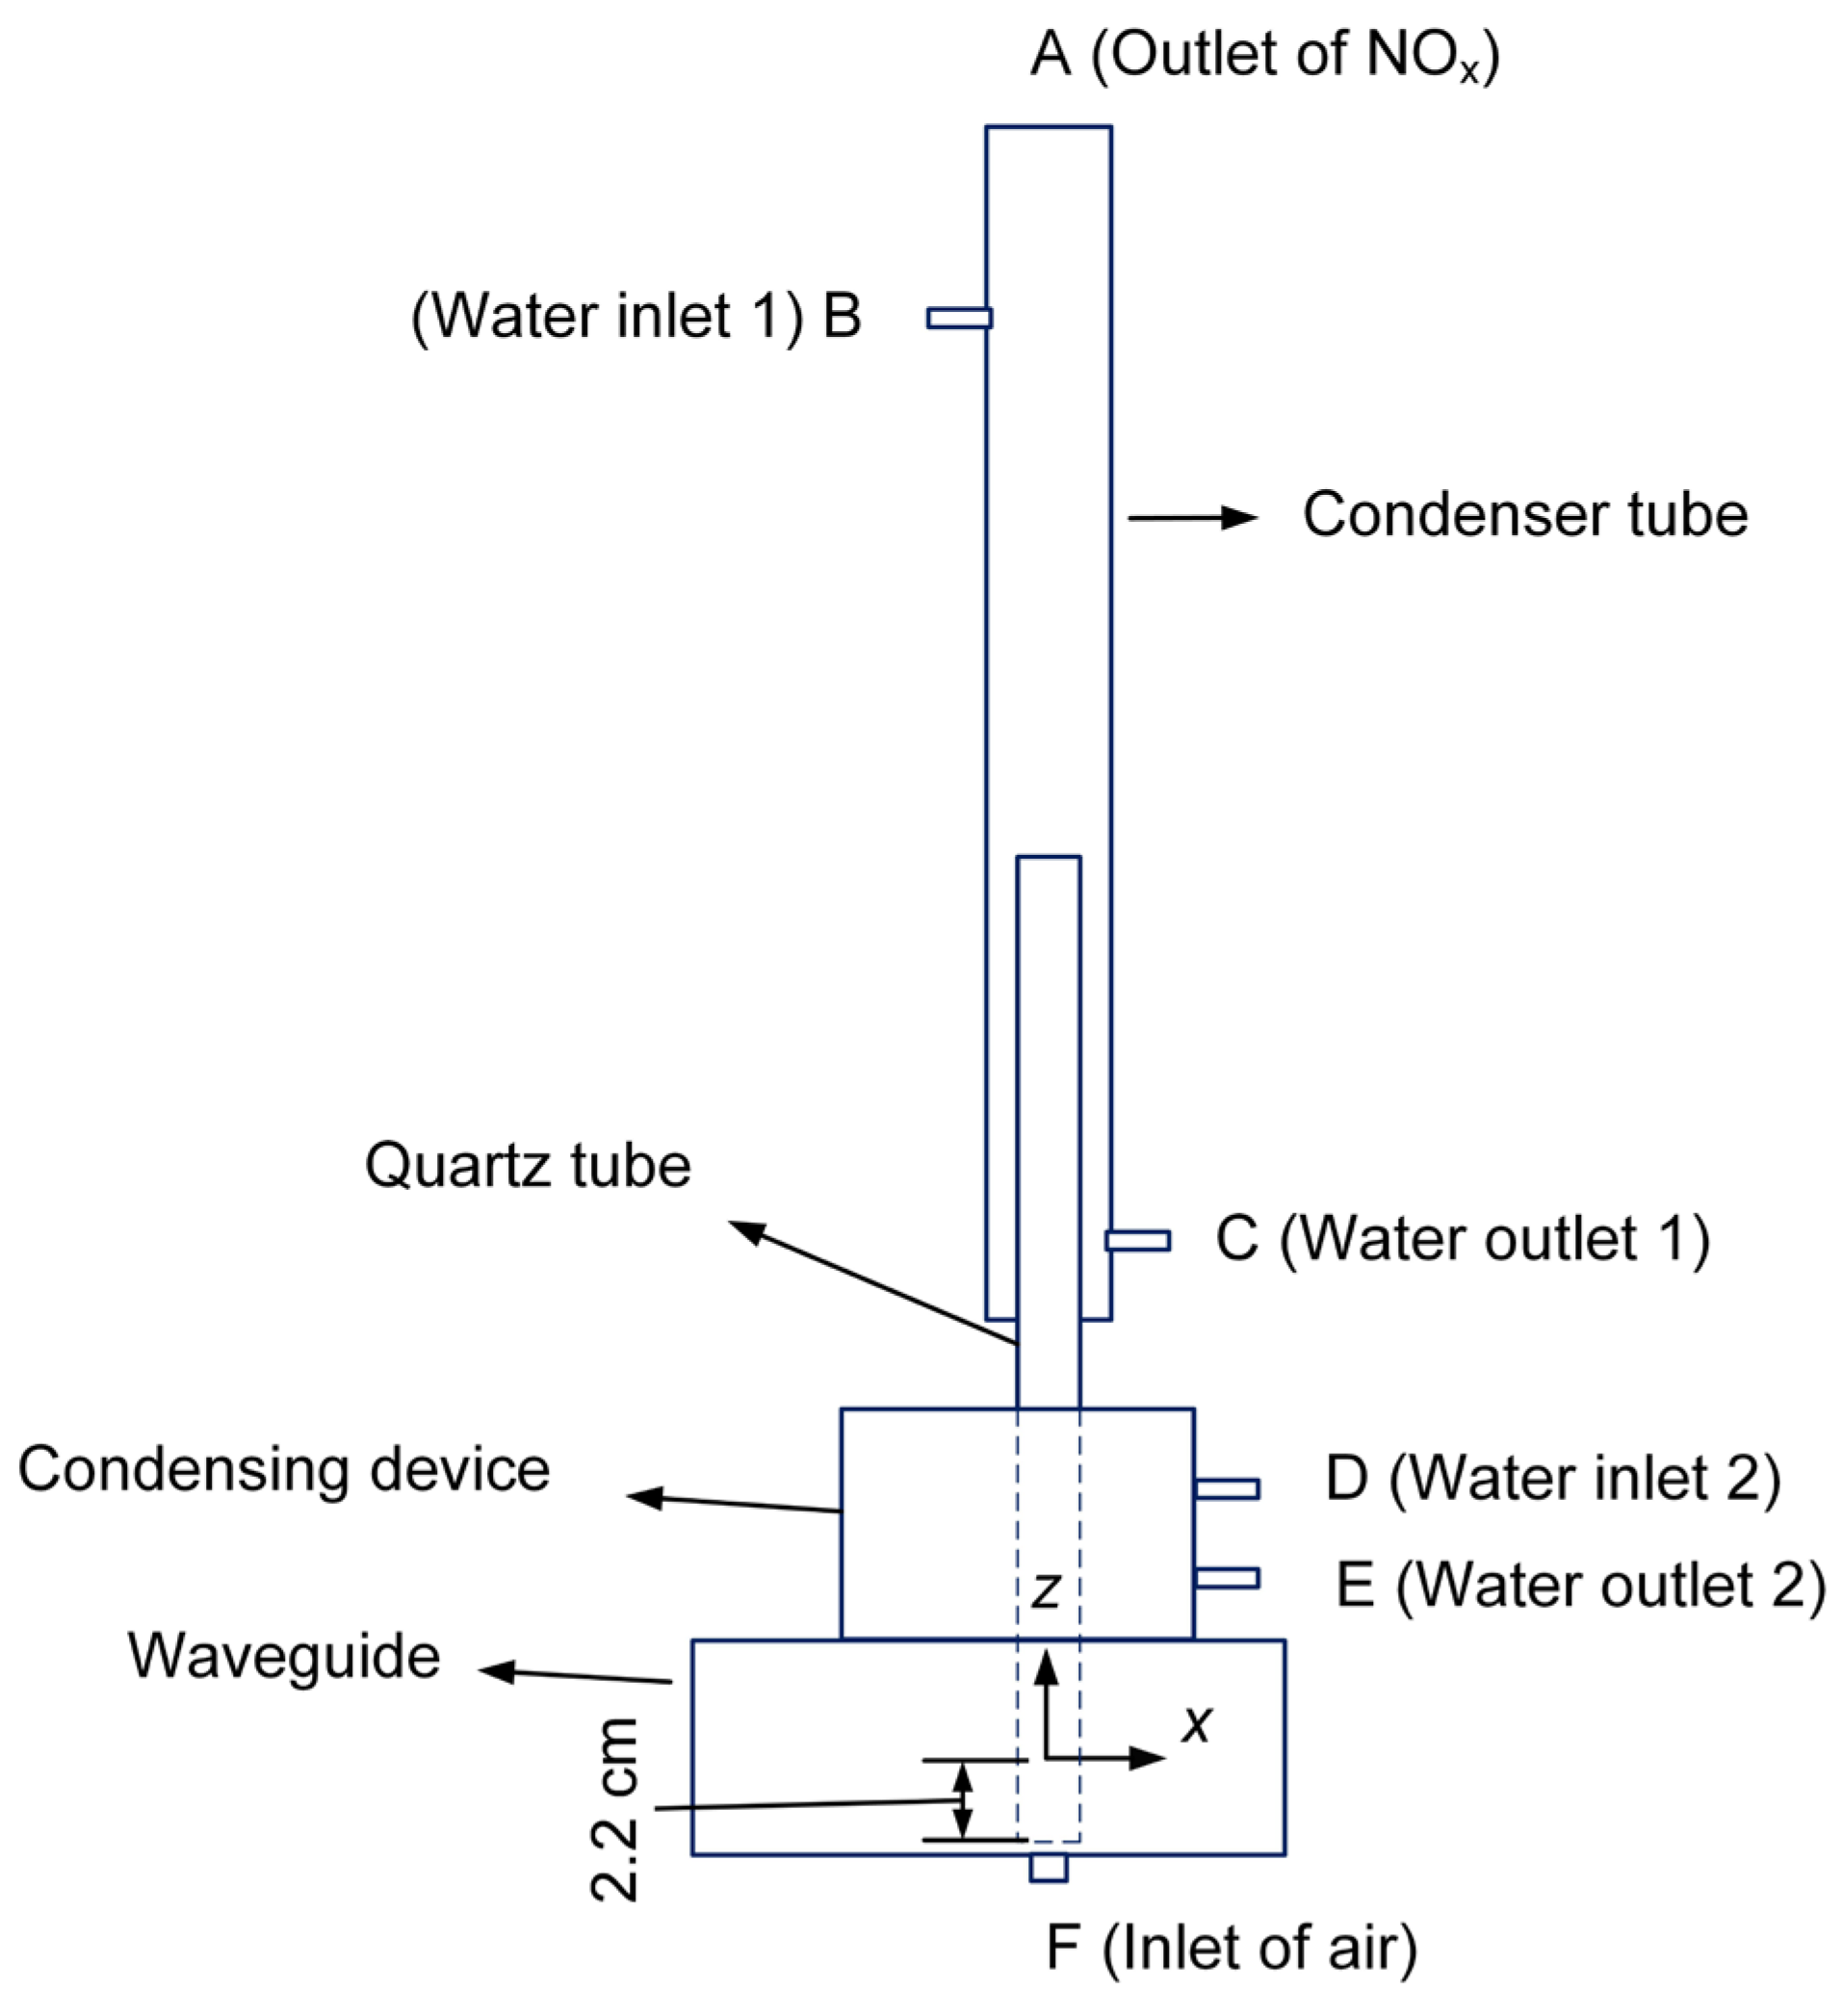
Figure 4.
Temperature distribution in the (a) x- z plane and (b) x-y plane (unit: ℃ ).
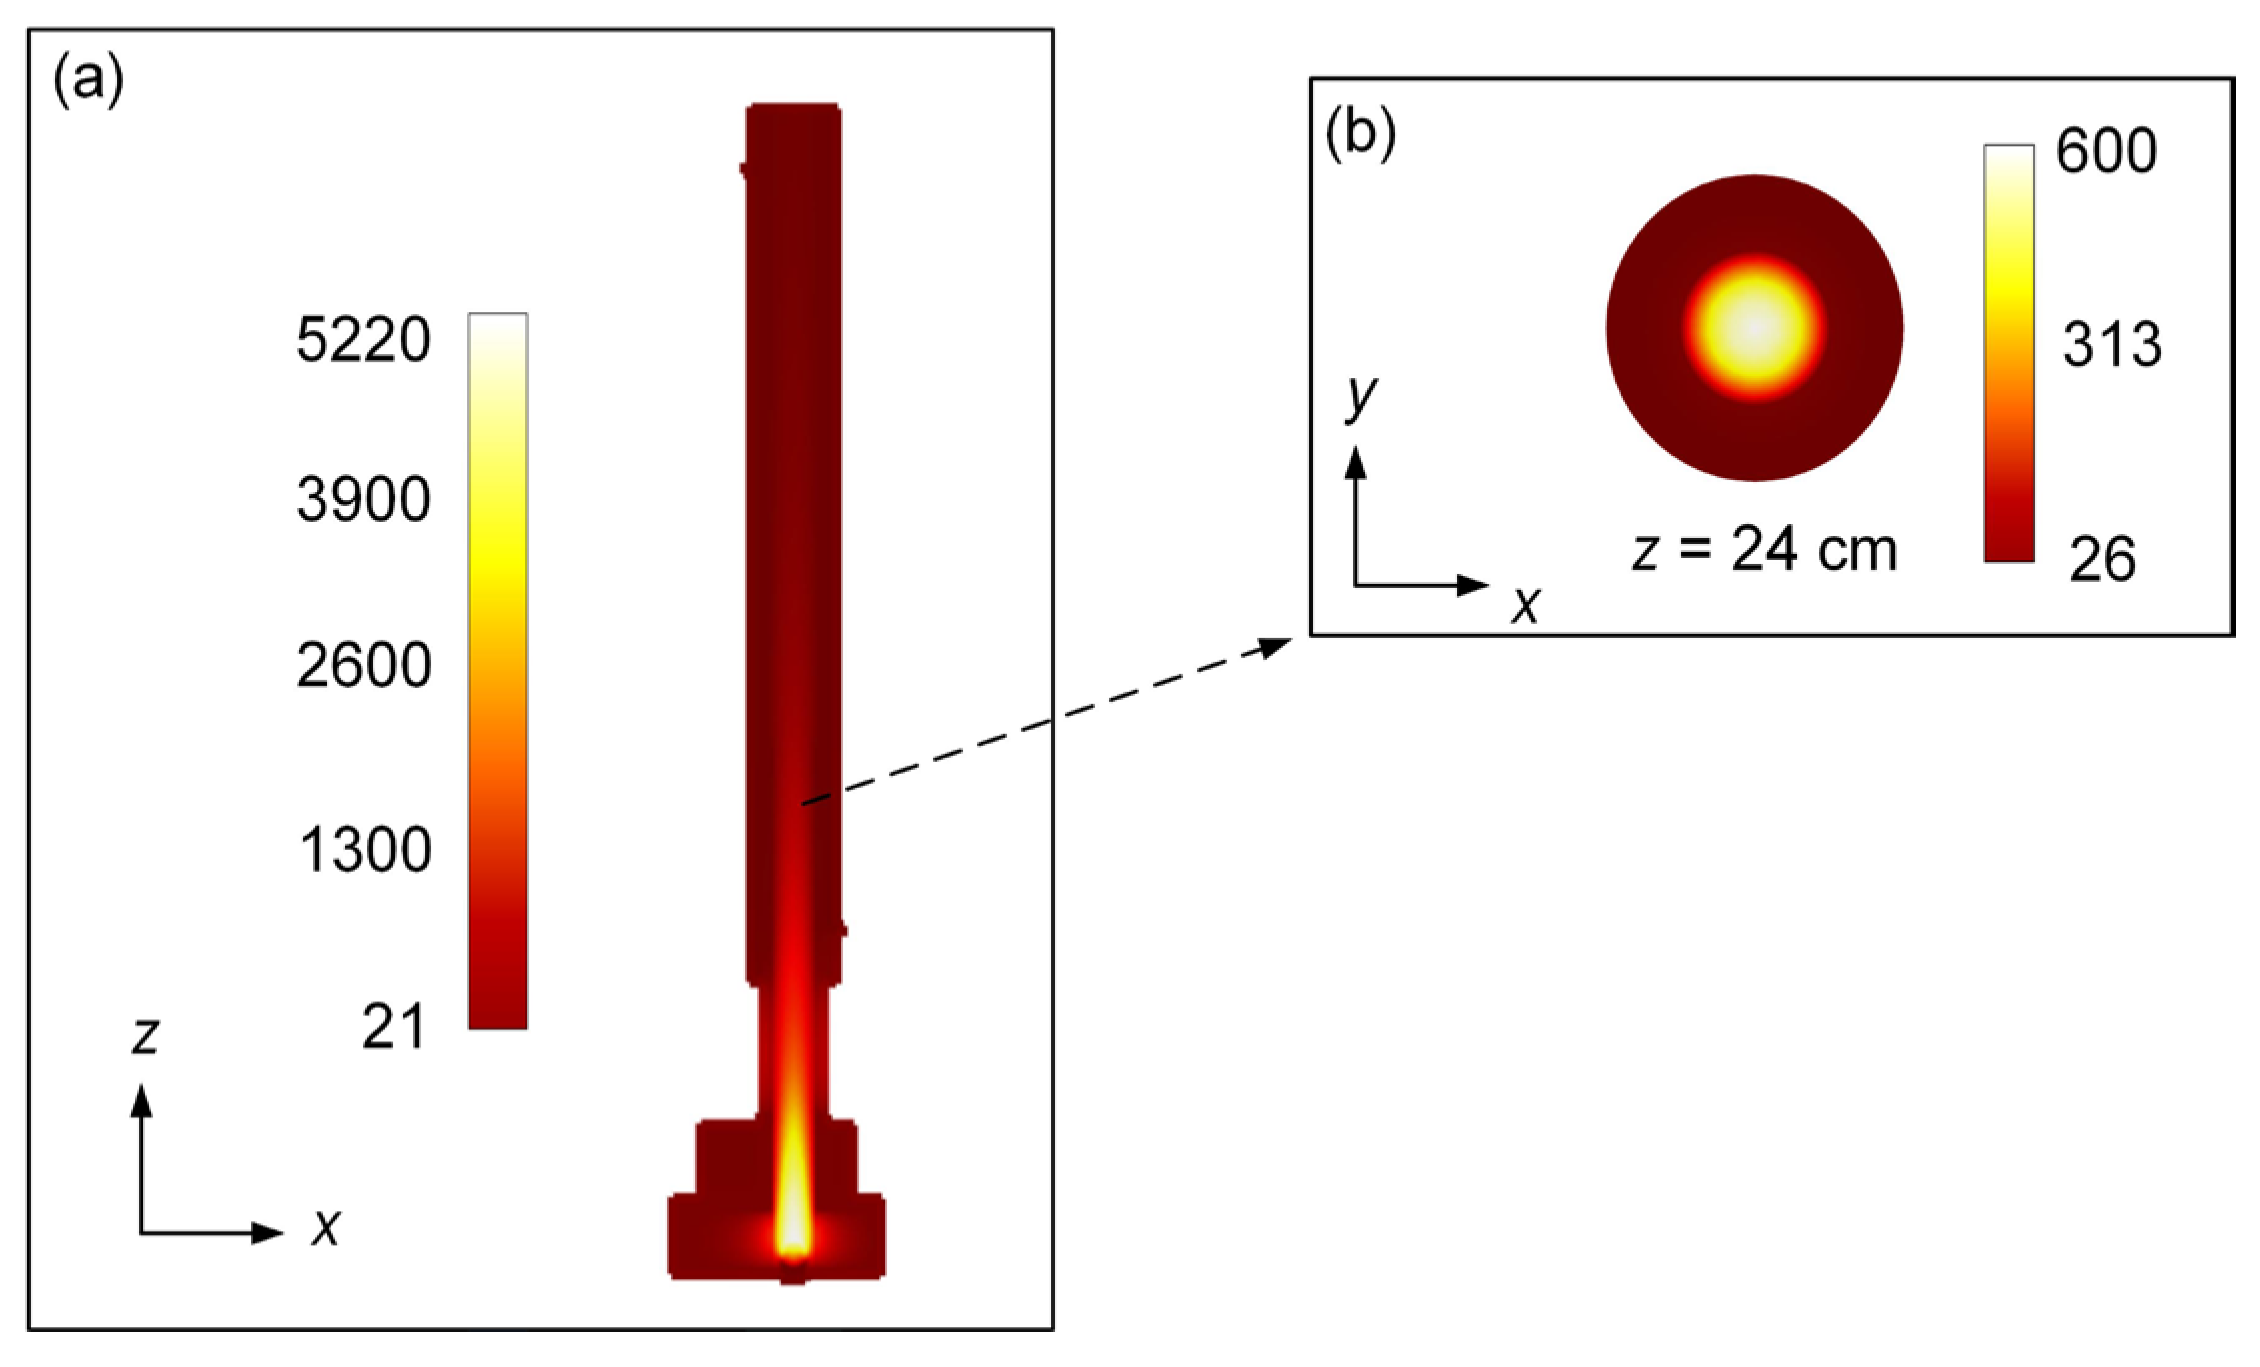
Figure 5.
Gas temperature at the z-axis in the quartz tube.
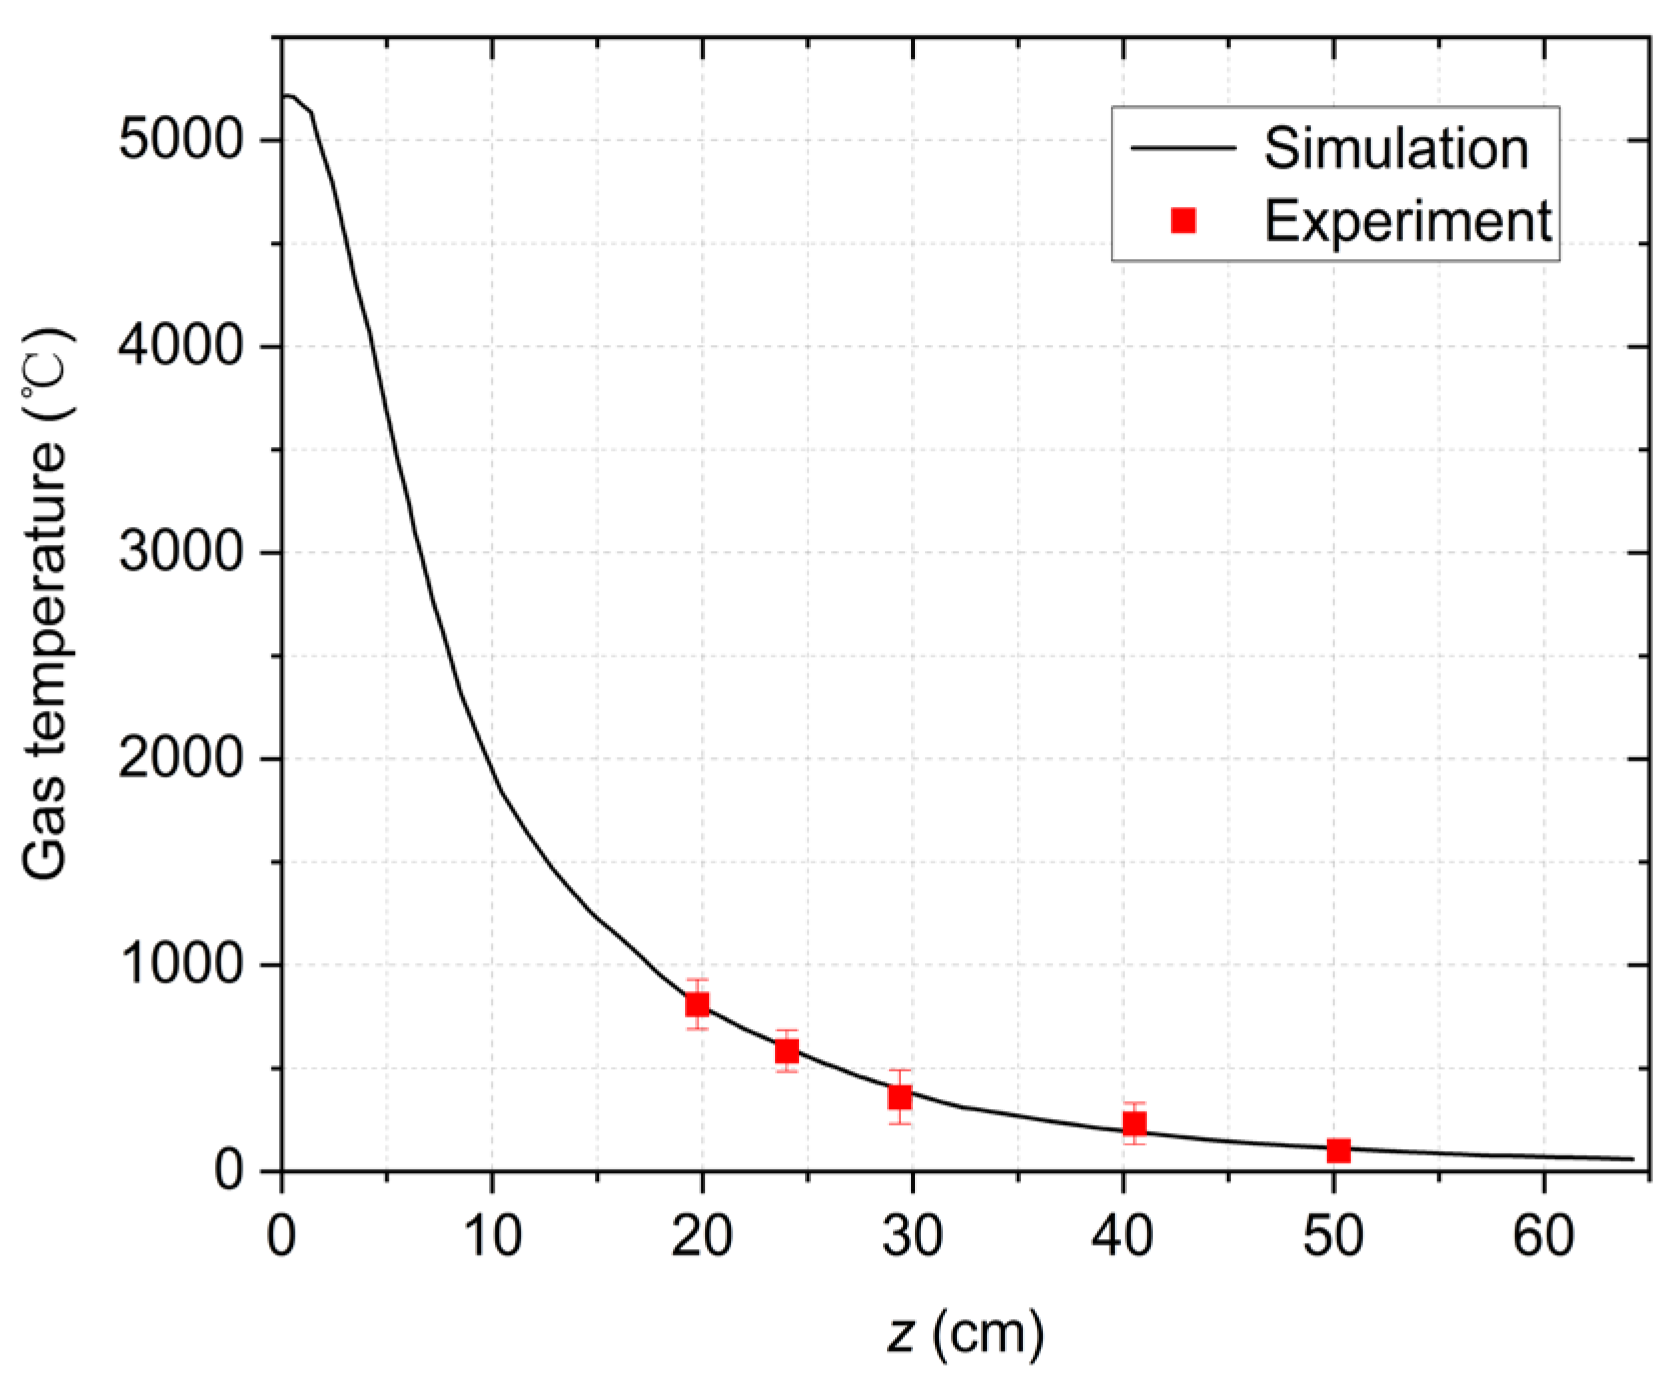
Figure 6.
Infrared absorption spectrum of the generated gas by atmospheric microwave plasma.
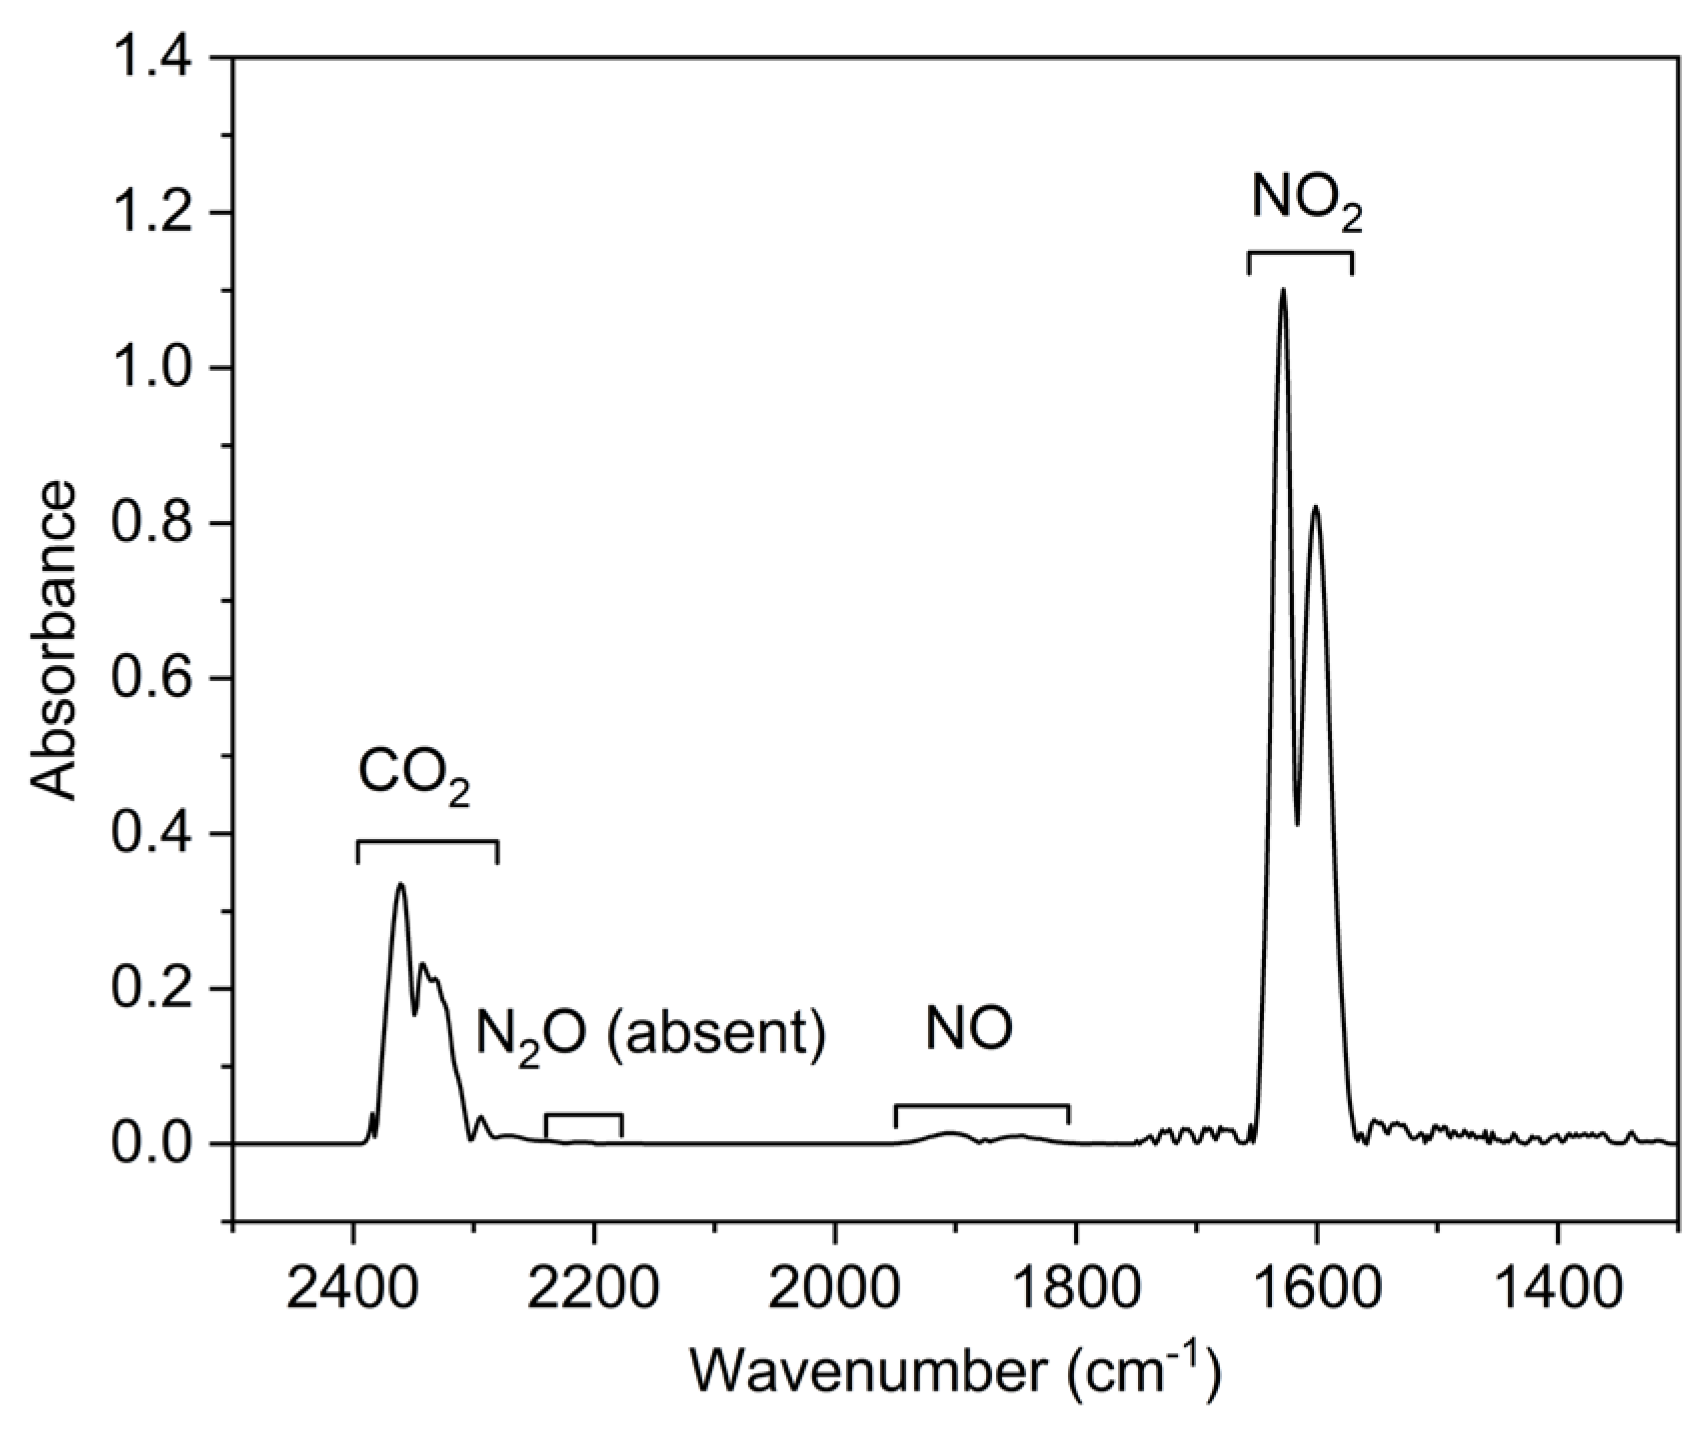
Figure 7.
Infrared absorption spectra of (a) NO and (c) NO2 with standard concentrations and the calibration curves of (b) NO and (d) NO2.
Figure 7.
Infrared absorption spectra of (a) NO and (c) NO2 with standard concentrations and the calibration curves of (b) NO and (d) NO2.
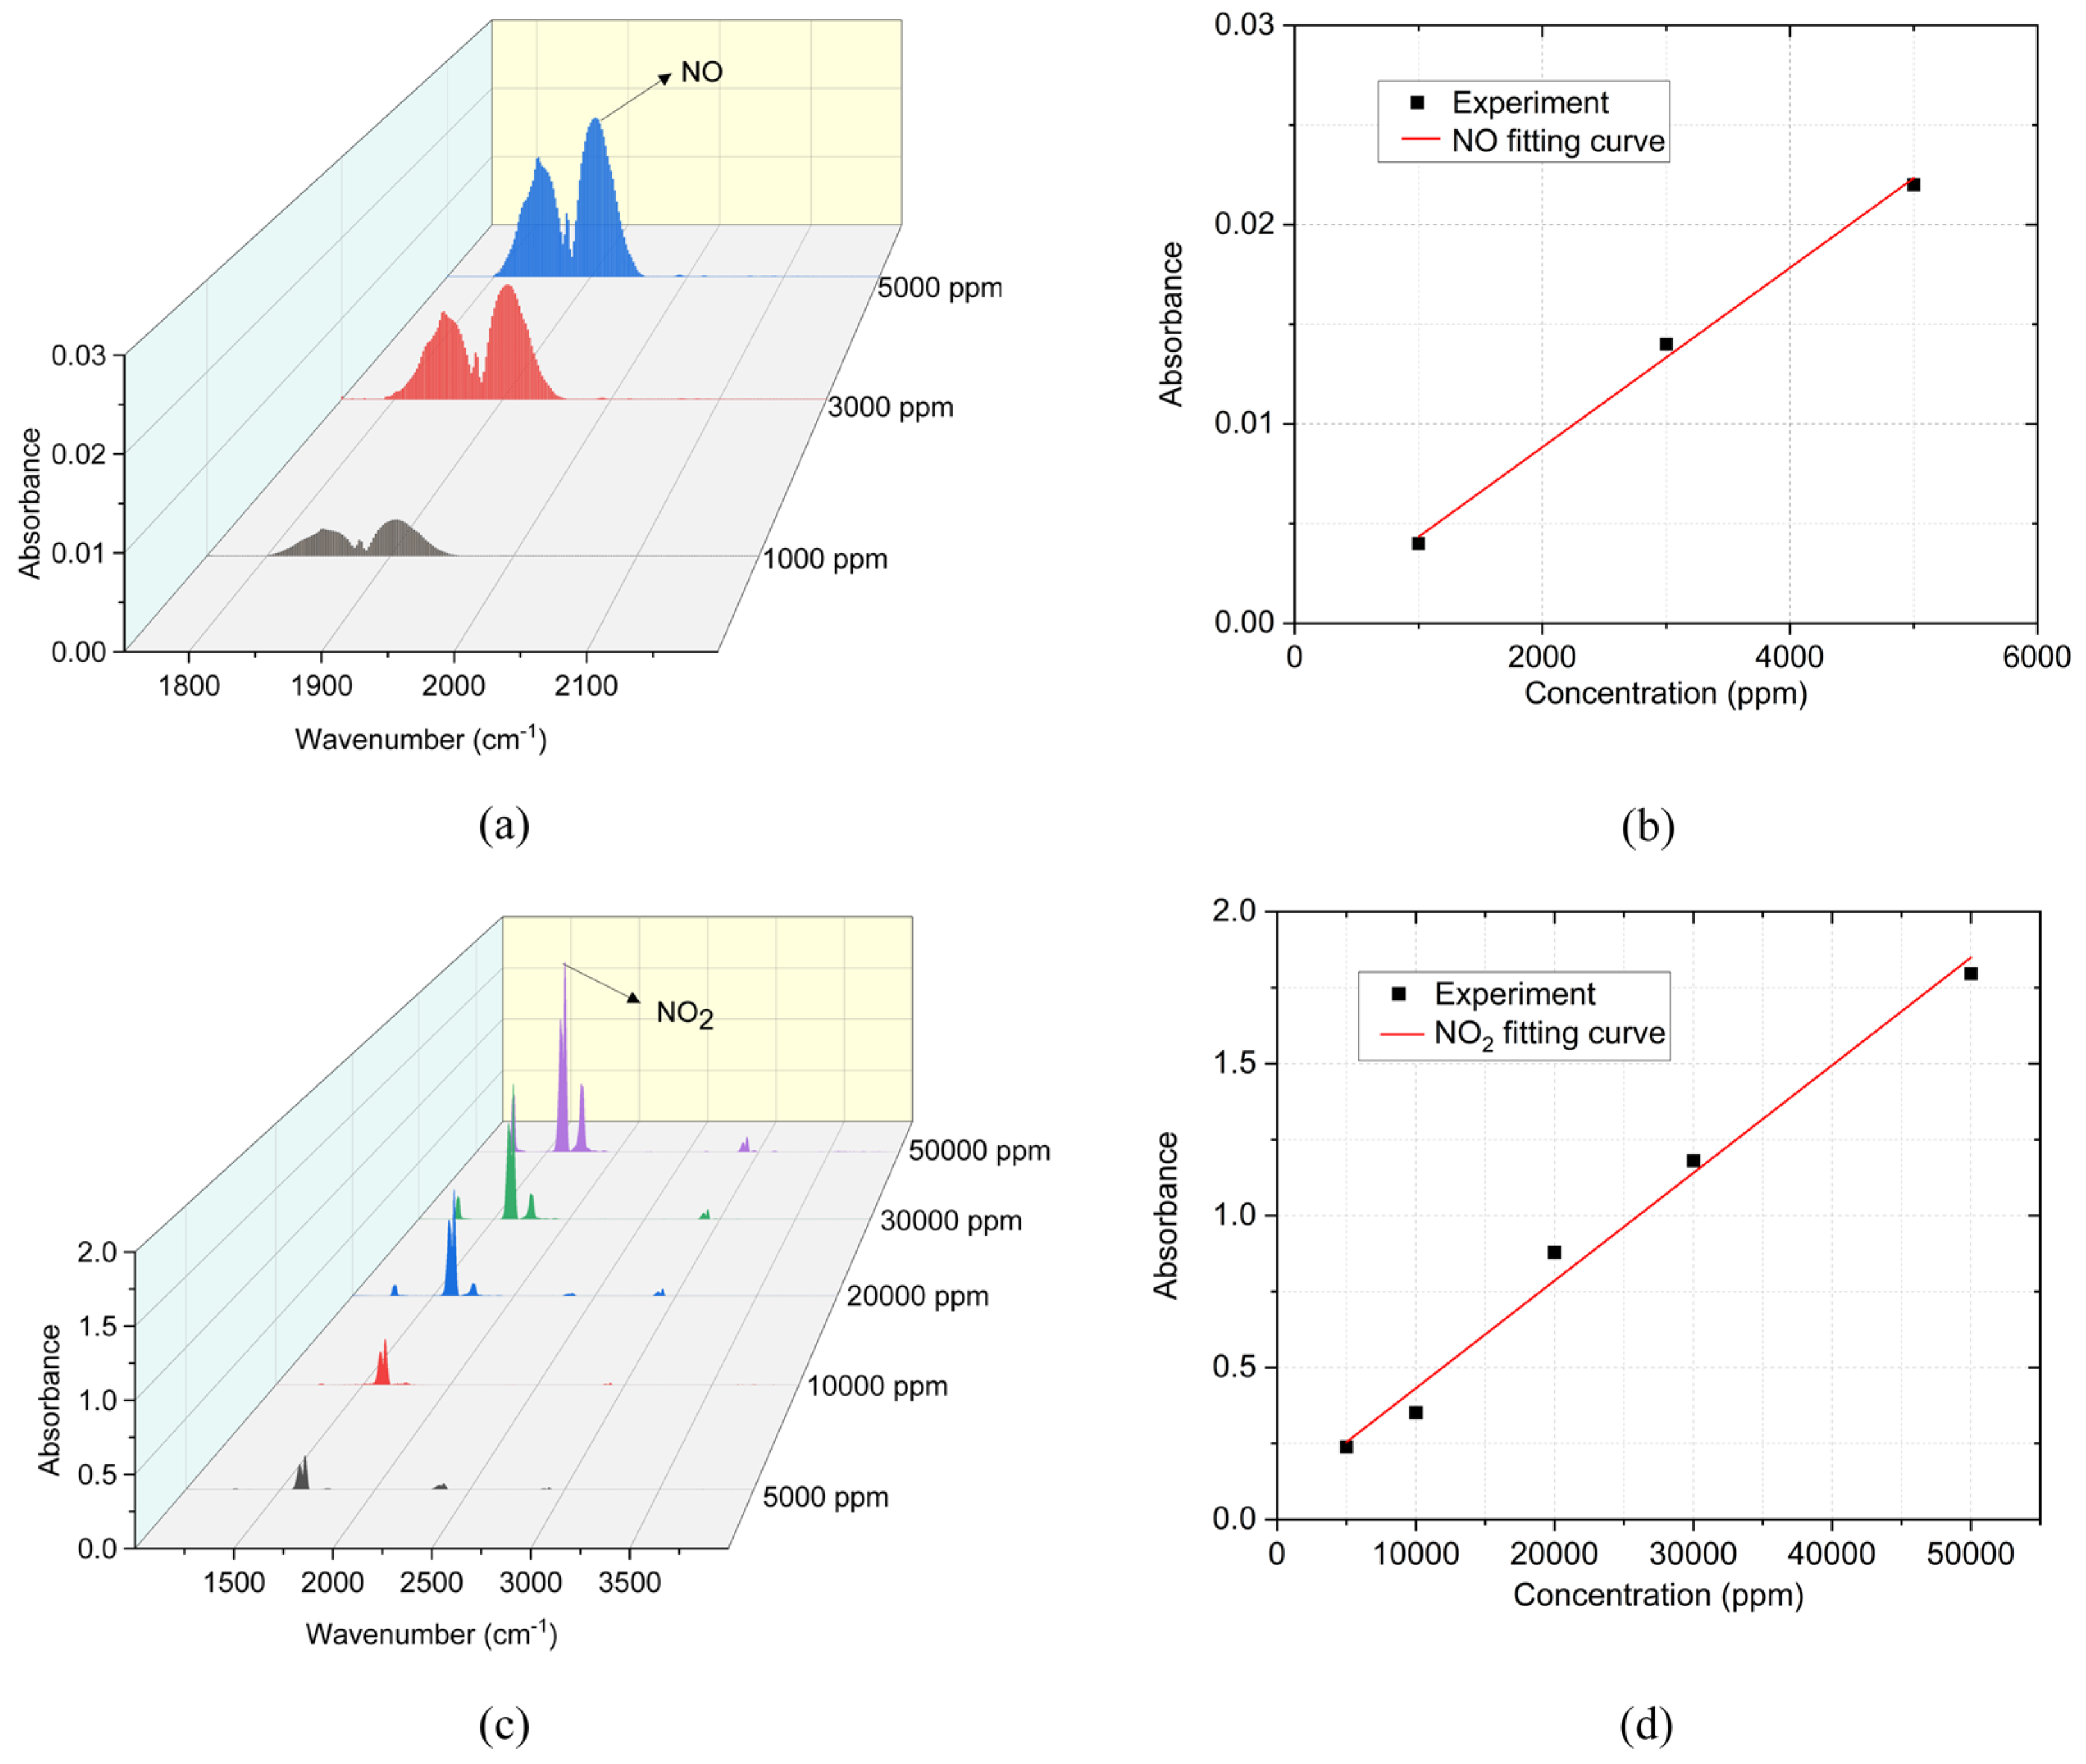
Figure 8.
NOx concentration at different gas flow rates and microwave power of (a) 450 W, (b) 550 W, (c) 650 W, and (d) 700 W.
Figure 8.
NOx concentration at different gas flow rates and microwave power of (a) 450 W, (b) 550 W, (c) 650 W, and (d) 700 W.
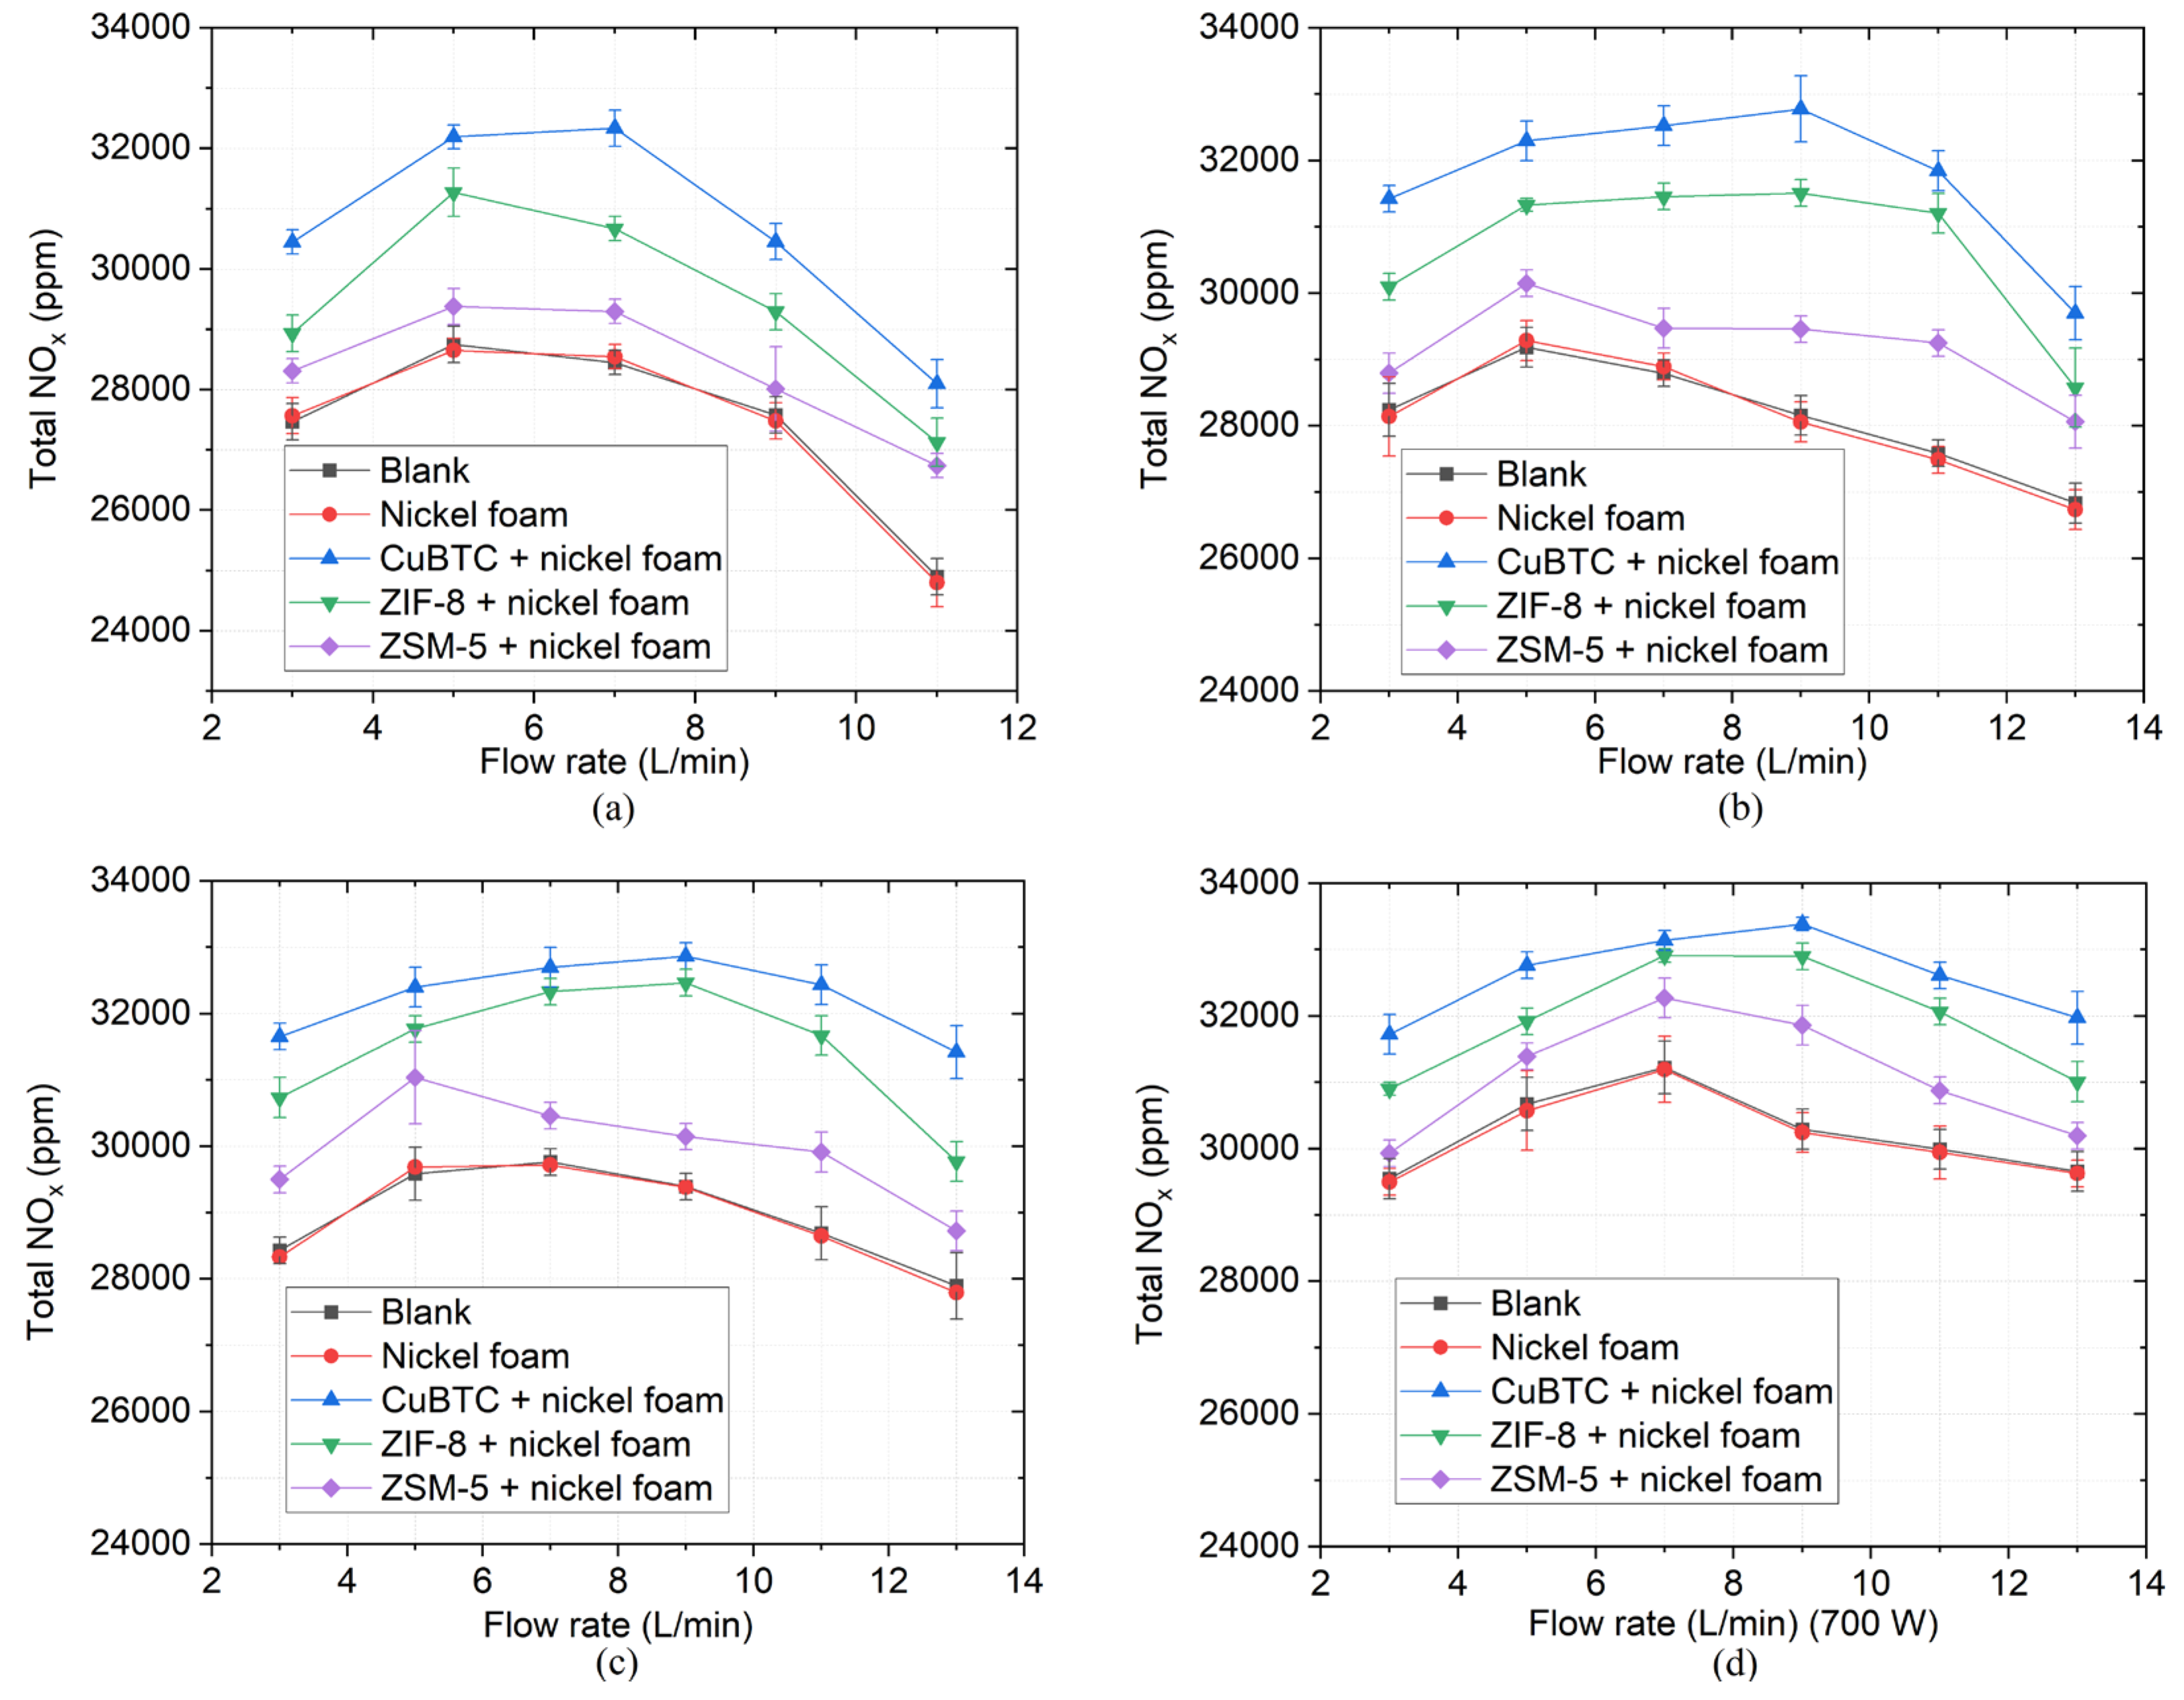
Figure 9.
Energy consumption with different gas flow rates and microwave power of (a) 450 W, (b) 550 W, (c) 650 W, and (d) 700 W.
Figure 9.
Energy consumption with different gas flow rates and microwave power of (a) 450 W, (b) 550 W, (c) 650 W, and (d) 700 W.
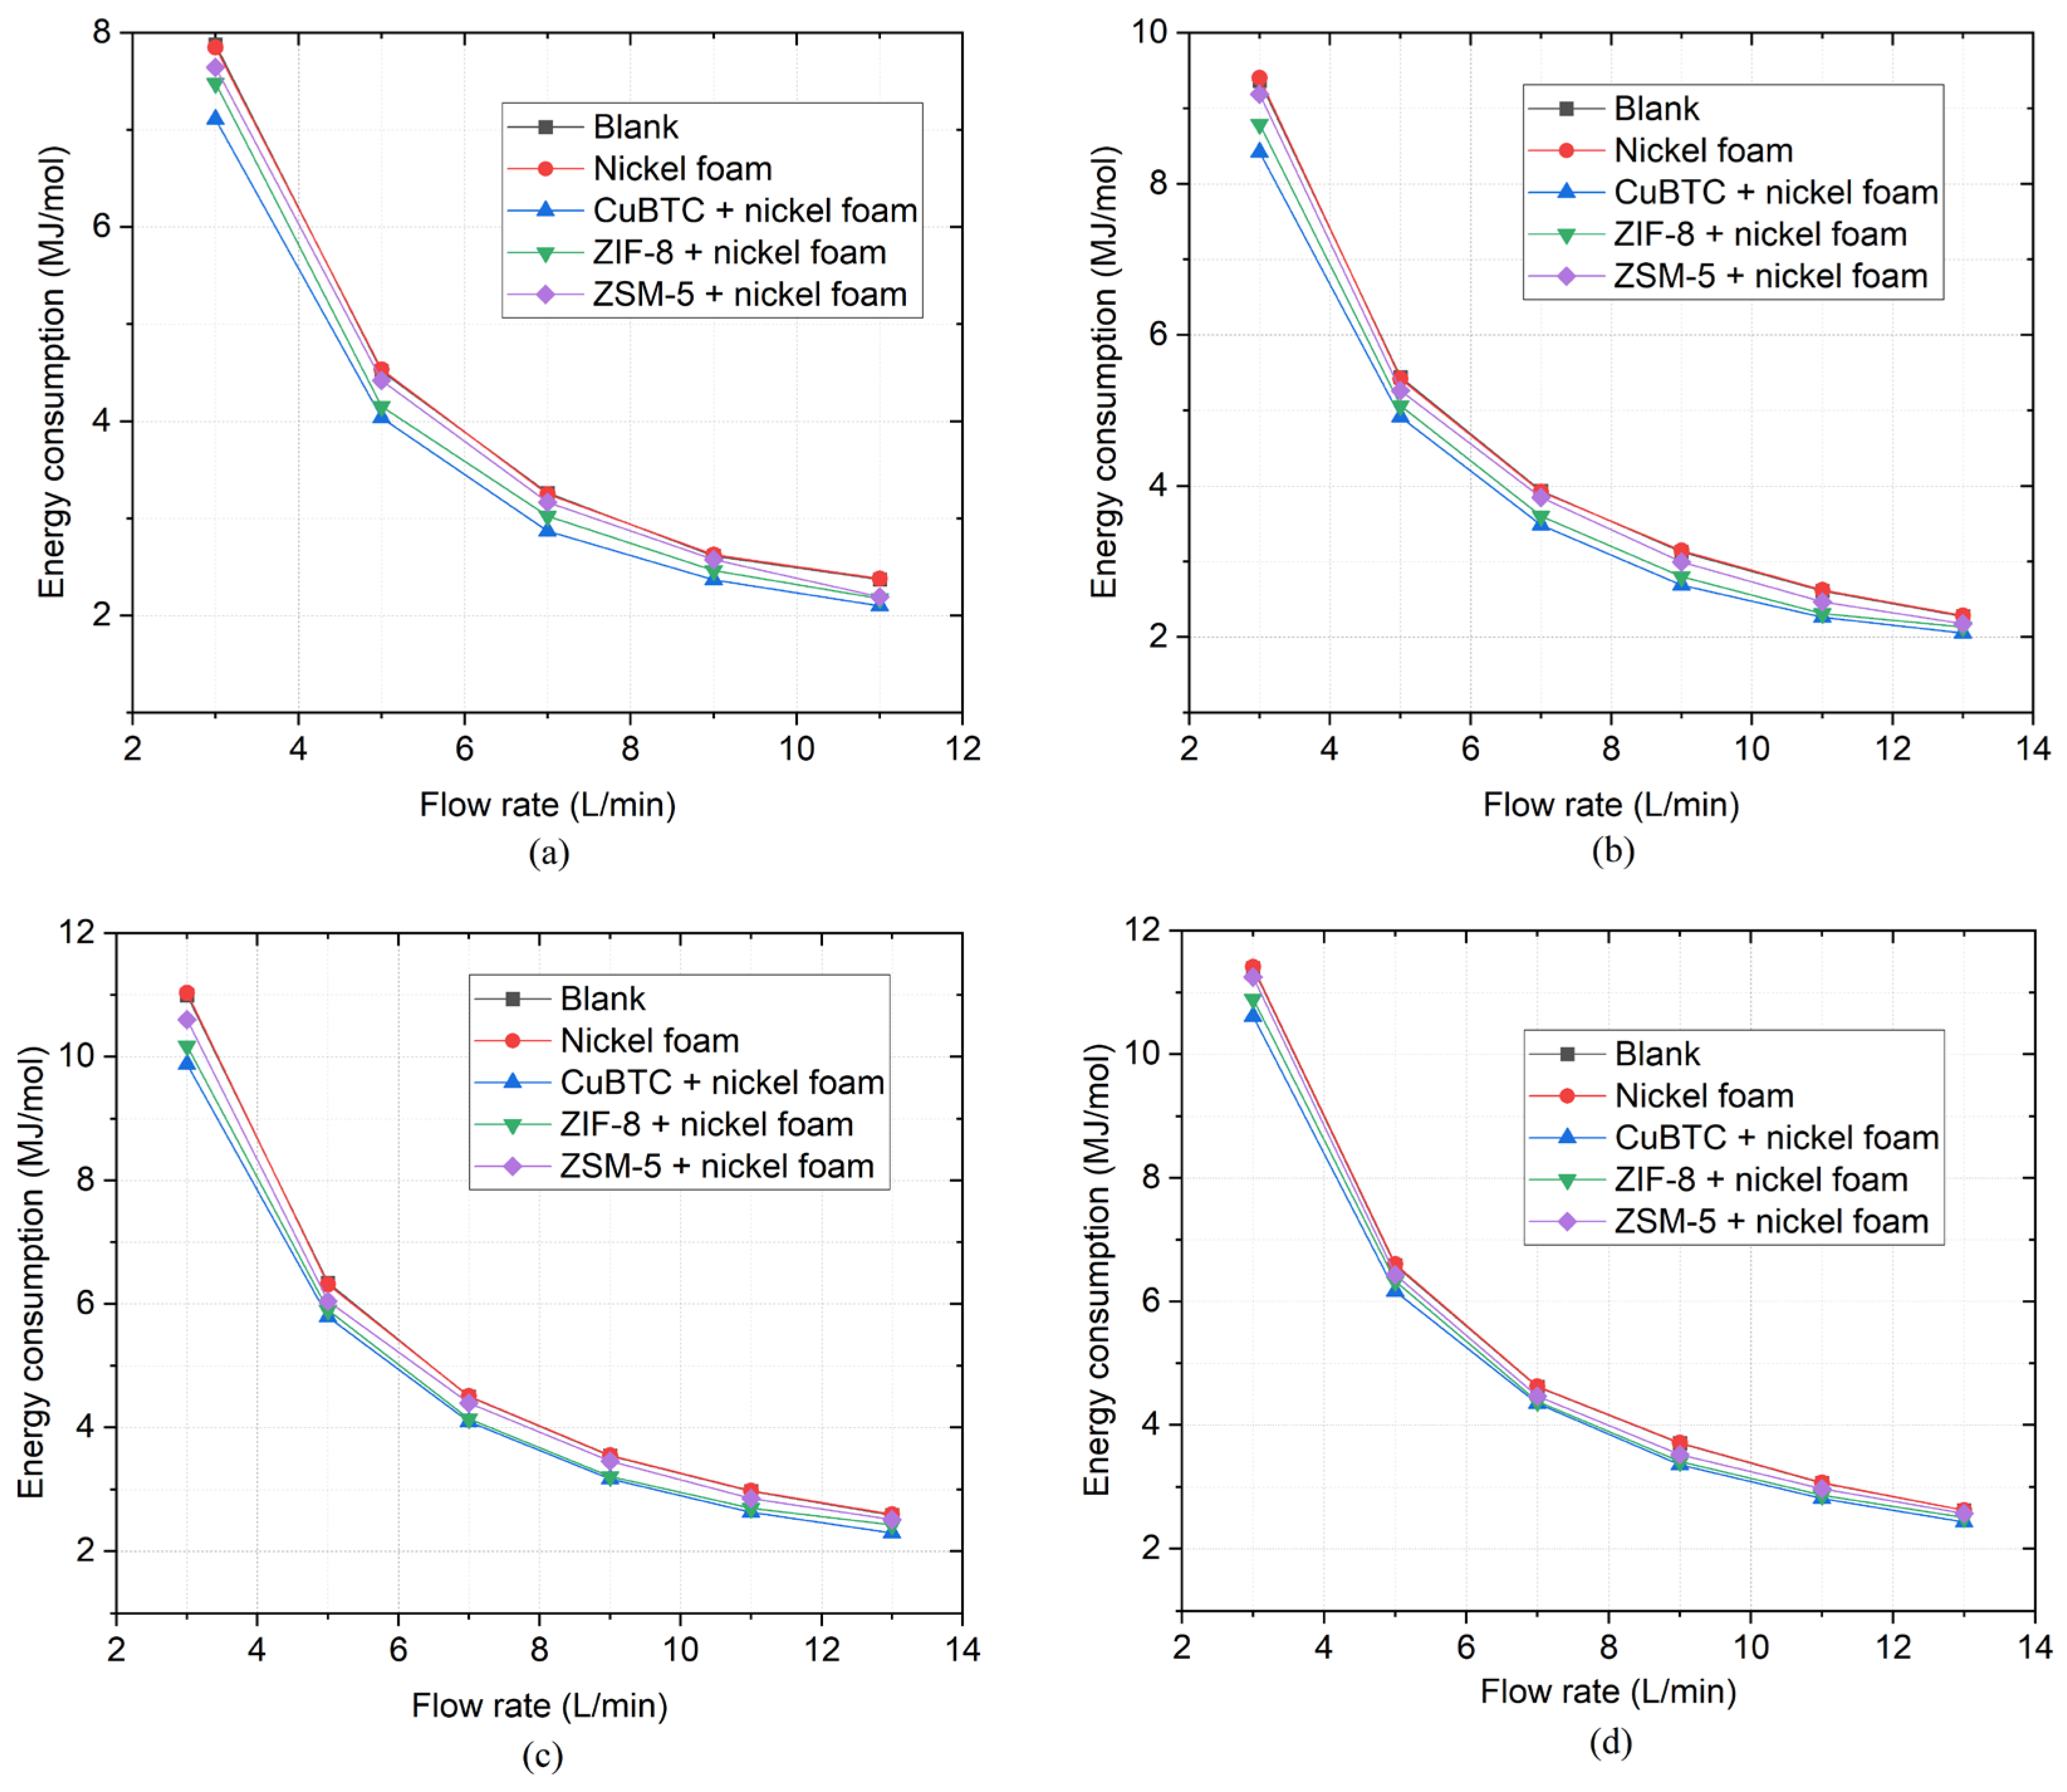
Figure 10.
(a) Photograph of the catalysts after usage; (b) TEM image of the catalysts prior to usage; (c) TEM image of the catalysts after usage.
Figure 10.
(a) Photograph of the catalysts after usage; (b) TEM image of the catalysts prior to usage; (c) TEM image of the catalysts after usage.
Disclaimer/Publisher’s Note: The statements, opinions and data contained in all publications are solely those of the individual author(s) and contributor(s) and not of MDPI and/or the editor(s). MDPI and/or the editor(s) disclaim responsibility for any injury to people or property resulting from any ideas, methods, instructions or products referred to in the content. |
© 2024 by the authors. Licensee MDPI, Basel, Switzerland. This article is an open access article distributed under the terms and conditions of the Creative Commons Attribution (CC BY) license (http://creativecommons.org/licenses/by/4.0/).
Copyright: This open access article is published under a Creative Commons CC BY 4.0 license, which permit the free download, distribution, and reuse, provided that the author and preprint are cited in any reuse.


