Submitted:
18 June 2024
Posted:
18 June 2024
You are already at the latest version
Abstract
Foxtail millet (Setaria italica) is an important cereal crop with rich nutritional value. Distinctness, Uniformity, and Stability (DUS) are the prerequisites for the application of new variety rights for foxtail millet. In this study, we investigated 32 DUS test characteristics of 183 foxtail millet resources, studied their artificial selection trends, and identified varieties that conform to breeding trends. The results indicated significant differences in terms of means, ranges, and coefficients of variation for each characteristic. Correlation analysis was performed to determine the correlations between various DUS characteristics. Principal component analysis was conducted on 31 test characteristics to determine their primary characteristics. By plotting PC1 and PC2, all germplasm resources could be clearly distinguished. Trends in foxtail millet breeding were identified through differential analysis of DUS test characteristics between landrace varieties and cultivated varieties. Based on these breeding trends, optimal solution types for multiple evaluation indicators were determined; weight allocation was calculated, and a specific TOPSIS algorithm was designed to establish a comprehensive multi-criteria decision-making model. Using this model, the breeding potential of foxtail millet germplasm resources was ranked. These findings provided important reference for foxtail millet breeding in future.
Keywords:
Foxtail millet
; DUS
; Breeding trends
; TOPSIS
1. Introduction
Foxtail millet (Setaria italica) is a cereal crop in the Poaceae family, widely distributed in temperate regions where it is used for food or feed purposes [1]. Foxtail millet has been reported to be originated in China [2]. Because of its excellent characteristics such as short growth cycle, strong adaptability, high yield, and drought resistance, foxtail millet has become a highly favored important cereal crop [3,4,5]. Additionally, compared to other small grain crops, foxtail millet has high nutritional value. It contains unique nutrient components and is gradually becoming a model crop for plant genomic research [6,7,8]. Significant differences are observed in the characteristics of various foxtail millet varieties because of factors such as planting environment and genetic diversity, posing great challenges to foxtail millet breeding. Therefore, it is urgent to accurately understand and explore the breeding trends of foxtail millet.
Breeding foxtail millet is closely related to market demand and economic development. Over time, breeding objectives change with variations in the market, and millet varieties cultivated and promoted at different stages exhibit different characteristics. Analyzing and summarizing the trends and characteristics of millet varieties can provide important guidance for future breeding efforts. Numerous reports are available on the evolution of agronomic characteristics in various millet-planting regions. For example, in some studies on millet cultivation in certain regions, researchers have identified a series of millet varieties and observed an increasing trend in yield over time. Key factors such as reduced plant height, early maturity, and improved lodging resistance have played significant roles [9,10,11]. Similar trends were observed for millet varieties in other regions, indicating that millet breeding is a continuous process of optimization and improvement [12,13,14]. These studies provided valuable references for millet breeding and offered scientific basis for millet cultivation and production.
The TOPSIS (Technique for Order Preference by Similarity to Ideal Solution) algorithm serves as a crucial multi-attribute decision-making tool in assessing the merits of a series of alternative solutions [15]. This algorithm primarily determines the optimal solution based on the relative proximity of the alternative solutions to the ideal and negative ideal solutions. Using the TOPSIS algorithm, various alternative solutions can be quickly and accurately evaluated. Therefore, it is widely applied across various decision-making domains [16,17]. Ali Bagherzadeh et al. used the TOPSIS method to examine the qualitative suitability of different irrigation strategies for wheat crops within the framework of the Food and Agriculture Organization [18]. Similarly, Nayak et al. used the TOPSIS method to identify the most suitable application of rice husk for potential use in energy generation [19]. Furthermore, Enqin Zheng et al. used the TOPSIS algorithm to assess the impact of humic acid on rice yield under various irrigation methods [20]. It is evident that TOPSIS method holds significant value in evaluating cultivation methods and selecting agricultural intervention measures.
DUS (Distinctness, Uniformity, and Stability) is a process of plant variety identification tests or indoor analytical tests and determines whether a tested variety belongs to a new variety based on the test results of distinctiveness, uniformity, and stability. It provides reliable criteria for the protection of new plant varieties and plays a significant role in plant breeding and new variety protection. Numerous studies have applied DUS testing methods in breeding to ensure the identifiability, distinguishability, and specificity of new varieties through comprehensive comparisons and identifications of the morphological and biological characteristics and molecular markers of new varieties, effectively protecting the intellectual property rights of new varieties. For example, Tao Chen et al. improved the statistical phenotypic characteristics for DUS testing through DUS identification of 143 germplasms and selected excellent germplasm resources for oil tea breeding using the TOPSIS algorithm [21]. Liyuan Wang et al. determined wheat breeding trends by studying the differences in DUS testing characteristics of wheat in various regions. The application of DUS testing has played a positive role in promoting the sustainable development of breeding strategies [22].
In this study, we characterized and comprehensively evaluated 32 phenotypic characteristics of 183 foxtail millet germplasm resources, aiming to assess the diversity and variation of DUS testing phenotypic characteristics of foxtail millet. Subsequently, by comparing the performance of landrace varieties and cultivated varieties in DUS testing, the trends in foxtail millet breeding were analyzed. Finally, the foxtail millet varieties were ranked according to these trends using the TOPSIS method, and varieties that met the breeding trends were selected. The study provided targeted recommendations for foxtail millet cultivation and breeding and valuable insights to promote research and practical application in the field of foxtail millet breeding.
2. Materials and Methods
2.1. Plant Materials and Field Experiments
A total of 183 foxtail millet germplasm resources were collected for this study, comprising 52 landrace varieties and 131 cultivated varieties. Planting experiments were conducted in Xinzhou City, Shanxi Province, China (120° 52’ E, 30° 40’ N, altitude 791 m) in 2022 and 2023. The experiments were designed using a randomized complete block design with three replicates. Each variety was sown in late May, with a minimum of 300 plants per plot planted in 6 rows. Each plot measured 5 m in length and 2.4 m in width. Row spacing was set at 40 cm, and plant spacing ranged from 7 to 10 cm. The soil at the experimental site was sandy loam. All experiments were performed according to standard agricultural practices. Organic fertilizer and compound fertilizer were applied at 52,500 and 600 kg·hm−1, respectively. After planting, the plots were irrigated 1–2 times.
2.2. Determination of Phenotypic Characteristics and Data Collection
In total, 32 characteristics were investigated as outlined in the foxtail millet DUS testing guidelines (Table 1), comprising 1 qualitative (QL), 14 pseudo-quantitative (PQ), and 17 quantitative (QN) characteristics. The characteristics observation methods included individual visual scoring (VS), population visual scoring (VG), individual measurements (MS), and population measurements (MG). In accordance with the guidelines, corresponding codes were recorded for visually scored characteristics. For each measured characteristic (e.g., leaf length, leaf width, stem length, stem thickness, number of tillers per plant, panicle neck length, panicle length, panicle thickness, number of grains per panicle, individual panicle weight, grain yield, and thousand-grain weight), at least 20 typical plants were selected from each plot for individual measurement and recording.
2.3. Statistical Analysis
All experiments were performed in triplicates. Based on 2-year investigation and measurements, the mean of each characteristic was used for statistical analysis. The qualitative and pseudo-qualitative characteristics were classified into 10 grades: 1 grade < X − 2S; 10 grades > X + 2S, with each grade interval being 0.5s between 1 and 10 grades; X and s are the mean and standard deviation, respectively. The morphological diversity was evaluated using the frequency of characteristic dispersion and Shannon’s diversity index (Hʹ). The minimum value (Min), maximum value (Max), mean, median, standard deviation (SD), coefficient of variation (CV; %), and Hʹ of all characteristics were measured. The CV for all quantitative characteristics was calculated as CV¼ S = X, where S is the standard deviation and X is the mean. The Hʹ for each characteristic was calculated using the following formula: Hʹ = −Pi ln (Pi) (Pi is the proportion of the individual number of this characteristic in total individual number). The IBM SPSS Statistics version 20.0 (SPSS Inc., Chicago, IL, USA) was used to estimate the correlation among all quantitative characteristics with the Pearson’s correlation coefficient. Principal component analysis (PCA) was applied to determine the relationship among the individuals. Based on the breeding history of foxtail millet, foxtail millet varieties were categorized into farmer varieties and breeding lines. The artificial selection trends were determined for characteristics assessed in the DUS tests of foxtail millet through differential analysis between farmer varieties and breeding lines. The results of correlation analysis, principal component analysis, and differential analysis were visualized using the R package “ggplot2.” Positive and negative ideotypes were identified based on the breeding trends identified above; weights were allocated using the subjective weighting method, and a specific TOPSIS algorithm was designed with the R package “TOPSIS” to establish a comprehensive multi-criteria decision-making model for assessing the breeding potential of foxtail millet varieties.
3. Results
3.1. Observation and Analysis of DUS Testing Characteristics
The 32 phenotypic characteristics of 183 foxtail millet varieties were observed and analyzed. The results revealed that various phenotypic characteristics exhibited varying frequency distributions (Figure 1). In the foxtail millet germplasm resources, only one type of endosperm (glutinous) was observed. Therefore, this characteristic was not further analyzed. Characteristics 1, 2, 4, and 16 exhibited two expression types. Characteristics 3, 5, and 27 had narrow and single-level distributions. Characteristics 14, 25, and 26 exhibited the widest distribution range, with 9 expression levels. Table 2 presents the mean, standard deviation, CV, and Hʹ for the 32 phenotypic characteristics. CV reflects the dispersion and variability of data, with a larger coefficient indicating greater variability. Among these characteristics, characteristics 5, 13, and 29 exhibited relatively high variability, with CVs of 50.31%, 50.52%, and 50.13% respectively. Characteristics 1, 2, and 16 exhibited relatively low variability, with CVs of 9.89%, 9.15%, and 3.72% respectively. Characteristics related to yield exhibited extensive variation, with significant differences in grading for characteristics such as panicle length, panicle thickness, number of grains per panicle, and individual panicle weight. The Shannon’s diversity index reflects the diversity and evenness of individual distribution. A higher diversity index indicates a more even distribution of individual characteristics in the varieties. Characteristics 14, 15, 20, 22, 23, 25, and 26 had diversity indexes > 1.5. Among them, characteristic 25 and 2 had the highest and lowest diversity indexes of 2.032 and 0.183, respectively.
3.2. Correlation of Phenotypic Characteristics
Correlation analysis was conducted on 31 agronomic characteristics (Figure 2). The results revealed various patterns of correlation among the characteristics. Individual panicle weight was significantly correlated with yield-related characteristics such as panicle length, panicle thickness, panicle density, and grains per panicle. On an average, each characteristic was correlated with 10.4 other characteristics. Characteristic 16 was not correlated with any other characteristics, whereas character 17 was correlated with the maximum (19) characteristics. Among all significant correlations, the largest significantly positive correlation (r = 0.75) was observed between characteristics 3 and 5, whereas the largest significantly negative correlation (r = −0.5) was observed between characteristics 4 and 6. Apart from these two correlations, the absolute values of correlation coefficients between other combinations were ≤0.5, indicating weak correlations.
3.3. Cluster Analysis
Based on the data of 32 phenotypic characteristics, the 183 foxtail millet varieties were classified into 7 clusters (Figure 3). Cluster 1 consisted of four varieties: Jinfen 111, Datong 29, Qisifeng, and Laohuwei, all exhibiting the highest code values in characteristics 1, 2, 3, 5, 20, 22, 27, 28, and 30. Cluster 2 included only one variety, Huangjinggu, exhibiting the highest code values in characteristics 1, 4, 7, 8, 10, 14, 18, 19, 21, 25, and 27. Clusters 3, 4, and 5 comprised 2, 4, and 4 varieties, respectively, each with the highest codes in characteristics 1 and 27. Cluster 6 consisted of 20 varieties with the highest code values in characteristics 1, 6, 9, 11, 12, 13, 17, 24, 29, and 31. Cluster 7 comprised 148 varieties, accounting for 80.9% of the total varieties, exhibiting the highest code values in characteristics 15, 16, 23, and 26.
3.4. Principal Component Analysis (PCA)
PCA was conducted on 183 foxtail millet germplasm resources to identify their major characteristics (Table 3). Overall, 11 significant components were selected, which accounted for 80.79% of the total variance based on eigenvalues > 1. Among them, the 1st, 5th, and 9th principal components were primarily composed of characteristics related to the seedling stage of foxtail millet (characteristics 1, 2, 3, 4, and 5), referred to as the seedling factor. The 2nd and 4th principal components mainly comprised characteristics related to the panicle of foxtail millet (characteristics 22, 23, 24, 25, and 26), termed as the panicle factor. Characteristics 19 and 28 had a significant loading on the 3rd principal component. The 6th, 7th, and 10th principal components were primarily loaded by individual characteristics (characteristics 16, 17, and 31) as the main negative loading factors. The 8th principal component mainly consisted of characteristics related to the color of foxtail millet panicles (characteristics 9 and 13), known as the panicle color factor. The 11th principal component was primarily composed of characteristics 16 and 19 but with lower loading. Projection of all varieties onto PC1 and PC2 for plotting (Figure 4) demonstrated clear separation between landrace varieties and cultivated varieties, indicating significant differences between landrace varieties and cultivated varieties.
3.5. Analysis of Breeding Trends
Based on the results, the foxtail millet germplasm resources in this study were divided into two categories: landrace varieties and cultivated varieties (52 and 131 varieties, respectively). Differential analysis of 32 DUS-tested characteristics of foxtail millet (Figure 5) was conducted to predict current breeding trends in foxtail millet. The differential analysis between landrace varieties and cultivated varieties revealed that 12 characteristics were not significantly different between the two, indicating that these characteristics are not major factors in the breeding process of foxtail millet. However, significant differences were observed in 20 characteristics between landrace varieties and cultivated varieties. Specifically, cultivated varieties exhibited significant superiority over landraces in characteristics 1 (P < 0.01), 6 (P < 0.0001), 12 (P < 0.01), 15 (P < 0.01), 17 (P < 0.0001), 26 (P < 0.05), 28 (P < 0.0001), and 29 (P < 0.01). On the other hand, landraces exhibited significant superiority over cultivated varieties in characteristics 3 (P < 0.0001), 4 (P < 0.0001), 5 (P < 0.0001), 7 (P < 0.001), 8 (P < 0.001), 9 (P < 0.001), 10 (P < 0.0001), 11 (P < 0.05), 20 (P < 0.05), 22 (P < 0.05), 25 (P < 0.01), and 30 (P < 0.001).
3.6. Comprehensive Evaluation Using TOPSIS Algorithm
Based on the identified breeding trends in foxtail millet, the maximum values of significantly increased characteristics and minimum values of significantly decreased characteristics were defined as the positive and negative ideal solutions, respectively. Each characteristic was given equal weight, and a comprehensive multi-criteria decision-making model was established using the TOPSIS algorithm to assess the breeding potential of seed resources, ranking landrace varieties and cultivated varieties (Table 4). After computation and analysis, the top 10 varieties were selected in terms of breeding potential. They were Changnong 41, Jinfen 117, Jinxuan 1012, Jinfen 119, Changgu K6, Dayoug 2, Jinfen 110, Jinfen 111, Jingug 21, and Huangjinggu 7.
4. Discussion
4.1. Phenotypic Variation of Foxtail Millet Resources
CV is an important indicator for assessing the degree of differences in phenotypic characteristics. It is significantly positively correlated with the degree of phenotypic differences and genetic diversity. This provides greater possibilities for utilizing phenotypic characteristics to identify the varieties and germplasms [23]. The analysis of 32 DUS-tested characteristics of 183 foxtail millet germplasm resources revealed that various characteristics in foxtail millet germplasm resources have high CV, indicating the presence of rich genetic diversity among foxtail millet germplasm resources. In terms of quantitative characteristics, the median and mean values of the 183 germplasm resources were essentially consistent, reflecting the representativeness of the study subjects. The H′ values of leaf, stem, and panicle characteristics were relatively high (1.078–2.032), indicating substantial genetic variation in these characteristics. In particular, leaf characteristics reflect the adaptability of plants to various environments and their self-regulation capacity in complex physiological environments; they are considered important indicators for plant science research [24]. In contrast, the H′ values of grain and seedling characteristics in foxtail millet were lower (0.147–1.045), suggesting that foxtail millet is less affected during the seedling stage and exhibits less characteristic segregation. However, grain characteristics directly impact the yield and quality of foxtail millet and are important characteristics that breeders hope to modify. Nevertheless, due to the low diversity of foxtail millet grains, more constraints are presented for foxtail millet breeding, emphasizing the importance of correctly identifying breeding trends in foxtail millet breeding.
4.2. Correlation Analysis and PCA
A significantly positive correlation was observed between the single panicle weight of foxtail millet and multiple characteristics, including stem thickness, stem length, length of the second leaf, width of the second leaf, internode number, panicle posture, panicle length, panicle thickness, panicle density, and grain number per panicle. This is consistent with a previous study, indicating that the improvement of foxtail millet yield is related to multiple characteristics [25]. This result is consistent with the source–sink theory [26], where the stem length and thickness of foxtail millet affect the permeability of nutrients and water in the root system, whereas the increase in the length and width of the second leaf enhances the leaf area and thereby strengthens plant photosynthesis. Additionally, the increase in panicle length, thickness, density, and grain number per panicle increases the grain yield of foxtail millet. Therefore, the enhancement of foxtail millet yield is influenced by multiple factors. By changing characteristics related to yield toward the correct breeding trend, the yield of foxtail millet can be improved.
Furthermore, PCA is an effective method for reducing the dimensions of large datasets, enhancing interpretability, reducing information loss, and determining the characteristics that are most suitable and primarily responsible for the variation in the selected materials [27,28]. In this study, PCA confirmed that the first 11 components explained the majority of the variation, focusing on the characteristics such as leaf sheath color in seedlings, leaf posture, leaf hilum anthocyanin coloration, stem length, panicle length, panicle thickness, grain number per panicle, and single panicle weight. These results suggested that these characteristics are suitable for evaluating the genetic diversity of foxtail millet germplasm resources and can be used for phenotypic identification of foxtail millet germplasm resources. Through the analysis, cultivated varieties and landrace varieties could be clearly divided into two categories, with a certain degree of overlap, further confirming the transition from landrace varieties to modern cultivated varieties in the breeding history of foxtail millet. Since the history of foxtail millet breeding is not extensive, a wide range of phenotypic divergence could not be observed between landrace varieties and cultivated varieties in the breeding process, explaining the presence of overlap in the PCA.
4.3. Analysis of Breeding Trends and Screening of Potential Varietal Resources
In the breeding process of foxtail millet, individuals first collect foxtail millet germplasm resources from various regions and areas, including landrace varieties and local cultivated varieties [29]. These germplasm resources possess rich genetic variation and adaptability, playing a vital foundational role in foxtail millet breeding [30]. Subsequently, through the evaluation and selection of these landrace varieties, superior individuals or populations with good agronomic and economic characteristics are chosen. Further, by employing methods such as controlled hybridization, selection, and progeny screening, the yield, quality, and stress resistance of foxtail millet are gradually enhanced.
Our study determined the breeding trend of foxtail millet by comparing the differences in DUS test characteristics between landrace varieties and cultivated varieties. The results indicated significant differences between landrace varieties and cultivated varieties in terms of 20 characteristics, with 8 characteristics significantly increasing and 12 characteristics significantly decreasing during the breeding process. Previous studies reported that early cultivated foxtail millet varieties had long awns; however, most modern varieties have short awns[31]. This change is attributed to the vulnerability of early foxtail millet cultivation to damage by birds; long-awned millet varieties are effectively protected against feeding by birds [32]. With advances in modern technology for protection from birds and the decrease in bird populations due to environmental pollution, the length of awns of foxtail millet gradually shortened, consistent with the findings of this study. Grains of cereal plants generally have long and narrow leaves. In this study, the length of the second leaf of foxtail millet gradually decreased, whereas the width of the second leaf increased. Additionally, the plant-to-leaf posture gradually exhibited an upward trend. This can be attributed to changes in the length-to-width ratio of the leaves, allowing them to meet the requirements of modern high-density cultivation, consistent with a previous study [33]. Additionally, the increase in stem thickness enhances the plant’s lodging resistance. Breeders optimize yield by increasing the grain weight of foxtail millet rather than the number of grains per panicle. Reducing panicle length can make the wheat spikes more compact, reducing the impact of natural factors such as wind or birds on foxtail millet yield and increasing its recoverable rate. The code for foxtail millet grain shape gradually increases, indicating a transition from ovate to spherical grain shapes. This results in an increase in individual grain volume, further explaining the increase in thousand-grain weight of foxtail millet.
By constructing a TOPSIS model, this study ranked the breeding potential of foxtail millet germplasm resources, with those ranked higher exhibiting greater breeding potential consistent with the aforementioned breeding trends. Moreover, this model can be used to screen foxtail millet germplasm for subsequent DUS testing, by selecting varieties with higher scores. The establishment of this model provided significant guidance for foxtail millet breeding, aiding in the selection of promising foxtail millet germplasm resources for further breeding work and accelerating the foxtail millet breeding process.
5. Conclusion
In this study, we evaluated the diversity of foxtail millet germplasm resources by observing 32 phenotypic characteristics in 183 accessions. The results demonstrated rich variability in foxtail millet germplasm resources across various characteristics. Key characteristics relevant to foxtail millet breeding and germplasm identification were identified through correlation analysis and PCA. Additionally, trends in DUS test characteristics were analyzed when comparing landrace varieties with cultivated varieties, and ranking of these germplasms as per the breeding potential was conducted using the TOPSIS method. These findings will guide the expansion of the foxtail millet characteristic description system and optimization of DUS testing guidelines. Moreover, this study provided references for further utilization of foxtail millet germplasm resources and improvement of major characteristics, laying a theoretical foundation for the breeding of new foxtail millet varieties in future.
Data Availability Statement
The original contributions presented in the study are included in the article/Supplementary Material, further inquiries can be directed to the corresponding author/s.
Declaration of Competing Interest
The authors declare that they have no conflicts of interest.
References
- Austin, D.F. Foxtail millets (Setaria: Poaceae)—abandoned food in two hemispheres. Econ. Bot 2006, 60, 143–158. [Google Scholar] [CrossRef]
- Nikolai, I.V. On the Origin of Cultivated Plants. 2014, 0, 0–0.
- Duc, Q.N.; Joyce, V.E.; Andrew, L.E.; Christopher, P.L.G. Robust and Reproducible Agrobacterium-Mediated Transformation System of the C4 Genetic Model Species Setaria viridis. Front. Plant Sci 2020, 11, 0–0. [Google Scholar]
- Sangam, L.; Hari, D.; Upadhyaya, S.; Senthilvel, C.T.; Kenji, F.; Xianmin, D. , Dipak, K., Santra, D., Baltensperge, M.P. Millets: Genetic and Genomic Resources. Plant Breed. Rev 2011, 0, 247–375. [Google Scholar]
- Carla, P.C.; Pu, H.; Thomas, P.B. Setaria viridis as a Model for C4 Photosynthesis. Plant Genet. Genomics Crops Models 2011, 0, 291–300. [Google Scholar]
- Andrew, N.D.; Elizabeth, A.K.; Katrien, M.D.; Jeffrey, L.B. Foxtail Millet: A Sequence-Driven Grass Model System. Plant Physiol 2009, 149, 137–141. [Google Scholar]
- Wang, C.; Chen, J.; Zhi, H.; Yang, L.; Li, W.; Wang, Y.; Li, H.; Zhao, B.; Chen, M.; Diao, X.M. Population genetics of foxtail millet and its wild ancestor. BMC Genom. Data 2010, 11, 0–0. [Google Scholar]
- Zhu, M.Y.; He, Q.; Lv, M.J.; Shi, T.; Gao, Q.; Zhi, H.; Wang, H.; Jia, G.Q.; Tang, S.; Cheng, X.L.; Wang, R.; Xu, A.D.; Wang, H.G.; Zhang, Q.; Li, J.; Diao, X.M.; Gao, Y. Integrated genomic and transcriptomic analysis reveals genes associated with plant height of foxtail millet. Crop J 2023, 11, 593–604. [Google Scholar] [CrossRef]
- Kuraloviya, M.; Vanniarajan, C.; Sudhagar, R.; Vetriventhan, M. Phenotypic diversity and stability of early maturing Barnyard Millet (Echinochloa sp.) germplasm for grain yield and its contributing traits. Indian J. Exp. Biol 2022, 60, 0–0. [Google Scholar]
- Tian, B.L.; Liu, L.Y.; Zhang, L.X.; Song, S.B.; Wang, J.G.; Wu, L.Y.; Li, H.J. Characterization of culm morphology, anatomy and chemical composition of foxtail millet cultivars differing in lodging resistance. J. Agric. Sci 2015, 153, 1437–1448. [Google Scholar] [CrossRef]
- Gao, Y.B.; Yuan, Y.H.; Zhang, X.Y.; Song, H.; Yang, Q.Y.; Yang, P.; Gao, X.L.; Gao, J.F.; Feng, B.L. Conuping BSA-Seq and RNA-Seq Reveal the Molecular Pathway and Genes Associated with the Plant Height of Foxtail Millet (Setaria italica). Int. J. Mol. Sci 2022, 23, 11824–11824. [Google Scholar] [CrossRef]
- Simon, K.A.; Kudakwashe, H.; Johanna, S.V.; Helena, N.N.; Evans, K.S.; Barthlomew, Y.C.; Lydia, N.H.; Simon, A.; Akundabweni, L.S.M.; Osmund, M. Co-Cultivation and Matching of Early- and Late-Maturing Pearl Millet Varieties to Sowing Windows Can Enhance Climate-Change Adaptation in Semi-Arid Sub-Saharan Agroecosystems. Climate 2022, 11, 227–227. [Google Scholar]
- Sreeja, R.; Balaji, S.; Arul, L.; Kumari, A.; Kannan, B.; Subramanian, A. Association of lignin and FLEXIBLE CULM 1 (FC1) ortholog in imparting culm strength and lodging resistance in kodo millet (Paspalum scrobiculatum L.). Mol. Breed 2016, 36, 0–0. [Google Scholar] [CrossRef]
- Jin, C.; Mi, J.X.; Li, F.C.; Liang, M.S. An improved TOPSIS method for multi-criteria decision making based on hesitant fuzzy β neighborhood. AI Rev 56, 793–831. [CrossRef]
- Abootalebi, S.; Hadi-Vencheh, A.; Jamshidi, S. Ranking the Alternatives With a Modified TOPSIS Method in Multiple Attribute Decision Making Problems. IEEE Trans. Eng. Manage. 2022, 69, 1800–1805. [Google Scholar] [CrossRef]
- Loubna, L.; Mohammed, C.A.; Mohammed, T.A. New distributed-topsis approach for multi-criteria decision-making problems in a big data context. J. Big Data 2023, 10, 0–0. [Google Scholar]
- Ali, B.; Amin, G. Modeling land suitability evaluation for wheat production by parametric and TOPSIS approaches using GIS, northeast of Iran. Model. Earth Syst. Environ 2016, 2, 0–0. [Google Scholar]
- Puja, P.N.; Anindita, D. An entropy-based TOPSIS approach for selecting best suitable rice husk for potential energy applications: pyrolysis kinetics and characterization of rice husk and rice husk ash. Biomass Convers. Biorefin 2022, 0, 0–0. [Google Scholar]
- Zheng, E.; Zhu, Y.; Hu, J.; Zhang, Z.; Xu, T.-J. Effects of humic acid on japonica rice production under different irrigation practices and a TOPSIS-based assessment on the Songnen Plain, China. Irrig. Sci 2021, 40, 87–101. [Google Scholar] [CrossRef]
- Chen, T.; Liu, L.; Zhou, Y.X.; Zheng, Q.; Luo, S.Y.; Xiang, T.; Zhou, L.J.; Feng, S.L.; Yang, H.C.; Ding, C.B. Characterization and comprehensive evaluation of phenotypic characters in wild Camellia oleifera germplasm for conservation and breeding. Front. Plant Sci 2023, 14, 0–0. [Google Scholar] [CrossRef]
- Wang, L.Y.; Zheng, Y.; Duan, L.L.; Wang, M.M.; Wang, H.; Li, H.; Li, R.Y.; Zhang, H. Artificial Selection Trend of Wheat Varieties Released in Huang-Huai-Hai Region in China Evaluated Using DUS Testing Characteristics. Front. Plant Sci 2020, 13, 0–0. [Google Scholar] [CrossRef]
- Zheng, Z.; Yao, Z.Y.; Ma, Q.; Liu, J.M.; Liu, Y.X.; Liang, W.; Zhang, T.; Yin, D.X.; Liu, W.; Qiao, Q. A study on the phenotypic diversity of Sinopodophyllum hexandrum (Royle) Ying. Pak. J. Bot 2022, 54, 0–0. [Google Scholar] [CrossRef] [PubMed]
- Yang, H.M.; Yang, L.; Gao, G.; Liao, D.S.; Li, L.; Qiu, J.; Wei, H.L.; Deng, Q.E.; Zhou, Y.C. A comparative study on the leaf anatomical structure of Camellia oleifera in a low-hot valley area in Guizhou Province, China. PLoS ONE 2022, 17, e0262509–e0262509. [Google Scholar]
- Dai, K.L.; Wang, X.; Liu, H.X.; Qiao, P.F.; Wang, J.X.; Shi, W.P.; Guo, J.; Diao, X.M. Efficient identification of QTL for agronomic traits in foxtail millet (Setaria italica) using RTM- and MLM-GWAS. Theor. Appl. Genet 2024, 137, 0–0. [Google Scholar]
- Zhang, H.P.; Sam, F. Source-sink manipulations indicate seed yield in canola is limited by source availability. Eur. J. Agron 2018, 96, 70–76. [Google Scholar] [CrossRef]
- Nardo, M.; Saisana, M.; Saltelli, A.; Tarantola, S. Tools for composite indicators building. Eur. Comission Ispra. 2005, 15, 19–20. [Google Scholar]
- Jolliffe, I.T.; Cadima, J. Principal component analysis: a review and recent developments. Phil. Trans. R. Soc A 2016, 374, 20150202. [Google Scholar] [CrossRef] [PubMed]
- Diao, X.M. ; Production and genetic improvement of minor cereals in China. Crop J 2017, 5, 103–114. [Google Scholar] [CrossRef]
- Chen, J.F.; Liu, Y.; Liu, M.X.; Guo, W.Y.; Wang, Y.Q.; He, Q.; Chen, W.Y.; Liao, Y.; Zhang, W.; Gao, Y.Z.; Dong, K.J.; Ren, R.Y.; Tian, y.; Zhang, L.Y.; Qi, M.Y.; Li, C.K.; Zhao, M.; Wang, H.G.; Wang, J.J.; Zhang, Q.; Li, H.Q.; Jiang, Y.M.; Liu, G.Q.; Song, X.Q.; Deng, Y.W.; Lv, H.; Yan, F.; Dong, Y.; Li, Q.Q.; Li, T.; Yang, W.; Cui, J.H.; Wang, H.R.; Zhou, Y.F.; Zhang, X.M.; Jia, G.Q.; Lü, P.; Zhi, H.; Tang, S.; Diao, X.M. Pangenome analysis reveals genomic variations associated with domestication traits in broomcorn millet. Nat. Genet 2023, 55, 2243–2254. [Google Scholar] [CrossRef]
- Kei, S.; Yohei, M.; Kunihiko, Naito.; Kenji, F. Construction of a foxtail millet linkage map and mapping of spikelet-tipped bristles 1(stb1) by using transposon display markers and simple sequence repeat markers with genome sequence information. Mol. Breeding 2013, 31, 675–684. [CrossRef]
- Zhang, A.Y.; Zhang, L.; Cui, L.; Guo, E.H.; Zhao, P.Y.; Xu, Z.S.; Li, Q.; Guo, S.S.; Wu, Y.J.; Li, Z. Identification of a QTL for Setaria italica bristle length using QTL-seq. Genet. Resour. Crop Evol 2023, 0, 0–0. [Google Scholar] [CrossRef]
- Zhao, M.C.; Tang, S.; Zhang, H.S.; He, M.; Liu, J.H.; Zhi, H.; Sui, Y.; Liu, X.T.; Jia, G.Q.; Zhao, Z.Y.; Yan, J.J.; Zhang, B.C.; Zhou, Y.H.; Chu, J.F.; Wang, X.C.; Zhao, B.; Tang, W.Q.; Li, J.Y.; Wu, C.Y.; Liu, X.G.; Diao, X.M. ; DROOPY LEAF1 controls leaf architecture by orchestrating early brassinosteroid signaling. Proc. Natl. Acad. Sci. U.S.A 2022, 117, 21766–21774. [Google Scholar] [CrossRef] [PubMed]
Figure 1.
Distribution of variation types of all DUS test characteristics in 183 millet varieties.
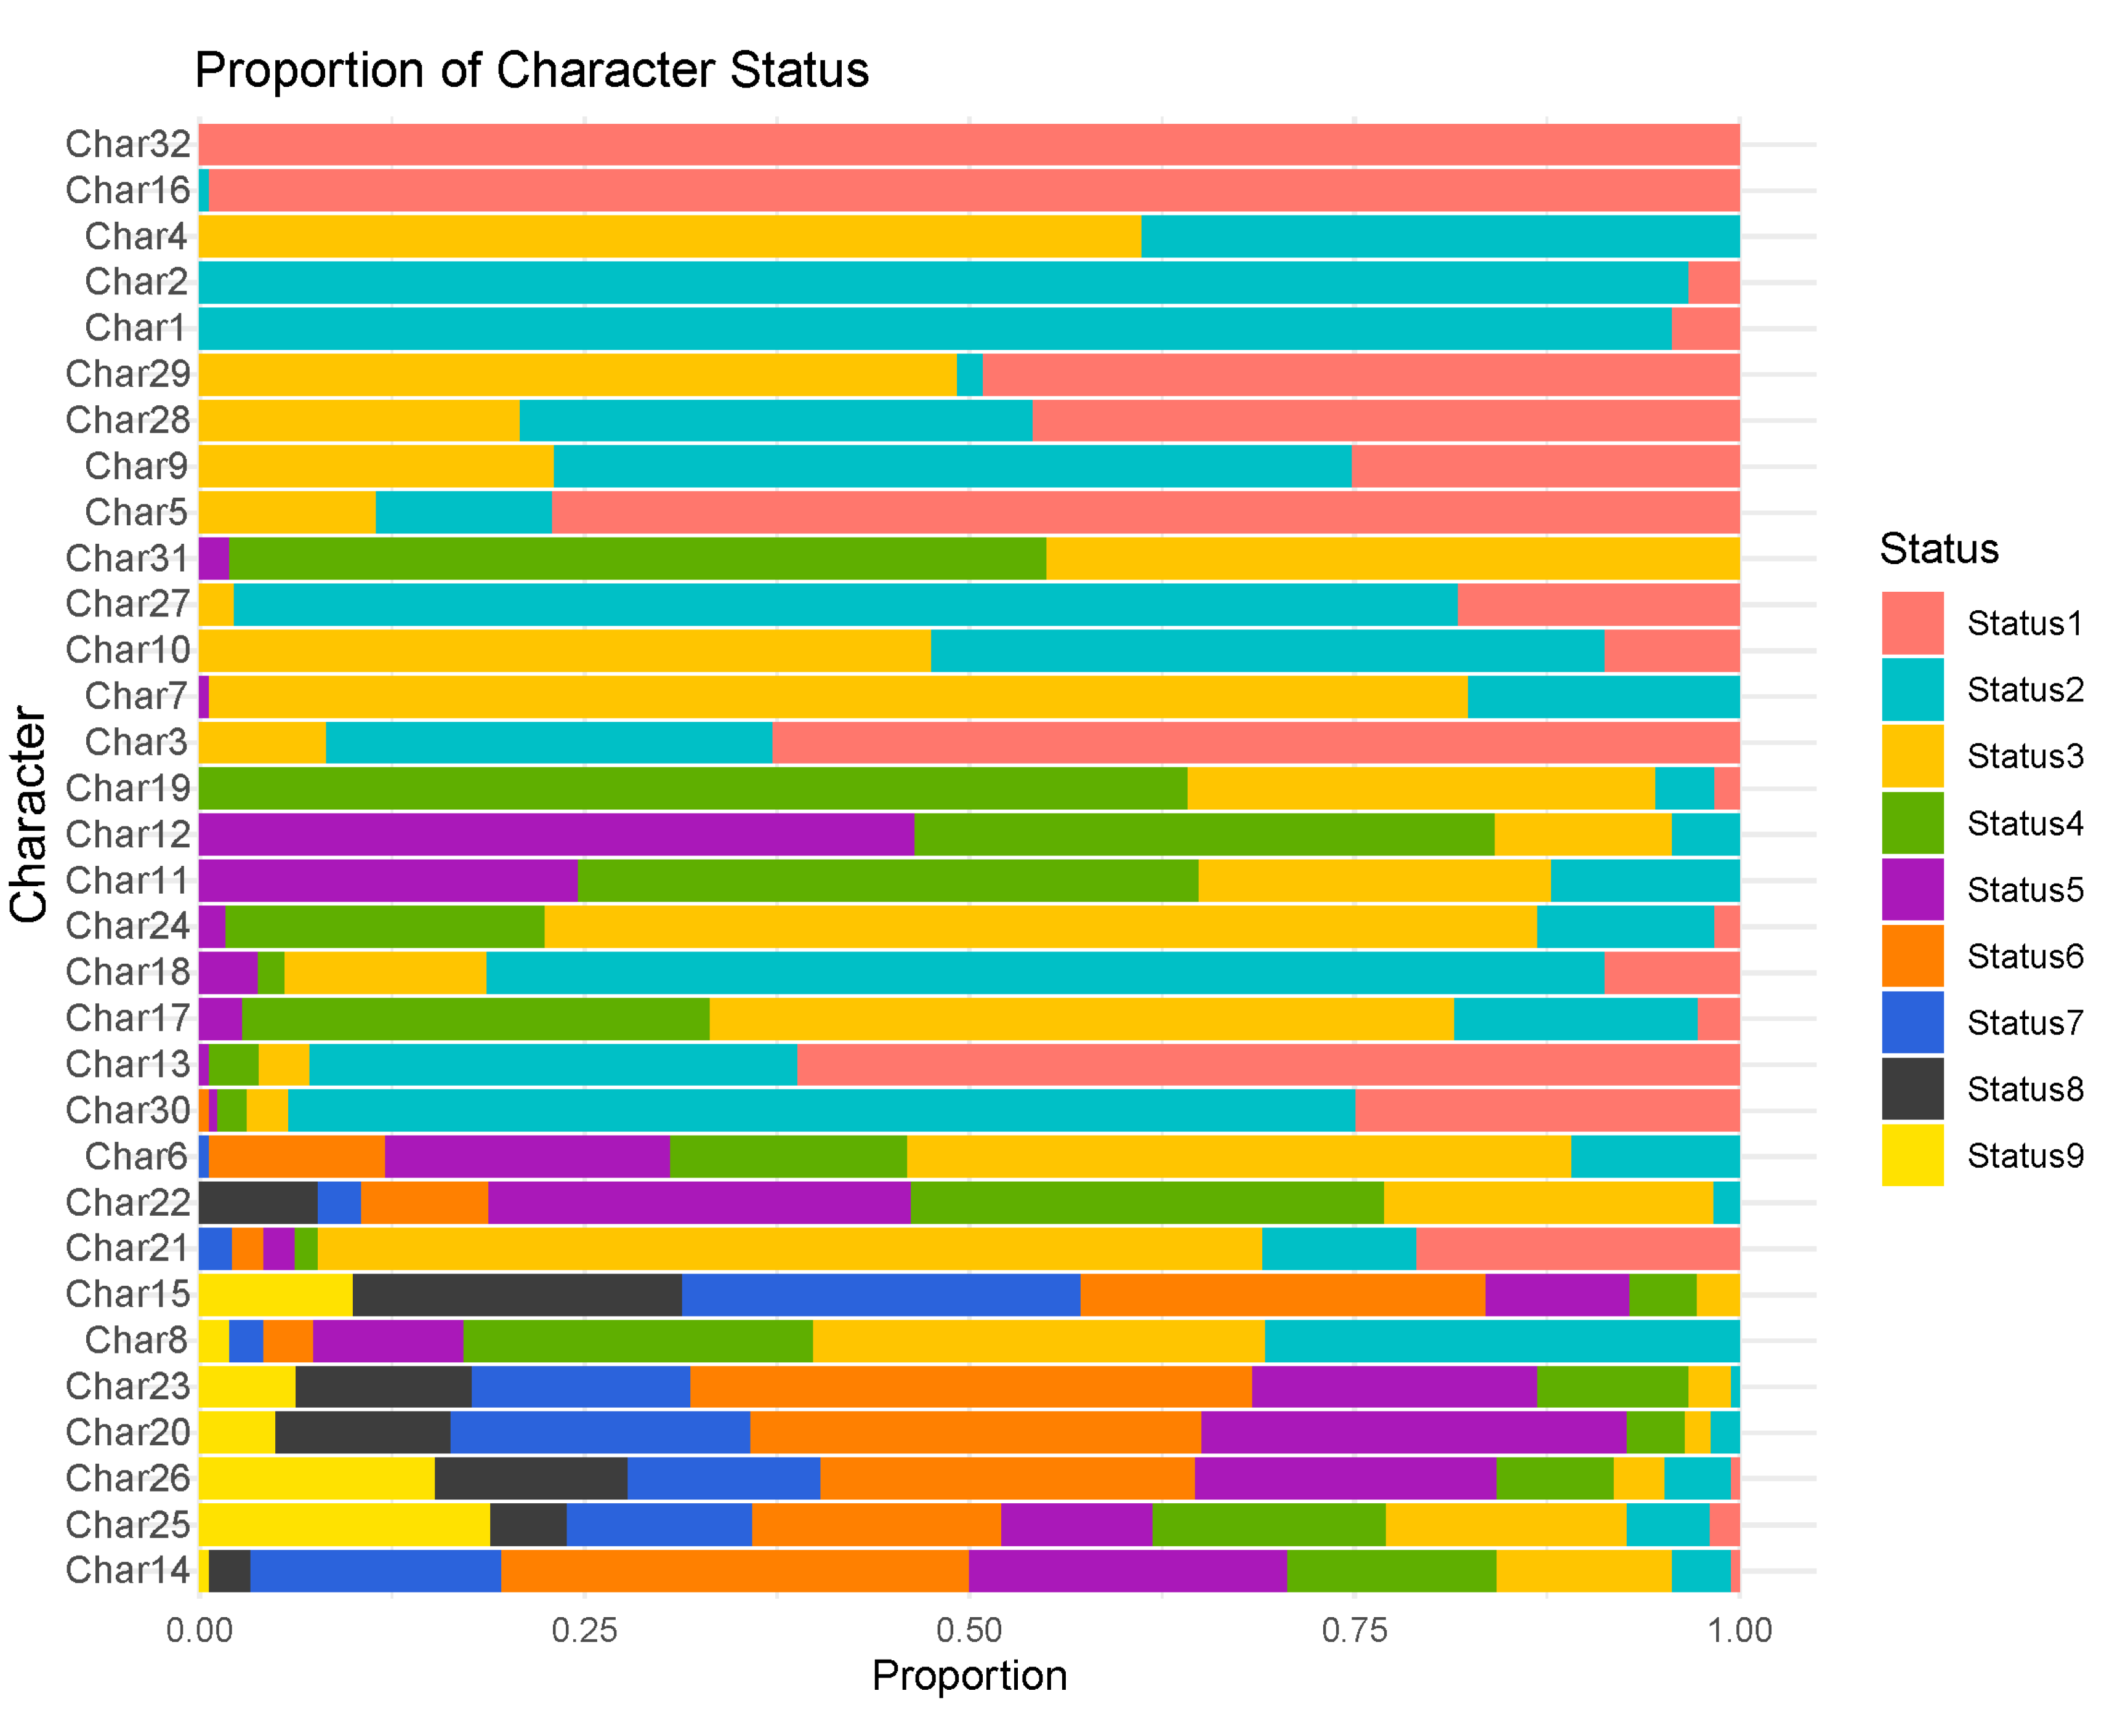
Figure 2.
Correlation analysis among DUS testing characteristics of the 183 varieties.
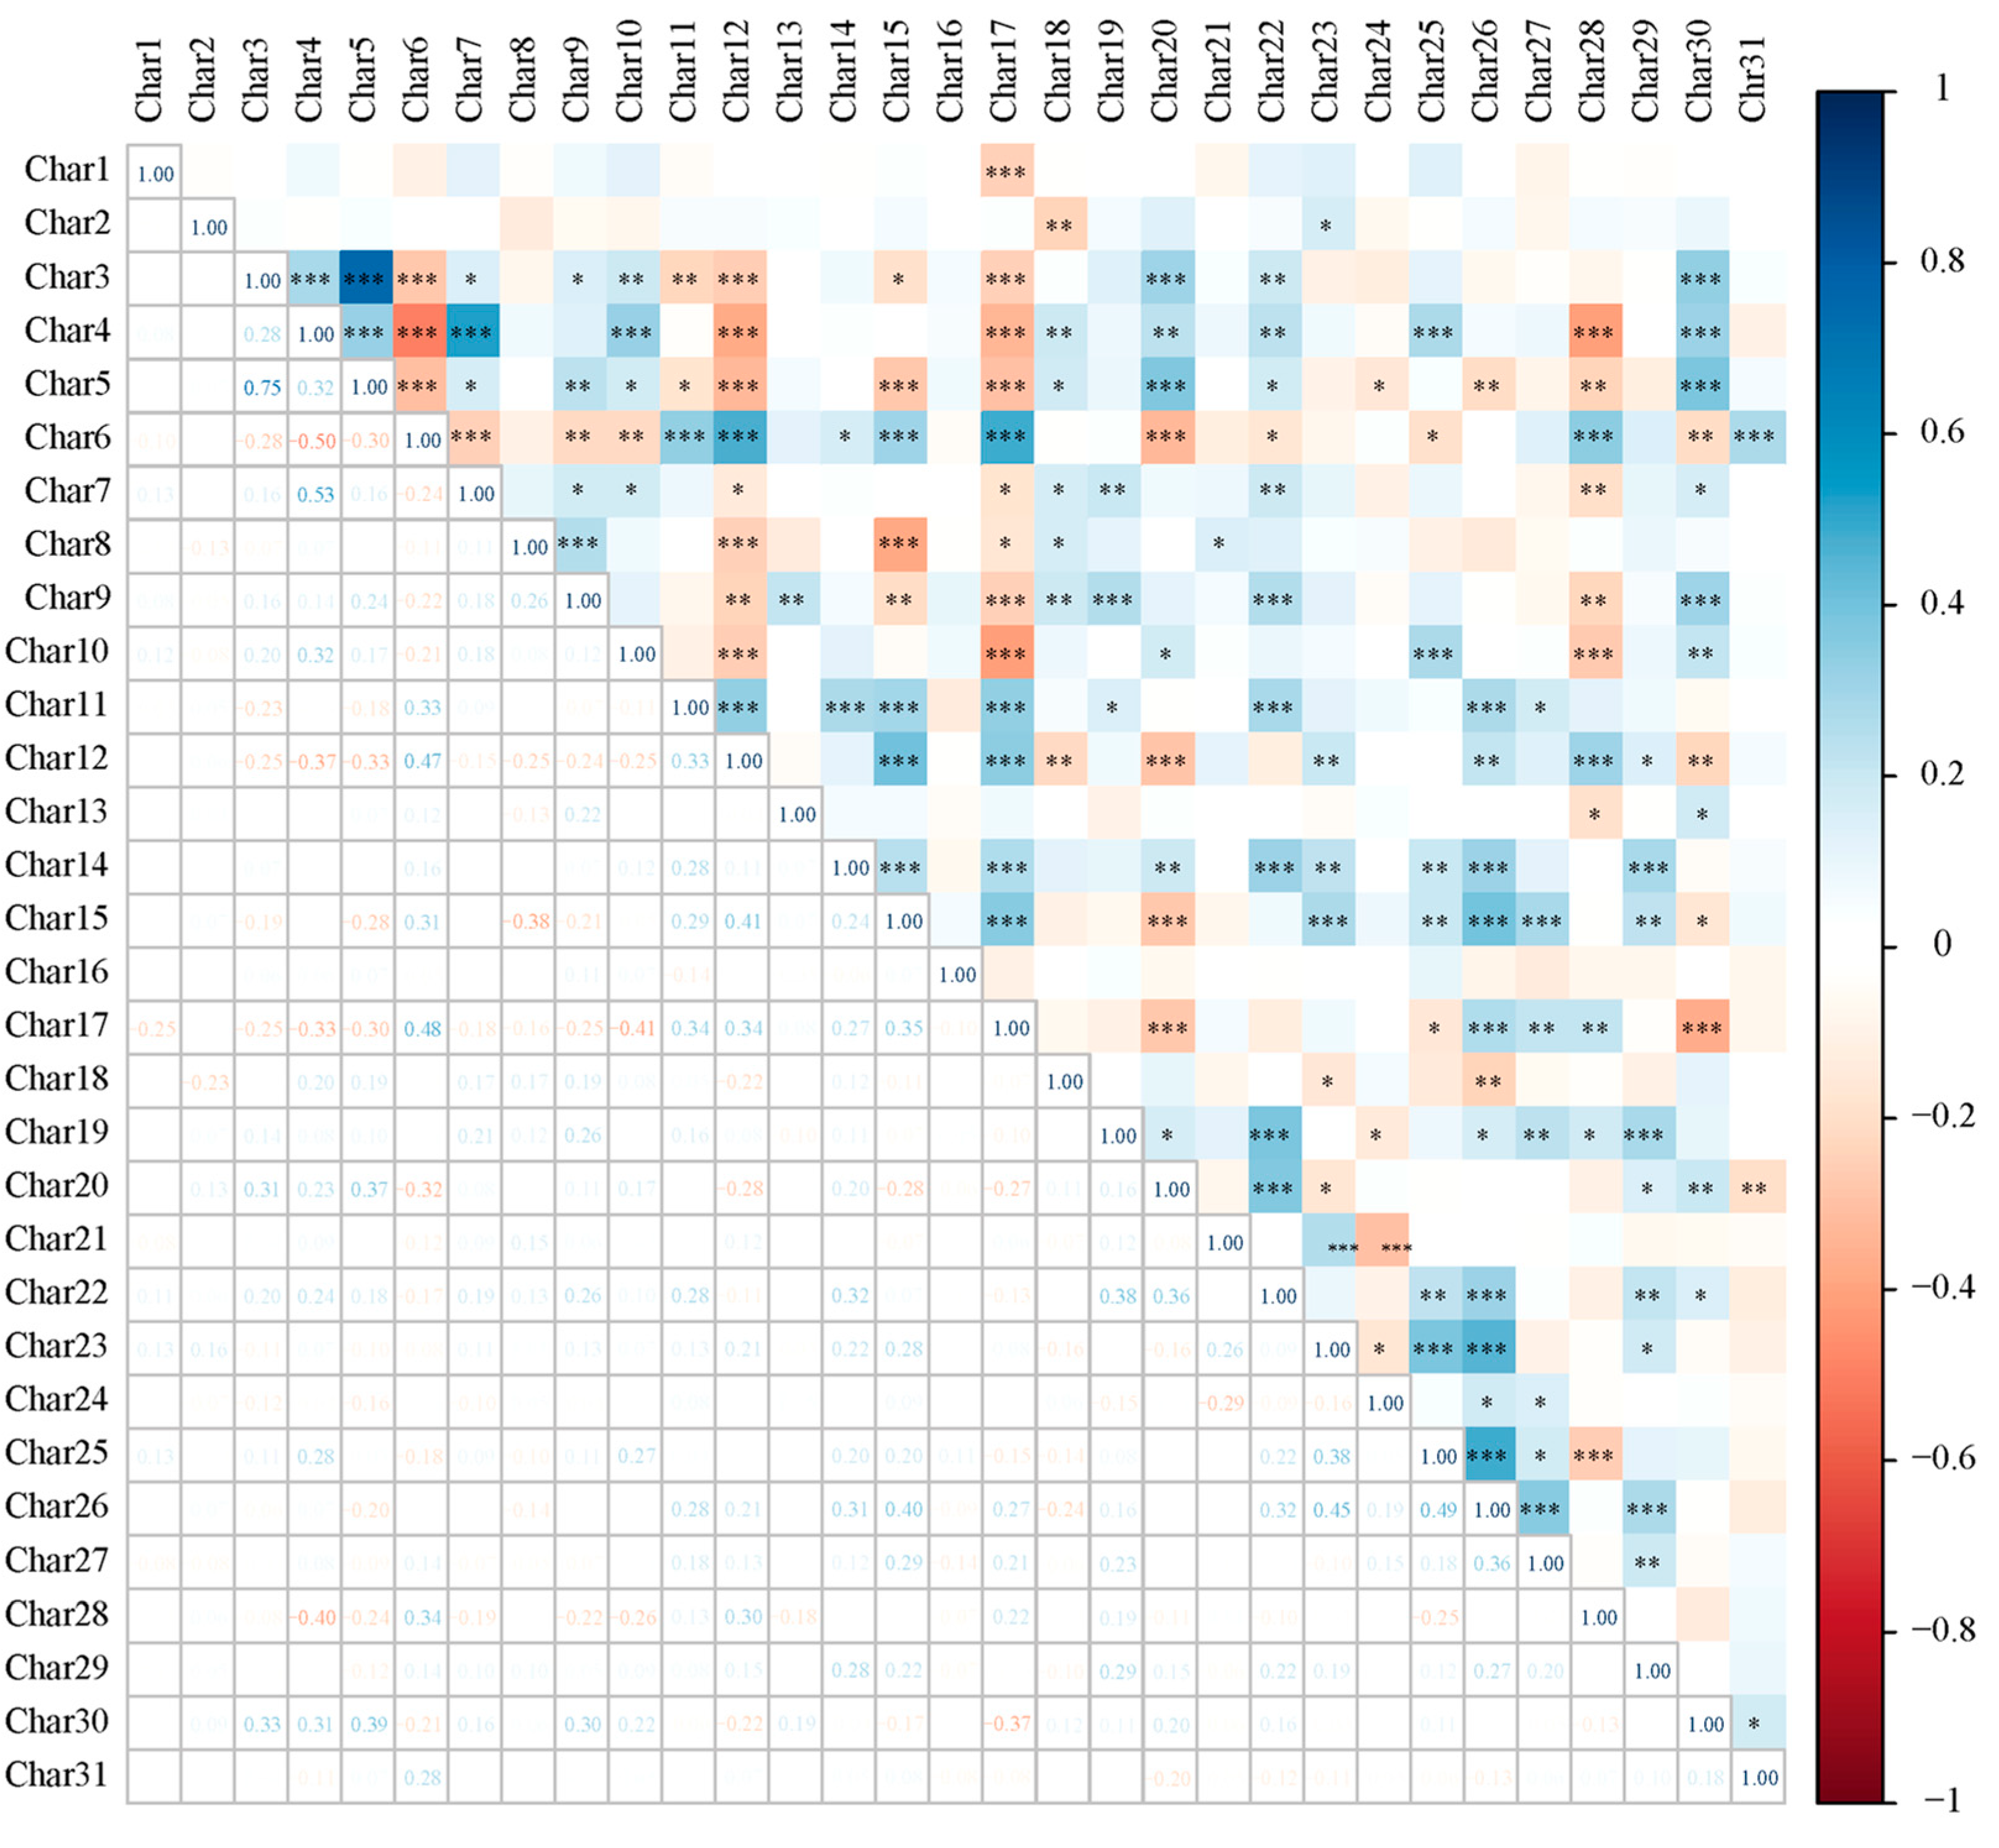
Figure 3.
Cluster dendrogram of 183 millet varieties based on DUS testing characteristics.
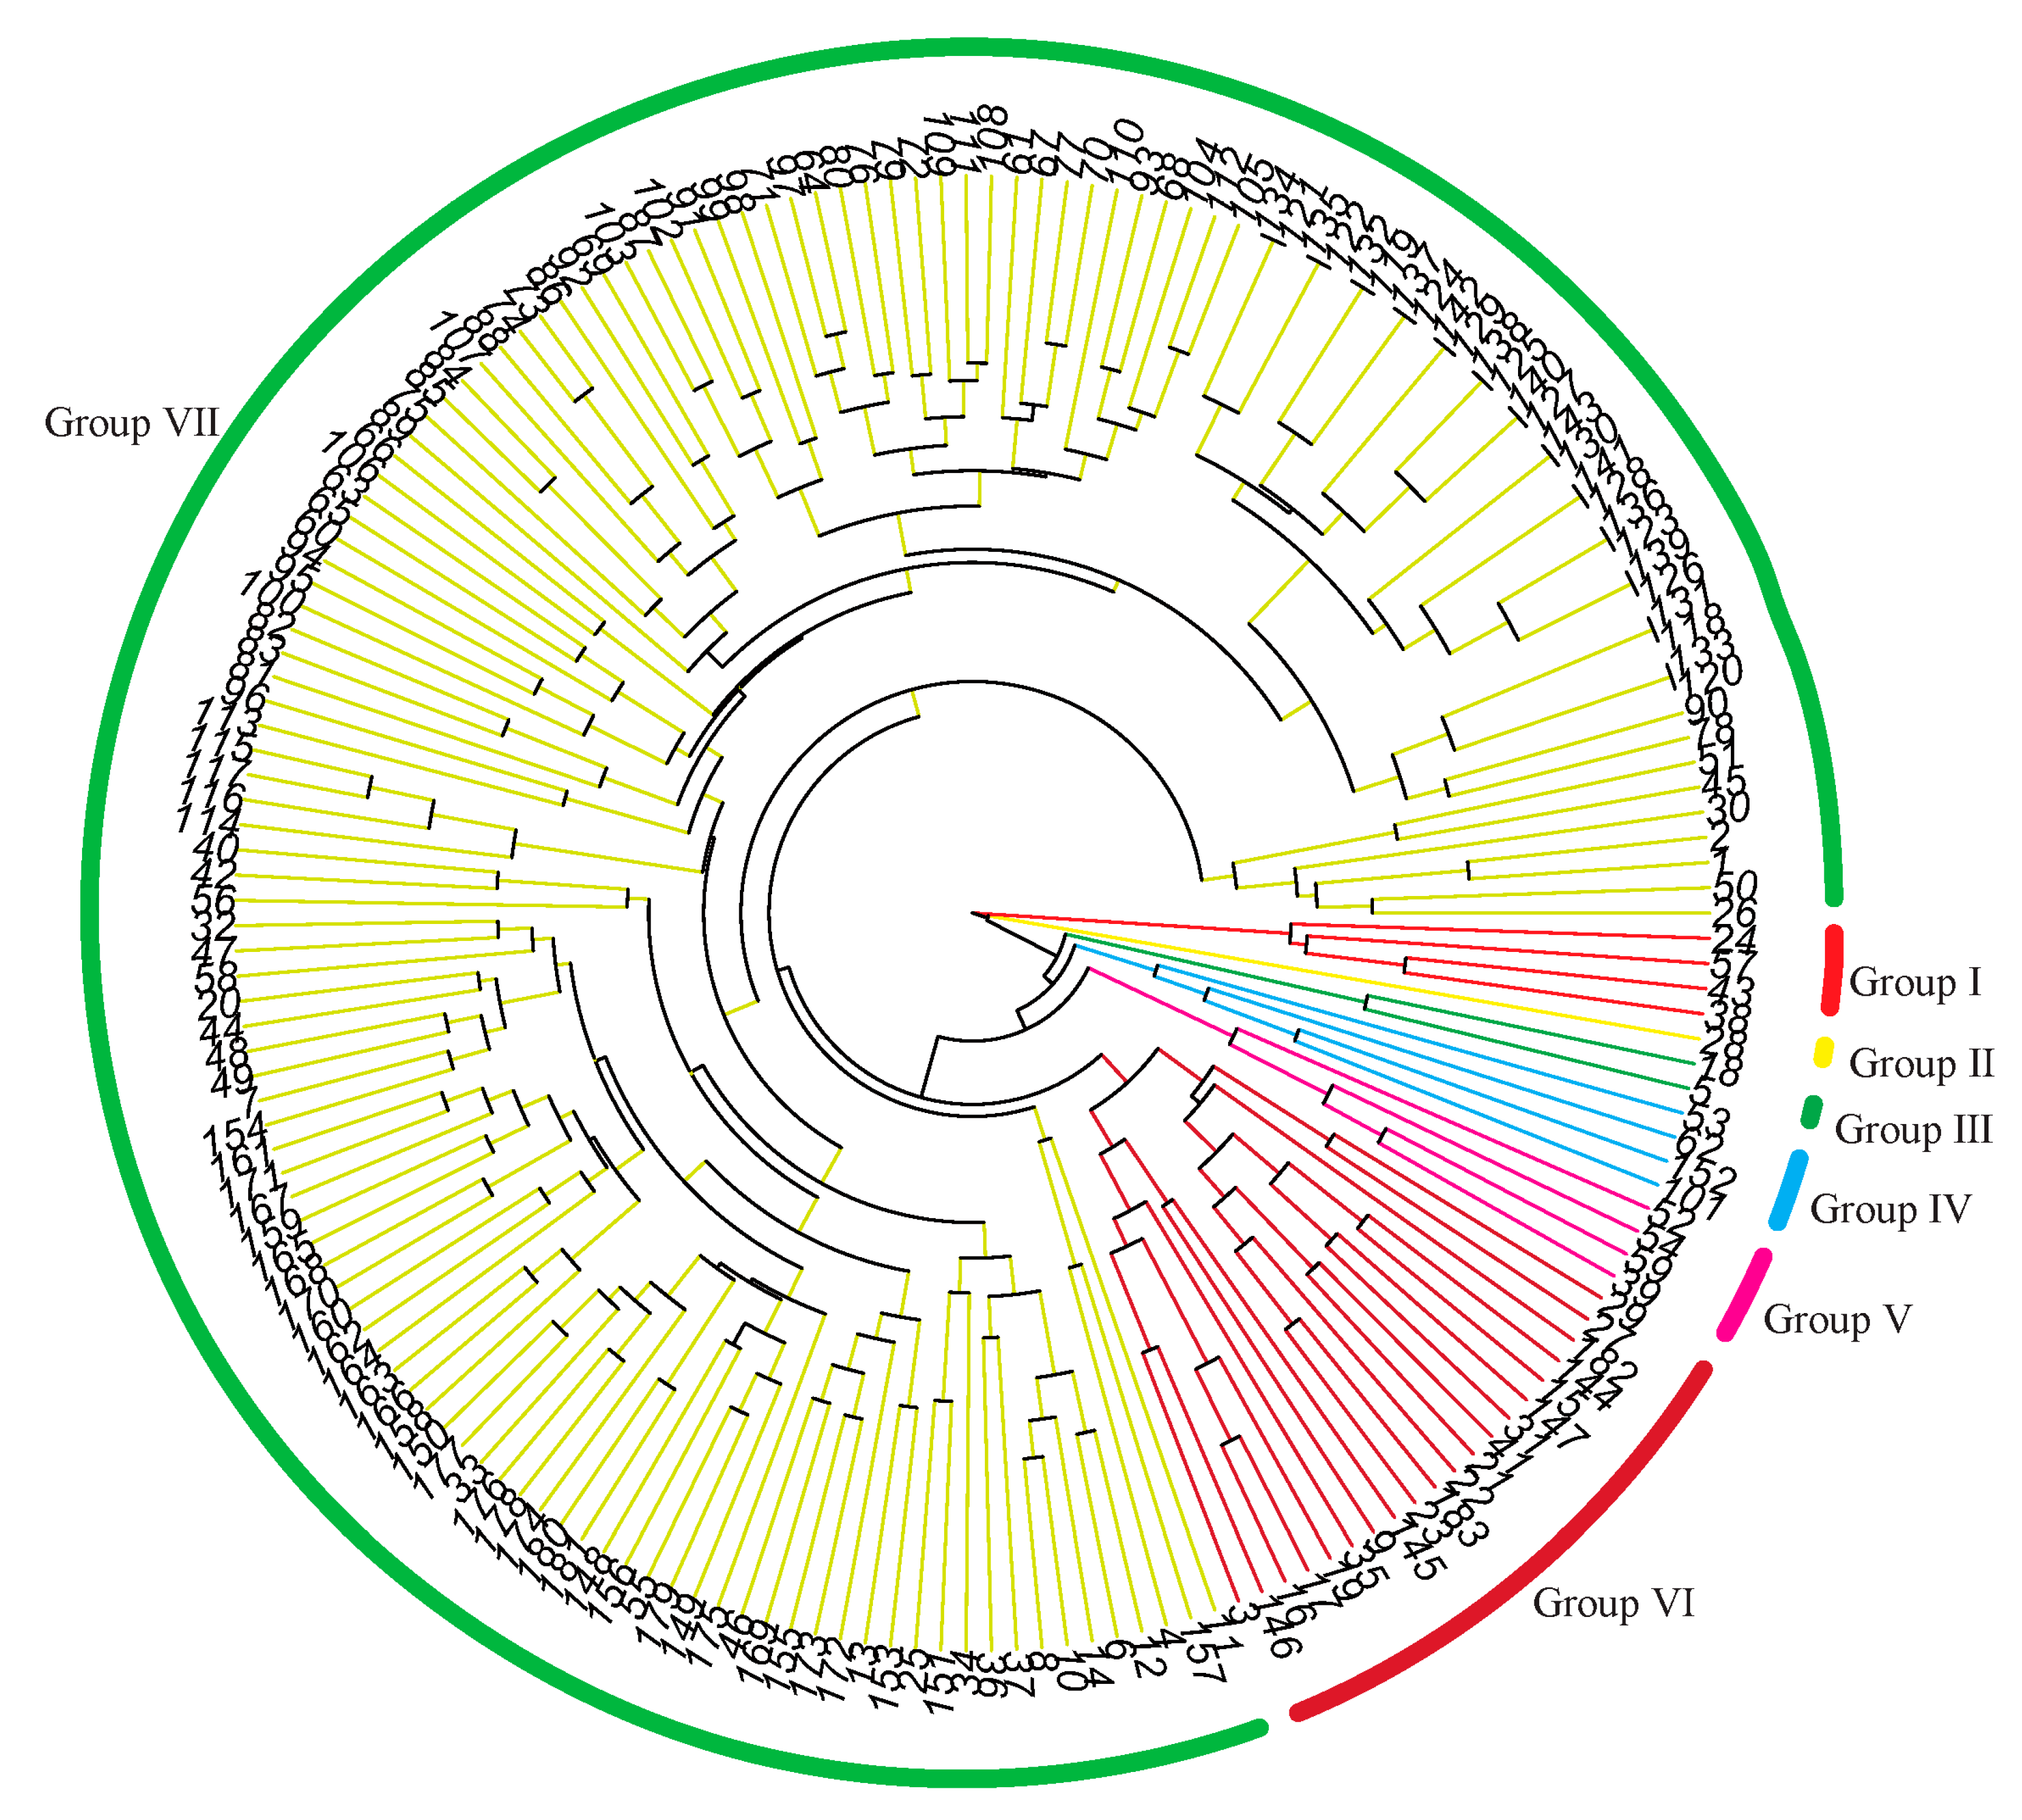
Figure 4.
The principal component analysis of the 183 millet varieties.
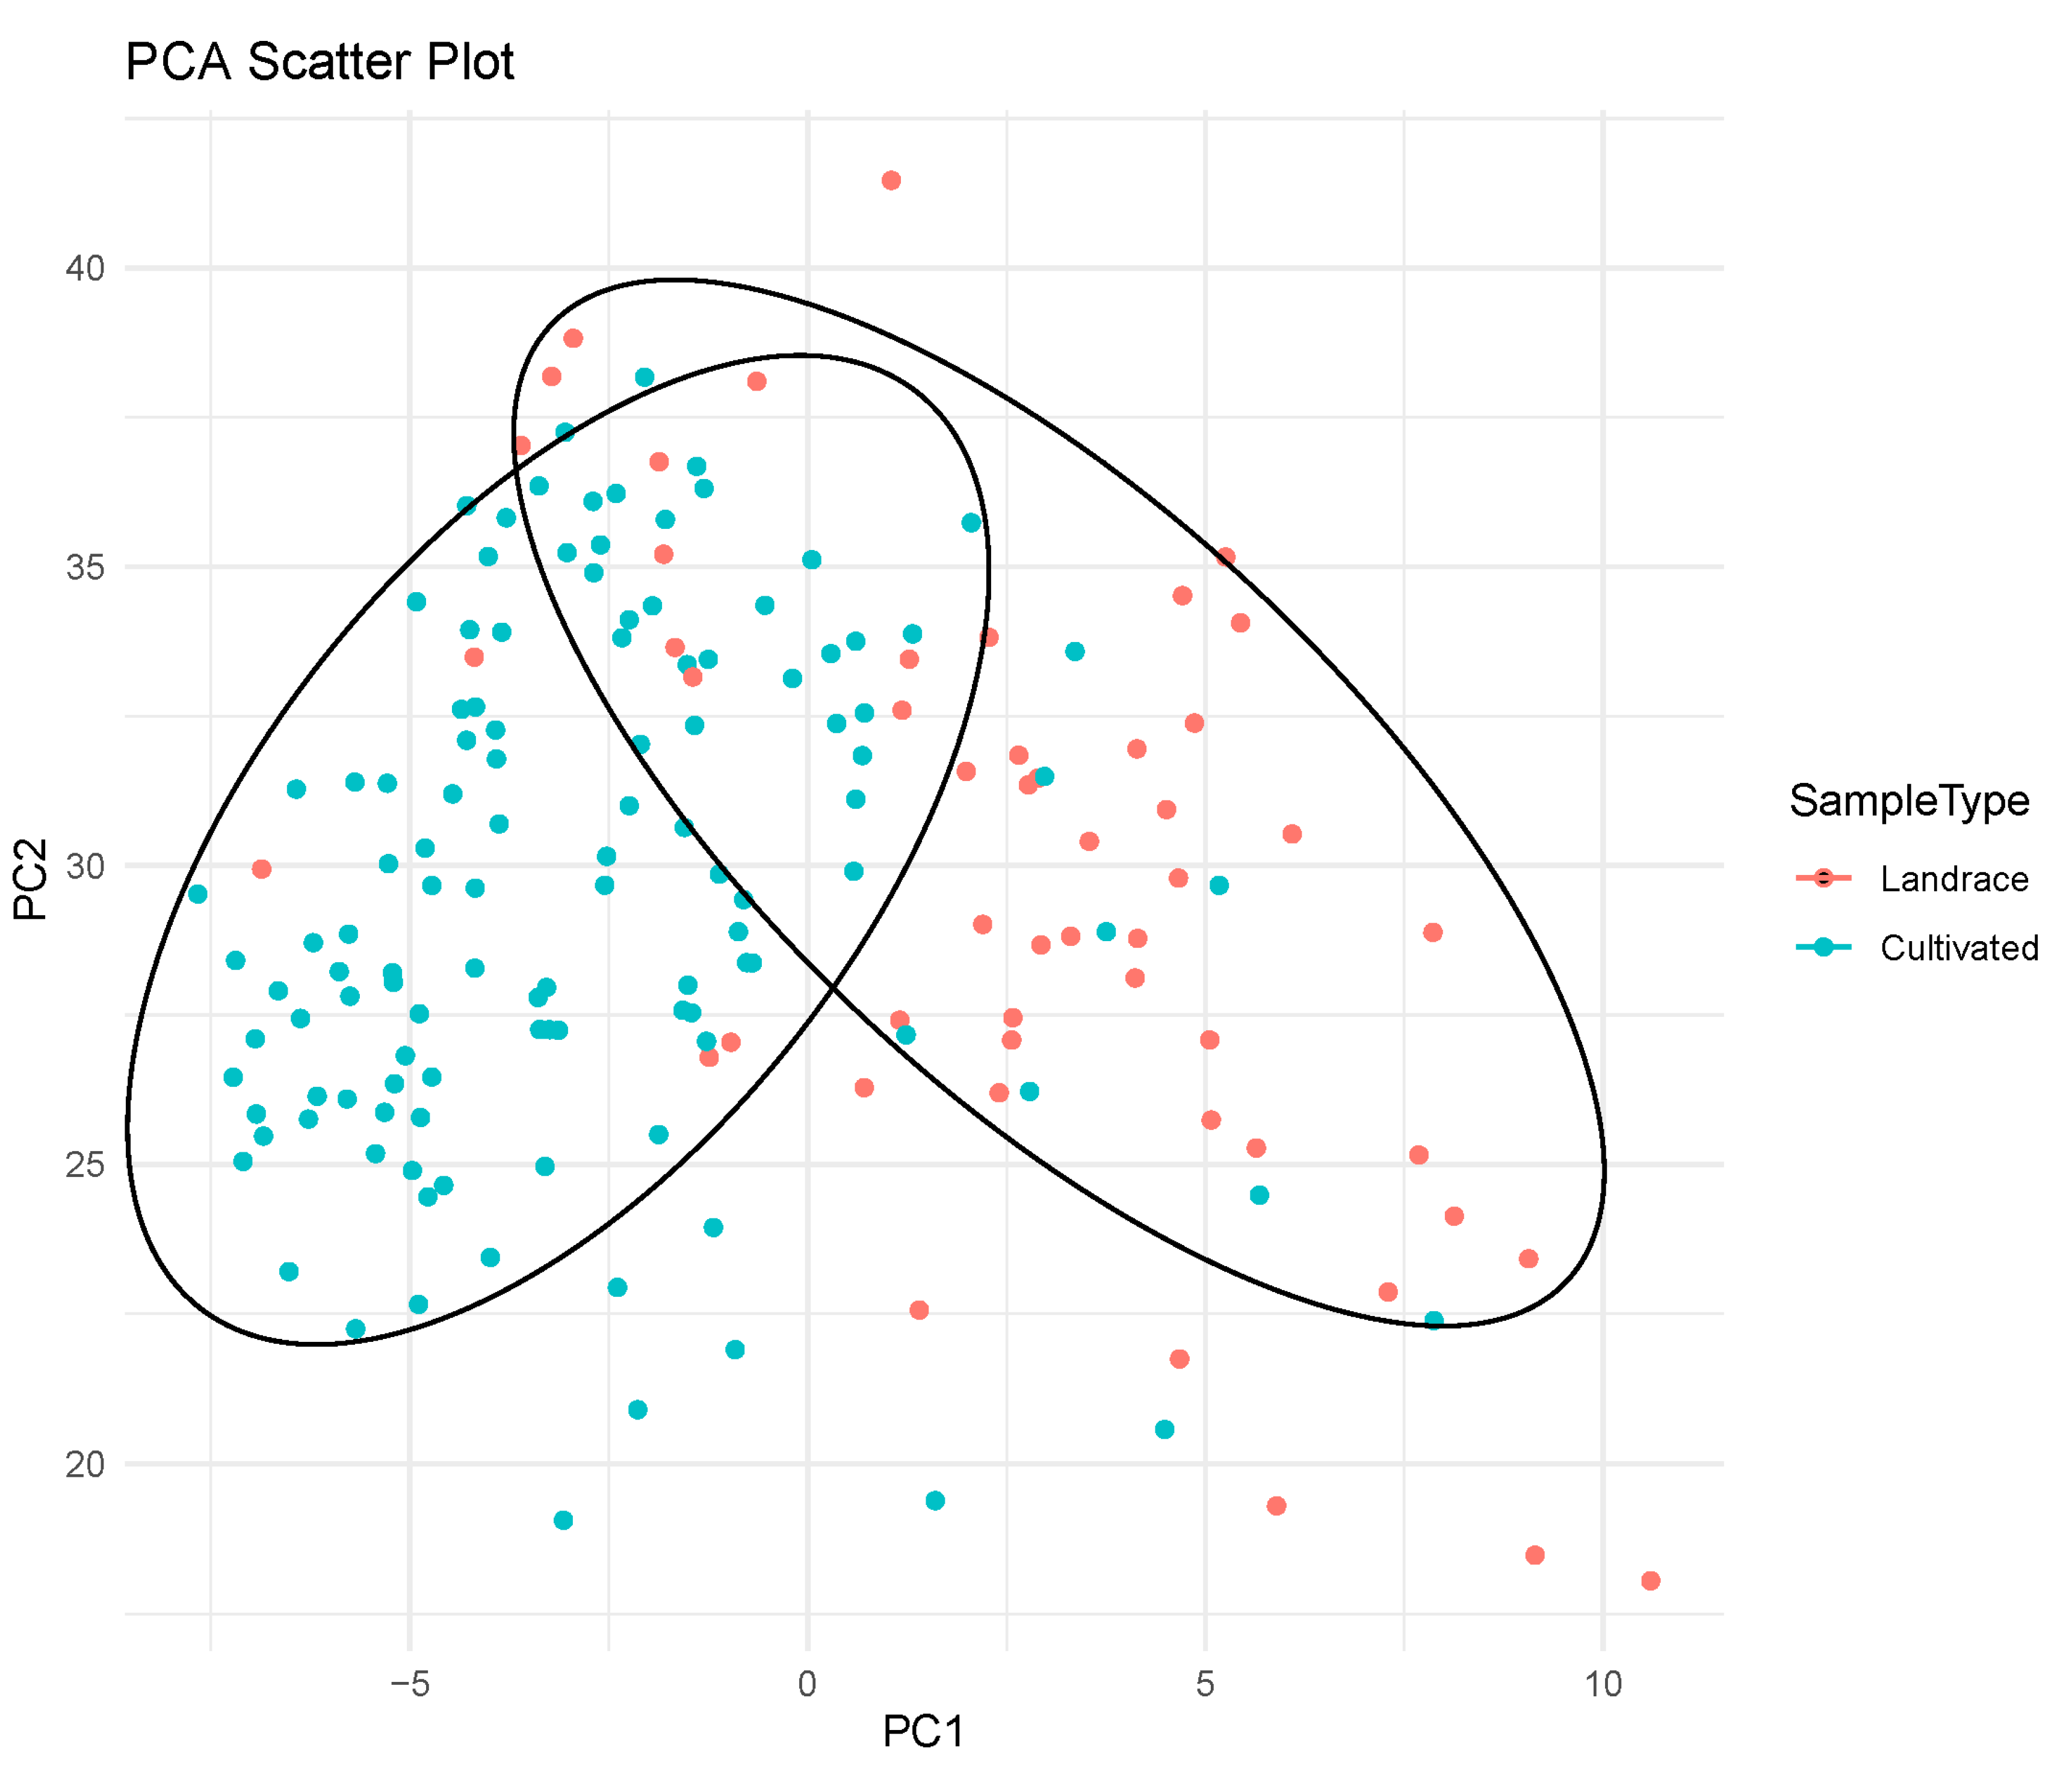
Figure 5.
Landrace and cultivated varietie differences in all DUS test characters analysis.
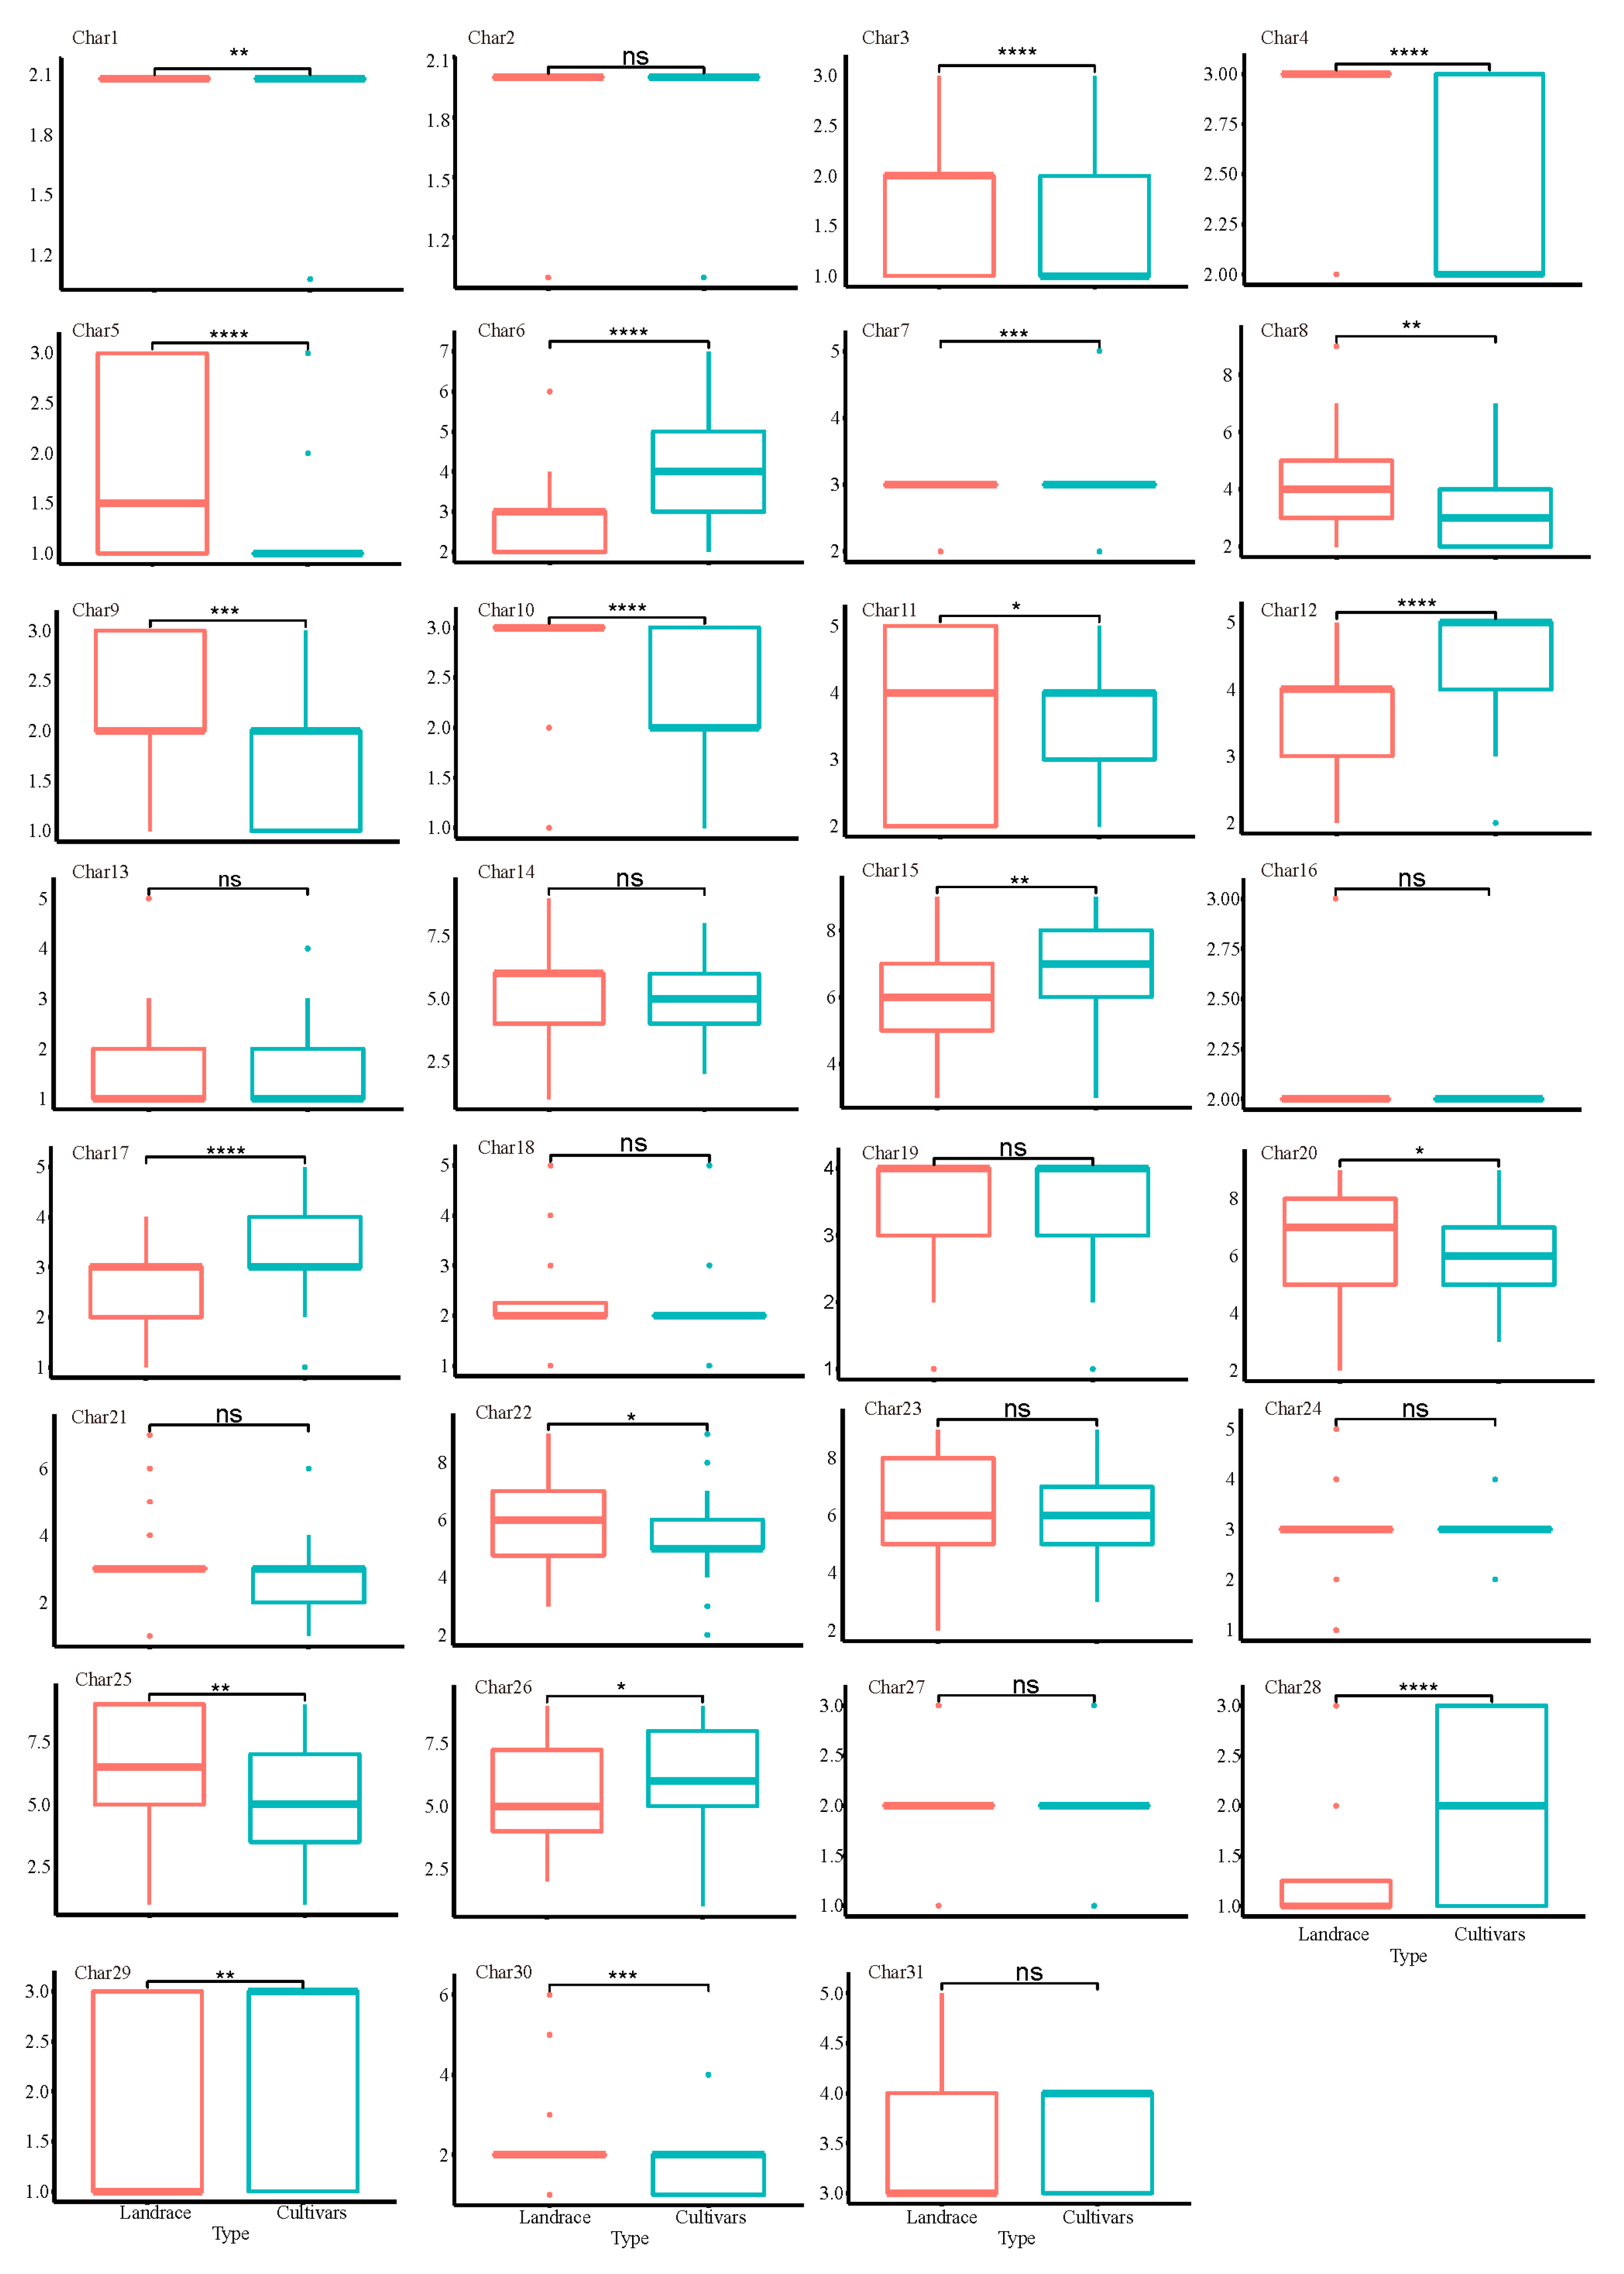

Table 1.
The information on wheat DUS testing characteristics used in this study.
| Characteristics | Character code | Type of expression | Method of observation | States and code of expression |
| First leaf: shape of tip | char1 | PQ | VG | pointed(1)pointed to rounded(2)rounded(3) |
| Seedling: Leaf color | char2 | PQ | VG | yellow green(1)green(2)light purple(3)purple(4) |
| Seedling: Leaf sheath color | char3 | PQ | VG | green(1)light purple(2)medium purple(3) |
| Seeding: growth habit | char4 | PQ | VG | upright(1)semi-upright(2)spreading(3)drooping(4) |
| Seedling: Anthocyanin shows color in leaf midrib | char5 | QN | VG | absent or weak(1)medium(2)strong(3) |
| Time of heading | char6 | QN | MG | very early(1)early(3)medium(5)late(7)very late(9) |
| Plant: growth habit | char7 | PQ | VG | upright(1)semi-upright(2)spreading(3)drooping(4) |
| Panicle: length of bristles | char8 | QN | VG | short(3)medium(5)long(7) |
| Panicle: bristles color | char9 | PQ | VG | green(1)yellow(2)purple(3) |
| Anther: color | char10 | PQ | VG | white(1)yellow(2)brown(3) |
| Flag leaf: length of blade | char11 | QN | MS/MG | short(1)medium(3)long(5) |
| Flag leaf: width of blade | char12 | QN | MS/MG | narrow(1)medium(3)broad(5) |
| Panicle: color of glume | char13 | PQ | VG | yellow green(1)green(2)red(3)light purple(4)medium purple(5) |
| Stem: length | char14 | QN | MS/MG | very short(1)short(3)medium(5)long(7)very long(9) |
| Stem: diameter | char15 | QN | MS/MG | narrow(3)medium(5)broad(7) |
| plant:color | char16 | PQ | VG | yellow(1)green(2)light purple(3)medium purple(4) |
| Plant: number of elongated internodes | char17 | QN | MG | few(1)medium(3)many(5) |
| Plant: number of culms per panicle | char18 | QN | MS | few(1)medium(3)many(5) |
| Panicle neck: attitude | char19 | PQ | VG | straight(1)medium curve(2)strong curve(3)claw(4) |
| Panicle neck:length | char20 | QN | MS | short(3)medium(5)long(7) |
| Panicle: type | char21 | PQ | VG | conical(1)spindle(2)cylindrical(3)club(4)duck mouth(5)cat foot(6)branched(7) |
| Panicle: length | char22 | QN | MG | very short(1)short(3)medium(5)long(7)very long(9) |
| Panicle:diameter | char23 | QN | MS | narrow(3)medium(5)broad(7) |
| Panicle:density | char24 | QN | VG | lax(1)lax to medium(2)medium(3)medium to dense(4)dense(5) |
| Panicle: single-grain number | char25 | QN | MG | very few(1)few(3)medium(5)many(7)very many(9) |
| Panicle: single panicle weight | char26 | QN | MS | very low(1)low(3)medium(5)high(7)very high(9) |
| Panicle: Grain yield per panicle | char27 | QN | MS | low(1)medium(2)high(3) |
| 1000 grain weight | char28 | QN | MG | low(1)medium(2)high(3) |
| Grain: shape | char29 | PQ | VG | narrow ovate(1)medium ovate(2)circular(3) |
| Grain: color | char30 | PQ | VG | white(1)yellow(2)red(3)brown(4)grey(5)black(6) |
| Dehusked grain:color (not polished) | char31 | PQ | VG | white(1)grey green(2)light yellow(3)medium yellow(4)grey(5) |
| Endosperm: type | char32 | QL | VG | waxy(1)non-waxy(2) |
Table 2.
Variability and genetic diversity of all DUS test characters.
| Characteristics | Mean | SD | CV | Max | Min | H’ |
| char1 | 1.96 | 0.19 | 9.89 | 2 | 1 | 0.183 |
| char2 | 1.97 | 0.18 | 9.15 | 2 | 1 | 0.147 |
| char3 | 1.46 | 0.65 | 44.08 | 3 | 1 | 0.864 |
| char4 | 2.63 | 0.48 | 18.43 | 3 | 2 | 0.661 |
| char5 | 1.35 | 0.68 | 50.31 | 3 | 1 | 0.707 |
| char6 | 3.79 | 1.24 | 32.70 | 7 | 2 | 1.490 |
| char7 | 2.83 | 0.42 | 14.69 | 5 | 2 | 0.503 |
| char8 | 3.31 | 1.31 | 39.54 | 9 | 2 | 1.493 |
| char9 | 1.97 | 0.69 | 35.21 | 3 | 1 | 1.218 |
| char10 | 2.40 | 0.65 | 26.98 | 3 | 1 | 1.129 |
| char11 | 3.78 | 0.96 | 25.43 | 5 | 2 | 1.489 |
| char12 | 4.25 | 0.83 | 19.55 | 5 | 2 | 1.228 |
| char13 | 1.51 | 0.76 | 50.52 | 5 | 1 | 1.045 |
| char14 | 5.22 | 1.51 | 29.02 | 9 | 1 | 1.790 |
| char15 | 6.78 | 1.34 | 19.79 | 9 | 3 | 1.705 |
| char16 | 2.01 | 0.07 | 3.72 | 3 | 2 | 1.078 |
| char17 | 3.15 | 0.82 | 26.06 | 5 | 1 | 1.431 |
| char18 | 2.19 | 0.78 | 35.39 | 5 | 1 | 1.156 |
| char19 | 3.56 | 0.65 | 18.28 | 4 | 1 | 1.100 |
| char20 | 6.14 | 1.36 | 22.23 | 9 | 2 | 1.709 |
| char21 | 2.69 | 1.10 | 40.59 | 7 | 1 | 1.256 |
| char22 | 5.37 | 1.21 | 22.51 | 9 | 2 | 1.579 |
| char23 | 6.06 | 1.44 | 23.80 | 9 | 2 | 1.737 |
| char24 | 3.10 | 0.68 | 21.84 | 5 | 1 | 1.379 |
| char25 | 5.66 | 2.29 | 40.45 | 9 | 1 | 2.032 |
| char26 | 6.20 | 1.91 | 30.84 | 9 | 1 | 1.949 |
| char27 | 1.84 | 0.42 | 23.11 | 3 | 1 | 0.58 |
| char28 | 1.74 | 0.77 | 44.35 | 3 | 1 | 1.045 |
| char29 | 1.98 | 0.99 | 50.13 | 3 | 1 | 0.766 |
| char30 | 1.83 | 0.66 | 36.25 | 6 | 1 | 0.812 |
| char31 | 3.55 | 0.52 | 14.65 | 5 | 3 | 0.745 |
| char32 | 2.00 | 0.00 | 0.00 | 2 | 2 | 0.000 |
Note: SD: Standard Deviation. CV: coefficient of variation. H’: Shannon diversity index.
Table 3.
The principal component analysis of the 32 quantitative characters in the 183 Setaria italica accessions.
Table 3.
The principal component analysis of the 32 quantitative characters in the 183 Setaria italica accessions.
| characters | 1 | 2 | 3 | 4 | 5 | 6 | 7 | 8 | 9 | 10 | 11 |
| Char1 | 0.134 | 0.097 | -0.243 | -0.060 | -0.114 | 0.088 | -0.286 | 0.181 | 0.535 | 0.110 | -0.054 |
| Char2 | -0.036 | 0.124 | 0.023 | -0.143 | 0.507 | -0.140 | -0.055 | 0.271 | 0.200 | -0.372 | 0.145 |
| Char3 | 0.579 | 0.074 | 0.178 | 0.096 | 0.519 | -0.001 | 0.039 | -0.209 | -0.079 | 0.207 | -0.130 |
| Char4 | 0.620 | 0.335 | -0.209 | 0.074 | -0.127 | 0.036 | 0.214 | -0.331 | 0.116 | -0.206 | 0.140 |
| Char5 | 0.671 | -0.014 | 0.212 | 0.123 | 0.430 | 0.067 | 0.176 | -0.112 | -0.055 | 0.144 | -0.092 |
| Char6 | -0.686 | -0.021 | 0.349 | 0.160 | 0.054 | 0.337 | -0.040 | 0.041 | 0.054 | 0.104 | -0.045 |
| Char7 | 0.401 | 0.281 | 0.007 | -0.165 | -0.190 | 0.225 | 0.190 | -0.258 | 0.372 | -0.243 | 0.209 |
| Char8 | 0.244 | -0.080 | 0.291 | -0.338 | -0.570 | 0.017 | -0.093 | 0.123 | -0.243 | -0.069 | -0.084 |
| Char9 | 0.456 | 0.167 | 0.176 | -0.126 | -0.178 | 0.290 | 0.029 | 0.458 | -0.204 | 0.184 | 0.219 |
| Char10 | 0.449 | 0.211 | -0.189 | 0.137 | -0.129 | 0.204 | -0.220 | -0.115 | -0.029 | -0.003 | -0.335 |
| Char11 | -0.358 | 0.429 | 0.311 | 0.056 | -0.163 | 0.017 | 0.258 | 0.001 | 0.266 | -0.103 | 0.134 |
| Char12 | -0.665 | 0.203 | 0.051 | -0.142 | 0.184 | 0.160 | -0.070 | -0.054 | 0.123 | 0.075 | 0.067 |
| Char13 | 0.041 | 0.044 | -0.012 | 0.329 | 0.144 | 0.295 | 0.292 | 0.550 | -0.149 | -0.118 | 0.157 |
| Char14 | -0.090 | 0.556 | 0.276 | 0.150 | -0.030 | 0.021 | 0.217 | 0.110 | 0.031 | 0.194 | -0.491 |
| Char15 | -0.482 | 0.498 | -0.246 | 0.238 | 0.108 | 0.215 | 0.079 | -0.146 | 0.181 | 0.044 | 0.048 |
| Char16 | 0.121 | -0.035 | -0.216 | -0.111 | 0.095 | 0.151 | -0.066 | -0.016 | 0.086 | 0.665 | 0.302 |
| Char17 | -0.689 | 0.107 | 0.127 | 0.063 | 0.059 | -0.066 | 0.481 | -0.024 | -0.134 | 0.051 | 0.005 |
| Char18 | 0.258 | -0.118 | 0.305 | 0.205 | -0.421 | 0.195 | 0.360 | -0.102 | 0.186 | 0.179 | -0.096 |
| Char19 | 0.137 | 0.383 | 0.520 | -0.286 | 0.013 | -0.019 | -0.247 | -0.139 | -0.026 | 0.137 | 0.375 |
| Char20 | 0.488 | 0.150 | 0.321 | 0.163 | 0.125 | -0.499 | 0.002 | 0.133 | 0.120 | -0.042 | -0.160 |
| Char21 | 0.039 | 0.085 | -0.032 | -0.617 | 0.064 | 0.146 | 0.297 | -0.136 | -0.321 | -0.079 | -0.016 |
| Char22 | 0.298 | 0.578 | 0.305 | -0.089 | -0.036 | -0.225 | 0.038 | 0.149 | 0.164 | 0.101 | 0.055 |
| Char23 | -0.106 | 0.524 | -0.355 | -0.458 | 0.016 | 0.140 | 0.078 | 0.224 | -0.025 | -0.047 | -0.234 |
| Char24 | -0.109 | 0.017 | -0.091 | 0.543 | -0.335 | -0.209 | -0.191 | 0.167 | -0.036 | 0.046 | 0.162 |
| Char25 | 0.160 | 0.605 | -0.427 | 0.043 | 0.016 | 0.052 | -0.149 | -0.016 | -0.182 | 0.187 | -0.040 |
| Char26 | -0.247 | 0.749 | -0.162 | 0.056 | 0.008 | -0.224 | -0.055 | 0.062 | -0.194 | 0.007 | 0.063 |
| Char27 | -0.201 | 0.385 | 0.117 | 0.341 | -0.086 | -0.071 | -0.135 | -0.383 | -0.401 | -0.088 | 0.234 |
| Char28 | -0.430 | -0.142 | 0.416 | -0.273 | 0.098 | -0.103 | -0.226 | -0.058 | 0.122 | 0.117 | -0.037 |
| Char29 | -0.078 | 0.482 | 0.256 | -0.036 | -0.061 | 0.026 | -0.390 | 0.017 | -0.054 | -0.142 | -0.194 |
| Char30 | 0.518 | 0.099 | 0.150 | 0.202 | 0.188 | 0.277 | -0.122 | 0.173 | -0.057 | -0.180 | 0.206 |
| Char31 | -0.068 | -0.069 | 0.255 | 0.154 | 0.120 | 0.644 | -0.319 | -0.119 | -0.036 | -0.207 | -0.155 |
Table 4.
Comprehensive score and ranking of 183 Setaria italica accessions.
| variety num | score | rank | variety num | score | rank | variety num | score | rank |
| 144 | 0.0044019 | 1 | 47 | 0.0051848 | 62 | 75 | 0.0057543 | 123 |
| 164 | 0.0044072 | 2 | 18 | 0.0051848 | 63 | 80 | 0.0057656 | 124 |
| 169 | 0.0044475 | 3 | 58 | 0.0052139 | 64 | 9 | 0.0057692 | 125 |
| 163 | 0.0044789 | 4 | 160 | 0.0052141 | 65 | 180 | 0.0057746 | 126 |
| 178 | 0.0044814 | 5 | 109 | 0.0052163 | 66 | 28 | 0.0057757 | 127 |
| 136 | 0.0045208 | 6 | 147 | 0.0052227 | 67 | 123 | 0.0057808 | 128 |
| 23 | 0.0045217 | 7 | 82 | 0.0052237 | 68 | 12 | 0.0057846 | 129 |
| 24 | 0.0045440 | 8 | 63 | 0.0052340 | 69 | 97 | 0.0057949 | 130 |
| 130 | 0.0045671 | 9 | 79 | 0.0052358 | 70 | 99 | 0.0058321 | 131 |
| 161 | 0.0045847 | 10 | 64 | 0.0052430 | 71 | 153 | 0.0058577 | 132 |
| 2 | 0.0046025 | 11 | 33 | 0.0052437 | 72 | 13 | 0.0058617 | 133 |
| 137 | 0.0046308 | 12 | 166 | 0.0052499 | 73 | 110 | 0.0058849 | 134 |
| 168 | 0.0046707 | 13 | 10 | 0.0052500 | 74 | 98 | 0.0058937 | 135 |
| 129 | 0.0046859 | 14 | 31 | 0.0052550 | 75 | 172 | 0.0058989 | 136 |
| 73 | 0.0046881 | 15 | 158 | 0.0052550 | 76 | 39 | 0.0059003 | 137 |
| 106 | 0.0046898 | 16 | 142 | 0.0052580 | 77 | 182 | 0.0059397 | 138 |
| 4 | 0.0047016 | 17 | 135 | 0.0052580 | 78 | 72 | 0.0059493 | 139 |
| 133 | 0.0047340 | 18 | 60 | 0.0052635 | 79 | 59 | 0.0059500 | 140 |
| 175 | 0.0047354 | 19 | 19 | 0.0052735 | 80 | 29 | 0.0059534 | 141 |
| 167 | 0.0047465 | 20 | 132 | 0.0052810 | 81 | 68 | 0.0059650 | 142 |
| 138 | 0.0047536 | 21 | 173 | 0.0052846 | 82 | 35 | 0.0059703 | 143 |
| 113 | 0.0047543 | 22 | 8 | 0.0052868 | 83 | 49 | 0.0059762 | 144 |
| 5 | 0.0047684 | 23 | 126 | 0.0052929 | 84 | 124 | 0.0059786 | 145 |
| 177 | 0.0047778 | 24 | 52 | 0.0052994 | 85 | 89 | 0.0059938 | 146 |
| 1 | 0.0047928 | 25 | 17 | 0.0053017 | 86 | 102 | 0.0060098 | 147 |
| 131 | 0.0047944 | 26 | 65 | 0.0053155 | 87 | 122 | 0.0060135 | 148 |
| 61 | 0.0048162 | 27 | 88 | 0.0053402 | 88 | 85 | 0.0060177 | 149 |
| 174 | 0.0048341 | 28 | 127 | 0.0053587 | 89 | 30 | 0.0060186 | 150 |
| 171 | 0.0048344 | 29 | 118 | 0.0053686 | 90 | 48 | 0.0060246 | 151 |
| 159 | 0.0048400 | 30 | 146 | 0.0054040 | 91 | 93 | 0.0060310 | 152 |
| 162 | 0.0048416 | 31 | 62 | 0.0054062 | 92 | 108 | 0.0060672 | 153 |
| 145 | 0.0048555 | 32 | 96 | 0.0054110 | 93 | 46 | 0.0060870 | 154 |
| 128 | 0.0048679 | 33 | 56 | 0.0054122 | 94 | 40 | 0.0060899 | 155 |
| 157 | 0.0048728 | 34 | 7 | 0.0054256 | 95 | 91 | 0.0060950 | 156 |
| 22 | 0.0048753 | 35 | 16 | 0.0054256 | 96 | 27 | 0.0061222 | 157 |
| 134 | 0.0048994 | 36 | 57 | 0.0054285 | 97 | 151 | 0.0061299 | 158 |
| 179 | 0.0049497 | 37 | 120 | 0.0054855 | 98 | 37 | 0.0061510 | 159 |
| 156 | 0.0049500 | 38 | 84 | 0.0055166 | 99 | 104 | 0.0061545 | 160 |
| 77 | 0.0049523 | 39 | 155 | 0.0055502 | 100 | 140 | 0.0061572 | 161 |
| 11 | 0.0049550 | 40 | 141 | 0.0055515 | 101 | 181 | 0.0061625 | 162 |
| 6 | 0.0049585 | 41 | 76 | 0.0055526 | 102 | 36 | 0.0061794 | 163 |
| 15 | 0.0049806 | 42 | 41 | 0.0055599 | 103 | 38 | 0.0061982 | 164 |
| 71 | 0.0050105 | 43 | 83 | 0.0055611 | 104 | 107 | 0.0062144 | 165 |
| 66 | 0.0050126 | 44 | 183 | 0.0055832 | 105 | 149 | 0.0062277 | 166 |
| 165 | 0.0050212 | 45 | 152 | 0.0055913 | 106 | 44 | 0.0062539 | 167 |
| 114 | 0.0050214 | 46 | 125 | 0.0056023 | 107 | 90 | 0.0062543 | 168 |
| 143 | 0.0050331 | 47 | 139 | 0.0056143 | 108 | 34 | 0.0063022 | 169 |
| 170 | 0.0050404 | 48 | 50 | 0.0056196 | 109 | 43 | 0.0063163 | 170 |
| 95 | 0.0050498 | 49 | 55 | 0.0056255 | 110 | 53 | 0.0063217 | 171 |
| 21 | 0.0050560 | 50 | 74 | 0.0056296 | 111 | 150 | 0.0063330 | 172 |
| 25 | 0.0050603 | 51 | 154 | 0.0056363 | 112 | 111 | 0.0063364 | 173 |
| 20 | 0.0050791 | 52 | 69 | 0.0056388 | 113 | 103 | 0.0063750 | 174 |
| 78 | 0.0050879 | 53 | 119 | 0.0056447 | 114 | 100 | 0.0064080 | 175 |
| 87 | 0.0050928 | 54 | 81 | 0.0056666 | 115 | 92 | 0.0064706 | 176 |
| 14 | 0.0050977 | 55 | 51 | 0.0056849 | 116 | 94 | 0.0065087 | 177 |
| 3 | 0.0050979 | 56 | 54 | 0.0056977 | 117 | 45 | 0.0065936 | 178 |
| 112 | 0.0051050 | 57 | 148 | 0.0057056 | 118 | 32 | 0.0066193 | 179 |
| 121 | 0.0051128 | 58 | 115 | 0.0057134 | 119 | 42 | 0.0066241 | 180 |
| 67 | 0.0051468 | 59 | 26 | 0.0057135 | 120 | 86 | 0.0067931 | 181 |
| 116 | 0.0051541 | 60 | 70 | 0.0057182 | 121 | 101 | 0.0068839 | 182 |
| 176 | 0.0051605 | 61 | 117 | 0.0057442 | 122 | 105 | 0.0071148 | 183 |
Disclaimer/Publisher’s Note: The statements, opinions and data contained in all publications are solely those of the individual author(s) and contributor(s) and not of MDPI and/or the editor(s). MDPI and/or the editor(s) disclaim responsibility for any injury to people or property resulting from any ideas, methods, instructions or products referred to in the content. |
© 2024 by the authors. Licensee MDPI, Basel, Switzerland. This article is an open access article distributed under the terms and conditions of the Creative Commons Attribution (CC BY) license (http://creativecommons.org/licenses/by/4.0/).
Copyright: This open access article is published under a Creative Commons CC BY 4.0 license, which permit the free download, distribution, and reuse, provided that the author and preprint are cited in any reuse.


