
Submitted:
07 July 2025
Posted:
08 July 2025
You are already at the latest version
Abstract
Climate change poses significant challenges to agriculture in Turkey, where diverse climatic conditions demand resilient forage crops to meet rising roughage demands. This study evaluates the performance of Hungarian vetch (Vicia pannonica Crantz), a cold- and drought-tolerant legume, to enhance sustainable forage production. Eight genotypes (Line-5, Line-16, Line-23, Line-28, Tarm White, Aegean White, Budak, and Oguz) were tested in Bilecik and Bingöl during the 2015–2016 and 2016–2017 growing seasons using a randomized complete block design with three replications. Key traits—pods per plant, thousand-seed weight, biological yield, seed yield, straw yield, and harvest index—were analyzed using GGE biplot and principal component analysis. Results showed significant variations: pods per plant ranged from 17.5 to 21.7, thousand-seed weight from 26.8 to 42.6 g, biological yield from 571.0 to 878.0 kg ha⁻¹, seed yield from 82.6 to 113.2 kg ha⁻¹, straw yield from 499.7 to 764.3 kg ha⁻¹, and harvest index from 13.9% to 21.0%. Aegean White excelled in seed yield, while Line-16 showed the highest harvest index. GGE biplot analysis highlighted harvest index as the primary variance contributor, emphasizing genotype-environment interactions for selecting adaptable cultivars for sustainable agriculture.
Keywords:
Hungarian vetch
; Vicia pannonica
; seed yield
; GGE biplot analysis
; genotype-environment interaction
; forage crops
; yield components
; climate resilience
; sustainable agriculture
1. Introduction
In the contemporary era, climate change has emerged as an urgent and formidable challenge, marked by the escalating consequences of global warming and cooling. These environmental shifts exert profound effects on agriculture and animal husbandry. In response to these pressing challenges, a key strategy for mitigation involves cultivating plant species and varieties that demonstrate resilience to these dynamic conditions. Despite the commendable support measures implemented in Turkey since the early 2000s, which have significantly increased the sowing rate of forage crops[1], the production of high-quality roughage still falls short of meeting the growing demand. Unfortunately, only a limited number of forage crops, such as clover, sainfoin, vetch, and corn, have achieved widespread adoption in the country, while the considerable potential of many other forage crops remains unexplored. In this context, Hungarian vetch emerges as a promising candidate. This annual cool-season legume fodder plant exhibits remarkable resilience to both cold and drought, thriving even in challenging conditions such as heavy clay soils [2,3]. Its unique characteristics make it indispensable for expanding forage crop cultivation within Turkey's agricultural landscape. Notably, Hungarian vetch is the only annual legume fodder plant successfully integrated into the winter cropping systems practiced across diverse regions [4,5,6].
However, the country’s geographical regions are characterized by substantial climatic variations, which profoundly influence the performance of different plant species and varieties. Unfortunately, research efforts aimed at uncovering region-specific plant diversity remain relatively inadequate, primarily due to the complex climatic variations that span both inter- and intra-regional domains. Selecting plant species with broad adaptability is central to identifying the most suitable candidates for specific regional contexts, a challenge that demands focused attention. A key aspiration of plant breeders is to develop varieties capable of thriving across diverse environmental conditions, with a particular emphasis on vital traits such as yield [7]. Over time, plant breeders, geneticists, statisticians, and researchers have integrated genetic (G) and genotype-by-environment (GE) interactions into their work, aiming to select superior genotypes through crop performance trials [8,9,10,11,12,13,14,15]. A rich array of statistical methods has been developed for GE interaction analysis, including the widely used AMMI analysis [7] and the influential GGE biplot analysis [16,17].
The biplot tool has gained growing popularity among plant breeders and agricultural researchers, primarily due to its versatility in evaluating cultivars and analyzing the complexities of mega-environments [13]. Yan et al. (2000) introduced the concept of “GGE biplots,” which are based on singular value decomposition (SVD) of environment-centered or within-environment standardized GE data. These biplots provide a comprehensive visualization of both G and GE, the two pillars of variation that are critical for cultivar evaluation [7,9,10,16]. The GGE biplot methodology [13,14,15,16,17] includes a variety of biplot interpretation methods, enabling the visual exploration of critical questions related to genotype evaluation and test-environment analysis. The primary objective of the current study is to provide a practical guide tailored to the needs of breeders, agronomists, and agricultural scientists, helping them navigate the complexities of biplot analysis [17].
Recent research highlights the intensifying impacts of climate change, with rising temperatures and erratic weather patterns significantly affecting agriculture and livestock globally [18]. In Turkey, where agriculture plays a vital role, diverse agro-ecological zones face increasing challenges, necessitating sustainable practices and resilient crop varieties [19]. Despite government efforts to boost forage crop cultivation, high-quality roughage production remains insufficient, with limited utilization of alternative crops [20].
Hungarian vetch (Vicia pannonica Crantz), a cold- and drought-tolerant annual legume, shows great potential for enhancing forage diversity, particularly in harsh conditions [21,22]. It is a key component of winter cropping systems in Turkey [23,24]. However, significant climatic variability across regions necessitates evaluations of genotypes for adaptability and yield [25]. Advances in plant breeding tools like GGE biplot analysis, which integrates genotype and environment interaction effects, have become essential for identifying stable, high-yielding genotypes [26,27]. This study evaluates Hungarian vetch genotypes in two contrasting regions, Bilecik and Bingöl, using GGE biplots to identify adaptable, high-performing genotypes, contributing to sustainable forage production in the face of climate change.
2. Materials and Methods
The Materials and Methods should be described with sufficient details to allow others to replicate and build on the published results. Please note that the publication of your manuscript implicates that you must make all materials, data, computer code, and protocols associated with the publication available to readers. Please disclose at the submission stage any restrictions on the availability of materials or information. New methods and protocols should be described in detail while well-established methods can be briefly described and appropriately cited.
Research manuscripts reporting large datasets that are deposited in a publicly available database should specify where the data have been deposited and provide the relevant accession numbers. If the accession numbers have not yet been obtained at the time of submission, please state that they will be provided during review. They must be provided prior to publication.
Interventionary studies involving animals or humans, and other studies that require ethical approval, must list the authority that provided approval and the corresponding ethical approval code.
In this section, where applicable, authors are required to disclose details of how generative artificial intelligence (GenAI) has been used in this paper (e.g., to generate text, data, or graphics, or to assist in study design, data collection, analysis, or interpretation). The use of GenAI for superficial text editing (e.g., grammar, spelling, punctuation, and formatting) does not need to be declared.
This study was conducted simultaneously in two distinct ecological settings: the Bilecik region, representing the Eastern Marmara Region, and the Bingöl region, representing the Eastern Anatolia Region, during the 2015-16 and 2016-17 growing seasons. The research material included Hungarian vetch lines (Line-5, Line-16, Line-23, and Line-28) as well as varieties developed by Bingöl University’s College of Agriculture, Field Crops Department, including Tarm White, Aegean White, Budak, and Oguz.
The experimental plots were established in October, during winter, at the research and application areas of Bingöl University’s College of Agriculture and Bilecik Şeyh Edebali University. The plot dimensions were set at 0.30 x 4 x 5 = 6 m², with a row length of 5 cm, row spacing of 30 cm, and inter-row spacing of 6 m². A randomized block design was employed for the experiments, with three replications. Fertilization was applied at the time of sowing, consisting of 3 kg of nitrogen (N) and 5-10 kg of phosphorus pentoxide (P2O5) per day.
The soil properties of the research sites are summarized in Figure 1, with technical term abbreviations provided upon their first mention. The soil in the trial area of Bilecik is predominantly sandy and loamy, with a moderately alkaline pH of 8.11 and moderate salinity at 0.26 mmhos/cm. It contains moderate levels of lime (7.3%) and organic matter (1.5%), along with lower concentrations of phosphorus (3.5 ppm) and potassium (1.1 ppm), though sufficient quantities of essential microelements are present.
In contrast, the soil in the experimental area of Bingöl is primarily loamy, with a slightly acidic pH of 6.37 and minimal salt content at 0.0006 mmhos/cm. Its organic matter content is relatively low at 1.26%, while phosphorus levels are moderate (7.9 ppm), and potassium content is relatively low at 24.45 ppm. Additionally, the Bingöl soil exhibits lower calcareous properties.
According to the data obtained from the Bilecik Provincial Meteorology Station, during the 2016-2017 research period, the average temperatures for the months of September, October, November, December, January, February, March, April, May, and June were recorded as 25.6°C, 20.0°C, 13.6°C, 7.8°C, 6.2°C, 8.2°C, 12.1°C, 17.3°C, 22.6°C, and 22.5°C, respectively. The total precipitation for these months was 26.7 mm, 51.6 mm, 39.0 mm, 54.0 mm, 46.6 mm, 43.8 mm, 50.2 mm, 49.6 mm, 41.2 mm, and 69.9 mm, respectively, while the relative humidity values were 64.8%, 70.5%, 71.9%, 76.2%, 76.4%, 73.0%, 68.3%, 64.9%, 63.2%, and 67.3%, respectively. Similarly, data from the Bingöl Meteorology Station for the same 2016-2017 research period revealed the following average temperatures for the months from September to June: 23.4°C (September), 14.3°C (October), 14.4°C (November), 1.3°C (December), -1.8°C (January), 1.9°C (February), 5.4°C (March), 10.9°C (April), 16.6°C (May), and 22.9°C (June). The total precipitation for these months was recorded as 0.8 mm, 220.9 mm, 18.9 mm, 46.2 mm, 148.2 mm, 115.8 mm, 154.4 mm, 66.7 mm, 21.2 mm, and 8.1 mm, respectively. Relative humidity values were 30.2%, 68.3%, 56.4%, 58.6%, 74.7%, 73.8%, 65.9%, 58.7%, 52.0%, and 37.0%, respectively.
Morphological and phenological observations of the plants were conducted when the lower fruits reached maturity. For seed yield and yield component analysis, harvesting was performed once the pods had completely turned yellow. Technical terms were introduced and explained as needed. The average number of pods per plant (number/plant) was calculated by counting the pods on 10 randomly selected plants from each plot. Seeds were then extracted, counted, and the number of seeds per pod was determined by dividing the total number of seeds by the total number of pods. Harvested parcels were divided into seed yield and biological yield (kg/ha) for further analysis.
3. Results and Discussion
Table 1 presents the average number of pods per plant obtained from different Hungarian vetch genotypes at the Bilecik and Bingöl locations during 2015 and 2016. The number of pods per plant is a morphological trait that directly affects seed yield [28]. Upon examining Table 1, significant statistical differences were observed in the number of pods among the genotypes across the location averages (p<0.01). Additionally, significant statistical differences were found between the years at both the Bilecik and Bingöl locations (p<0.01). However, the interaction between location and year was found to be insignificant.
The number of pods per plant is an important criterion influencing seed yield. According to the two-year average data for the Bilecik and Bingöl locations, the highest number of pods was recorded for the Oguz genotype at the Bilecik location, with an average of 24.8 pods. This was followed by the Line-23, Line-5, and Line-16 genotypes at Bilecik, with averages of 24.6, 24.0, and 23.7 pods, respectively. Conversely, the lowest number of pods was observed at the Bingöl location, with 13.2 pods for the Tarm White genotype and 13.0 pods for the Oguz genotype.
In general, the number of pods in Hungarian vetch was higher at the Bilecik location compared to Bingöl. The lower number of pods at Bingöl is attributed to the high variability in monthly average temperatures, relative humidity, and total precipitation values at this location. Considering the averages across years and locations, the highest number of pods was obtained from the Line-5 genotype, with an average of 21.7 pods, followed by the Line-23 and Line-28 genotypes, with averages of 21.6 and 21.0 pods, respectively. The lowest number of pods was recorded for the Tarm White genotype, with an average of 17.5 pods, followed by the Aegean White genotype, with 18.2 pods. The findings of this study align with previous literature. For example, [29] reported that the number of pods per plant ranged between 6.03 and 9.37 in a study conducted to determine the adaptation of some Hungarian vetch lines and varieties to the dry conditions of Bingöl. Similarly, [30] found that the number of pods per plant ranged between 18.0 and 25.8 in a study evaluating Hungarian vetch varieties as bee pasture. Furthermore, other studies reported the number of pods per plant for different Hungarian vetch genotypes to range from 17.20 to 24.35 [31], 7.5 [32], and 8.93 to 24.93 [33].
In 2015 and 2016, the average thousand grain weights (in grams) of various Hungarian vetch genotypes at the Bilecik and Bingöl locations are presented in Table 2. Thousand grain weight is a crucial trait that significantly influences seed size and yield. Its positive effects on germination, robust seedling development, and ultimately higher seed yield have been well-documented [28], highlighting the importance of determining this parameter. Table 2 reveals statistically significant differences (at the 0.01% level) in thousand grain weights among the Hungarian vetch genotypes across years, between location averages, and within location-year interactions. Notably, the highest thousand grain weight was recorded for the Oguz genotype, reaching 43.2 g in 2016-2017 and 42.1 g in 2015-2016 at the Bingöl location. In contrast, the lowest thousand grain weight was observed in the Line-23 genotype, with 25.8 g in 2016-2017, and in the Line-28 genotype, with 26.4 g at the Bingöl location.
An analysis of the two-year location interaction mean data shows that the Oguz genotype exhibited the highest thousand grain weight at the Bingöl location, registering 42.6 g. Conversely, the lowest thousand grain weights were associated with the Line-28, Line-5, and Line-23 genotypes at the Bingöl location, measuring 26.8 g, 27.3 g, and 28.2 g, respectively.
Comparative studies further emphasize the variability in thousand seed weights among Hungarian vetch lines and varieties. For instance, under Bingöl’s arid conditions, thousand seed weights ranged from 32.60 to 40.90 g [29]. Varieties evaluated as bee pastures exhibited weights between 26.3 and 38.6 g [30]. Similarly, [31] found that thousand grain weights of different Hungarian vetch genotypes varied between 32.08 and 39.15 g. In contrast, [34]determined thousand seed weights ranging from 17.3 to 34.7 g.Another study assessing seed and straw yields, as well as straw quality in various Hungarian vetch genotypes, reported thousand seed weights ranging from 25.32 to 43.23 g [35].
In 2015 and 2016, the biological yield (kg da⁻¹) derived from various genotypes of Hungarian vetch at the Bilecik and Bingöl locations is detailed in Table 3. An examination of the table reveals a statistically significant difference (at the 0.01% level) among the years, location averages, and location-year interaction averages concerning the biological yield of the Hungarian vetch genotypes at these locations. However, the mean values for the individual years did not exhibit statistical significance. Further analysis of the location-year interaction average data shows that the Aegean White genotype stood out, achieving the highest biological yield of Hungarian vetch, with 1039.9 kg da⁻¹ at the Bingöl location in 2015-2016. In contrast, the lowest biological yield was recorded for the Line-5 genotype, with 519.0 kg da⁻¹ at the Bingöl location during the same period.

Table 3.
Biological yield (kg da-1) of Hungarian vetch at both locations.
|
Genotypes |
Biological yield (kg da-1) | |||||||||
| Locations |
Mean Loc. Two |
Mean 2015 |
Mean 2016 |
Mean 2015 2016 |
||||||
| Bilecik | Bingol | |||||||||
|
2015 2016 |
2016 2017 |
Mean Loc.Bil. |
2015 2016 |
2016 2017 |
Mean Loc.Bin. |
|||||
| Tarm | 760.7 cde | 627.1 g-l | 693.9 EF | 829.3 bc | 762.6 cd | 795.9 BC | 744.9 AB | 794.9 b | 694.8 cde | 744.9 |
| Budak | 717.4 def | 693.6 d-g | 705.5 EF | 883.2 b | 648.7 f-j | 765.9 CD | 735.7 B | 800.3 b | 671.1d-g | 735.7 |
| Line-16 | 567.1klm | 587.3 ı-m | 577.2 G | 640.7 f-k | 582.0 j-m | 611.4 G | 594.3 E | 603.9 ı | 584.7 ı | 594.3 |
| Aegean | 677.4fgh | 663.8 f-ı | 670.6 F | 1039.9 a | 716.1 def | 878.0 A | 774.3 A | 858.7 a | 689.9 cde | 774.3 |
| Oguz | 624.0 g-l | 604.0 h-l | 614.0 G | 645.2 f-j | 840.9 b | 743.0 DE | 678.5 C | 634.7 f-ı | 722.5 cd | 678.5 |
| Line-23 | 664.1 f-ı | 690.3 d-g | 677.2 F | 817.5 bc | 552.0 lm | 684.8 F | 681.0 C | 740.8 c | 621.2 ghı | 681.0 |
| Line-28 | 700.7 d-g | 667.1 fgh | 683.9 F | 984.9 ab | 683.7 efg | 834.3 AB | 759.1 AB | 842.8 ab | 675.4 def | 759.1 |
| Line-5 | 710.5 def | 689.8 efg | 700.2 EF | 519.0 m | 623.1 g-l | 571.0 G | 635.6 D | 614.8 hı | 656.5 e-h | 635.6 |
| Mean | 677.8 | 652.9 | 665.3 | 795.0 | 676.1 | 735.5 | 700.4 | 736.4 | 664.5 | 700.5 |
| C.V.(%) | 4.41 | |||||||||
| LSD(gen.) | n.s. | n.s. | n.s. | n.s. | n.s. | n.s. | 33.61** | n.s. | n.s. | n.s. |
| LSD(gen.xlok.) | n.s. | n.s. | n.s. | n.s. | n.s. | 47.53** | n.s. | n.s. | n.s. | n.s. |
| LSD(gen.xyear) | n.s. | n.s. | n.s. | n.s. | n.s. | n.s. | n.s. | n.s. | 47.53** | n.s. |
| LSD(gen.xyear.xlok.) | n.s. | n.s. | n.s. | n.s. | 67.22** | n.s. | n.s. | n.s. | n.s. | n.s. |
*P≤0.05, **P≤0.01, n.s.: non significantion.
When analyzing the two-year location interaction mean data, the Aegean White genotype emerged as the top performer, with a biological yield of 774.3 kg da⁻¹, while the Line-23 genotype demonstrated the lowest biological yield, at 681.0 kg da-¹. These findings highlight the dynamic nature of biological yield in Hungarian vetch genotypes, emphasizing the importance of considering both temporal and spatial factors to gain a comprehensive understanding of the crop’s performance. In a study conducted to determine the straw yield and straw quality of some Hungarian vetch varieties, [36] reported that the biological yield varied between 188 and 264 kg da⁻¹.
In 2015 and 2016, seed yields (kg ha-1) obtained from different Hungarian vetch genotypes at Bilecik and Bingol locations are presented in Table 5. As shown in Table 5, there is a statistically significant difference (0.01%) in seed yield among different Hungarian vetch genotypes between years, locations, and location-year interaction for both Bilecik and Bingol locations. However, the mean values between years were not statistically significant. Additionally, the highest seed yield in the location-year interaction was obtained from the Aegean White genotype with 126.7 kg ha-1 in Bingol in 2016-2017, followed by Line 16 and Line 28 genotypes at the Bilecik location in 2015-16 with 124.0 and 123.3 kg ha-1, respectively. The lowest seed yield was recorded at the Bingol location with 37.5 kg ha-1 obtained from the Line 23 genotype in 2015-2016. According to the two-year location interaction mean data, the highest seed yield was obtained from the Aegean White genotype with 113.2 kg ha-1, while the lowest seed yield was obtained from the Line 23 genotype with 82.6 kg ha-1. The Hungarian vetch genotypes used in the study exhibited different responses in terms of grain yield performance in different environments, indicating the Line these genotypes may respond differently in diverse settings. This variability is estimated to be due to differences in edaphic, biotic, and abiotic factors between environments. Similarly, [37] reported the Line environmental factors lead to different performances in genotypes.
Table 4.
Seed yield (kg da-1) of Hungarian vetch at both locations.
|
Genotypes |
Seed yield (kg da-1) | |||||||||
|
Locations |
Mean Loc. Two |
Mean 2015 |
Mean 2016 |
Mean 2015 2016 |
||||||
| Bilecik | Bingol | |||||||||
|
2015 2016 |
2016 2017 |
Mean Loc.Bil. |
2015 2016 |
2016 2017 |
Mean Loc.Bin. |
|||||
| Tarm | 122.0ab | 90.1 fgh | 106.0 AB | 55.9ı | 85.3 gh | 70.6 FG | 88.3 CD | 88.9 d-g | 87.7 d-g | 88.3 |
| Budak | 122.0 ab | 98.0fgh | 110.0 AB | 61.0 ı | 102.0 d-g | 81.5 DEF | 95.8 BC | 91.5 def | 100.0 bcd | 95.8 |
| Line-16 | 124.0 a | 101.6 d-g | 112.8 A | 87.1 gh | 93.7 fgh | 90.4 CD | 101.6 B | 105.5 abc | 97.6 cde | 101.6 |
| Aegean | 122.3 ab | 103.2 c-g | 112.8 A | 100.7 efg | 126.7 a | 113.7 A | 113.2 A | 111.5 ab | 114.9 a | 113.2 |
| Oguz | 102.3 d-g | 96.4 fgh | 99.4 BC | 57.6 ı | 117.0 a-e | 87.3 DE | 93.3 BC | 79.9 fg | 106.7 abc | 93.3 |
| Line-23 | 118.7 a-d | 92.4 fgh | 105.6 AB | 37.5 j | 82.0 h | 59.7 G | 82.6 D | 78.1 g | 87.2 efg | 82.6 |
| Line-28 | 123.3 a | 105.5 b-f | 114.4 A | 65.8 ı | 88.7 fgh | 77.3 EF | 95.8 BC | 94.6 cde | 97.1 cde | 95.8 |
| Line-5 | 119.7 abc | 98.1 fgh | 108.9 AB | 55.8 ı | 87.0 gh | 71.4 F | 90.1 CD | 87.7 d-g | 92.5 de | 90.1 |
| Mean | 119.3 | 98.2 | 108.7 | 65.2 | 97.8 | 81.5 | 95.1 | 92.2 | 97.9 | 95.1 |
| C.V.(%) | 7.49 | |||||||||
| LSD(gen.) | n.s. | n.s. | n.s. | n.s. | n.s. | n.s. | 7.756** | n.s. | n.s. | n.s. |
| LSD(gen.xlok.) | n.s. | n.s. | n.s. | n.s. | n.s. | 10.97** | n.s. | n.s. | n.s. | n.s. |
| LSD(gen.xyear) | n.s. | n.s. | n.s. | n.s. | n.s. | n.s. | n.s. | n.s. | 10.97** | n.s. |
| LSD(gen.xyea.xlok.) | n.s. | n.s. | n.s. | n.s. | 15.51** | n.s. | n.s. | n.s. | n.s. | n.s. |
The research findings emphasize the significant effect of genotype-environment interaction on seed yield in Hungarian vetch. Consistent with our results, many researchers have found the Line genotype-environment interactions are important for seed yield in various forage crops [38,39,40]. However, genotype-environment interactions varied among locations and sowing years. As in our study, many researchers concluded tLine genotype-location and genotype-location-year interactions were more important than genotype-year interactions [41,42]. Consistent with our findings, [43] reported seed yields of 12 different Hungarian vetch genotypes at five different locations in the Southeastern Anatolia Region of Turkey between 0.46 and 1.10 t ha-1. [40] emphasized tLine seed yields of seven different Hungarian vetch genotypes varied between 0.54 and 0.76 t ha-1 at three different locations in the Thrace Region of Turkey.
In 2015 and 2016, the straw yields (kg da⁻¹) obtained from different Hungarian vetch genotypes at the Bilecik and Bingöl locations are presented in Table 5. As shown in the table, there is a statistically significant difference (at the 0.01% level) between years, between locations, and between location-year interaction averages in terms of the straw yields of distinct Hungarian vetch genotypes from Bilecik and Bingöl. However, the mean values for the individual years were not found to be statistically significant. According to the mean data for the location-year interactions, the highest straw yield was obtained from the Aegean White genotype, with 939.2 kg da⁻¹ in 2015-2016 at the Bingöl location, followed by the Line-28 genotype, which achieved 919.1 kg da⁻¹ in 2015-2016 at the Bingöl location. The lowest straw yield was recorded for the Line-16 genotype, with 443.1 kg da⁻¹ at the Bilecik location in 2015-2016. The two-year location interaction mean data ranged from 661.1 kg da⁻¹ to 492.7 kg da⁻¹.
Table 5.
Straw yield (kg da-1)of Hungarian vetch at both locations.
|
Genotypes |
Straw yield (kg da-1) | |||||||||
|
Locations |
Mean Loc. Two |
Mean 2015 |
Mean 2016 |
Mean 2015 2016 |
||||||
| Bilecik | Bingol | |||||||||
|
2015 2016 |
2016 2017 |
Mean Loc.Bil. |
2015 2016 |
2016 2017 |
Mean Loc.Bin. |
|||||
| Tarm | 638.7ef | 537.0 g-k | 587.6 EF | 773.4 bc | 677.2 de | 725.3 AB | 656.6 A | 706.0ab | 607.1 de | 656.6 |
| Budak | 595.4fg | 595.6 fg | 595.5 EF | 822.1 b | 546.6 g-j | 684.4 BC | 639.9 A | 708.8 ab | 571.1def | 639.9 |
| Line-16 | 443.1 l | 485.7 ı-l | 464.4 J | 553.6 ghı | 488.3 ı-l | 520.9 GHI | 492.7 D | 498.4 g | 487.0 g | 492.7 |
| Aegean | 555.1 ghı | 560.6 f-ı | 557.9 FGH | 939.2a | 589.4 fg | 764.3 A | 661.1 A | 747.2 a | 575.0 def | 661.1 |
| Oguz | 521.7g-k | 507.7 h-l | 514.7 HIJ | 587.6 fgh | 723.9 cd | 655.8 CD | 585.2 B | 554.7 ef | 615.7 cd | 585.2 |
| Line-23 | 545.5 g-j | 597.9 fg | 571.7 EFG | 780.1 bc | 470.0 jkl | 625.0 DE | 598.3 B | 662.7 bc | 533.9 fg | 598.4 |
| Line-28 | 577.3 fgh | 561.6 f-ı | 569.5 FG | 919.1 a | 595.0 fg | 757.1 A | 663.3 A | 748.2 a | 578.3 def | 663.3 |
| Line-5 | 590.9 fg | 591.8 fg | 591.3 EF | 463.2 kl | 536.1g-k | 499.7 IJ | 545.5 C | 527.0 fg | 563.9 def | 545.5 |
| Mean | 558.5 | 554.7 | 556.6 | 729.8 | 578.3 | 654.1 | 605.3 | 644.1 | 566.5 | 605.3 |
| C.V.(%) | 5.26 | |||||||||
| LSD(gen.) | n.s. | n.s. | n.s. | n.s. | n.s. | n.s. | 34.65** | n.s. | n.s. | n.s. |
| LSD(gen.xlok.) | n.s. | n.s. | n.s. | n.s. | n.s. | 49.01** | n.s. | n.s. | n.s. | n.s. |
| LSD(gen.xyear) | n.s. | n.s. | n.s. | n.s. | n.s. | n.s. | n.s. | n.s. | 49.01** | n.s. |
| LSD(gen.xyea.xlok.) | n.s. | n.s. | n.s. | n.s. | 69.31** | n.s. | n.s. | n.s. | n.s. | n.s. |
*P≤0.05, **P≤0.01, n.s.: non significantion.
In a study conducted by [29], seed and straw yields of some Hungarian vetch lines and varieties grown under the dry conditions of Bingöl were reported to range from 46.13 to 58.15 kg da⁻¹ for seed yield and from 204.9 to 266.1 kg da⁻¹ for straw yield. Similarly, in a study by [35] that aimed todetermine the seed and straw yields as well as straw qualities of some Hungarian vetch genotypes, seed yields ranged from 35.4 to 126.7 kg da⁻¹, while straw yields ranged from 463.2 to 1110.0 kg da⁻¹. On the other hand,[30] reported that the seed yields of some Hungarian vetch varieties established as bee pastures were 22.5 kg da⁻¹, while [36] reported straw yields of 204 kg da⁻¹ in a study conducted to determine the straw yield and straw quality of some Hungarian vetch varieties.
The harvest index, a crucial indicator of resource utilization efficiency, was evaluated for various Hungarian vetch genotypes cultivated at the Bilecik and Bingöl locations during 2015 and 2016. As depicted in Table 6, a statistically significant difference (at the 0.01% level) was observed in the harvest index across years, location means, and location-year interaction averages for Hungarian vetch genotypes from both Bilecik and Bingöl. However, no statistically significant differences were detected in the mean values across years. The observed variability in the harvest index among Hungarian vetch genotypes is likely attributed to a complex interplay of environmental factors, including altitude, soil type, temperature variations, annual rainfall patterns, and other agro-climatic conditions.
The highest harvest index, reaching an impressive 28.1%, was achieved by the Line-16 genotype in 2015-2016 at the Bilecik location. Conversely, the lowest harvest index, a mere 4.8%, was recorded for the Line-23 genotype in 2015-2016 at the Bingöl location. The two-year location interaction mean data revealed that the Line-16 genotype consistently exhibited the highest harvest index (21.0%), while the Tarm White genotype exhibited the lowest harvest index (13.9%).
The relationship between observations and variables collected at the two distinct locations was examined with precision using biplot analysis, a methodology that incorporates the decomposition technique of principal component analysis (PCA). The outcomes of this rigorous analysis are elegantly presented in Figure 2. Prior todelving into the PCA findings, Figure 2 presents the correlation coefficient heat map matrix between normalized traits, which serves as the foundation of the PCA. The variables employed in the analysis included the number of pods per plant (PodsNmbr), thousand-grain weight (g) (Wghtperthsnd), biological yield (kg da⁻¹) (BlgclYld), seed yield (kg da⁻¹) (SeedYld), straw yield (kg da⁻¹) (StrawYld), and harvest index (%) (HrvstIndx). The color scheme indicates that the strength of the relationship between traits intensifies as the shade transitions towards red. In this context, the most pronounced association exists between biological yield (BlgclYld) and straw yield (StrawYld), with a correlation value of 0.98 (p < 0.000). This is followed by the positive relationship between seed yield (SeedYld) and harvest index (HrvstIndx) (0.872, p < 0.000), and the negative correlation between harvest index (HrvstIndx) and straw yield (StrawYld) (-0.712, p < 0.000). The majority of the pairwise associations attained statistical significance. Examining the heat map reveals that the weakest association is between thousand-grain weight (Wghtperthsnd) and other traits.
The entire variance distribution across the major component dimensions is shown in Figure 3. Among the plant features assessed at the two locations in Turkey, the first three principle components explain an astounding 92% of the total variance, while the first two principal components notably capture nearly 79% of the whole variance. Normalized plant traits and linear combinations of eigenvectors are two fundamental elements that can be reasonably attributed to the observed differences in plant traits, given the significant variance described by the initial principal components. The visual examination of intricate multivariate datasets, however, is made possible by the well-known graphical method known as biplot analysis. Its main purpose is to make complex multidimensional data easier to grasp by displaying it in a lower-dimensional graphical format. This allows for a more thorough comprehension of the dataset's underlying structure. Scores and loadings are the two basic parts of a conventional biplot. A biplot's scores are shown as points, each of which represents a distinct dataset observation related to the multiple variables being studied. These scores make it possible to see where each observation falls inside the multivariate space that the variables describe. On the other hand, loadings are shown graphically in the biplot as arrows or vectors. These vectors show how each variable affects where data points are located along the x-axis, which is the first principal component, the y-axis, or any other chosen components of interest. By indicating the relationships between variables, the loadings are essential in illuminating the relative importance of the various variables in the dataset. They also show the underlying data structure and provide insights into how ratings are constructed [13]. In conclusion, biplot analysis becomes a potent analytical technique for gaining a deeper comprehension of the crucial interactions between variables in a dataset as well as the core of its observations when combined with PCA decomposition. Since all of this is done within the context of an easily readable graphical depiction, it is a useful tool for data exploration and analysis [14].
A detailed analysis of the results presented in Figure 4, particularly focusing on the first two largest eigen values, Dim1 (x-axis) and Dim2 (y-axis), reveals that these two principal components account for a significant portion of the variance among multiple factors. Dim1 (the first principal component) exhibits a distinct spatial pattern, with Bilecik generally positioned in the positive region and Bingöl occupying both positive and negative regions. This pattern, coupled with the overlapping regions observed along the Dim2 axis (the second principal component), suggests a strong likelihood of environmental interactions influencing Hungarian vetch plant traits. Focusing on the Hungarian vetch characteristics, the number of pods per plant (PodsNmbr), harvest index (HrvstIndx), and seed yield (SeedYld) exhibit close relationships, collectively contributing significantly to the total variance explained by the first principal component. Conversely, straw yield (StrawYld) and biological yield (BlgclYld) likely exert a substantial negative influence on the first principal component. Consistent with the findings from the heat map, the thousand-grain weight trait (WghtPerThsnd) displays an orthogonal relationship to the first principal component. Regarding the second principal component, all six characteristics contribute negatively. The loadings for the first principal component range from -0.488 (StrawYld) to +0.521 (HrvstIndx), while those for the second principal component range from -0.130 (PodsNmbr) to -0.617 (WghtPerThsnd). These loading values clearly indicate that the absence of the thousand-grain weight (WghtPerThsnd) would strongly impact the second principal component, while the harvest index (HrvstIndx) emerges as the most influential characteristic shaping the first principal component.
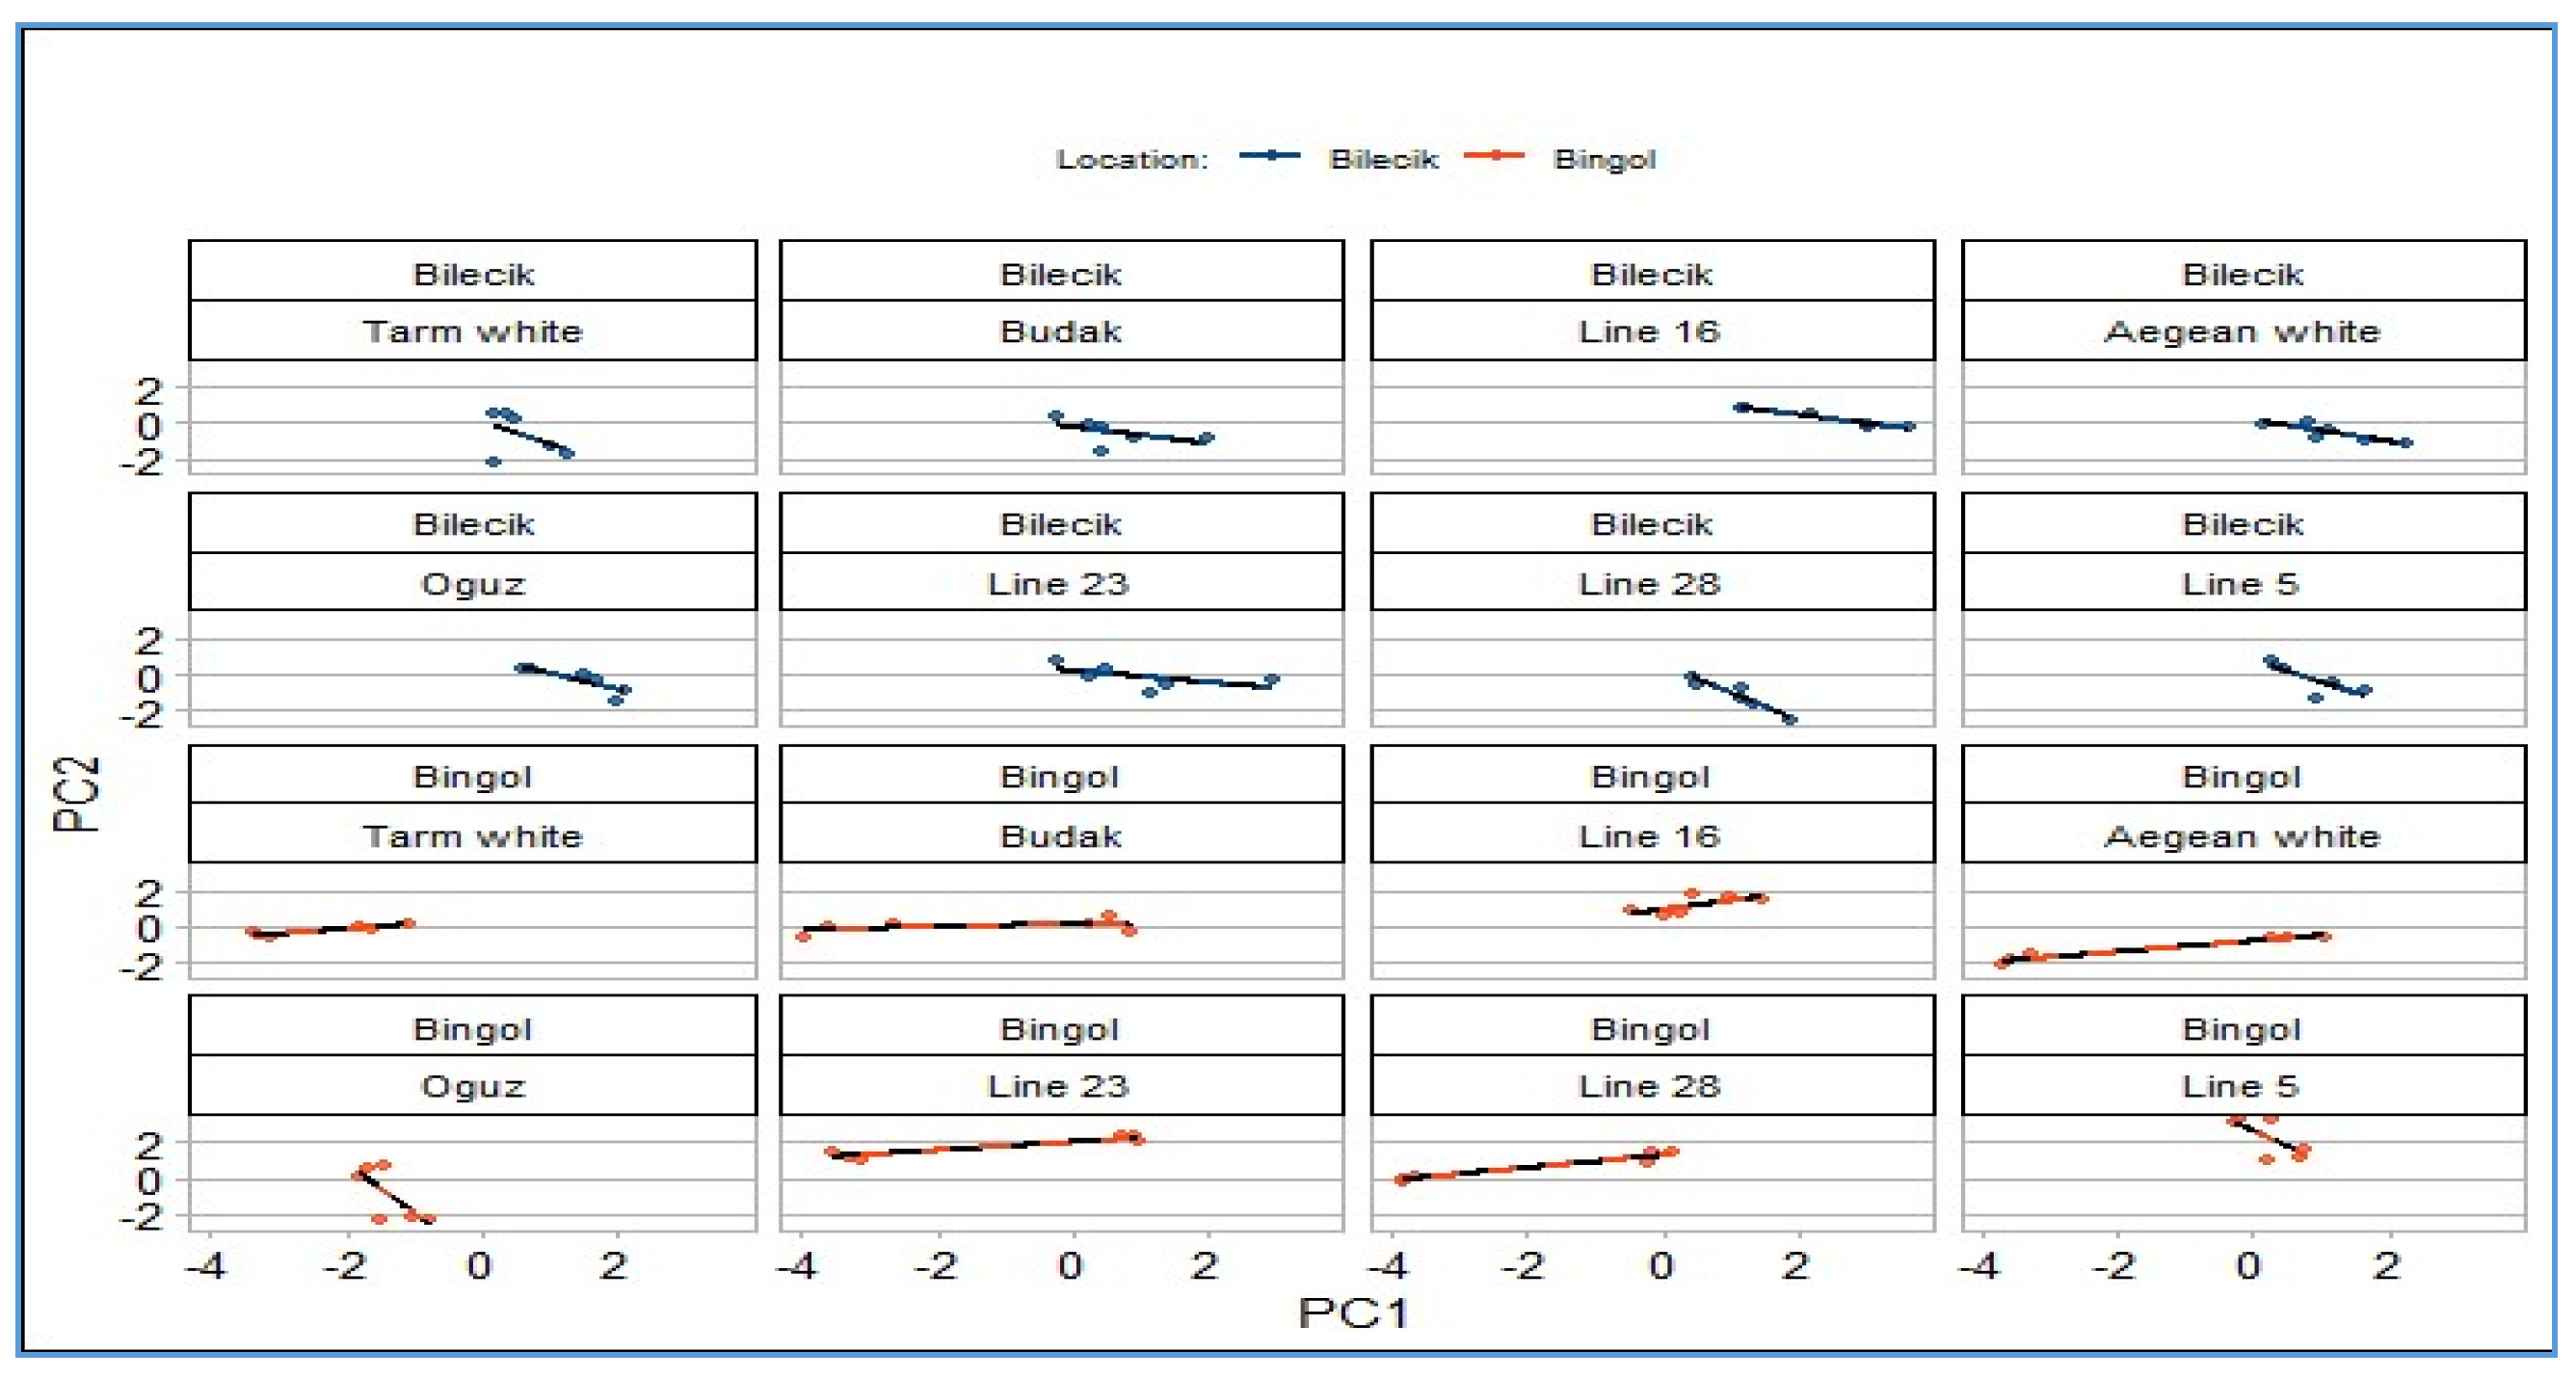
Figure 5 and Figure 6 thoughtfully illustrate the relationship between genotypes and principal components in the two distinct locations. The analysis of genotype-environment interactions revealed distinct patterns at the Bilecik and Bingöl locations. At the Bilecik location, all genotypes exhibited a negative relationship with both the first and second principal components. This trend was particularly pronounced in Line-5 and Line-28, which displayed steeper negative slopes. In contrast, at the Bingöl location, all genotypes, except Oguz and Line-5, demonstrated positive associations with both principal components. The contrasting linearity patterns of the principal components for genotypes other than Oguz and Line-5 were observed at both locations. This variation is thought to be due to differential environmental effects, such as variations in temperature, precipitation, and relative humidity between the two locations.
Figure 5.
Determination of ideal traits by biplot method in distinct locations.
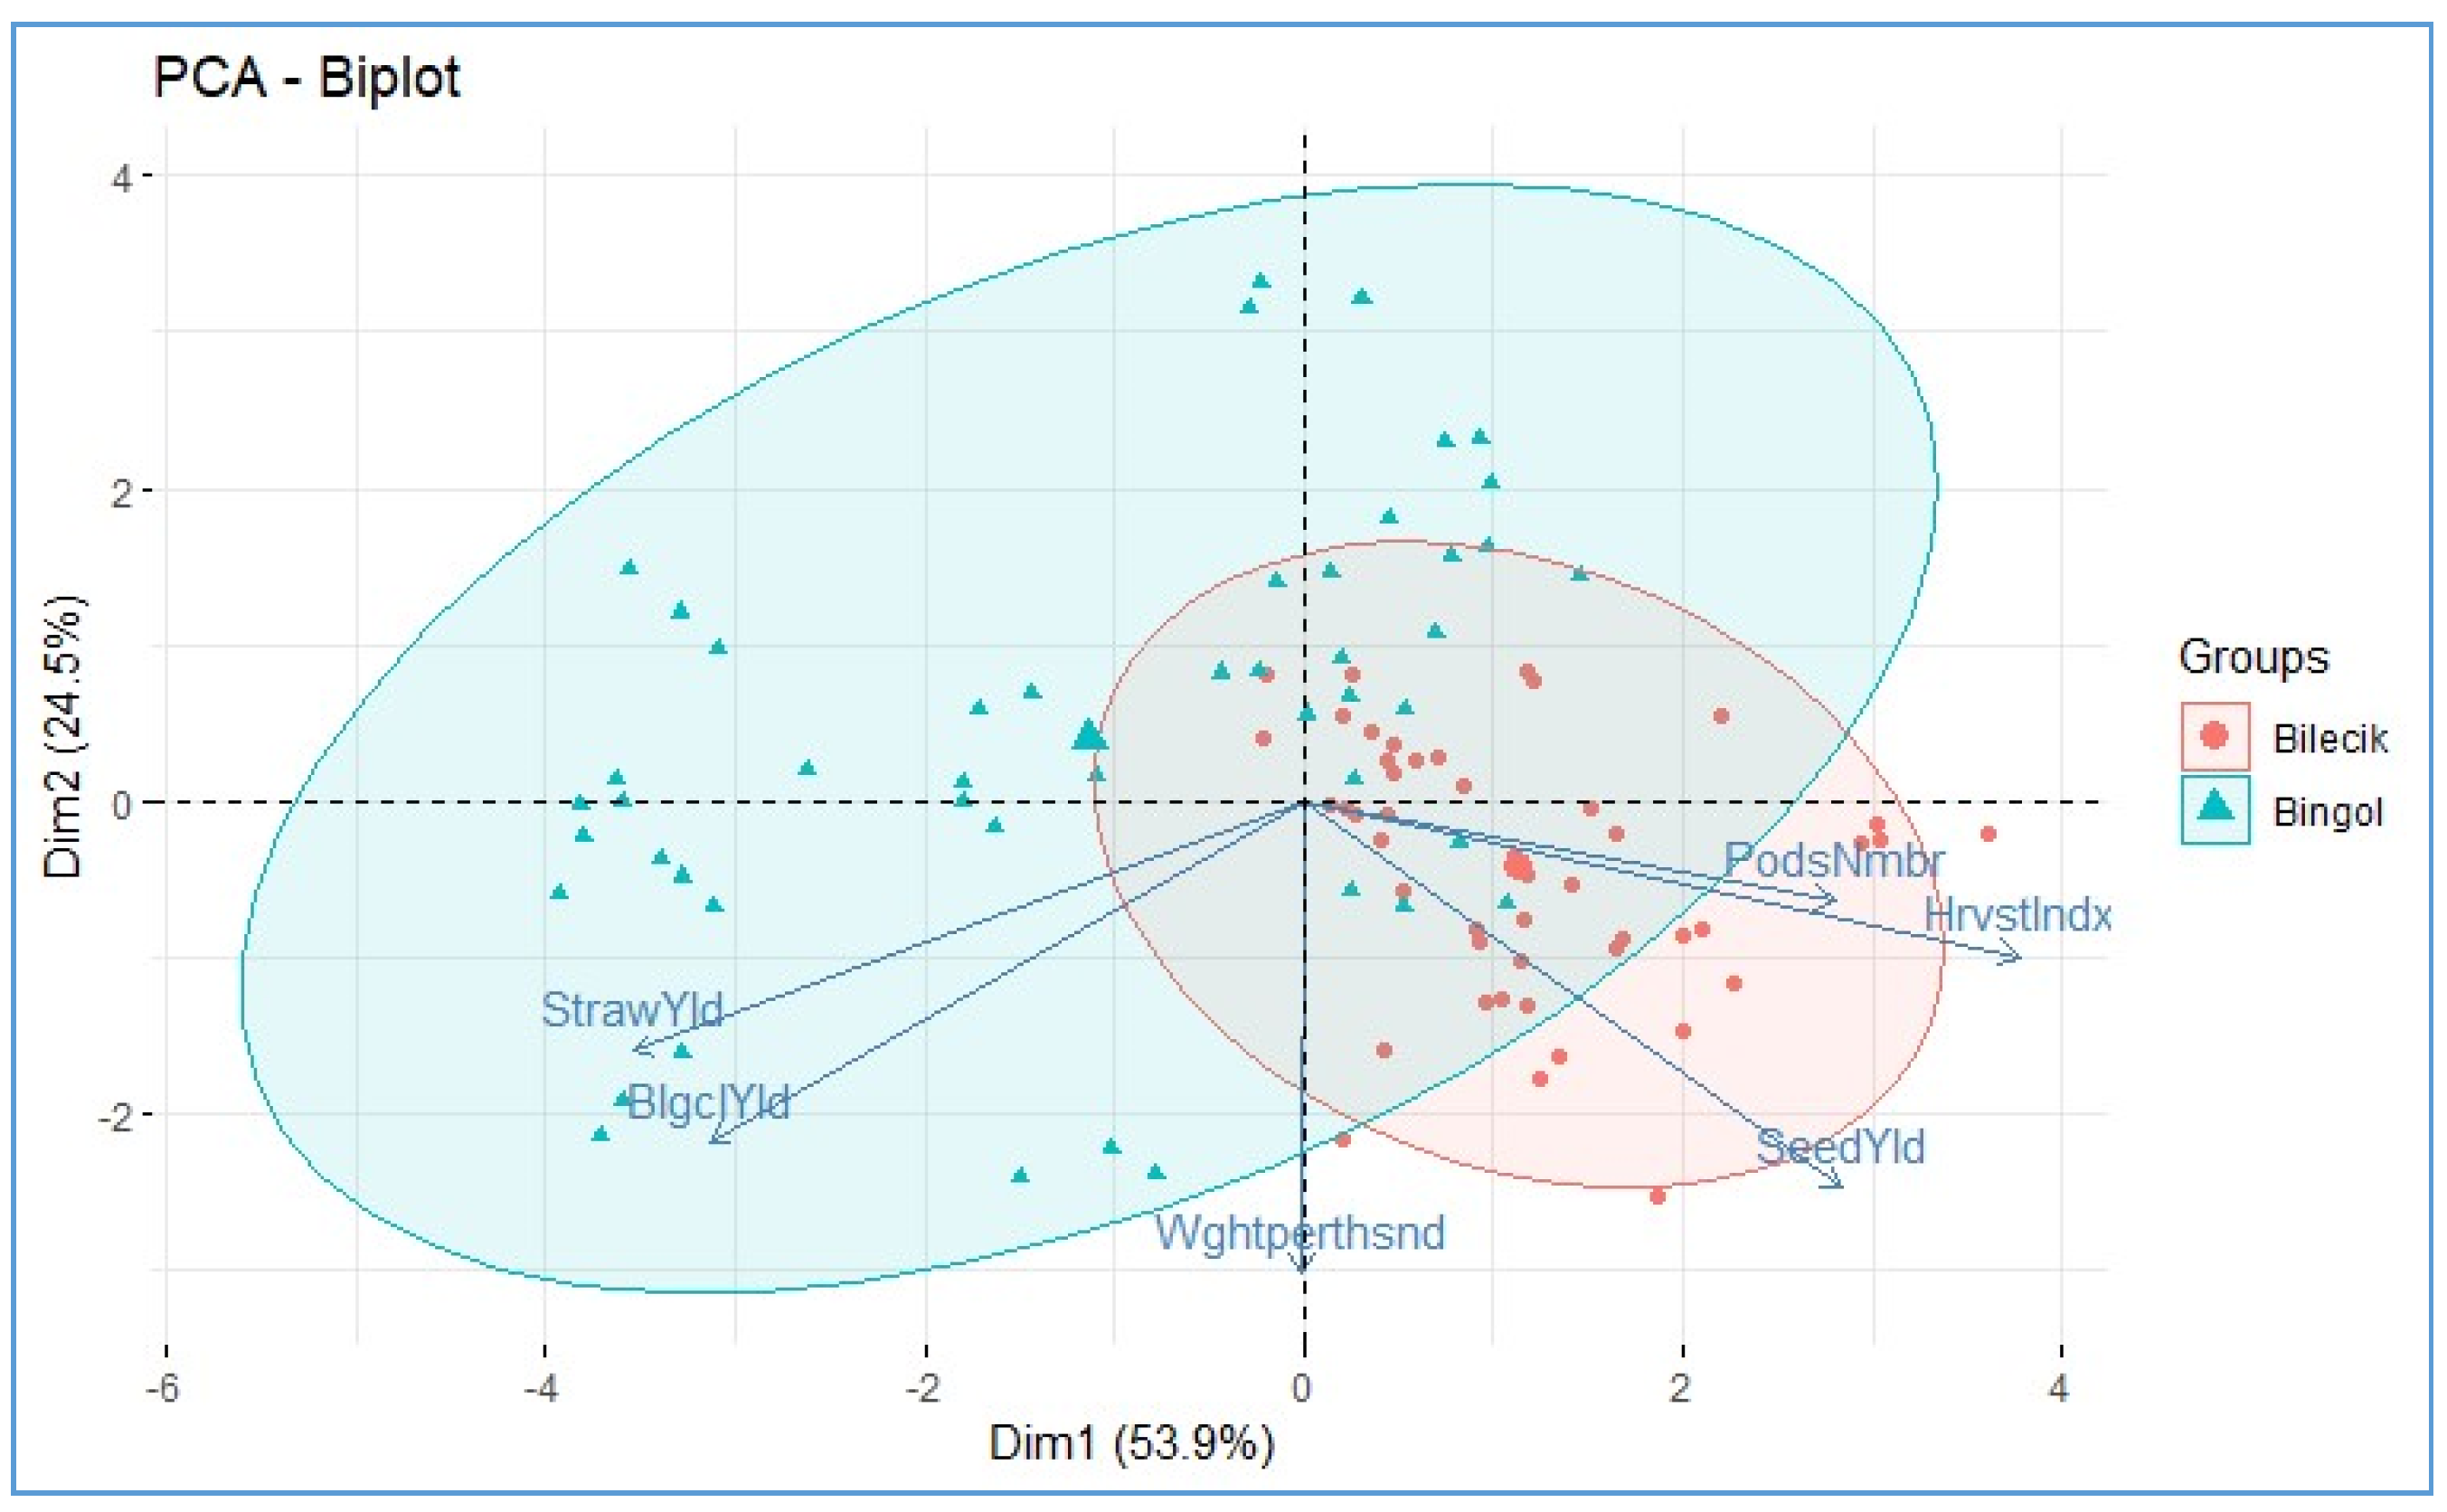
Figure 6.
Determination of ideal traits by biplot method in distinct genotypes.
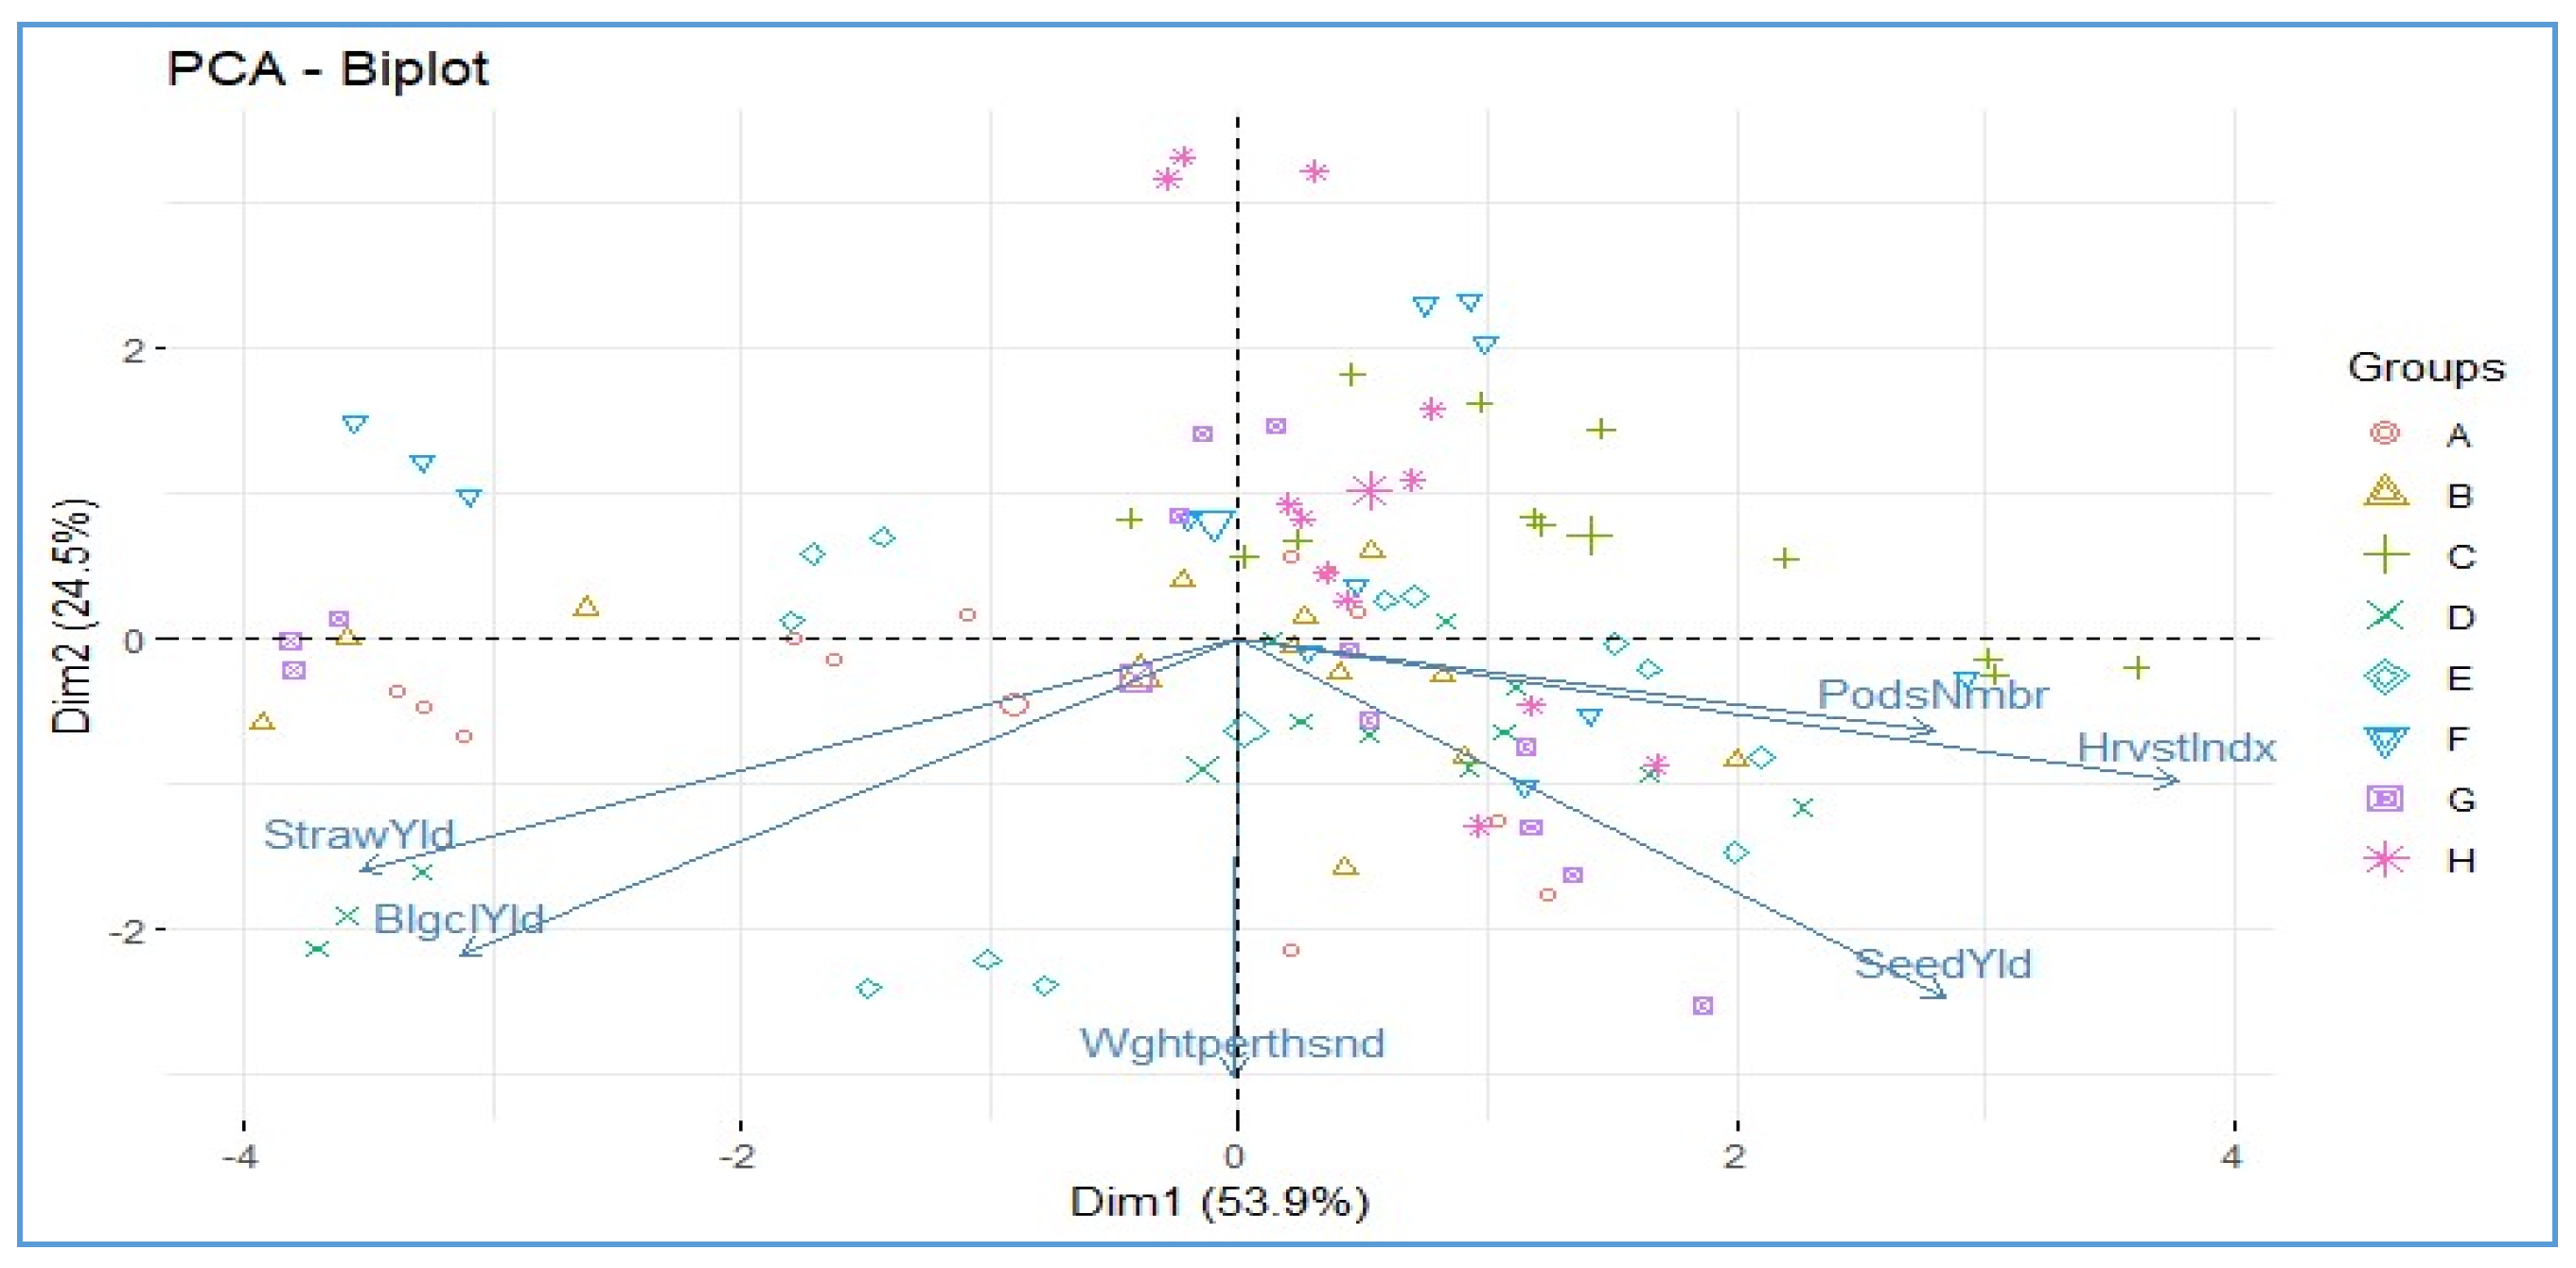
Figure 7.
Distribution of the first two principal components in compliance with location and genotypes.
Figure 7.
Distribution of the first two principal components in compliance with location and genotypes.
4. Conclusions
This study examined seed yield and its components in Hungarian vetch genotypes across two environments, Bilecik and Bingöl, using GGE Biplot analysis. At Bilecik, genotypes Oguz, Line-23, Line-5, and Line-16 excelled in the number of pods per plant, with Line-16 achieving the highest harvest index, indicating efficient biomass allocation to seeds. Thousand-grain weight was consistent across locations, with Oguz performing best. In Bingöl, biomass production was higher, with Aegean White and Line-28 leading in biological and straw yield. Despite similar yields across locations, Aegean White had the highest overall seed yield, showing adaptability to diverse environments. Biplot and principal component analyses revealed strong correlations at Bilecik, particularly between harvest index, pods per plant, and seed yield for Line-16 and Line-5. The harvest index was the largest contributor to variance, followed by biological and straw yield, while thousand-grain weight had a smaller effect. These findings highlight the importance of genotype-environment interactions in shaping yield traits and demonstrate the utility of GGE Biplot analysis in identifying suitable cultivars for specific regions, aiding improved agricultural practices.
Data Availability
The dataset generated and analyzed during this study is available in the Bona Res Data Centre repository or upon reasonable request from the corresponding author.
Conflicts of Interest
The authors declare no competing interests.
References
- TÜİK. Crop Production Statistics. Available online: http://www.tuik.gov.tr/PreTablo.do?alt_id=1001 (accessed on 16 April 2015).
- Açıkgöz, E. Forage Crops; Uludağ University Foundation Publication No: 182: Bursa, Turkey, 2001; pp. 1–300.
- Balabanlı, C. Hungarian Vetch. In Forage Crops: Legume Forage Crops Volume II; Avcıoğlu, R., Lineipoğlu, R., Karadağ, Y., Eds.; Republic of Turkey Ministry of Agriculture and Rural Affairs Publications: İzmir, Turkey, 2009; Volume 2, pp. 417–420. [Google Scholar]
- Tükel, T.; Sağlamtimur, T.; Gülcan, H.; Tansi, V.; Baytekin, H.; Güneydoğu Anadolu Bölgesinde yem bitkileri adaptasyonu üzerinde araştırmalar. GAP Bölge Kalkınma İdaresi Başkanlığı Yayınları. Available online: http://www.gap.gov.tr/turkish/tarim/tarastir/adapt.html (accessed on 16 April 2015).
- Başbağ, M.; Saruhan, V.; Gül, İ. Diyarbakır koşullarında bazı tek yıllık baklagil yem bitkilerinin adaptasyonu üzerine bir araştırma. In Proceedings of the Türkiye 4. Tarla Bitkileri Kongresi, Tekirdağ, Türkiye, 17–21 September 2001; Volume 3, pp. 169–173. [Google Scholar]
- Sayar, M.S.; Tekdal, S.; Han, Y.; Yasak, M.Ş.; Anlarsal, A.E.; Başbağ, M.; Gül, İ. Diyarbakır koşullarında bazı macar fiği (Vicia pannonica Crantz.) genotiplerinin verim ve verim unsurlarının belirlenmesi. In Proceedings of the Dicle Üniversitesi, Uluslararası Katılımlı Kamu Üniversite-Sanayi İşbirliği Sempozyumu, Diyarbakır, Türkiye, 24–26 May 2010; pp. 351–356. [Google Scholar]
- Gauch, H.G.; Zobel, R.W. AMMI analysis of yield trials. In Genotype-by-Environment Interaction; Kang, M.S., Gauch, H.G., Eds.; CRC Press: Boca Raton, FL, USA, 1996; pp. 85–122. [Google Scholar]
- Barah, B.C.; Binswanger, H.P.; Rana, B.S.; Rao, N.G.P. The use of risk aversion in plant breeding; concept and application. Euphytica 1981, 30, 451–458. [Google Scholar] [CrossRef]
- Kang, M.S. A rank-sum method for selecting high-yielding, stable corn genotypes. Cereal Res. Commun. 1988, 16, 113–115. [Google Scholar]
- Kang, M.S. Simultaneous selection for yield and stability in crop performance trials: Consequences for growers. Agron. J. 1993, 85, 754–757. [Google Scholar] [CrossRef]
- Eskridge, K.M. Selection of stable cultivars using a safety-first rule. Crop Sci. 1990, 30, 369–374. [Google Scholar] [CrossRef]
- Kang, M.S.; Pham, H.N. Simultaneous selection for high yielding and stable crop genotypes. Agron. J. 1991, 83, 161–165. [Google Scholar] [CrossRef]
- Yan, W.; Hunt, L.A.; Sheng, Q.; Szlavnics, Z. Cultivar evaluation and mega-environment investigation based on GGE biplot. Crop Sci. 2000, 40, 597–605. [Google Scholar] [CrossRef]
- Yan, W. GGEBiplot—A Windows application for graphical analysis of multi-environment trial data and other types of two-way data. Agron. J. 2001, 93, 1111–1118. [Google Scholar] [CrossRef]
- Yan, W. Singular-value partition for biplot analysis of multienvironment trial data. Agron. J. 2002, 94, 990–996. [Google Scholar] [CrossRef]
- Yan, W.; Kang, M.S. GGE Biplot Analysis: A Graphical Tool for Breeders, Geneticists, and Agronomists; CRC Press: Boca Raton, FL, USA, 2003; pp. 1–288. [Google Scholar]
- Yan, W.; Tinker, N.A. Biplot analysis of multi-environment trial data: Principles and applications. Can. J. Plant Sci. 2006, 86, 623–645. [Google Scholar] [CrossRef]
- IPCC. Climate Change 2021: Impacts, Adaptation, and Vulnerability; Intergovernmental Panel on Climate Change: Geneva, Switzerland, 2021; pp. 1–1000. [Google Scholar]
- FAO. Climate Change and Agriculture in Turkey: Challenges and Opportunities; FAO Reports: Rome, Italy, 2022; pp. 1–100. [Google Scholar]
- TÜİK. Agricultural Production Statistics; Turkish Statistical Institute Publications: Ankara, Turkey, 2023; pp. 1–100. [Google Scholar]
- Açıkgöz, N.; Gül, İ.; Kaya, M. Resilient forage crops for sustainable agriculture. Turk. J. Agric. 2020, Volume not specified, page range not specified.
- Balabanlı, C.; Kaya, M. Hungarian vetch as a sustainable forage crop in Turkey. J. Sustain. Agric. 2021, Volume not specified, page range not specified.
- Başbağ, M.; Gül, İ.; Kökten, K. Winter cropping systems and the role of Hungarian vetch. Agric. Clim. Res. 2020, Volume not specified, page range not specified.
- Sayar, M.S.; Başbağ, M.; Kökten, K. Hungarian vetch: A key crop for sustainable forage production. J. Agric. Sci. 2022, Volume not specified, page range not specified.
- Kaya, M.; Balabanlı, C.; Açıkgöz, N. Regional climate impacts on forage crop performance in Turkey. Turk. J. Field Crops 2021, Volume not specified, page range not specified.
- Yan, W.; Tinker, N.A. GGE biplot analysis: Concepts and applications. Agron. J. 2020, Volume not specified, page range not specified. [CrossRef]
- Gauch, H.G.; Piepho, H.P.; Annicchiarico, P. Advances in AMMI and GGE biplot analysis for crop evaluation. Crop Sci. 2021, Volume not specified, page range not specified. [CrossRef]
- Tenikecier, H.S. Forage and seed yield, relationships among its characters in some grass pea (Lathyrus sativus L.) genotypes. J. Agric. Fac. Gaziosmanpasa Univ. 2020, 37, 152–158. [Google Scholar] [CrossRef]
- Bakoglu, A.; Kökten, K.; Karadavut, U. A study on the adaptation of some Hungarian vetch (Vicia pannonica Crantz. In ) lines and varieties to the dry conditions of Bingöl. In Proceedings of the 3rd Bingöl Symposium, Bingöl, Türkiye, 17–19 September 2010; pp. 93–99. [Google Scholar]
- Kutlu, M.A.; Uçar, R.; Özdemir, S.; Ekmekçi, M.; Mokhtarzadeh, S.; Kökten, K.; Çaçan, E. Determination of some yield characteristics of Hungarian vetch varieties and their evaluation as bee pasture. Bee Stud. 2022, 14, 1–7. [Google Scholar] [CrossRef]
- Tenikecier, H.S.; Orak, A.; Deveci, S.; Gültekin, B. Determination of seed yield and its some characters of some Hungarian vetch (Vicia pannonica Crantz. ) genotypes. Curr. Trends Nat. Sci. 2021, 10, 401–406. [Google Scholar] [CrossRef]
- Unal, S.; Mutlu, Z.; Fırıncıoğlu, H.K. Performances of some winter Hungarian vetch accessions (Vicia pannonica Crantz) on the highlands of Turkey. Turk. J. Field Crops 2011, 16, 1–8. [Google Scholar]
- Sayar, M.S. Path coefficient and correlation analysis between forage yield and its affecting components in common vetch (Vicia sativa L.). Legume Res. 2014, 37, 445–452. [Google Scholar] [CrossRef]
- Naydenova, G.K.; Aleksieva, A.K. Phenotypic performance and genotypic variance for reproductive characteristics in Hungarian vetch (Vicia pannonica Crantz). Rom. Agric. Res. 2014, 31, 69–74. [Google Scholar]
- Ozdemir, S.; Kökten, K. Determination of seed and cutting yields and cutting qualities of some Hungarian vetch (Vicia pannonica Crantz. ) genotypes. Turk. J. Agric. Nat. Sci. 2022, 9, 524–534. [Google Scholar]
- Ucar, R.; Ekmekçi, M.; Çaçan, E.; Özdemir, S.; Kökten, K.; Kutlu, M.A.; Mokhtarzadeh, S. Evaluation of Hungarian vetch (Vicia pannonica Crantz) varieties in terms of cut yield and cut quality. ADYUTAYAM 2022, 10, 75–82. [Google Scholar]
- Fehr, W.R. Genotype × environment interaction. In Principles of Cultivar Development: Theory and Techniques; Fehr, E.L., Jessen, H.J., Eds.; Iowa State University: Ames, IA, USA, 1993; pp. 247–260. Available online: https://lib.dr.iastate.edu/agron_books/1 (accessed on 16 April 2015).
- Albayrak, S. , Sevimay, C. S., & Tongel, Ö. Effects of environmental factors and genotype × environment interactions on seed yield and yield components of forage crops. Journal of Agronomy and Crop Science. 2005, 191, 206–210. [Google Scholar]
- Açıkgöz, E.; Ustun, A.; Gul, I.; Anlarsal, A.E.; Tekeli, A.S.; Nizam, I.; Avcioglu, R. Genotype × environment interaction and stability analysis for dry matter and seed yield in field pea (Pisum sativum L.). Span. J. Agric. Res. 2009, 7, 96–106. [Google Scholar] [CrossRef]
- Nizam, İ.; Cubuk, M.G.; Moralar, E. Genotype × environment interaction and stability analysis of some Hungarian vetch (Vicia pannonica Crantz. ) genotypes. Afr. J. Agric. Res. 2011, 6, 6119–6125. [Google Scholar] [CrossRef]
- Akcura, M.; Kaya, Y.; Taner, S. Genotype-environment interaction and phenotypic stability analysis for grain yield of durum wheat in Central Anatolian Region. Turk. J. Agric. For. 2005, 29, 369–375. [Google Scholar]
- Ezzat, E.M.; Ali, M.A.; Mahmoud, A.M. Agronomic performance, genotype x environment interactions and stability analysis of grain sorghum (Sorghum bicolor L. Moench). Asian J. Crop Sci. 2010, 2, 250–260. [Google Scholar] [CrossRef]
- Sayar, M.S.; Anlarsal, A.E.; Başbağ, M. Genotype—environment interactions and stability analysis for dry-matter yield and seed yield in Hungarian vetch (Vicia pannonica Crantz. ). Turk. J. Field Crops 2013, 18, 238–246. [Google Scholar]
Figure 1.
Some physical and chemical properties of the soils of the trial areas.
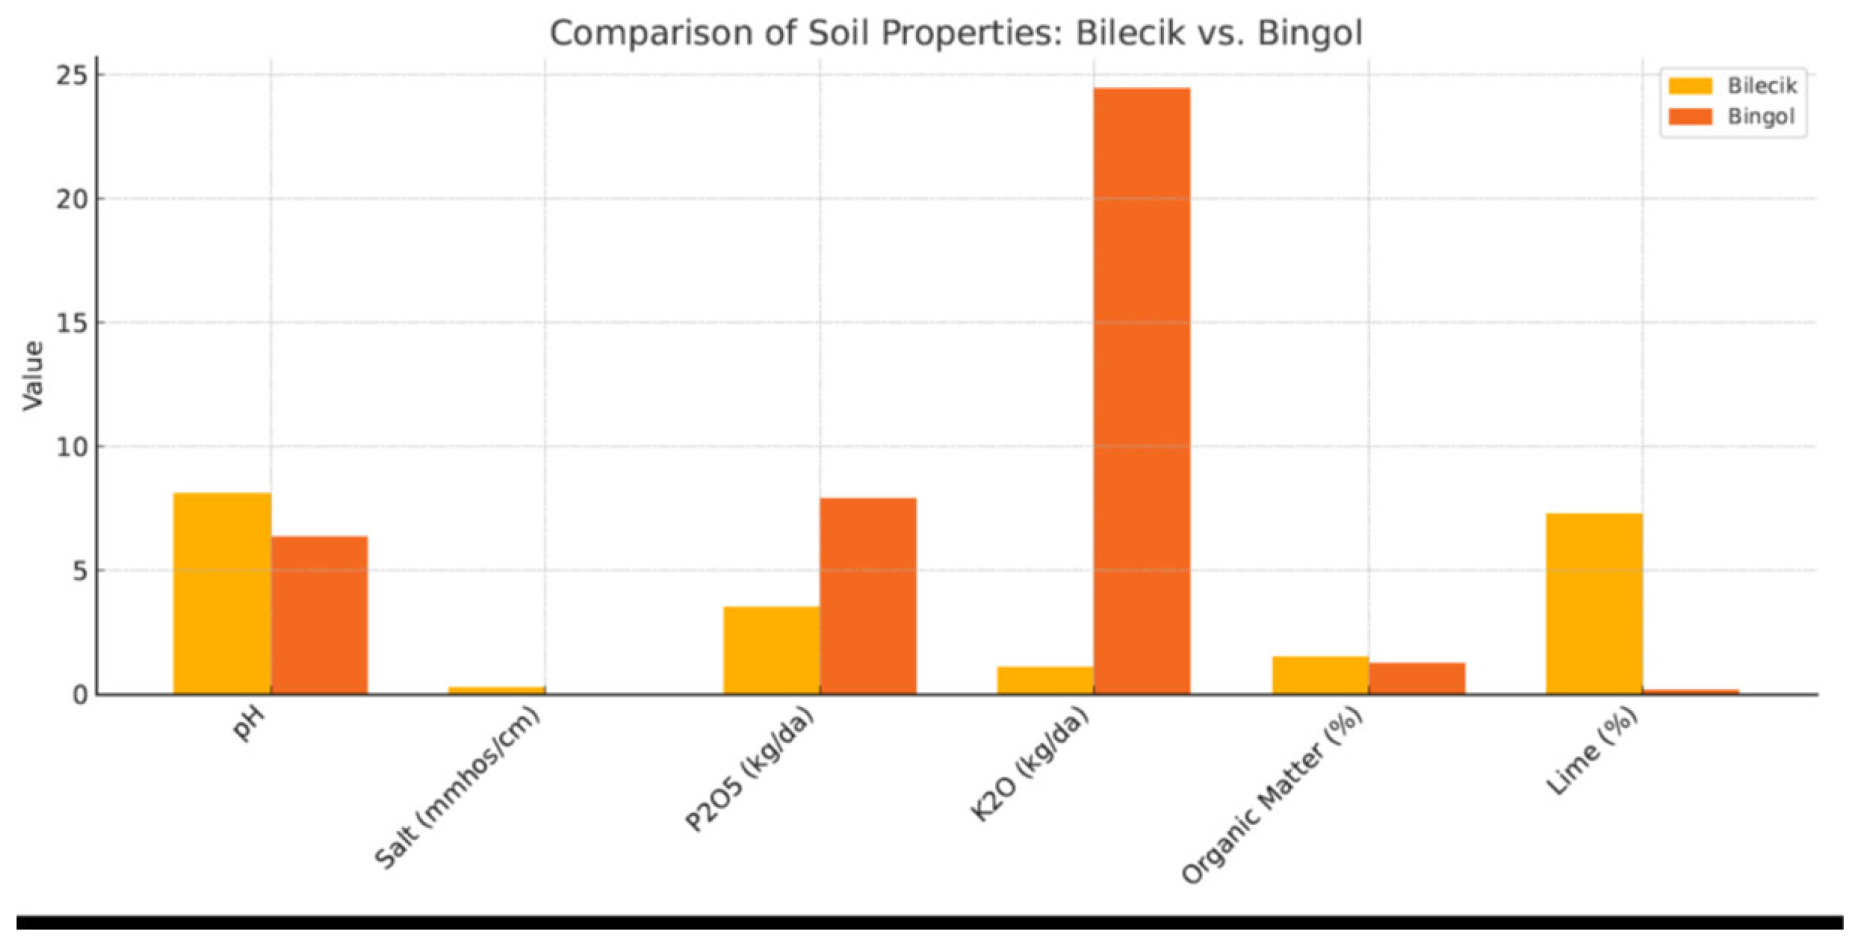
Figure 3.
Correlation coefficients between normalized traits of Hungarian vetch.
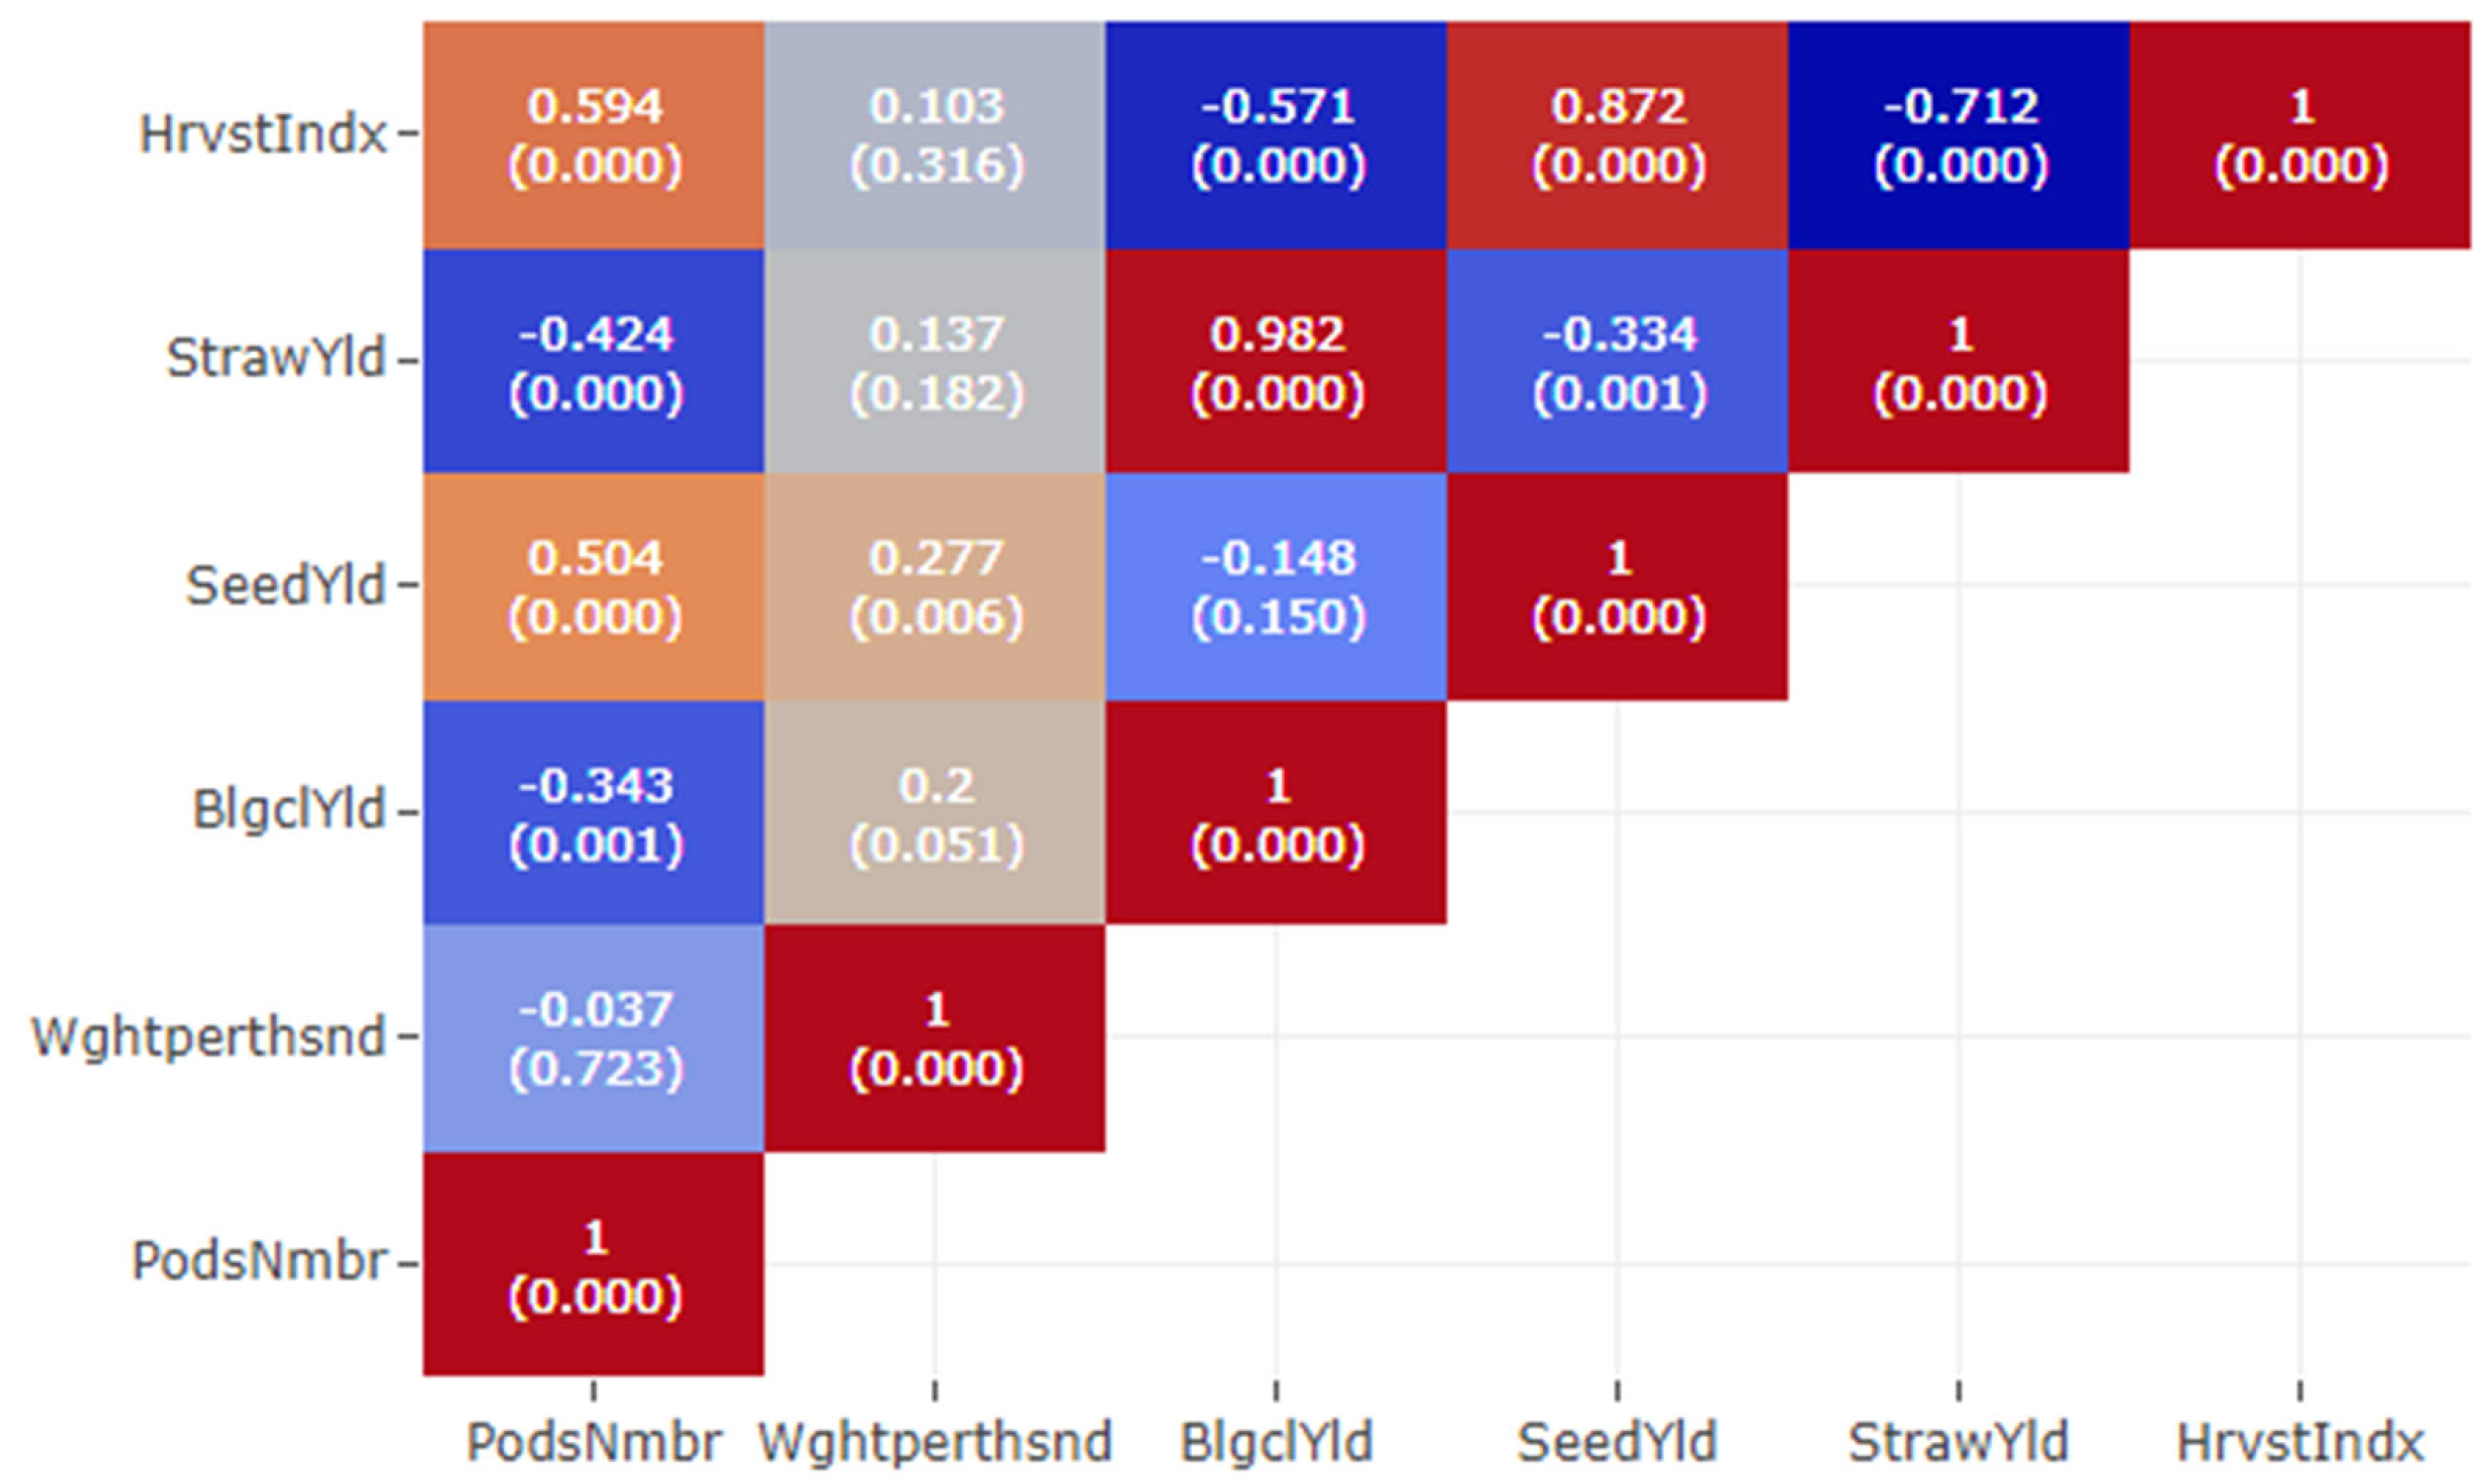
Figure 4.
Scree plot for percentage of explained variances by the principle components.
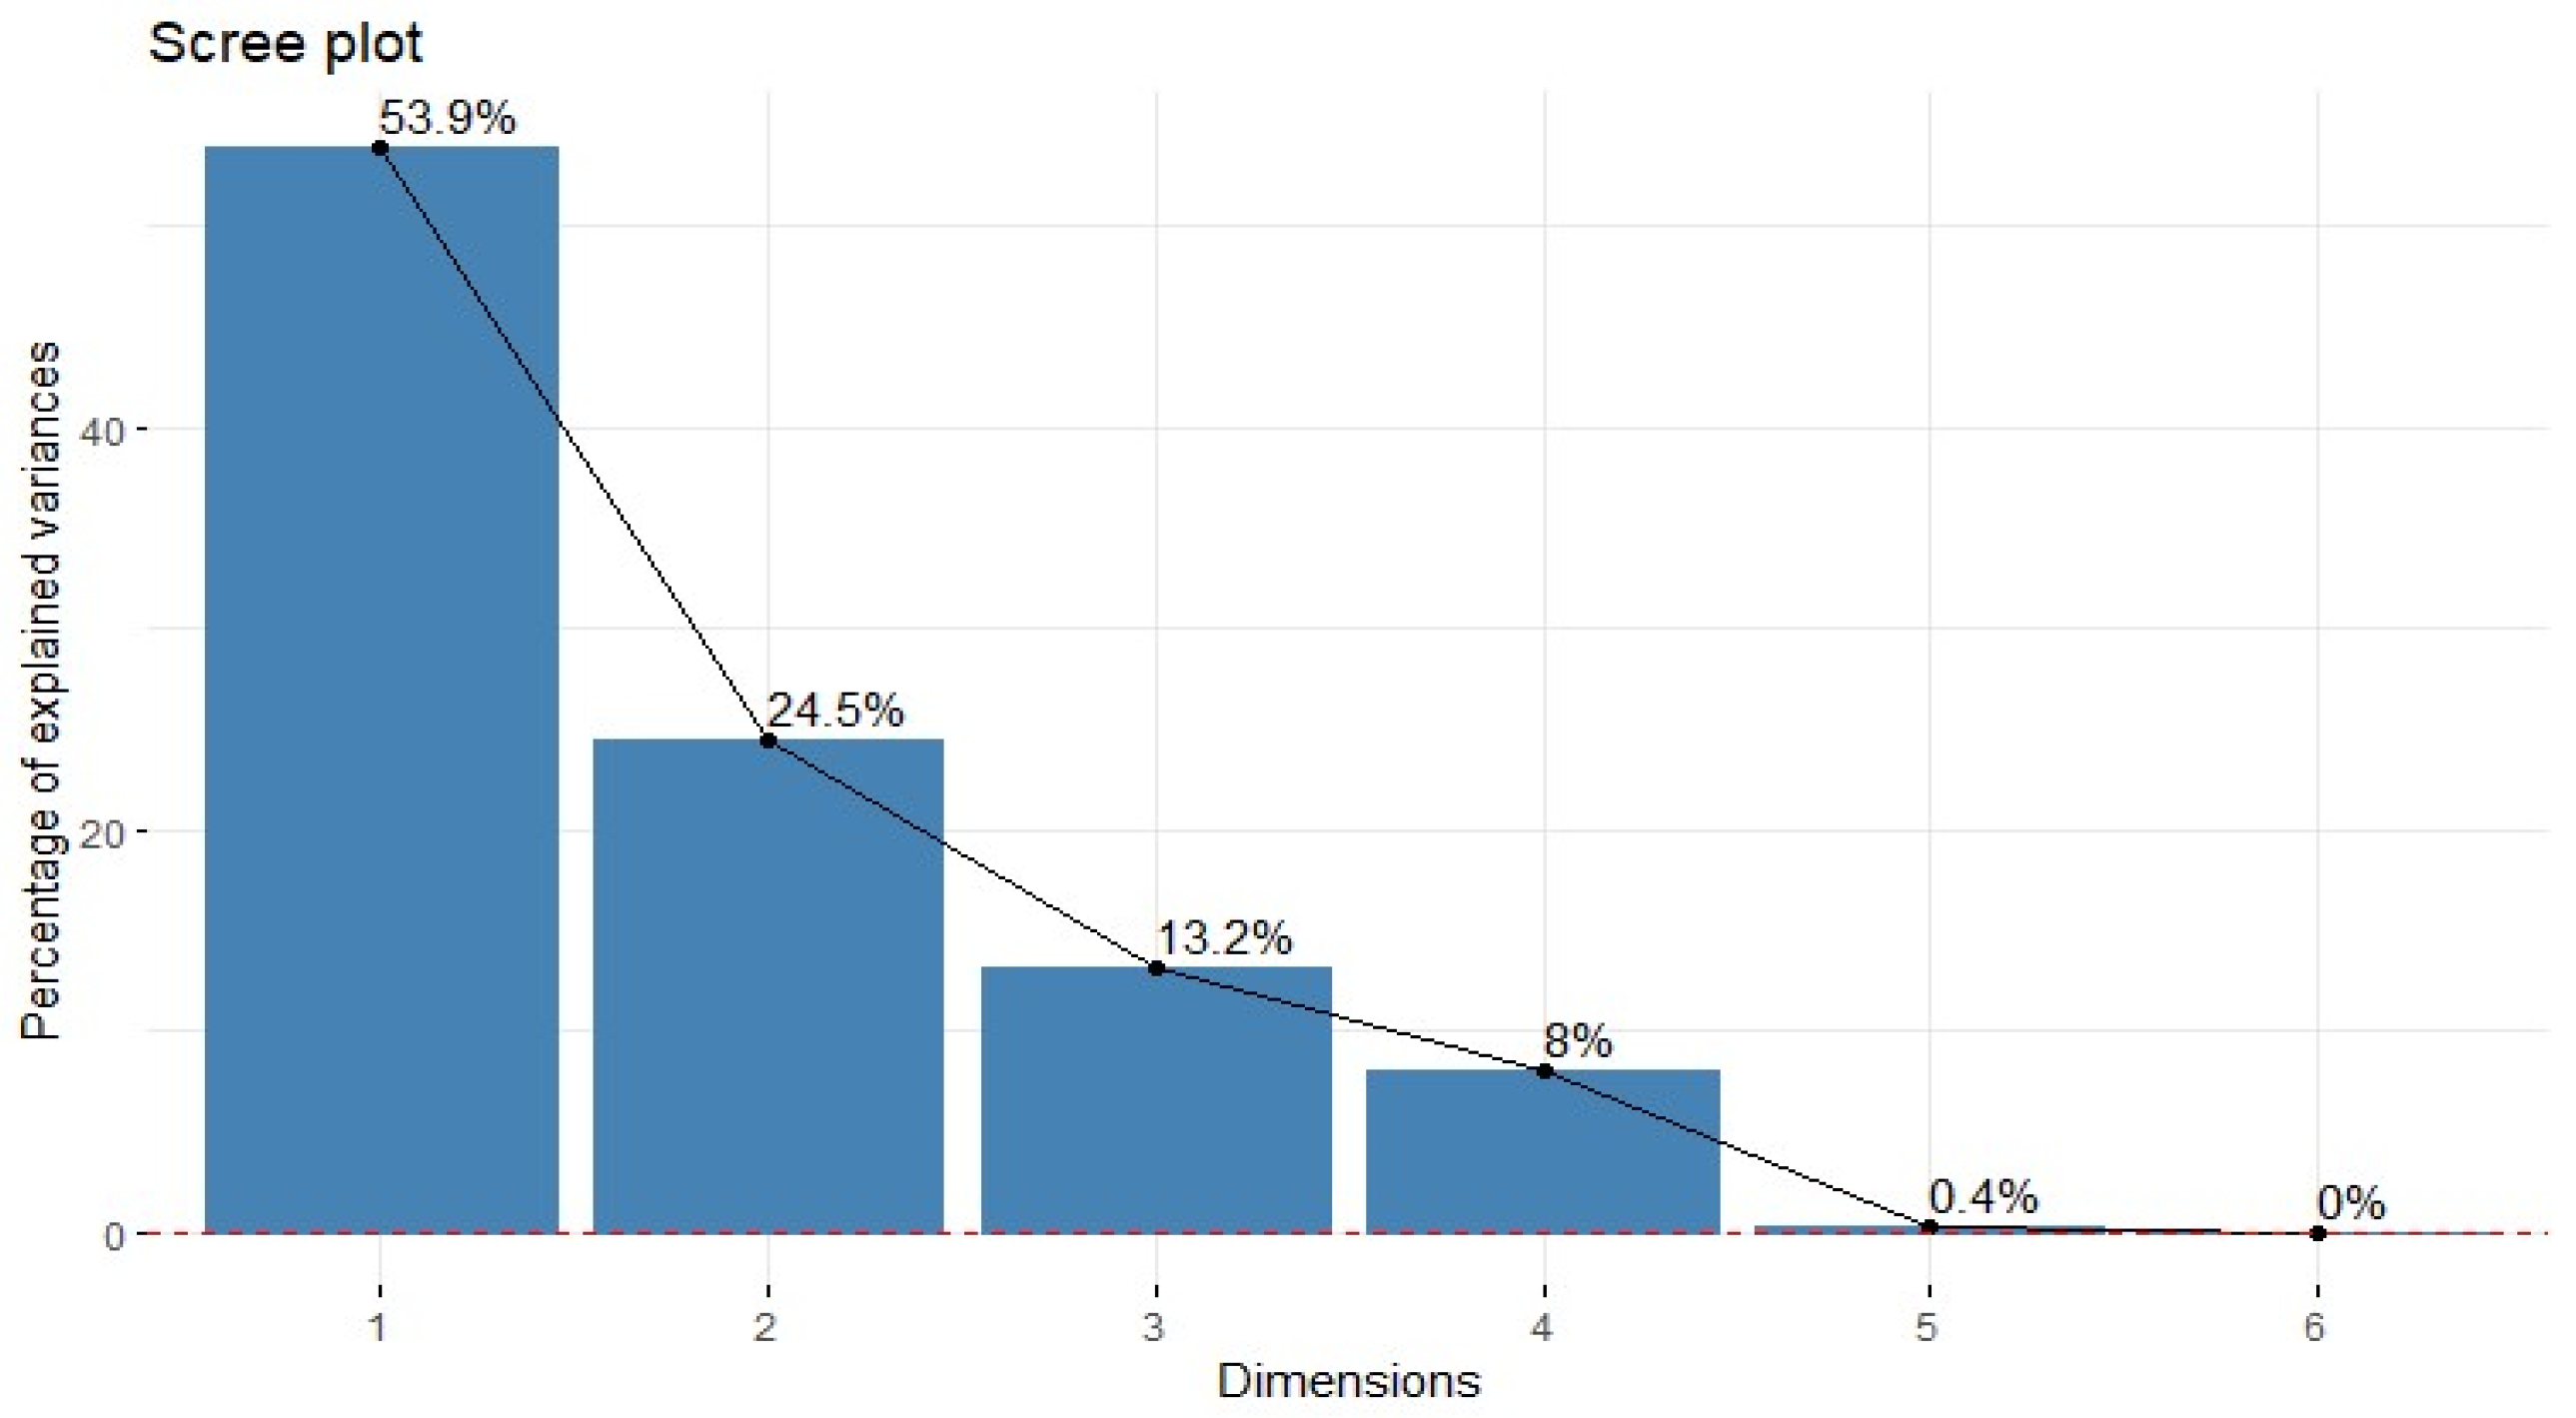
Table 1.
Pod numbers of per plant (number) of Hungarian vetch at both locations.
|
Genotypes |
Pod numbers of per plant (number) | |||||||||
| Locations |
Mean Loc. Two |
Mean 2015 |
Mean 2016 |
Mean 2015 2016 |
||||||
| Bilecik | Bingol | |||||||||
|
2015 2016 |
2016 2017 |
Mean Loc.Bil. |
2015 2016 |
2016 2017 |
Mean Loc.Bin. |
|||||
| Tarm | 25.7 | 18.1 | 21.8 AB | 12.3 | 14.0 | 13.2 G | 17.5 C | 19.0 | 16.1 | 17.5 |
| Budak | 23.4 | 20.1 | 21.7 ABC | 14.3 | 17.3 | 15.8 EFG | 18.8 BC | 18.9 | 18.7 | 18.8 |
| Line-16 | 26.1 | 21.2 | 23.7 A | 16.3 | 17.7 | 17.0 DEF | 20.3 AB | 21.2 | 19.4 | 20.3 |
| Aegean | 24.1 | 20.6 | 22.3 AB | 13.3 | 15.0 | 14.2 FG | 18.2 C | 18.7 | 17.8 | 18.2 |
| Oguz | 26.7 | 22.9 | 24.8 A | 11.7 | 14.3 | 13.0 G | 18.9 BC | 19.2 | 18.6 | 18.9 |
| Line-23 | 26.4 | 22.9 | 24.6 A | 18.0 | 19.0 | 18.5 CDE | 21.6 A | 22.2 | 20.9 | 21.6 |
| Line-28 | 25.0 | 20.1 | 22.5 AB | 18.3 | 20.7 | 19.5 BCD | 21.0 A | 21.7 | 20.4 | 21.0 |
| Line-5 | 25.8 | 22.2 | 24.0 A | 17.0 | 21.7 | 19.3 BCD | 21.7 A | 21.4 | 21.9 | 21.7 |
| Mean | 25.4 | 21.0 | 23.2 | 15.2 | 17.5 | 16.3 | 19.8 | 20.3 | 19.2 | 19.7 |
| C.V.(%) | 10.1 | |||||||||
| LSD (gen.) | n.s. | n.s. | n.s. | n.s. | n.s. | n.s. | 1.634* | n.s. | n.s. | n.s. |
| LSD (gen.xlok.) | n.s. | n.s. | n.s. | n.s. | n.s. | 3.075** | n.s. | n.s. | n.s. | n.s. |
*P≤0.05, **P≤0.01, n.s.: non significantion.
Table 2.
Thousand seed weight (gr) of Hungarian vetch at both locations.
|
Genotypes |
Thousand seed weight (gr) | |||||||||
| Locations |
Mean Loc. Two |
Mean 2015 |
Mean 2016 |
Mean 2015 2016 |
||||||
| Bilecik | Bingol | |||||||||
|
2015 2016 |
2016 2017 |
Mean Loc.Bil. |
2015 2016 |
2016 2017 |
Mean Loc.Bin. |
|||||
| Tarm | 38.5 cd | 35.5 e-h | 36.9 CD | 41.3ab | 34.6 e-h | 37.9 BC | 37.5 B | 39.9 a | 35.0 b | 37.4 |
| Budak | 35.7e-h | 33.5 hıj | 34.6 EF | 34.5 e-h | 34.1 ghı | 34.3 EFG | 34.5 C | 35.1 b | 33.8 bc | 34.4 |
| Line-16 | 33.2 hıj | 31.4 jkl | 32.3 H | 33.6 hıj | 27.0 no | 30.3I | 31.3 E | 33.4 bc | 29.2 e | 31.3 |
| Aegean | 36.4 d-g | 34.5 e-h | 35.4 DE | 34.0 g-j | 33.1 h-k | 33.6 FGH | 34.5 C | 35.2b | 33.8 bc | 34.5 |
| Oguz | 39.4 bc | 37.1 cde | 38.2 BC | 42.1 a | 43.2 a | 42.6 A | 40.4 A | 40.7 a | 40.1 a | 40.4 |
| Line-23 | 34.0 g-j | 31.6 ı-l | 32.8 GH | 30.6 kl | 25.8 o | 28.2 J | 30.5 EF | 32.3 cd | 28.7 e | 30.5 |
| Line-28 | 41.5 ab | 36.9 c-f | 39.2 B | 27.3 mno | 26.4 o | 26.8 J | 33.0 D | 34.4 b | 31.6 d | 33.0 |
| Line-5 | 34.3 fgh | 29.5 lm | 31.9 HI | 25.3 o | 29.3 lmn | 27.3 J | 29.6 F | 29.8 e | 29.4 e | 29.6 |
| Mean | 36.6 | 33.7 | 35.2 | 33.6 | 31.7 | 32.6 | 33.9 | 35.1 | 32.7 | 33.9 |
| C.V.(%) | 3.2 | |||||||||
| LSD(gen.) | n.s. | n.s. | n.s. | n.s. | n.s. | n.s. | 1.171 ** | n.s. | n.s. | n.s. |
| LSD(gen.xlok.) | n.s. | n.s. | n.s. | n.s. | n.s. | 1.657** | n.s. | n.s. | n.s. | |
| LSD(gen.xyear) | n.s. | n.s. | n.s. | n.s. | n.s. | n.s. | n.s. | n.s. | 1.657** | n.s. |
|
LSD (gen.xyear.xlok.) |
n.s. | n.s. | n.s. | n.s. | 2.343** | n.s. | n.s. | n.s. | n.s. | |
*P≤0.05, **P≤0.01, n.s.: non significantion.
Table 6.
Harvest index (%)of Hungarian vetch at both locations.
|
Genotypes |
Harvest index (%) | |||||||||
| Locations |
Mean Loc. Two |
Mean 2015 |
Mean 2016 |
Mean 2015 2016 |
||||||
| Bilecik | Bingol | |||||||||
|
2015 2016 |
2016 2017 |
Mean Loc.Bil. |
2015 2016 |
2016 2017 |
Mean Loc.Bin. |
|||||
| Tarm | 19.2 b-h | 16.8c-j | 17.9 BCD | 7.2 mn | 12.7ı-l | 9.9 H | 13.9 D | 13.2e | 14.7 cde | 13.9 |
| Budak | 20.7 b-f | 16.5 d-j | 18.6 BCD | 7.5 mn | 18.7 b-h | 13.1 FG | 15.8CD | 14.1 de | 17.6 b | 15.8 |
| Line-16 | 28.1 a | 21.0 b-e | 24.5 A | 15.8 f-j | 19.2 b-h | 17.5 CD | 21.0 A | 21.9 a | 20.1 a | 21.0 |
| Aegean | 22.1 b | 18.5 b-h | 20.3 B | 10.8 klm | 21.5 bc | 16.1 DE | 18.2 B | 16.4 bcd | 20.0 a | 18.2 |
| Oguz | 19.7 b-h | 19.0 b-h | 19.4BC | 9.8 lm | 16.2 e-j | 12.9 FG | 16.2BCD | 14.8cde | 17.6 b | 16.2 |
| Line-23 | 22.1 b | 15.4 g-j | 18.8 BC | 4.8 n | 17.5 b-ı | 11.1 GH | 15.1 CD | 13.5 e | 16.5 bcd | 14.9 |
| Line-28 | 21.4 bcd | 18.8 b-h | 20.1 B | 7.2 mn | 14.9 h-k | 11.0 GH | 15.6 CD | 14.3 de | 16.9 bc | 15.6 |
| Line-5 | 20.3 b-g | 16.6 c-j | 18.4 BCD | 12.1 jkl | 16.3 e-j | 14.2 EF | 16.3BC | 16.2 bcd | 16.4 bcd | 16.3 |
| Mean | 21.7 | 17.8 | 19.8 | 9.4 | 17.1 | 13.2 | 16.5 | 15.5 | 17.5 | 16.5 |
| C.V.(%) | 11.6 | |||||||||
| LSD(gen.) | n.s. | n.s. | n.s. | n.s. | n.s. | n.s. | 2.094** | n.s. | n.s. | n.s. |
| LSD(gen.xlok.) | n.s. | n.s. | n.s. | n.s. | n.s. | 2.225* | n.s. | n.s. | n.s. | n.s. |
| LSD(gen.xyear) | n.s. | n.s. | n.s. | n.s. | n.s. | n.s. | n.s. | n.s. | 2.225* | n.s. |
| LSD(gen.xyea.xlok.) | n.s. | n.s. | n.s. | n.s. | 4.188** | n.s. | n.s. | n.s. | n.s. | n.s. |
*P≤0.05, **P≤0.01, n.s.: non significantion.
Disclaimer/Publisher’s Note: The statements, opinions and data contained in all publications are solely those of the individual author(s) and contributor(s) and not of MDPI and/or the editor(s). MDPI and/or the editor(s) disclaim responsibility for any injury to people or property resulting from any ideas, methods, instructions or products referred to in the content. |
© 2025 by the authors. Licensee MDPI, Basel, Switzerland. This article is an open access article distributed under the terms and conditions of the Creative Commons Attribution (CC BY) license (http://creativecommons.org/licenses/by/4.0/).
Copyright: This open access article is published under a Creative Commons CC BY 4.0 license, which permit the free download, distribution, and reuse, provided that the author and preprint are cited in any reuse.


