
Submitted:
02 May 2024
Posted:
06 May 2024
You are already at the latest version
Abstract
Background: The pathophysiology of functional dyspepsia (FD) remains insufficiently understood, and the pain and economic constraints associated with endoscopic examinations hinder the precise definition and treatment of this disorder. Exploring the potential of multi-omics biomarkers for FD could yield promising targets for effectively diagnosing and treating this condition. Methods: We recruited 54 FD patients and 29 healthy volunteers and characterized their gut microbiota by shotgun metagenomic sequencing and their serum and urine metabolites by liquid chromatography-mass spectrometry (LC-MS). Results: We identified the changes in circulating metabolites associated with FD and linked to the gut microbial alterations. Among the differential circulating metabolites, we particularly highlighted the strong association of L-glutamate deficiency with the severity of FD symptoms and its strong predictive value for FD. Although no significant changes were noted in the gut microbial community structure of the FD samples, this might be attributed to symptom overlap between epigastric pain syndrome (EPS) and postprandial distress syndrome (PDS). However, significant alterations in the abundance of certain species were observed, including a substantial increase in the abundance of Streptococcus in the digestive tract of patients with FD. Finally, a cross-omics correlation network integrating metabolomic data with microbial community abundance was established, uncovering potential host-microbe-metabolite interactions. Conclusions: This work provides the first comprehensive description of the disrupted state of blood and urine metabolite composition and gut microbiota in patients with FD. These findings potentially offer promising targets for the diagnosis and treatment of this condition through a multi-omics approach, with particular emphasis on serum metabolomics.
Keywords:
Functional dyspepsia
; Metabolomics
; Metagenomics
; Multi-omics
; Biomarkers
1. Introduction
Functional dyspepsia (FD) is a common functional gastrointestinal disorder (FGID) in clinical practice. It is characterized by typical clinical manifestations, including postprandial bloating and discomfort, early satiety discomfort, epigastric pain, and epigastric burning sensation. Based on its clinical presentation, FD is commonly classified into two subtypes: epigastric pain syndrome (EPS) and postprandial distress syndrome (PDS) [1]. Although FD is considered a functional disorder, implying an absence of specific anatomical abnormalities or pathophysiological alterations, the multifaceted pathological mechanisms underlying FD have been gradually revealed with the advancing research and development in systems biology.
Metabolomics offers a promising approach for identifying metabolites, providing insights into the etiology, treatment, and early diagnosis of diseases [2,3]. This technique holds potential significance in investigating the multifactorial mechanisms of FD. Blood functions as a liquid transporter for molecules in the body, with particular relevance attributed to the numerous circulating small molecules in serum, collectively referred to as the serum metabolome. The serum metabolome contains a substantial number of biomarkers that provide distinct insights into biological processes [4]. Furthermore, it commonly influences the alterations in metabolite levels in other bodily fluids, such as the urine metabolome. Our previous study revealed the predictive value of modifications in the glycerophospholipid metabolic pathway for FD using lipid metabolomics [5]. However, our comprehension of the broader spectrum of metabolite changes in patients with FD remains limited.
Certain compounds in serum are endogenously synthesized, while others are assimilated from the external environment. The origins of specific metabolites are well-recognized, including highly heritable metabolites [6,7] or metabolites influenced by gut microbiota, lifestyle, and diet [8,9]. The gut microbiota emerges as a pivotal determinant for changes in certain metabolites. Previous studies have reported the impact of alterations in duodenal microbiota on gastric emptying and mild duodenal inflammation in patients with FD [10,11]. Notably, probiotics have been suggested as a promising therapeutic approach for FD [12,13]. However, the alterations in fecal microbiota among patients with FD and the potential association between microbiota and serum metabolites remain unaddressed.
Herein, 54 patients with FD and 29 healthy volunteers were recruited to acquire multi-omics profiles, including serum and urine non-targeted metabolomics, along with fecal metagenomics. The aim was to characterize the composition and function of serum and urine metabolites and fecal microbial communities among individuals diagnosed with FD. Through these multi-omics approaches, this study provides, for the first time, a comprehensive characterization of serum and urine metabolites, as well as fecal microbial communities, in patients with FD. These findings may offer promising targets for metabolome- and microbiome-based strategies for diagnosis and treatment of this disorder.
2. Materials and Methods
2.1. Research Participants
The study participants were recruited from patients who sought medical attention at the outpatient and endoscopy centers of the Xiyuan Hospital of China Academy of Chinese Medical Sciences between October 2018 and December 2021. The study consisted of two groups: 54 patients with FD and 29 individuals constituting the control group. The healthy control group comprised individuals from the clinical examination at Xiyuan Hospital, who were confirmed to be healthy after inquiry about medical history and examination, with the exclusion of cardiovascular diseases, diabetes, hypertension, hyperlipidemia, as well as functional and organic gastrointestinal disorders. Patients with FD were diagnosed according to the Roma IV diagnostic criteria [14] for FGIDs with participants aged between 18 and 65 years. The exclusion criteria were defined as follows: (1) Endoscopic evidence indicative of gastric or duodenal ulcers, mucosal erosion, or bleeding, along with the histopathological confirmation of gastric mucosal atrophy, intestinal metaplasia, or dysplasia. Patients manifesting typical heartburn and reflux symptoms associated with gastroesophageal reflux disease were excluded. (2) Confirmation of Helicobacter pylori (H. pylori) infection (including rapid urease test and 13C urea breath test). (3) Presence of organic diseases affecting the digestive system (e.g., chronic pancreatitis) or systemic diseases affecting gastrointestinal motility (such as diabetes, chronic renal insufficiency, connective tissue disorders, psychiatric or neurological disorders), or a history of gastric/abdominal surgery (except appendectomy). (4) Recent utilization of medications related to this condition within 2 weeks prior to the onset of symptoms (such as probiotics, prokinetic agents, anticholinergics, proton pump inhibitors, and histamine-type 2 [H2] receptor antagonists). (5) Severe primary cardiovascular, liver, kidney, hematological, or pulmonary diseases or severe conditions impacting survival, such as tumors or acquired immune deficiency syndrome (AIDS). (6) Patients with psychiatric disorders, intellectual impairment, or language disorders. (7) Persistent use of sedatives or hypnotics (> three times per week), antidepressants, and opioid preparations. (8) Pregnancy or lactation.
Participants were requested to provide fecal samples and blood samples, and complete demographic and medical questionnaires. The questionnaires included recording and quantitative scoring of the severity and frequency of the four main symptoms of FD. Scores were categorized into five levels: a score of “1” indicated the absence of symptoms, “2” exhibited mild symptoms that required attention to be noticed, “3” denoted noticeable symptoms that did not affect work or daily life, “4” reflected noticeable symptoms that affected work and daily activities, and “5” depicted highly pronounced symptoms that severely impacted work and daily life. The frequency scores ranged from 1 to 5, a score of “1” indicated no attacks, “2” indicated attacks occurring once a week, “3” represented attacks occurring 2–3 times a week, “4” denoted attacks occurring 4–5 times a week, and “5” represented almost daily or continuous attacks. FD patients often suffer from psychological abnormalities such as anxiety and depression. The SF-36 Health Survey is commonly used to assess the health-related quality of life in FD patients [15], as it has good acceptability, reliability, and validity [16]. It comprehensively assesses various aspects of health, including psychological, physiological, and social dimensions. In previous studies, the SF-36 mental health (SF36-MH) dimension was found to be significantly abnormal in FD patients [17,18]. Therefore, in our study, we used the SF36-MH dimension to evaluate the mental state of FD patients, including five questions: (1) Are you a sensitive person? (2) Do you feel downhearted and blue? (3) Do you feel calm and peaceful? (4) Do you feel downhearted and depressed? (5) Do you feel happy? Scoring was based on time frequency: 1 point for all the time, 2 points for most of the time, 3 points for a good bit of the time, 4 points for some of the time, 5 points for a little of the time, 6 points for none of the time. The final standard score = (raw score - minimum score) / score range of the dimension × 100. All study participants were adequately informed and voluntarily provided informed consent, and the research protocol was approved by the Ethics Committee of Xiyuan Hospital (Ethics number: 2017XLA035).
2.2. Sample Collection
Participants were provided with fecal collection kits to facilitate home-based collection. Instructions were provided to promptly refrigerate the fecal samples until they could be delivered to the research coordinator within 24–48 h of collection, either in person or through a courier service. Subsequently, the samples were transferred to a laboratory freezer and maintained at -80°C for long-term preservation. Participants were instructed to refrain from strenuous physical or late-night activities for at least 72 h before blood collection. Venous blood was collected from participants after an overnight fast using heparin anticoagulant tubes. The samples were centrifuged at 1500 rpm for 10 min at 4°C to obtain serum, which was subsequently stored at -80°C for future use. Urine samples, collected in the early morning while fasting, were similarly stored at -80°C for subsequent analysis.
2.3. Extraction of Metabolites and Liquid Chromatography-Mass Spectrometry (LC-MS)
Please refer to the supplementary experimental procedures for detailed information.
2.4. Extraction of Metabolites and Liquid Chromatography-Mass Spectrometry (LC-MS)
Please refer to the supplementary experimental procedures for detailed information.
2.5. Additional Software Applications
Receiver operating characteristic (ROC) curves and Mantel tests were generated using OmicShare Tools (https://www.omicshare.com/tools/Home/Soft/getsoft). Cytoscape (Version: 3.10.0) was used to construct a network illustrating significant microbial and host blood and urine co-metabolism correlations at the species level.
2.6. Statistical Analysis
Metabolomics and metagenomics analyses were performed using the free online tool of Majorbio Cloud Platform (cloud.majorbio.com). In the metabolomics analysis, Student's t-test was employed to determine the significance of metabolite differences between the FD and control groups. In contrast, Spearman analysis was employed to evaluate correlations between metabolites and clinical symptoms, as well as between different metabolites. For the metagenomics analysis, the Wilcoxon rank-sum test was utilized to compare differences in species and functional abundances, as well as alpha diversity. At the genus level, principal coordinate analysis (PCoA) and analysis of similarities (ANOSIM) based on Bray-Curtis and Binary-Lennon distances were applied to assess the differences in structural diversity between the two groups. Distance-based redundancy analysis (db-RDA) was employed to visualize the changes in beta diversity related to symptom scores, age, gender, body mass index (BMI), and SF36-MH. The explanatory power of these factors on sample differences was determined using permutational multivariate analysis of variance (PERMANOVA), and permutation tests were employed to assess the statistical significance of the partition. All statistical tests were two-tailed, and statistical significance was set at р < 0.05.
3. Results
3.1. Clinical Information
The cases included in this study were patients who sought medical attention in the Department of Gastroenterology and Spleen at Xiyuan Hospital between November 2019 and December 2021. A total of 54 patients diagnosed with FD and 29 healthy individuals (control group) were enrolled. A comprehensive comparison of age, gender, BMI, ethnicity, and education level was conducted between the two groups. No significant differences were observed in these factors (р > 0.05), ensuring comparability between the two groups. For the SF36-MH score dimension, patients with FD exhibited an average MH score of 54 (with higher MH scores indicating improved MH and the maximum score being 68). Furthermore, according to epidemiological observations, symptom overlap frequently occurs between patients with PDS and EPS [19]. Among the recruited patients with FD, 79.63% presented overlapping PDS and EPS symptoms (Table 1).
3.2. Altered Serum Metabolites and Functional Pathways Identified in Patients with FD through Multivariate Statistical Analysis
Serum samples were subjected to LC-MS analysis and pre-processing steps for the serum metabolome. These steps included excluding low-quality peaks, imputing missing values, normalizing, evaluating the relative standard deviation (RSD) of quality control (QC) samples, and transforming the data. In both positive ion (pos) mode and negative ion (neg) modes, 17,623 mass spectral peaks were detected. Ultimately, based on first- and second-level mass spectrometry data, we identified 514 metabolites (in pos mode) and 207 metabolites (in neg mode). For both pos and neg modes, the principal component analysis (PCA) results demonstrated the close clustering of QC samples, confirming the reliability of the data. Notably, a distinct separation trend emerged between the control and the FD group, indicating significant differences in the metabolite profiles (Figure 1A, Supplemental Figure S1A). Subsequently, we employed partial least squares discriminant analysis (PLS-DA) through fitting to establish a model incorporating metabolic information, revealing a clear clustering of patients with FD (Figure 1B, Supplemental Figure S1B). Furthermore, to assess the capability of the model to accurately classify new samples, we performed 200 random permutation tests and conducted seven-fold cross-validation. The intercepts of the goodness-of-fit (R2) and goodness-of-prediction (Q2) indicated the reliability of the PLS-DA model and ensured the avoidance of overfitting concerns (Figure 1C, Supplemental Figure S1C). Moreover, Venn diagrams were used to evaluate the abundance of unique and shared metabolites between the two groups (excluding metabolites with missing values ≥50% in each group). The results indicated that the FD group had 537 metabolites in pos mode, with 11 specifically present in this group, while 526 metabolites were commonly observed in the control group (Figure 1D). In the neg mode, the FD group exhibited 220 metabolites, with three being unique to this group, while 217 metabolites were commonly observed in the control group (Supplemental Figure S1D). Differential analysis of metabolites between the two groups was performed, with a screening criterion of variable importance in projection (VIP) pred > 1 in orthogonal PLS-DA (OPLS-DA) and a significance level of р < 0.05. This analysis yielded 72 metabolites with significant differential abundances (Supplemental Table S1), forming a differential metabolite set. Volcano plots illustrated the differential abundances of identified metabolites between patients with FD and healthy controls to enhance the rapid identification of data points manifesting significant alterations. In both pos and neg modes, the abundances of differentially abundant metabolites in patients with FD were significantly different from those in healthy controls (Figure 1E, Supplemental Figure S1E). We utilized KEGG for pathway enrichment and topological analysis to understand the functional characteristics and classification of these differentially abundant serum metabolites. Several critical differential metabolic pathways were identified, including “D-Glutamine and D-glutamate metabolism,” “Taurine and hypotaurine metabolism,” and “Alanine, aspartate, and glutamate metabolism,” which exhibited a decrease in activity (Figure 1F).
3.3. Analysis of Key Differentially Abundant Serum Metabolites and Model Prediction in Patients with FD
We visualized the significance and abundance patterns of 72 distinct differentially abundant metabolites by constructing cluster heatmaps and bar plots showing VIP values (Figure 2A). Several significant alterations in metabolites with critical implications were detected. For instance, a significant downregulation in the abundance of L-glutamate was identified, which was involved in pathways such as "D-Glutamine and D-glutamate metabolism," "Taurine and hypotaurine metabolism," and "Alanine, aspartate, and glutamate metabolism" (р < 0.001) (Supplemental Figure S2A). L-glutamate is the most abundant free amino acid in the brain and serves as a major excitatory neurotransmitter in the central nervous system of vertebrates [20]. It is also one of the primary neurotransmitters in the stomach, exerting potent stimulatory effects on most smooth muscle layers and promoting gastric emptying [21,22,23,24]. Interestingly, Spearman correlation analysis unveiled a significant negative correlation between L-glutamate and the severity of early satiety, and postprandial bloating and discomfort in patients with FD (R = -0.469, р < 0.01; R = -0.416, р < 0.05) (Figure 2B). This finding suggests a potential involvement of L-glutamate in the pathogenesis of the PDS subtype of FD. Furthermore, we also noticed some metabolites with significant differences in their abundance. For instance, a significant decrease was observed in taurine abundance in the serum of patients with FD (р < 0.001) (Supplemental Figure S2B). Taurine has been highlighted to diminish cellular aging, diminish mitochondrial dysfunction, mitigate DNA damage, attenuate inflammation [25], and confer a protective effect against gastric mucosal injury [26,27,28]. It has also been implicated in the regulation of anxiety [29,30,31] and depression management [32,33,34]. Nonetheless, no significant correlation was witnessed between taurine and the symptoms or severity of MH impairment in FD patients (Figure 2B). Gentisic acid, a phenolic acid, exhibits health-promoting attributes, including anti-inflammatory, hepatoprotective, neuroprotective, and particularly antioxidant activities [35]. It has also been suggested to exhibit antipsychotic and antidepressant-like effects [36,37]. Similarly, uridine has been found to confer antidepressant-like effects [38,39]. In this study, a significant reduction was observed in the abundance of gentisic acid and uridine among patients with FD (р < 0.001), which had a negative correlation with the severity of MH impairment symptoms (R = -0.346, р < 0.05; R = -0.375, р < 0.05) (Supplemental Figure S2C-D, Figure 2B). Vaccenic acid has been demonstrated to confer beneficial effects in alleviating intestinal inflammation [40], reducing blood lipids [41,42], and addressing insulin resistance [43]. We observed a significant decrease in the vaccenic acid levels in patients with FD (р < 0.001), and a substantial inverse relationship was identified between vaccenic acid levels and the severity of early satiety in these patients (R = -0.360, р < 0.01) (Supplemental Figure S2E, Figure 2B). We further identified several significantly elevated metabolites in patients with FD, such as 3-O-Sulfogalactosylceramide, closely associated with metachromatic leukodystrophy [44], Ganglioside GM3 (d18:1/9Z-18:1), which has been linked to cancer [45], and Ganglioside GM1 (d18:0/24:0), which is involved in the protection of the nervous system function [46]. However, these elevated metabolites did not show a clear correlation with the clinical symptoms of patients with FD (Supplemental Figure S2F-H, Figure 2B).
Subsequently, ROC curves were constructed (Figure 2C) for four important differentially abundant metabolites that were closely correlated with the severity of clinical symptoms in patients with FD. The area under the curve (AUC) values for each metabolite were as follows: vaccenic acid (AUC = 0.923, 95% CI: 0.862–0.984), L-glutamate (AUC = 0.884, 95% CI: 0.801–0.967), uridine (AUC = 0.839, 95% CI: 0.75–0.929), and gentisic acid (AUC = 0.724, 95% CI: 0.605–0.843). These AUC values exhibited favorable predictive value, suggesting that these differentially abundant metabolites may serve as pivotal biomarkers for patients with FD.
3.4. Altered Urine Metabolites and Functional Pathways Identified in Patients with FD through Multivariate Statistical Analysis
The same data pre-processing approach for the serum metabolome was applied to the urine metabolome. In total, 12,304 mass spectral peaks were identified in both pos and neg modes, and the final number of identified metabolites was 598 (in the pos mode) and 499 (in the neg mode) using first- and second-level MS data. Similarly, PCA results demonstrated the data reliability and revealed differences in urine metabolites between patients with FD and healthy volunteers (Figure 3A, Supplemental Figure S3A). PLS-DA findings also revealed distinct clustering patterns for the two sample groups, and the intercepts of R2 and Q2 indicated the reliability of the PLS-DA model without overfitting (Figure 3B-C, Supplemental Figure S3B-C). The Venn diagram revealed the number of unique urine metabolites in FD samples, excluding metabolites with missing values ≥50% in this group. In the pos mode, the FD group showed 657 metabolites, with six specific to FD samples and 651 shared with the control group (Figure 3D). In the neg mode, the FD group had 604 metabolites, including 20 specific to FD and 584 shared with the control group (Supplemental Figure S3D). Similarly, differential analysis was performed on the two metabolite groups, using the screening criteria of VIPpred> 1 in OPLS-DA and р < 0.05, resulting in the identification of 285 metabolites with significant differences in abundance (Supplemental Table S2). The volcano plots in the pos and neg modes visually confirmed significant differences in urine metabolite abundance between patients with FD and healthy controls (Figure 3E, Supplemental Figure S3E). KEGG topological analysis revealed alterations in vital metabolic pathways, including "Aminobenzoate degradation," "Cysteine and methionine metabolism," "Starch and sucrose metabolism," and "Alanine, aspartate, and glutamate metabolism" (Figure 3F).
3.5. Analysis of Key Differentially Abundant Urine Metabolites and Model Prediction in Patients with FD
Cluster heatmaps and bar plots of VIP visually depict the significance and abundance trends of some differentially abundant urine metabolites (top 50 based on VIP value) (Figure 4A). Similarly, we have also noted some meaningful differential metabolites, such as LPC(16:0) and LysoPC(15:0), both of which are types of lysophosphatidylcholine with different fatty acid chain lengths. They, like PC(16:0/0:0)[U] (Phosphatidylcholine), are essential membrane components in the human body, participating in signal transduction and immune regulation. In the presence of acyl-CoA, lysophosphatidylcholine acyltransferase can convert LPC to PC [47]. Some digestive system diseases such as inflammatory bowel disease [48], nonalcoholic fatty liver disease [49], and sclerosing cholangitis [50] are associated with decreased expression levels of LPC or PC. 1Alpha-hydroxyvitamin D3 is a derivative of vitamin D3. Studies have shown that besides treating osteoporosis, 1Alpha-hydroxyvitamin D3 also has effects on inhibiting gastrointestinal carcinogenesis [51,52], and regulating bile acid metabolism [53]. The increase in circulating (±)12,13-DiHOME is associated with improved metabolic health and is considered a potential target for the prevention and treatment of obesity and metabolic diseases [54]. These noted beneficial metabolites are significantly decreased in the urine of FD patients (Figure 4A and Supplemental Figure S4A-E). In addition, we also noticed that compared to healthy individuals, the elevated L-Glutamate in the serum metabolome of FD patients did not show significant changes in urine. However, L-Glutamine significantly increased in urine (Supplementary Figure S4F-G), indicating that metabolic changes in serum and urine may not be consistent. It is generally believed that L-Glutamine serves as a precursor to L-Glutamate [20]. Therefore, it is not ruled out that an increase in urinary excretion of L-Glutamine may lead to a reduction in the synthesis of L-Glutamate. However, further research is needed to validate this hypothesis. Spearman correlation analysis also revealed a significant negative correlation between L-Glutamine in urine and L-Glutamate in serum (R = -0.389, р < 0.01). Furthermore, other urine metabolites showed strong correlation with serum metabolites (Supplemental Figure S4H), indicating complex mutual influences between urine and serum metabolites. We conducted Spearman correlation analysis between meaningful differential urine metabolites and symptom scores of FD patients. Interestingly, L-Glutamine in urine showed a significant positive correlation with early satiety symptoms (R = 0.308, р < 0.05) (Figure 4B). ROC analysis also demonstrated that L-Glutamine had good predictive value for FD (AUC = 0.727, 95% CI: 0.599–0.855) (Figure 4C). These data suggest that differential urine metabolites may also serve as important biomarkers for FD patients, although their correlation and predictive value with symptoms are not as high as serum metabolites.
3.6. Alterations in the Microbial Community Structure Specific to FD Identified through Shotgun Metagenomic Sequencing
For sequence alignment, Diamond [55] was used to compare the amino acid sequences of the non-redundant gene set with the non-redundant protein sequence (NR) database, using BLASTP with an expected value (E-value) of 1e-5. Species annotations were obtained from the taxonomic information database corresponding to the NR database (annotation method: De-unclassified). Species abundance was calculated based on the total gene abundance corresponding to each species. Abundance profiles were created for species in each sample by analyzing their quantities across various taxonomic levels, including Domain, Kingdom, Phylum, Class, Order, Family, Genus, and Species. The number of annotated taxa in the NR species were as follows: Domain: 5; Kingdom: 15; Phylum: 142; Class: 293; Order: 577; Family: 1,156; Genus: 4,017; Species: 19,802. According to the Venn diagram, there were 857 genes specific to FD at the genus level compared to the control group, with 3,003 shared genes between the two groups (Figure 5A). At the species level, there were 4,665 genes specific to FD compared to the control group and 14,061 shared genes (Figure 5B). The bar plot representing the community at the phylum level displayed an increased ratio of Firmicutes to Bacteroidetes (2.20 vs. 2.74) and a significant reduction in the abundance of Proteobacteria in patients with FD (Figure 5C), indicating shifts in the microbial community structure among these patients. Further analysis of alpha diversity provided information on the richness, coverage, and diversity in the community. However, no significant changes in alpha diversity were observed in patients with FD (Supplemental Figure S5A). In terms of beta diversity, PCA and PCoA based on the Bray-Curtis distance algorithm (considering the presence and abundance of species) did not show a distinct separation between the two groups (Supplemental Figure S5B-C). On the contrary, PCoA based on the Binary-Lennon distance algorithm (considering the presence or absence of species) revealed differences in diversity between the two groups (ANOSIM: R = 0.088, р = 0.034). We observed that the FD samples were divided into two clusters (indicated by a red dashed line). One cluster was closely aligned with healthy volunteers, while the other cluster exhibited distinct separation from them (Supplemental Figure S5D). To unravel contributory factors, we utilized db-RDA visualization based on Bray-Curtis and Binary-Lennon distances, and examined the changes in beta diversity related to FD symptom scores (severity + frequency), age, gender, BMI, and MH scores (SF36-MH) (Supplemental Figure S6A-B). Furthermore, the explanatory power of these factors in explaining the differences between samples was assessed using the PERMANOVA method, and the statistical significance of the partitions was determined using permutation tests. Interestingly, we found that the severity of EPS may be one of the contributors to the differences in gut microbiota between FD samples (PERMANOVA: R2 = 0.034, р = 0.042) (Supplemental Figure S6B, Supplemental Table S3). This finding implies that patients with the EPS subtype might exhibit distinct gut microbiota structures, while the gut microbiota structures of patients of the PDS subtype may be more similar to those of healthy volunteers. However, it should be noted that the majority of patients in our study had overlapping subtypes of EPS and PDS, and it is necessary to recruit patients with isolated EPS and PDS in future studies to validate our hypothesis.
3.7. Alterations in the Microbial Community Structure Specific to FD Identified through Shotgun Metagenomic Sequencing
At the genus level, we identified alterations in species abundance among patients with FD through Wilcoxon rank-sum tests. Among these, Alistipes and Streptococcus were found to exhibit significantly higher abundances and clinical significance. Specifically, a significant reduction was observed in Alistipes abundance in the gut of patients with FD (р < 0.05) (Figure 5D). Alistipes is a crucial propionate-producing bacterium in the human body. It has been associated with protective effects against inflammatory bowel disease, liver cirrhosis, and patients with liver cancer [56,57], possibly due to its immunomodulatory capabilities [58]. A previous study has reported a decreased relative abundance of Alistipes in individuals with autism, suggesting a potential protective role in psychiatric disorders [59]. The abundance of Streptococcus in the gut of patients with FD exhibited a significant increase (р < 0.05) (Figure 5D). Streptococcus is a gram-positive, spherical-shaped bacterium belonging to the phylum Firmicutes. While some streptococci are pathogenic, such as Streptococcus pneumoniae [60], many other streptococci, such as Streptococcus thermophilus, are considered probiotics [61]. Of interest, a prior study conducted in Japan reported a significant increase in the abundance of Streptococcus in the oral cavity, esophagus, gastric antrum, and duodenal descending part of patients with FD [62]. Similarly, a study from Australia highlighted a substantial increase in the abundance of Streptococcus in the small intestine of patients with FD [63]. Our findings aligned with these observations, revealing a significant increase in the abundance of Streptococcus in the fecal samples of patients with FD. Furthermore, we examined the changes in species at the species level in the gut of patients with FD. It was found that Alistipes putredinis and Alistipes putredinis CAG: 67 were the major species contributing to the significant decrease in the abundance of the genus Alistipes, while Streptococcus sp. was the primary species causing the notable increase in the abundance of the genus Streptococcus at the genus level (р < 0.05) (Figure 5E). To ascertain the diagnostic potential of these species in FD, we generated ROC curves based on the abundance of Alistipes putredinis, Alistipes putredinis CAG: 67, and Streptococcus sp.. The results revealed that Streptococcus sp. exhibited a more prominent predictive value (AUC = 0.693, 95% CI: 0.558–0.828) (Figure 5F), underscoring the strong association between Streptococcus sp. and FD.
Subsequently, Diamond [55,64] was employed to align non-redundant gene set sequences with the GENES database of KEGG (BLASTP parameter: E-value ≤ 1e-5). The abundance of functional categories was calculated based on the sum of gene abundances at Levels 2 and 3. It was noted that no significant alteration in species function was observed in the FD group at Level 2 (Supplemental Figure S7A). However, at Level 3, a significant decrease was observed in the enrichment levels of functions, such as "Folate biosynthesis," "Nitrogen metabolism," and "Cationic antimicrobial peptide (CAMP) resistance" in the FD group (Supplemental Figure S7B).
3.8. Construction of a Multifactorial Correlation Network and Joint Diagnostic Value of Blood and Urine Metabolomics with Fecal Macrogenomics in Patients with FD
Like most chronic diseases, the multifactorial pathophysiology of FD, involving host and microbial pathways, led us to construct a cross-omics correlation network combining metabolomic data with microbial community abundances. To comprehensively explore the hypothesized host-microbe-metabolite interactions without bias, we hypothesized that microbes may not directly participate in urine metabolism, and blood metabolites could serve as intermediate communicators. Thus, we initially used the Mantel test to analyze the correlation networks between key species, such as Alistipes and Streptococcus at the genus level, and crucial serum metabolites, as well as their interrelationships. Significant negative correlations were noted between Alistipes and Ganglioside GM3 (d18:1/9Z-18:1) (R = -0.318, р = 0.026), Ganglioside GM1 (d18:0/24:0) (R = -0.295, р = 0.039), and 3-O-Sulfogalactosylceramide (d18:1/18:0) (R = -0.296, р = 0.039), suggesting complex and close relationship among serum metabolites (Figure 6A). Subsequently, we constructed a complex correlation network at the species level using Cytoscape, integrating essential microbes with host blood and urine co-metabolism. Alistipes putredinis primarily contributed to the observed negative correlations with the aforementioned three key serum metabolites. Additionally, Streptococcus sp. exhibited a significant negative correlation with taurine (R = -0.283, р = 0.049). The complexity of the pathophysiological connections could be observed from the correlation network, suggesting that alterations in gut microbiota among patients with FD might influence changes in the serum-metabolite profile, consequently affecting urine metabolites (Figure 6B). This finding underscores the potential for generating multiple hypotheses through the use of multi-omics integration methods to link observed changes in different layers of cross-omics data [65].
Finally, an ROC model was developed by combining serum metabolomics, urine metabolomics, and fecal metagenomics to evaluate the predictive value of comprehensive multi-omics analysis for FD. Our findings revealed that the serum metabolome (AUC = 0.992, 95% CI: 0.976–1.000) exhibited a superior predictive value compared to the urine metabolome (AUC = 0.769, 95% CI: 0.616–0.922) and fecal metagenome (AUC = 0.754, 95% CI: 0.607–0.900). After combining serum and urine metabolomes (AUC = 0.992, 95% CI: 0.976–1.000) or serum metabolome with fecal metagenome (AUC = 0.994, 95% CI: 0.982–1.000), there was no significant improvement in predictive value (Figure 6C). Given the relatively modest predictive value of the urine metabolome and fecal metagenome and the potential economic burden on patients, we suggest utilizing the serum metabolome as an adjunct diagnostic and therapeutic tool for FD. Specifically, evaluating the serum abundances of L-glutamate, vaccenic acid, and uridine could be beneficial. Nevertheless, more cohorts are required to validate the accuracy of this model.
4. Discussion
Due to limited understanding of the pathophysiology of FD, accurate characterization and treatment of the condition remain challenging. While conventional endoscopic examinations are technically required for the diagnosis of FD, their application is limited for all patients with typical symptoms. It is recommended to restrict endoscopic examinations to individuals aged >55 years or those presenting with associated features, such as weight loss or vomiting [14]. Therefore, there is still a need for applicable non-invasive early diagnostic methods to improve the diagnosis and treatment of FD. Multi-omic technologies provide efficient tools for disease diagnosis, management, monitoring, treatment, and identification of novel disease biomarkers, offering important opportunities to unravel the information underlying diseases [66]. Therefore, in this study, we conducted untargeted metabolomic and shotgun metagenomic analyses of serum, urine, and fecal samples from patients with FD and healthy volunteers, presenting a comprehensive and in-depth investigation. To the best of our knowledge, this study is the first to elucidate the specific alterations in the human gut microbiota and metabolome associated with FD in a comprehensive multi-omics framework.
The findings and their implications should be discussed in the broadest context possible. Future research directions may also be highlighted.The multivariate statistical analysis identified significant changes in the serum metabolome in patients with FD. A set of 72 metabolites with significant differences were selected, constituting a differential metabolite set. We conducted pathway enrichment and topological analysis using the KEGG database to gain insights into the functional profiles and classification of these differentially abundant serum metabolites. Our study revealed that several vital metabolic pathways, such as "D-Glutamine and D-glutamate metabolism," "Taurine and hypotaurine metabolism," and "Alanine, aspartate, and glutamate metabolism," were downregulated in patients with FD. Moreover, these downregulated metabolic pathways were primarily attributed to decreased L-glutamate abundance. We emphasize the significant diagnostic and therapeutic value of L-glutamate in FD when combining previous studies with our research findings. L-glutamate is the most abundant free amino acid in the brain and functions as a major excitatory neurotransmitter[20]. Furthermore, it is one of the primary neurotransmitters in the stomach, exerting potent stimulatory effects on most smooth muscle layers and enhancing gastric emptying [21,22,23,24]. Moreover, L-glutamate regulates gastric acid secretion through its N-methyl-D-aspartate (NMDA) receptor, protecting against cold-restraint stress-induced gastric ulcer formation [67] and enhancing local mucosal defense to prevent duodenal acid exposure-induced damage [68]. L-glutamate supplementation in the diet can improve intestinal integrity and facilitate the digestion and absorption of nutrients in the jejunum [69]. Intriguingly, we observed a significant negative correlation between the severity of early satiety and postprandial bloating and discomfort in patients with FD, along with L-glutamate abundance. This observation suggests that a deficiency in L-glutamate might be associated with the pathogenesis of the PDS subtype of FD. Moreover, the ROC curve analysis demonstrated the diagnostic potential of L-glutamate in FD. These findings suggest that supplementing L-glutamate potentially offers a protective effect on patients with FD.
Regarding serum metabolites with differential abundance, we identified several downregulated metabolites, including taurine, known for its gastric mucosal protective effects [26,27,28], gentisic acid with potential anti-psychiatric and antidepressant-like properties [36,37], uridine with antidepressant effects [38,39], and vaccenic acid with the improvement of intestinal inflammation [41,42]. Furthermore, we observed significant elevations in the abundance of specific metabolites in patients with FD, such as 3-O-Sulfogalactosylceramide associated with metachromatic leukodystrophy [44], Ganglioside GM3 (d18:1/9Z-18:1) closely related to carcinogenesis [45], and Ganglioside GM1 (d18:0/24:0) linked to neuroprotective functions [46]. These differentially abundant metabolites potentially contribute to the pathogenesis of FD and serve as vital biomarkers in patients with FD.
In terms of urine metabolomics, we also found significant alterations in the urine metabolome of FD patients through multivariate statistical analysis. We observed some meaningful differential metabolites, among which it is noteworthy that L-Glutamine in the urine of FD patients showed a significant increase, which was significantly positively correlated with early satiety symptoms and had some predictive value. It is generally believed that L-Glutamine serves as a precursor to L-Glutamate [20]. Therefore, it is not ruled out that an increase in urinary excretion of L-Glutamine may lead to a reduction in the synthesis of L-Glutamate. However, this hypothesis requires further investigation for validation. We also examined the correlation between urine metabolites and blood metabolites, as metabolites in the bloodstream can deeply influence those in urine even when kidney function is normal [70]. Some differential urine metabolites showed strong correlation with serum metabolites, but the clinical significance of these small molecules warrants further clarification.
In the field of urine metabolomics, we specifically focused on exploring the correlation between urine metabolites and blood metabolites, as even in cases of normal renal function, blood metabolites can profoundly influence those in urine. Therefore, we conducted a non-targeted metabolomic analysis of urine samples to elucidate the urine metabolite profiles in patients with FD and their potential correlation with blood metabolites. Using multivariate statistics, we identified significant alterations in the urine metabolome. While some differentially abundant urine metabolites strongly correlate with serum metabolites, the clinical significance of these small-molecule differences needs further clarification. It is hypothesized that, in patients with FD, the importance of differentially abundant blood metabolites outweighs that of urine.
The gut microbiota could play a pivotal role in the observed alterations of specific metabolites [9]. The human gastrointestinal tract harbors trillions of microorganisms, which partially maintain a symbiotic relationship with the human body. Changes in the gut microbiota significantly impact human health, and factors, such as diet, disease, infection, and medication, can alter the composition of the gut microbiota [71,72]. Previous studies have highlighted the changes in the small intestinal microbiota in patients with FD and the influence of alterations in the duodenal microbiota on gastric emptying [10,63]. Nevertheless, the alterations in the fecal microbiota of patients with FD have not yet been investigated. This study identified dysbiosis of the gut microbiota in patients with FD through shotgun metagenomics. Although no significant changes in the structure of microbial communities were observed, our findings suggest that patients with more severe EPS symptoms may exhibit a distinctive gut microbial community structure compared to healthy individuals. Conversely, the gut microbial community structure of patients with the PDS subtype may be more similar to that of healthy volunteers. However, it should be noted that the majority of patients in our study exhibited overlapping symptoms of both EPS and PDS subtypes, possibly contributing to the absence of significant changes in the overall gut microbial community structure in patients with FD. Future studies should consider enrolling individuals with isolated EPS and PDS symptoms to validate our hypothesis.
Furthermore, we emphasize the significance of two pivotal gut microbial species. The abundance of Streptococcus exhibited significant variations in patients with FD. Previous investigations have suggested the elevated abundance of Streptococcus in the oral cavity, esophagus, gastric antrum, duodenal pars descendens, and small intestine of patients with FD [62,63]. In the current investigation, we found a significant increase in the abundance of Streptococcus in the fecal samples of patients with FD, indicating a potential widespread increase in Streptococcus abundance across the entire digestive tract. This finding strongly implies that Streptococcus may play a significant role in the pathogenesis of FD. Furthermore, we identified Streptococcus sp. as the primary species responsible for the notable increase in Streptococcus abundance. Moreover, the potential probiotic Alistipes exhibited a substantial decrease in abundance in the fecal samples of patients with FD. Alistipes is an essential propionate-producing bacterium in the body, with protective effects against inflammatory bowel disease, liver cirrhosis, and liver cancer [56,57], possibly due to its immunomodulatory abilities [48,58]. A prior study has noted a relative decline in Alistipes abundance in individuals with autism, suggesting a potential protective role in psychiatric disorders [59]. Alistipes putredinis and Alistipes putredinis CAG: 67 are the main species responsible for the significant decrease in the abundance of Alistipes at the genus level.
Lastly, we constructed a complex correlation network that captures the interaction between gut microbiota and host co-metabolism. While in vivo and in vitro validations are necessary to confirm these assumed associations, our multi-omics results provide guidance for exploring causal relationships between critical microbial species and metabolites in the occurrence and progression of FD. Our present study identified the gut microbiota and metabolite profiles that were enriched or deficient in individuals with FD, indicating the potential for accurate prediction of FD. Notably, a set of core serum metabolites (L-glutamate, vaccenic acid, and uridine), predominantly sourced from patients with FD, demonstrated remarkably reliable diagnostic accuracy compared to urine metabolites and microbial profiles. Considering the economic burden on patients, we highly recommend the use of serum metabolites as adjunctive tools for the diagnosis and treatment of FD. However, rigorous validation of the accuracy of this model is essential, which requires additional cohorts to be examined.
However, we acknowledge the limitations of our current study. Firstly, our sample size is relatively small, and since FD patients often exhibit overlapping symptoms of EPS and PDS, we couldn't differentiate the multi-omics characteristics of pure EPS or PDS patients in more detail. Moreover, due to the similarity in symptoms between EPS patients and non-erosive reflux disease, the two conditions often overlap and are difficult to differentiate, which hindered our predictive analysis from distinguishing between them. Future research should involve multicenter studies with well-defined FD phenotypes, including those with isolated PDS and EPS, to further validate these findings. Furthermore, more data on the correlation and consistency between serum and urine metabolites in FD patients are needed. Lastly, our findings are primarily data-driven, requiring further in vivo and in vitro experiments for validation.
5. Conclusions
In conclusion, our current study offers initial insight into dysregulated gut microbiota and altered serum and urine metabolome profiles in patients with FD. This condition is characterized by a deficiency of beneficial metabolites and microorganisms, and an elevation of abnormal metabolites and microorganisms. Further investigation is needed to establish whether these specific species directly contribute to FD development. However, the disrupted ecological and metabolic structure may directly or indirectly contribute to the attack of FD. These findings enhance our understanding of the potential involvement of dysregulated metabolites and gut microbiota in the pathogenesis of FD, offering promising targets for FD diagnosis and treatment via multi-omics approaches.
Supplementary Materials
The following supporting information can be downloaded at the website of this paper posted on Preprints.org, Figure S1: Serum metabolite alterations in patients with FD identified through multivariate statistical analysis in negative ion mode; Figure S2: Bar chart representing the significant elevation or decrease in the abundance of crucial metabolites in the serum samples of patients with FD compared to healthy volunteers; Figure S3: Alterations in urine metabolites among patients with FD identified through multivariate statistical analysis in negative ion mode; Figure S4: Analysis of important differential metabolites in the urine of FD patients and their correlation with blood metabolites; Figure S5: Dysregulated microbial community structure specific to FD identified through shotgun metagenomic sequencing; Figure S6: Visualization of beta diversity changes associated with gender, age, BMI, PDS symptom severity score, EPS symptom severity score, and SF36-MH score in FD using db-RDA; Figure S7: Metagenomic analysis of the functional alterations in the gut microbiota of patients with FD; Table S1: 72 serum metabolites with significant differences in abundances (VIP > 1, р < 0.05); Table S2: 285 urine metabolites with significant differences in abundances (VIP > 1, р < 0.05); Table S3: Explanatory power and statistical significance of FD symptom score, age, sex, BMI, and MH score in explaining differences between samples.
Author Contributions
Conceptualization, methodology, X.T., F.W. and L.L.; resources, J.Z. and B.Z.; formal analysis, investigation, Y.W., X.L. and J.L.; data curation, writing—original draft preparation, visualization, Y.W.; writing—review and editing, supervision, L.L. and X.T.; project administration, X.T.and F.W.; funding acquisition, X.T. All authors have read and agreed to the published version of the manuscript.
Funding
Please add: This work was supported by grants from National Natural Science Foundation of China (No. 81673853, 82305136, 82305107), Scientific and Technological Innovation Project of China Academy of Chinese Medical Sciences (No. CI2021B005).
Institutional Review Board Statement
The study was conducted in accordance with the Declaration of Helsinki, and approved by the Ethics Committee of Xiyuan Hospital (protocol code 2017XLA035, 2017).
Informed Consent Statement
Informed consent was obtained from all subjects involved in the study.
Data Availability Statement
Sequence data associated with this project have been deposited in the NCBI Short Read Archive database (https://www.ncbi.nlm.nih.gov/sra/, BioProject ID: PRJNA1020460). Other original contributions presented in the study are included in the article/supplementary material, further inquiries can be directed to the corresponding authors.
Acknowledgments
In this section, you can acknowledge any support given which is not covered by the author contribution or funding sections. This may include administrative and technical support, or donations in kind (e.g., materials used for experiments).
Conflicts of Interest
The authors declare no conflicts of interest.
References
- Enck, P.; Azpiroz, F.; Boeckxstaens, G.; Elsenbruch, S.; Feinle-Bisset, C.; Holtmann, G.; Lackner, J.M.; Ronkainen, J.; Schemann, M.; Stengel, A.; et al. Functional dyspepsia. Nat. Rev. Dis. Primers 2017, 3, 17081. [Google Scholar] [CrossRef] [PubMed]
- Yang, Q.; Zhao, J.; Hao, J.; Li, B.; Huo, Y.; Han, Y.; Wan, L.; Li, J.; Huang, J.; Lu, J.; et al. Serum and urine metabolomics study reveals a distinct diagnostic model for cancer cachexia. Journal of Cachexia, Sarcopenia and Muscle 2018, 9, 71–85. [Google Scholar] [CrossRef] [PubMed]
- Liu, J.; Geng, W.; Sun, H.; Liu, C.; Huang, F.; Cao, J.; Xia, L.; Zhao, H.; Zhai, J.; Li, Q.; et al. Integrative metabolomic characterisation identifies altered portal vein serum metabolome contributing to human hepatocellular carcinoma. Gut 2022, 71, 1203–1213. [Google Scholar] [CrossRef] [PubMed]
- Psychogios, N.; Hau, D.D.; Peng, J.; Guo, A.C.; Mandal, R.; Bouatra, S.; Sinelnikov, I.; Krishnamurthy, R.; Eisner, R.; Gautam, B.; et al. The human serum metabolome. Plos One 2011, 6, e16957. [Google Scholar] [CrossRef] [PubMed]
- Zhang, J.; Wang, X.; Shi, X.; Xie, J.; Zhang, M.; Ma, J.; Wang, F.; Tang, X. Combination of 15 lipid metabolites and motilin to diagnose spleen-deficiency FD. Chin. Med. 2019, 14, 16. [Google Scholar] [CrossRef] [PubMed]
- Shin, S.; Fauman, E.B.; Petersen, A.; Krumsiek, J.; Santos, R.; Huang, J.; Arnold, M.; Erte, I.; Forgetta, V.; Yang, T.; et al. An atlas of genetic influences on human blood metabolites. Nature Genet. 2014, 46, 543–550. [Google Scholar] [CrossRef] [PubMed]
- Long, T.; Hicks, M.; Yu, H.; Biggs, W.H.; Kirkness, E.F.; Menni, C.; Zierer, J.; Small, K.S.; Mangino, M.; Messier, H.; et al. Whole-genome sequencing identifies common-to-rare variants associated with human blood metabolites. Nature Genet. 2017, 49, 568–578. [Google Scholar] [CrossRef] [PubMed]
- Wikoff, W.R.; Anfora, A.T.; Liu, J.; Schultz, P.G.; Lesley, S.A.; Peters, E.C.; Siuzdak, G. Metabolomics analysis reveals large effects of gut microflora on mammalian blood metabolites. Proc. Natl. Acad. Sci. U. S. A. 2009, 106, 3698–3703. [Google Scholar] [CrossRef] [PubMed]
- Bar, N.; Korem, T.; Weissbrod, O.; Zeevi, D.; Rothschild, D.; Leviatan, S.; Kosower, N.; Lotan-Pompan, M.; Weinberger, A.; Le Roy, C.I.; et al. A reference map of potential determinants for the human serum metabolome. Nature 2020, 588, 135–140. [Google Scholar] [CrossRef]
- Shanahan, E.R.; Kang, S.; Staudacher, H.; Shah, A.; Do, A.; Burns, G.; Chachay, V.S.; Koloski, N.A.; Keely, S.; Walker, M.M.; et al. Alterations to the duodenal microbiota are linked to gastric emptying and symptoms in functional dyspepsia. Gut 2023, 72, 929–938. [Google Scholar] [CrossRef]
- Ji, S.; You, Y.; Peng, B.; Zhong, T.; Kuang, Y.; Li, S.; Du, L.; Chen, L.; Sun, X.; Dai, J.; et al. Multi-omics analysis reveals the metabolic regulators of duodenal low-grade inflammation in a functional dyspepsia model. Front. Immunol. 2022, 13, 944591. [Google Scholar] [CrossRef] [PubMed]
- Tziatzios, G.; Gkolfakis, P.; Leite, G.; Mathur, R.; Damoraki, G.; Giamarellos-Bourboulis, E.J.; Triantafyllou, K. Probiotics in Functional Dyspepsia. Microorganisms 2023, 11. [Google Scholar] [CrossRef] [PubMed]
- Ceulemans, M.; Wauters, L.; Vanuytsel, T. Targeting the altered duodenal microenvironment in functional dyspepsia. Curr. Opin. Pharmacol. 2023, 70, 102363. [Google Scholar] [CrossRef] [PubMed]
- Ford, A.C.; Mahadeva, S.; Carbone, M.F.; Lacy, B.E.; Talley, N.J. Functional dyspepsia. Lancet (London, England) 2020, 396, 1689–1702. [Google Scholar] [CrossRef]
- Aro, P.; Talley, N.J.; Agréus, L.; Johansson, S.; Bolling-Sternevald, E.; Storskrubb, T.; Ronkainen, J. Functional dyspepsia impairs quality of life in the adult population - PubMed. Aliment. Pharmacol. Ther. 2011, 33, 1215–1224. [Google Scholar] [CrossRef] [PubMed]
- Goyal, O.; Goyal, P.; Kishore, H.; Kaur, J.; Kumar, P.; Sood, A. Quality of life in Indian patients with functional dyspepsia: Translation and validation of the Hindi version of Short-Form Nepean Dyspepsia Index. Indian Journal of Gastroenterology : Official Journal of the Indian Society of Gastroenterology 2022, 41, 378–388. [Google Scholar] [CrossRef] [PubMed]
- Hantoro, I.F.; Syam, A.F.; Mudjaddid, E.; Setiati, S.; Abdullah, M. Factors associated with health-related quality of life in patients with functional dyspepsia. Health Qual. Life Outcomes 2018, 16, 83. [Google Scholar] [CrossRef] [PubMed]
- Van Oudenhove, L.; Vandenberghe, J.; Vos, R.; Holvoet, L.; Demyttenaere, K.; Tack, J. Risk factors for impaired health-related quality of life in functional dyspepsia. Aliment. Pharmacol. Ther. 2011, 33, 261–274. [Google Scholar] [CrossRef] [PubMed]
- Aziz, I.; Palsson, O.S.; Törnblom, H.; Sperber, A.D.; Whitehead, W.E.; Simrén, M. Epidemiology, clinical characteristics, and associations for symptom-based Rome IV functional dyspepsia in adults in the USA, Canada, and the UK: a cross-sectional population-based study. The Lancet. Gastroenterology & Hepatology 2018, 3, 252–262. [Google Scholar] [CrossRef]
- Tapiero, H.; Mathé, G.; Couvreur, P.; Tew, K.D., II. Glutamine and glutamate. Biomedicine & Pharmacotherapy = Biomedecine & Pharmacotherapie 2002, 56, 446–457. [Google Scholar] [CrossRef]
- Tsai, L.H. Function of GABAergic and glutamatergic neurons in the stomach. J. Biomed. Sci. 2005, 12, 255–266. [Google Scholar] [CrossRef] [PubMed]
- Ishibashi-Shiraishi, I.; Shiraishi, S.; Fujita, S.; Ogawa, S.; Kaneko, M.; Suzuki, M.; Tanaka, T. L-Arginine L-Glutamate Enhances Gastric Motor Function in Rats and Dogs and Improves Delayed Gastric Emptying in Dogs. The Journal of Pharmacology and Experimental Therapeutics 2016, 359, 238–246. [Google Scholar] [CrossRef] [PubMed]
- Kusano, M.; Zai, H.; Hosaka, H.; Shimoyama, Y.; Nagoshi, A.; Maeda, M.; Kawamura, O.; Mori, M. New frontiers in gut nutrient sensor research: monosodium L-glutamate added to a high-energy, high-protein liquid diet promotes gastric emptying: a possible therapy for patients with functional dyspepsia. J. Pharmacol. Sci. 2010, 112, 33–36. [Google Scholar] [CrossRef] [PubMed]
- Mano, F.; Ikeda, K.; Joo, E.; Yamane, S.; Harada, N.; Inagaki, N. Effects of three major amino acids found in Japanese broth on glucose metabolism and gastric emptying. Nutrition (Burbank, Los Angeles County, Calif.) 2018, 46, 153–158. [Google Scholar] [CrossRef] [PubMed]
- Singh, P.; Gollapalli, K.; Mangiola, S.; Schranner, D.; Yusuf, M.A.; Chamoli, M.; Shi, S.L.; Lopes Bastos, B.; Nair, T.; Riermeier, A.; et al. Taurine deficiency as a driver of aging. Science (New York, N.Y.) 2023, 380, eabn9257. [Google Scholar] [CrossRef] [PubMed]
- Kodama, M.; Tsukada, H.; Ooya, M.; Onomura, M.; Saito, T.; Fukuda, K.; Nakamura, H.; Taniguchi, T.; Tominaga, M.; Hosokawa, M.; et al. Gastric mucosal damage caused by monochloramine in the rat and protective effect of taurine: endoscopic observation through gastric fistula. Endoscopy 2000, 32, 294–299. [Google Scholar] [CrossRef] [PubMed]
- Zeybek, A.; Ercan, F.; Cetinel, S.; Cikler, E.; Sağlam, B.; Sener, G. Taurine ameliorates water avoidance stress-induced degenerations of gastrointestinal tract and liver. Dig. Dis. Sci. 2006, 51, 1853–1861. [Google Scholar] [CrossRef] [PubMed]
- Sener, G.; Sehirli, O.; Cetinel, S.; Midillioğlu, S.; Gedik, N.; Ayanoğlu-Dülger, G. Protective effect of taurine against alendronate-induced gastric damage in rats. Fundam. Clin. Pharmacol. 2005, 19, 93–100. [Google Scholar] [CrossRef] [PubMed]
- Park, E.; Elidrissi, A.; Schuller-Levis, G.; Chadman, K.K. Taurine Partially Improves Abnormal Anxiety in Taurine-Deficient Mice. Adv.Exp.Med.Biol. 2019, 1155, 905–921. [Google Scholar] [CrossRef]
- Bhattacharjee, A.; Prajapati, S.K.; Krishnamurthy, S. Supplementation of taurine improves ionic homeostasis and mitochondrial function in the rats exhibiting post-traumatic stress disorder-like symptoms. Eur. J. Pharmacol. 2021, 908, 174361. [Google Scholar] [CrossRef]
- Zhang, C.G.; Kim, S. Taurine induces anti-anxiety by activating strychnine-sensitive glycine receptor in vivo. Annals of Nutrition & Metabolism 2007, 51, 379–386. [Google Scholar] [CrossRef] [PubMed]
- Samuelsson, M.; Gerdin, G.; Ollinger, K.; Vrethem, M. Taurine and glutathione levels in plasma before and after ECT treatment. Psychiatry Res. 2012, 198, 53–57. [Google Scholar] [CrossRef] [PubMed]
- Zhu, Y.; Wang, R.; Fan, Z.; Luo, D.; Cai, G.; Li, X.; Han, J.; Zhuo, L.; Zhang, L.; Zhang, H.; et al. Taurine Alleviates Chronic Social Defeat Stress-Induced Depression by Protecting Cortical Neurons from Dendritic Spine Loss. Cell. Mol. Neurobiol. 2023, 43, 827–840. [Google Scholar] [CrossRef] [PubMed]
- Wu, G.; Ren, S.; Tang, R.; Xu, C.; Zhou, J.; Lin, S.; Feng, Y.; Yang, Q.; Hu, J.; Yang, J. Antidepressant effect of taurine in chronic unpredictable mild stress-induced depressive rats. Sci Rep 2017, 7, 4989. [Google Scholar] [CrossRef] [PubMed]
- Abedi, F.; Razavi, B.M.; Hosseinzadeh, H. A review on gentisic acid as a plant derived phenolic acid and metabolite of aspirin: Comprehensive pharmacology, toxicology, and some pharmaceutical aspects. Phytotherapy Research : Ptr 2020, 34, 729–741. [Google Scholar] [CrossRef] [PubMed]
- Altinoz, M.A.; Ozpinar, A. Acetylsalicylic acid and its metabolite gentisic acid may act as adjunctive agents in the treatment of psychiatric disorders. Behav. Pharmacol. 2019, 30, 627–641. [Google Scholar] [CrossRef] [PubMed]
- Xu, N.; Meng, H.; Liu, T.; Feng, Y.; Qi, Y.; Zhang, D.; Wang, H. Blueberry Phenolics Reduce Gastrointestinal Infection of Patients with Cerebral Venous Thrombosis by Improving Depressant-Induced Autoimmune Disorder via miR-155-Mediated Brain-Derived Neurotrophic Factor. Front. Pharmacol. 2017, 8, 853. [Google Scholar] [CrossRef] [PubMed]
- Carlezon, W.A.J.; Mague, S.D.; Parow, A.M.; Stoll, A.L.; Cohen, B.M.; Renshaw, P.F. Antidepressant-like effects of uridine and omega-3 fatty acids are potentiated by combined treatment in rats. Biol. Psychiatry 2005, 57, 343–350. [Google Scholar] [CrossRef] [PubMed]
- Kondo, D.G.; Sung, Y.; Hellem, T.L.; Delmastro, K.K.; Jeong, E.; Kim, N.; Shi, X.; Renshaw, P.F. Open-label uridine for treatment of depressed adolescents with bipolar disorder. J. Child Adolesc. Psychopharmacol. 2011, 21, 171–175. [Google Scholar] [CrossRef]
- Jacome-Sosa, M.; Vacca, C.; Mangat, R.; Diane, A.; Nelson, R.C.; Reaney, M.J.; Shen, J.; Curtis, J.M.; Vine, D.F.; Field, C.J.; et al. Vaccenic acid suppresses intestinal inflammation by increasing anandamide and related N-acylethanolamines in the JCR:LA-cp rat. J. Lipid Res. 2016, 57, 638–649. [Google Scholar] [CrossRef]
- Wang, Y.; Lu, J.; Ruth, M.R.; Goruk, S.D.; Reaney, M.J.; Glimm, D.R.; Vine, D.F.; Field, C.J.; Proctor, S.D. Trans-11 vaccenic acid dietary supplementation induces hypolipidemic effects in JCR:LA-cp rats. The Journal of Nutrition 2008, 138, 2117–2122. [Google Scholar] [CrossRef] [PubMed]
- Jacome-Sosa, M.M.; Borthwick, F.; Mangat, R.; Uwiera, R.; Reaney, M.J.; Shen, J.; Quiroga, A.D.; Jacobs, R.L.; Lehner, R.; Proctor, S.D.; et al. Diets enriched in trans-11 vaccenic acid alleviate ectopic lipid accumulation in a rat model of NAFLD and metabolic syndrome. The Journal of Nutritional Biochemistry 2014, 25, 692–701. [Google Scholar] [CrossRef] [PubMed]
- Wang, X.; Gupta, J.; Kerslake, M.; Rayat, G.; Proctor, S.D.; Chan, C.B. Trans-11 vaccenic acid improves insulin secretion in models of type 2 diabetes in vivo and in vitro. Mol. Nutr. Food Res. 2016, 60, 846–857. [Google Scholar] [CrossRef] [PubMed]
- Schuster, T.; Mühlstein, A.; Yaghootfam, C.; Maksimenko, O.; Shipulo, E.; Gelperina, S.; Kreuter, J.; Gieselmann, V.; Matzner, U. Potential of surfactant-coated nanoparticles to improve brain delivery of arylsulfatase A. Journal of Controlled Release : Official Journal of the Controlled Release Society 2017, 253, 1–10. [Google Scholar] [CrossRef] [PubMed]
- Zheng, C.; Terreni, M.; Sollogoub, M.; Zhang, Y. Ganglioside GM3 and Its Role in Cancer. Curr. Med. Chem. 2019, 26, 2933–2947. [Google Scholar] [CrossRef] [PubMed]
- Guo, Z. Ganglioside GM1 and the Central Nervous System. Int. J. Mol. Sci. 2023, 24. [Google Scholar] [CrossRef] [PubMed]
- Law, S.; Chan, M.; Marathe, G.K.; Parveen, F.; Chen, C.; Ke, L. An Updated Review of Lysophosphatidylcholine Metabolism in Human Diseases. Int. J. Mol. Sci. 2019, 20. [Google Scholar] [CrossRef] [PubMed]
- Boldyreva, L.V.; Morozova, M.V.; Saydakova, S.S.; Kozhevnikova, E.N. Fat of the Gut: Epithelial Phospholipids in Inflammatory Bowel Diseases. Int. J. Mol. Sci. 2021, 22. [Google Scholar] [CrossRef] [PubMed]
- Sánchez, V.; Baumann, A.; Brandt, A.; Wodak, M.F.; Staltner, R.; Bergheim, I. Oral Supplementation of Phosphatidylcholine Attenuates the Onset of a Diet-Induced Metabolic Dysfunction-Associated Steatohepatitis in Female C57BL/6J Mice. Cell. Mol. Gastroenterol. Hepatol. 2024, 17, 785–800. [Google Scholar] [CrossRef]
- Gauss, A.; Ehehalt, R.; Lehmann, W.; Erben, G.; Weiss, K.; Schaefer, Y.; Kloeters-Plachky, P.; Stiehl, A.; Stremmel, W.; Sauer, P.; et al. Biliary phosphatidylcholine and lysophosphatidylcholine profiles in sclerosing cholangitis. World J. Gastroenterol. 2013, 19, 5454–5463. [Google Scholar] [CrossRef]
- Kawaura, A.; Tanida, N.; Nishikawa, M.; Yamamoto, I.; Sawada, K.; Tsujiai, T.; Kang, K.B.; Izumi, K. Inhibitory effect of 1alpha-hydroxyvitamin D3 on N-methyl-N'-nitro-N-nitrosoguanidine-induced gastrointestinal carcinogenesis in Wistar rats. Cancer Lett. 1998, 122, 227–230. [Google Scholar] [CrossRef] [PubMed]
- Iseki, K.; Tatsuta, M.; Uehara, H.; Iishi, H.; Yano, H.; Sakai, N.; Ishiguro, S. Inhibition of angiogenesis as a mechanism for inhibition by 1alpha-hydroxyvitamin D3 and 1,25-dihydroxyvitamin D3 of colon carcinogenesis induced by azoxymethane in Wistar rats. Int. J. Cancer 1999, 81, 730–733. [Google Scholar] [CrossRef]
- Nishida, S.; Ozeki, J.; Makishima, M. Modulation of bile acid metabolism by 1alpha-hydroxyvitamin D3 administration in mice. Drug Metabolism and Disposition: The Biological Fate of Chemicals 2009, 37, 2037–2044. [Google Scholar] [CrossRef] [PubMed]
- Macêdo, A.P.A.; Muñoz, V.R.; Cintra, D.E.; Pauli, J.R. 12,13-diHOME as a new therapeutic target for metabolic diseases. Life Sci. 2022, 290, 120229. [Google Scholar] [CrossRef] [PubMed]
- Buchfink, B.; Xie, C.; Huson, D.H. Fast and sensitive protein alignment using DIAMOND. Nat. Methods 2015, 12, 59–60. [Google Scholar] [CrossRef] [PubMed]
- Sung, C.M.; Lin, Y.; Chen, K.; Ke, H.; Huang, H.; Gong, Y.; Tsai, W.; You, J.; Lu, M.J.; Cheng, H.; et al. Predicting Clinical Outcomes of Cirrhosis Patients With Hepatic Encephalopathy From the Fecal Microbiome. Cell. Mol. Gastroenterol. Hepatol. 2019, 8, 301–318. [Google Scholar] [CrossRef] [PubMed]
- Dziarski, R.; Park, S.Y.; Kashyap, D.R.; Dowd, S.E.; Gupta, D. Pglyrp-Regulated Gut Microflora Prevotella falsenii, Parabacteroides distasonis and Bacteroides eggerthii Enhance and Alistipes finegoldii Attenuates Colitis in Mice. Plos One 2016, 11, e146162. [Google Scholar] [CrossRef] [PubMed]
- Parker, B.J.; Wearsch, P.A.; Veloo, A.C.M.; Rodriguez-Palacios, A. The Genus Alistipes: Gut Bacteria With Emerging Implications to Inflammation, Cancer, and Mental Health. Front. Immunol. 2020, 11, 906. [Google Scholar] [CrossRef] [PubMed]
- Strati, F.; Cavalieri, D.; Albanese, D.; De Felice, C.; Donati, C.; Hayek, J.; Jousson, O.; Leoncini, S.; Renzi, D.; Calabrò, A.; et al. New evidences on the altered gut microbiota in autism spectrum disorders. Microbiome 2017, 5, 24. [Google Scholar] [CrossRef]
- Marquart, M.E. Pathogenicity and virulence of Streptococcus pneumoniae: Cutting to the chase on proteases. Virulence 2021, 12, 766–787. [Google Scholar] [CrossRef]
- Li, Q.; Hu, W.; Liu, W.; Zhao, L.; Huang, D.; Liu, X.; Chan, H.; Zhang, Y.; Zeng, J.; Coker, O.O.; et al. Streptococcus thermophilus Inhibits Colorectal Tumorigenesis Through Secreting β-Galactosidase. Gastroenterology 2021, 160, 1179–1193. [Google Scholar] [CrossRef] [PubMed]
- Fukui, A.; Takagi, T.; Naito, Y.; Inoue, R.; Kashiwagi, S.; Mizushima, K.; Inada, Y.; Inoue, K.; Harusato, A.; Dohi, O.; et al. Higher Levels of Streptococcus in Upper Gastrointestinal Mucosa Associated with Symptoms in Patients with Functional Dyspepsia. Digestion 2020, 101, 38–45. [Google Scholar] [CrossRef] [PubMed]
- Zhong, L.; Shanahan, E.R.; Raj, A.; Koloski, N.A.; Fletcher, L.; Morrison, M.; Walker, M.M.; Talley, N.J.; Holtmann, G. Dyspepsia and the microbiome: time to focus on the small intestine. Gut 2017, 66, 1168–1169. [Google Scholar] [CrossRef] [PubMed]
- Buchfink, B.; Reuter, K.; Drost, H. Sensitive protein alignments at tree-of-life scale using DIAMOND. Nat. Methods 2021, 18, 366–368. [Google Scholar] [CrossRef] [PubMed]
- Mars, R.A.T.; Yang, Y.; Ward, T.; Houtti, M.; Priya, S.; Lekatz, H.R.; Tang, X.; Sun, Z.; Kalari, K.R.; Korem, T.; et al. Longitudinal Multi-omics Reveals Subset-Specific Mechanisms Underlying Irritable Bowel Syndrome. Cell 2020, 182, 1460–1473. [Google Scholar] [CrossRef] [PubMed]
- Dar, M.A.; Arafah, A.; Bhat, K.A.; Khan, A.; Khan, M.S.; Ali, A.; Ahmad, S.M.; Rashid, S.M.; Rehman, M.U. Multiomics technologies: role in disease biomarker discoveries and therapeutics. Brief. Funct. Genomics 2023, 22, 76–96. [Google Scholar] [CrossRef] [PubMed]
- Chen, S.H.; Lei, H.L.; Huang, L.R.; Tsai, L.H. Protective effect of excitatory amino acids on cold-restraint stress-induced gastric ulcers in mice: role of cyclic nucleotides. Dig. Dis. Sci. 2001, 46, 2285–2291. [Google Scholar] [CrossRef] [PubMed]
- Akiba, Y.; Watanabe, C.; Mizumori, M.; Kaunitz, J.D. Luminal L-glutamate enhances duodenal mucosal defense mechanisms via multiple glutamate receptors in rats. American Journal of Physiology. Gastrointestinal and Liver Physiology 2009, 297, G781–G791. [Google Scholar] [CrossRef] [PubMed]
- Lin, M.; Zhang, B.; Yu, C.; Li, J.; Zhang, L.; Sun, H.; Gao, F.; Zhou, G. L-Glutamate supplementation improves small intestinal architecture and enhances the expressions of jejunal mucosa amino acid receptors and transporters in weaning piglets. Plos One 2014, 9, e111950. [Google Scholar] [CrossRef]
- Jain, R.B. Factors affecting the variability in the observed levels of cadmium in blood and urine among former and current smokers aged 20-64 and ≥ 65years. Environmental Science and Pollution Research International 2017, 24, 8837–8851. [Google Scholar] [CrossRef]
- Cryan, J.F.; O'Mahony, S.M. The microbiome-gut-brain axis: from bowel to behavior. Neurogastroenterology and Motility : The Official Journal of the European Gastrointestinal Motility Society 2011, 23, 187–192. [Google Scholar] [CrossRef] [PubMed]
- Turnbaugh, P.J.; Ridaura, V.K.; Faith, J.J.; Rey, F.E.; Knight, R.; Gordon, J.I. The effect of diet on the human gut microbiome: a metagenomic analysis in humanized gnotobiotic mice. Sci. Transl. Med. 2009, 1, 6ra14. [Google Scholar] [CrossRef] [PubMed]
Figure 1.
Alterations in serum metabolite and metabolic pathways identified through multivariate statistical analysis in positive ion mode for patients with FD. (A) PCA score plot representing serum samples from patients with FD and healthy volunteers. Scores of patients with FD are in blue, and those of healthy volunteers are represented in green. There are relative coordinate points on PCs (PC1 and PC2), and the distances between these points represent the degree of clustering and dispersion among the samples. Greater distances signify more significant differences between samples. (B) PLS-DA score plot of serum samples from patients with FD and healthy volunteers. Components 1 and 2 indicate explanatory powers of the first and second PCs, respectively, with increased separation implying more significant classification. (C) Cross-validation plot with 200 repeated permutation tests. R2 = (0, 0.2377) and Q2 = (0, -0.2517) indicate that the PLS-DA model avoids overfitting. (D) Venn diagram showing the number of overlapping metabolites in the two groups. The numbers in the overlapping regions represent the common metabolites, while the numbers in the non-overlapping region signify group-specific metabolites. (E) Volcano plot illustrating the comparison of metabolites between the patients with FD and healthy volunteers. Student's t-test was utilized for inter-group comparisons, with significantly altered metabolites presented in red (upregulated) or blue (downregulated). The position of each metabolite on the plot indicates the significance of the abundance difference, with more significant differences positioning towards the far left, far right, or top. (F) Topological analysis of differentially abundant metabolites with KEGG pathways. Each bubble represents a KEGG pathway, with the X-axis showing relative metabolite importance and the Y-axis representing metabolite enrichment significance (-log10[р-value]). Bubble size corresponds to Impact Value, with larger bubbles indicating greater pathway importance. FD: functional dyspepsia; PCA: principal component analysis; PC: principal component; VIP: variable importance in projection; PLS-DA: partial least squares discriminant analysis; KEGG: Kyoto Encyclopedia of Genes and Genomes.
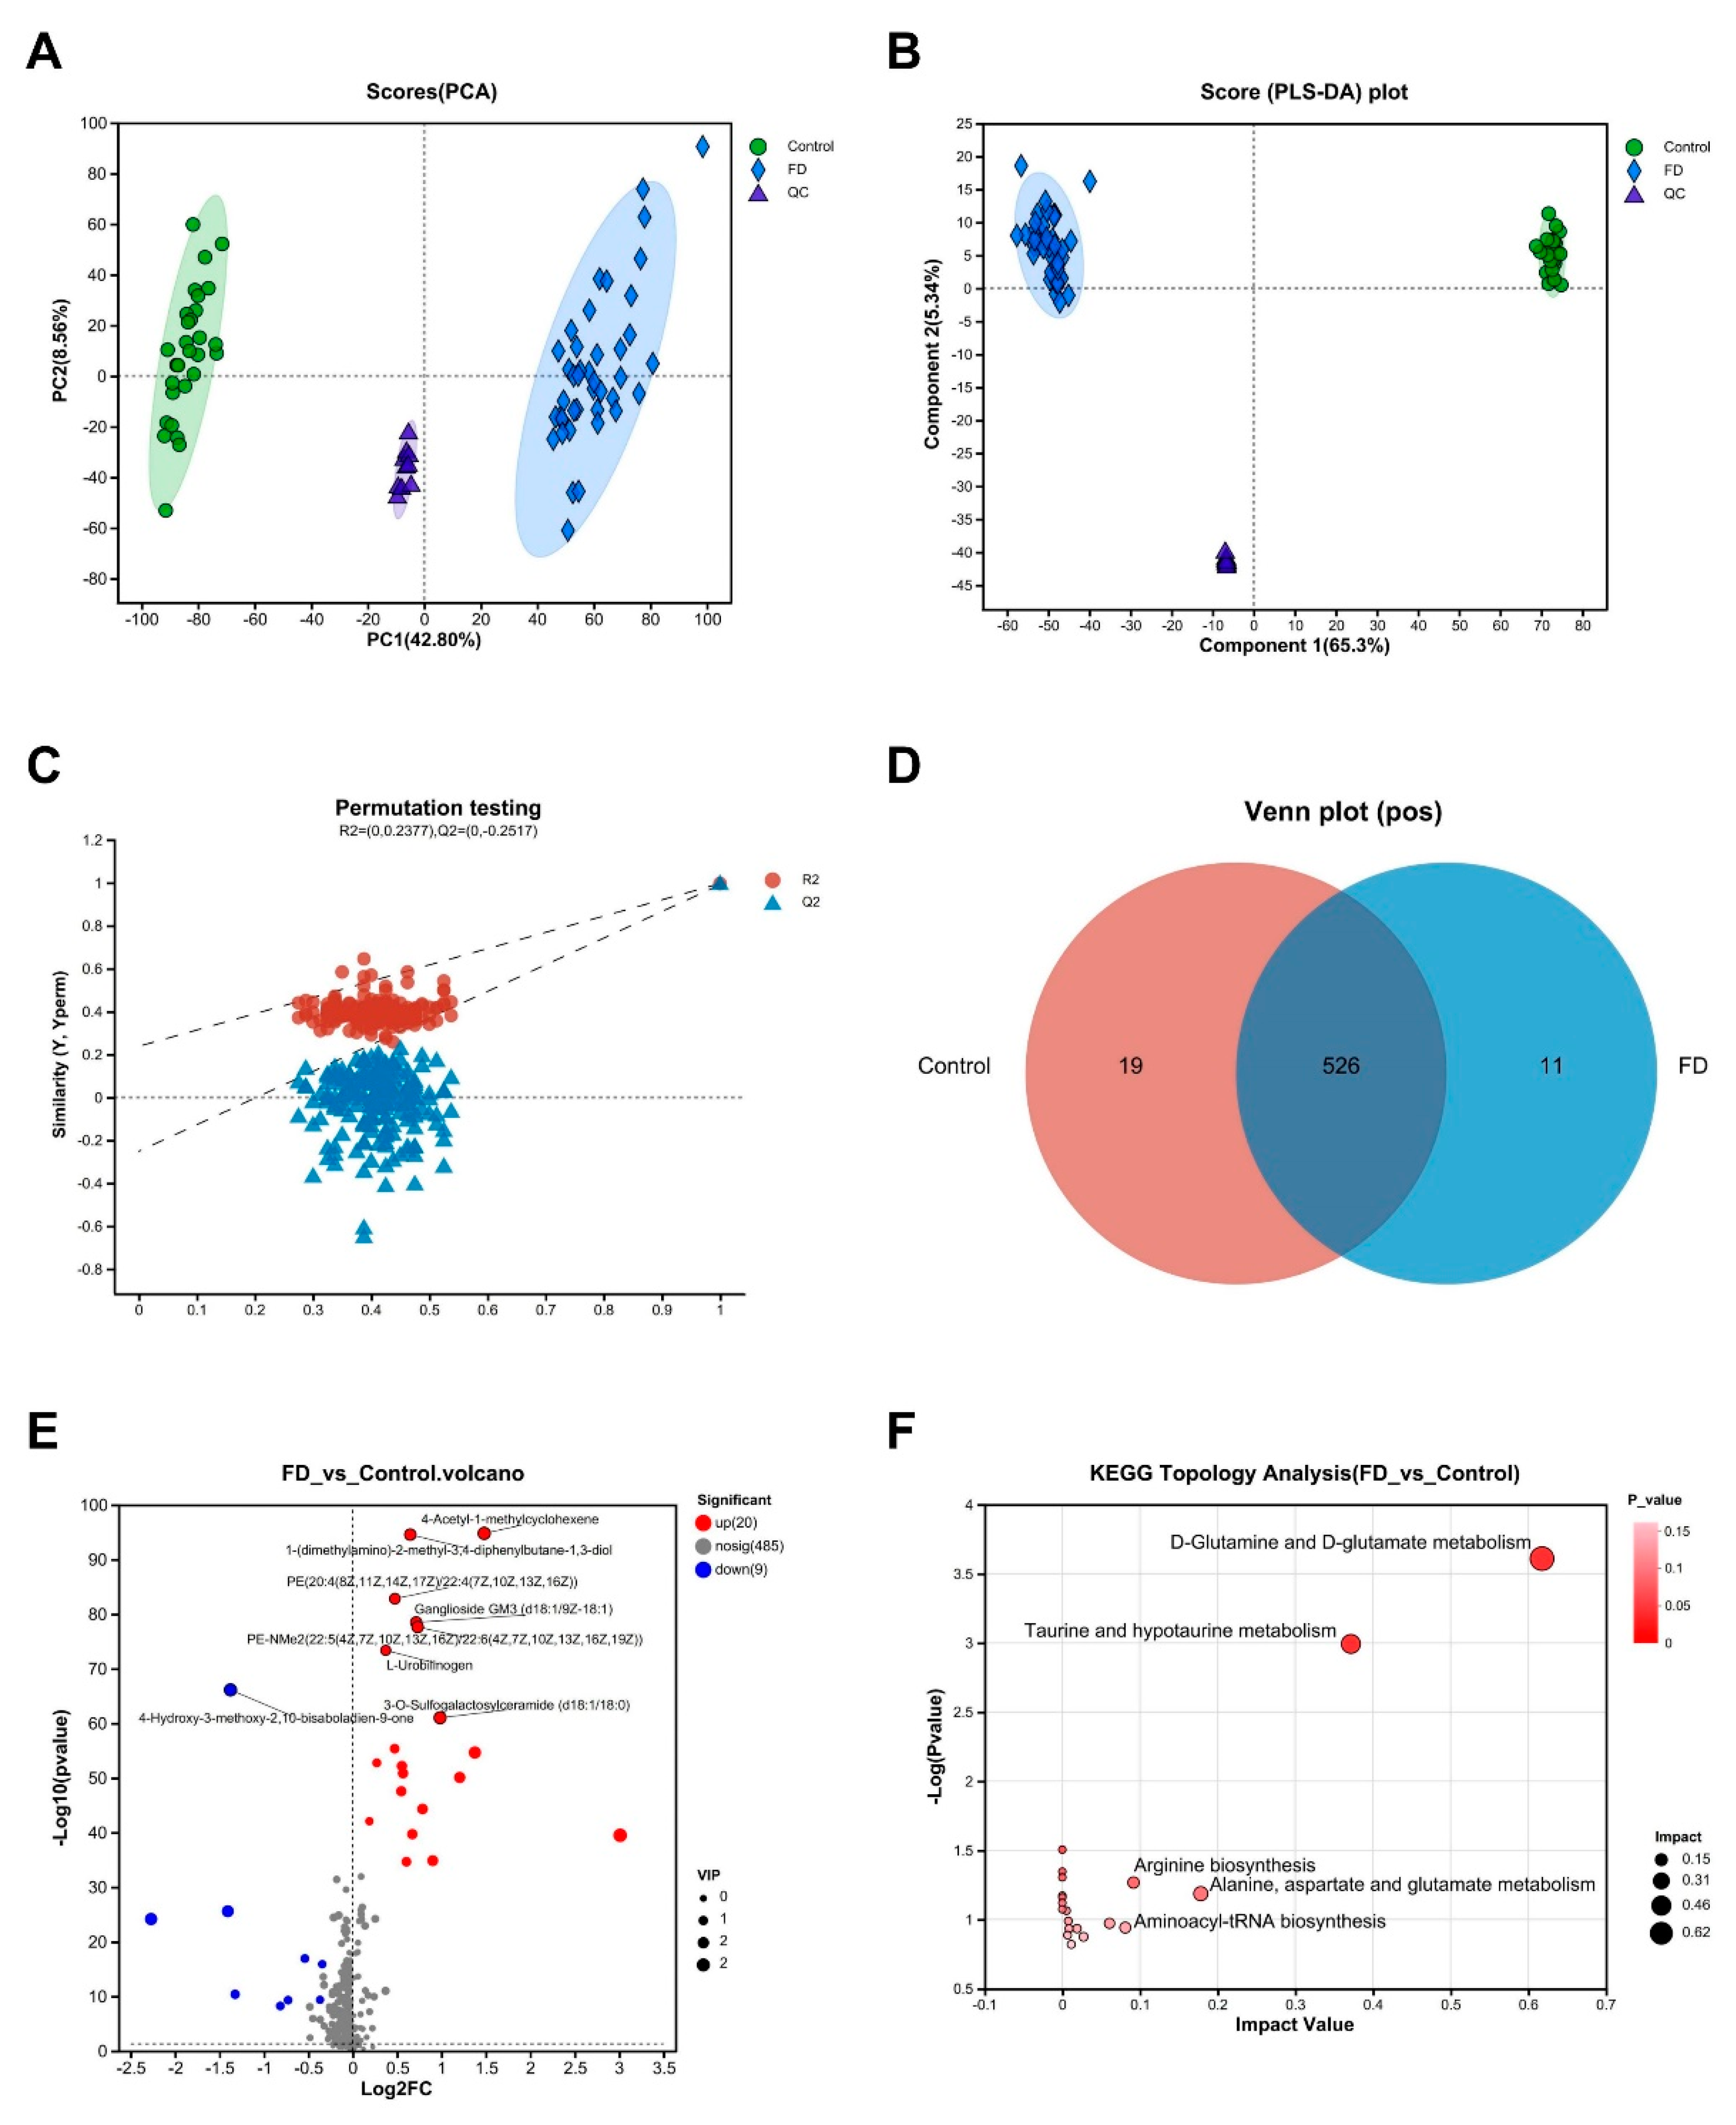
Figure 2.
Analysis of differentially abundant serum metabolites and their diagnostic significance in patients with FD. (A) Clustering heatmap and bar plot of VIP scores. The left panel illustrates the clustering dendrogram of metabolites, where closer branches indicate similar abundance patterns of all metabolites in the samples. The color denotes the relative abundance of each metabolite in each group. The right panel represents the bar plot of VIP scores, where the bar length indicates the contribution of the metabolite to the differences between the two groups, with higher values indicating more pronounced differences. The color of the bars indicates the significance of the metabolite differences between the two groups. (B) Spearman correlation analysis for the association between differentially abundant metabolites and clinical symptom scores. Different colors represent the magnitude of correlation coefficients between attributes. (C) ROC analysis of four significant metabolites to determine their diagnostic value for FD. For vaccenic acid, AUC = 0.923, 95% CI: 0.862-0.984. For L-glutamate, AUC = 0.884, 95% CI: 0.801-0.967. For uridine, AUC = 0.839, 95% CI: 0.75-0.929. For gentisic acid, AUC = 0.724, 95% CI: 0.605-0.843. The points on the curves indicate the optimal threshold for distinguishing between the two classes based on the ROC curve.* р < 0.05, ** р < 0.01, *** р < 0.001. FD, functional dyspepsia; VIP, variable importance in projection; ROC, receiver operator characteristic; AUC, area under the curve.
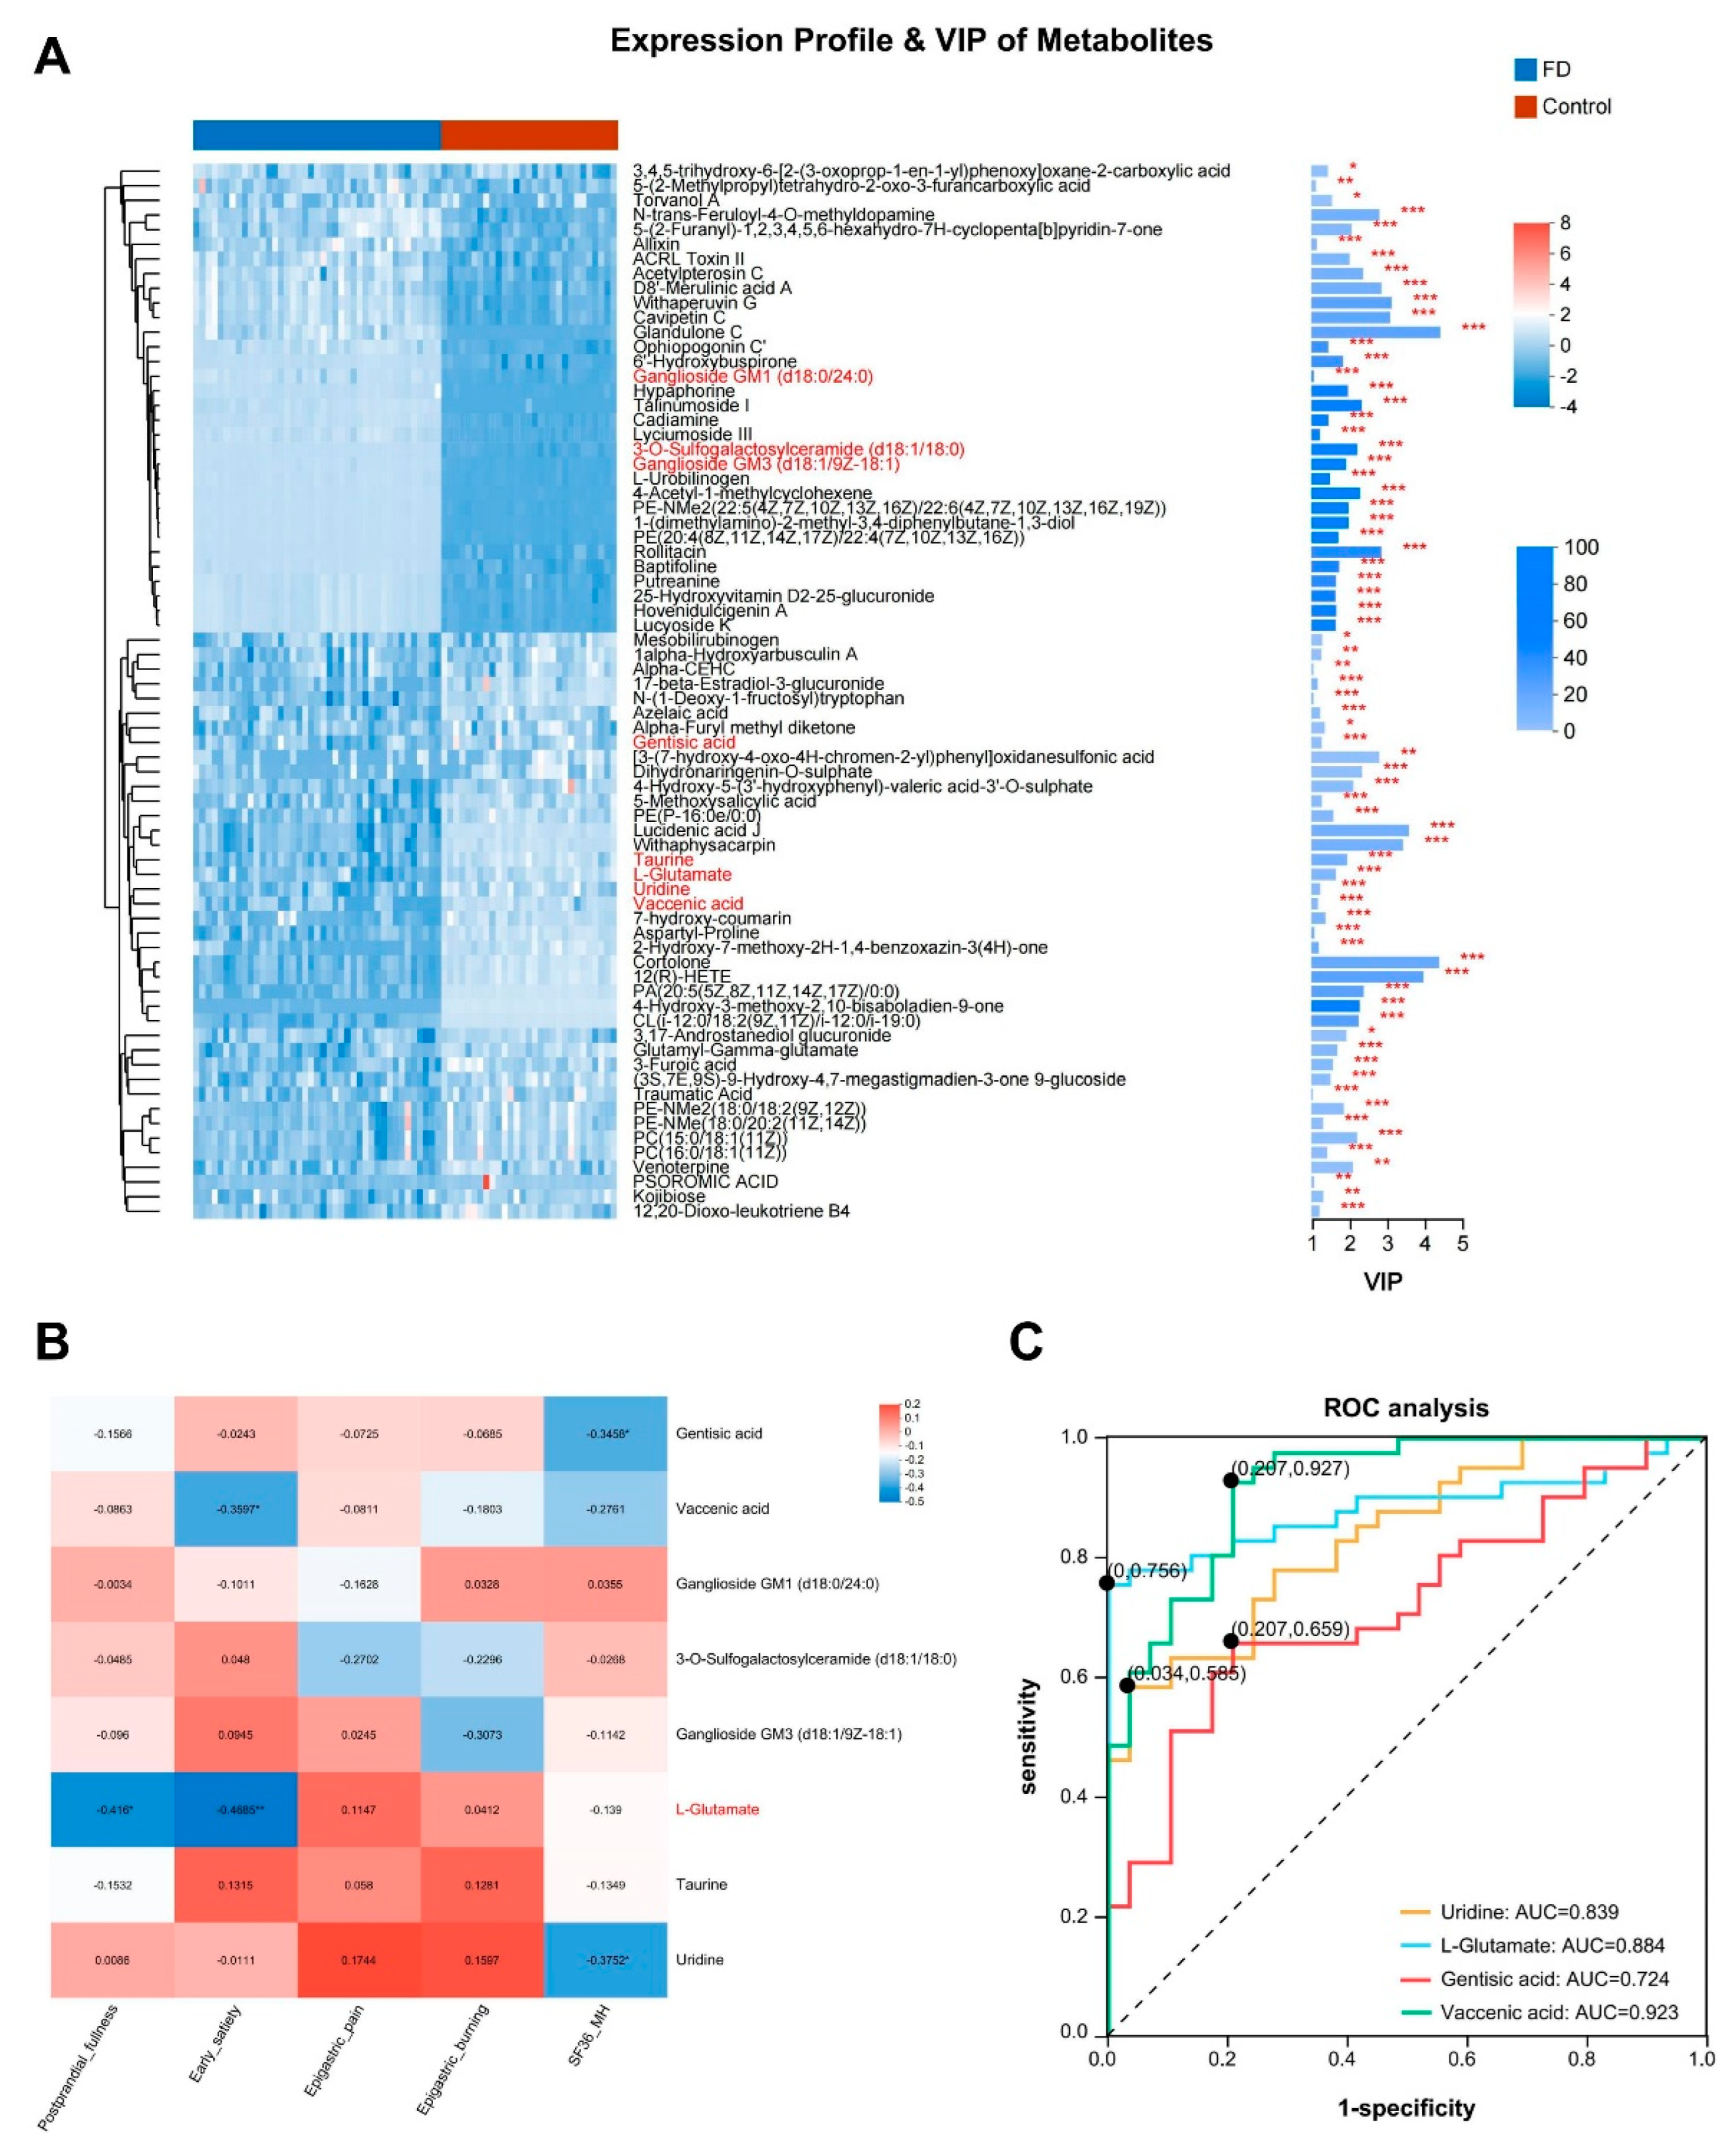
Figure 3.
Alterations in urine metabolites and pathways in patients with FD revealed through multivariate statistical analysis in positive ion mode. (A) PCA score plot of urine samples from patients with FD and healthy volunteers. Scores of patients with FD are in blue, and those of healthy volunteers are in green. There are relative coordinates on PCs (PC1 and PC2), and the distances between them reflect the extent of clustering and dispersion among samples. A greater distance indicates a more considerable difference between the samples. (B) PLS-DA score plot of urine samples from patients with FD and healthy volunteers. Components 1 and 2 indicate the explanatory powers of the first and second PCs, respectively. Greater separation between the two groups suggests a more pronounced classification effect. (C) Cross-validation plot with a permutation test repeated 200 times. R2 = (0, 0.8037) and Q2 = (0, -0.7029) confirm that the PLS-DA model avoids overfitting the data. (D) Venn diagram showing the number of overlapping in the two groups. The numbers in the overlapping regions represent the number of metabolites common to both groups, and the numbers in the non-overlapping regions represent the number of metabolites specific to each group. (E) Volcano plot illustrating the comparison of metabolites between patients in FD and healthy volunteers. Student's t-test was used for inter-group comparison, and metabolites with significant changes are presented in red (upregulated) or blue (downregulated). The position of each metabolite on the plot indicates the significance of the abundance difference, with more prominent differences appearing on the far left, far right, or top of the plot. (F) Topological analysis of differentially abundant metabolites with KEGG pathways. Each bubble symbolizes a KEGG pathway, with the X-axis representing the relative metabolite importance and the Y-axis representing the significance of metabolite enrichment significance (-log10[р-value]). Bubble size corresponds to the Impact Value, with larger bubbles indicating greater pathway importance. FD: functional dyspepsia; PCA: principal component analysis; PC: principal component; VIP: variable importance in projection; PLS-DA: partial least squares discriminant analysis; KEGG: Kyoto Encyclopedia of Genes and Genomes.
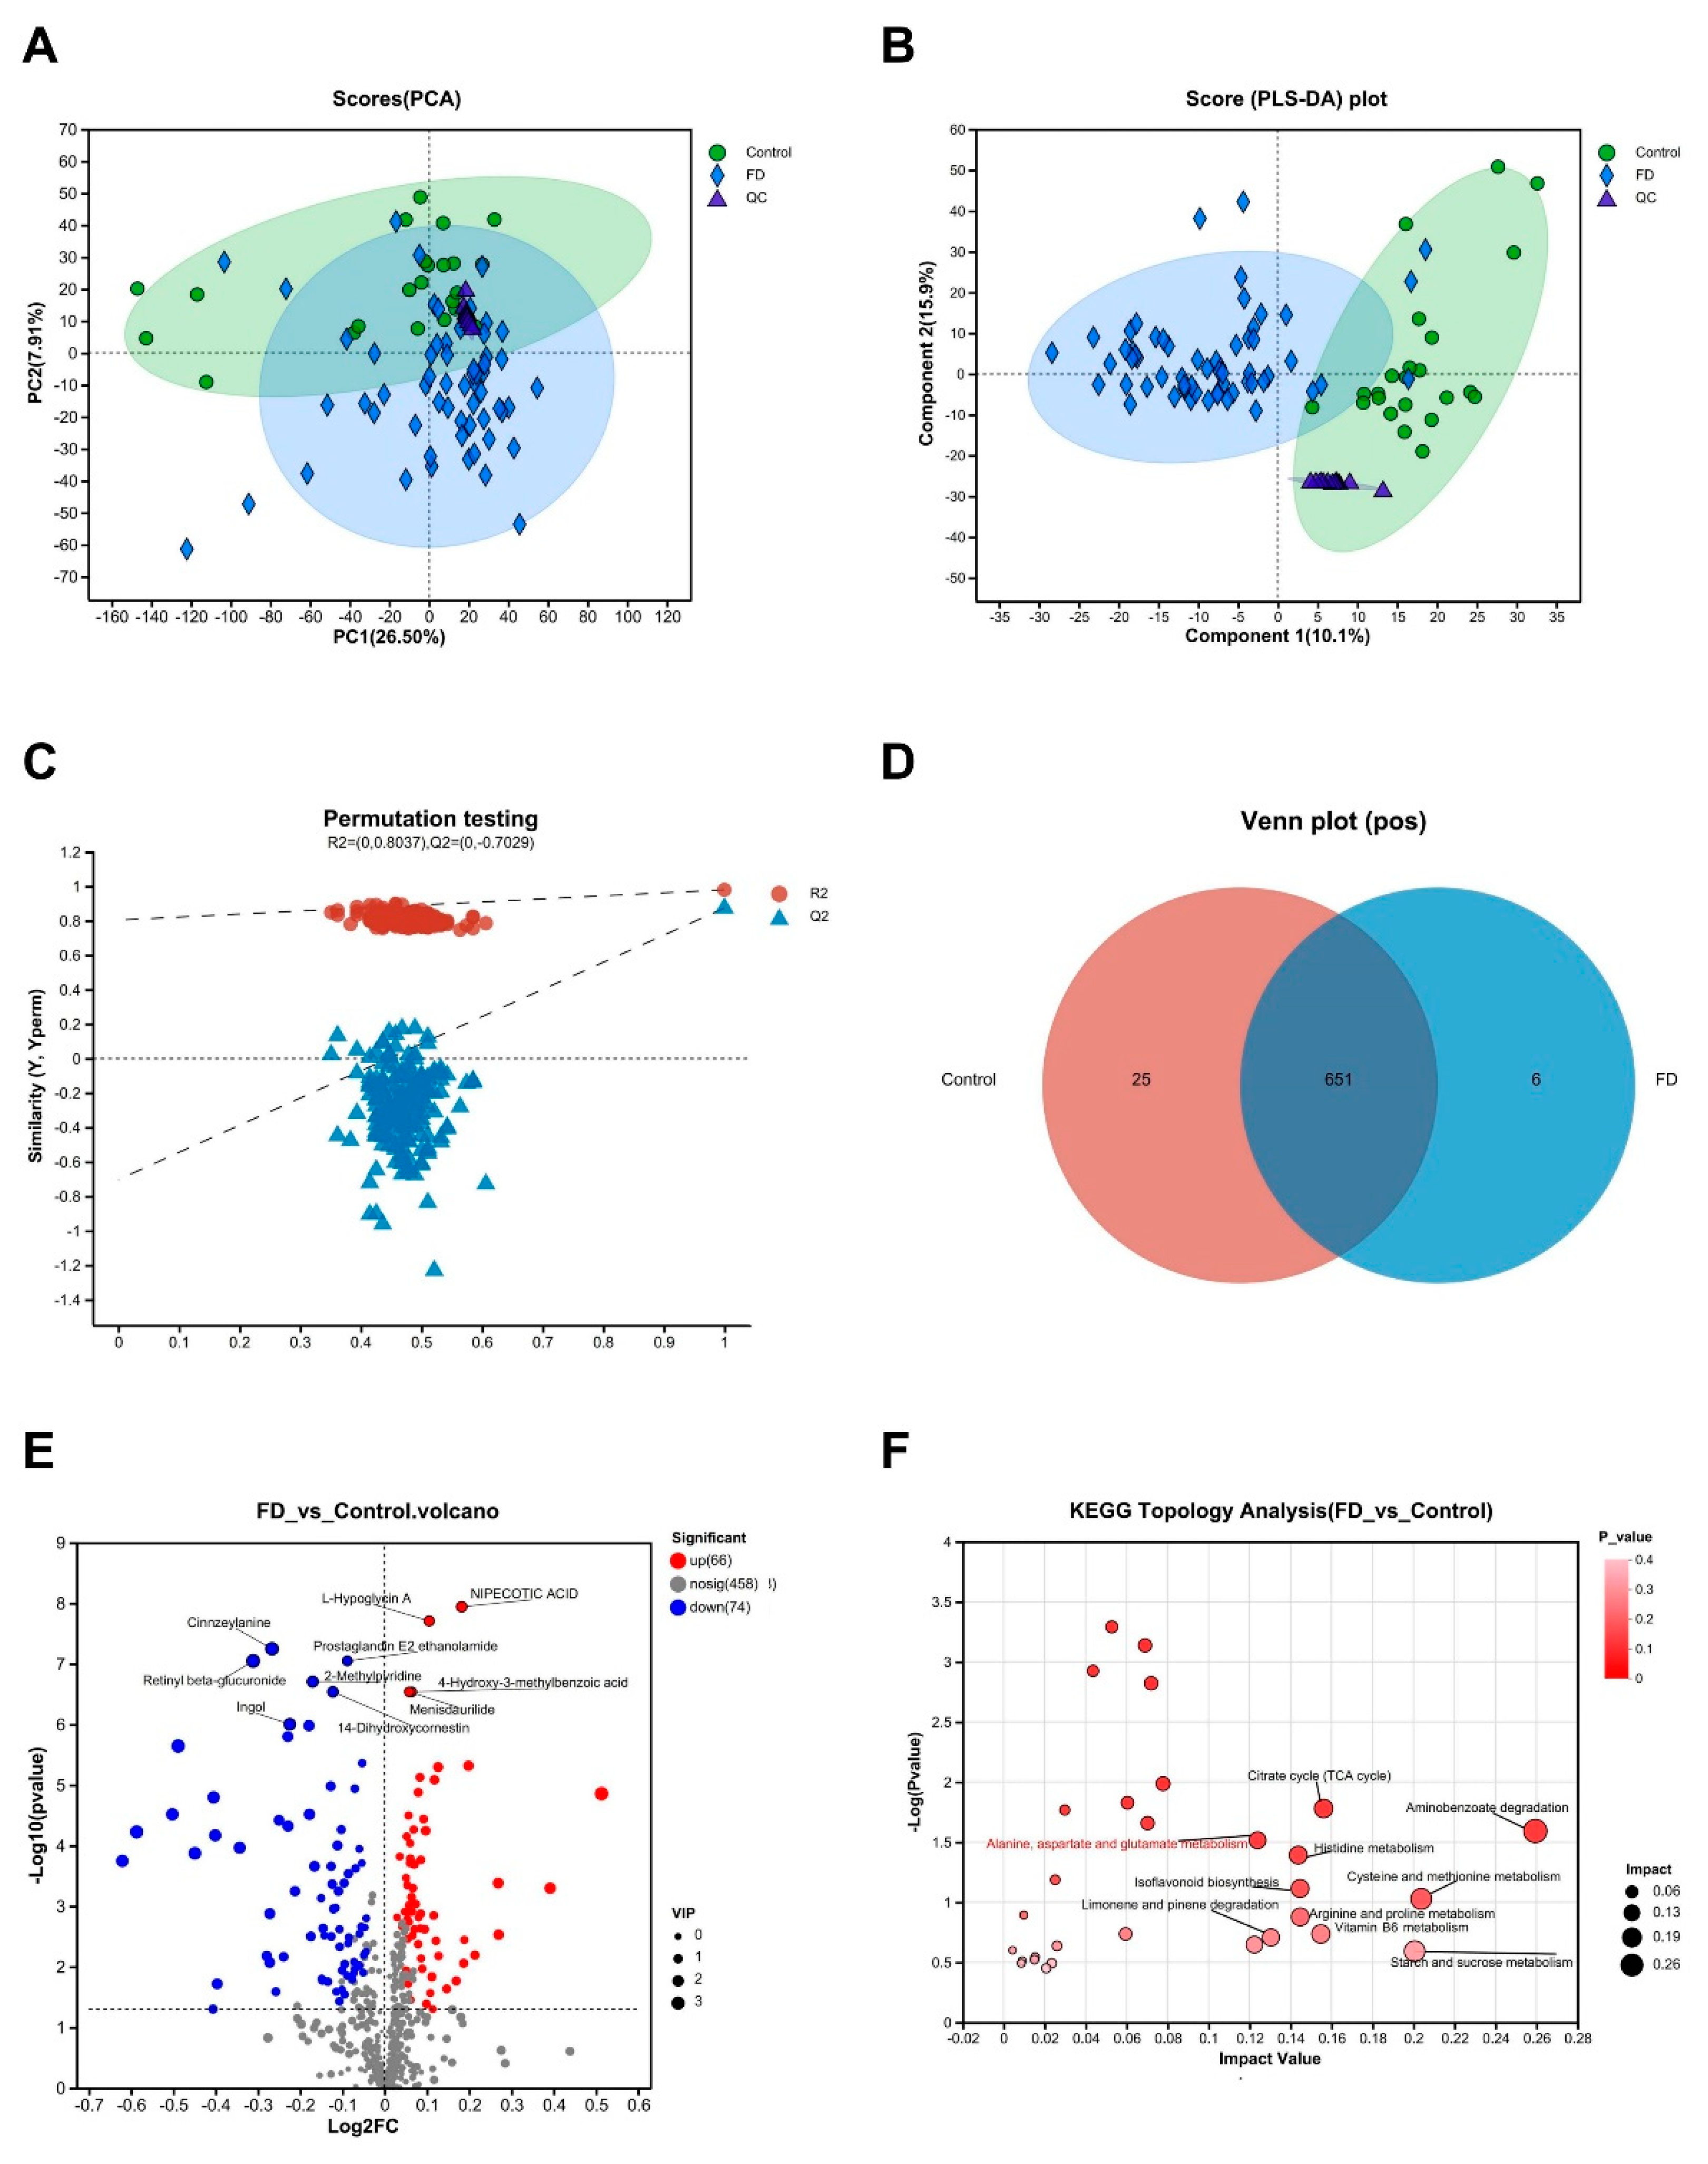
Figure 4.
Analysis of differentially abundant urine metabolites and their diagnostic significance in patients with FD. (A) Clustering heatmap and bar plot of VIP scores. The left panel represents the clustering dendrogram of metabolites, with closer branches signifying similar abundance patterns among all metabolites in the samples. The color indicates relative metabolite abundance in each group. The right panel displays the bar plot of VIP scores, where the bar length indicates the contribution of the metabolite to inter-group differences, with higher values indicating more significant differences. The bar color represents the significance of metabolite differences between the two groups. (B) Spearman correlation analysis for the association between differentially abundant metabolites and clinical symptom scores. Different colors represent the magnitude of correlation coefficients between attributes. (C) ROC analysis of two significant metabolites to determine their diagnostic value for FD. For L-Glutamine, AUC = 0.727, 95% CI: 0.599 - 0.855. For 1alpha-hydroxyvitamin D3, AUC = 0.798, 95% CI: 0.703 - 0.893. The points on the curves indicate the optimal threshold for distinguishing between the two classes based on the ROC curve. * р < 0.05, ** р < 0.01, *** р < 0.001. FD: functional dyspepsia; VIP: variable importance in projection; ROC, receiver operator characteristic; AUC: area under the curve.
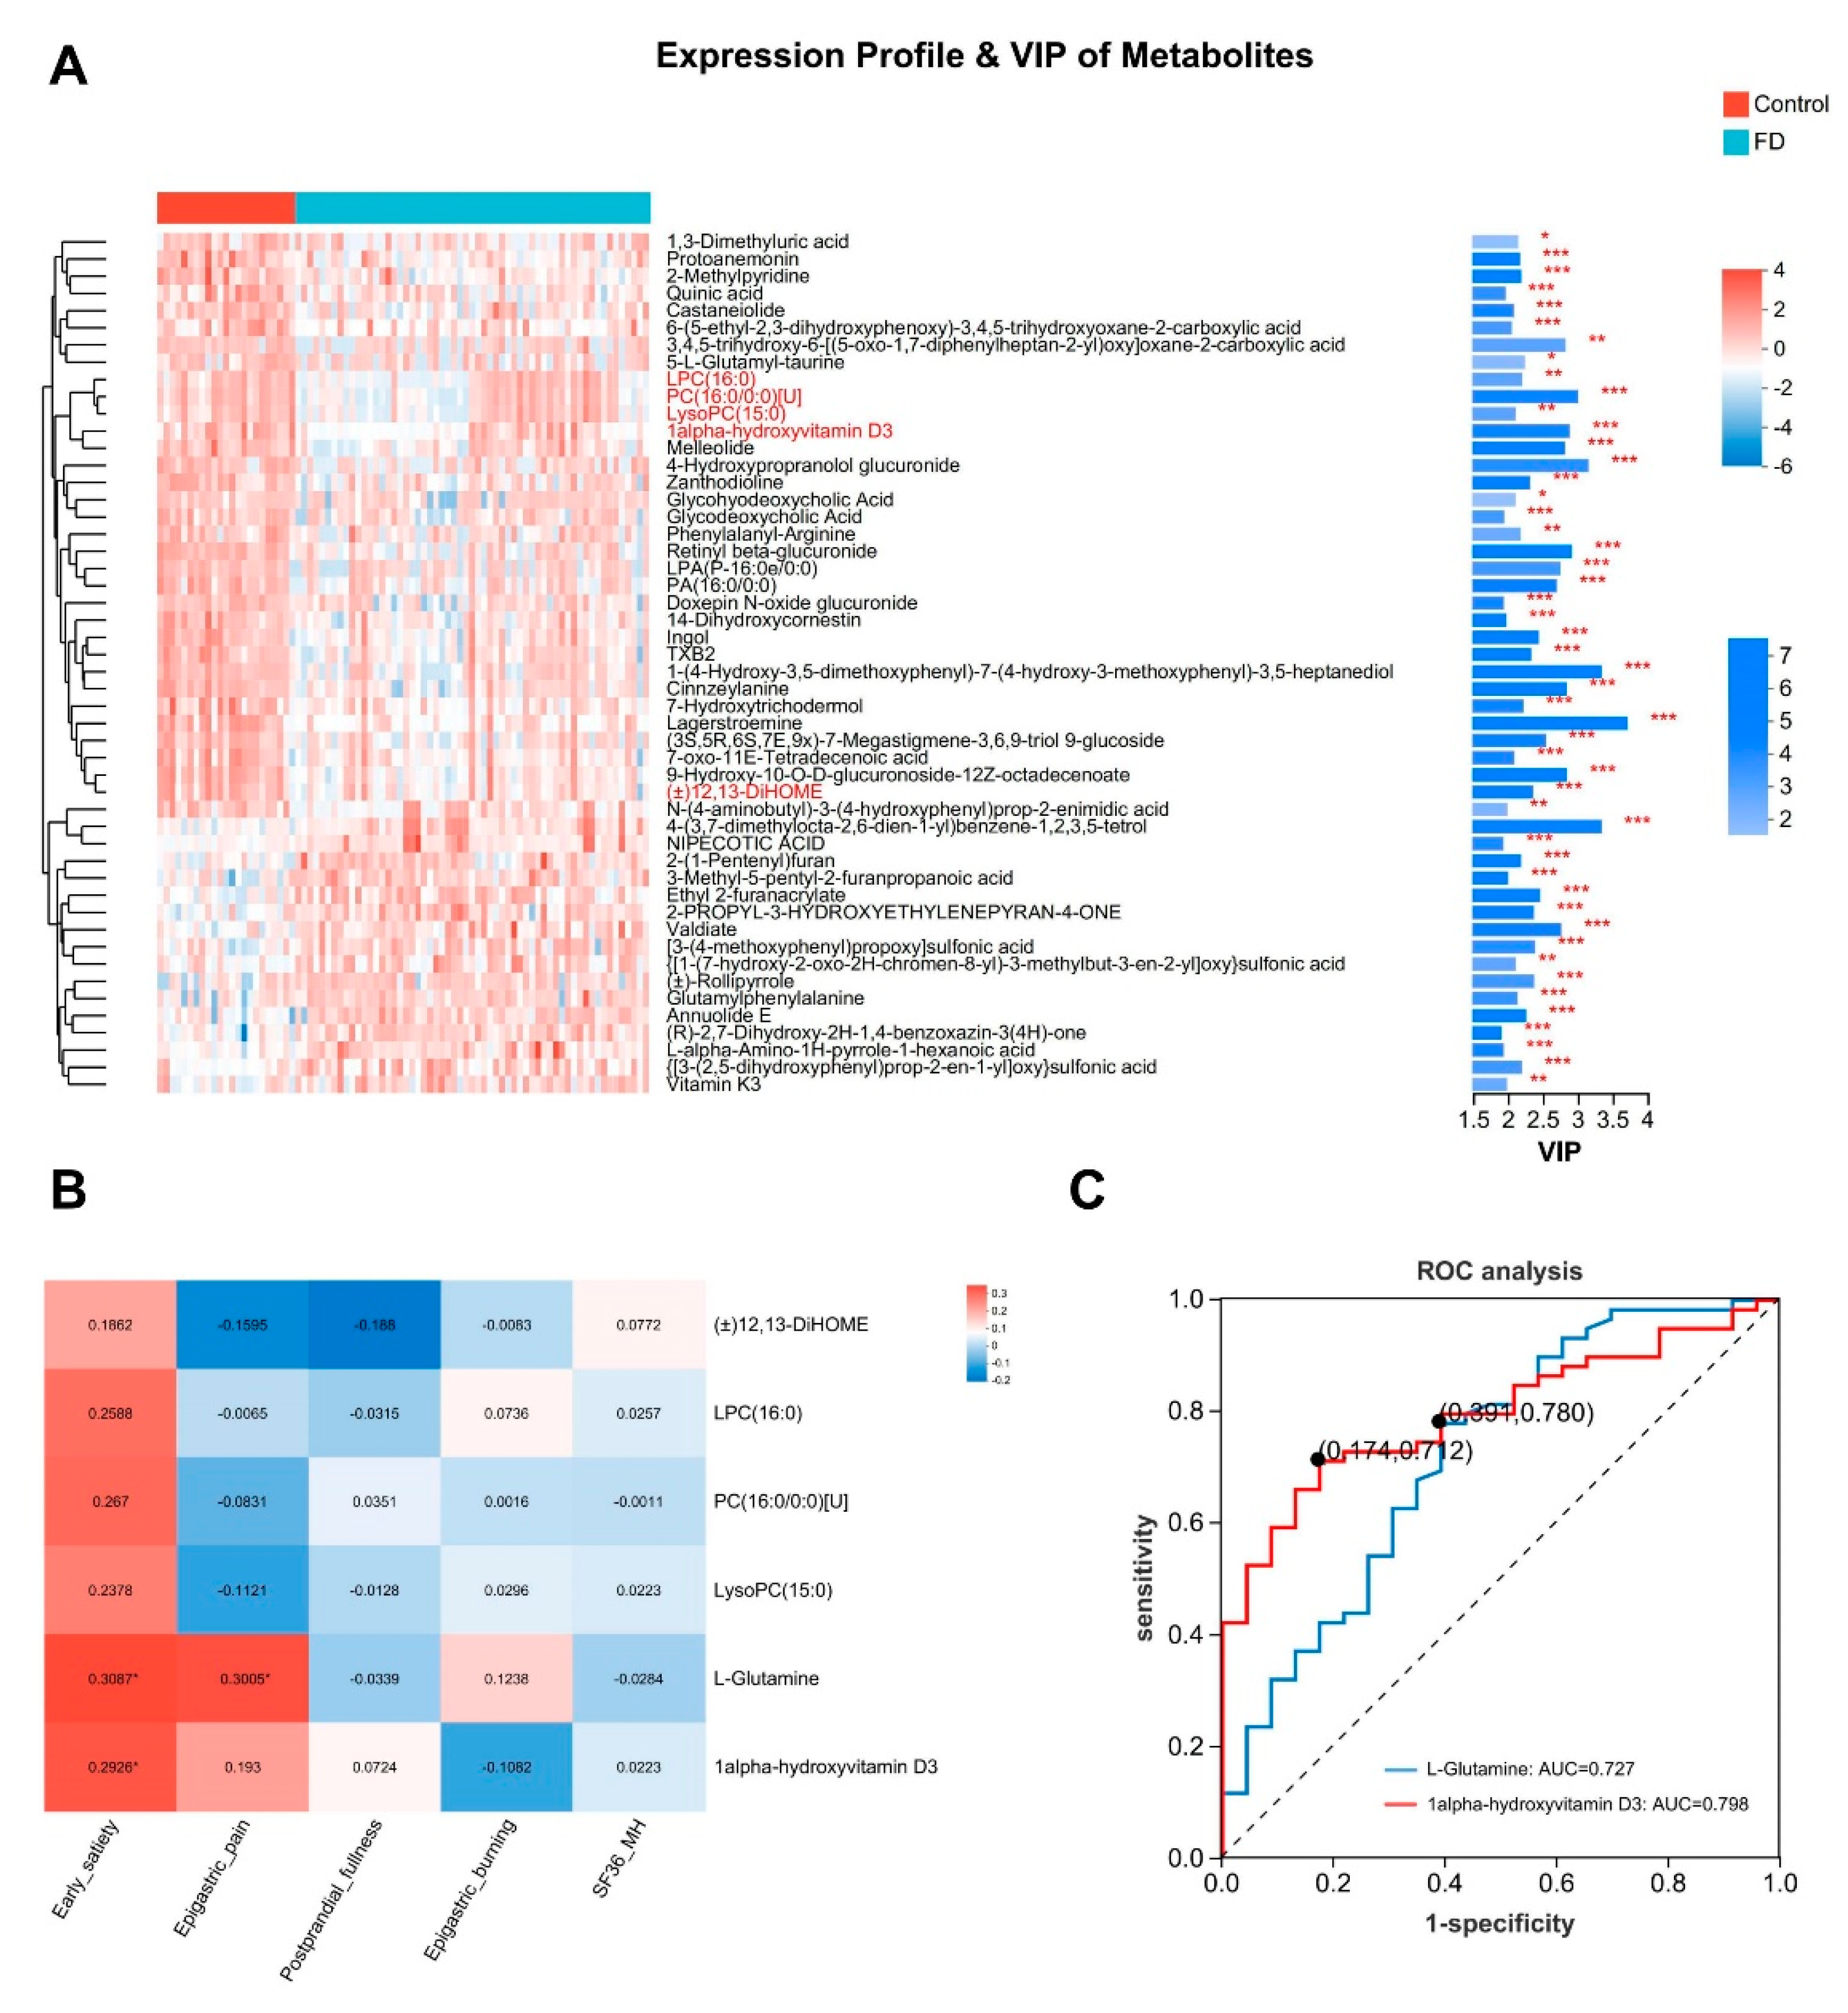
Figure 5.
Metagenomic analysis of the alterations in gut-specific species abundance in patients with FD. (A-B) Venn diagrams at genus and species levels, where the numbers in the overlapping regions represent the shared species between the two groups, and the numbers in the non-overlapping regions represent the unique metabolites in each group. (C) Community bar plot. Different colored bars represent different species, and the length of the bars represents the proportional abundance of each species. (D-E) Bar plots depicting the differentially abundant species at the genus and species levels based on the Wilcoxon rank-sum test (Top: 15). The Y-axis indicates the names of the species at different taxonomic levels, and the X-axis represents the percentage abundance of a particular species in the sample. * р < 0.05, ** р < 0.01. (F) ROC curves for Alistipes putredinis, Alistipes putredinis CAG:67, and Streptococcus sp. Alistipes putredinis: AUC = 0.665, 95% CI: 0.515–0.815, Alistipes putredinis CAG:67: AUC = 0.649, 95% CI: 0.492–0.806, and Streptococcus sp.: AUC = 0.693, 95% CI: 0.558–0.828. The points along the curves indicate the optimal threshold for distinguishing between the two groups based on the ROC curve. FD, functional dyspepsia; ROC, receiver operator characteristic curve; AUC, area under the curve.
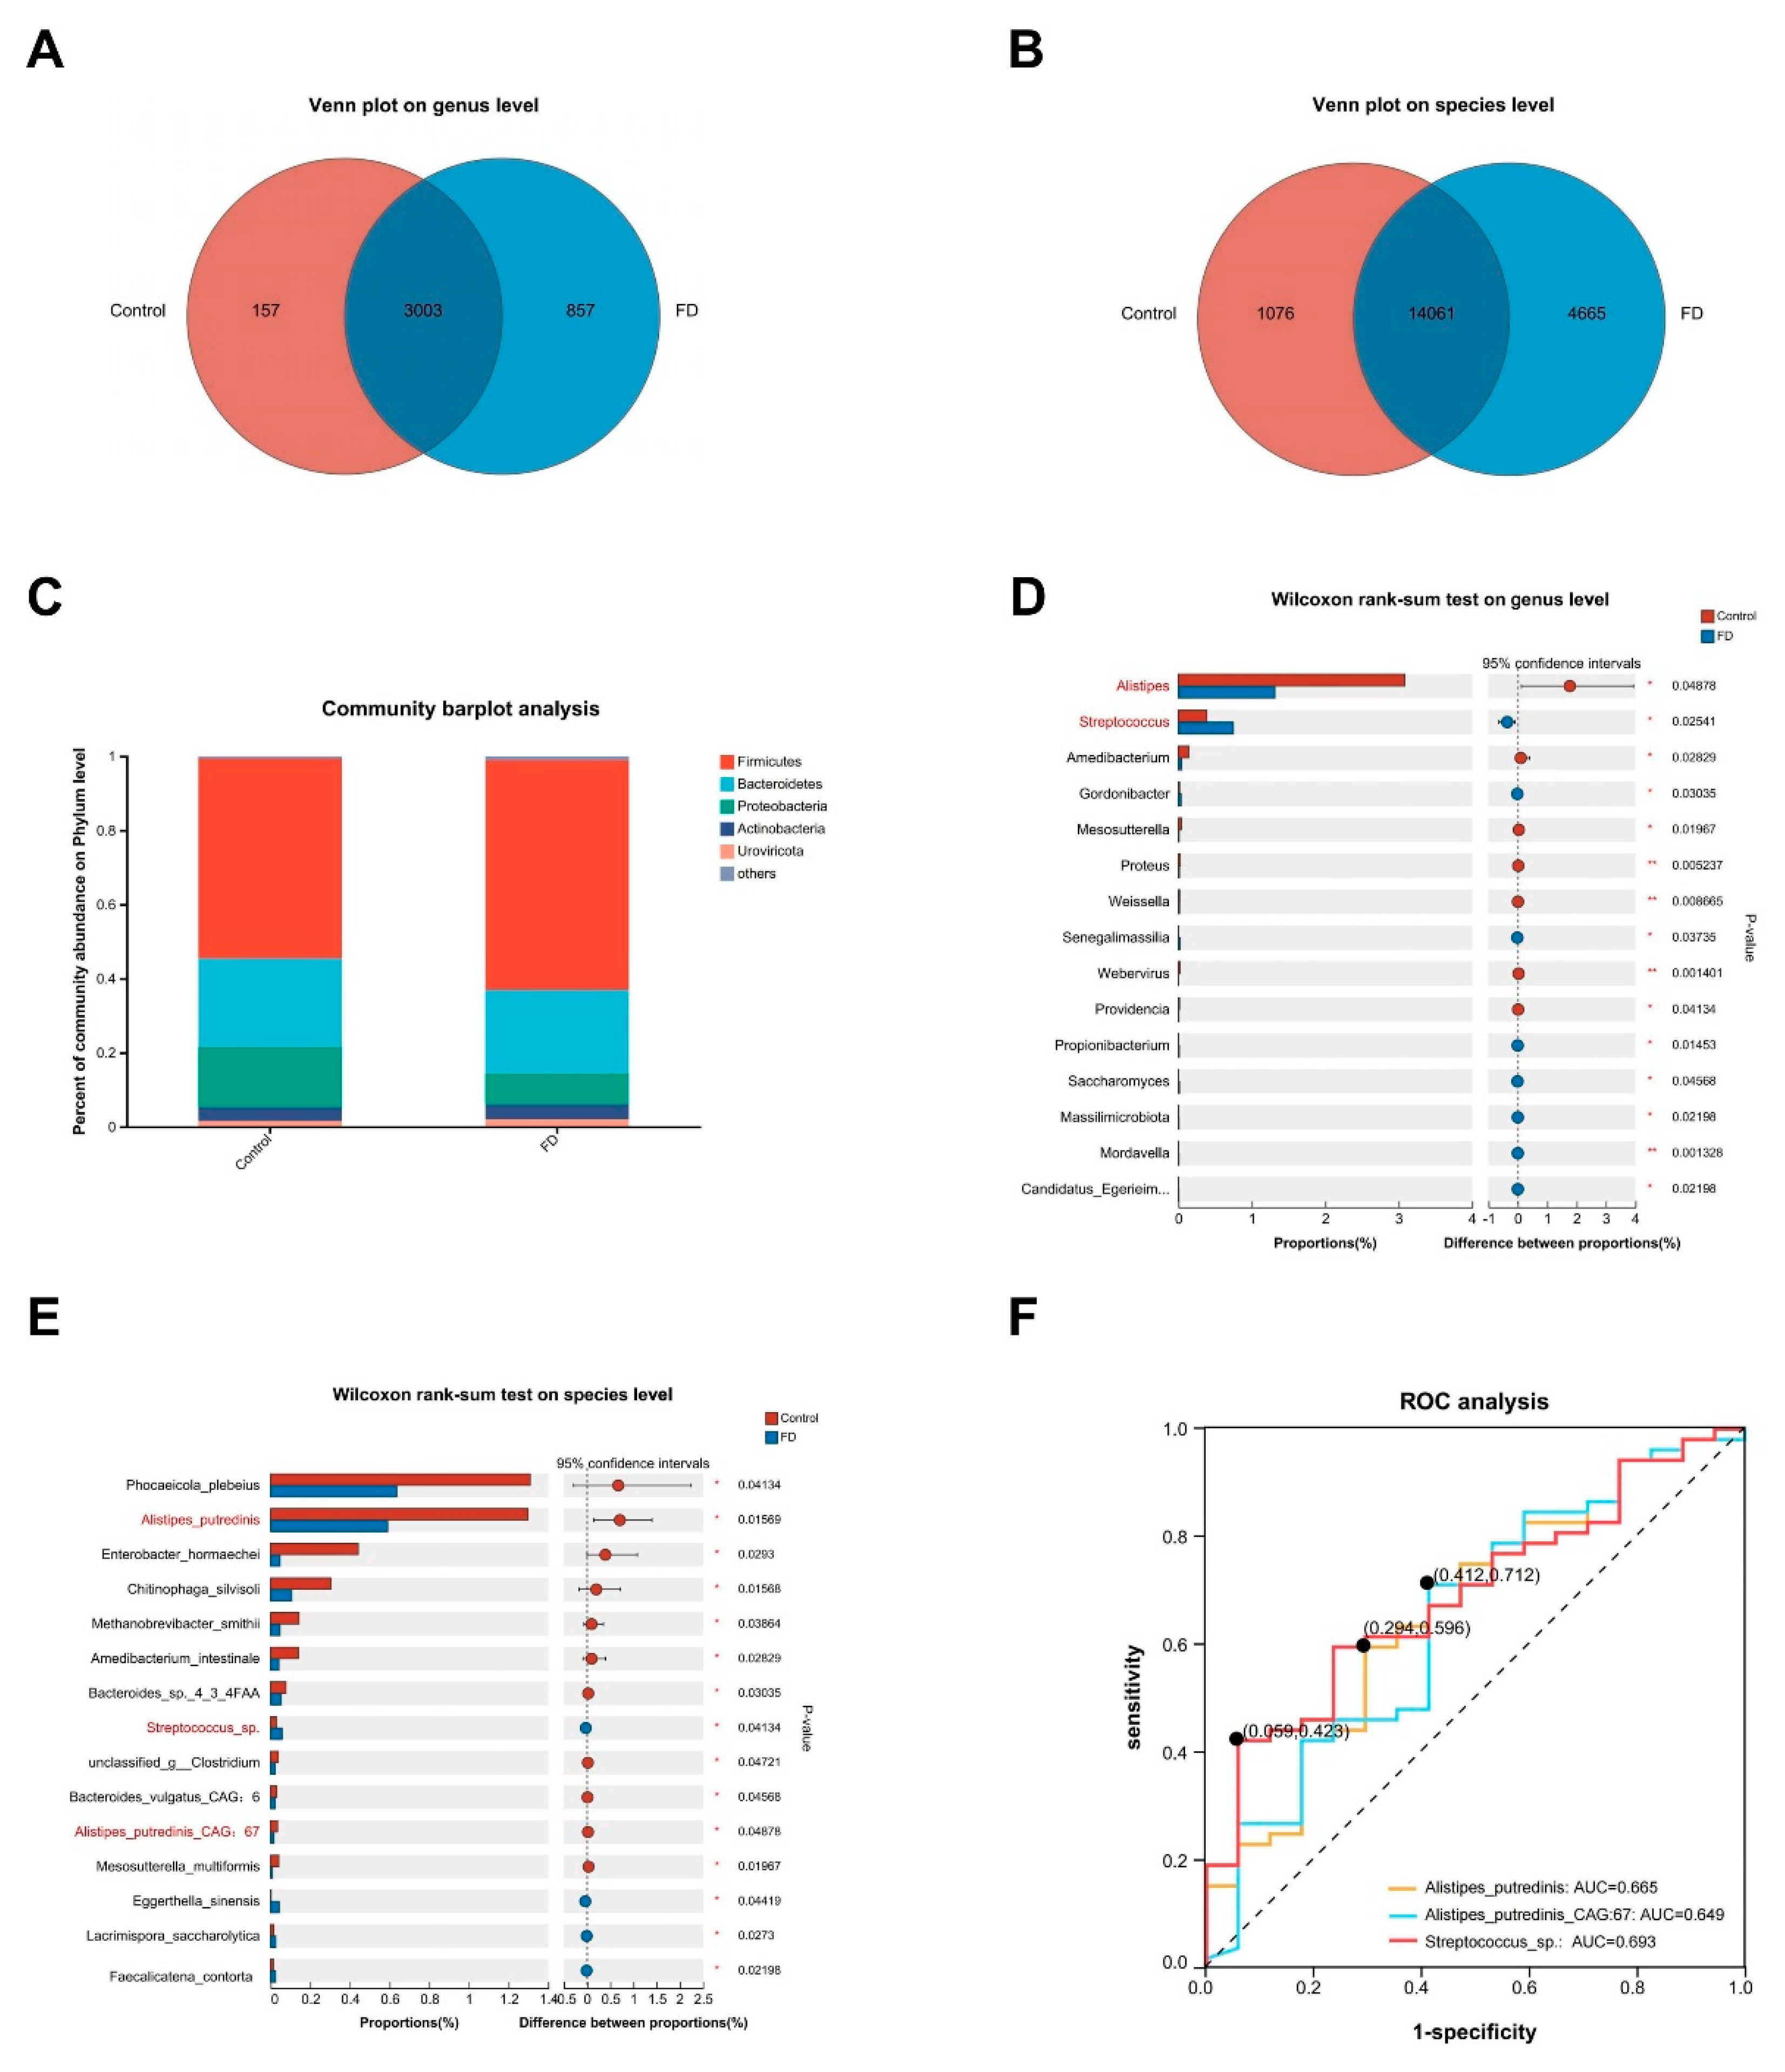
Figure 6.
Multifactorial correlation network and combined diagnostic value of blood and urine metabolomics with fecal metagenomics in patients with FD. (A) Network heatmap of Mantel test illustrating the correlation between Alistipes, Streptococcus, and key serum metabolites. The right panel depicts Spearman correlation of significant serum metabolites. Each square in the heatmap represents the positive or negative correlation coefficient between metabolites, with red indicating positive correlation and blue indicating negative correlation. The size of the squares represents the absolute magnitude of the correlation coefficient. The left panel shows the correlation network connecting gut species and important differentially abundant serum metabolites. Line color signifies significance, and line thickness indicates correlation intensity. (B) A complex cross-metabolism network at the species level was constructed using Cytoscape, showing interactions between gut microbial species and host. Green boxes represent species at the species level, red boxes represent serum metabolites, and purple boxes represent urine metabolites. Box size indicates the significance of species or metabolites. Light blue lines represent negative correlations between species and metabolites or between metabolites, while light yellow lines denote positive correlations. Line thickness represents the absolute magnitude of the correlation coefficient. (C) Integrative ROC analysis of multi-omics data. Serum metabolites: AUC = 0.992, 95% CI: 0.976-1.000. Urine metabolites: AUC = 0.769, 95% CI: 0.616–0.922. Fecal microbiota: AUC = 0.754, 95% CI: 0.607–0.900. Serum metabolites + Urine metabolites: AUC = 0.992, 95% CI: 0.976–1.000. Serum metabolites + Fecal microbiota: AUC = 0.994, 95% CI: 0.982–1.000. Points along the curve indicate the optimal threshold for distinguishing between the two categories based on the ROC curve. FD, functional dyspepsia; ROC, receiver operator characteristic curve; AUC, area under the curve.
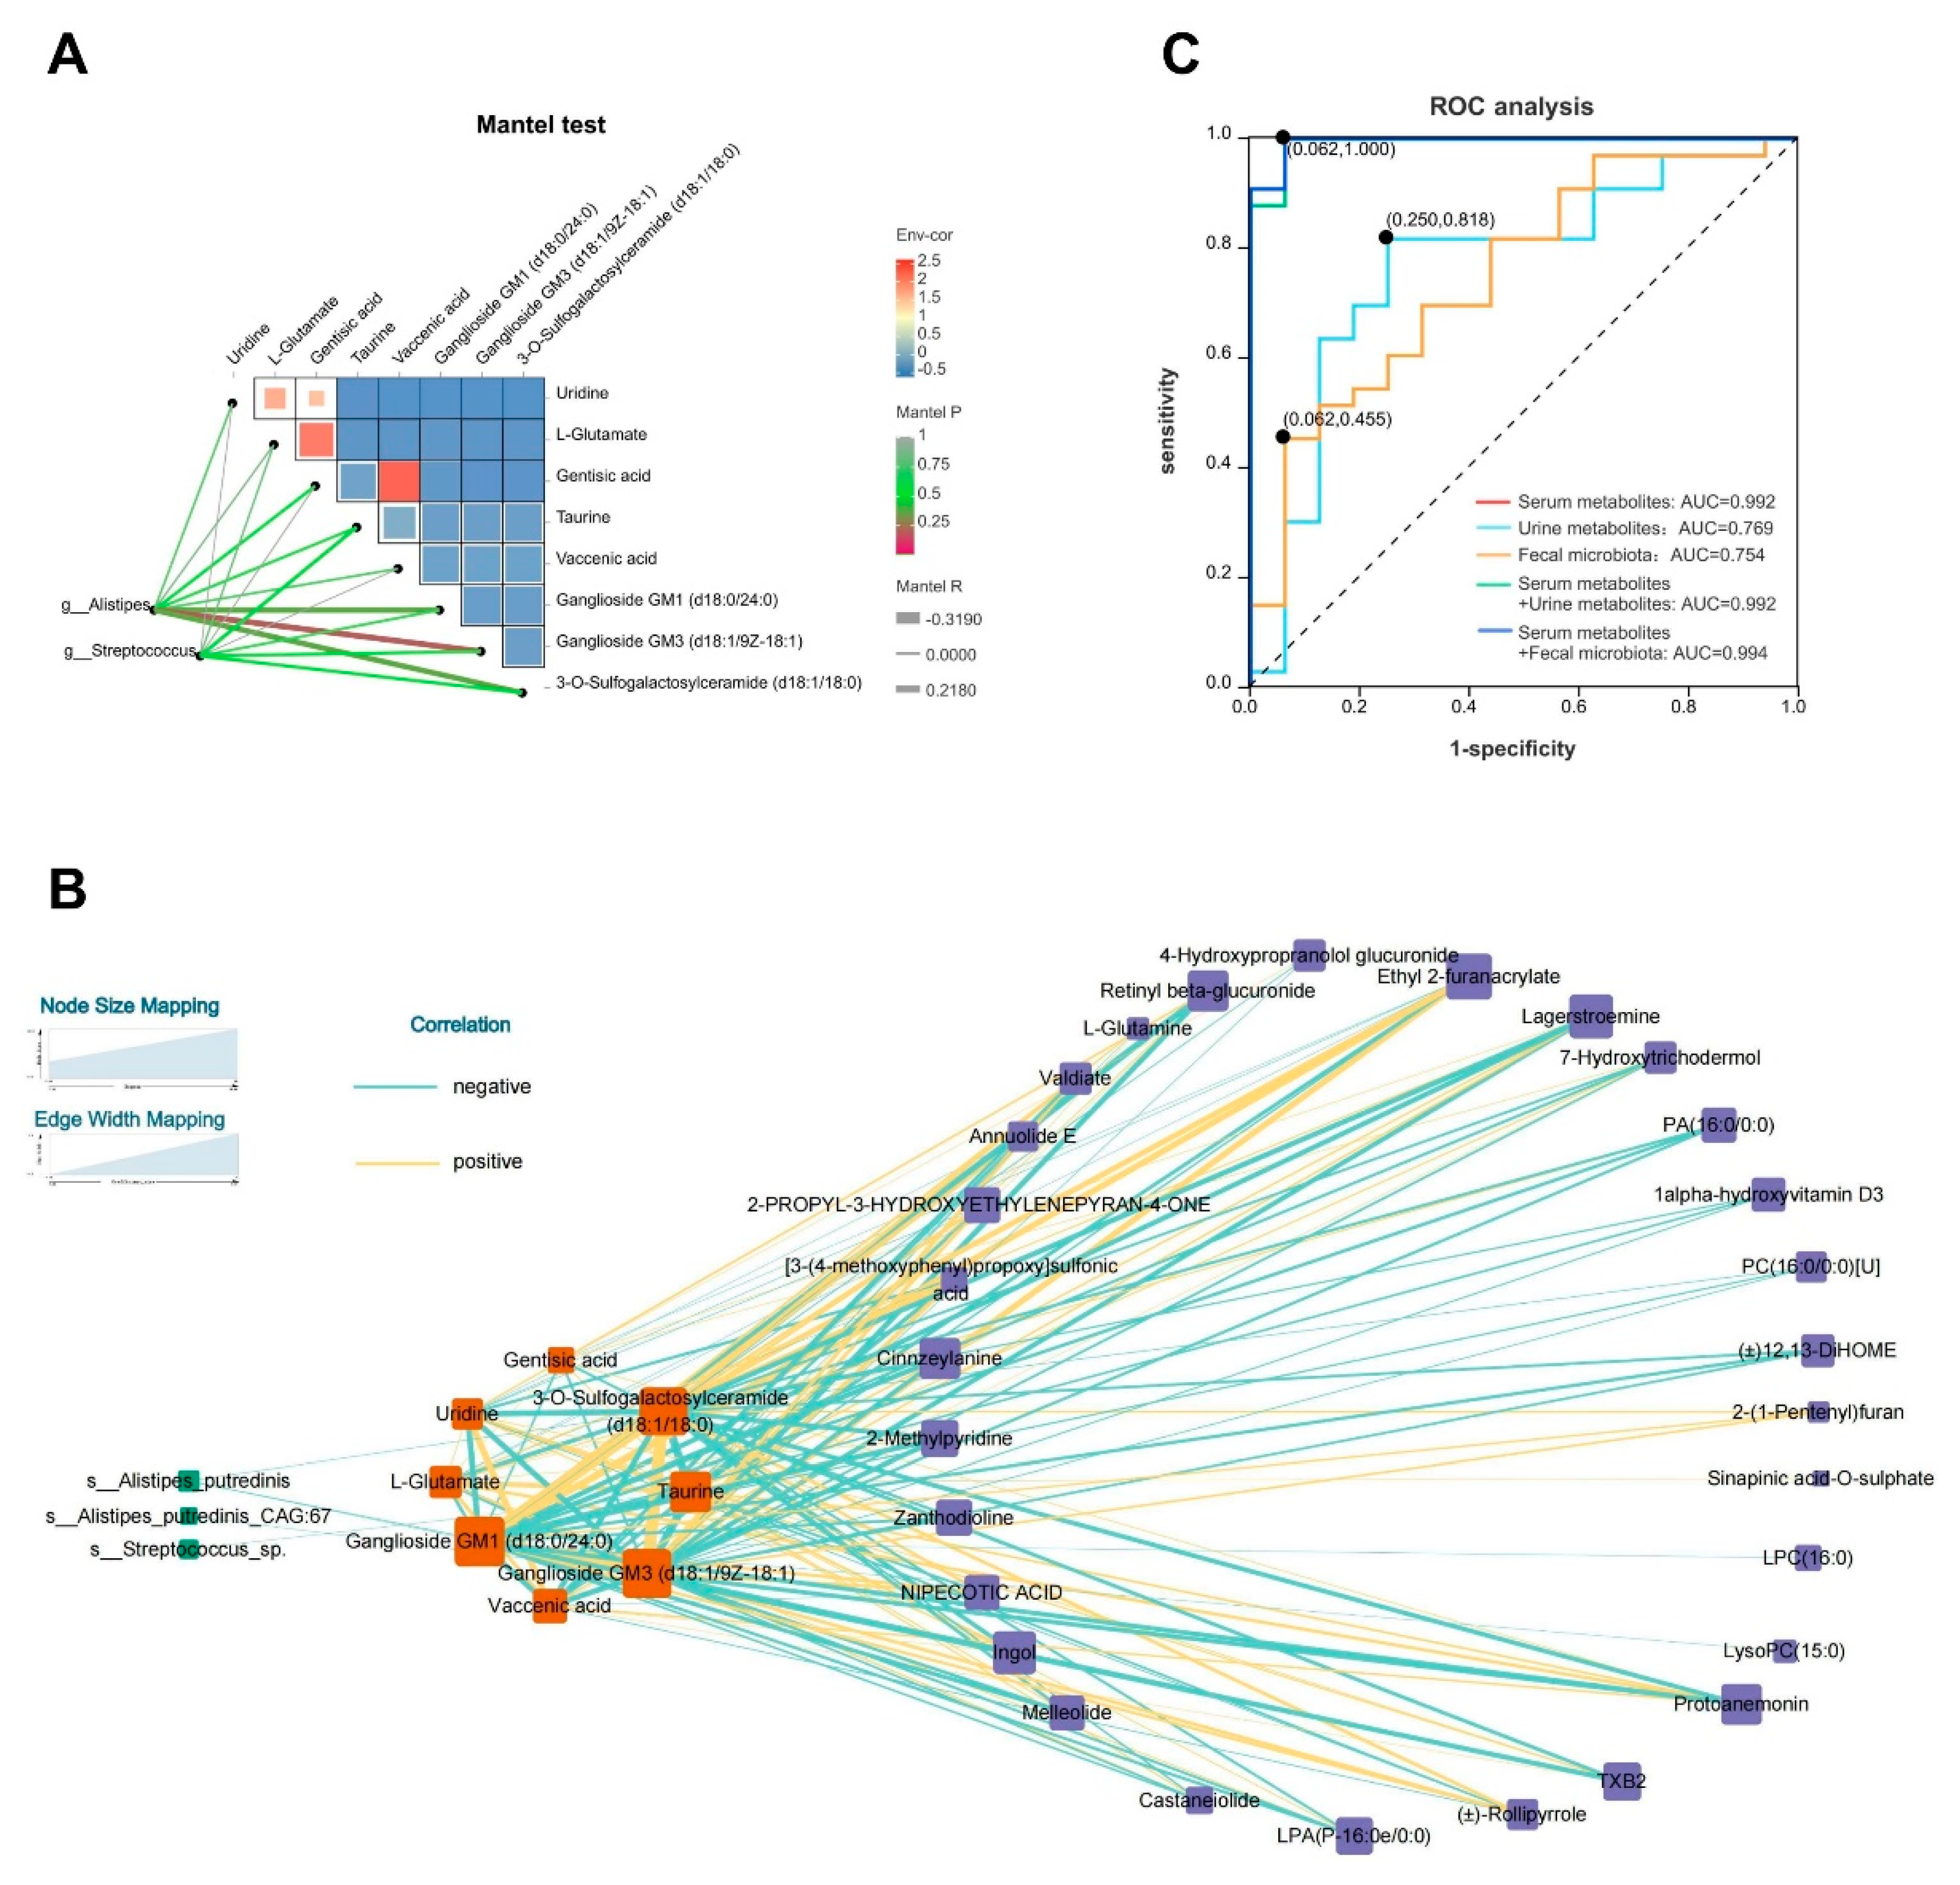

Table 1.
Clinical data of patients with functional dyspepsia (FD) and healthy controls.
| FD (n = 54) | Control (n = 29) | р value | |
|---|---|---|---|
| Age (years) | 39.20 ± 11.51 | 35.41 ± 9.29 | 0.16 |
| Sex (Male/Female) | 22/32 | 11/18 | 0.80 |
| BMI (kg/m2) | 22.07 ± 3.04 | 21.58 ± 2.20 | 0.45 |
| Race | 0.46 | ||
| Ethnic Han | 53 | 29 | |
| Others | 1 | 0 | |
| Education | 0.30 | ||
| Primary | 5 (9.26%) | 1 (3.45%) | |
| Junior | 5 (9.26%) | 3 (10.34%) | |
| High/Technical secondary | 7 (12.96%) | 2 (6.90%) | |
| College degree and above | 37 (68.52%) | 23 (79.31%) | |
| SF36-MH | 54 (36-68) | 60.4 (52-72) | 0.02 |
| Subtype | |||
| PDS | 9 (16.67%) | ||
| EPS | 2 (3.70%) | ||
| PDS + EPS | 43 (79.63%) |
Disclaimer/Publisher’s Note: The statements, opinions and data contained in all publications are solely those of the individual author(s) and contributor(s) and not of MDPI and/or the editor(s). MDPI and/or the editor(s) disclaim responsibility for any injury to people or property resulting from any ideas, methods, instructions or products referred to in the content. |
© 2024 by the authors. Licensee MDPI, Basel, Switzerland. This article is an open access article distributed under the terms and conditions of the Creative Commons Attribution (CC BY) license (http://creativecommons.org/licenses/by/4.0/).
Copyright: This open access article is published under a Creative Commons CC BY 4.0 license, which permit the free download, distribution, and reuse, provided that the author and preprint are cited in any reuse.


