
Submitted:
08 February 2025
Posted:
10 February 2025
You are already at the latest version
Abstract
Background: Irritable Bowel Syndrome (IBS) is a complex disorder characterised by altered gut-brain interactions, with gastrointestinal microbiota and metabolic dysregulation playing key roles in its pathophysiology. Identifying specific metabolic alterations within the colonic mucosa may enhance our understanding of IBS and contribute to improved diagnostic and therapeutic approaches.
Methods: This cross-sectional study analysed the metabolomic profiles of colonic mucosal biopsies from 44 IBS patients assessed with ROME IV criteria and 69 healthy controls undergoing colonoscopy. Untargeted metabolomic profiling was conducted using liquid chromatography-mass spectrometry (LC-MS), and differential metabolite analysis was performed via fold-change calculations and machine learning-based classification.
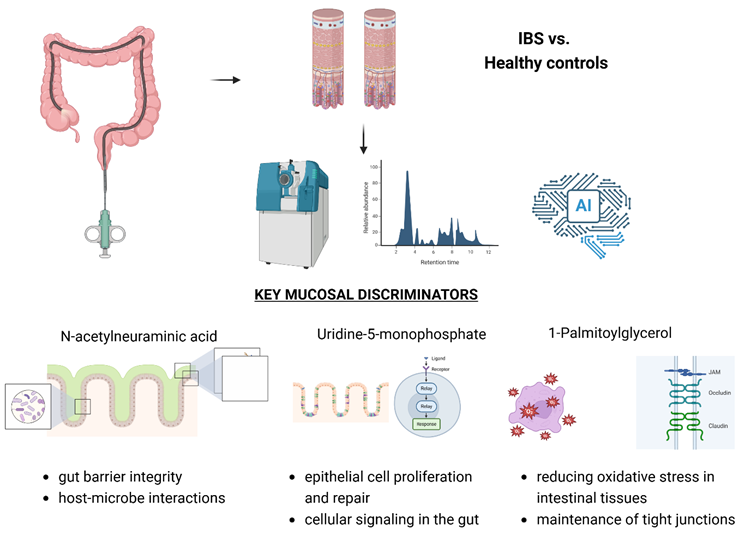
Results: IBS patients exhibited distinct mucosal metabolic profiles, with significantly elevated levels of N-acetylneuraminic acid and 1-palmitoylglycerol, suggesting compromised epithelial integrity and increased gut permeability. In contrast, cis-4-hydroxycyclohexanecarboxylic acid, a metabolite associated with protective mucosal functions, was reduced. Random Forest analysis identified these metabolites as key discriminatory features between IBS and control groups, reinforcing their potential role as biomarkers for IBS-related mucosal alterations.
Conclusions: Our study highlights the unique metabolomic signatures of IBS at the mucosal level, emphasising the role of microbial metabolites in disease pathology. These findings may facilitate the development of novel diagnostic tools and targeted therapeutic strategies, advancing personalised management for IBS patients.
Keywords:
Irritable Bowel Syndrome
; Metabolomics
; Mucosal Microbiota
; Gut-Brain Axis
; Biomarkers
; Liquid Chromatography-Mass Spectrometry
Graphical Abstract
1. Introduction
Irritable Bowel Syndrome (IBS) is a disorder of gut-brain interaction (DGBI) characterised by symptoms such as abdominal pain, bloating, and altered bowel habits without identifiable organic causes [1]. As a chronic condition, IBS considerably impacts the quality of life for those affected and imposes a significant economic and psychological burden due to its high prevalence and requirement for long-term management [2,3]. Epidemiological studies estimate that IBS affects approximately 4-21% of the global population, though prevalence varies widely between countries and demographic groups [4,5,6,7].
The pathophysiology of IBS is multifactorial and remains incompletely understood, posing challenges to developing effective treatments [8]. Recent research highlights the critical role of microbial and metabolic alterations among various contributing factors, which have been linked to the hallmark of IBS symptoms, such as increased gut permeability, low-grade inflammation, and abnormal gastrointestinal motility [9,10]. The rising prevalence of post-infectious IBS in the era of COVID-19, often accompanied by overlapping conditions such as functional dyspepsia, highlights the growing need for comprehensive management strategies targeting the gut-brain axis [11,12].
The metabolome—representing the complete set of small molecules produced by both the host and its microbiota—has emerged as a valuable lens through which these interactions can be explored. Metabolomic profiling provides a unique opportunity to identify biomarkers of health-related conditions and better elucidate the mechanisms behind pathological states [13,14]. However, the data concerning the metabolome profiles at the level of colonic mucosa in patients with IBS are scarce.
In the current study, we focused on individuals presenting for endoscopic evaluations and aimed to uncover metabolic alterations specific to IBS. We screened patients for IBS diagnosis using the Rome IV criteria, enabling the identification of distinct metabolic profiles within the colonic mucosa biopsies. Our findings could pave the way for novel diagnostic and therapeutic strategies, ultimately advancing personalised management approaches for IBS patients.
2. Patients and Methods
2.1. Study Design
The study was designed as a cross-sectional observational analysis focusing on individuals diagnosed with IBS according to the Rome IV criteria[5]. The Rome IV validated questionnaire version in the Polish language was licensed by the Rome Foundation (License Agreement 07.02.2022). The primary objective was to characterise the metabolome of the colonic mucosa in selected individuals and to identify any distinct metabolomic pattern associated with IBS. The study aimed to ensure that the observed alterations were associated explicitly with IBS by excluding participants with any detectable organic diseases or other confounding conditions. The study was conducted in compliance with the Helsinki Declaration. The protocol was approved by the Pomeranian Medical University (PMU) ethics committee in Szczecin (resolution no KB-0012/197/19; date 19.02.2019), and all participants gave written informed consent to participate in the present study.
We recruited patients between 2021 and 2023 from individuals presenting for endoscopic procedures at the PMU Hospital nr 1 Endoscopy Unit in Szczecin, Poland. To avoid selection bias, random sampling was performed. To ensure the integrity and reliability of the data, specific exclusion criteria were established that could have potentially biased the study results. These were (i) age under 18, (ii) pregnancy, (iii) presence of severe comorbidities, (iv) history of inflammatory bowel disease (IBD), iv) history of immunosuppressive therapy, (v) presence of ileo- or colostomy, v) hospitalisation at a time of enrollment, (vi) referral for advanced endoscopic procedures (e.g. polypectomy, endoscopic mucosal or sub mucosal resection /EMR, ESD/ vi) incomplete questionnaires or lack of informed consen.
A total of 2070 individuals of West Pomeranian Cohort were screened, of which 436 were diagnosed with IBS based on the Rome IV criteria as previously reported [5]. Among them, 44 individuals fulfilling the Rome IV criteria for IBS and undergoing colonoscopy were randomly selected, of whom mucosal biopsies of the large intestine were obtained for metabolomic analysis. A control group of 69 healthy individuals undergoing colonoscopy and colonic biopsies, without DGBI or organic gastrointestinal disorders, was also included for comparative analysis. Overall, one hundred thirteen (n=113) participants provided colonic mucosal biopsies for the study. The demographic characteristics of enrolled patients are presented in Table 1.
2.2. Sample Collection
One hundred thirteen (n=113) participants provided colonic mucosal biopsies for the study, including 44 individuals diagnosed with IBS and 69 participants from a control group. These samples were retrieved during colonoscopy procedures conducted by experienced gastroenterologists at the Endoscopy Unit of Clinical Hospital No. 1 in Szczecin, Poland. Before the colonoscopy, patients underwent preparation following established, standard medical protocols, which included cleansing the bowel using a polyethylene glycol (PEG) solution. Biopsy samples were strategically collected from various colon segments using biopsy forceps, ensuring that areas with noticeable inflammatory alterations were avoided in the control group. Each participant provided 2 to 3 mucosal tissue fragments, roughly 2 to 3 mm in size, which were then securely placed into sterile Eppendorf tubes filled with DNA Shield (Zymo Research, Irvine, CA, USA), enabling to store the samples at 4°C until analysis.
2.3. Liquid Chromatography-Mass Spectrometry Analysis
A mixture of methanol, water and acetonitrile (100ul) in 50: 25: 25 v/v/v proportions with deuterated internal standards was added to biopsy samples. The sample was shaken at 2000 rpm at 4°C for 30 min to dissolve the metabolites in the solution. Subsequently, samples were centrifuged for 4 minutes at a speed of 4000 rpm and a temperature of 4°C. The supernatant was transferred to the chromatography vial and, as such, analysed on the same day by liquid chromatography-mass spectrometry. QC samples were prepared by mixing test samples in equal proportions and prepared in the same way as the test samples. The LCMS analysis was conducted on an ExionLC liquid chromatograph equipped with a binary pump, autosampler, and column thermostat coupled with a Triple TOF 6600+ mass spectrometer (Sciex, Framingham, MA, USA). The separation was carried out on a Phenomenex Luna® Omega 1.6μm polar C18 150 x 2.1mm column for 45 min in gradient separation. The mobile phases were Phase A – Water with 10mM ammonium acetate and Phase B - acetonitrile with 0.1% formic acid. The column injection was 2μl, and the column temperature was 20°C. The phase flow was 0.2 ml/min. Spectral analysis was performed in the positive ion mode with a capillary voltage of 5500 V, Curtain gas (CUR) was 25 psi, Ion source gas 1 (GS1) was 45 psi, Ion source gas 2 (GS2) 60 psi, and the ion source temperature was 400 °C. The mode negative ions at a capillary voltage of 4500 V, Curtain gas (CUR) was 25 psi, Ion source gas 1 (GS1) 45 psi, Ion source gas 2 (GS2) 60 psi and the ion source temperature was 350 °C. The spectrometer collected spectral data in SWATH mode.
The spectral spectra were analysed using SCIEX OS software and integrated SCIEX All-In-One HR-MS/MS, NIST and own databases. The resulting datasets were preprocessed to ensure quality control, including normalisation, log transformation, and scaling, as implemented in MetaboAnalystR (version 4.0.0). The metabolite abundances of IBS patients and controls and IBS-C and IBS-D subtypes were compared using fold-change (FC) analysis. FC was computed as the ratio between the mean abundance in the IBS and control groups or between the mean abundance in IBS-D and IBS-C. A threshold of log2FC of ≥1 or ≤-1 was used (corresponding to an FC threshold of ≥2 or ≤0.5). The volcano plot was used to report the results of the fold change analysis, showing the metabolites as a function of the p-value (-log10 p-value) and the fold change value (log2 fold change).
2.4. Random Forest Classification and Feature Importance Analysis
Machine learning Random Forest (RF) algorithm was applied using nested cross-validation to find the best hyperparameters and to evaluate the model while minimising the risk of overfitting. The nested cross-validation consisted of training data (70%) and testing data (30%) created using a stratified algorithm to maintain a balanced class representation. Data was split into training and testing sets using a stratified algorithm to preserve a balanced class representation. The training data was further divided into two folds, which were used to select the best hyperparameters using a grid search approach. The following RF hyperparameters were optimised: the number of features randomly sampled for splitting, the number of decision trees, the maximum tree depth, and the minimum number of samples per leaf node. The RF models were evaluated using the area under the receiver operating characteristic curve (AUC). Feature importance was assessed by randomly permuting each feature in the test data. The AUC and a complementary 1-AUC measure were calculated for each permuted predictor.
The training data was also used to generate a dataset with randomly shuffled outcome labels (Y-scrambled data). All steps described above were repeated using Y-scrambled data, allowing us to compare the predictive potential of models trained on real and scrambled data, thereby excluding the possibility of capturing noise rather than real patterns. The entire process was repeated 100 times to calculate bootstrap (1000 samples) 95% confidence intervals (CIs) of evaluation and feature importance metrics. R statistical package was used for all analyses (version 4.4.0, R Core Team (2024). R: A Language and Environment for Statistical Computing. R Foundation for Statistical Computing, Vienna, Austria. https://www.R-project.org/). RF models were built using the Ranger R package (version 0.16.0).
3. Results
Except for age (IBS: 52 ± 16 years, non-IBS 59 ± 13 years, P=0.029) there were no significant differences between the groups. Using the fold-change analysis, we first compared the metabolite levels of IBS and controls. N-acetylneuraminic acid (log2 fold change [log2FC] = 1.63, P = 0.00003, false discovery rate [FDR] Q = 0.003) and 1-Palmitoylglycerol (log2FC = 1.08, P = 0.0002, Q = 0.009) and were among the metabolites with higher concentrations in the IBS group (Figure 1). In contrast, the control group had higher levels of cis-4-Hydroxycyclohexanecarboxylic acid (NIST EL) (log2FC = -1.52, P = 0.023, Q = 0.279). Although it was below the log2FC threshold of 1, corresponding to a fold change of 2, glycine was also more abundant in the IBS group and statistically significant (P = 0.00006, Q = 0.003). Full-fold change analysis results are shown in Supplementary Table 1.
Next, we used the Random Forest machine learning algorithm to identify key metabolites that distinguished the IBS patient from non-IBS individuals. The median area under the curve (AUC) of the ROC for the real data (Y-Real) and scrambled data (Y-scrambled) was 0.66 (95% CI 0.64-0.68) and 0.49 (95% CI 0.45-0.54), respectively, Figure 2A). Feature importance analysis revealed that N-acetylneuraminic acid was the most important predictor, and its 95% CI of 1-AUC did not overlap with the 95% CI of the baseline. The second most crucial metabolite was uridine-5-monophosphate, followed by 1-palmitoylglycerol. The feature importance values (1-AUC) obtained from the model trained on scrambled data centred around 50%, without any noticeable pattern.
The fold change analysis was also conducted on a group of IBS patients to identify metabolites that differ between the two IBS subtypes, IBS-C and IBS-D. Although some metabolites exceeded the fold change threshold, for example eleutheroside E +NH3 (log2FC = 2.15, P = 0.489, Q = 0.921), glycodeoxycholic (log2FC = -3.39, P = 0.682, Q = 0.921), sodium glycochenodeoxycholate (log2FC = -2.31, P = 0.730, Q = 0.921), the difference in abundance between IBS-C and IBS-D were not statistically significant. The full results of the fold change analysis comparing IBS-C and IBS-D are presented in Supplementary Table 2.
4. Discussion
Colonic mucosal biopsies provide detailed insights into pathological processes, effectively identifying changes in intestinal barrier function, inflammation, and metabolism [15]. Given the complexity of IBS, our study highlights the crucial interactions between the intestinal epithelium and the microbiota. A standard fold change analysis and a Random Forest machine learning classification analysis, using a stringent and controlled approach, including nested cross-validation and scrambled data, pinpointed essential metabolites that set IBS patients apart from controls. Neu5Ac, Uridine-5-monophosphate, and 1-Palmitoylglycerol exhibited the most potent discriminatory power, a finding also evident in the fold change analysis results. This consistency underscores the potential biological relevance of these metabolites and positions them as candidate biomarkers for IBS.
Most metabolomics studies have reported data based on faecal or plasma analyses, focusing on patients with IBD and cancer [16,17]. While these approaches provide valuable systemic insights, they may not fully capture metabolic alterations at the tissue level [18]. Colonic biopsies offer a more detailed understanding of the biochemical environment in the intestinal mucosa. This approach may help uncover disease-specific metabolic pathways and improve the identification of potential therapeutic targets [19,20]. While faecal studies help evaluate overall microbiota composition and their metabolites, such as short-chain fatty acids (SCFAs), bile acids, and amino acid derivatives, biopsies uncover more detailed information about metabolic function at the epithelial level [21].
Accordingly, Neu5Ac and 1-palmitoyl glycerol, found in our study to be elevated in IBS patients, could be directly related to the function of the colonic barrier and low-grade inflammation. Including these metabolites in future diagnostic panels could facilitate non-invasive diagnostic methods, reducing reliance on invasive procedures like colonoscopies [22]. Elevated Neu5Ac levels are consistent with findings by Li et al. [23], who associated its presence with chronic inflammation and increased gut permeability. Neu5Ac also affects immune responses and epithelial glycoprotein composition, potentially linking localized epithelial dysfunction to broader microbial alterations. This aligns with research by Wang et al. [24] and Liu et al. [25], which highlighted Neu5Ac's role in sialic acid metabolism and its implications for gut microbiota composition, function and inflammation. Similarly, elevated 1-palmitoylglycerol levels in IBS patients point to its role in promoting inflammation and compromising the intestinal barrier, as supported by studies like Li et al. [26] and McGuckin et al. [27]. Conversely, reduced levels of cis-4-hydroxycyclohexanecarboxylic acid, a protective microbiota byproduct, suggest impaired mucosal defence mechanisms, increasing susceptibility to epithelial damage [28].
Our findings demonstrate that colonic biopsies could provide precise insights into localised metabolic changes [19,20]. Indeed, as shown in previous research, such as by Choo et al. [29], local epithelial changes that reflect luminal microbiota interactions might be uncovered. While faecal studies help evaluate overall microbiota composition and their metabolites, biopsies uncover details of epithelial function and metabolic shifts [21]. Our current data provide a novel perspective on the role of mucosal microbiota in IBS and contrast with those presented by Iribarren et al. (2024), who primarily focused on characterising the plasma and faecal metabolomes in participants with DGBI [30]. While both studies recognise the importance of microbial and metabolic alterations in IBS pathophysiology, our results suggest a more pronounced role of mucosal-associated microbiota in symptom manifestation and disease progression.
Fraser et al. [13] also recently emphasised systemic metabolic alterations. One key point of divergence between our current study and Fraser et al. report is the approach to microbiota analysis [31]. Fraser et al. relied on faecal and plasma metabolome analyses, which may not fully capture the microbial metabolites present within the mucosal layer [13]. In our study, we employed a detailed assessment of the mucosal metabolome, which more directly reflects the microbial interaction with the host's immune system and intestinal epithelium, thereby influencing local inflammation at the level of GI barrier function. This distinction is crucial because mucosal microbial alterations, frequently named as dysbiosis, have been implicated in visceral hypersensitivity and immune activation mechanisms, central to IBS pathophysiology [32]. In detail, we identified specific metabolites, including Neu5Ac, 1-Palmitoylglycerol, and cis-4-hydroxycyclohexanecarboxylic acid, which are primarily associated with localised epithelial changes and are often undetectable in faecal studies. Of note and in contrast to Fraser et al. study, we were not able to show differences between individuals with either constipation or diarrhoea-predominant IBS subtypes.
Future therapeutic strategies could potentially target metabolic pathways linked to these metabolites. For instance, dietary interventions or prebiotic treatments designed to enhance sialic acid metabolism and restore SCFA levels could improve intestinal barrier function as assessed by metabolomics profiling. Preclinical studies, such as those by Wang et al. [33], have shown that introducing butyrate helps restore epithelial integrity. Combining colon biopsy and faecal metabolomics data could enhance diagnostic accuracy and lead to more targeted treatments [30].
Our findings on the colonic mucosal metabolome in IBS contrast with recent faecal metabolomic studies in IBD, as summarised by Vila et al. [34]. While our study highlights localised metabolic alterations in IBS, particularly increased N-acetylneuraminic acid and 1-palmitoyl glycerol, Vila et al. emphasise the focus on systemic metabolic shifts in IBD, including elevated sphingolipids, bile acids, and reduced SCFAs. This distinction suggests that mucosal-associated microbiota and epithelial dysfunction play a more prominent role in IBS, whereas microbiome-driven metabolic dysregulation is central in IBD. Since colonoscopy is not required for IBS diagnosis and is only recommended in individuals with alarm symptoms or for cancer screening and surveillance, mucosal biopsies taken during colonoscopy in individuals with IBS may serve as a source of metabolic profiling, providing reassurance for both patients and clinicians. Moreover, while not yet part of clinical guidelines, mucosal metabolomics may offer a future complementary role in therapeutic decision-making, potentially guiding more targeted treatment approaches.
Our study does have limitations. The small sample size and lack of control over long-term dietary and lifestyle factors may confound results. The cross-sectional design restricts causal conclusions, and the focus on large intestinal biopsies excludes potential findings from other gut regions. Although untargeted metabolomics provided a broad overview, specific key metabolites may have been missed due to detection limits. Additionally, the moderate performance of the RS model suggests the need for integration with other datasets, such as microbiome profiles, to improve diagnostic precision.
Future studies should focus on longitudinal designs, integrating metabolomics with proteomics and transcriptomics to clarify causal relationships. Including duodenal and small intestine biopsies could expand our understanding of metabolic changes in IBS and overlapping DGBI syndromes. Our study highlights the significance of colonic biopsies in identifying localised metabolic changes in IBS and improve our understanding of IBS, opening up new avenues for diagnostic and therapeutic strategies, moving us closer to personalised management for DGBI affected individuals.
Author Contributions
P.K. - M.K. - data analysis, interpretation, drafting the manuscript and approval of final draft K.S.Ż. - data acquisition, analysis, interpretation, writing and approval of final draft, D.S. – data acquisition, analysis, interpretation, drafting, final approval; K.P., DC-L, K.D., A.D., W.R-M., M.Ł., A.B. - data acquisition, interpretation and approval of final draft; A.K. - data analysis and interpretation, drafting the manuscript, supervision, funding, approval of final draft; W.M. - conception and design of the work; drafting the manuscript, supervision and funding. All authors substantively revised and approved the manuscript.
Funding
The study was financed by Program of the Ministry of Science and Health Education under the name of “Regional Initiative of Excellence” in 2019–2022 project number 002/RID/2018/19 amount of financing 12.000.000 PLN.
Institutional Review Board Statement
The study was approved by the ethics committee of the Pomeranian Medical University in Szczecin (resolution no KB-0012/197/19) and all participants gave written informed consent to participate.
Data Availability Statement
The datasets used and/or analysed during the current study are available from the corresponding author on reasonable request.
Conflicts of Interest
The authors declare no competing interests.
References
- Palsson, O.S.; Tack, J.; Drossman, D.A.; Le Nevé, B.; Quinquis, L.; Hassouna, R.; Ruddy, J.; Morris, C.B.; Sperber, A.D.; Bangdiwala, S.I.; et al. Worldwide Population Prevalence and Impact of Sub-Diagnostic Gastrointestinal Symptoms. Aliment Pharmacol Ther 2024, 59, 852–864. [Google Scholar] [CrossRef] [PubMed]
- Jones, M.P.; Holtmann, G.J.; Tack, J.; Carbonne, F.; Chey, W.; Koloski, N.; Shah, A.; Bangdiwala, S.I.; Sperber, A.D.; Palsson, O.S.; et al. Diagnostic Classification Systems for Disorders of Gut-Brain Interaction Should Include Psychological Symptoms. Neurogastroenterology and Motility 2024, 36. [Google Scholar] [CrossRef]
- Ballou, S.; Vasant, D.H.; Guadagnoli, L.; Reed, B.; Chiarioni, G.; Ten Cate, L.; Keefer, L.; Kinsinger, S.W. A Primer for the Gastroenterology Provider on Psychosocial Assessment of Patients with Disorders of Gut-Brain Interaction. Neurogastroenterol Motil 2024, 36, e14894. [Google Scholar] [CrossRef] [PubMed]
- Mulak, A.; Freud, T.; Waluga, M.; Bangdiwala, S.I.; Palsson, O.S.; Sperber, A.D. Sex- and Gender-Related Differences in the Prevalence and Burden of Disorders of Gut-Brain Interaction in Poland. Neurogastroenterol Motil 2023, 35, e14568. [Google Scholar] [CrossRef]
- Krynicka, P.; Kaczmarczyk, M.; Skonieczna-Żydecka, K.; Cembrowska-Lech, D.; Podsiadło, K.; Dąbkowski, K.; Gaweł, K.; Botke, N.; Zawada, I.; Ławniczak, M.; et al. The Burden of Irritable Bowel Syndrome and Functional Dyspepsia in Poland: A Cross-Sectional Study from West Pomeranian Voivodship. BMC Gastroenterol 2025, 25, 8. [Google Scholar] [CrossRef]
- Palma, J.; Antoniewicz, J.; Borecki, K.; Tejchman, K.; Skonieczna-Żydecka, K.; Maciejewska-Markiewicz, D.; Ryterska, K.; Komorniak, N.; Czerwińska-Rogowska, M.; Wolska, A.; et al. Irritable Bowel Syndrome Prevalence among Participants of Woodstock Rock Festival in Poland Based on Rome IV Criteria Questionnaire. Int J Environ Res Public Health 2021, 18, 11464. [Google Scholar] [CrossRef] [PubMed]
- Sperber, A.D.; Bangdiwala, S.I.; Drossman, D.A.; Ghoshal, U.C.; Simren, M.; Tack, J.; Whitehead, W.E.; Dumitrascu, D.L.; Fang, X.; Fukudo, S.; et al. Worldwide Prevalence and Burden of Functional Gastrointestinal Disorders, Results of Rome Foundation Global Study. Gastroenterology 2021, 160, 99–114.e3. [Google Scholar] [CrossRef]
- Ionescu, V.A.; Gheorghe, G.; Georgescu, T.F.; Bacalbasa, N.; Gheorghe, F.; Diaconu, C.C. The Latest Data Concerning the Etiology and Pathogenesis of Irritable Bowel Syndrome. Journal of Clinical Medicine 2024, 13, 5124. [Google Scholar] [CrossRef]
- Li, X.; Li, X.; Xiao, H.; Xu, J.; He, J.; Xiao, C.; Zhang, B.; Cao, M.; Hong, W. Meta-Analysis of Gut Microbiota Alterations in Patients with Irritable Bowel Syndrome. Front. Microbiol. 2024, 15. [Google Scholar] [CrossRef]
- Barbaro, M.R.; Cremon, C.; Marasco, G.; Savarino, E.; Guglielmetti, S.; Bonomini, F.; Palombo, M.; Fuschi, D.; Rotondo, L.; Mantegazza, G.; et al. Molecular Mechanisms Underlying Loss of Vascular and Epithelial Integrity in Irritable Bowel Syndrome. Gastroenterology 2024, 167, 1152–1166. [Google Scholar] [CrossRef]
- Nazarewska, A.; Lewandowski, K.; Kaniewska, M.; Rosołowski, M.; Marlicz, W.; Rydzewska, G. Irritable Bowel Syndrome Following COVID-19: An Underestimated Consequence of SARS-CoV-2 Infection. Pol Arch Intern Med 2022, 132, 16323. [Google Scholar] [CrossRef] [PubMed]
- Nazarewska, A.; Lewandowski, K.; Kaniewska, M.; Tulewicz-Marti, E.; Więcek, M.; Szwarc, P.; Rosołowski, M.; Marlicz, W.; Rydzewska, G. Long-Lasting Dyspeptic Symptoms - Another Consequence of the COVID-19 Pandemic? Prz Gastroenterol 2023, 18, 175–182. [Google Scholar] [CrossRef] [PubMed]
- Fraser, K.; James, S.C.; Young, W.; Gearry, R.B.; Heenan, P.E.; Keenan, J.I.; Talley, N.J.; McNabb, W.C.; Roy, N.C. Characterisation of the Plasma and Faecal Metabolomes in Participants with Functional Gastrointestinal Disorders. International Journal of Molecular Sciences 2024, 25, 13465. [Google Scholar] [CrossRef]
- Kopera, K.; Gromowski, T.; Wydmański, W.; Skonieczna-Żydecka, K.; Muszyńska, A.; Zielińska, K.; Wierzbicka-Woś, A.; Kaczmarczyk, M.; Kadaj-Lipka, R.; Cembrowska-Lech, D.; et al. Gut Microbiome Dynamics and Predictive Value in Hospitalized COVID-19 Patients: A Comparative Analysis of Shallow and Deep Shotgun Sequencing. Front. Microbiol. 2024, 15. [Google Scholar] [CrossRef]
- Zhao, D.-Y.; Qi, Q.-Q.; Long, X.; Li, X.; Chen, F.-X.; Yu, Y.-B.; Zuo, X.-L. Ultrastructure of Intestinal Mucosa in Diarrhea-Predominant Irritable Bowel Syndrome. Physiol Int 2019, 106, 225–235. [Google Scholar] [CrossRef]
- Vich Vila, A.; Zhang, J.; Liu, M.; Faber, K.N.; Weersma, R.K. Untargeted Faecal Metabolomics for the Discovery of Biomarkers and Treatment Targets for Inflammatory Bowel Diseases. Gut 2024, 73, 1909–1920. [Google Scholar] [CrossRef]
- Gao, R.; Wu, C.; Zhu, Y.; Kong, C.; Zhu, Y.; Gao, Y.; Zhang, X.; Yang, R.; Zhong, H.; Xiong, X.; et al. Integrated Analysis of Colorectal Cancer Reveals Cross-Cohort Gut Microbial Signatures and Associated Serum Metabolites. Gastroenterology 2022, 163, 1024–1037.e9. [Google Scholar] [CrossRef] [PubMed]
- Han, L.; Zhao, L.; Zhou, Y.; Yang, C.; Xiong, T.; Lu, L.; Deng, Y.; Luo, W.; Chen, Y.; Qiu, Q.; et al. Altered Metabolome and Microbiome Features Provide Clues in Understanding Irritable Bowel Syndrome and Depression Comorbidity. ISME J 2022, 16, 983–996. [Google Scholar] [CrossRef]
- Lin, A.-Z.; Fu, X.; Jiang, Q.; Zhou, X.; Hwang, S.H.; Yin, H.-H.; Ni, K.-D.; Pan, Q.-J.; He, X.; Zhang, L.-T.; et al. Metabolomics Reveals Soluble Epoxide Hydrolase as a Therapeutic Target for High-Sucrose Diet-Mediated Gut Barrier Dysfunction. Proc Natl Acad Sci U S A 2024, 121, e2409841121. [Google Scholar] [CrossRef]
- Calzadilla, N.; Qazi, A.; Sharma, A.; Mongan, K.; Comiskey, S.; Manne, J.; Youkhana, A.G.; Khanna, S.; Saksena, S.; Dudeja, P.K.; et al. Mucosal Metabolomic Signatures in Chronic Colitis: Novel Insights into the Pathophysiology of Inflammatory Bowel Disease. Metabolites 2023, 13, 873. [Google Scholar] [CrossRef]
- Caceres Lessa, A.Y.; Edwinson, A.; Sato, H.; Yang, L.; Berumen, A.; Breen-Lyles, M.; Byale, A.; Ryks, M.; Keehn, A.; Camilleri, M.; et al. Transcriptomic and Metabolomic Correlates of Increased Colonic Permeability in Postinfection Irritable Bowel Syndrome. Clin Gastroenterol Hepatol, 1542; -7. [Google Scholar] [CrossRef]
- Valles-Colomer, M.; Falony, G.; Darzi, Y.; Tigchelaar, E.F.; Wang, J.; Tito, R.Y.; Schiweck, C.; Kurilshikov, A.; Joossens, M.; Wijmenga, C.; et al. The Neuroactive Potential of the Human Gut Microbiota in Quality of Life and Depression. Nat Microbiol 2019, 4, 623–632. [Google Scholar] [CrossRef] [PubMed]
- Li, D.; Lin, Q.; Luo, F.; Wang, H. Insights into the Structure, Metabolism, Biological Functions and Molecular Mechanisms of Sialic Acid: A Review. Foods 2024, 13, 145. [Google Scholar] [CrossRef] [PubMed]
- Wang, S.; Peng, R.; Qin, S.; Liu, Y.; Yang, H.; Ma, J. Effects of Oligosaccharide-Sialic Acid (OS) Compound on Maternal-Newborn Gut Microbiome, Glucose Metabolism and Systematic Immunity in Pregnancy: Protocol for a Randomised Controlled Study. BMJ Open 2019, 9, e026583. [Google Scholar] [CrossRef]
- Liu, Q.; Yu, Z.; Tian, F.; Zhao, J.; Zhang, H.; Zhai, Q.; Chen, W. Surface Components and Metabolites of Probiotics for Regulation of Intestinal Epithelial Barrier. Microbial Cell Factories 2020, 19, 23. [Google Scholar] [CrossRef]
- Li, W.; Tang, X.; Liu, H.; Liu, K.; Tian, Z.; Zhao, Y. Protective Effect of 1,3-Dioleoyl-2-Palmitoylglycerol against DSS-Induced Colitis via Modulating Gut Microbiota and Maintaining Intestinal Epithelial Barrier Integrity. Food Funct. 2024, 15, 8700–8711. [Google Scholar] [CrossRef] [PubMed]
- McGuckin, M.A.; Eri, R.; Simms, L.A.; Florin, T.H.J.; Radford-Smith, G. Intestinal Barrier Dysfunction in Inflammatory Bowel Diseases. Inflamm Bowel Dis 2009, 15, 100–113. [Google Scholar] [CrossRef]
- Adams, L.; Li, X.; Burchmore, R.; Goodwin, R.J.A.; Wall, D.M. Microbiome-Derived Metabolite Effects on Intestinal Barrier Integrity and Immune Cell Response to Infection. Microbiology 2024, 170, 001504. [Google Scholar] [CrossRef]
- Choo, C.; Mahurkar-Joshi, S.; Dong, T.S.; Lenhart, A.; Lagishetty, V.; Jacobs, J.P.; Labus, J.S.; Jaffe, N.; Mayer, E.A.; Chang, L. Colonic Mucosal Microbiota Is Associated with Bowel Habit Subtype and Abdominal Pain in Patients with Irritable Bowel Syndrome. Am J Physiol Gastrointest Liver Physiol 2022, 323, G134–G143. [Google Scholar] [CrossRef]
- Iribarren, C.; Savolainen, O.; Sapnara, M.; Törnblom, H.; Simrén, M.; Magnusson, M.K.; Öhman, L. Temporal Stability of Fecal Metabolomic Profiles in Irritable Bowel Syndrome. Neurogastroenterol Motil 2024, 36, e14741. [Google Scholar] [CrossRef]
- Vakili, O.; Adibi Sedeh, P.; Pourfarzam, M. Metabolic Biomarkers in Irritable Bowel Syndrome Diagnosis. Clin Chim Acta 2024, 560, 119753. [Google Scholar] [CrossRef]
- Baumgartner, M.; Lang, M.; Holley, H.; Crepaz, D.; Hausmann, B.; Pjevac, P.; Moser, D.; Haller, F.; Hof, F.; Beer, A.; et al. Mucosal Biofilms Are an Endoscopic Feature of Irritable Bowel Syndrome and Ulcerative Colitis. Gastroenterology 2021, 161, 1245–1256.e20. [Google Scholar] [CrossRef] [PubMed]
- Wang, R.X.; Lee, J.S.; Campbell, E.L.; Colgan, S.P. Microbiota-Derived Butyrate Dynamically Regulates Intestinal Homeostasis through Regulation of Actin-Associated Protein Synaptopodin. Proc Natl Acad Sci U S A 2020, 117, 11648–11657. [Google Scholar] [CrossRef] [PubMed]
- Vich Vila, A.; Hu, S.; Andreu-Sánchez, S.; Collij, V.; Jansen, B.H.; Augustijn, H.E.; Bolte, L.A.; Ruigrok, R.A.A.A.; Abu-Ali, G.; Giallourakis, C.; et al. Faecal Metabolome and Its Determinants in Inflammatory Bowel Disease. Gut 2023, 72, 1472–1485. [Google Scholar] [CrossRef] [PubMed]
Figure 1.
Volcano plot of fold change and statistical significance for differential features between IBS and control groups. Positive values of the log2FC indicate a higher metabolite level in IBS patients, negative values indicate a higher metabolite level in non-IBS individuals. P values, reported as -log10, were obtained from a t-test. Points are colored according to fold change, while point size reflects the -log10(p-value). Only metabolites exceeding fold change threshold (log2 fold change ≥ 1 or ≤ -1, indicated by vertical lines) and p-values < 0.05 (corresponding to -log10 of 1.30 – a horizontal line) are highlighted. .
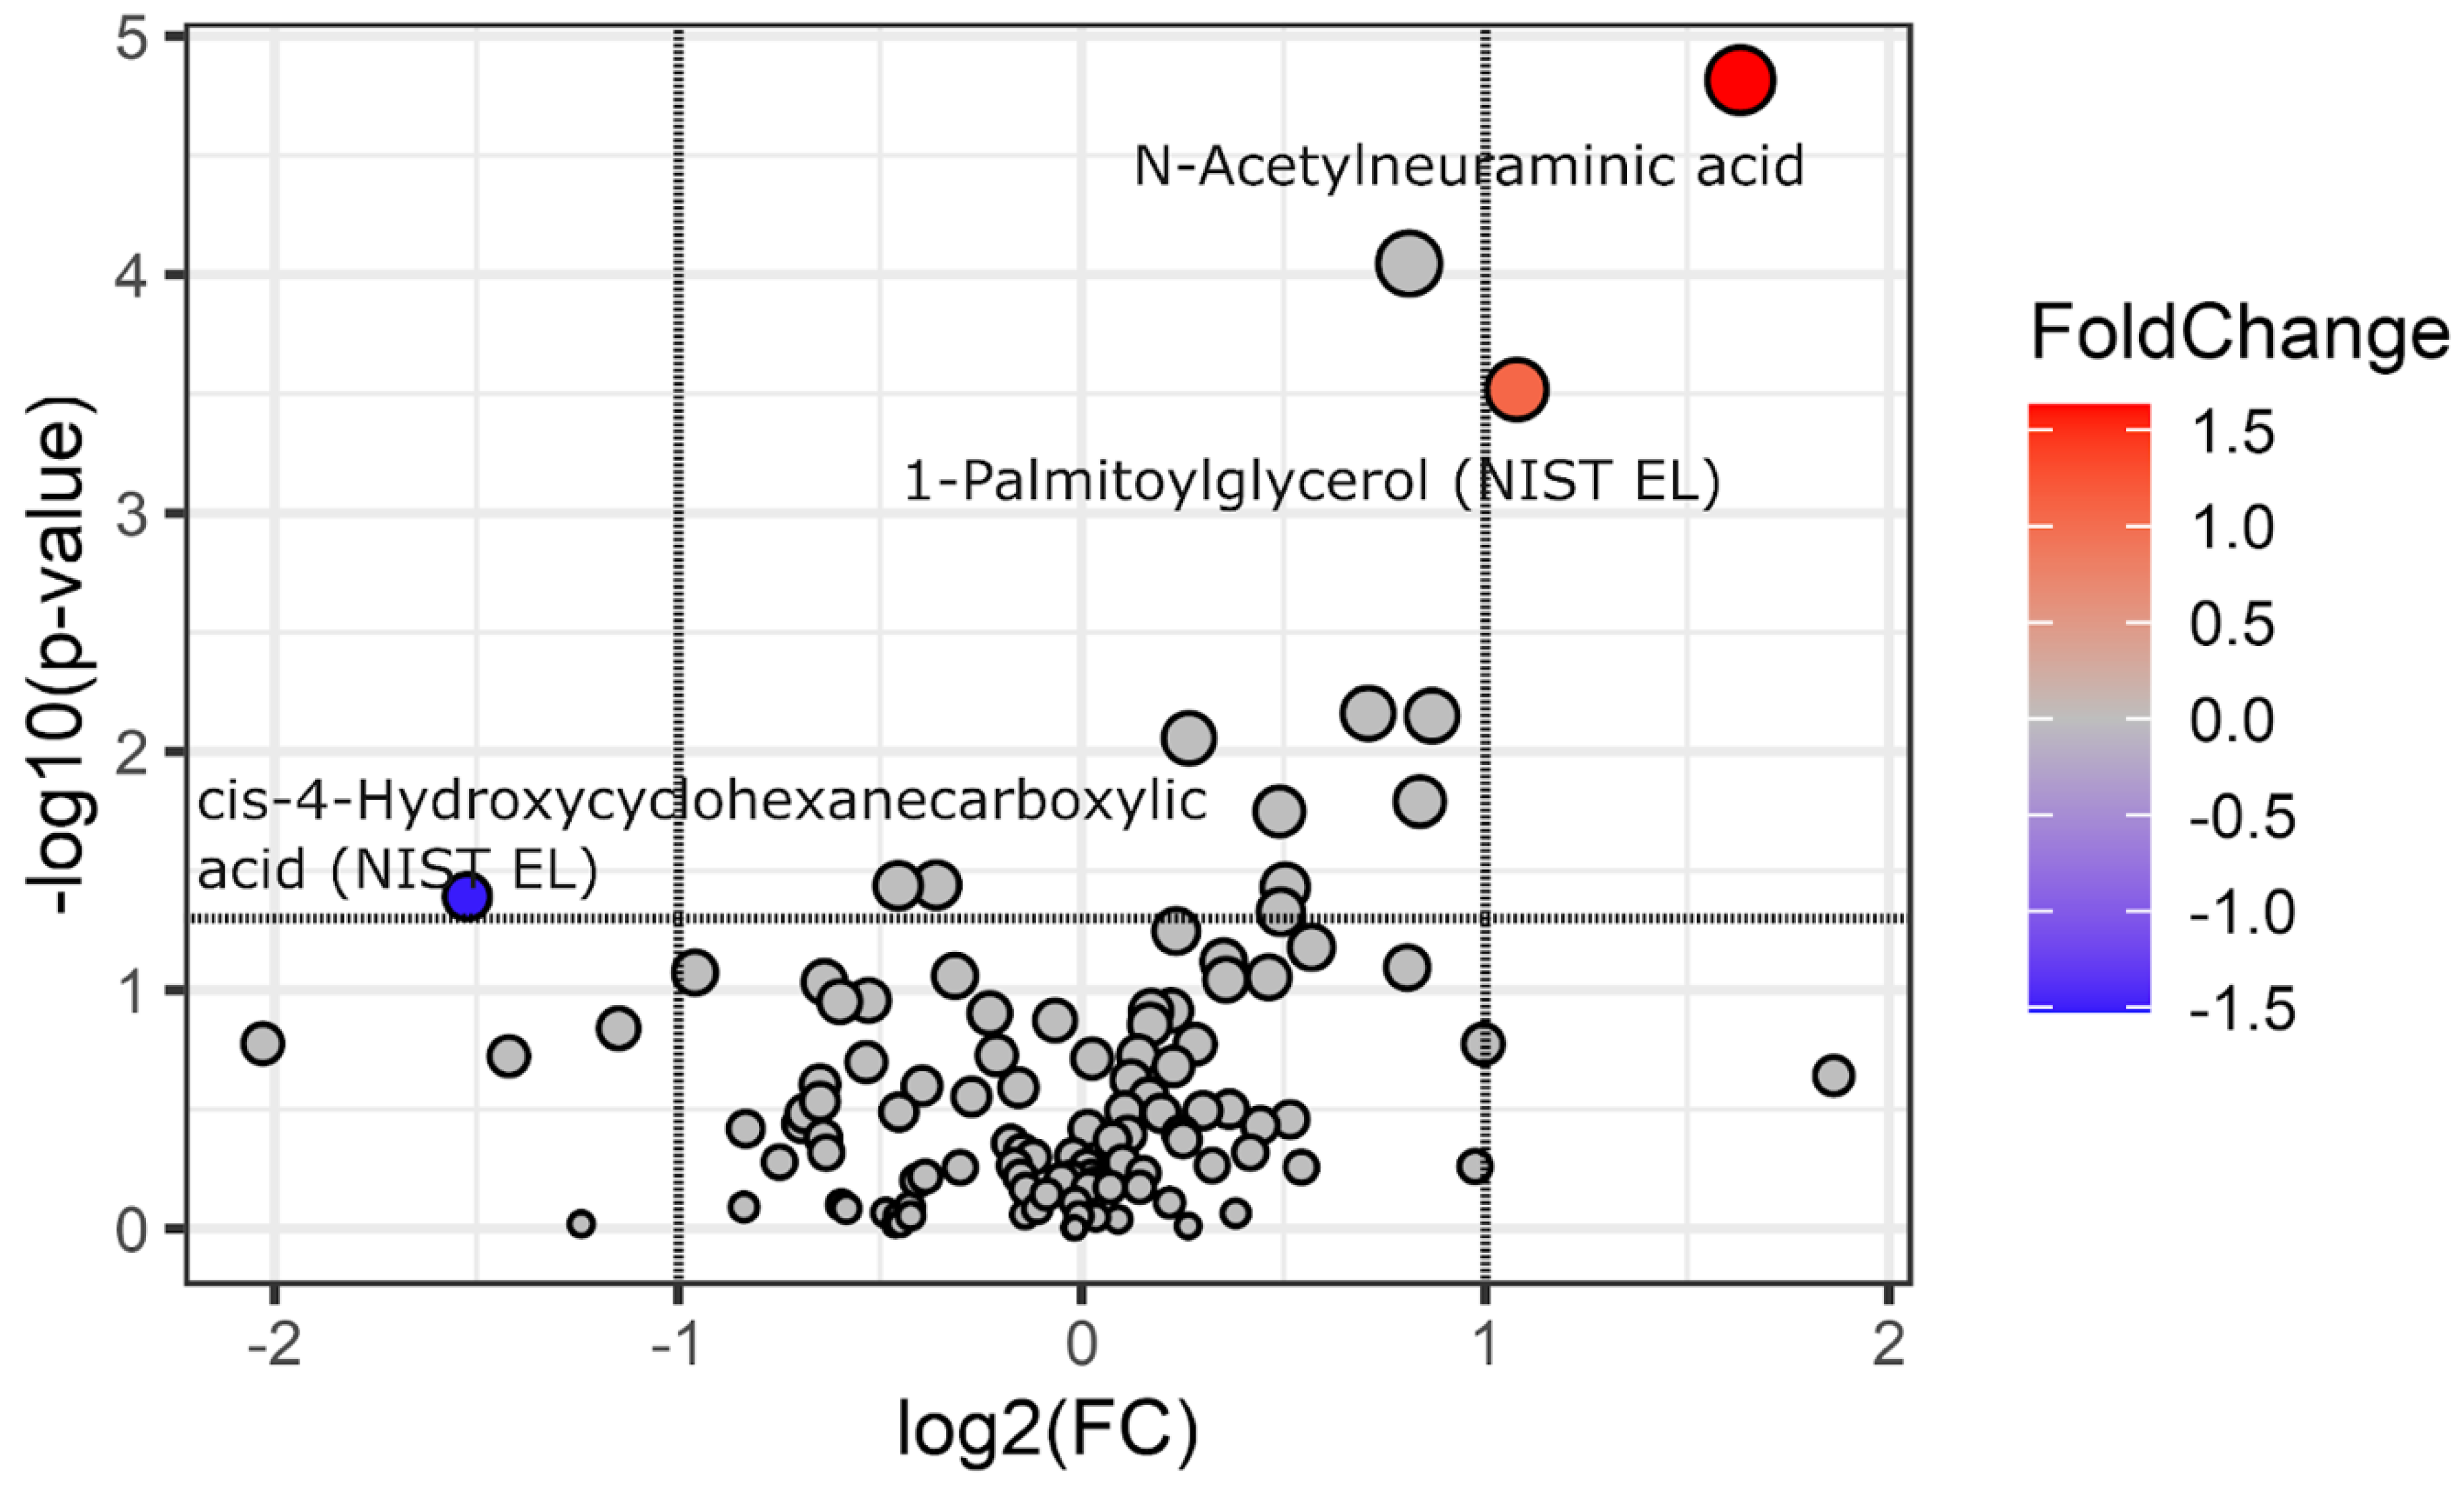
Figure 2.
Evaluation of Random Forest model performance and feature importance based on AUC and 1−AUC metrics. Panel (A) Test data AUC ROC values with bootstrap 95% CI for models trained on real data (Y-real) and Y-scrambled data from 100 iterations. Panel (B) Feature importance analysis - 10 most influential predictors, ranked by a median 1-AUC value. Features were permuted in the test set, and the corresponding reduction in AUC was calculated for models trained on Y-real (red) and Y-scrambled (blue) outcome data. Error bars represent bootstrap 95% CI. The baseline refers to AUC values obtained without permutation (100 iterations themselves). Comparing the 95% CIs of permuted features against the baseline enables statistical assessment of feature importance.
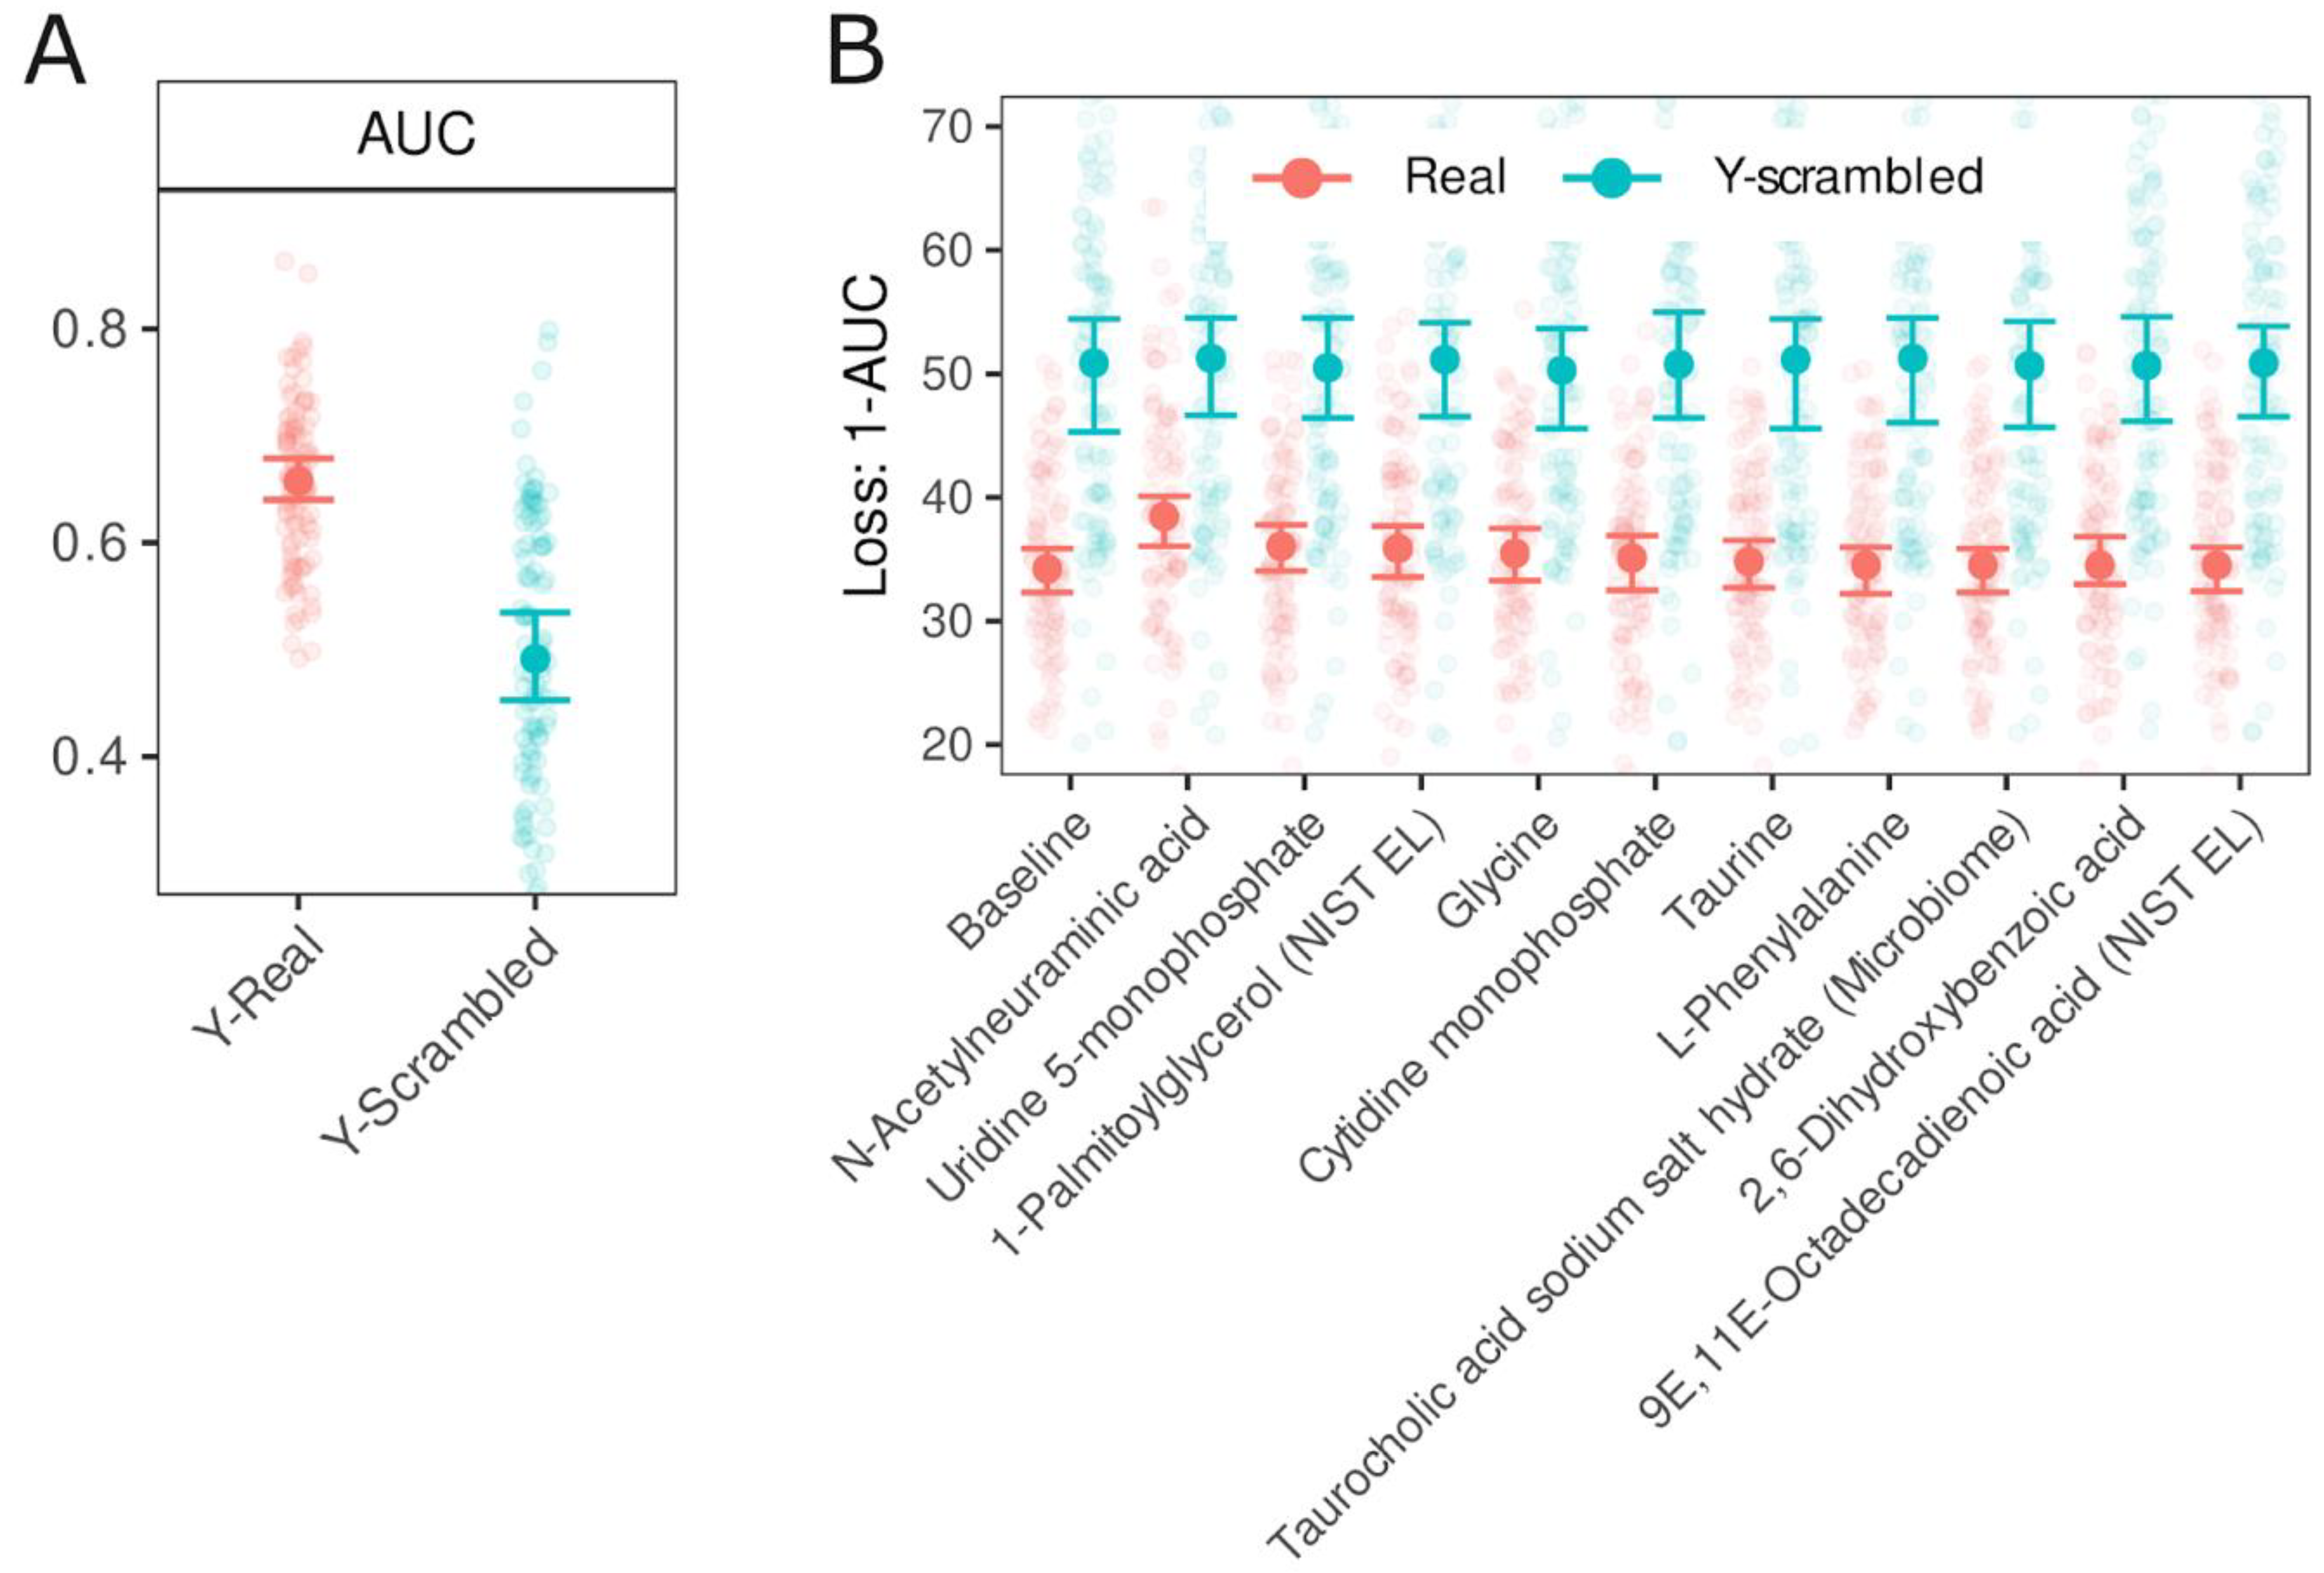

Table 1.
Participants characteristics.
| Characteristic | IBS N = 441 | Other N = 691 | P2 |
|---|---|---|---|
| Sex | 0.175 | ||
| Females | 30 / 44 (68%) | 38 / 69 (55%) | |
| Males | 14 / 44 (32%) | 31 / 69 (45%) | |
| Age (years) | 0.029 | ||
| Mean (SD) | 52 (16) | 59 (13) | |
| Body mass (kg) | 0.741 | ||
| Mean (SD) | 77 (18) | 77 (15) | |
| Height (cm) | 0.538 | ||
| Mean (SD) | 168 (10) | 168 (13) | |
| BMI (kg/m2) | 0.932 | ||
| Mean (SD) | 27.0 (5.4) | 27.7 (8.5) | |
| DM (Yes/No) | 7 / 44 (16%) | 9 / 69 (13%) | 0.783 |
| Hypertension (Yes/No) | 14 / 44 (32%) | 32 / 69 (46%) | 0.169 |
1n / N (%), 2Fisher's exact test; Wilcoxon rank sum test.
Disclaimer/Publisher’s Note: The statements, opinions and data contained in all publications are solely those of the individual author(s) and contributor(s) and not of MDPI and/or the editor(s). MDPI and/or the editor(s) disclaim responsibility for any injury to people or property resulting from any ideas, methods, instructions or products referred to in the content. |
© 2025 by the authors. Licensee MDPI, Basel, Switzerland. This article is an open access article distributed under the terms and conditions of the Creative Commons Attribution (CC BY) license (http://creativecommons.org/licenses/by/4.0/).
Copyright: This open access article is published under a Creative Commons CC BY 4.0 license, which permit the free download, distribution, and reuse, provided that the author and preprint are cited in any reuse.


