
Submitted:
18 August 2025
Posted:
20 August 2025
You are already at the latest version
Abstract
Clostridioides difficile infection (CDI) is the leading cause of nosocomial diarrhea. Current diagnostic tools have difficulty distinguishing between colonization and active infection. This study evaluated the utility of fecal metabolomics in diagnosing CDI in hospitalized patients with acute diarrhea. We conducted a prospective observational study involving hospitalized adults with new-onset diarrhea during admission. Participants were strati-fied into groups based on clinical and microbiological findings: controls, C. difficile col-onized and C. difficile infected. Fecal samples were analyzed using UPLC-MS/MS and GC-MS to quantify selected short-chain fatty acids, amino acids, and bile acids. Multi-variate and univariate statistical analyses included PLS-DA, sPLSDA, and tests with FDR correction. Infected patients exhibited significantly higher concentrations of SCFAs and notable alterations in bile acid profiles. Key discriminative metabolites included isova-lerate, propionate, isobutyrate and alpha-aminobutyric acid. ROC curve analyses showed strong diagnostic performance for these markers, with AUC values exceeding 0.85. Fecal metabolomic profiling could effectively differentiate between colonization and infection in CDI among hospitalized patients with diarrhea. These results highlight the potential of metabolomic signatures to enhance the diagnostic precision for CDI.
Keywords:
Clostridioides difficile
; fecal metabolomics
; diagnosis
; biomarkers
; bile acids
; SCFAs
; amino acids
1. Introduction
Clostridioides difficile infection (CDI) is the most common cause of healthcare-associated diarrhea in high-income countries and represents a growing public health challenge due to its increasing incidence, recurrence rates, and severity [1,2]. While diagnostic techniques have evolved—from enzyme immunoassays to nucleic acid amplification tests (NAATs)—the ability to distinguish between active infection and asymptomatic colonization remains limited [3]. This distinction is clinically critical, as up to 3-21% of hospitalized patients may be colonized by toxigenic C. difficile without presenting symptoms [4,5], and overtreatment based on NAATs alone can lead to unnecessary antibiotic exposure and costs. The concept of “colonization resistance” underscores the protective role of the gut microbiota against C. difficile overgrowth [6,7]. Antibiotic-induced dysbiosis disrupts this balance, allowing spore germination, vegetative proliferation, and toxin production. However, microbial composition alone may not capture the full picture. Increasing evidence suggests that the gut metabolome—the collective metabolic output of host and microbial activity—plays a decisive role in determining susceptibility to CDI [8].
Among the most relevant microbial metabolites are bile acids and short-chain fatty acids (SCFAs). Primary bile acids, such as cholic and chenodeoxycholic acid, can promote C. difficile germination, while secondary bile acids like deoxycholic and lithocholic acid inhibit its growth and toxin production [9,10]. CDI has been consistently associated with an increased ratio of primary to secondary bile acids, reflecting impaired microbial 7α-dehydroxylation capacity [11,12]. On the other hand, SCFAs—particularly butyrate, isobutyrate, and propionate—contribute to epithelial integrity and modulate immune responses. Their depletion has been linked to gut barrier dysfunction and may facilitate disease onset and progression, although previous studies in animal and human models have shown contradictory results [13,14,15]. Despite the growing body of evidence, few studies have directly compared the fecal metabolic signatures of patients with active CDI, asymptomatic colonization, and non-colonized controls [15,16,17]. This distinction is crucial, as it mirrors the real-world diagnostic dilemma clinicians face, particularly when microbiological results and clinical presentation are discordant.
In this study, we applied targeted fecal metabolomics to characterize and compare the metabolic profiles of hospitalized patients with confirmed CDI, toxigenic C. difficile colonized patients, and non-colonized controls with acute onset diarrhea. We aimed to identify metabolite-level alterations, especially in bile acid and SCFA pathways, that could serve as discriminatory biomarkers for CDI. By focusing on clinically relevant patterns, our goal was to explore the potential of fecal metabolomics as a complementary tool in the diagnostic work-up of CDI.
2. Materials and Methods
2.1. Study Design
This was a single-center, experimental, prospective study conducted at a tertiary hospital between January 2019 and March 2023. Fecal samples were collected from hospitalized adult patients with new-onset diarrhea and for whom C. difficile diagnostic testing was requested.
2.2. Study Population and Classification
Inclusion criteria were: age ≥18, hospitalization for more than 48h at inclusion, acute diarrhea during admission, and availability of C. difficile diagnostic results (PCR for toxin B and toxin B antigen immunochromatographic assay). Exclusion criteria were recent CDI treatment (<14 days), or incomplete microbiological data. Patients were classified into three groups: (1) Infection: PCR-positive and antigen-positive, meeting all clinical criteria for CDI (including diarrhea with ≥3 unformed stools in 24 h, fever or abdominal pain, risk factors for CDI, and absence of alternative causes); further subdivided into first episode (I) and recurrence (R); (2) Colonized (C): PCR-positive, antigen-negative, with diarrhea but not meeting full CDI clinical criteria; (3) Control (X): Negative for both PCR and toxin, but with acute diarrhea during hospitalization.
2.3. Ethics Statement
All data were pseudonymized. Data collection followed GDPR and Spanish biomedical research regulations. The study was approved by the INCLIVA Institutional Review Board (CEIm), reference number 2020/271, on 12 November 2020, and conducted in accordance with the Declaration of Helsinki (2013).
2.4. Sample Size
This was an exploratory translational study. Based on literature and feasibility, we selected 30 CDI patients (15 first episode infections and 15 recurrent infections), 15 colonized patients, and 15 controls.
2.5. Clinical Data Collection
Demographic, clinical, microbiological, and therapeutic variables were extracted from electronic health records. Collected variables are detailed in Supplementary Table S1.
2.6. Sample Handling and Metabolomic Processing
Stool samples (100–200 mg) were aliquoted into 1.5 mL Eppendorf tubes and stored at −80°C until analysis. Fecal metabolomic profiling was conducted using a combined analytical platform incorporating both liquid chromatography-tandem mass spectrometry (LC-MS/MS) and gas chromatography-mass spectrometry (GC-MS). A total of 77 metabolites were quantified, including bile acids, amino acids, and SCFAs. Detection rates exceeded 95% for nearly all SCFAs and amino acids. Quantitative normalization followed standard internal procedures appropriate for fecal metabolomics and concentrations were corrected for wet fecal weight.
2.7. Bile Acids
Bile acids were quantified using a validated UHPLC-MS/MS protocol adapted from Ramos-García et al. [18]. Stool samples were extracted in CH3OH:PBS (1:1), centrifuged, and supernatants were mixed with internal standards and cold methanol for protein precipitation. After a second centrifugation, the samples were analyzed using an ACQUITY BEH C8 column and a Xevo TQ-S mass spectrometer in negative ESI mode. Gradient elution and MRM transitions were optimized. The method followed FDA guidelines [19], and concentrations were normalized to sample weight.
2.8. Short-Chain Fatty Acids and Branched-Chain Amino Acids
SCFAs and branched-chain amino acids (BCAAs) were analyzed using a derivatization method based on propyl chloroformate, adapted from Ramos-Garcia et al. [20]. After extraction and derivatization, samples were analyzed by GC-MS in SIM mode using a capillary HP-5 MS column. Quantification was achieved through external calibration with an internal standard (caproic acid-D3), and concentrations were normalized to sample weight.
2.9. Amino Acids
Amino acids were quantified by UPLC-MS/MS following derivatization with the AccQTag Ultra kit (Waters). Derivatized extracts were analyzed with MRM mode transitions specific to each amino acid. Chromatographic separation and detection conditions were optimized for accuracy and reproducibility. Results were normalized to sample weight, with QC measures applied throughout the run.
2.7. Metabolomics and Statistical Analysis
Statistical analysis of clinical variables was conducted using SPSS v29.0. Depending on the data type and distribution, group comparisons employed Student’s t-test, Mann–Whitney U test, chi-squared test, or Fisher’s exact test. Multivariate logistic regression was used to identify independent clinical predictors of CDI. Targeted metabolomics data were processed using MetaboAnalyst and MATLAB. To account for the high dimensionality and potential non-normal distribution of metabolite concentrations, non-parametric ANOVA and Mann–Whitney U tests were applied, with false discovery rate (FDR) correction to adjust for multiple comparisons. Key discriminatory metabolites were identified using Significance Analysis of Microarrays (SAM) (a feature selection method originally developed for high-dimensional data) based on delta thresholds and q-values. To evaluate the diagnostic separation between CDI and control groups, dimensionality reduction and classification techniques were employed. Principal component analysis (PCA) was used for unsupervised pattern recognition. Partial least squares discriminant analysis (PLS-DA), a supervised multivariate technique, and its sparse variant (sPLS-DA) were applied to enhance group discrimination and pinpoint potential biomarker metabolites. Visualization tools such as clustered heatmaps and self-organizing maps (SOMs) provided intuitive representations of metabolic shifts associated with CDI. Missing values were conservatively imputed using the minimum detected positive value per metabolite, preserving biological relevance while minimizing distortion.
3. Results
3.1. Study Population and Sample Processing
A total of 60 fecal specimens were collected using a consecutive sampling strategy stratified by each of the four clinical groups defined by microbiological and clinical criteria: 30 individuals with confirmed CDI, subdivided into 15 with a primary episode (I) and 15 with a first documented recurrence (R); 15 individuals colonized with C. difficile (C); and 15 symptomatic control patients presenting with diarrhea but testing negative for the C. difficile toxin B gene by PCR (X). Each group was defined to explore distinct pathophysiological stages along the C. difficile infection spectrum. Upon sample quality control, 12 fecal samples were excluded due to inadequate material for metabolomic profiling (presence of foreign material or contaminants that could interfere with mass spectrometry detection). This yielded a final analytical dataset of 48 fecal specimens (Figure 1). Mean concentrations for all analyzed metabolites are provided as supplementary material in Table S2.
Demographic profiles, including age and sex distribution, did not differ significantly across groups (Table 1). However, patients with active CDI exhibited a slightly higher burden of chronic comorbidities, notably heart failure (40% vs. 0% in colonized and 9% in controls) and advanced-stage chronic kidney disease (32% in CDI vs. 0% in colonized vs. 18% in controls). Antibiotic exposure was markedly elevated in the CDI group, with 80% of patients reporting more than 10 cumulative days of antibiotic therapy in the preceding month (vs. 8.3% in colonized and 18.2% in controls, p < 0.001). Other epidemiological characteristics, risk factors for CDI and clinical characteristics are summarized in Table 1, Table 2 and Table 3. Severity parameters and microbiological diagnostics tests results (including Ct values for PCR) among different groups at diagnosis are presented in Table A1 and A2, respectively.
3.2. Global Metabolomic Trends
PCA revealed partial segregation between groups, with controls showing the most distinct separation from CDI patients. The first two principal components captured approximately 31% of the total variance. SCFAs contributed prominently to PC1, though their levels were notably elevated, in C. difficile-positive samples. PLS-DA supported this trend, showing clear separation between controls and C. difficile-positive patients, with substantial overlap between colonized and infected groups. These data suggest that C. difficile colonization—irrespective of symptomatology—is also associated with a metabolically distinct fecal profile (Figure 2).
3.3. Differential Metabolites and Diagnostic Stratification
Several metabolites, particularly SCFAs and select amino acids, were significantly elevated in C. difficile-positive patients compared to controls. Propionate, isovalerate, and alpha-aminobutyric acid (AABA) showed the most consistent increases in infected patients. Boxplots and heatmaps revealed that these metabolites were markedly enriched in infection states, particularly in cases with recurrence (Figure 3).
When comparing active CDI (first episode + recurrent infection) to non-infected patients (colonized + controls), isovalerate, propionate, and AABA were also significantly higher in the CDI group (p < 0.001; FDR < 0.01). Hierarchical clustering using these top metabolites provided good separation of infected from non-infected samples. Notably, SCFA elevation in CDI was observed in much smaller proportion in colonized individuals, reinforcing its link with active infection.
Receiver operating characteristic (ROC) analysis confirmed the diagnostic potential of these analytes. Isovalerate and propionate achieved AUCs 0.892 (0.786-0.979) and 0.849 (0.731-0.947), for identifying CDI, respectively. Metabolite ratios improved discriminative capacity further: aminoadipic acid (AAA)/propionate yielded an AUC of 0.929 (0.818-1.000) in the MCCV 100-fold (Figure 4). Restricting analysis to CDI versus strictly non-colonized controls resulted in even higher diagnostic precision. Isovalerate alone produced an AUC of 0.941 (0.875-1.000). The AUC, sensitivity and specificity of the main metabolites and ratios with biomarker potential for identifying CDI were determined through logistic regression with 10-fold cross-validation (Table 4).
3.4. Recurrent Infection and Group-Specific Trends
The overall recurrence rate in our cohort was 28%, comparable to rates reported in previous studies (Seekatz et al., 34% [21]; Dawkins et al., 29% [22]; Khanna et al., 28.5% [23]) and higher than the 15% reported by Guh et al. [24]. Notably, none of our patients received metronidazole, which has been associated with increased recurrence risk; all were treated with vancomycin or fidaxomicin. When comparing recurrent CDI cases (R) to primary infections (I), modest differences in fecal metabolite concentrations were observed. Recurrent cases tended to exhibit higher levels of AABA and select SCFAs such as isovalerate and propionate. However, only AABA consistently reached statistical significance in Mann–Whitney U test (FDR 0.045). To further explore this observation, we examined the metabolomic profiles of individuals who experienced a recurrence after their sample had been collected during the primary episode. First infection episode individuals clustered more closely with the recurrent infection group in both unsupervised and supervised analyses, reinforcing the potential of fecal metabolomics to capture features associated with recurrence risk even prior to clinical relapse.

Table 4.
Main metabolites and ratios with the highest potential as biomarkers for CDI and for recurrent infection, identified through logistic regression with 10-fold cross-validation.
Table 4.
Main metabolites and ratios with the highest potential as biomarkers for CDI and for recurrent infection, identified through logistic regression with 10-fold cross-validation.
| Metabolite/Ratio | Condition | AUC | Sensitivity | Specificity |
|---|---|---|---|---|
| AAA/propionate | CDI (I+R vs X+C) | 0.883 (0.785–0.982) |
0.783 (0.783–0.951) |
0.880 (0.753–1.000) |
| AAA/isovalerate | CDI (I+R vs X+C) | 0.893 (0.776–1.000) |
0.880 (0.880–1.000) |
0.833 (0.622–1.000) |
| GCDCA/isobutyrate | CDI (I+R vs X) | 0.942 (0.868–1.000) |
0.995 (0.950–1.000) |
0.880 (0.753–1.000) |
| AABA | Recurrent infection | 0.888 (0.700–1.000) |
0.917 (0.917–1.000) |
0.769 (0.540–0.998) |
AAA, aminoadipic acid; AABA, alpha-aminobutyric acid; GCDCA, glycochenodeoxycholic acid.
3.5. Influence of Comorbidities and Risk Factors
To assess potential confounding effects, we analyzed the fecal metabolomic profiles stratified by the presence or absence of major comorbidities and known risk factors for CDI, including heart failure, advanced chronic kidney disease, and recent antibiotic use. No significant differences in metabolite abundance or composition were observed between patients with and without these risk factors (Figure A1). This suggests that the metabolic alterations identified are primarily associated with infection status rather than underlying host factors, strengthening the specificity of the metabolomic signature for CDI.
4. Discussion
This study demonstrates that targeted fecal metabolomics can effectively differentiate between CDI, colonization, and non-infectious diarrhea in hospitalized patients. Elevated levels of specific SCFAs—notably isovalerate, propionate, and isobutyrate—along with AABA, emerged as robust metabolic signatures of active CDI. Diagnostic accuracy improved further through the construction of metabolite ratios, such as AAA/SCFAs and GCDCA/SCFAs, achieving AUC values exceeding 0.85. AAA was included in several metabolite ratios achieving high AUC values given its relatively stable concentrations across all study groups, providing a consistent reference point for comparative analysis. These results highlight the potential of metabolomic signatures to differentiate not only between infected and control individuals but also to distinguish infection from colonization—an enduring diagnostic challenge.
These findings are consistent with and extend previous research, particularly the landmark study by Robinson et al. [15], which also identified 4-methylpentanoic acid (4-MPA), an SCFA product of Stickland fermentation, an anaerobic amino acid fermentation pathway used by certain gut bacteria, as a potential CDI biomarker. More recently, a large multi-omics study of hospital-acquired diarrhea by Bosnjak et al. [25] likewise reported elevated levels of several Stickland by-products in CDI, including 4-MPA, isovalerate, and isobutyrate, further corroborating our observations. Unlike these cohorts, our study incorporated a more granular clinical characterization and stratification into first infection, recurrence, colonization, and control groups. The observed enrichment of SCFAs in infected patients aligns with the anaerobic fermentative metabolism of C. difficile, particularly via the Stickland reaction. This contrasts with prior assumptions that SCFA depletion is a hallmark of dysbiosis and, therefore, was associated with CDI [13,26]. Instead, our data suggest that certain SCFAs may accumulate specifically in the setting of C. difficile overgrowth, likely due to bacterial metabolic activity rather than host or commensal dysfunction. Notably, in our study isovalerate exhibited excellent discriminatory capacity, reinforcing the role of leucine fermentation pathways in CDI pathogenesis. In addition to SCFAs, AABA showed strong discriminatory performance, especially in recurrent infections. While previously underappreciated, AABA is a non-proteinogenic amino acid linked to nitrogen export during bacterial amino acid metabolism [27] and may reflect intensified metabolic flux in recurrent disease. This supports its potential role as a recurrence-specific biomarker.
The profile of bile acids also revealed group-specific patterns. As expected from prior studies, infected patients showed relatively lower levels of secondary bile acids, consistent with a loss of microbial dehydroxylation activity [12,28]. Though these differences were less pronounced than those observed for SCFAs, ratios involving GCDCA and secondary bile acids added diagnostic value, particularly when distinguishing between infection and colonization. This is in line with experimental data showing that primary bile acids promote C. difficile germination, while secondary bile acids inhibit its vegetative growth and toxin activity [10,29].
Importantly, we found no significant influence of major comorbidities (e.g., DM, heart failure), antibiotic duration, or common medications (e.g., PPIs, antidepressants) on metabolomic patterns within clinical groups. This supports the hypothesis that the metabolic shifts observed are primarily attributable to infection status, enhancing their potential utility as specific diagnostic tools.
While not designed for prediction, exploratory analyses suggested that metabolomic fingerprints may offer early indications of recurrence risk. In particular, samples from patients who later relapsed showed a profile more similar to recurrent cases at baseline. This echoes observations from Dawkins et al. [22], who highlighted metabolomic delays in post-treatment microbiome recovery as potential predictors of recurrence.
Some experts have proposed that C. difficile colonization and infection should be understood as a pathophysiological continuum rather than as two distinct clinical entities [30]. This spectrum-based model considers the interplay of multiple host and microbial factors that modulate disease progression. In our study, the proximity of metabolomic profiles observed between some colonized individuals and patients with active infection supports this concept and suggests that a subset of colonized patients may represent a preclinical stage of CDI. Identifying such high-risk individuals early could have important preventive implications, although the central clinical challenge remains determining when targeted treatment is truly warranted.
A distinguishing feature of our work is the comprehensive and systematic assessment of clinical characteristics and potential risk factors, which was conducted in far greater detail than in any previous metabolomic study of C. difficile infection, thereby allowing a more robust adjustment for possible confounders. Another strength of this study is the rigorous methodology applied in fecal sampling, storage, and analysis. Sample handling was tightly standardized to minimize variability related to collection, homogenization, and freeze–thaw cycles—critical issues in fecal metabolomics. Dual-platform analysis using GC-MS and UPLC-MS/MS enabled broad coverage of both volatile and non-volatile compounds, ensuring reliable quantification of key metabolite classes. Despite these promising findings, several limitations should be noted. First, the study was cross-sectional and limited in sample size, potentially affecting the generalizability and statistical power for subgroup comparisons. Although formal power calculations were not feasible due to the exploratory nature of the study and the lack of prior effect size estimates for most metabolites, we acknowledge the potential for type I and type II errors as well as model overfitting. To mitigate this, we employed repeated cross-validation and multiple testing correction strategies; nevertheless, findings should be interpreted as hypothesis-generating. Second, while all patients received standardized hospital diets, potential confounding from unmeasured dietary variation or medication exposure remains possible. Third, the lack of concurrent microbiome sequencing limits our ability to link metabolic shifts with specific microbial taxa. Future work integrating metagenomics with metabolomics will be critical to clarify host-microbiota-metabolite interactions.
5. Conclusions
This study adds to the growing evidence that fecal metabolomics can refine the diagnostic approach to CDI. Our results support a model in which SCFAs, AABA, and bile acid ratios may complement existing microbiological testing by improving specificity—particularly in distinguishing colonization from infection, a current clinical challenge. These metabolite markers could form the basis of an adjunct diagnostic test to distinguish true CDI cases from carriers, thereby reducing misdiagnosis and unnecessary treatment. Prospective validation in larger, multi-center cohorts is warranted, ideally with longitudinal follow-up and inclusion of microbiome sequencing. Ultimately, the integration of metabolomic biomarkers into clinical workflows could enable earlier, more accurate diagnoses, optimize treatment decisions, and reduce unnecessary antibiotic use.
Supplementary Materials
The following supporting information can be downloaded at the website of this paper posted on Preprints.org, Table S1: Demographic, epidemiological and clinical variables; Table S2: Concentrations of metabolites in stool samples.
Author Contributions
Conceptualization, Carlos Bea-Serrano and María Rosa Oltra-Sempere; methodology, Carlos Bea-Serrano and María Rosa Oltra-Sempere; formal analysis, Carlos Bea-Serrano; investigation, Carlos Bea-Serrano, Andreu Belmonte-Domingo, Carolina Pinto-Plá, Ana Ferrer-Ribera, Sara Vela-Bernal, Ana Isabel de Gracia-León, Andrea de Castro-Oliver, Lucas Serna-Navarro, Celia Prades-Sirvent, David Ruiz-Raga, and María Rosa Oltra-Sempere; resources, María José Forner-Giner and María Rosa Oltra-Sempere; data curation, Carlos Bea-Serrano; writing—original draft preparation, Carlos Bea-Serrano; writing—review and editing, Carlos Bea-Serrano, María José Forner-Giner, and María Rosa Oltra-Sempere; supervision, María José Galindo, María José Forner-Giner and María Rosa Oltra-Sempere; project administration, Carlos Bea-Serrano; funding acquisition, María Rosa Oltra-Sempere. All authors have read and agreed to the published version of the manuscript.
Funding
Carlos Bea-Serrano holds a Rio Hortega contract (CM23/00282), funded by the Instituto de Salud Carlos III (ISCIII), Spain. This research received no specific external funding. The APC was funded by the authors.
Institutional Review Board Statement
The study was conducted in accordance with the Declaration of Helsinki, and approved by the Ethics Committee of INCLIVA (reference number 2020/271, on 12 November 2020).
Informed Consent Statement
Informed consent was obtained from all subjects involved in the study.
Data Availability Statement
The data presented in this study are available on request from the corresponding author due to ethical and privacy restrictions. The dataset contains individual-level patient information for which specific consent for public data sharing was not obtained.
Conflicts of Interest
The authors declare no conflicts of interest.
Abbreviations
The following abbreviations are used in this manuscript:
| AAA | Aminoadipic acid |
| AABA | Alpha-aminobutyric acid |
| ANOVA | Analysis of variance |
| BEH | Ethylene bridged hybrid (chromatography column technology) |
| CDI | Clostridioides difficile infection |
| CKD | Chronic kidney disease |
| COPD | Chronic obstructive pulmonary disease |
| CVD | Cardiovascular disease |
| DA | Discriminant analysis |
| DM | Diabetes mellitus |
| ESI | Electrospray ionization |
| FDA | Food and Drug Administration |
| FDR | False discovery rate |
| GC-MS | Gas chromatography–mass spectrometry |
| GCDCA | Glycochenodeoxycholic acid |
| GDPR | General Data Protection Regulation |
| GEIH | Grupo de Estudio de Infección Hospitalaria (Spanish Hospital Infection Study Group) |
| IBD | Inflammatory bowel disease |
| IDSA | Infectious Diseases Society of America |
| LC-MS | Liquid chromatography–mass spectrometry |
| MCCV | Monte Carlo cross-validation |
| MPA | methylpentanoic acid |
| MRM | Multiple reaction monitoring |
| MS | Mass spectrometry |
| NAAT | Nucleic acid amplification tests |
| PBS | Phosphate-buffered saline |
| PCA | Principal component analysis |
| PCR | Polymerase chain reaction |
| PLS-DA | Partial least squares–discriminant analysis |
| PPI | Proton pump inhibitors |
Appendix A
Appendix A.1
Table A1.
Severity parameters among different groups at diagnosis.
| Recurrence | Infection | Colonization | Control | p-value | |
|---|---|---|---|---|---|
| Temperature (ºC) |
36.6 (IQR 36.3-37.8) |
36.2 (IQR 36-37.4) |
36.3 (IQR 36.0-36.8) |
36.0 (IQR 36.0-38.0) |
0.544 |
| WBC (cels/μL) |
14015 (IQR 7080-17562) |
11000 (IQR 7265-24970) |
7765 (IQR 2630-9520) |
7170 (IQR 5660-10080 |
0.069 |
| Albumin (g/dL) | 3.2 (±0.6) | 3.03 (±0.7) | 3.39 (±0.7) | 2.9 (±0.7) | 0.280 |
| Creatinine (mg/dL) | 0.79 (IQR 0.59-1.14) |
1.60 (IQR 0.61-2.37) |
0.96 (IQR 0.59-1.26) |
0.83 (IQR 0.54-1.46) |
0.586 |
WBC, white blood cells.
Table A2.
Microbiological diagnostic tests of CDI in the included patients.
| Test | Infection | Colonization | Control | |
|---|---|---|---|---|
| Ct PCR DNAtoxB | ≤25 | 22 (88.0%) | 2 (16.7%) | – |
| >25 | 3 (12.0%) | 10 (83.4%) | – | |
| GDH antigen | Positive | 21 (84.0%) | 5 (41.7%) | 0 (0.0%) |
| Negative | 0 (0.0%) | 5 (41.7%) | 10 (90.9%) | |
| Not performed | 4 (16.0%) | 2 (16.7%) | 1 (9.1%) | |
| Toxin B IC | Positive | 25 (100%) | 0 (0.0%) | 0 (0.0%) |
| Negative | 0 (0.0%) | 12 (100%) | 11 (100%) |
Ct, cycle threshold; GDH, glutamate dehydrogenase; IC, immunochromatographic test.
Figure A1.
sPLS-DA of the fecal metabolomic profile according to the presence or absence of selected comorbidities and CDI risk factors that showed differences in their distribution between groups. (A) Previous antibiotic exposure, (B) Antibiotic treatment longer than 10 days, (C) Diabetes mellitus, (D) Heart failure.
References
- Gerding, D.N.; Johnson, S.; Peterson, L.R.; Mulligan, M.E.; Silva, J. Clostridium Difficile-Associated Diarrhea and Colitis. Infection Control & Hospital Epidemiology 1995, 16, 459–477. [Google Scholar] [CrossRef]
- Lessa, F.C.; Mu, Y.; Bamberg, W.M.; Beldavs, Z.G.; Dumyati, G.K.; Dunn, J.R.; Farley, M.M.; Holzbauer, S.M.; Meek, J.I.; Phipps, E.C.; et al. Burden of Clostridium Difficile Infection in the United States. New England Journal of Medicine 2015, 372, 825–834. [Google Scholar] [CrossRef]
- McDonald, L.C.; Gerding, D.N.; Johnson, S.; Bakken, J.S.; Carroll, K.C.; Coffin, S.E.; Dubberke, E.R.; Garey, K.W.; Gould, C.V.; Kelly, C.; et al. Clinical Practice Guidelines for Clostridium Difficile Infection in Adults and Children: 2017 Update by the Infectious Diseases Society of America (IDSA) and Society for Healthcare Epidemiology of America (SHEA). Clinical Infectious Diseases 2018, 66, e1–e48. [Google Scholar] [CrossRef]
- Clabots, C.R.; Johnson, S.; Olson, M.M.; Peterson, L.R.; Gerding, D.N. Acquisition of Clostridium Difficile by Hospitalized Patients: Evidence for Colonized New Admissions as a Source of Infection. Journal of Infectious Diseases 1992, 166, 561–567. [Google Scholar] [CrossRef]
- Alasmari, F.; Seiler, S.M.; Hink, T.; Burnham, C.-A.D.; Dubberke, E.R. Prevalence and Risk Factors for Asymptomatic Clostridium Difficile Carriage. Clinical Infectious Diseases 2014, 59, 216–222. [Google Scholar] [CrossRef] [PubMed]
- Abt, M.C.; McKenney, P.T.; Pamer, E.G. Clostridium Difficile Colitis: Pathogenesis and Host Defence. Nat Rev Microbiol 2016, 14, 609–620. [Google Scholar] [CrossRef]
- Francis, M.B.; Allen, C.A.; Shrestha, R.; Sorg, J.A. Bile Acid Recognition by the Clostridium Difficile Germinant Receptor, CspC, Is Important for Establishing Infection. PLoS Pathog 2013, 9. [Google Scholar] [CrossRef]
- Ross, C.L.; Spinler, J.K.; Savidge, T.C. Structural and Functional Changes within the Gut Microbiota and Susceptibility to Clostridium Difficile Infection. Anaerobe 2016, 41, 37–43. [Google Scholar] [CrossRef]
- Thanissery, R.; Winston, J.A.; Theriot, C.M. Inhibition of Spore Germination, Growth, and Toxin Activity of Clinically Relevant C. Difficile Strains by Gut Microbiota Derived Secondary Bile Acids. Anaerobe 2017, 45, 86–100. [Google Scholar] [CrossRef] [PubMed]
- Theriot, C.M.; Young, V.B. Microbial and Metabolic Interactions between the Gastrointestinal Tract and Clostridium Difficile Infection. Gut Microbes 2013, 5, 86–95. [Google Scholar] [CrossRef] [PubMed]
- Palmieri, L.-J.; Rainteau, D.; Sokol, H.; Beaugerie, L.; Dior, M.; Coffin, B.; Humbert, L.; Eguether, T.; Bado, A.; Hoys, S.; et al. Inhibitory Effect of Ursodeoxycholic Acid on Clostridium Difficilegermination Is Insufficient to Prevent Colitis: A Study in Hamsters and Humans. Front Microbiol 2018, 9. [Google Scholar] [CrossRef] [PubMed]
- Brown, J.R.-M.; Flemer, B.; Joyce, S.A.; Zulquernain, A.; Sheehan, D.; Shanahan, F.; O’Toole, P.W. Changes in Microbiota Composition, Bile and Fatty Acid Metabolism, in Successful Faecal Microbiota Transplantation for Clostridioides Difficile Infection. BMC Gastroenterol 2018, 18. [Google Scholar] [CrossRef]
- Rolfe, R.D. Role of Volatile Fatty Acids in Colonization Resistance to Clostridium Difficile. Infect Immun 1984, 45, 185–191. [Google Scholar] [CrossRef]
- Ferreyra, J.A.; Wu, K.J.; Hryckowian, A.J.; Bouley, D.M.; Weimer, B.C.; Sonnenburg, J.L. Gut Microbiota-Produced Succinate Promotes C. Difficile Infection after Antibiotic Treatment or Motility Disturbance. Cell Host Microbe 2014, 16, 770–777. [Google Scholar] [CrossRef]
- Robinson, J.I.; Weir, W.H.; Crowley, J.R.; Hink, T.; Reske, K.A.; Kwon, J.H.; Burnham, C.-A.D.; Dubberke, E.R.; Mucha, P.J.; Henderson, J.P. Metabolomic Networks Connect Host-Microbiome Processes to Human Clostridioides Difficile Infections. Journal of Clinical Investigation 2019, 129, 3792–3806. [Google Scholar] [CrossRef] [PubMed]
- Zhou, P.; Zhou, N.; Shao, L.; Li, J.; Liu, S.; Meng, X.; Duan, J.; Xiong, X.; Huang, X.; Chen, Y.; et al. Diagnosis of Clostridium Difficile Infection Using an UPLC-MS Based Metabolomics Method. Metabolomics 2018, 14. [Google Scholar] [CrossRef] [PubMed]
- Patel, M.; Fowler, D.; Sizer, J.; Walton, C. Faecal Volatile Biomarkers of Clostridium Difficile Infection. PLoS One 2019, 14. [Google Scholar] [CrossRef]
- Ramos-Garcia, V.; Ten-Doménech, I.; Vento, M.; Bullich-Vilarrubias, C.; Romaní-Pérez, M.; Sanz, Y.; Nobili, A.; Falcone, M.; Di Stefano, M.; Quintás, G.; et al. Fast Profiling of Primary, Secondary, Conjugated, and Sulfated Bile Acids in Human Urine and Murine Feces Samples. Anal Bioanal Chem 2023, 415, 4961–4971. [Google Scholar] [CrossRef]
- 2018.
- Ramos-Garcia, V.; Ten-Doménech, I.; Moreno-Giménez, A.; Campos-Berga, L.; Parra-Llorca, A.; Solaz-García, Á.; Lara-Cantón, I.; Pinilla-Gonzalez, A.; Gormaz, M.; Vento, M.; et al. GC-MS Analysis of Short Chain Fatty Acids and Branched Chain Amino Acids in Urine and Faeces Samples from Newborns and Lactating Mothers. Clinica Chimica Acta 2022, 532, 172–180. [Google Scholar] [CrossRef]
- Seekatz, A.M.; Rao, K.; Santhosh, K.; Young, V.B. Dynamics of the Fecal Microbiome in Patients with Recurrent and Nonrecurrent Clostridium Difficile Infection. Genome Med 2016, 8. [Google Scholar] [CrossRef] [PubMed]
- Dawkins, J.J.; Allegretti, J.R.; Gibson, T.E.; McClure, E.; Delaney, M.; Bry, L.; Gerber, G.K. Gut Metabolites Predict Clostridioides Difficile Recurrence. Microbiome 2022, 10, 1–18. [Google Scholar] [CrossRef]
- Khanna, S.; Montassier, E.; Schmidt, B.; Patel, R.; Knights, D.; Pardi, D.S.; Kashyap, P.C. Gut Microbiome Predictors of Treatment Response and Recurrence in Primary Clostridium Difficile Infection. Aliment Pharmacol Ther 2016, 44, 715–727. [Google Scholar] [CrossRef]
- Guh, A.Y.; Mu, Y.; Winston, L.G.; Johnston, H.; Olson, D.; Farley, M.M.; Wilson, L.E.; Holzbauer, S.M.; Phipps, E.C.; Dumyati, G.K.; et al. Trends in U.S. Burden of Clostridioides Difficile Infection and Outcomes. New England Journal of Medicine 2020, 382, 1320–1330. [Google Scholar] [CrossRef]
- Bosnjak, M.; Karpe, A. V.; Van, T.T.H.; Kotsanas, D.; Jenkin, G.A.; Costello, S.P.; Johanesen, P.; Moore, R.J.; Beale, D.J.; Srikhanta, Y.N.; et al. Multi-Omics Analysis of Hospital-Acquired Diarrhoeal Patients Reveals Biomarkers of Enterococcal Proliferation and Clostridioides Difficile Infection. Nature Communications 2023 14:1 2023, 14, 1–16. [Google Scholar] [CrossRef]
- Theriot, C.M.; Bowman, A.A.; Young, V.B. Antibiotic-Induced Alterations of the Gut Microbiota Alter Secondary Bile Acid Production and Allow for Clostridium Difficile Spore Germination and Outgrowth in the Large Intestine. mSphere 2016, 1. [Google Scholar] [CrossRef]
- Neumann-Schaal, M.; Hofmann, J.D.; Will, S.E.; Schomburg, D. Time-Resolved Amino Acid Uptake of Clostridium Difficile 630Δerm and Concomitant Fermentation Product and Toxin Formation. BMC Microbiol 2015, 15. [Google Scholar] [CrossRef] [PubMed]
- Seekatz, A.M.; Theriot, C.M.; Rao, K.; Chang, Y.-M.; Freeman, A.E.; Kao, J.Y.; Young, V.B. Restoration of Short Chain Fatty Acid and Bile Acid Metabolism Following Fecal Microbiota Transplantation in Patients with Recurrent Clostridium Difficile Infection. Anaerobe 2018, 53, 64–73. [Google Scholar] [CrossRef] [PubMed]
- Weingarden, A.R.; Chen, C.; Bobr, A.; Yao, D.; Lu, Y.; Nelson, V.M.; Sadowsky, M.J.; Khoruts, A. Microbiota Transplantation Restores Normal Fecal Bile Acid Composition in Recurrent Clostridium Difficile Infection. Am J Physiol Gastrointest Liver Physiol 2014, 306. [Google Scholar] [CrossRef]
- Hurley, B.W.; Nguyen, C.C. The Spectrum of Pseudomembranous Enterocolitis and Antibiotic-Associated Diarrhea. Arch Intern Med 2002, 162, 2177–2184. [Google Scholar] [CrossRef] [PubMed]
Figure 1.
Study flow-chart for sample selection and analysis.
Figure 2.
PLS-DA with three groups: CDI (IR), C. difficile colonized (C) and controls (X). (A) Scores plot showing separation of fecal metabolomic profiles among patients with CDI (IR, green), colonized (C, red), and non-colonized controls (X, blue). Each dot represents an individual sample, and ellipses indicate the 95% confidence interval for each group. (B) Variable loadings plot corresponding to Component 1 of the PLS-DA model, highlighting the top metabolites contributing to class separation. Metabolites such as isovalerate, propionate and AABA showed high discriminative power.
Figure 3.
(A) Boxplots showing the distribution of isovaleric acid, propionic acid, AABA, and isobutyric acid concentrations across study groups. These metabolites exhibited the most marked differences between groups, with higher levels generally observed in infection states, particularly recurrent cases. (B) Heatmap of selected fecal metabolites across the four study groups. Metabolite intensities were autoscaled prior to visualization. The panel highlights distinct group-level differences, including elevated levels of SCFAs and amino acid derivatives in infected patients (I+R), and reduced concentrations of secondary bile acids particularly in recurrent CDI (R). Rows represent metabolites and columns mean concentration for each group; color scale denotes relative abundance (red: higher, blue: lower).
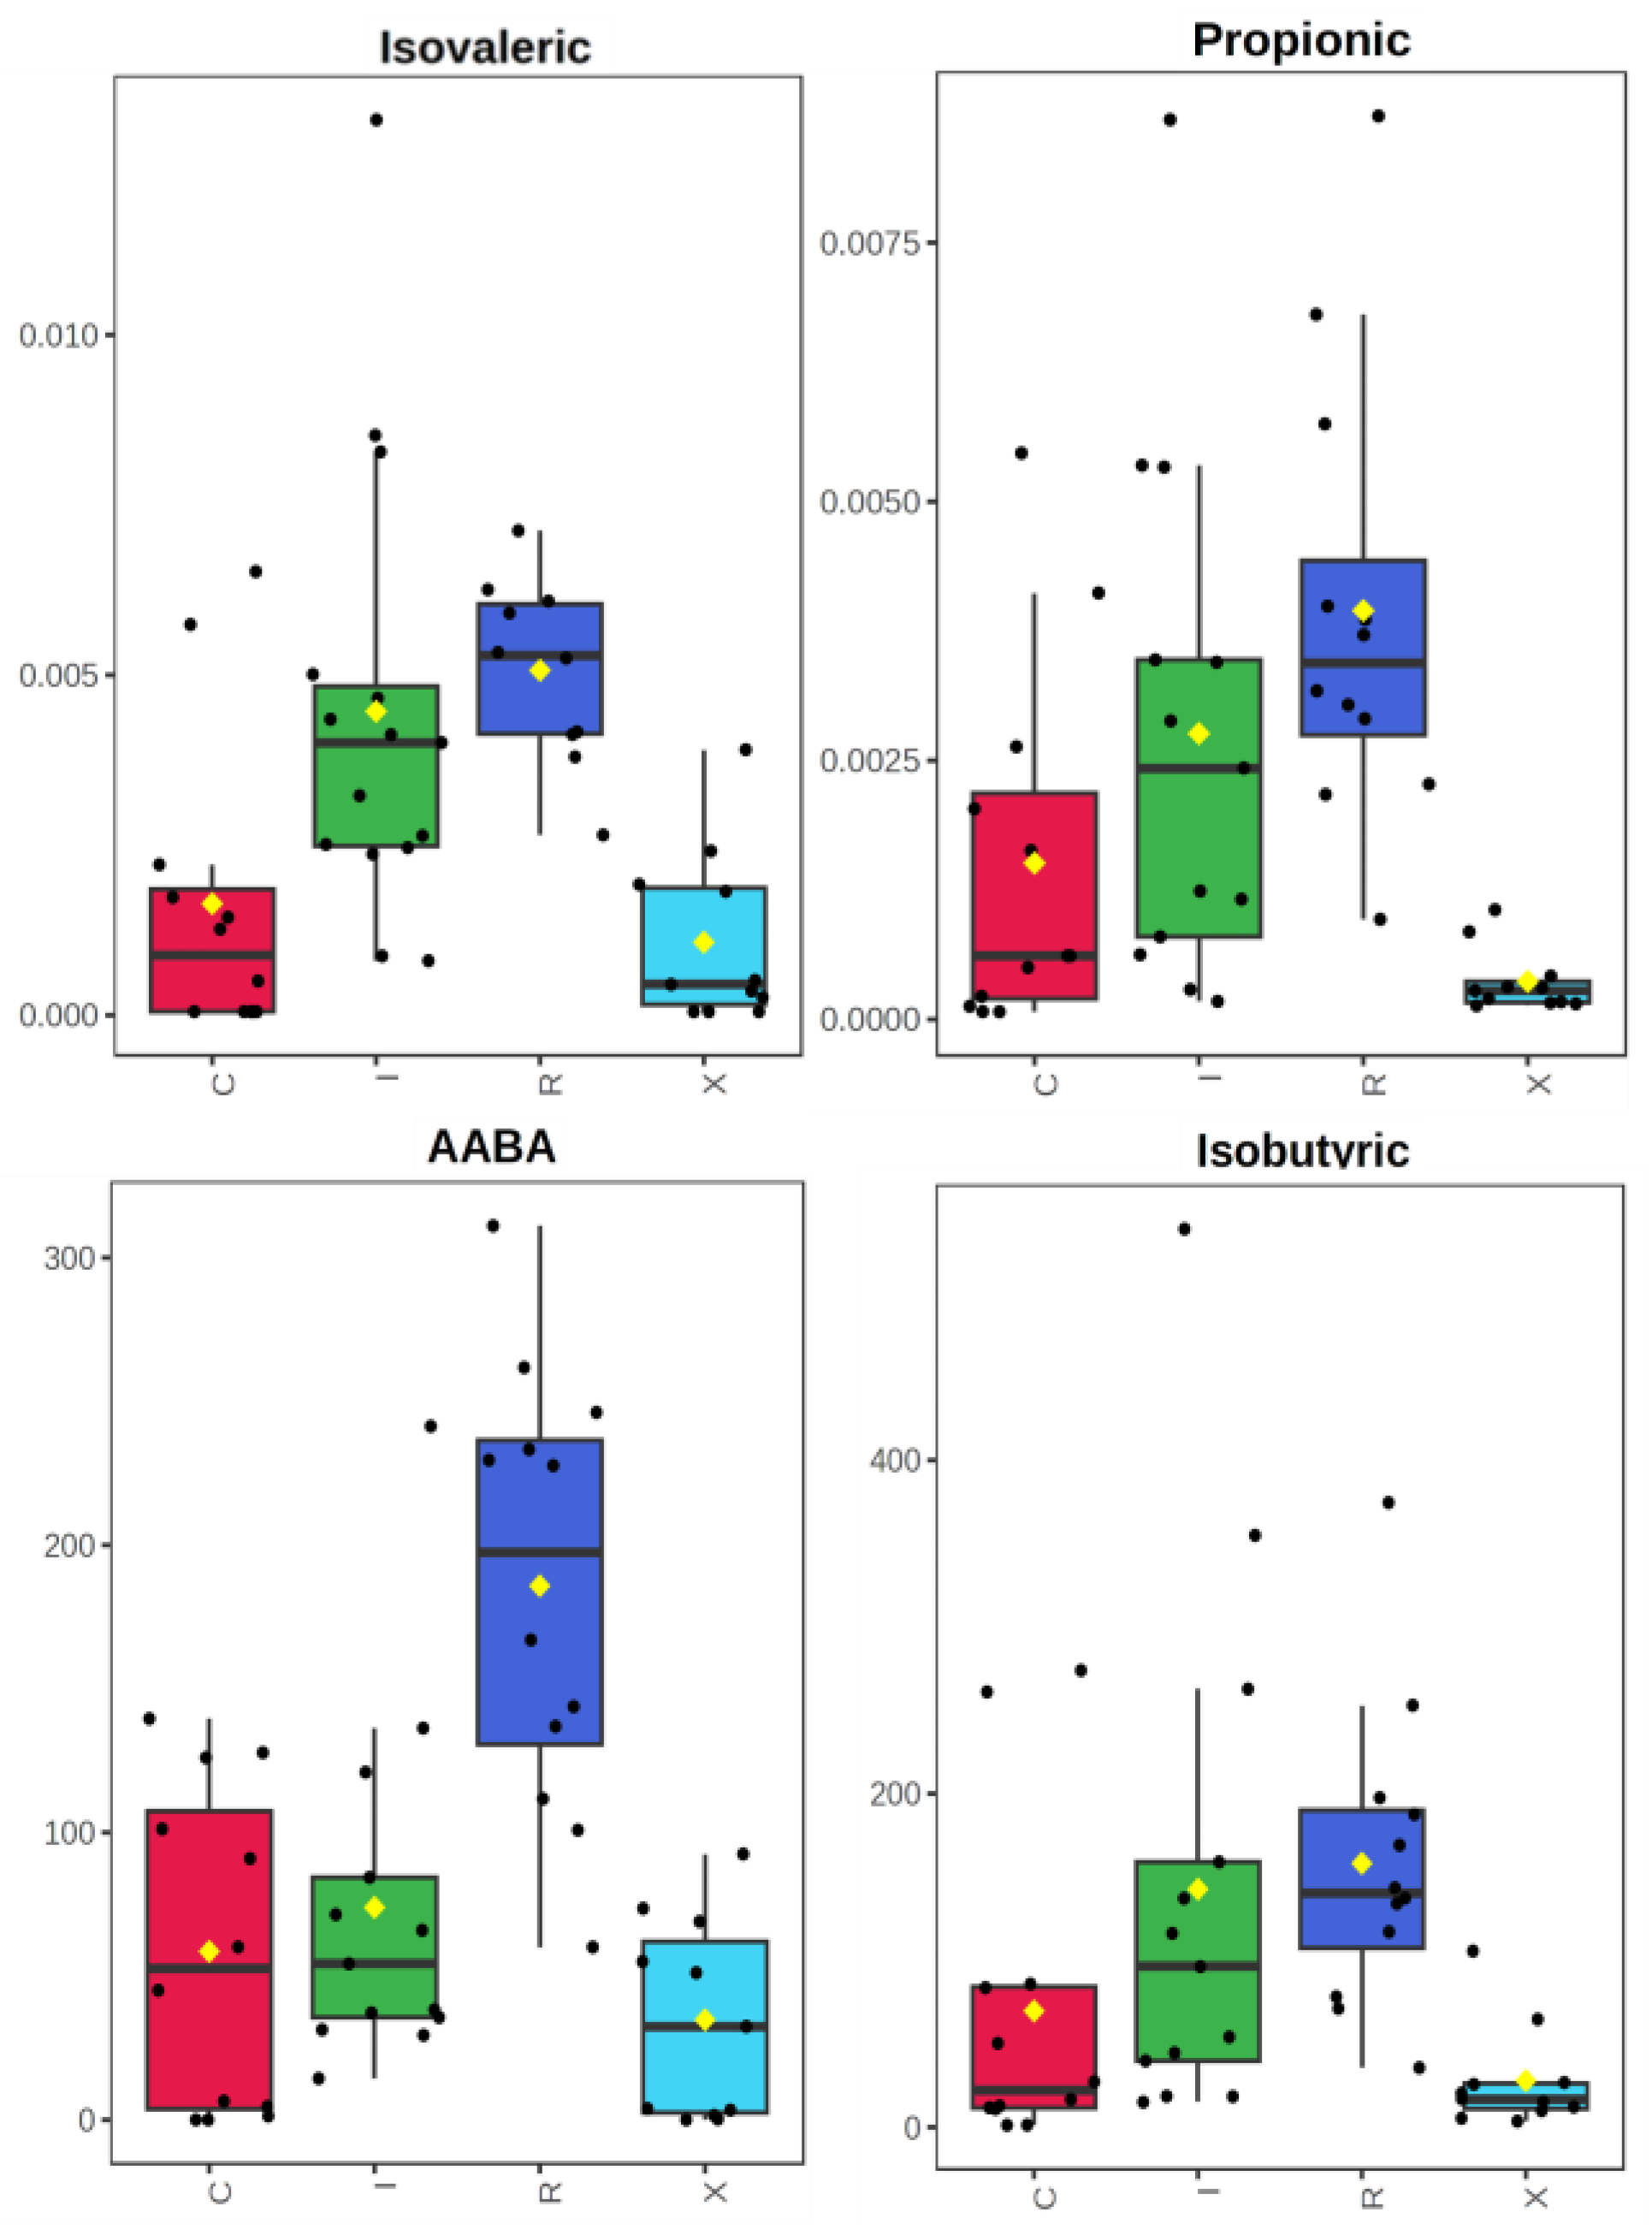
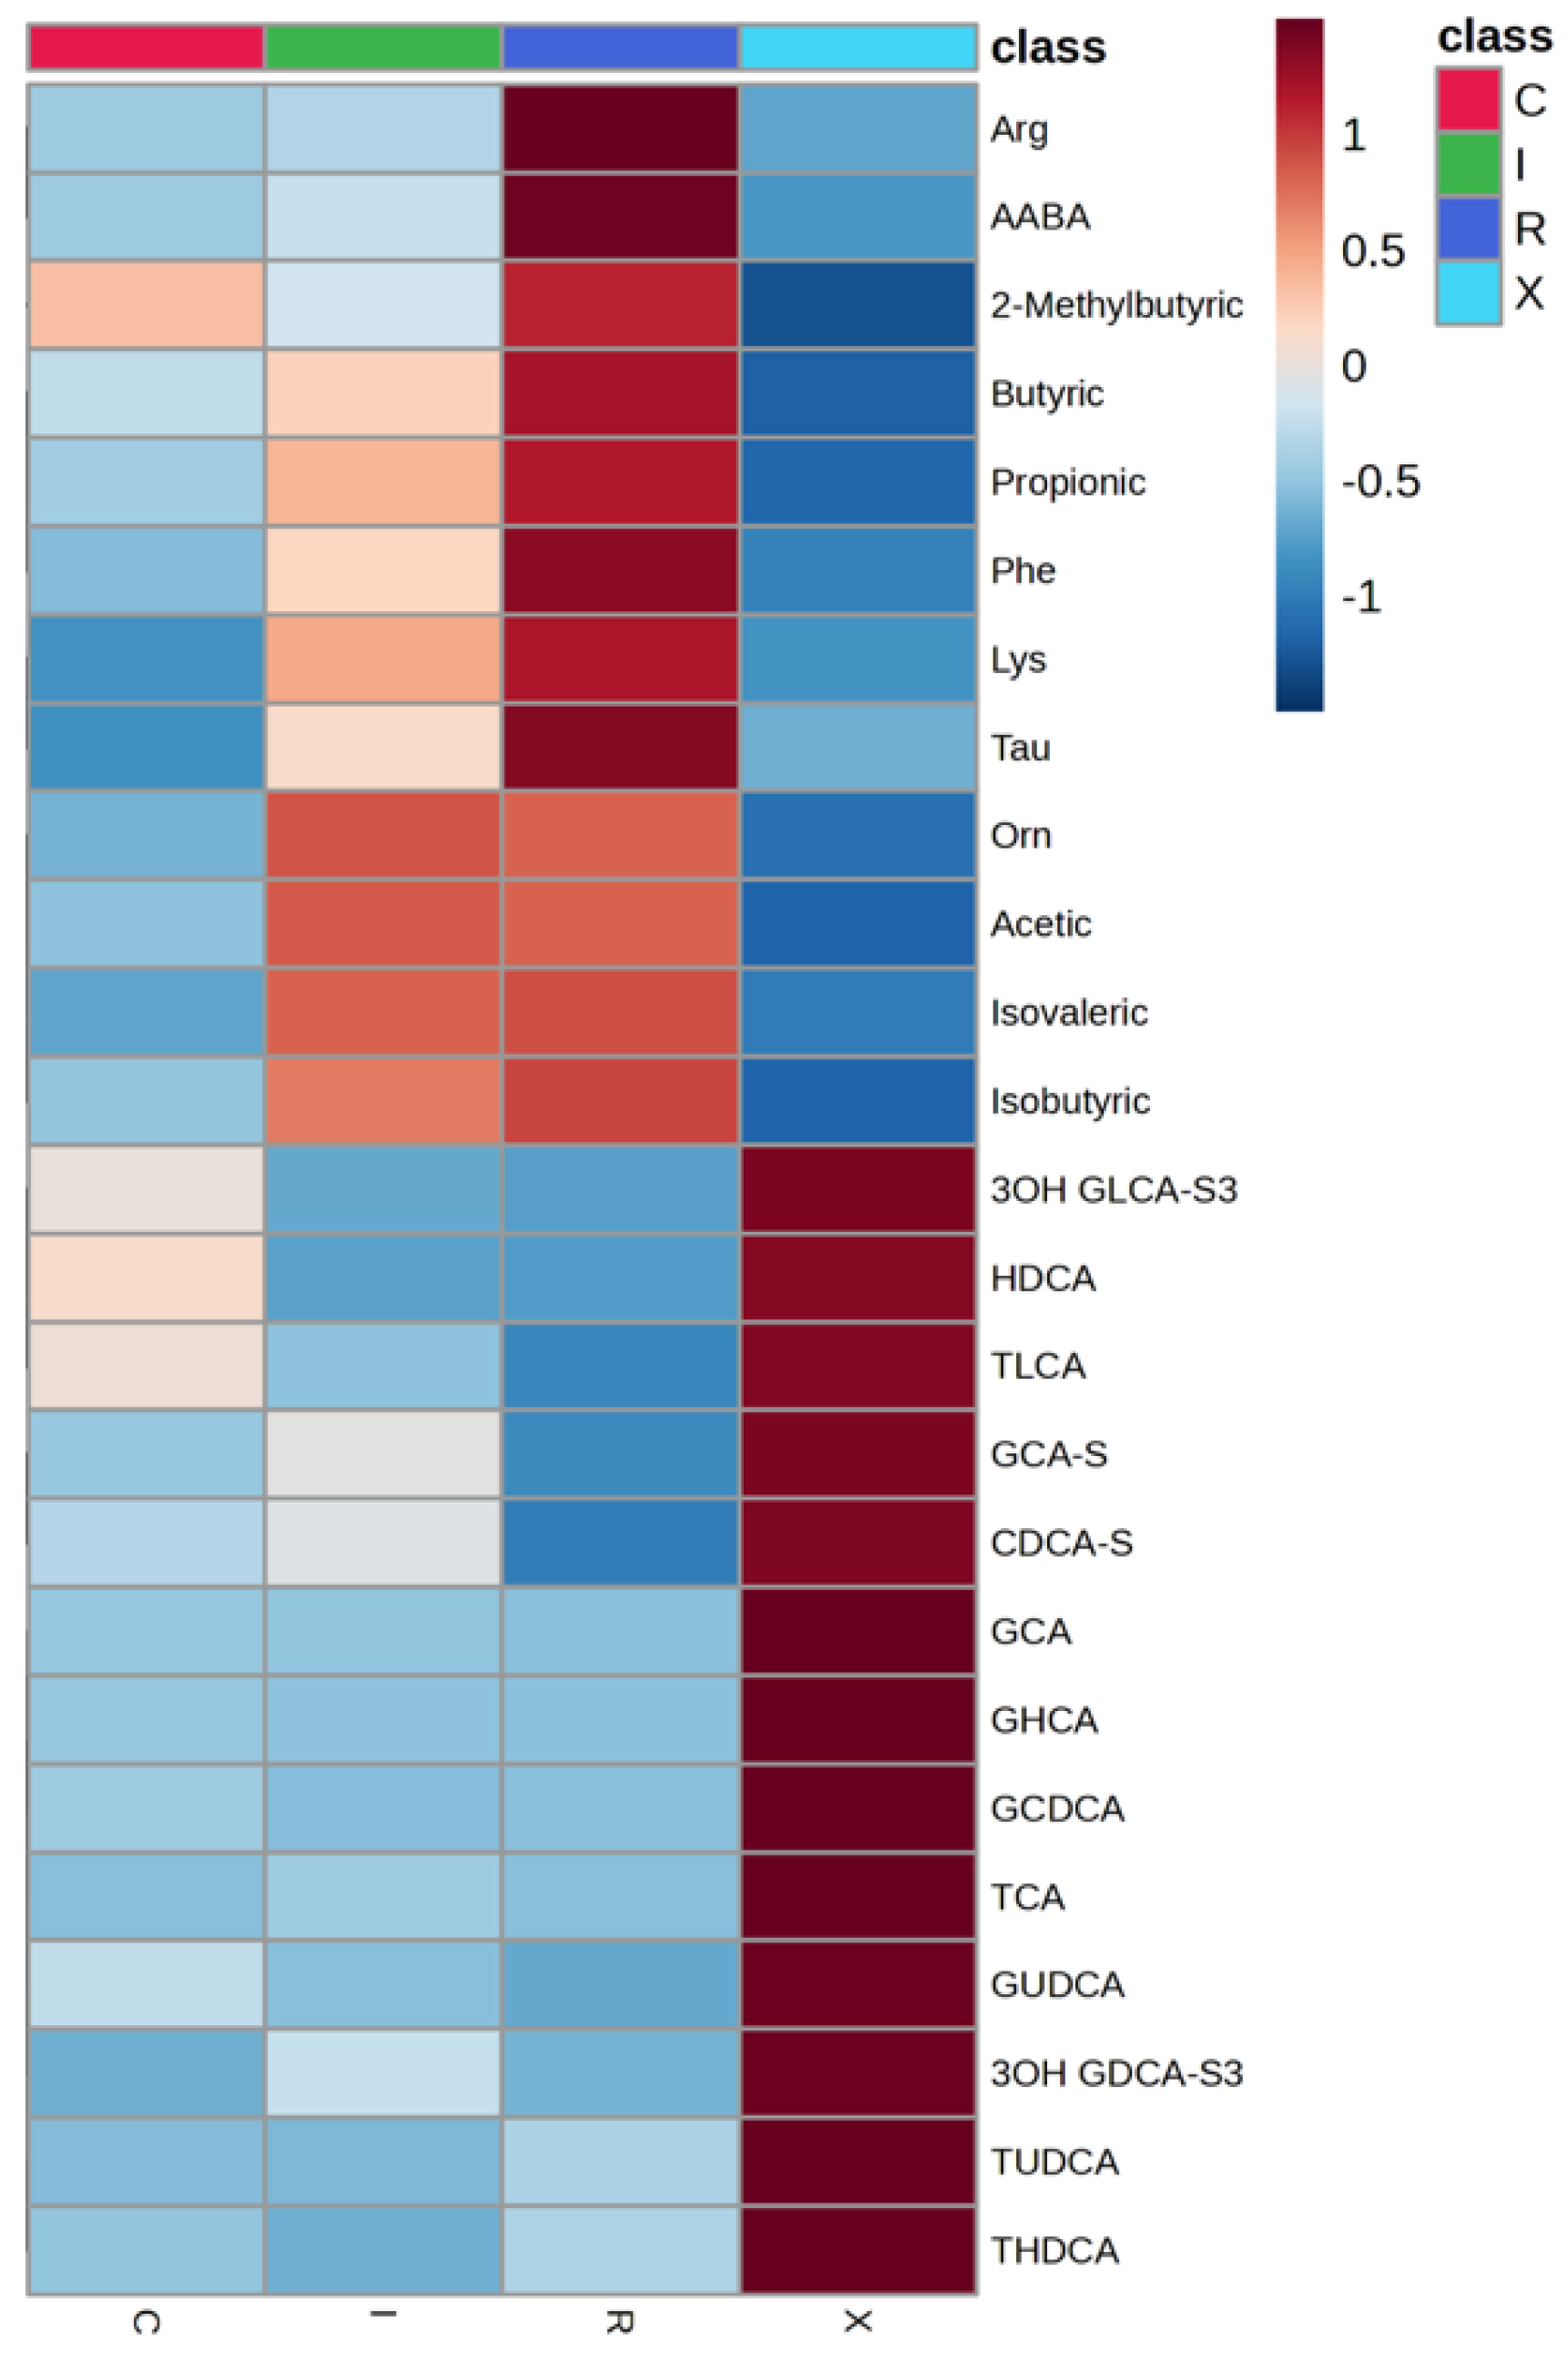
Figure 4.
ROC curve showing the diagnostic performance of the AAA/propionate ratio for distinguishing CDI from non-infected individuals (colonized and controls). The analysis was performed using MCCV with 100 iterations.
Figure 4.
ROC curve showing the diagnostic performance of the AAA/propionate ratio for distinguishing CDI from non-infected individuals (colonized and controls). The analysis was performed using MCCV with 100 iterations.
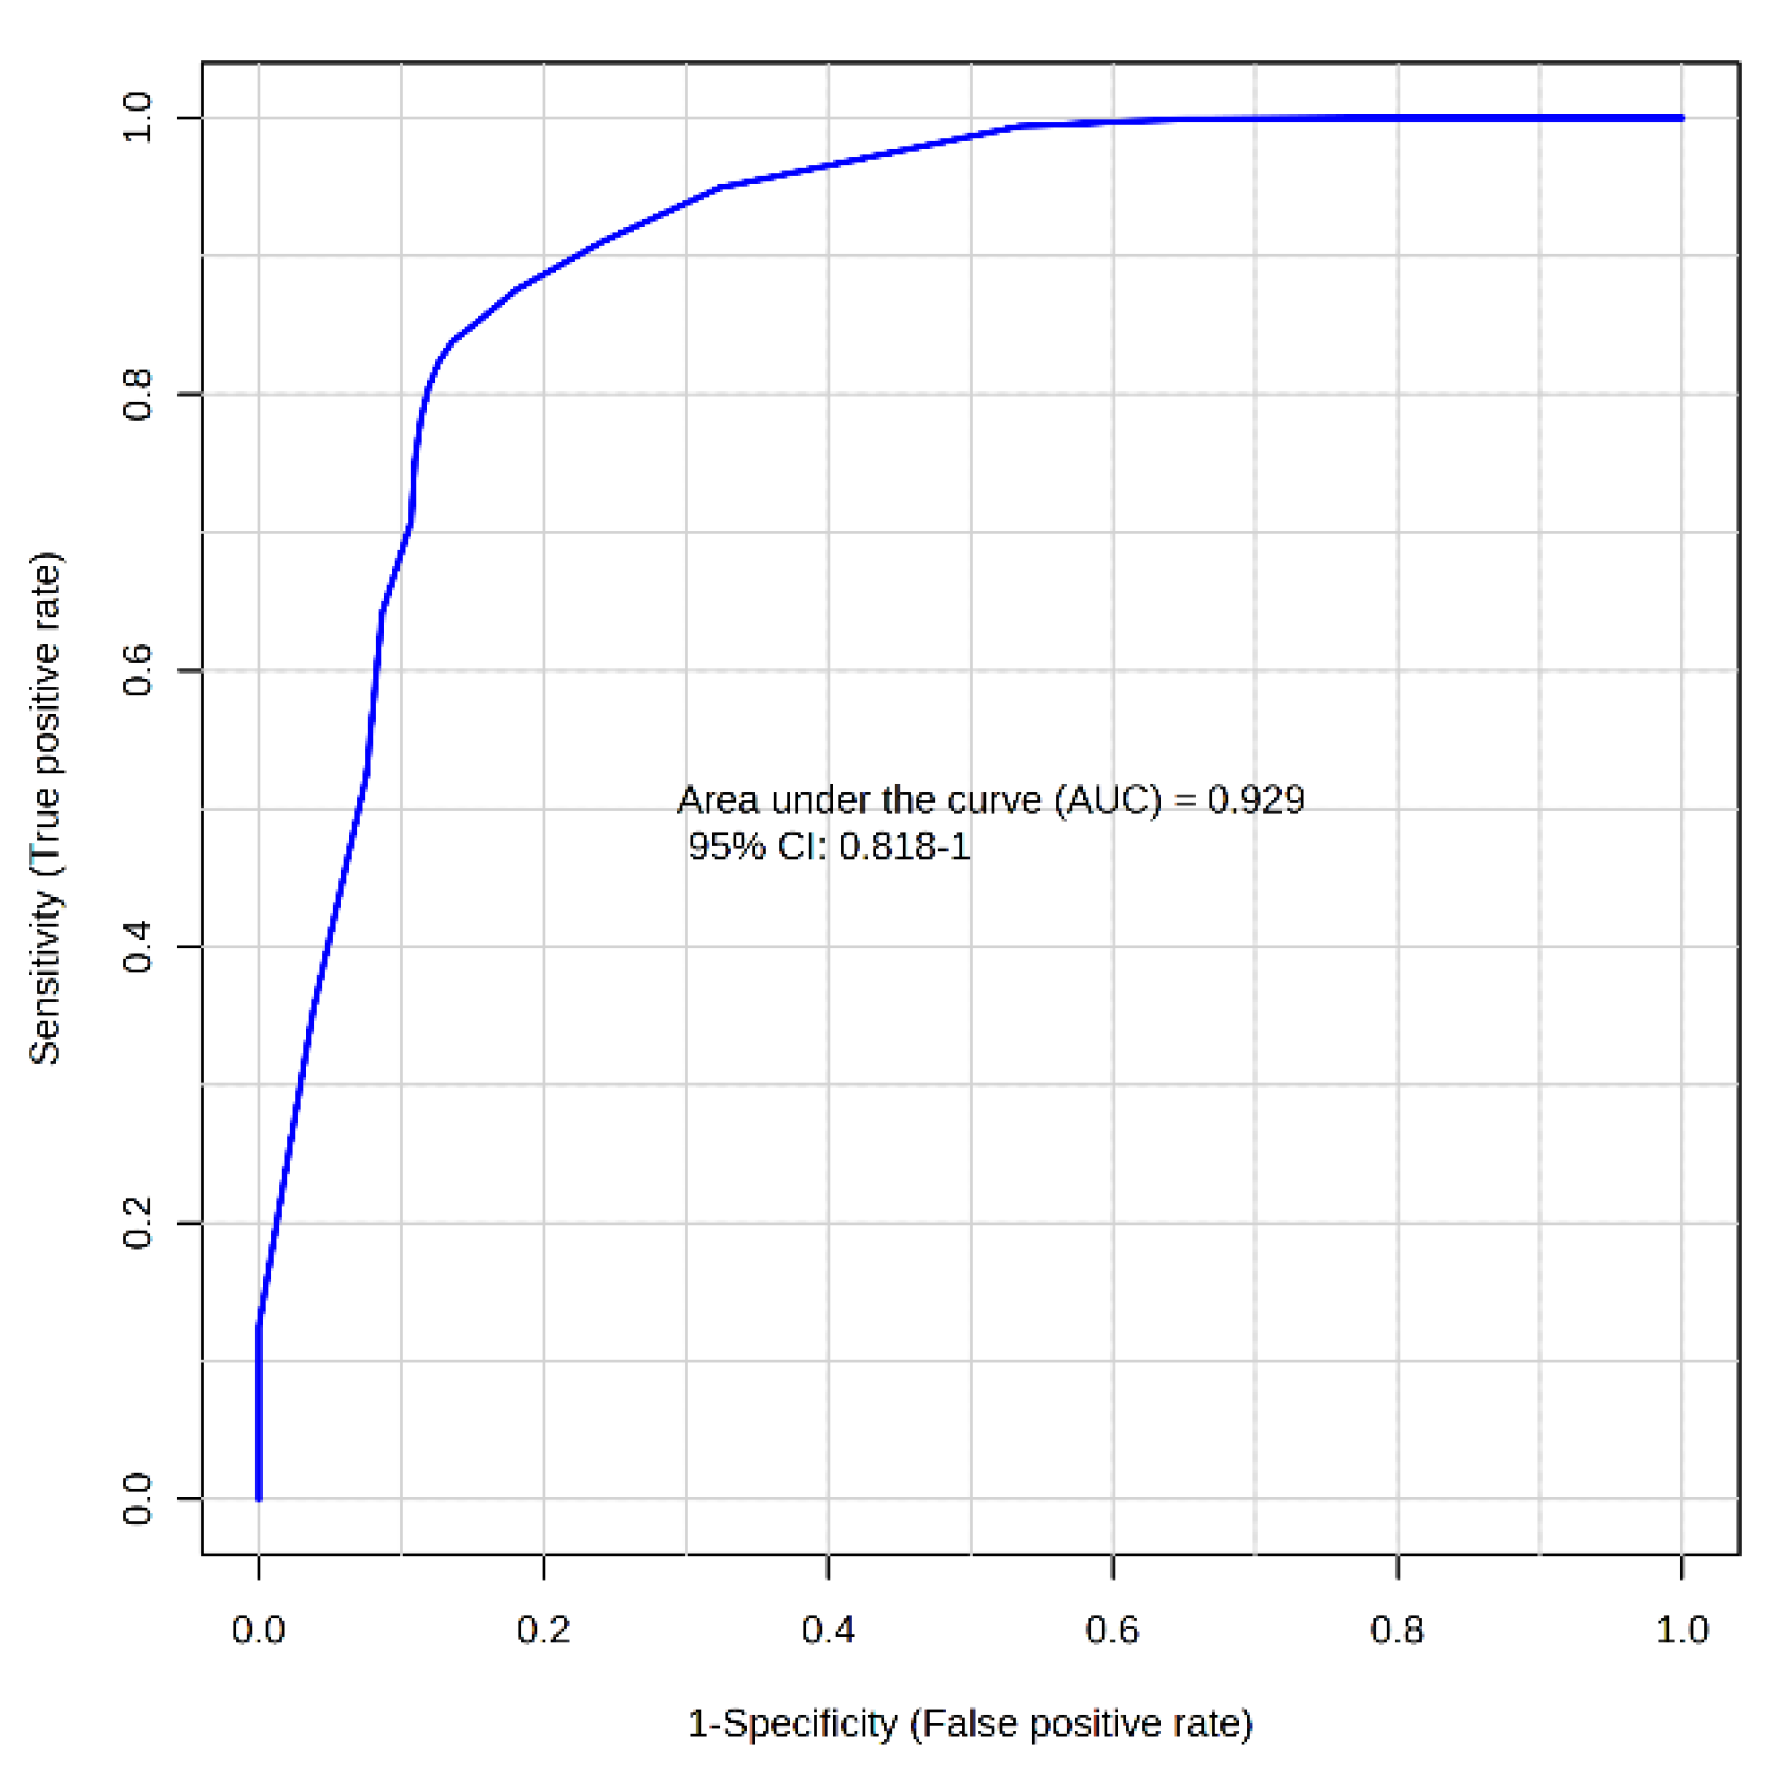
Table 1.
Epidemiological characteristics and comorbidities.
| Infection n=25 |
Colonization n=12 |
Control n=11 |
p-value | ||
|---|---|---|---|---|---|
| Female sex | 13 (52%) | 7 (58.3%) | 3 (27.3%) | 0.266 | |
| Neoplasia | Located | 3 (12.0%) | 0 (0.0%) | 1 (9.1%) | 0.560 |
| Metastatic | 6 (24.0%) | 4 (33.3%) | 2 (18.2%) | ||
| Leukemia | 1 (4.0%) | 2 (16.7%) | 1 (9.1%) | 0.444 | |
| Lymphoma | 2 (8.0%) | 2 (16.7%) | 1 (9.1%) | 0.732 | |
| Liver | Mild to moderate | 2 (8.0%) | 2 (16.7%) | 0 (0.0%) | 0.392 |
| Severe/cirrhosis | 1 (4.0%) | 0 (0.0%) | 0 (0.0%) | ||
| Moderate-severe CKD | 8 (32.0%) | 0 (0.0%) | 2 (18.2%) | 0.025 | |
| Hemodialysis | 1 (4.0%) | 0 (0.0%) | 1 (9.1%) | 0.466 | |
| IBD | 1 (4.0%) | 0 (0.0%) | 2 (18.2%) | 0.164 | |
| Diabetes mellitus |
No TO damage | 1 (4.0%) | 1 (8.3%) | 4 (36.4%) | 0.024 |
| With TO damage | 4 (16.0%) | 0 (0.0%) | 0 (0.0%) | ||
| Dementia | 2 (8.0%) | 1 (8.3%) | 2 (18.2%) | 0.662 | |
| CVD | 1 (4.0%) | 1 (8.3%) | 1 (9.1%) | 0.794 | |
| Heart failure | 10 (40.0%) | 0 (0.0%) | 1 (9.1%) | 0.003 | |
| Ischemic heart disease | 3 (12.0%) | 0 (0.0%) | 1 (9.1%) | 0.288 | |
| Peripheral artery disease | 1 (4.0%) | 0 (0.0%) | 1 (9.1%) | 0.466 | |
| COPD | 1 (4.0%) | 1 (8.3%) | 0 (0.0%) | 0.510 | |
| Connective tissue disease | 1 (4.0%) | 2 (16.7%) | 0 (0.0%) | 0.199 | |
| Peptic ulcer | 2 (8.0%) | 1 (8.3%) | 1 (9.1%) | 0.994 | |
| Immunocompromised | 9 (36.0%) | 5 (41.7%) | 5 (45.5%) | 0.854 | |
| Charlson | ≤5 | 11 (44.0%) | 6 (50.0%) | 7 (63.6%) | 0.552 |
| 6 o+ | 14 (56.0%) | 6 (50.0%) | 5 (36.4%) | ||
CKD, chronic kidney disease; COPD, chronic obstructive pulmonary disease; CVD, cerebrovascular disease; IBD, inflammatory bowel disease; TO, target organ.
Table 2.
Risk factors for CDI among patients included in the study.
| Risk Factor | Infection (n = 25) |
Colonization (n = 12) |
Control (n = 11) |
p-value | |
|---|---|---|---|---|---|
| Previous ATB use | 25 (100%) | 9 (75.0%) | 7 (63.6%) | 0.009 | |
| Number of previous ATB | 0–2 | 14 (56.0%) | 9 (75.0%) | 6 (54.5%) | 0.435 |
| >2 | 11 (44.0%) | 3 (25.0%) | 5 (45.5%) | 0.489 | |
| Type of previous ATB | Quinolones | 12 (48.0%) | 4 (33.3%) | 4 (36.4%) | 0.641 |
| Lincosamides | 1 (4.0%) | 1 (8.3%) | 0 (0.0%) | 0.606 | |
| Cephalosporins | 20 (80.0%) | 6 (50.0%) | 5 (45.5%) | 0.065 | |
| Penicillins | 12 (48.0%) | 3 (25.0%) | 1 (9.1%) | 0.058 | |
| Carbapenems | 2 (8.0%) | 2 (16.7%) | 5 (45.5%) | 0.029 | |
| Oxazolidinones | 3 (12.0%) | 0 (0.0%) | 4 (36.4%) | 0.041 | |
| Duration of previous ATB | ≤10 days | 5 (20.0%) | 11 (91.7%) | 9 (81.8%) | <0.001 |
| >10 days | 20 (80.0%) | 1 (8.3%) | 2 (18.2%) | — | |
| Concomitant ATB use | 11 (44.0%) | 5 (41.7%) | 5 (45.5%) | 0.983 | |
| ONS | 2 (8.0%) | 1 (8.3%) | 5 (45.5%) | 0.026 | |
| Antidepressants | 10 (40.0%) | 7 (58.3%) | 1 (9.1%) | 0.032 | |
| PPI/AntiH2 | 21 (84.0%) | 8 (66.7%) | 8 (72.7%) | 0.467 |
AntiH2, antihistaminics H2; ATB, antibiotic; ONS, oral nutritional supplement; PPI, proton pump inhibitors; WBC, white blood cells.
Table 3.
Clinical characteristics, treatment and evolution.
| Recurrence | Primary infection | Colonization | p-value | ||
|---|---|---|---|---|---|
| Bacterial coinfection | 2 (16.7%) | 2 (15.4%) | 1 (8.3%) | 0.812 | |
| Severe episode (IDSA) | 6 (50.0%) | 7 (53.8%) | - | 0.847 | |
| Zar score | 0-2 | 5 (41.7%) | 9 (69.2%) | - | 0.165 |
| ≥3 | 7 (58.3%) | 4 (30.8%) | - | ||
| ATLAS score | 0-3 | 8 (66.7%) | 4 (30.8%) | - | 0.073 |
| ≥4 | 4 (33.3%) | 9 (69.2%) | - | ||
| GEIH score | 0-2 | 0 (0.0%) | 9 (69.2%) | - | <0.001 |
| ≥3 | 12 (100%) | 4 (30.8%) | - | ||
| Treatment |
Vancomycin | 5 (41.7%) | 6 (46.2%) | 0.821 | |
| Fidaxomycin | 6 (50.0%) | 4 (30.8%) | 0.428 | ||
| Bezlotoxumab | 4 (33.3%) | 0 (0.0%) | 0.039 | ||
| No treatment | 1 (8.3%) | 3 (23.1%) | 0.593 | ||
| 5th day diarrhea | 3 (25.0%) | 2 (15.4%) | - | 0.545 | |
| Colectomy | 0 (0.0%) | 0 (0.0%) | - | - | |
| Ileus | 0 (0.0%) | 0 (0.0%) | - | ||
| Cure | 11 (91.7%) | 11 (84.6%) | - | 0.292 | |
| Posterior recurrence | 5 (41.7%) | 2 (15.4%) | - | 0.035 | |
| Death | 1 (8.3%) | 4 (30.8%) | 2 (16.7%) | 0.285 | |
GEIH, Grupo Español Infección Hospitalaria; IDSA, Infectious Disease Society of America.
Disclaimer/Publisher’s Note: The statements, opinions and data contained in all publications are solely those of the individual author(s) and contributor(s) and not of MDPI and/or the editor(s). MDPI and/or the editor(s) disclaim responsibility for any injury to people or property resulting from any ideas, methods, instructions or products referred to in the content. |
© 2025 by the authors. Licensee MDPI, Basel, Switzerland. This article is an open access article distributed under the terms and conditions of the Creative Commons Attribution (CC BY) license (http://creativecommons.org/licenses/by/4.0/).
Copyright: This open access article is published under a Creative Commons CC BY 4.0 license, which permit the free download, distribution, and reuse, provided that the author and preprint are cited in any reuse.


