
Submitted:
02 May 2024
Posted:
06 May 2024
You are already at the latest version
Abstract
Environmental preservation presents numerous challenges, particularly in capturing carbon di-oxide. Despite multiple studies on this topic, there remains a need for additional capture plants, particularly in the energy sector. The power industry emits flue gas during its post-combustion process, and capturing carbon dioxide from this gas would make power plants more environ-mentally friendly while aiding the preservation of the planet. The work conducted in This study aimed to investigate the gap in knowledge to contribute to the development of a better world without harming it. The identified research gap reveals no established optimal monoethanola-mine (MEA) solvent concentration for the process. A simulation was performed using Aspen Hysys to analyze the absorption efficiency at higher solvent concentrations and address this is-sue. The input data was obtained from a flue gas capture plant in the UK. The results obtained from discrete increments indicate an optimal solid result for an MEA concentration of 36 wt.%. Further analysis of temperature and pressure revealed that other solvents, such as diethanola-mine (DEA) and triethanolamine (TEA), are more stable at higher concentrations and that DEA and TEA at the same concentration as MEA consumed significantly less energy to capture carbon dioxide.
Keywords:
Carbon capture
; monoethanolamine
; energy consumption
; post-combustion
; process simulation
; Aspen Hysys
1. Introduction
Global warming resulting from climate change is one of the significant technical issues facing the world in this century. Considering the temperature, particulate (ash), SOx, and NOx content of the flue gas generated by the power station, our discussion assumes that the flue gas has been pretreated to a solvent-dependent level, as particulate matter clogs, absorber packing, foaming, and pressure drop increase. NOx and SO2 react with amine solvents to form heat-stable salts, which reduce solvent activity. The degree of upstream processing achieved will depend on the site. Commercial solvents place strict demands on SO2, NOx, and particulates. Environmental controls are already mandatory for power plants in Europe, the USA, and Japan, including flue gas desulphurization (FGD) and low NOx burners. With the FGD unit, the temperature and SO2 concentration will be lowered to levels suitable for CO2 capture, however additional treatment (e.g. caustic wash) may be required to reduce SO2 concentrations to levels acceptable for CO2 capture economically[1]. To prevent global warming, one promising option is to capture the CO2 produced from the significant emission sources from various industries such as power plants, cement, and steel industries and transport them via CO2 pipelines/clusters to suitable platforms wherein it is securely stored. One of the robust options used traditionally in capturing CO2 in natural gas processes is using alkanol amines as a solvent, and the same has been applied so far in post-combustion carbon capture processes from flue gas emitted from power plants, the cement industry, etc. A comprehensive review of three different capture technologies was given elsewhere by Kheirinik et al. (2021).
COVID-19 lockdown in 2020 and a co-occurring increase in greenhouse gases (GHGs) and global temperature trends prove that anthropogenic CO2 is essentially to blame for recent global warming. According to studies, coal-fired power plants, in particular, emit the largest amount of greenhouse gases (GHGs), mainly CO2. Hence, a trade-off must be made between energy demand and GHG mitigation to avoid global warming exceeding 3°C by the end of the 21st century[2].
The chemical absorption process using MEA consists of two fundamental stages: a cross-heat exchanger, a reboiler, and a condenser[3].
Figure 1.
Schematic of a typical carbon capture process [4]
Figure 1.
Schematic of a typical carbon capture process [4]
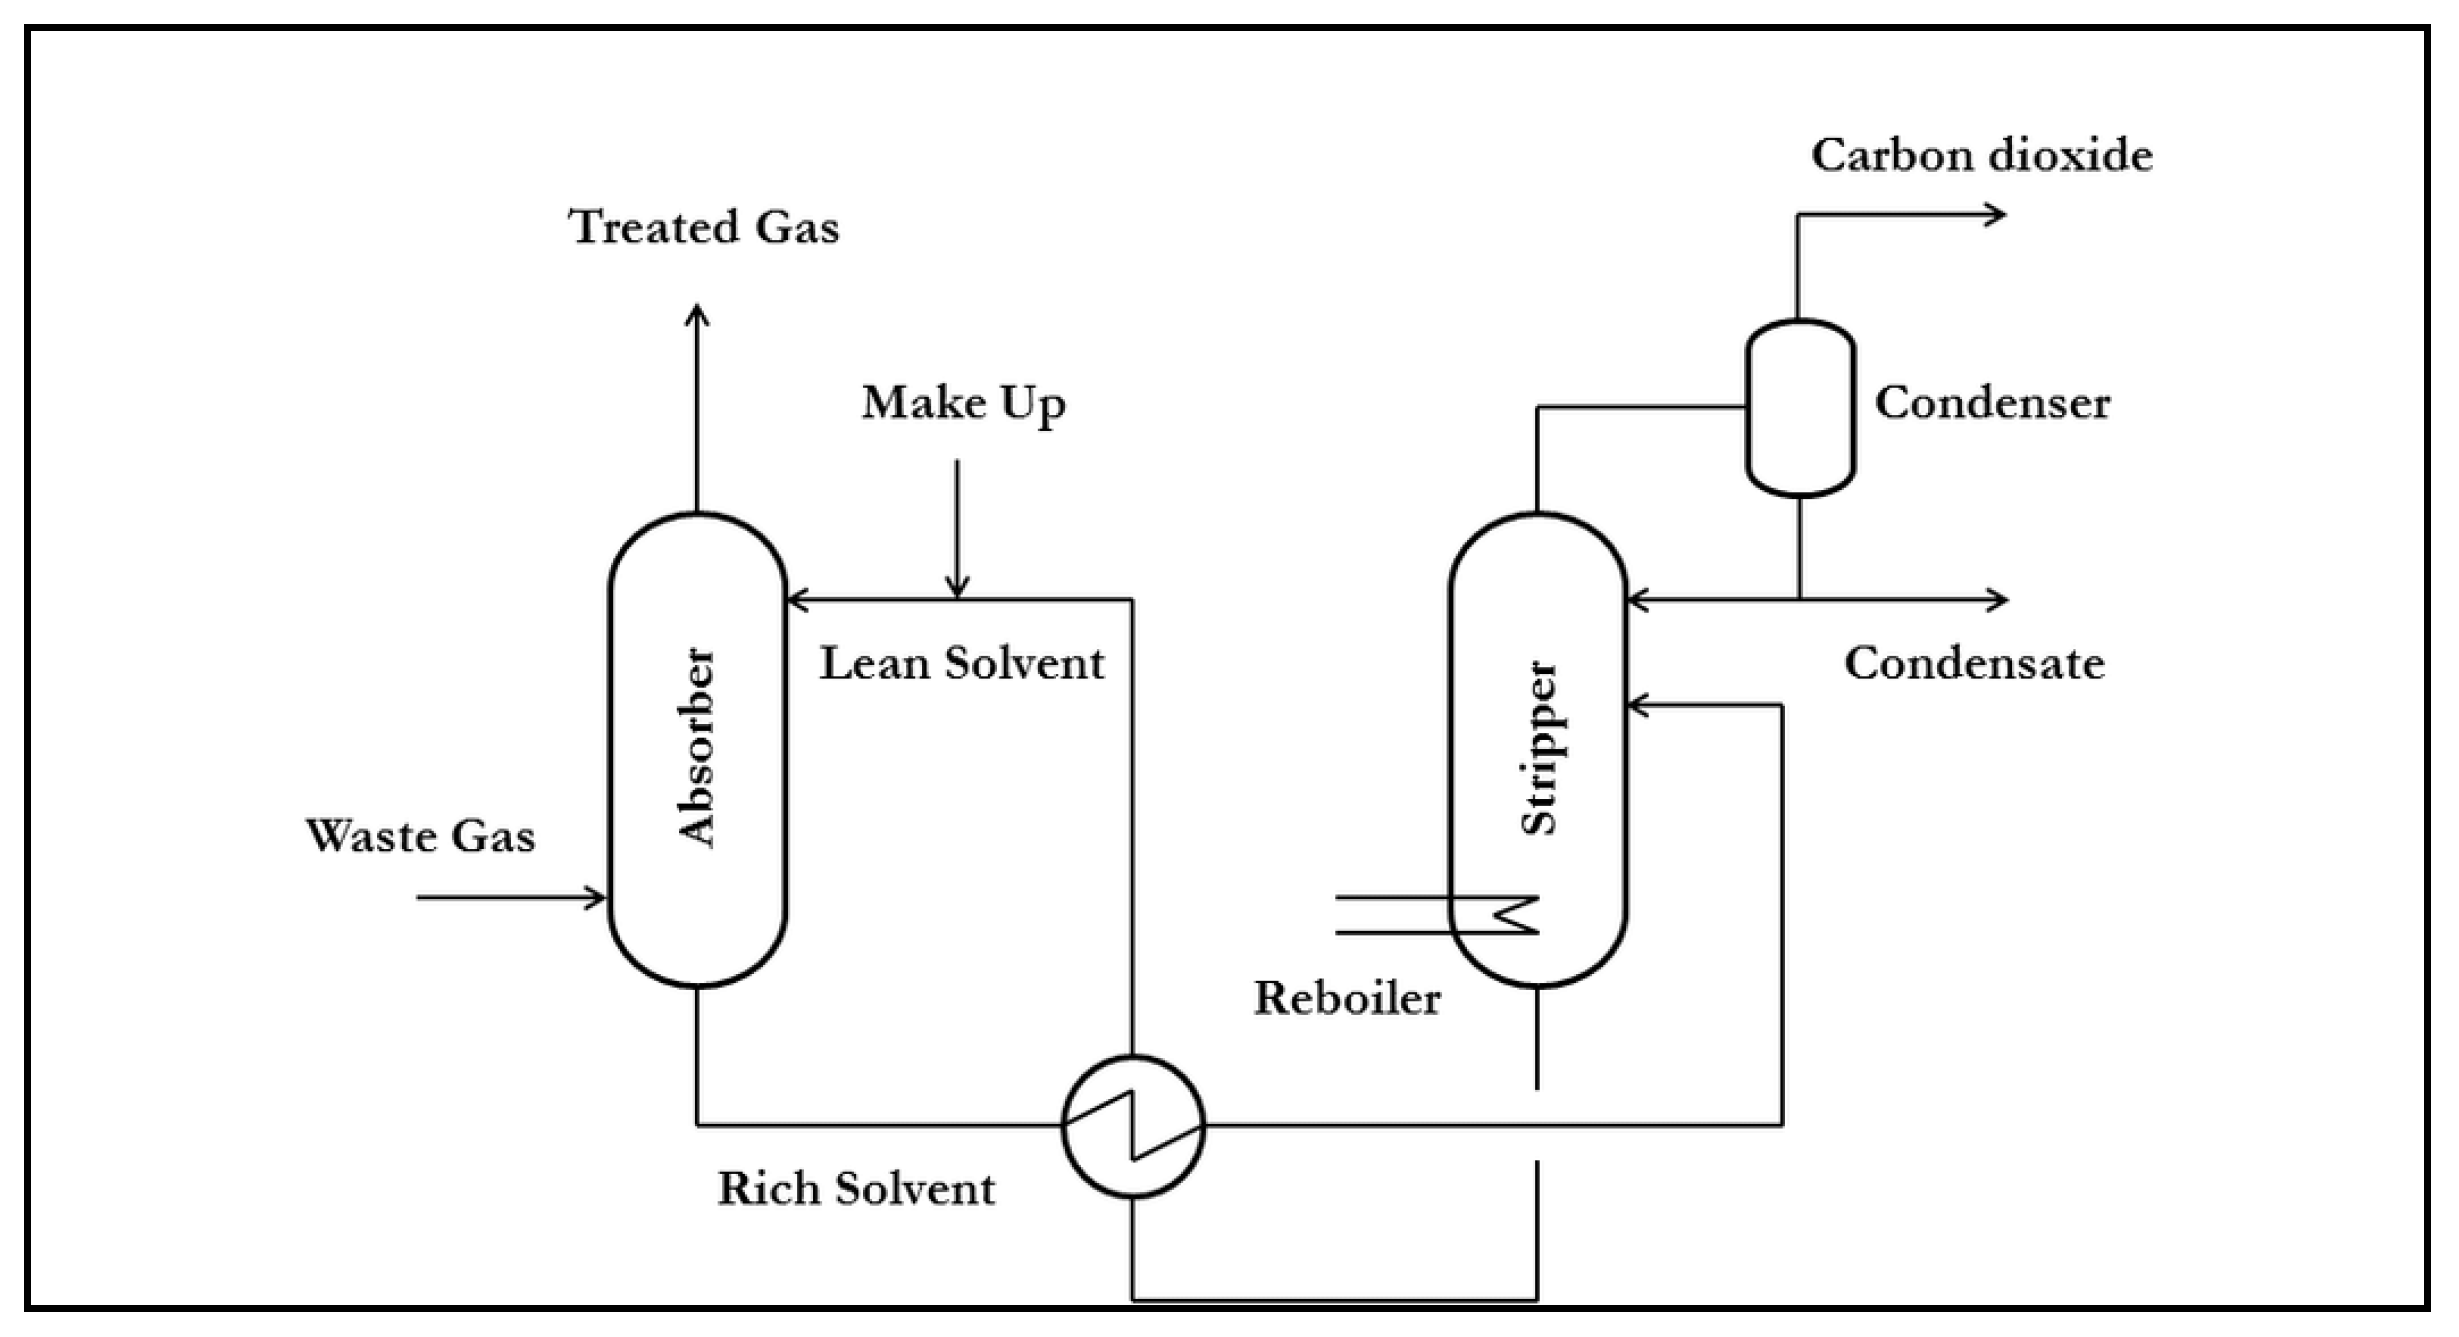
Zhang and Chen [5,6], Delfort et al. [7] and Wang et al. [8] have described various parts of the process and combined their information; the detailed process is given. The MEA, now enriched with CO2, enters a cross-heat exchanger, where the temperature is increased further before entering the stripper at an elevated temperature just above approximately 100 °C. The stripper is heated by a reboiler, which is economically sourced by the power plant's turbines producing the flue gas. A two-version CaO was fabricated under pressurized CO2 at nominal room temperature. The hydroxide formation from these two oxides closed the surface area gap, but the formation of byproduct water limited the further carbonation of Ca(OH)2. The adequate activation energy of decarbonization for CaO sorbent milled with water decreased significantly after 50% sorbent regeneration[9].
As shown in Equation 1-5, this process involves the dissociation of water (equation 1) and bicarbonate (equation 3), the hydrolysis of CO2 (equation 2) and carbamate (equation 3), and the protonation of the solvent MEA, a non-ideal liquid phase. For this reason, the NRTL (active electrolytes) package in Aspen HYSYS accounts for non-ideal liquid phases, as numerical models are necessary for calculating the essential properties of transport Zhang and Chen [5,6], such as;
2𝐻2𝑂 ↔ 𝐻3𝑂+ + 𝑂𝐻-
𝐶𝑂2 + 2𝐻2𝑂 ↔ 𝐻𝐶𝑂3− + 𝐻3𝑂+
𝐻𝐶𝑂3− + 𝐻2𝑂 ↔ 𝐶𝑂3−2 + 𝐻3𝑂+
𝑀𝐸𝐴𝐶𝑂𝑂− + 𝐻2𝑂 ↔ 𝑀𝐸𝐴 + 𝐻𝐶𝑂3−
𝑀𝐸𝐴𝐻+ + 𝐻2𝑂 ↔ 𝑀𝐸𝐴 + 𝐻3𝑂+
Because this reaction is reversible, the reaction kinetics are crucial. Below are the reaction kinetics for CO2 absorption by MEA. Carbamate is formed in equation 6, while the reverse reaction is shown in equation 7 [10]. Bicarbonate is formed in equation 8 and is the forward reaction, while equation 9 is the reverse reaction [11].
𝑀𝐸𝐴 + 𝐶𝑂2 + 𝐻2𝑂 → 𝑀𝐸𝐴𝐶𝑂𝑂− + 𝐻3𝑂+
𝑀𝐸𝐴𝐶𝑂𝑂− + 𝐻3𝑂+ → 𝑀𝐸𝐴 + 𝐶𝑂2 + 𝐻2𝑂
𝐶𝑂2 + 𝑂𝐻− → 𝐻𝐶𝑂−
𝐻𝐶𝑂− → 𝐶𝑂2 + 𝑂𝐻−
In Table 1, kn is the reaction rate constant for reaction 'n', '𝑎𝑗𝑗' is the species' reactivity, and 'kn' is the equilibrium constant (chemical) of the species forming.
Risk assessments are crucial in carbon capture plants as they help identify and mitigate potential hazards from handling and storing substances beyond their limits. By understanding the limitations and properties of solvents like MEA and the risks associated with CO2, operators can implement necessary precautions and procedures to ensure the safety of both personnel and the environment [13].
A reported study used a rotating packed-bed absorption column with the amine solvent MEA and a 40% saturated gaseous mixture feed to match the saturated flue gas. The effect of the mass percentage of the solvent was investigated, and an optimum could be found on additional variables [14].
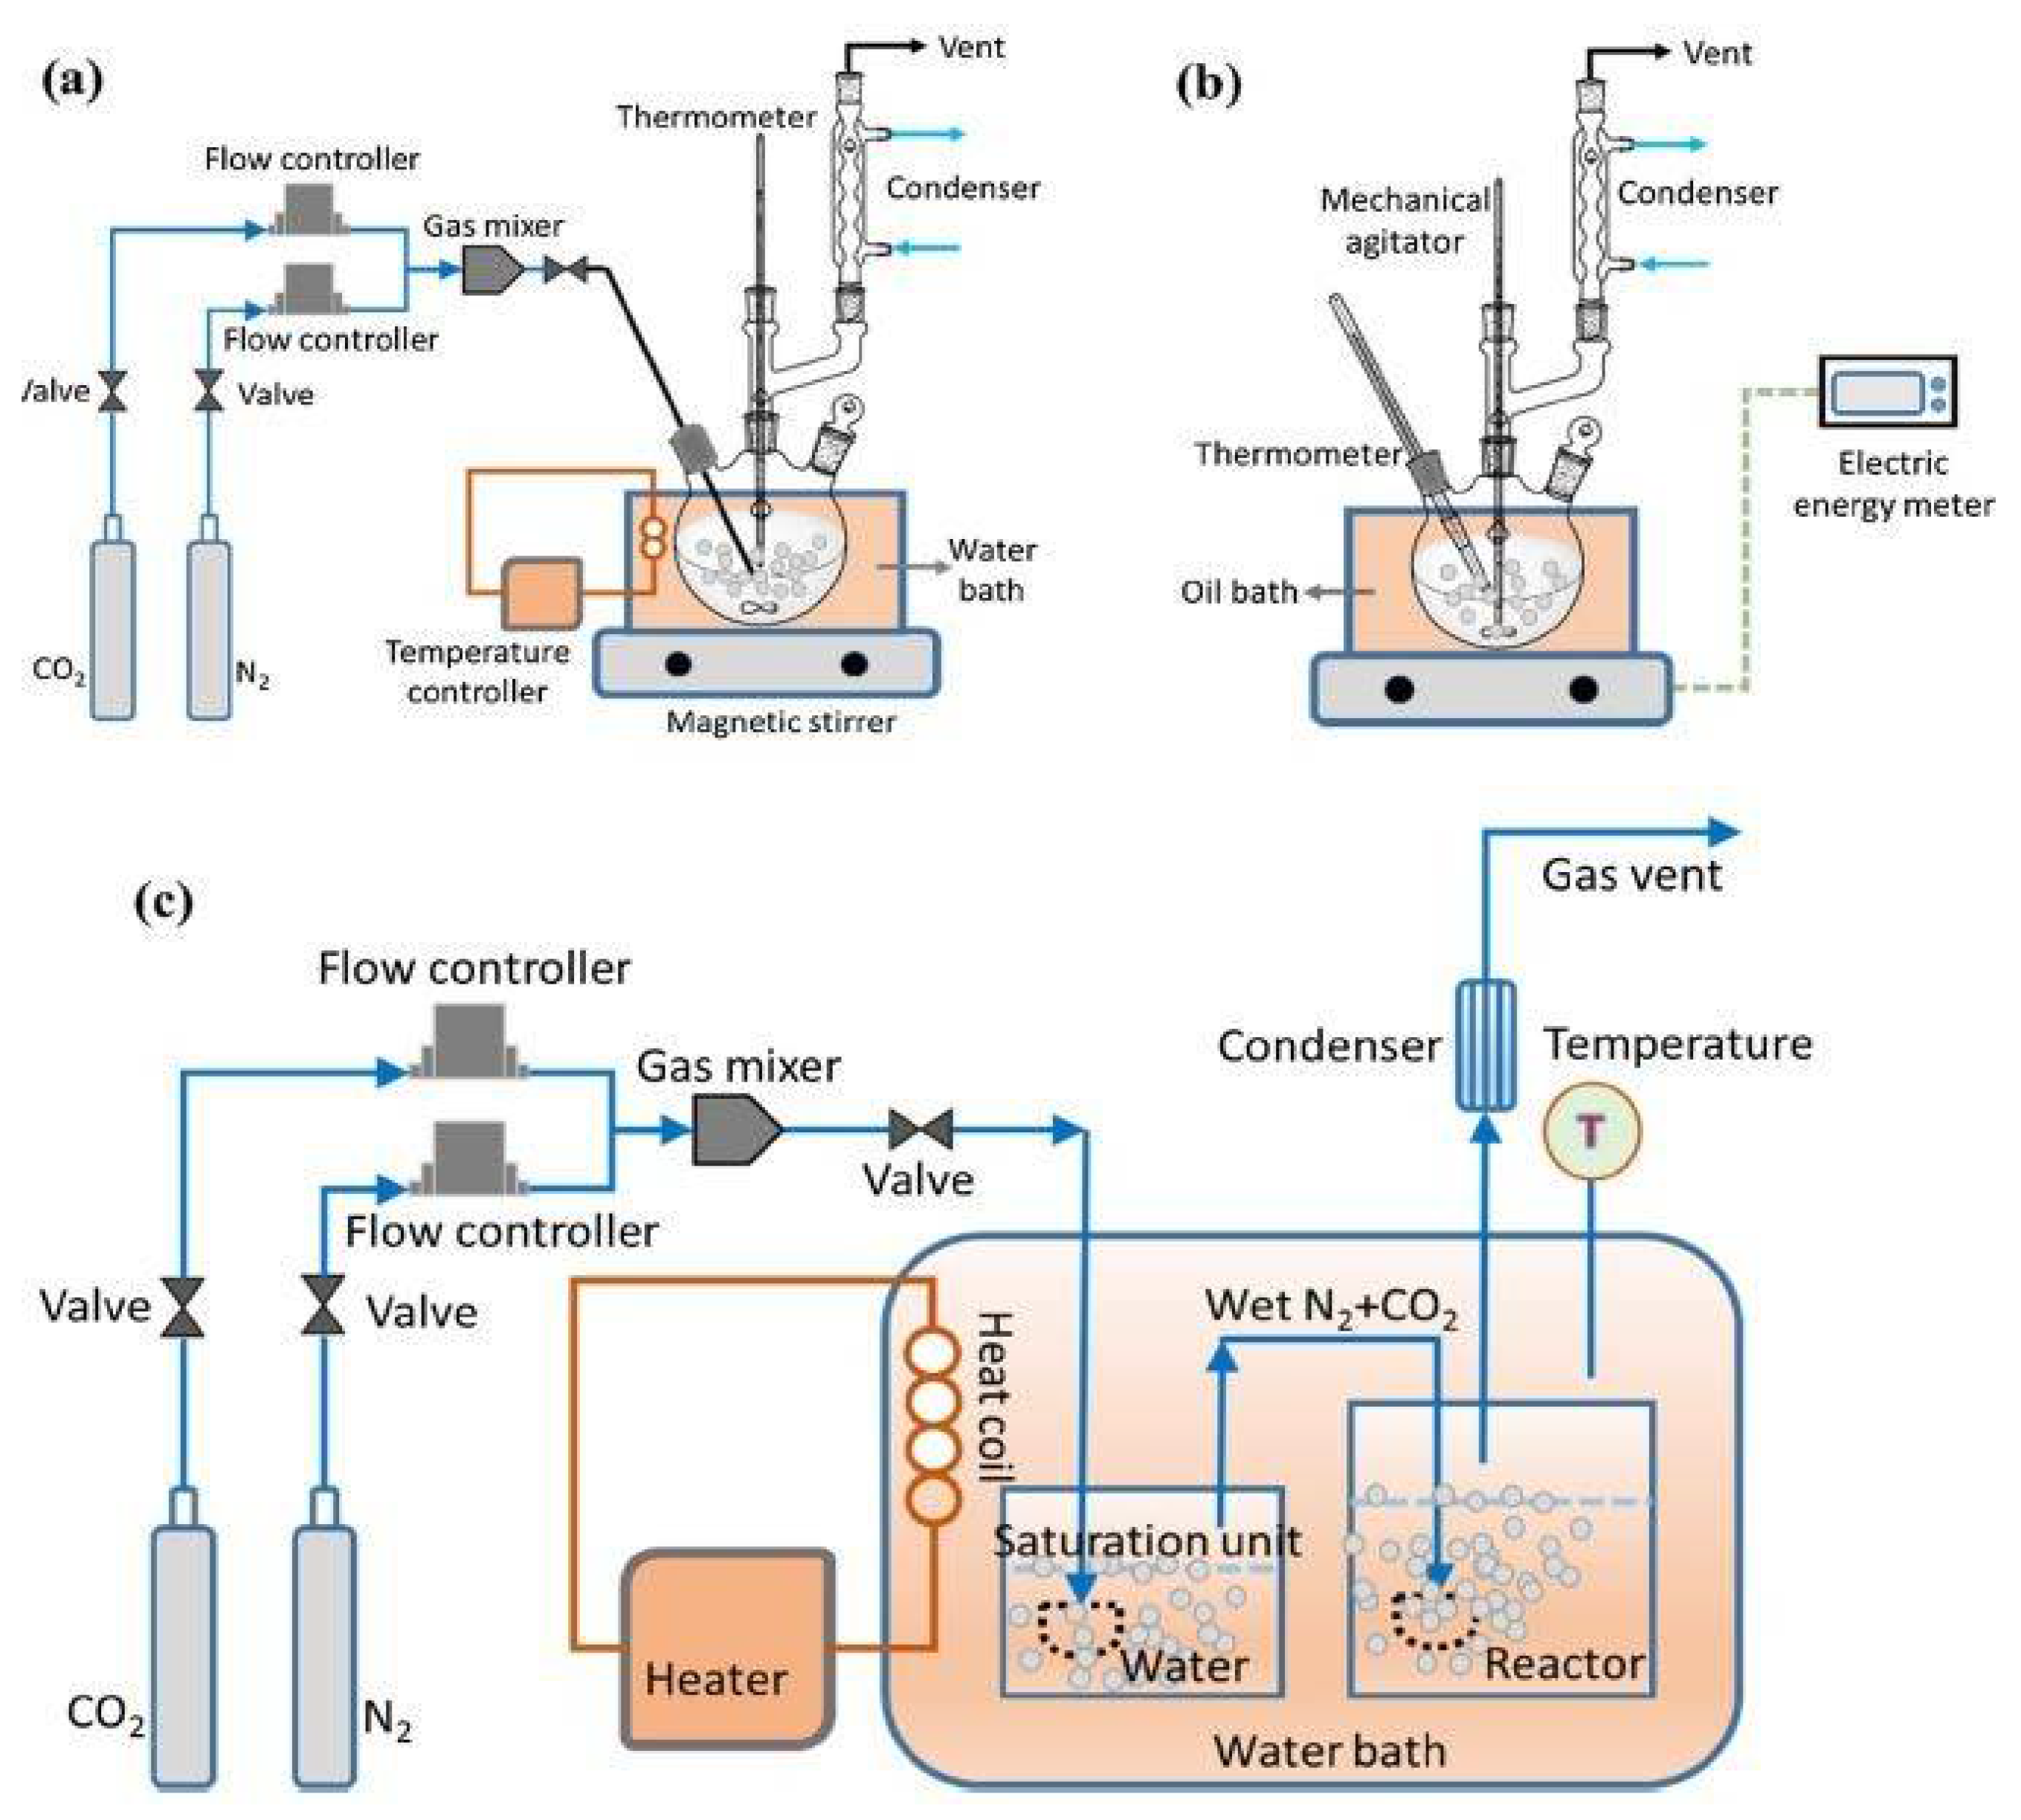
Delfort et al. [7] studied solvent MEA degrading at a 40 wt. % experimentally in a laboratory. They used unconventional inhibitors to reduce the magnitude of MEA oxidation and degradation, investigated other amines that were oxidizing at the same concentration, and validated their efficiencies. Reducing energy cost was investigated by testing various blends of a variety of amines and comparing the resultant data produced by a software called 'Bruker Top Spin 3.5'. The optimum blend was the first blend, where the MDEA increased while the P.Z. amine decreased[15,16].
Figure 2.
Schematic of experimental apparatus utilized [15]
Figure 2.
Schematic of experimental apparatus utilized [15]
The availability of various amines in the industry is less freely obtainable than in MEA, where the challenges occur. Two types of amines were investigated for removing CO2 within hydrocarbon streams, and the physical properties of these amines were analyzed. It was found that the properties of these amines decreased as the temperature increased, which validates their use within other blends. [17]. It has been shown that amine blends can be used to capture CO2 from flue gas from coal fires, but the advancement of operational use for amine blends could be faster.
It has been found that amine-based scrubbing solvents, particularly monoethanolamine (MEA), may negatively impact freshwater ecosystems, causing a 10-fold increase in toxicity. The impact on terrestrial ecosystems, however, is relatively minor. To ensure the overall sustainability of climate change mitigation efforts, it is essential to consider these environmental impacts when implementing Carbon Capture and Storage (CCS) technologies [18].
Process simulation software allows studies to be carried out without the experimental restriction in variations or the high costs of every single study. For the above investigation by Mores et al. [19], previous works were also used to simulate and validate the mathematical optimization model. The results agreed and obtained a close fit with the mentioned raw data, meaning the mathematical model could now be used for optimization. Chu et al. [20] carried out work to deduce the optimum operational pressure, height, and packing for the absorption column based on the working conditions labelled T13 in China precisely [21]. The results showed better performance with larger porosities and operational at atmospheric conditions with a column height of 8 meters.
Gaspar et al. [22] investigated models for dynamic behavior versus transient behavior for CO2 capture and investigated configurations of solvent-stored tanks.
The numerical model was validated with the findings from Weiland et al. [23], which showed that high loads for CO2 had an impact on specific reboiler duty. Additionally, the configuration for solvent storage was viable and excluded any extra costs involved. Ahn et al. [24] studied reducing energy consumption in the CO2 adsorption process using 30 wt. % MEA solvent by modifying the stripper unit, attaching overhead compressions and condensing evaporation, and then evaluating accordingly. The results showed that the improved amine processing directly improves the reboiler stage.
Research has been carried out to validate the transient stage by Kvamsdal et al. [25]. However, the trend patterns have deviated enough to consider it non-validated or in progress status. According to [26], optimal CO2 capture (from post-combustion) was simulated using reduced models corresponding to technological-economic objectives. As simple models were limited, they developed a method for optimum operation, and a reduced model would be highly beneficial in simulations. Using reduced models corresponding to technological and economic objectives, optimum CO2 capture was simulated. Simulating a reduced model would be beneficial as simple models were a limitation. Using existing data, the new techno-economical model was simulated using Response Surface Modelling (MODDE 7 package) and compared with the Aspen HYSYS 7.3 model Peng-Robinson fluid package. As a result of the findings, tabulated data identified optimal processes and costs for various electric prices. This excellent reduced model evaluates the optimum running and power usage alongside the varying costs for electricity in industrial use. Model validation does not require further research, but optimization can be analyzed in more detail to maximize efficiency.
Andrade [27] used gPROMS to simulate a carbon capture process using MEA to reduce cost[28]. The simulated model showed that by reducing the capture rate to 75%, the purity of CO2 increased to 88%, and the mass fraction of solvent MEA increased to 40%, the specific heat cost would be reduced by 5%. The adsorption operation (with MEA) was investigated with a comparative focus on the equilibrium-based selected model and the rate-based selected model; these were carried out on gPROMS. The rate-based selected model obtained predictions much better and more accurately than the equilibrium-based model chosen.
Lawal et al. [29] simulated the same process above but added a reboiler and a recycle stream to the absorber. Results showed that the absorption unit showed a more significant sensitivity in the ratios of MEA and flue gas and that the rising reboiler duty impacted the poorer performance of MEA regeneration. They simulated a 500 MWe sub-critical power plant in 2012, using data merged from previous work. Three MEA concentrations were tested in this simulation, with 40 wt. % of MEA solvent being the most efficient concentration for CO2 capture. The height of the column was optimum at 27 m, and the cost of MEA solvent regeneration was higher at high concentrations.
Garcia et al. [30] validated a pilot plant simulation against four experimental data sets for the adsorption process using 30 wt. % MEA concentration. The desorption column had an average absolute relative deviation of 9.2%, and the reboilers' liquid flux temperature at output had a deviation of 3.3%.
Moioli et al. [31] simulated the CO2 adsorption process with MEA and evaluated the thermodynamic aspect impacting the reboiler's energy-saving duty. The validation could not be proved as the adsorption rate was below the 85-90% range at 75.9% CO2 adsorption. The rate-based model was validated against the equilibrium stage model, and the equilibrium stage model was rejected. The rate-based model promotes scope for varied concentrations using the rate-based model. The Aspen Plus RateSep model was used to simulate experimental results from the CASTOR project in 2007, and the results were acceptable but higher than the predicted results for the gas phase profile of temperature. Lim et al. [32] studied the absorber and the stripper with two rate-based models and validated the results against a 0.1 MW pilot plant based in Boryeong So, Utah, Korea.
The study used MEA solvent in a stripper integrated with a refinery plant. The results showed that the heat demand in the stripper increased when lower temperatures were simulated [33].
Luo et al. [34] investigated integrating a power plant of 453 MWe NGCC into a CO2 absorption process, including a compression unit for the CO2 product. They found that the integration improved the net efficiency and could be tested with other process aspects.
Moioli et al. [35] used Aspen Plus to simulate Lewis and Whitman's film theory and compared the results with experimental results. The simulated results showed slower results than the experimental data, thus confirming that much work and model validation needs to be carried out. Luo and Wang [36] validated a rate-based model for a combined cycle gas turbine (CCGT) plant using an MEA concentration of approximately 30 wt. %. They found that the model was even closer to the data from a pilot plant than any previous work.
Research by Luo and Wang [36]owed that thermodynamic models had a high impact on the accuracy of VLE for the lean solvent mixture. The modified rate-based model raised the accuracy of the density of the liquid mixture and better predicted the simulation.
A study comparing the models in Aspen Plus against equivalent models in Aspen HYSYS was investigated by Øi [37] The results showed that the rate-based model in Aspen Plus had the most negligible variations in its equilibrium-based model, whereas the rest of the comparisons were very similar.
In 2013, I et al. investigated configuration optimization for capturing CO2 by the absorption method. The results showed that including a vapor recompression saved the most energy, resulting in a total heat demand of approximately 2.9 MJ/kg compared to the standard configuration at 3.26 MJ/kg. In 2014, Øi and Kvam merged the two investigations, Øi [37] and Øi et al. [38], and analyzed various configurations alongside the Aspen HYSYS and Aspen Plus models. The results showed that the configuration with the vapor compression lowers energy consumption and is an optimized process.
Akram et al. [39,40] simulated CO2 loadings ranging from 5.5-9.9 vol. % on Aspen HYSYS and found that the higher the CO2 loading, the higher the absorption and the higher the flow rate for MEA meant more CO2 absorbed.
Rehan et al. [41] investigated the impact of an intercooler unit at various locations in the configured design to save energy. Rahmanian et al. [42] used Aspen HYSYS to simulate a pilot plant and investigated the impact packing structure has on the absorption of CO2. They concluded that the B.X. type had the largest surface area and obtained the lowest energy consumption.
Global energy demand is one of the main contributors to CO2 emissions, which must be contained by capturing methods to control this source that is currently damaging the environment (as mentioned earlier). Despite this, CO2 capture is a confirmed challenge and presents many challenges in implementing the process due to its feasibility. A great deal of research is continually being conducted to develop the process as well as reduce operational and maintenance costs. In conclusion, the literature review chapter has demonstrated that within this pool of studies, discrete concentrations of MEA solvent are the area of knowledge gap within the CO2 absorption process using MEA. The range in which MEA can be tested in simulations is limited. However, the behavior is important to analyze, as so far, the minimum concentration or cut-off has not been determined or claimed. According to the literature study, up to 45 wt.% of MEA concentration can be allowed. Thus, the range of MEA concentrations from 30-45 wt. % (usually fixed at 30 wt. %) shows opportunities for simulation using Aspen HYSYS in increments of 2 wt. %.
2. Materials and Methods
Numerical data (flow rates/temperatures/pressures, etc.) entered into the flowsheet model. The data were obtained from a capture plant in the U.K. In modeling, the property package decides which models will be evaluated. According to components of interest, Aspen HYSYS suggests recommended packages. During CO2 capture, the acid gas is considered automatically [43]. Simulation can begin with the amine package, which consists of reliable models.
Table 3 lists the components of acid gas using the amine property package. The Kent-Eisenberg model usually models the liquid phase, while the Peng-Robinson (P.R.) model usually models the vapor phase. The package limits simulation parameters. Table 4 summarizes the operating conditions of amines and their blends within Aspen. As a result, MEA concentrations will be below 50 wt.% maximum [44].
K is the equilibrium ratio predicted by the Kent-Eisenberg model in the liquid phase. This model uses non-linear expressions to describe phase and chemical equilibrium, electroneutrality, and mass balances for electrolytes in the liquid phase. The Peng-Robinson (P.R.) model predicts the equilibrium ratio in the vapor phase. The model also predicts non-ideal systems. Using the Peng-Robinson (PR) equation of state, systems of two, three, and singular phases can be efficiently evaluated while reliable simulations can be solved ([45]).
3.1. Model Parameters
3.2. Modelling Methodology
Table 5 lists the model parameters in the following steps to simulate the process. The following steps were undertaken to get the results.
- The components within the properties section were selected and confirmed.
- In response to Aspen HYSYS acknowledging the selected components list, the amine package was recommended for process simulation, fluid properties prediction, and acid gas cleaning evaluations.
- Enter feed data into model parameters.
- Figure 3 shows the flowsheet, which includes the absorbing column, cross heat exchanger, stripper column with reboiler and condenser, mixer, and recycle.
- Column convergence was achieved after many iterations (see Table 5).
- Once the base case results were validated, the solvent concentrations were varied by 2 wt% and the simulation was run to collect 30 - 46 wt% data
- The calculations were made, and the obtained results were plotted in Excel.
The following equations were used to calculate the relative parameters based on the resultant data. MCCC2 (kg/h) represents the rate at which CO2 is captured; 𝑛𝐶O2 represents the number of moles in and out; 𝑀𝐶O2 represents the molecular weight of CO2; and Q (kJ/h) represents the reboiler duty (Akram et al. 2016); h is the CO2 absorption efficiency as a percentage fraction; and last but not least, CO2 in and out are respectively flow rates [19]
𝑀𝐶O2 = (𝑛𝐶O2𝑖𝑛 − 𝑛𝐶O2𝑜𝑢𝑡) ∗ 𝑀W𝐶O2
For further analysis, the new data calculations were represented graphically, and the optimal parameters were located and simulated again using different variables.
- Using the existing simulation, two new parameters were chosen to vary, as the behavior at peak concentration showed potential.
- The chosen parameter was the temperature (rising in 5 °C increments) of the solvent, within the limits ranging from 303 K to 328 K (30-55 °C) from Zhang and Chen [5]. In contrast, the maximum temperature was 80 °C, which is not simulated because corrosion and oxidation increase dramatically at this temperature, as shown in Fischer et al. [42].
- Pressure was the second chosen parameter. It was simulated from 200 kPa to 1000 kPa in 100 kPa increments.
- A further simulation of the same configuration was performed. However, simulations to compare MEA with two other amines, DEA and TEA, were performed in separate flow sheets and are not shown for brevity. Pressure and temperature sensitivities were simulated in MEA.
- The obtained data were analyzed and discussed.
3.3. Convergence Chalenges
Øi [37] described convergence challenges in this simulation. Solvent flow rate and pressure were susceptible to stimulation. The stripper convergence depends heavily on the absorbed data. There were many iterations until the columns converged. If the complete simulation could not be solved, iterations were carried out on individual columns. As soon as the two columns converged, they were connected, and the last few adjustments were made to keep them converged.
4. Results and Discussions
The results in Figure 4 are significant as they demonstrate a high absorption efficiency of 87.02% at a close solvent concentration of 30 wt.%. This validates the findings of Øi [46] and suggests that the base case with the lowest solvent concentration can still achieve efficient absorption.
At the optimum concentration of 36 wt.% MEA, the absorption efficiency reaches nearly 90%. This is significantly higher than the efficiency at the lowest concentration of 30 wt.% MEA, approximately 87.02%, and higher than the efficiency at the highest concentration of 46 wt.% MEA, which is approximately 89.67%.
Because MEA is the capturing component, more MEA contacts CO2 molecules, and more adsorption is expected. After the peak point, however, absorption stops increasing and remains constant because equilibrium has been reached, and no more reactants can be saturated to convert into the product.
As shown in Figure 5, there is a correlation between the absorption rate trend and Figure 4. An increase in solvent concentration seems to decrease the absorption rate, although at the same optimum concentration of 36 wt.% MEA, the absorption rate increases slightly and then stabilizes. The same reason causes this opposing trend, but they are connected. As the absorption efficiency increases and becomes constant with increased solvent concentrations, the actual absorption rate decreases and remains constant with equilibrium.
The relationship between energy consumption and MEA concentration is inversely proportional. As the MEA concentration increases, the energy consumption decreases. This can be observed in Figure 6, where the energy consumption declines as the MEA concentration increases. However, at a concentration of 36 wt.%, the energy consumption reaches its highest point before gradually decreasing. This suggests that there might be an optimal MEA concentration that balances both absorption rate and energy consumption.
As a result, regeneration is unnecessary after the maximum absorption point, decreasing overall energy consumption. As expected, the initial decrease in energy consumption should have been followed by a slight increase until the optimum point, but this was not the case, and each discrete increment converged well except for points between the first and optimum, indicating that the results were abnormal. Many trials were carried out before convergence was reached, and as confirmed by Øi [46], the columns are sensitive and challenging to convergence.
Aside from the initial validation of the base case, Figure 7 examines the specific trend of the reboiler duties for different CO2 loadings. Akram et al. [39] ) indicate that the experimental and simulated work shown in the literature has been validated. While the CO2 loadings were much lower, the trend showed that duty decreased as the loading increased despite the lower CO2 loadings. Knudsen et al. [48] showed the lowest specific reboiler duty at high CO2 loading and closely matched the current simulation results at 87% CO2 absorption.
Table 6 presents the simulation kinetic data and a literature validation comparison. For the resultant data to be a real representation of the CO2 capture process, these criteria were checked in the simulated model to ensure the reactions are correct and the simulation is valid. According to simulation, kinetic data, reaction constants, and activation energies agree with the literature data. In both columns, the activation energy differs very little in forward and reverse reactions. Despite the slight difference in operating conditions, the simulation values are slightly higher. They confirm a valid simulation model and agree about the reaction constant.
4.1. Further Result and Discussion
Figures 4 to 6 show that the MEA concentration was 36 wt.%. To analyze MEA in more depth, two other amines, DEA and TEA, were also simulated and run on Aspen HYSYS for temperature analysis at the same concentration as MEA. Figure 8 and Figure 9 show the results of varying the solvent inlet temperature.
Temperature affects CO2 absorption efficiency for all three amine solvents, as shown in Figure 8. However, MEA seems to fluctuate compared to DEA and TEA, which rise more steadily. In this case, the solvent MEA is more stable at a limited temperature range, and once another temperature limit has been reached, the molecules have much more energy to collide and react with CO2, thus increasing absorption. At a temperature of 55 °C, MEA solvent shows the most outstanding absorption efficiency and captures 92% CO2.
In contrast to MEA, DEA seems less affected by higher temperatures, with an increase of less than 1% in absorption efficiency from the lowest to the highest inlet temperature. Therefore, DEA is less sensitive to this temperature range than MEA. In addition, Pouladi et al. [49] analyzed how temperature impacts tower performance using DEA and found that above 53 °C, absorption decreases tower performance. DEA has shown here that it is much less sensitive to temperature than MEA solvent, so further increases in temperature would not add any benefit.
However, the TEA trend has an increasingly steeper slope than DEA and is much more sensitive to temperature changes. Similar to MEA, TEA increases the absorption efficiency of CO2 as temperature increases. While 40 °C is used in the simulation by Øi [46], this temperature shows that MEA is the best solvent and absorbs the most CO2 out of the three solvents. At the highest temperature of 55 °C, MEA still takes the top position and absorbs 92% CO2. Unless the inlet temperature is lowered to 30 to 35°C, which, according to the results, shows DEA to be the better performer, MEA has been the preferred choice.
Figure 9 also shows how temperature impacts energy consumption for three amines. Similar trends were observed in Figure 8. Solvent TEA, however, seems to have a much lower slope and consumes less energy than it adsorbs CO2. DEA also appears to follow the same trend, and increasing temperature does not affect energy consumption as much. While MEA increases energy consumption similarly to that seen in absorption efficiency, the regeneration of MEA is much greater than that of DEA and TEA. This means that because MEA has a much higher energy consumption, DEA and TEA, while not far from MEA in absorption efficiency values, should be utilized more, bringing the energy costs down significantly.
The temperature sensitivities of MEA and TEA were relatively similar, but DEA had much less impact. The base case involved an absorb pressure of approximately 101 kPa, and increments of 100 kPa were simulated to check how pressure affected absorption efficiency.
As shown in Figure 11 and Figure 10, the results show a very steady and non-fluctuating trend in energy consumption. Among the most exciting results seen in Figure 11 is that MEA has a higher absorption rate and a more significant gap at lower pressure than DEA and TEA, indicating a higher absorption rate. As the graph shows, the gap between the amines narrows as the operating pressures increase, and the CO2 absorption efficiency becomes similar pressures.
Pouladi et al. [49] found that inlet pressure variation does not affect tower performance. Still, in this case, the varied pressure of the tower/column significantly impacts tower performance, indicating that higher operational pressures encourage this reaction. At these pressure ranges, MEA still performs the best among the three amines; at its highest-pressure range, MEA has a 97% absorption efficiency.
As shown in Figure 11, the gap is smaller at lower operational pressures than energy consumption. While MEA appears to behave linearly as pressure increases, the energy consumption is also very high. Compared to DEA and TEA, the energy required to regenerate MEA is much higher. Therefore, DEA and TEA perform better at higher operation pressures than MEA, and the balance between energy consumption and CO2 absorption is vital for revealing better amine.
After analyzing the performance of three different amines at various temperatures and pressures, DEA and TEA's discrete concentration analysis needs to be further investigated. Two amines can be tested at discrete concentrations to determine their limits. The amine behavior of a column at each stage can be compared with a packed column to determine which CO2 is absorbed and what stages can be reduced.
5. Conclusions
The predicament of carbon capture feasibility appears as a quarry requiring reduction. Although some costs can be reduced, the best option is to try all angles and accumulate the savings to make the process feasible. Despite much research, the capture process is still not fully integrated, and there is room for improvement in reducing costs and optimizing operations. A knowledge gap was found where discrete solvent (MEA) concentration data had not been analyzed, which led to a deeper analysis of temperature and pressure sensitivity simulations. Based on these results, further studies can be undertaken on the other two amines (DEA and TEA) or the most appropriate solvent for industry.
- After 36 wt.%, all higher concentrations are constant and less than the optimum concentration for CO2 absorption efficiency.
- As equilibrium is reached, the absorption remains constant at higher concentrations as the capture rate falls.
- Despite the optimum MEA concentration of 36 wt.%, the highest energy consumption also resulted in the highest costs, so the optimum concentration also has higher costs.
- The working simulation model confirmed agreement with literature values for the base case's reaction kinetics and absorption efficiency.
- In the simulated temperature and pressure ranges, MEA had the highest absorption (up to 97%) compared to DEA and TEA.
- Energy consumption increased as absorption increased with temperature and pressure.
- DEA and TEA require less energy than MEA to achieve similar results when operating at high pressures. Therefore, these fewer common amines are alternatives to MEA at higher operating pressures.
References
- Cousins, A.; Wardhaugh, L.T.; Feron, P.H.M. A Survey of Process Flow Sheet Modifications for Energy Efficient CO2 Capture from Flue Gases Using Chemical Absorption. International Journal of Greenhouse Gas Control 2011, 5, 605–619. [Google Scholar] [CrossRef]
- Kheirinik, M.; Ahmed, S.; Rahmanian, N. Comparative Techno-Economic Analysis of Carbon Capture Processes: Pre-Combustion, Post-Combustion, and Oxy-Fuel Combustion Operations. Sustainability 2021, 13, 13567. [Google Scholar] [CrossRef]
- Li, T.; Yang, C.; Tantikhajorngosol, P.; Sema, T.; Liang, Z.; Tontiwachwuthikul, P.; Liu, H. Comparative Desorption Energy Consumption of Post-Combustion CO2 Capture Integrated with Mechanical Vapor Recompression Technology. Sep Purif Technol 2022, 294, 121202. [Google Scholar] [CrossRef]
- Joel, A.S.; Olaleye, A.K.; Lee, J.G.M.; Wu, K.; Kim, D.; Shah, N.; Kolster, C.; Mac Dowell, N.; Wang, M.; Ramshaw, C.; et al. Carbon Capture. In The Water-Food-Energy Nexus; CRC Press, 2017; pp. 457–632.
- Zhang, Y.; Chen, C.-C. Modeling CO2 Absorption and Desorption by Aqueous Monoethanolamine Solution with Aspen Rate-Based Model. Energy Procedia 2013, 37, 1584–1596. [Google Scholar] [CrossRef]
- Agarwal, N.; Cao Nhien, L.; Lee, M. Rate-Based Modeling and Assessment of an Amine-Based Acid Gas Removal Process through a Comprehensive Solvent Selection Procedure. Energies (Basel) 2022, 15, 6817. [Google Scholar] [CrossRef]
- Delfort, B.; Carrette, P.-L.; Bonnard, L. MEA 40% with Improved Oxidative Stability for CO2 Capture in Post-Combustion. Energy Procedia 2011, 4, 9–14. [Google Scholar] [CrossRef]
- Wang, M.; Lawal, A.; Stephenson, P.; Sidders, J.; Ramshaw, C. Post-Combustion CO2 Capture with Chemical Absorption: A State-of-the-Art Review. Chemical engineering research and design 2011, 89, 1609–1624. [Google Scholar] [CrossRef]
- Taghavi Kouzehkanan, S.M.; Hassani, E.; Feyzbar-Khalkhali-Nejad, F.; Oh, T.S. Calcium-Based Sorbent Carbonation at Low Temperature via Reactive Milling under CO2. Inorganics (Basel) 2023, 11. [Google Scholar] [CrossRef]
- Hikita, H.; Asai, S.; Ishikawa, H.; Honda, M. The Kinetics of Reactions of Carbon Dioxide with Monoethanolamine, Diethanolamine and Triethanolamine by a Rapid Mixing Method. The Chemical Engineering Journal 1977, 13, 7–12. [Google Scholar] [CrossRef]
- Pinsent, B.R.W.; Pearson, L.; Roughton, F.J.W. The Kinetics of Combination of Carbon Dioxide with Hydroxide Ions. Transactions of the Faraday Society 1956, 52, 1512–1520. [Google Scholar] [CrossRef]
- Zhang, Y.; Chen, C.-C. Modeling CO2 Absorption and Desorption by Aqueous Monoethanolamine Solution with Aspen Rate-Based Model. Energy Procedia 2013, 37, 1584–1596. [Google Scholar] [CrossRef]
- Ramadan, B.S.; Rachman, I.; Ikhlas, N.; Kurniawan, S.B.; Miftahadi, M.F.; Matsumoto, T. A Comprehensive Review of Domestic-Open Waste Burning: Recent Trends, Methodology Comparison, and Factors Assessment. J Mater Cycles Waste Manag 2022, 24, 1633–1647. [Google Scholar] [CrossRef] [PubMed]
- Lee, J.; Kolawole, T.; Attidekou, P. Carbon Capture from a Simulated Flue Gas Using a Rotating Packed Bed Adsorber and Mono Ethanol Amine (MEA). Energy Procedia 2017, 114, 1834–1840. [Google Scholar] [CrossRef]
- Zhang, R.; Zhang, X.; Yang, Q.; Yu, H.; Liang, Z.; Luo, X. Analysis of the Reduction of Energy Cost by Using MEA-MDEA-PZ Solvent for Post-Combustion Carbon Dioxide Capture (PCC). Appl Energy 2017, 205, 1002–1011. [Google Scholar] [CrossRef]
- Bariki, S.G.; Movahedirad, S. ; others Comparative Analysis of Artificial Neural Network (ANN) Models: CO2 Loading in MDEA and Blended MDEA/PZ Solvents. Fuel 2024, 357, 129667. [Google Scholar]
- Nessi, E.; Papadopoulos, A.I.; Seferlis, P. A Review of Research Facilities, Pilot and Commercial Plants for Solvent-Based Post-Combustion CO2 Capture: Packed Bed, Phase-Change and Rotating Processes. International Journal of Greenhouse Gas Control 2021, 111, 103474. [Google Scholar] [CrossRef]
- Veltman, K.; Singh, B.; Hertwich, E.G. Human and Environmental Impact Assessment of Postcombustion CO2 Capture Focusing on Emissions from Amine-Based Scrubbing Solvents to Air. Environ Sci Technol 2010, 44, 1496–1502. [Google Scholar] [CrossRef]
- Mores, P.; Scenna, N.; Mussati, S. Post-Combustion CO2 Capture Process: Equilibrium Stage Mathematical Model of the Chemical Absorption of CO2 into Monoethanolamine (MEA) Aqueous Solution. Chemical Engineering Research and Design 2011, 89, 1587–1599. [Google Scholar] [CrossRef]
- Chu, F.; Yang, L.; Du, X.; Yang, Y. CO2 Capture Using MEA (Monoethanolamine) Aqueous Solution in Coal-Fired Power Plants: Modeling and Optimization of the Absorbing Columns. Energy 2016, 109, 495–505. [Google Scholar] [CrossRef]
- Huang, L.; Hou, Z.; Fang, Y.; Liu, J.; Shi, T. Evolution of CCUS Technologies Using LDA Topic Model and Derwent Patent Data. Energies (Basel) 2023, 16, 2556. [Google Scholar] [CrossRef]
- Gaspar, J.; Gladis, A.; Jørgensen, J.B.; Thomsen, K.; Von Solms, N.; Fosbøl, P.L. Dynamic Operation and Simulation of Post-Combustion CO2 Capture. Energy Procedia 2016, 86, 205–214. [Google Scholar] [CrossRef]
- Weiland, R.H.; Dingman, J.C.; Cronin, D.B.; Browning, G.J. Density and Viscosity of Some Partially Carbonated Aqueous Alkanolamine Solutions and Their Blends. J Chem Eng Data 1998, 43, 378–382. [Google Scholar] [CrossRef]
- Ahn, H.; Luberti, M.; Liu, Z.; Brandani, S. Process Simulation of Aqueous MEA Plants for Post-Combustion Capture from Coal-Fired Power Plants. Energy Procedia 2013, 37, 1523–1531. [Google Scholar] [CrossRef]
- Kvamsdal, H.M.; Chikukwa, A.; Hillestad, M.; Zakeri, A.; Einbu, A. A Comparison of Different Parameter Correlation Models and the Validation of an MEA-Based Absorber Model. Energy Procedia 2011, 4, 1526–1533. [Google Scholar] [CrossRef]
- Li, Z.; Sharma, M.; Khalilpour, R.; Abbas, A. Optimal Operation of Solvent-Based Post-Combustion Carbon Capture Processes with Reduced Models. Energy Procedia 2013, 37, 1500–1508. [Google Scholar] [CrossRef]
- Andrade, A. Design and Operation Optimisation of a MEA-Based CO2 Capture Unit, M. Sc. thesis). Chemical Engineering Department, Instituto Superior Tecnico~…, 2014.
- Im, D.; Jung, H.; Lee, J.H. Modeling, Simulation and Optimization of the Rotating Packed Bed (RPB) Absorber and Stripper for MEA-Based Carbon Capture. Comput Chem Eng 2020, 143, 107102. [Google Scholar] [CrossRef]
- Lawal, A.; Wang, M.; Stephenson, P.; Koumpouras, G.; Yeung, H. Dynamic Modelling and Analysis of Post-Combustion CO2 Chemical Absorption Process for Coal-Fired Power Plants. Fuel 2010, 89, 2791–2801. [Google Scholar] [CrossRef]
- Garcia, M.; Knuutila, H.K.; Gu, S. ASPEN PLUS Simulation Model for CO2 Removal with MEA: Validation of Desorption Model with Experimental Data. J Environ Chem Eng 2017, 5, 4693–4701. [Google Scholar] [CrossRef]
- Moioli, S.; Nagy, T.; Langé, S.; Pellegrini, L.A.; Mizsey, P. Simulation Model Evaluation of CO2 Capture by Aqueous MEA Scrubbing for Heat Requirement Analyses. Energy Procedia 2017, 114, 1558–1566. [Google Scholar] [CrossRef]
- Lim, Y.; Kim, J.; Jung, J.; Lee, C.S.; Han, C. Modeling and Simulation of CO2 Capture Process for Coal-Based Power Plant Using Amine Solvent in South Korea. Energy Procedia 2013, 37, 1855–1862. [Google Scholar] [CrossRef]
- Kum, J.; Cho, S.; Ko, Y.; Lee, C.-H. Blended-Amine CO2 Capture Process without Stripper for High-Pressure Syngas. Chemical Engineering Journal 2024, 150226. [Google Scholar] [CrossRef]
- Luo, X.; Wang, M.; Chen, J. Heat Integration of Natural Gas Combined Cycle Power Plant Integrated with Post-Combustion CO2 Capture and Compression. Fuel 2015, 151, 110–117. [Google Scholar] [CrossRef]
- Moioli, S.; Pellegrini, L.A.; Gamba, S. Simulation of CO2 Capture by MEA Scrubbing with a Rate-Based Model. Procedia Eng 2012, 42, 1651–1661. [Google Scholar] [CrossRef]
- Luo, X.; Wang, M. Improving Prediction Accuracy of a Rate-Based Model of an MEA-Based Carbon Capture Process for Large-Scale Commercial Deployment. Engineering 2017, 3, 232–243. [Google Scholar] [CrossRef]
- ErikØi, L. Comparison of Aspen HYSYS and Aspen Plus Simulation of CO2 Absorption into MEA from Atmospheric Gas. Energy Procedia 2012, 23, 360–369. [Google Scholar] [CrossRef]
- Øi, L.E.; Bråthen, T.; Berg, C.; Brekne, S.K.; Flatin, M.; Johnsen, R.; Moen, I.G.; Thomassen, E. Optimization of Configurations for Amine Based CO2 Absorption Using Aspen HYSYS. Energy Procedia 2014, 51, 224–233. [Google Scholar] [CrossRef]
- Rezazadeh, F.; Gale, W.F.; Akram, M.; Hughes, K.J.; Pourkashanian, M. Performance Evaluation and Optimisation of Post Combustion CO2 Capture Processes for Natural Gas Applications at Pilot Scale via a Verified Rate-Based Model. International journal of greenhouse gas control 2016, 53, 243–253. [Google Scholar] [CrossRef]
- Ali, U.; Akram, M.; Font-Palma, C.; Ingham, D.B.; Pourkashanian, M. Part-Load Performance of Direct-Firing and Co-Firing of Coal and Biomass in a Power Generation System Integrated with a CO2 Capture and Compression System. Fuel 2017, 210, 873–884. [Google Scholar] [CrossRef]
- Rehan, M.; Rahmanian, N.; Hyatt, X.; Peletiri, S.P.; Nizami, A.-S. Energy Savings in CO2 Capture System through Intercooling Mechanism. Energy Procedia 2017, 142, 3683–3688. [Google Scholar] [CrossRef]
- Rahmanian, N.; Rehan, M.; Sumani, A.; Nizami, A.-S. Effect of Packing Structure on CO2 Capturing Process. Chem Eng Trans 2018, 70, 1891–1896. [Google Scholar]
- He, S.; Li, L.-X.; Zhang, L.-T.; Zeng, S.; Feng, C.; Chen, X.-X.; Zhou, H.-L.; Huang, X.-C. Elucidating Influences of Defects and Thermal Treatments on CO2 Capture of a Zr-Based Metal-Organic Framework. Chemical Engineering Journal 2024, 479, 147605. [Google Scholar] [CrossRef]
- Zhang, Y.; Yang, X.; Zhang, L.; Li, Y.; Zhang, T.; Sun, S. Energy Landscape Analysis for Two-Phase Multi-Component NVT Flash Systems by Using ETD Type High-Index Saddle Dynamics. J Comput Phys 2023, 477, 111916. [Google Scholar] [CrossRef]
- Aspentech Acid Gas Cleaning in Aspen HYSYS®.
- Øi, L.E. Aspen HYSYS Simulation of CO2 Removal by Amine Absorption from a Gas Based Power Plant. In Proceedings of the 48th Scandinavian Conference on Simulation and Modeling (SIMS 2007), Göteborg (Särö); 2007, 30-31 October 2007; pp. 73–81. [Google Scholar]
- Gervasi, J.; Dubois, L.; Thomas, D. Simulation of the Post-Combustion CO2 Capture with Aspen HysysTM Software: Study of Different Configurations of an Absorption-Regeneration Process for the Application to Cement Flue Gases. Energy Procedia 2014, 63, 1018–1028. [Google Scholar] [CrossRef]
- Knudsen, J.N.; Jensen, J.N.; Vilhelmsen, P.J.; Biede, O. Experience with CO2 Capture from Coal Flue Gas in Pilot-Scale. In Proceedings of the IOP Conference Series. Earth and Environmental Science; 2009; Vol. 6. [Google Scholar]
- Pouladi, B.; Hassankiadeh, M.N.; Behroozshad, F. Dynamic Simulation and Optimization of an Industrial-Scale Absorption Tower for CO2 Capturing from Ethane Gas. Energy reports 2016, 2, 54–61. [Google Scholar] [CrossRef]
Figure 3.
The flowsheet of process simulation for CO2 capture. using MEA solvent.
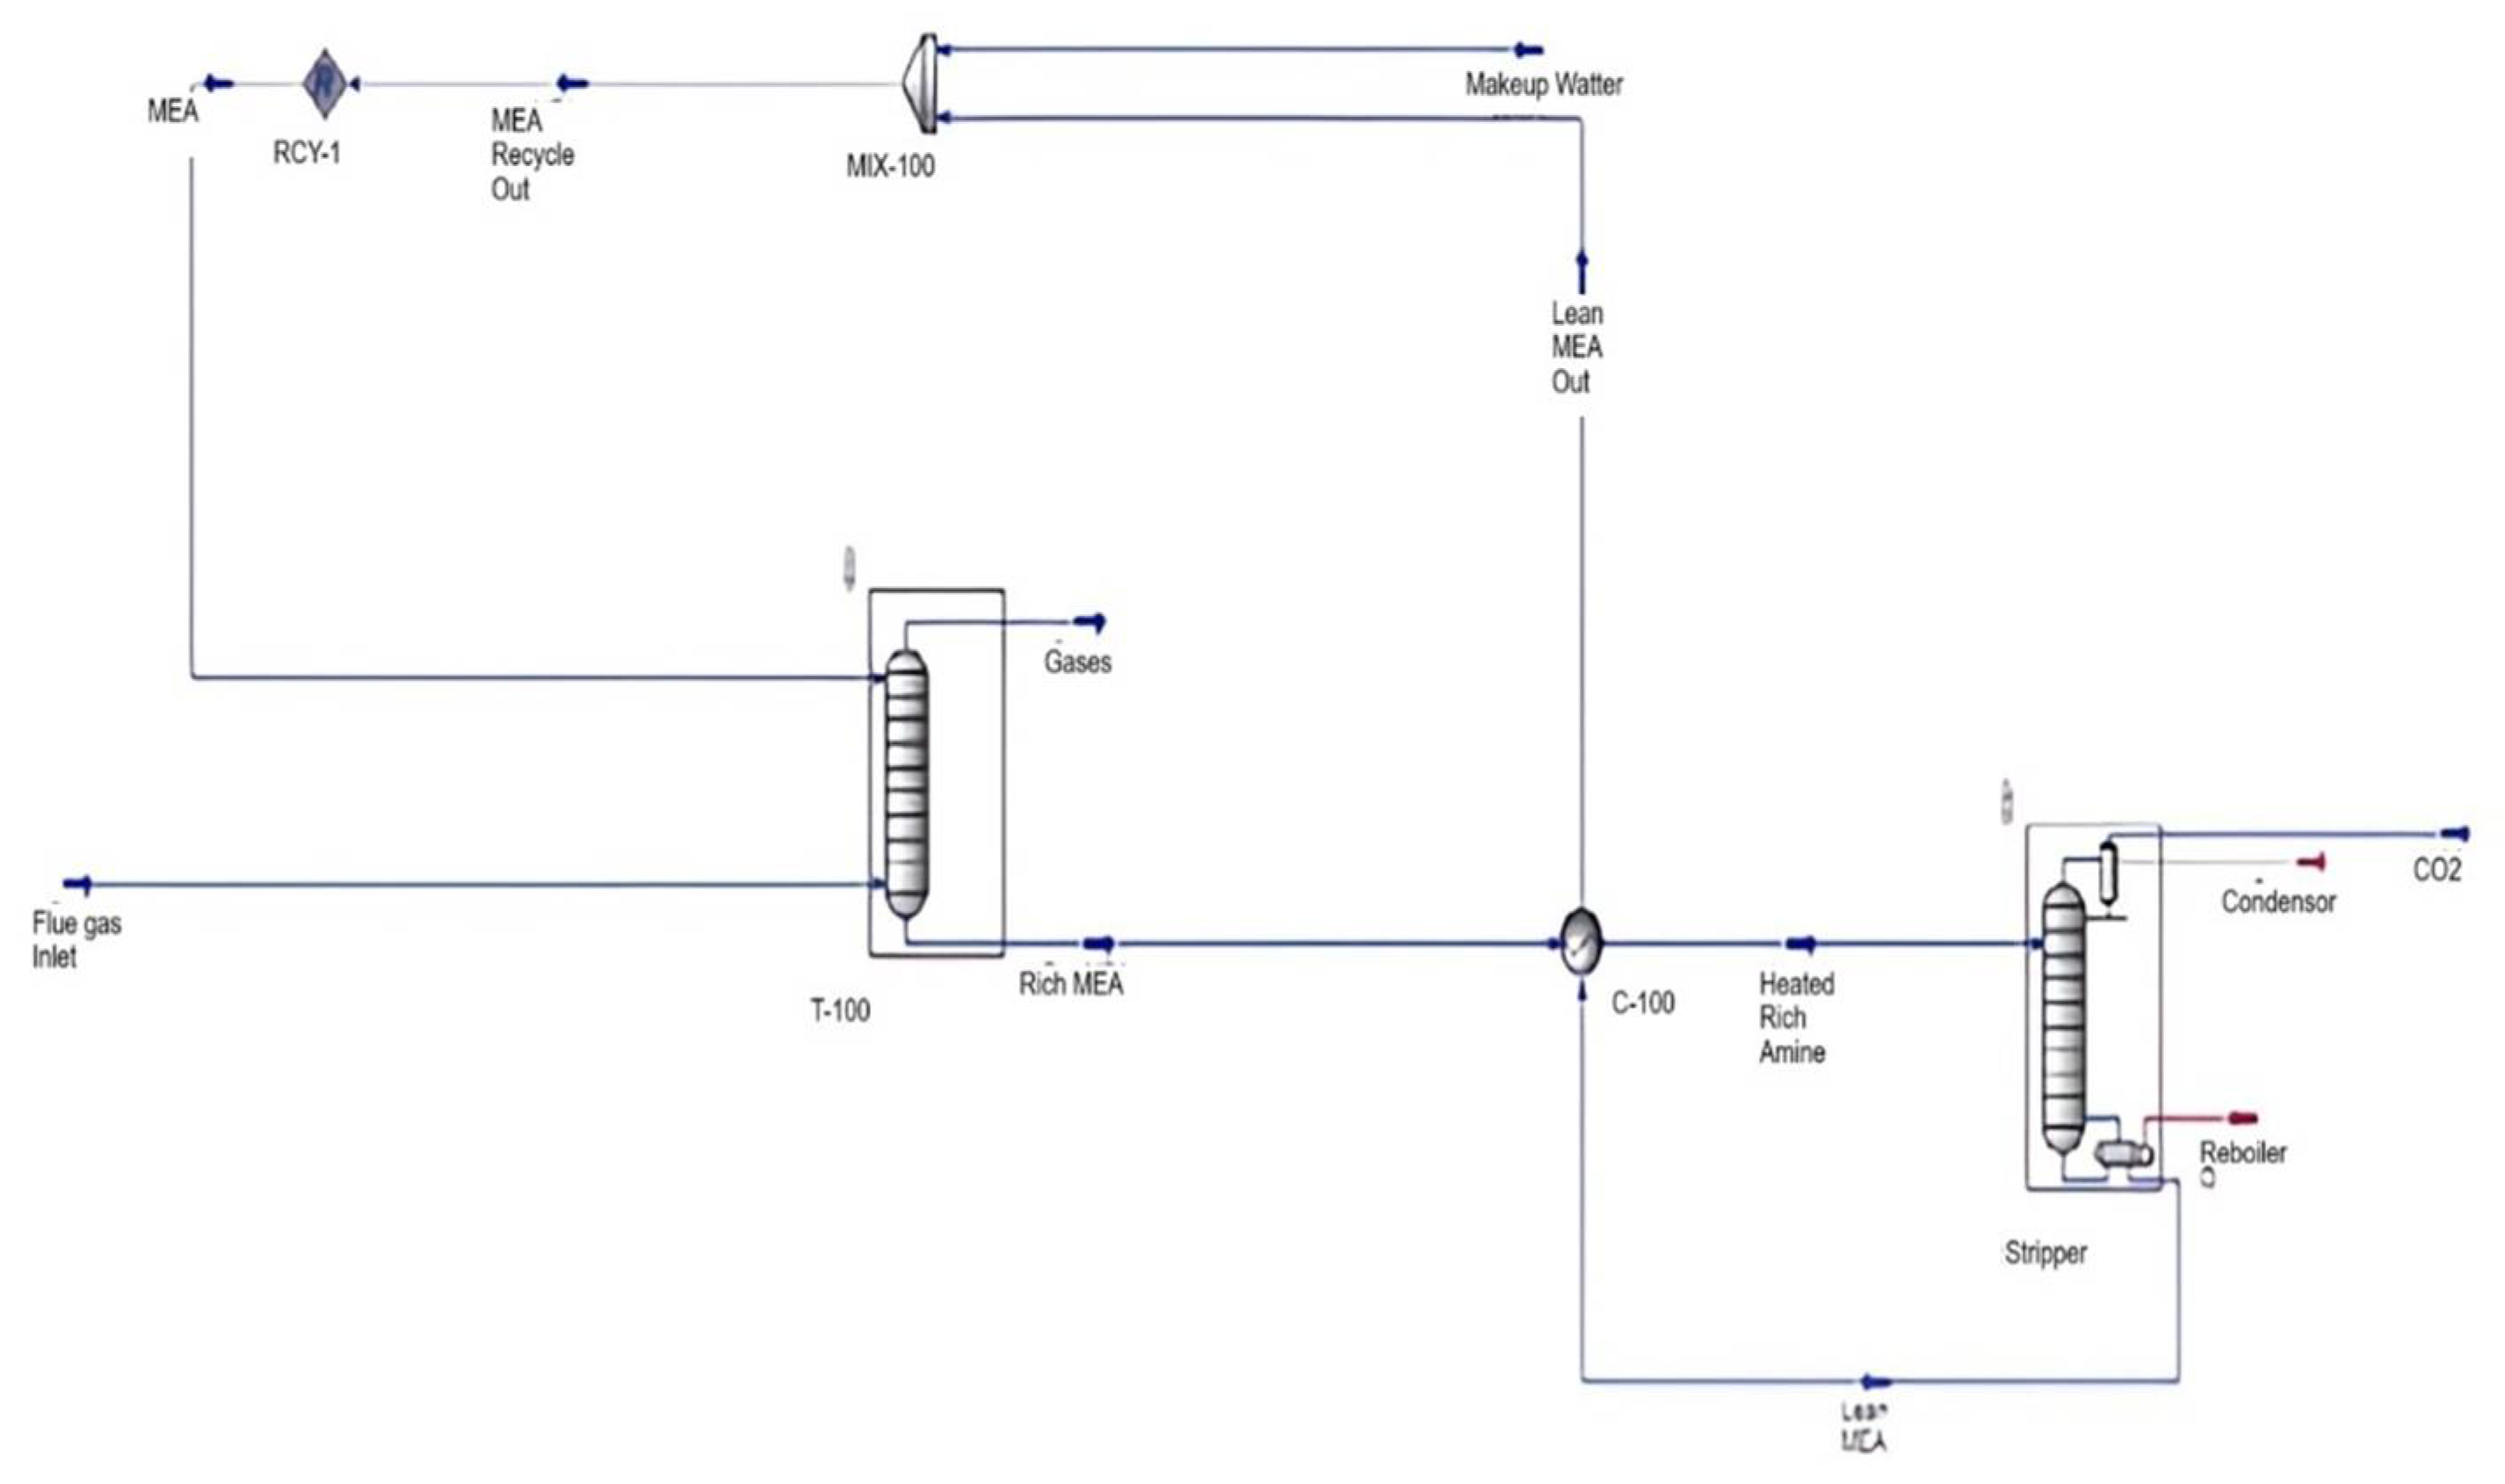
Figure 4.
Graphical results for the effect of MEA concentration on the absorption efficiency of CO2.
Figure 4.
Graphical results for the effect of MEA concentration on the absorption efficiency of CO2.
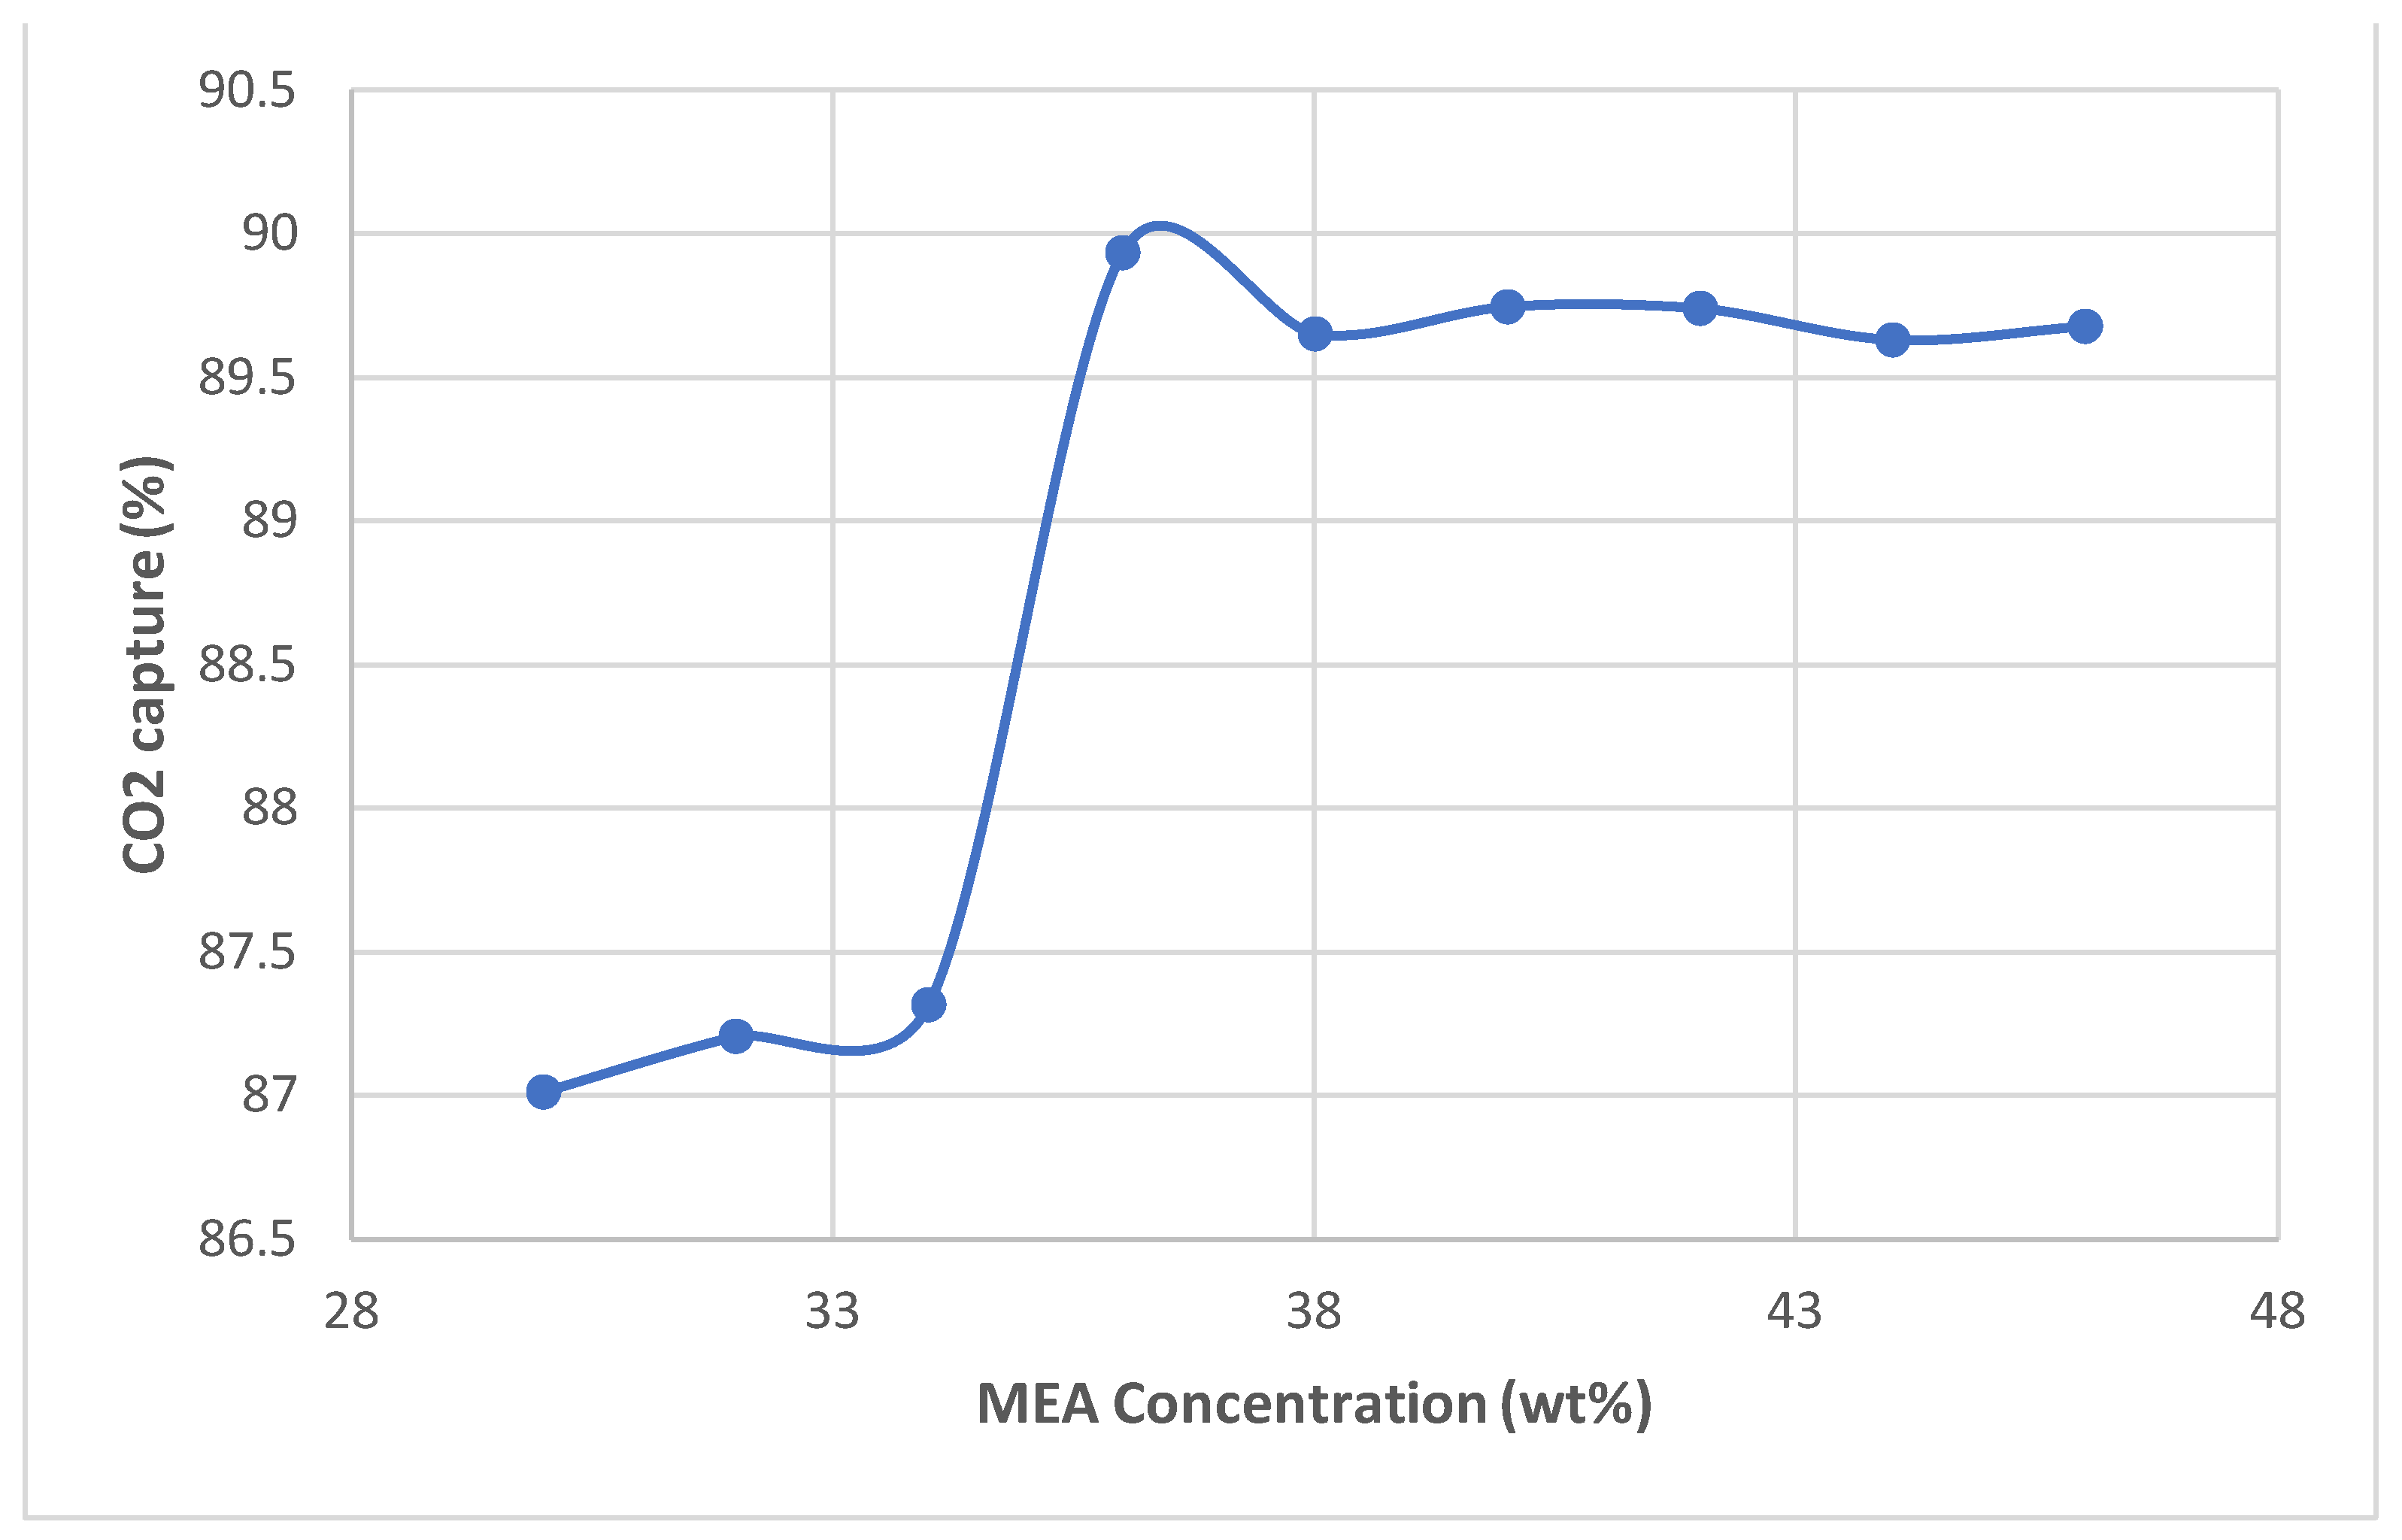
Figure 5.
Graphical results for the effect of MEA concentration on the absorption rate
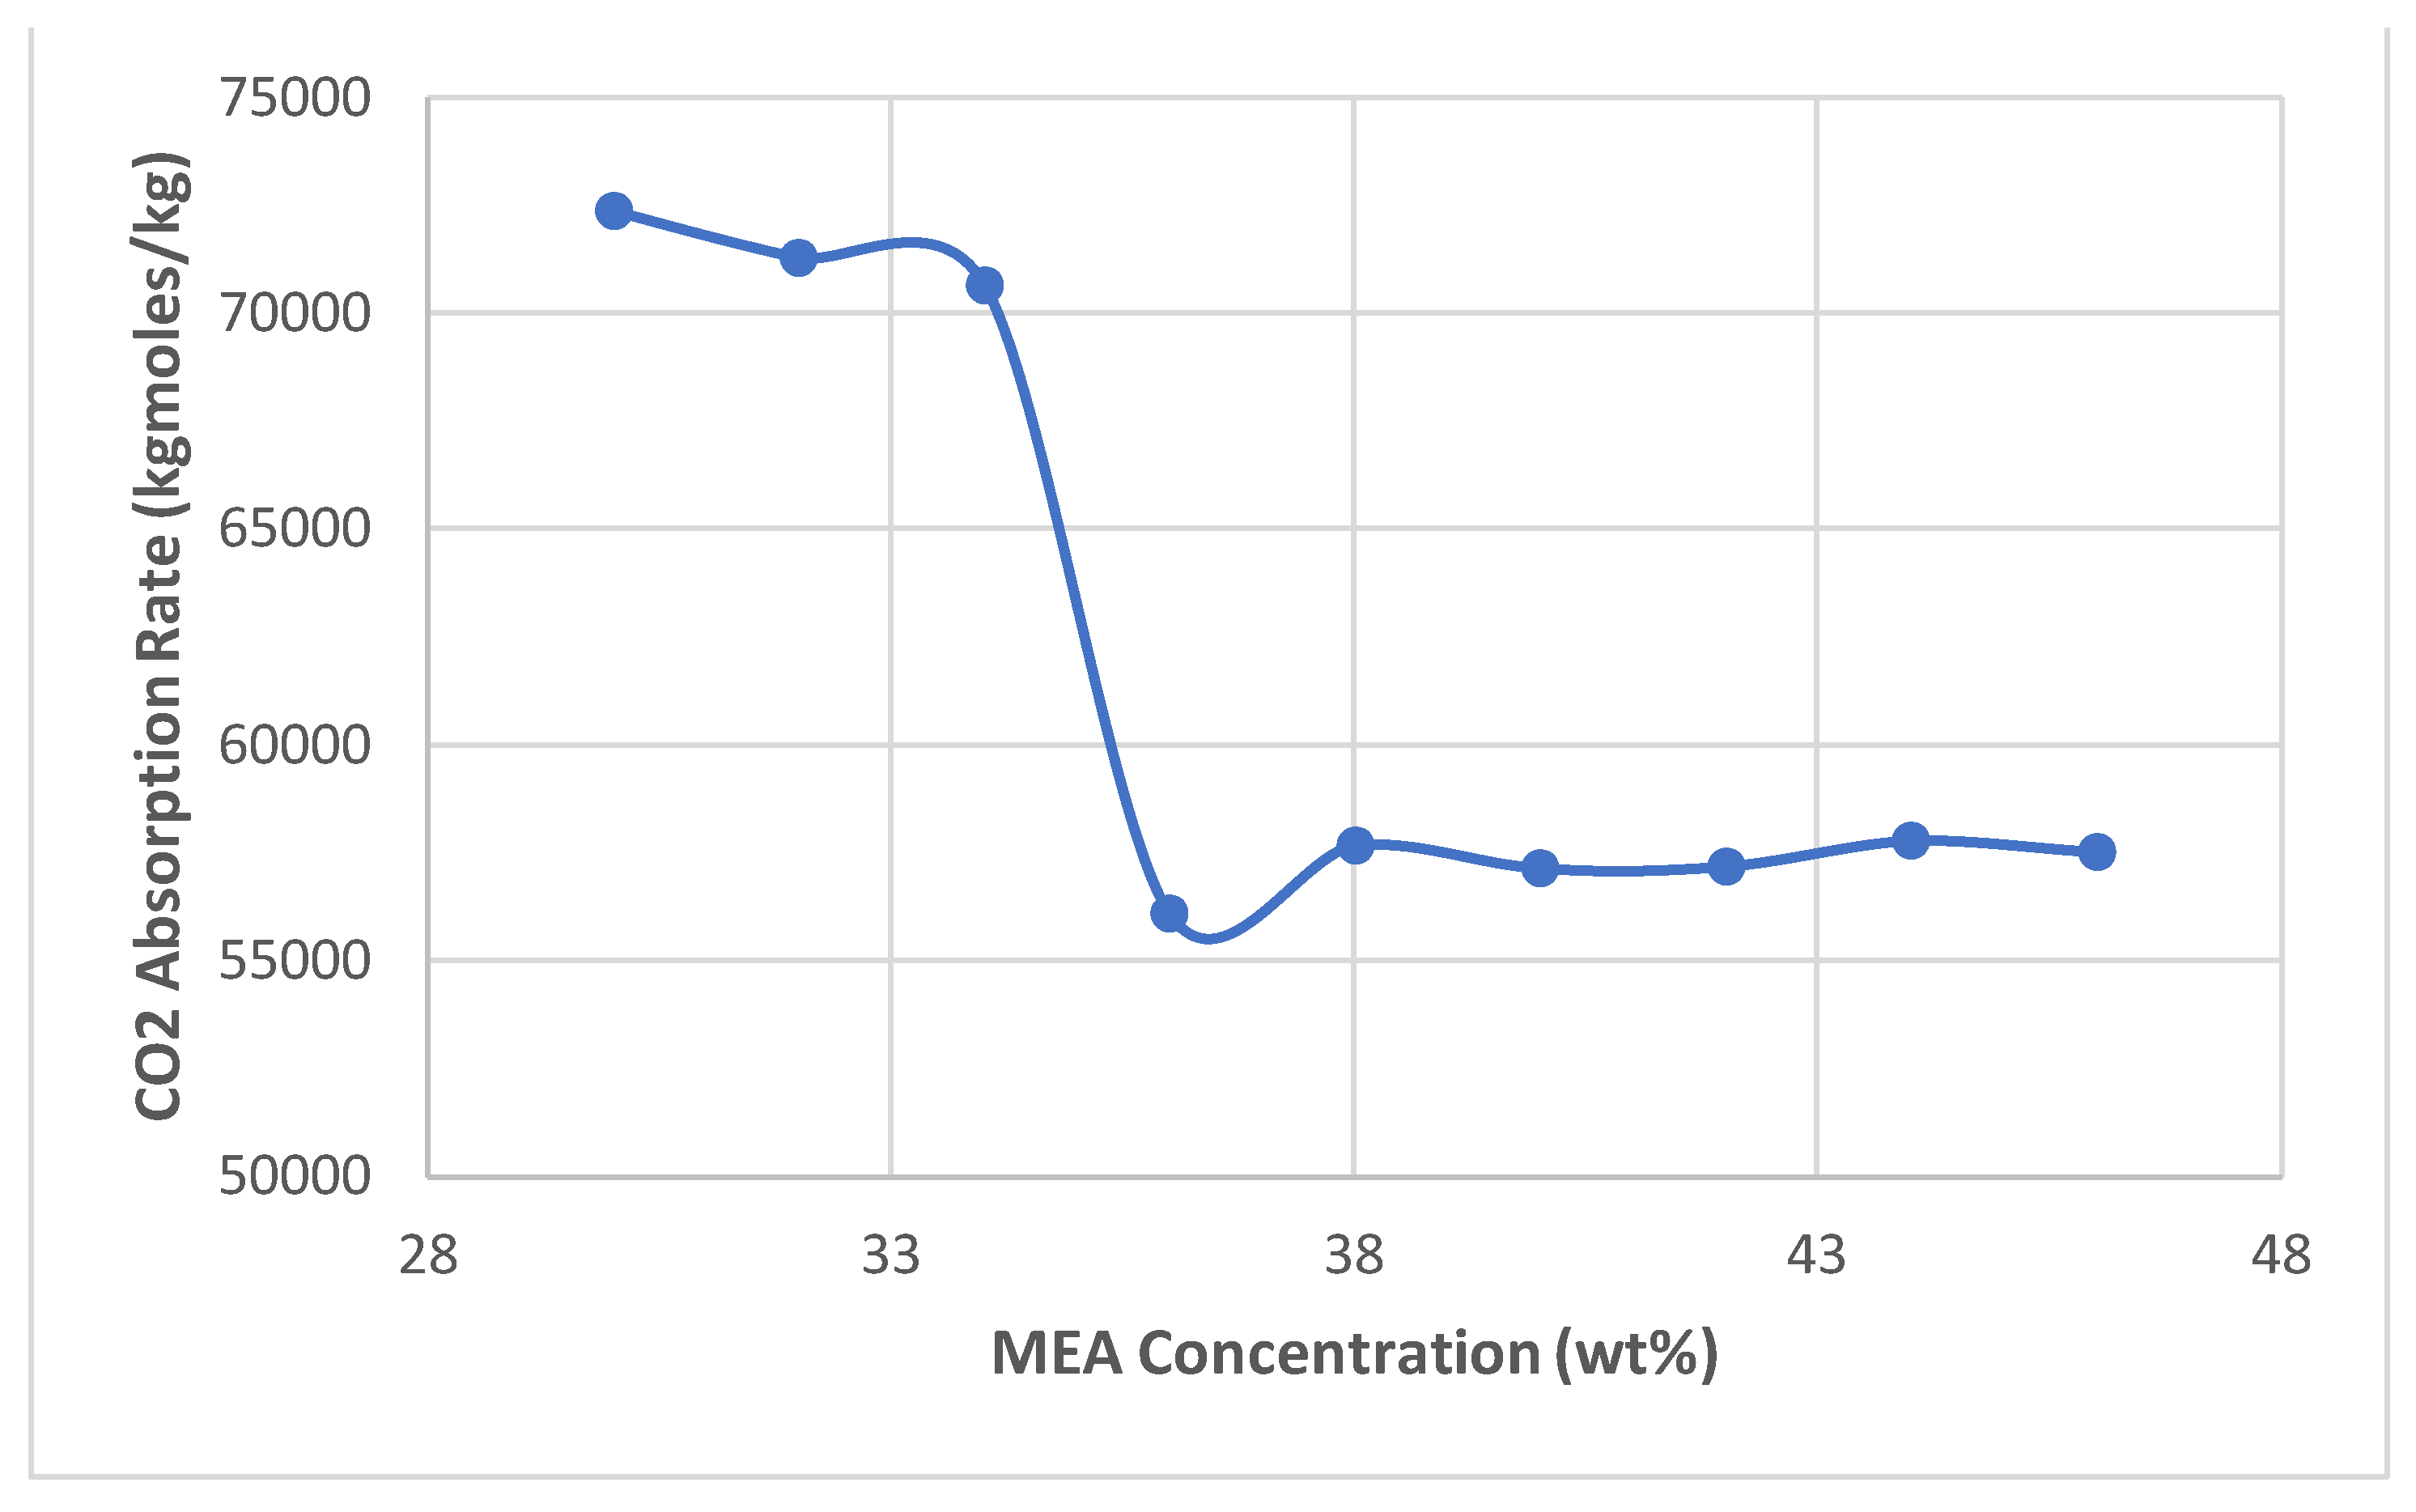
Figure 6.
Graphical results for the effect of MEA concentration on energy consumption.
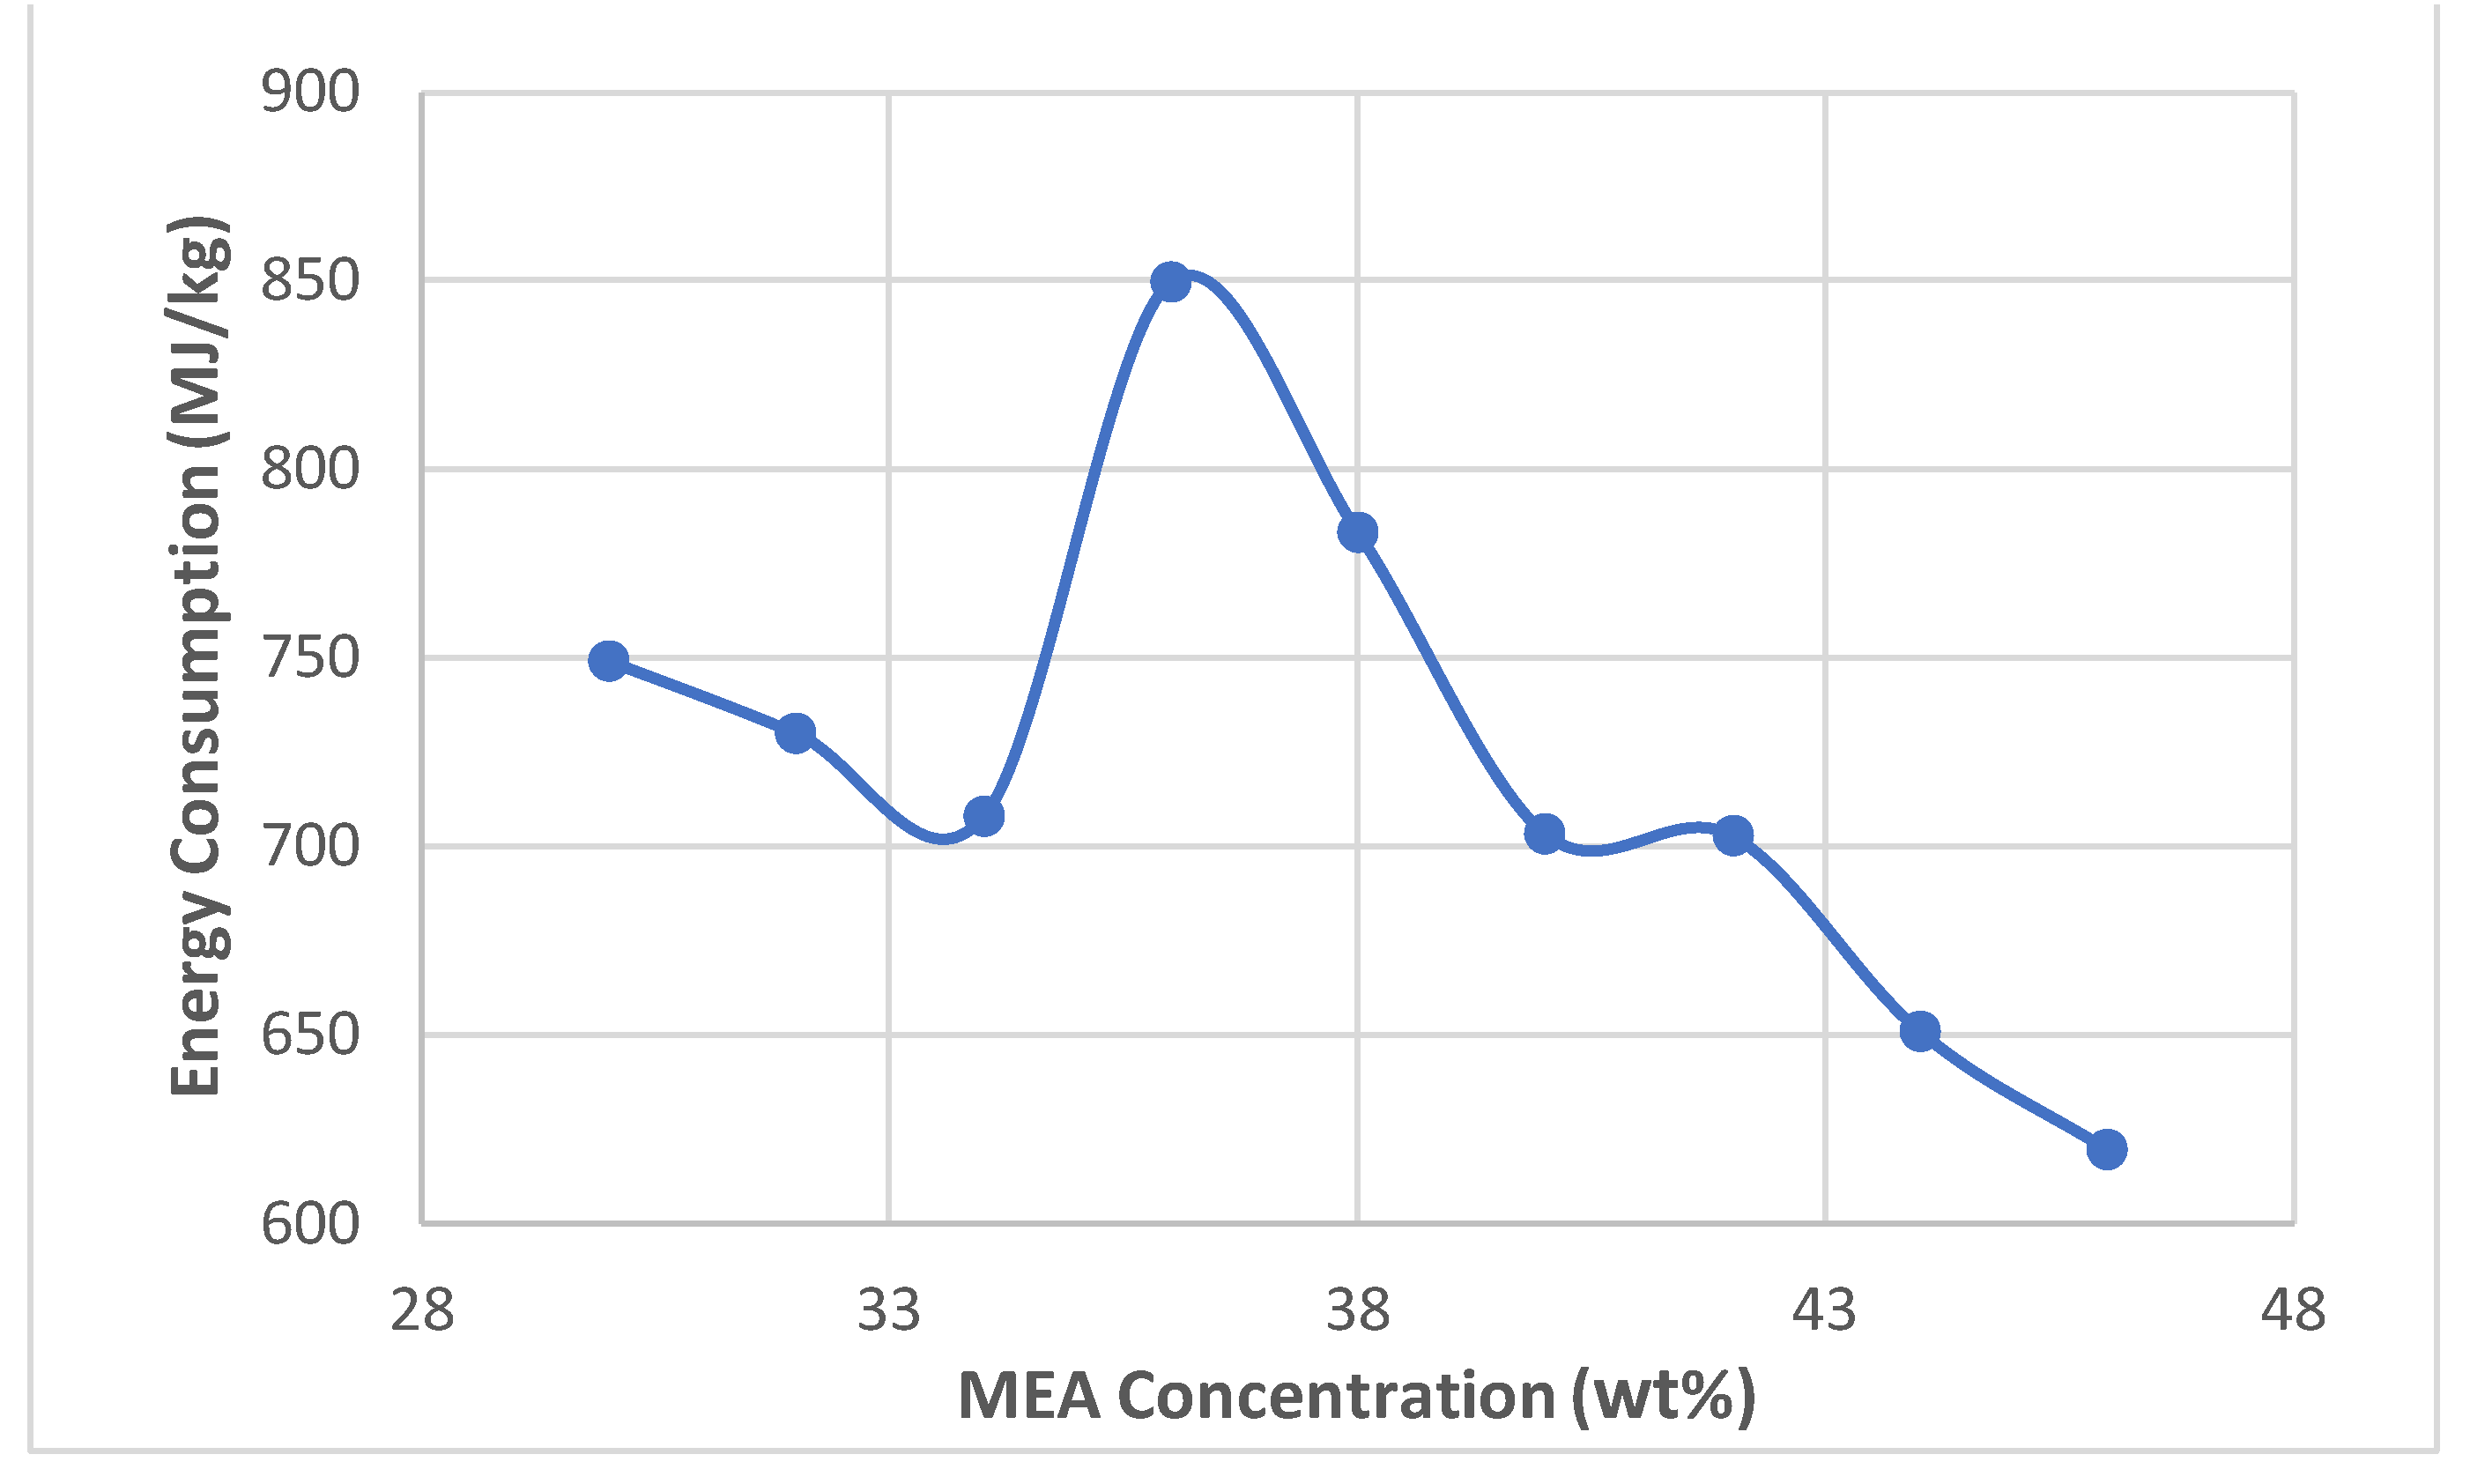
Figure 7.
shows 87% and 90% specific reboiler duty validation with literature data.
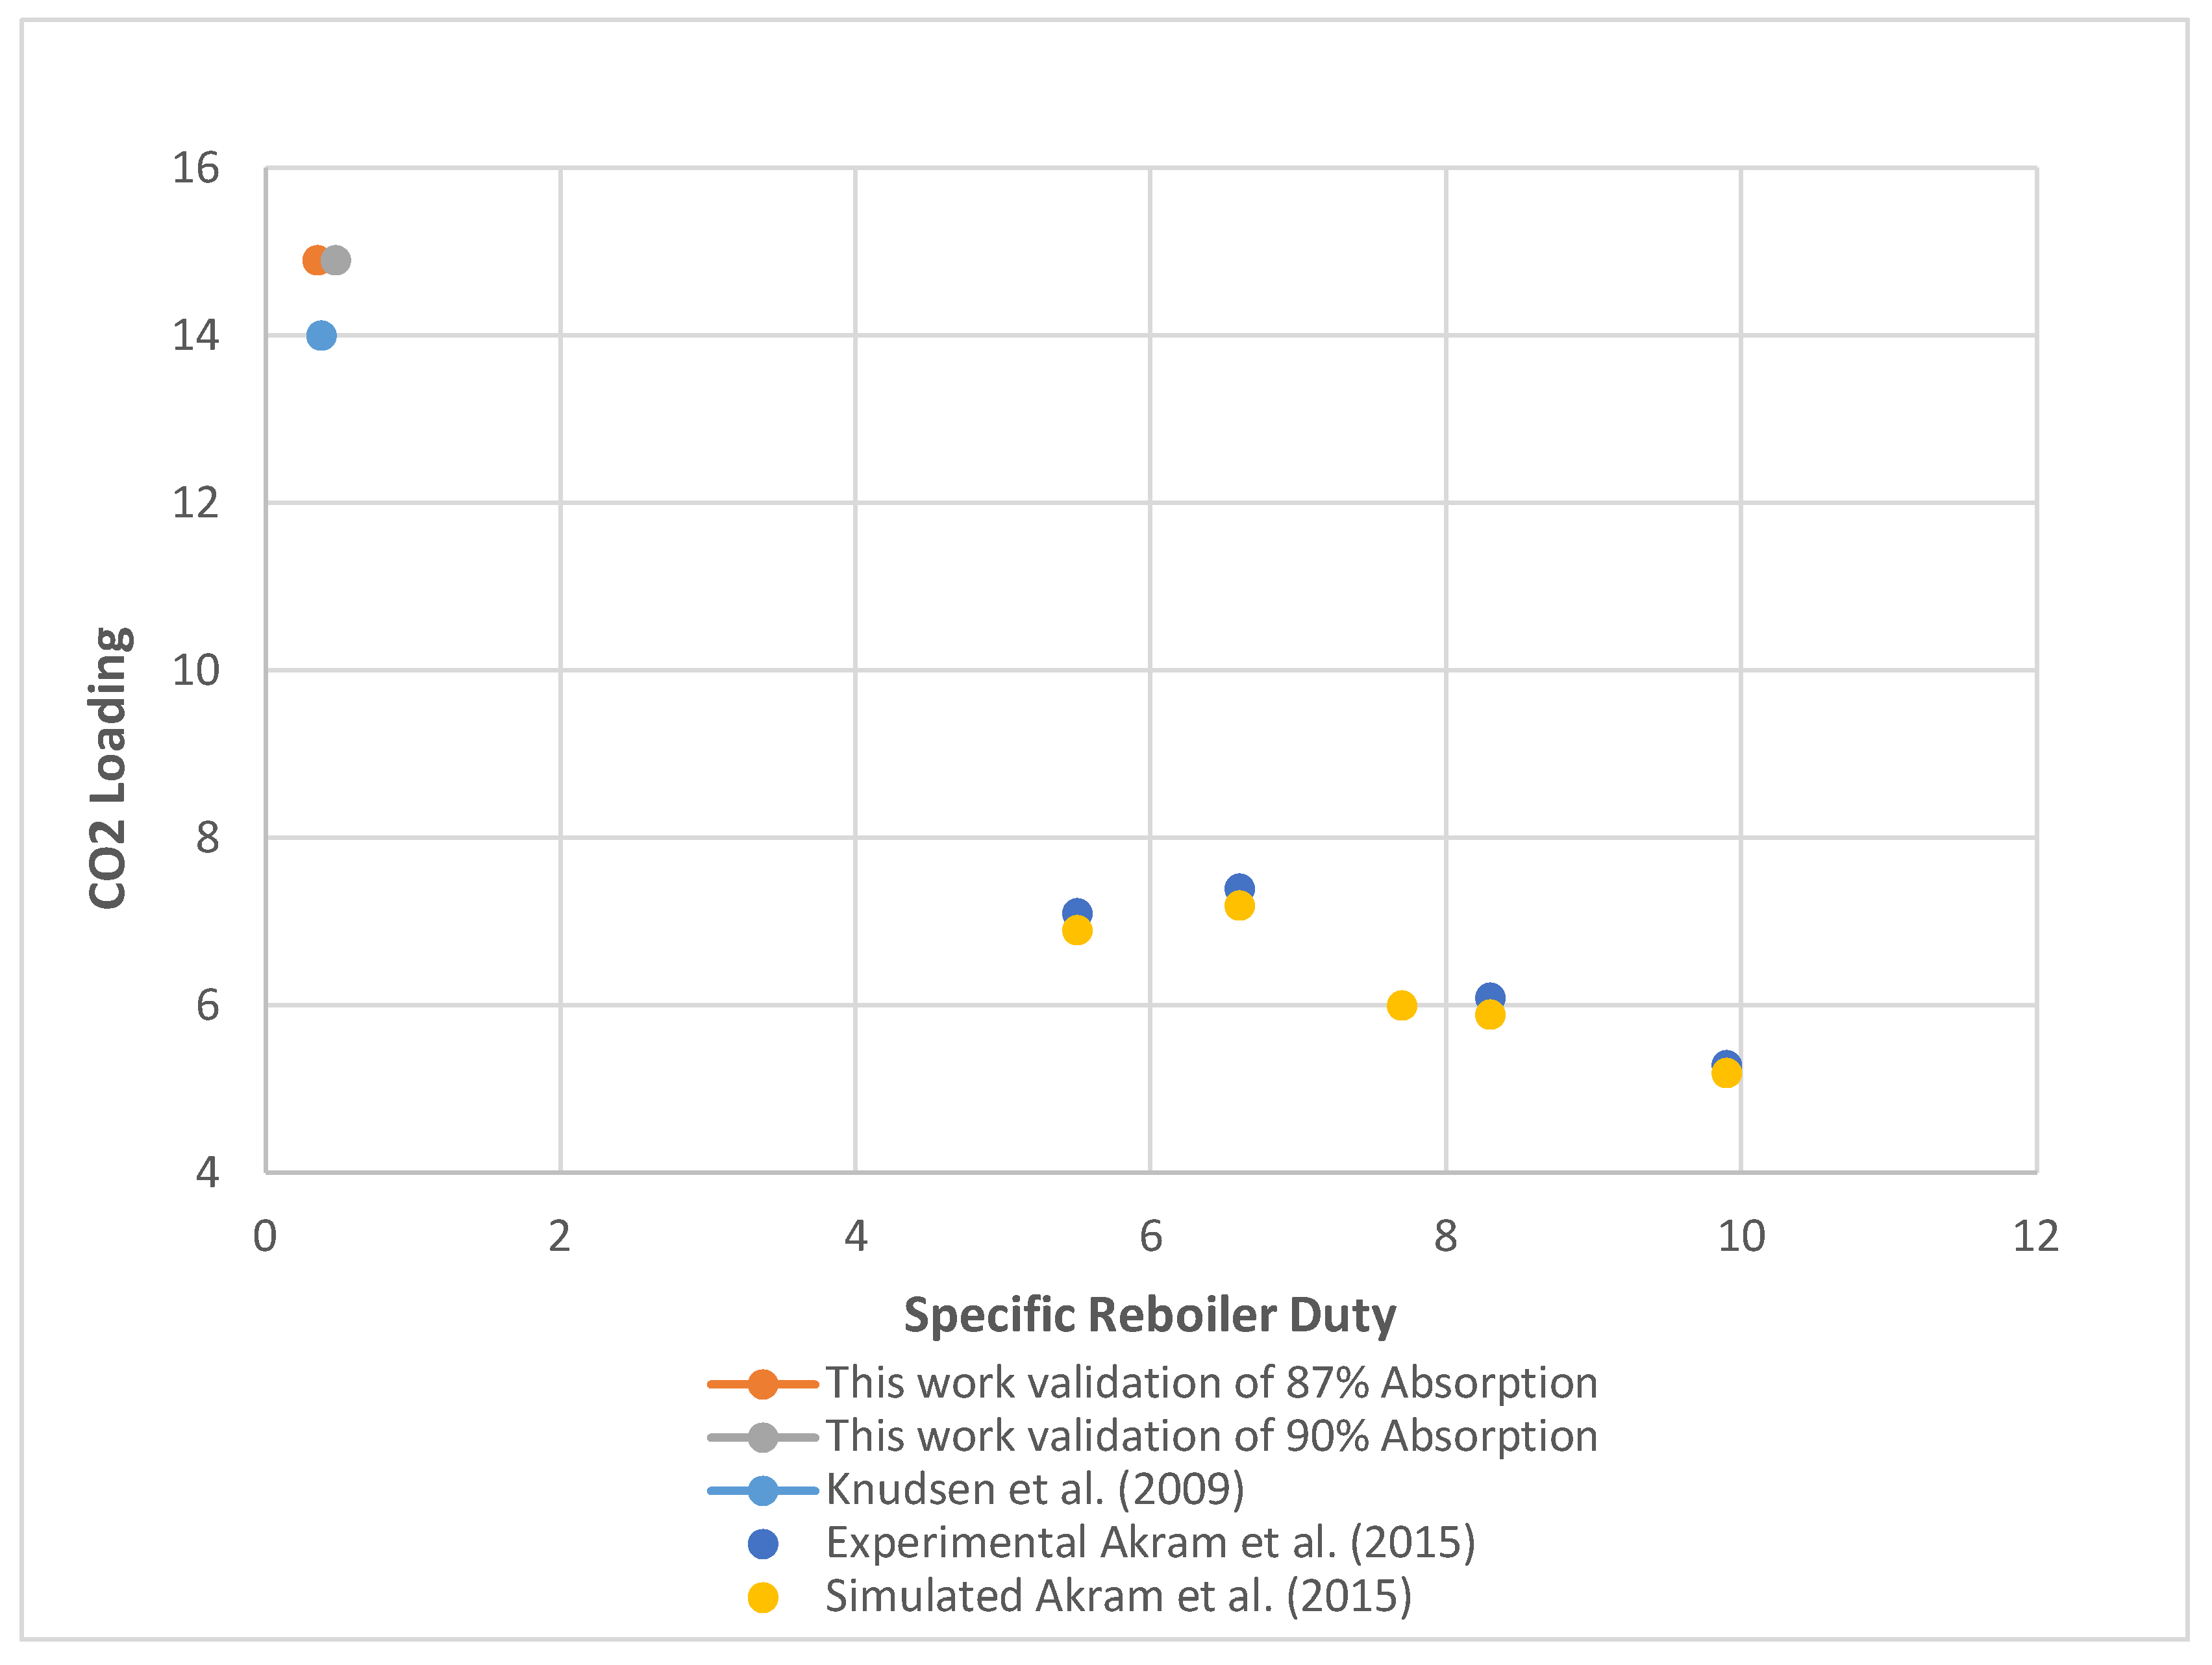
Figure 8.
Graphical results for the effect of temperature on the absorption efficiency of CO2.
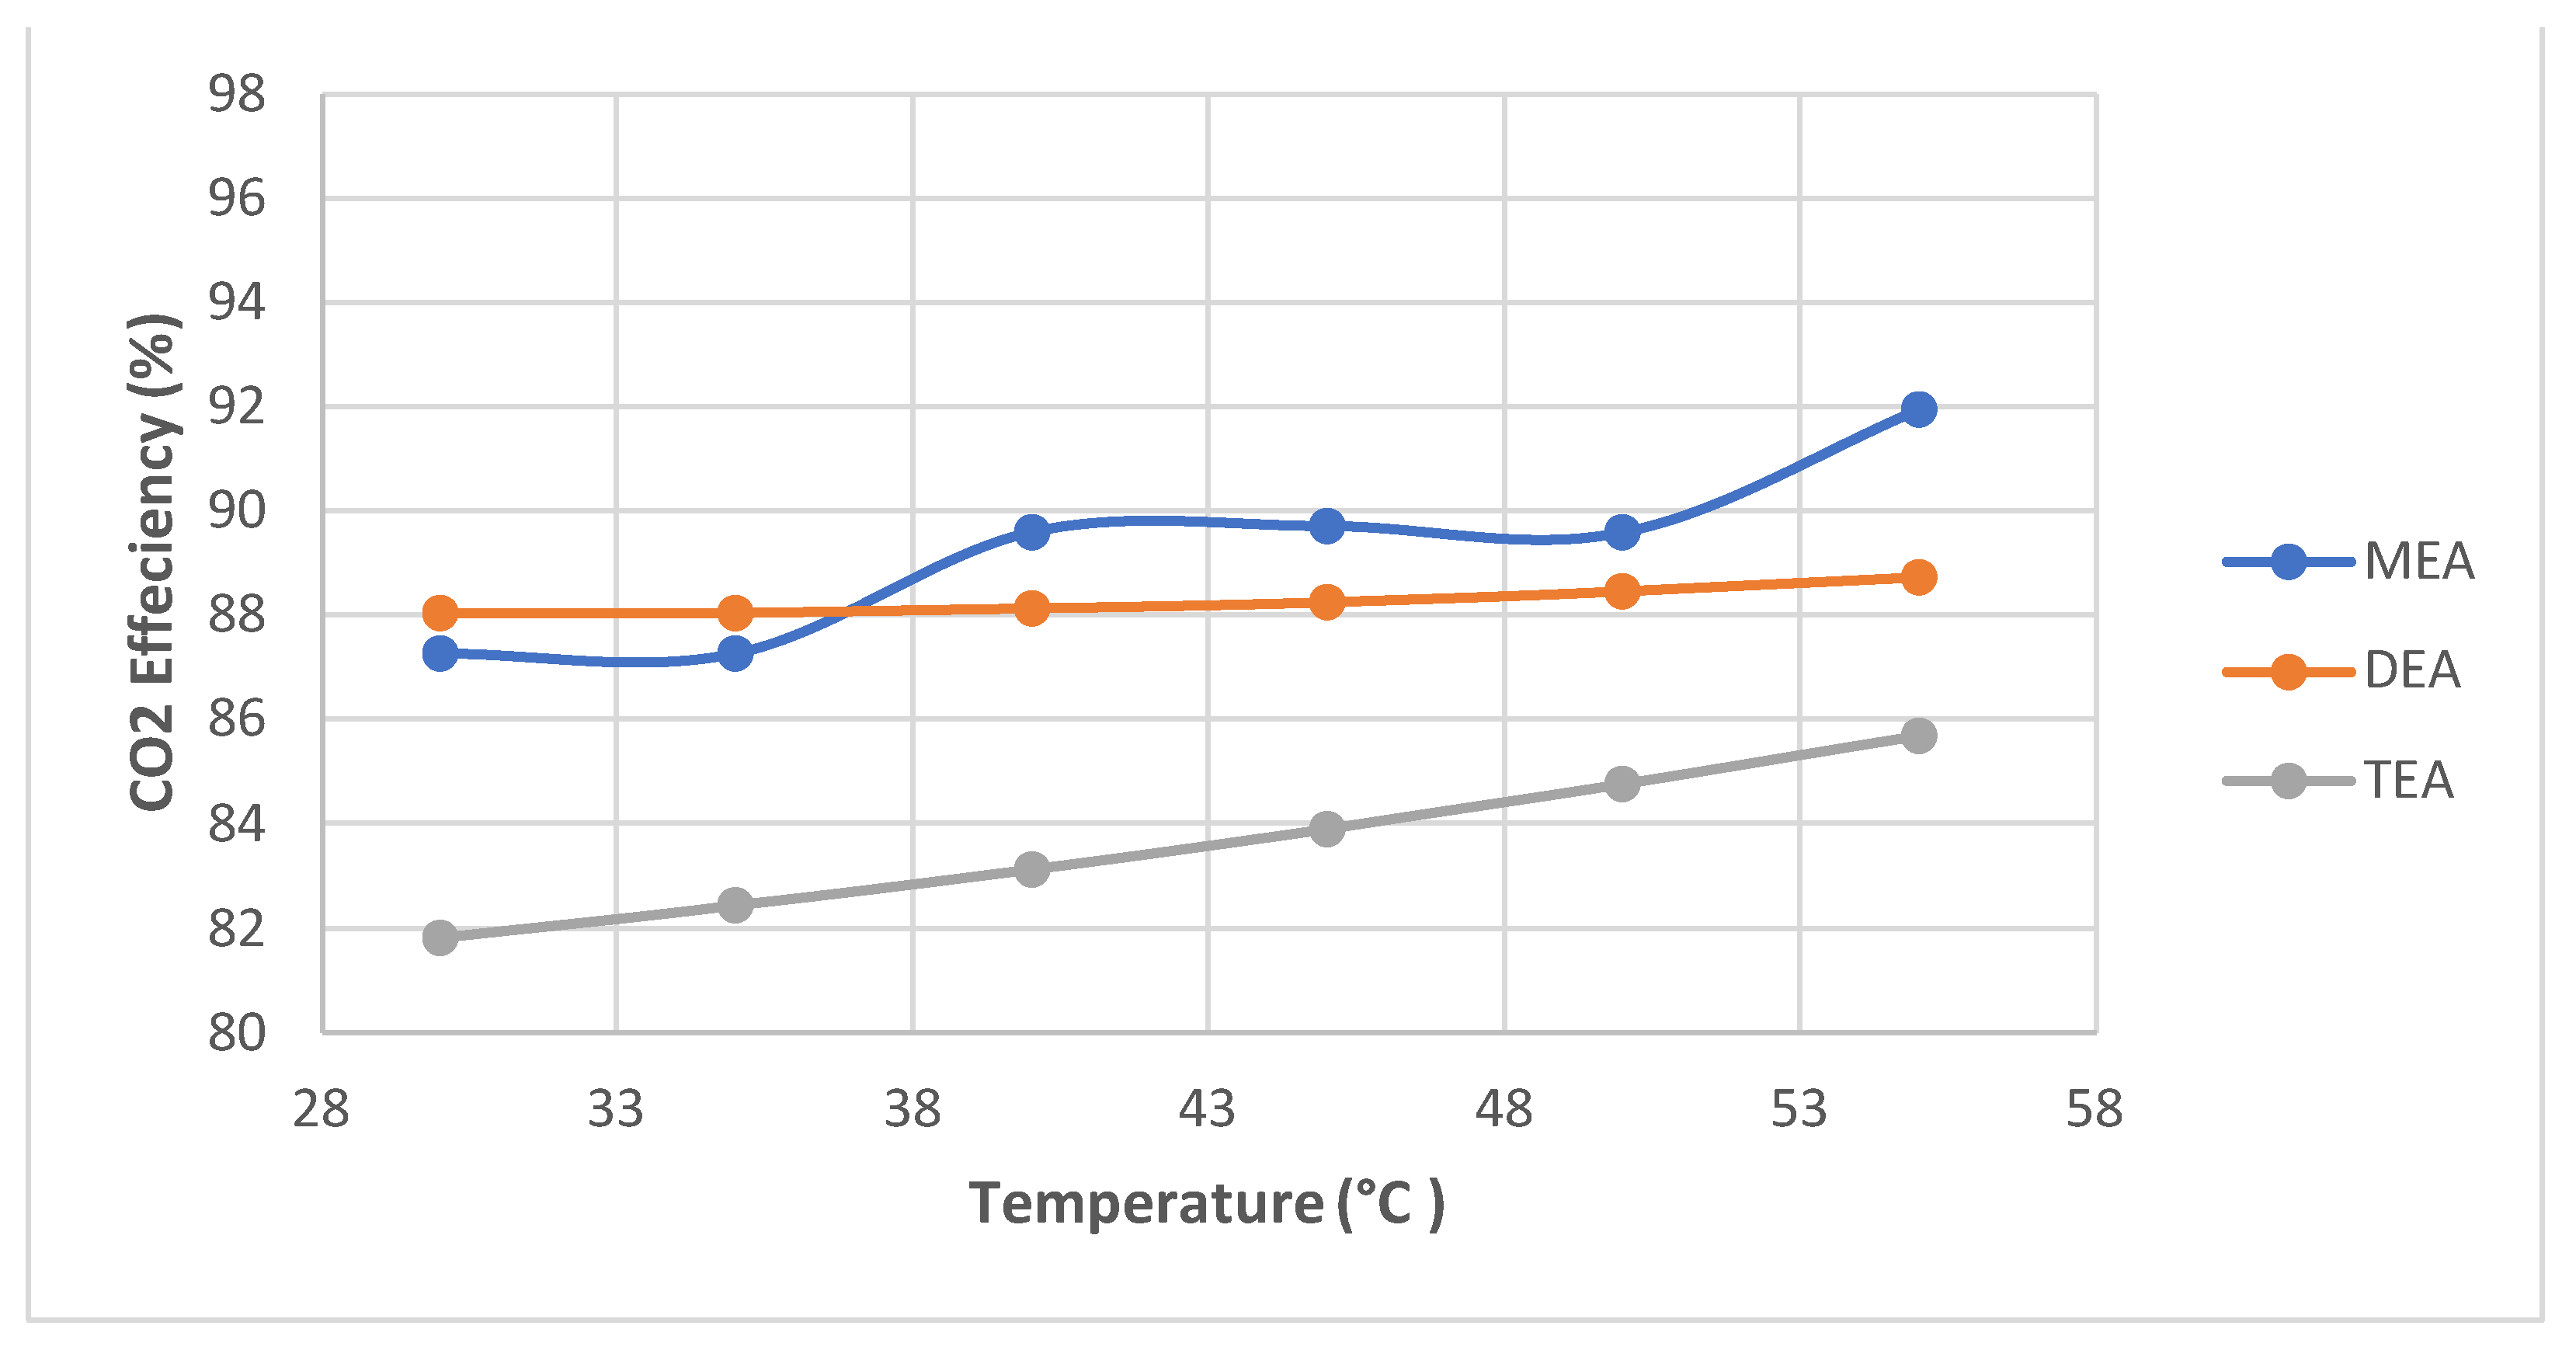
Figure 9.
Graphical results for the effect of temperature on energy consumption.
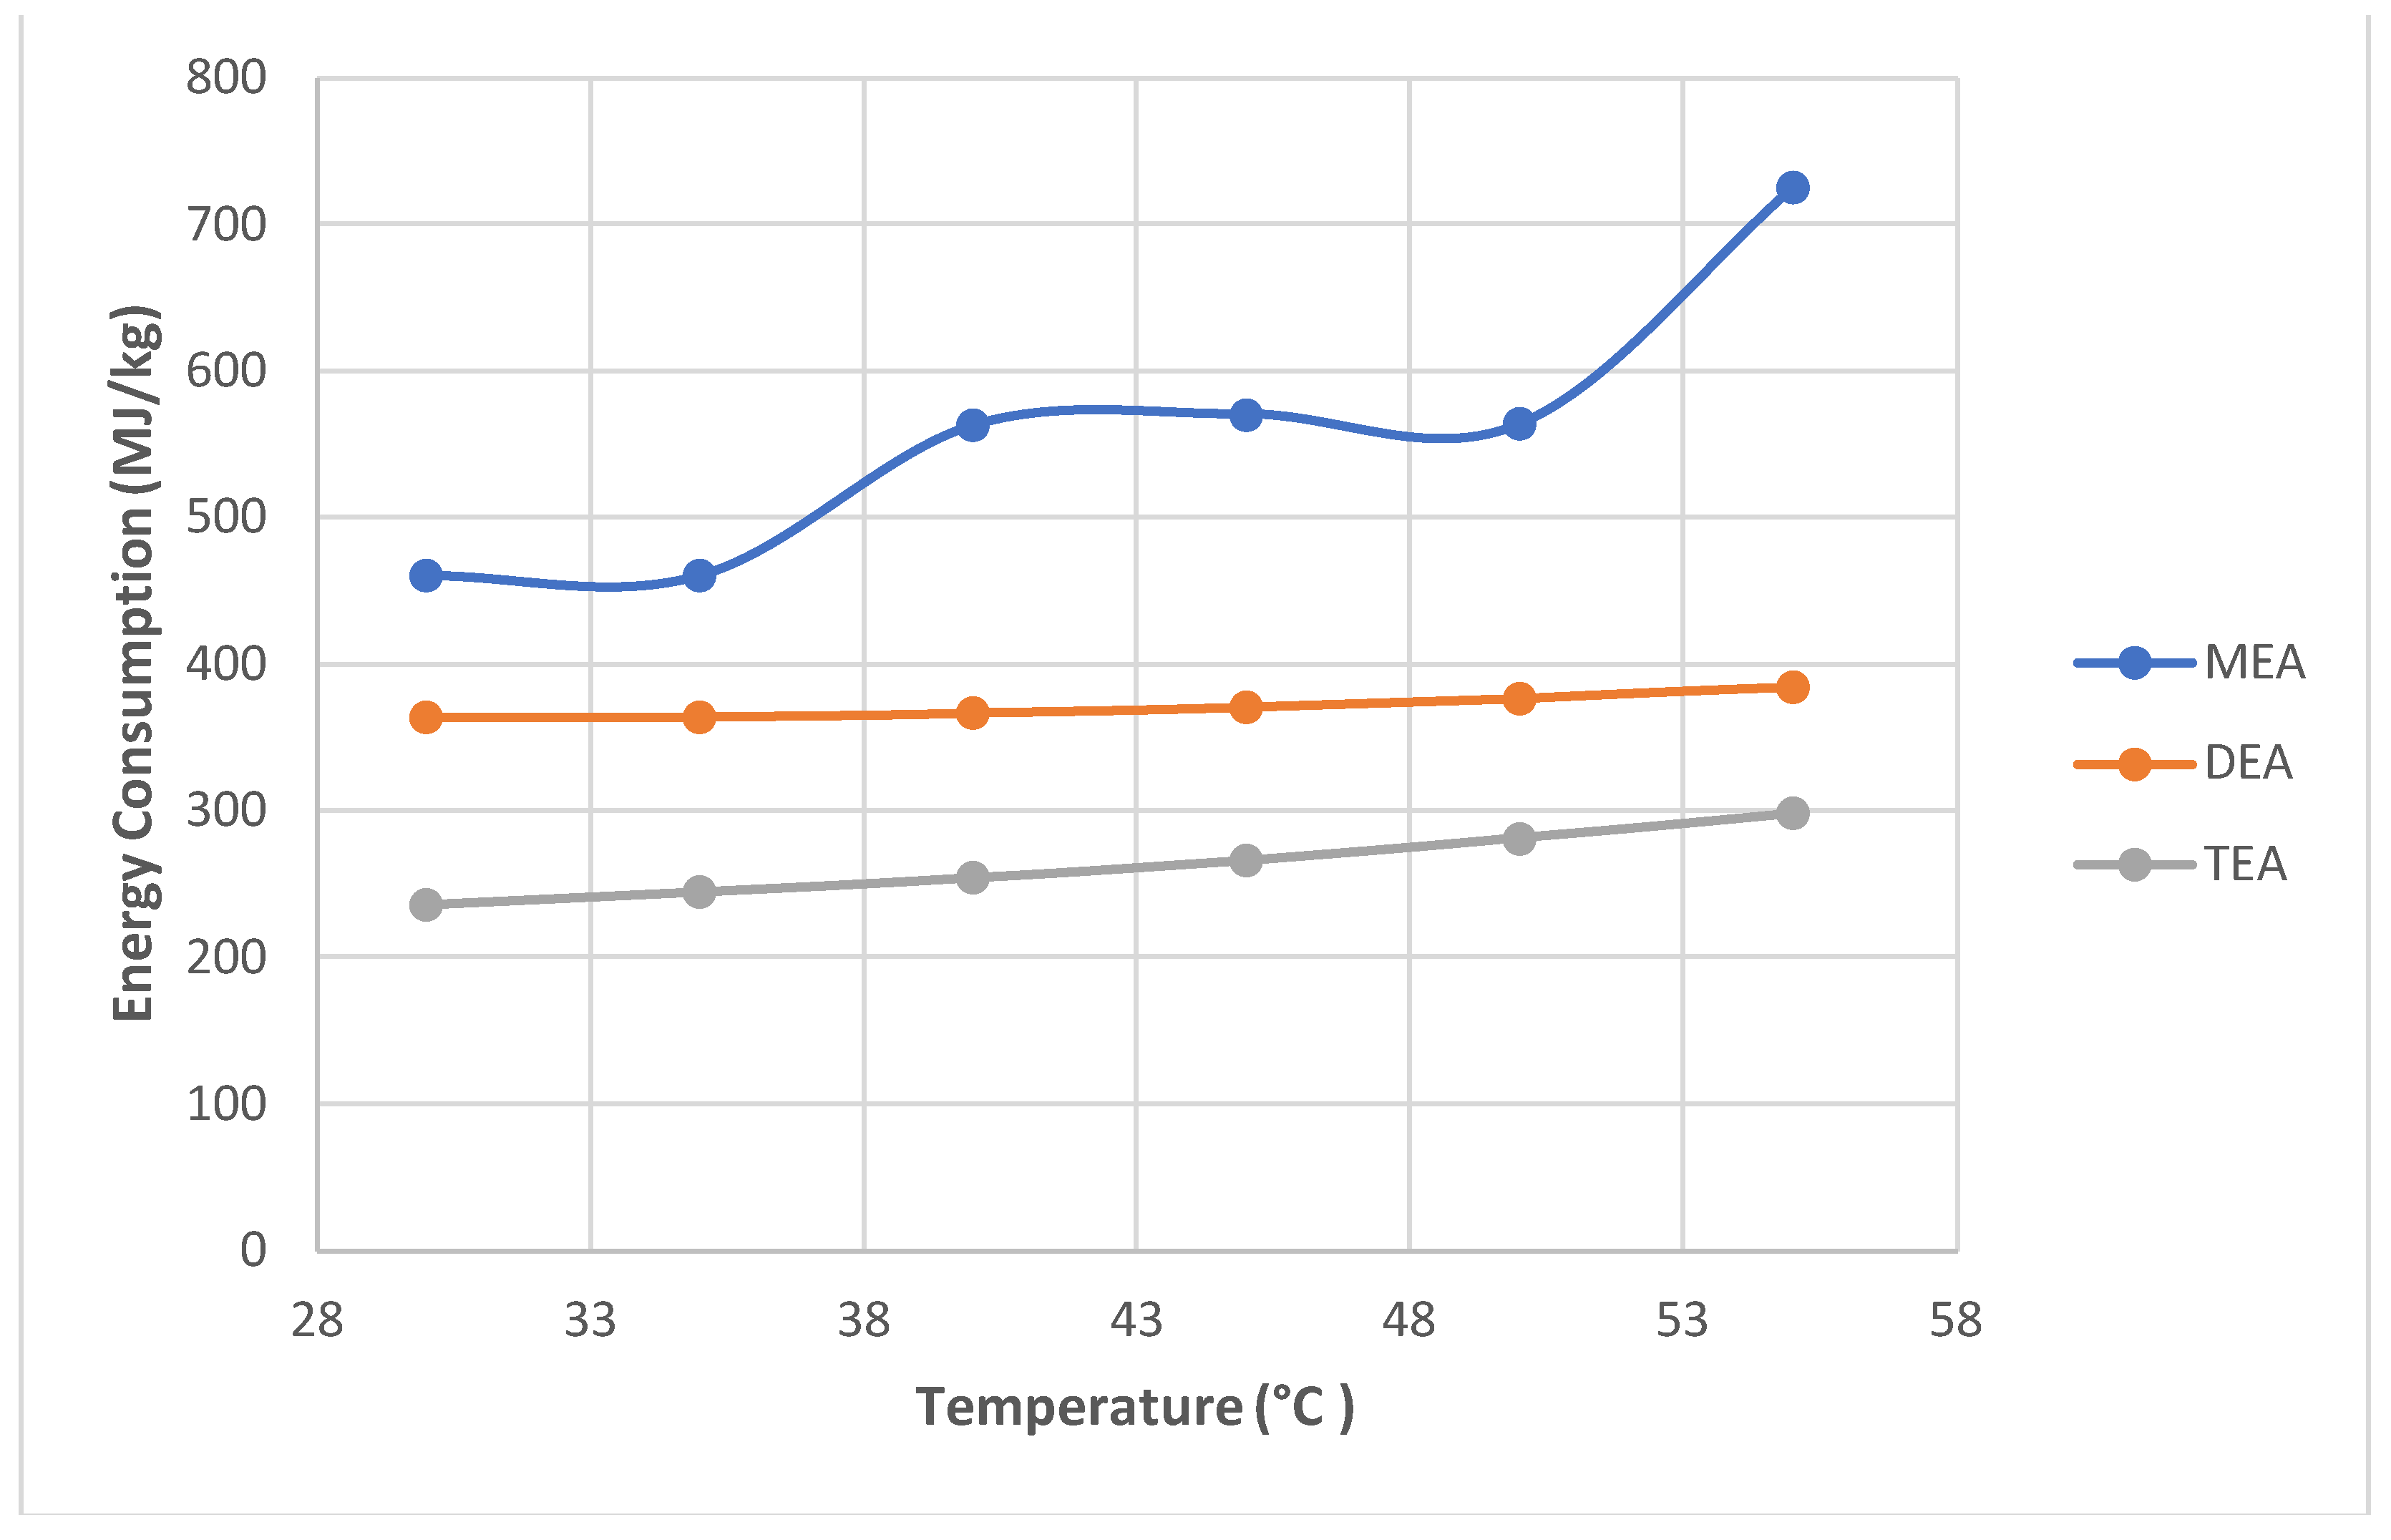
Figure 10.
Graphical results for the effect of pressure on the absorption efficiency of CO2.
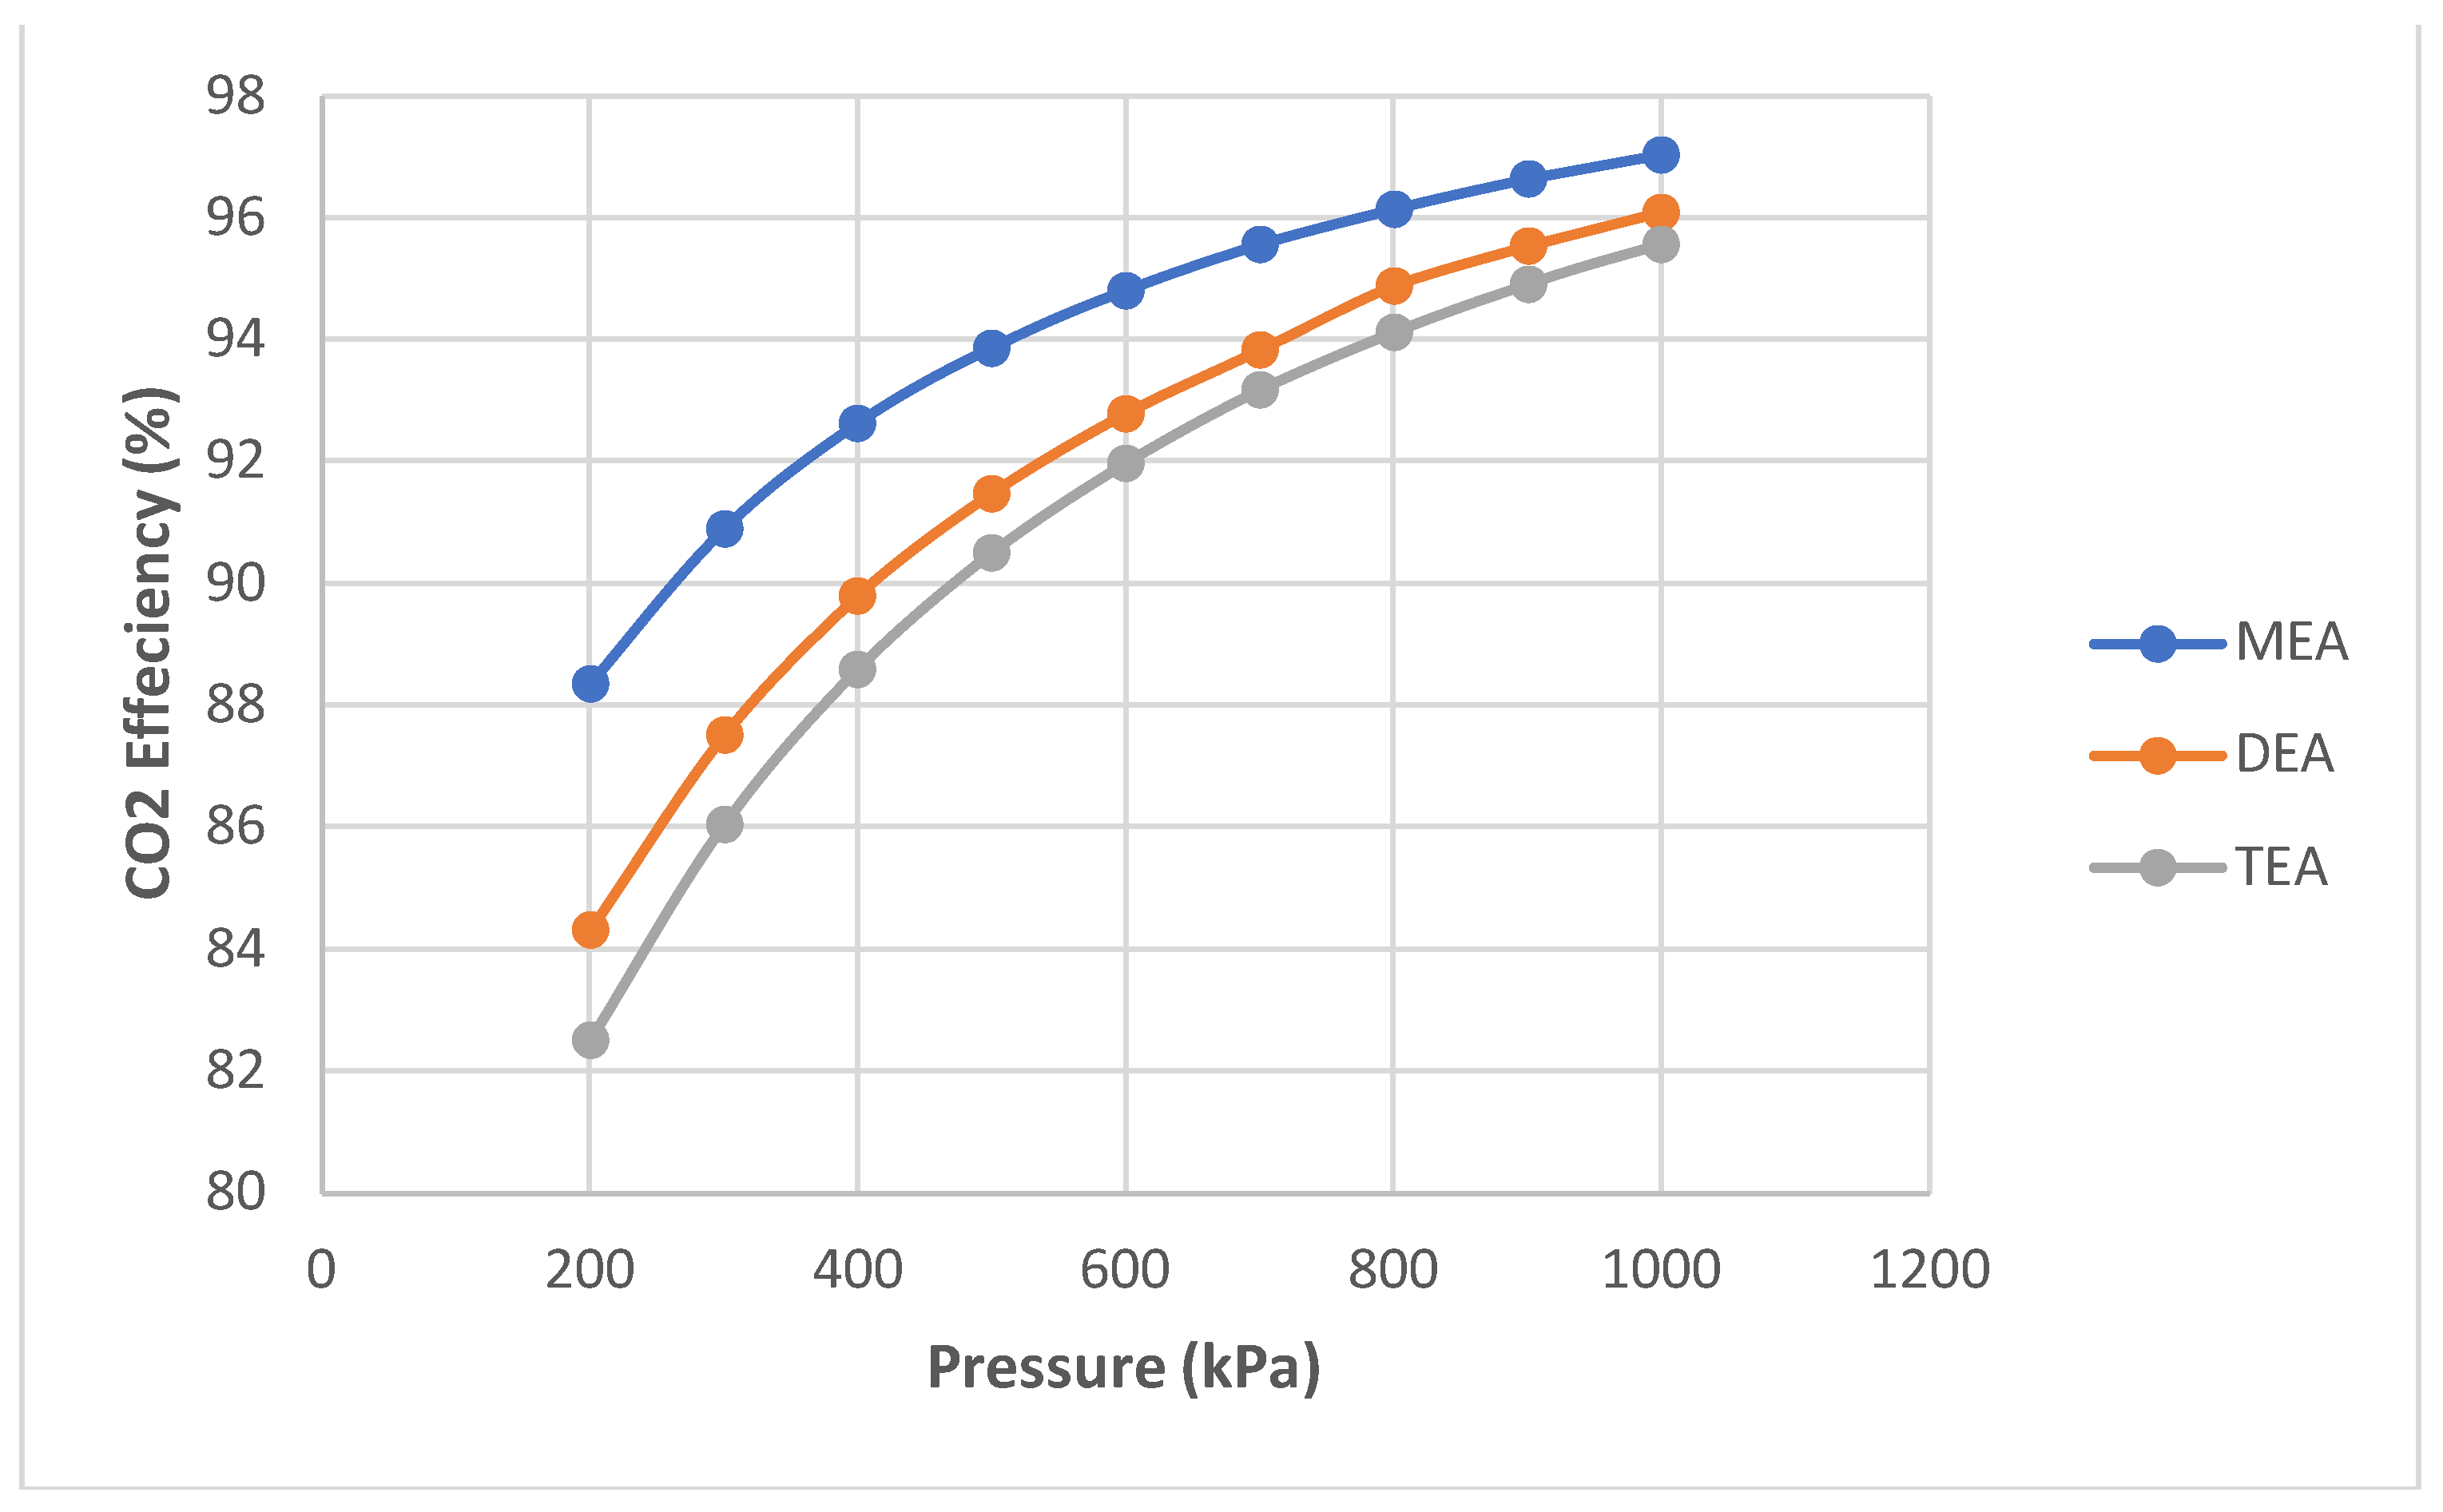
Figure 11.
Graphical results for the effect of pressure on energy consumption.
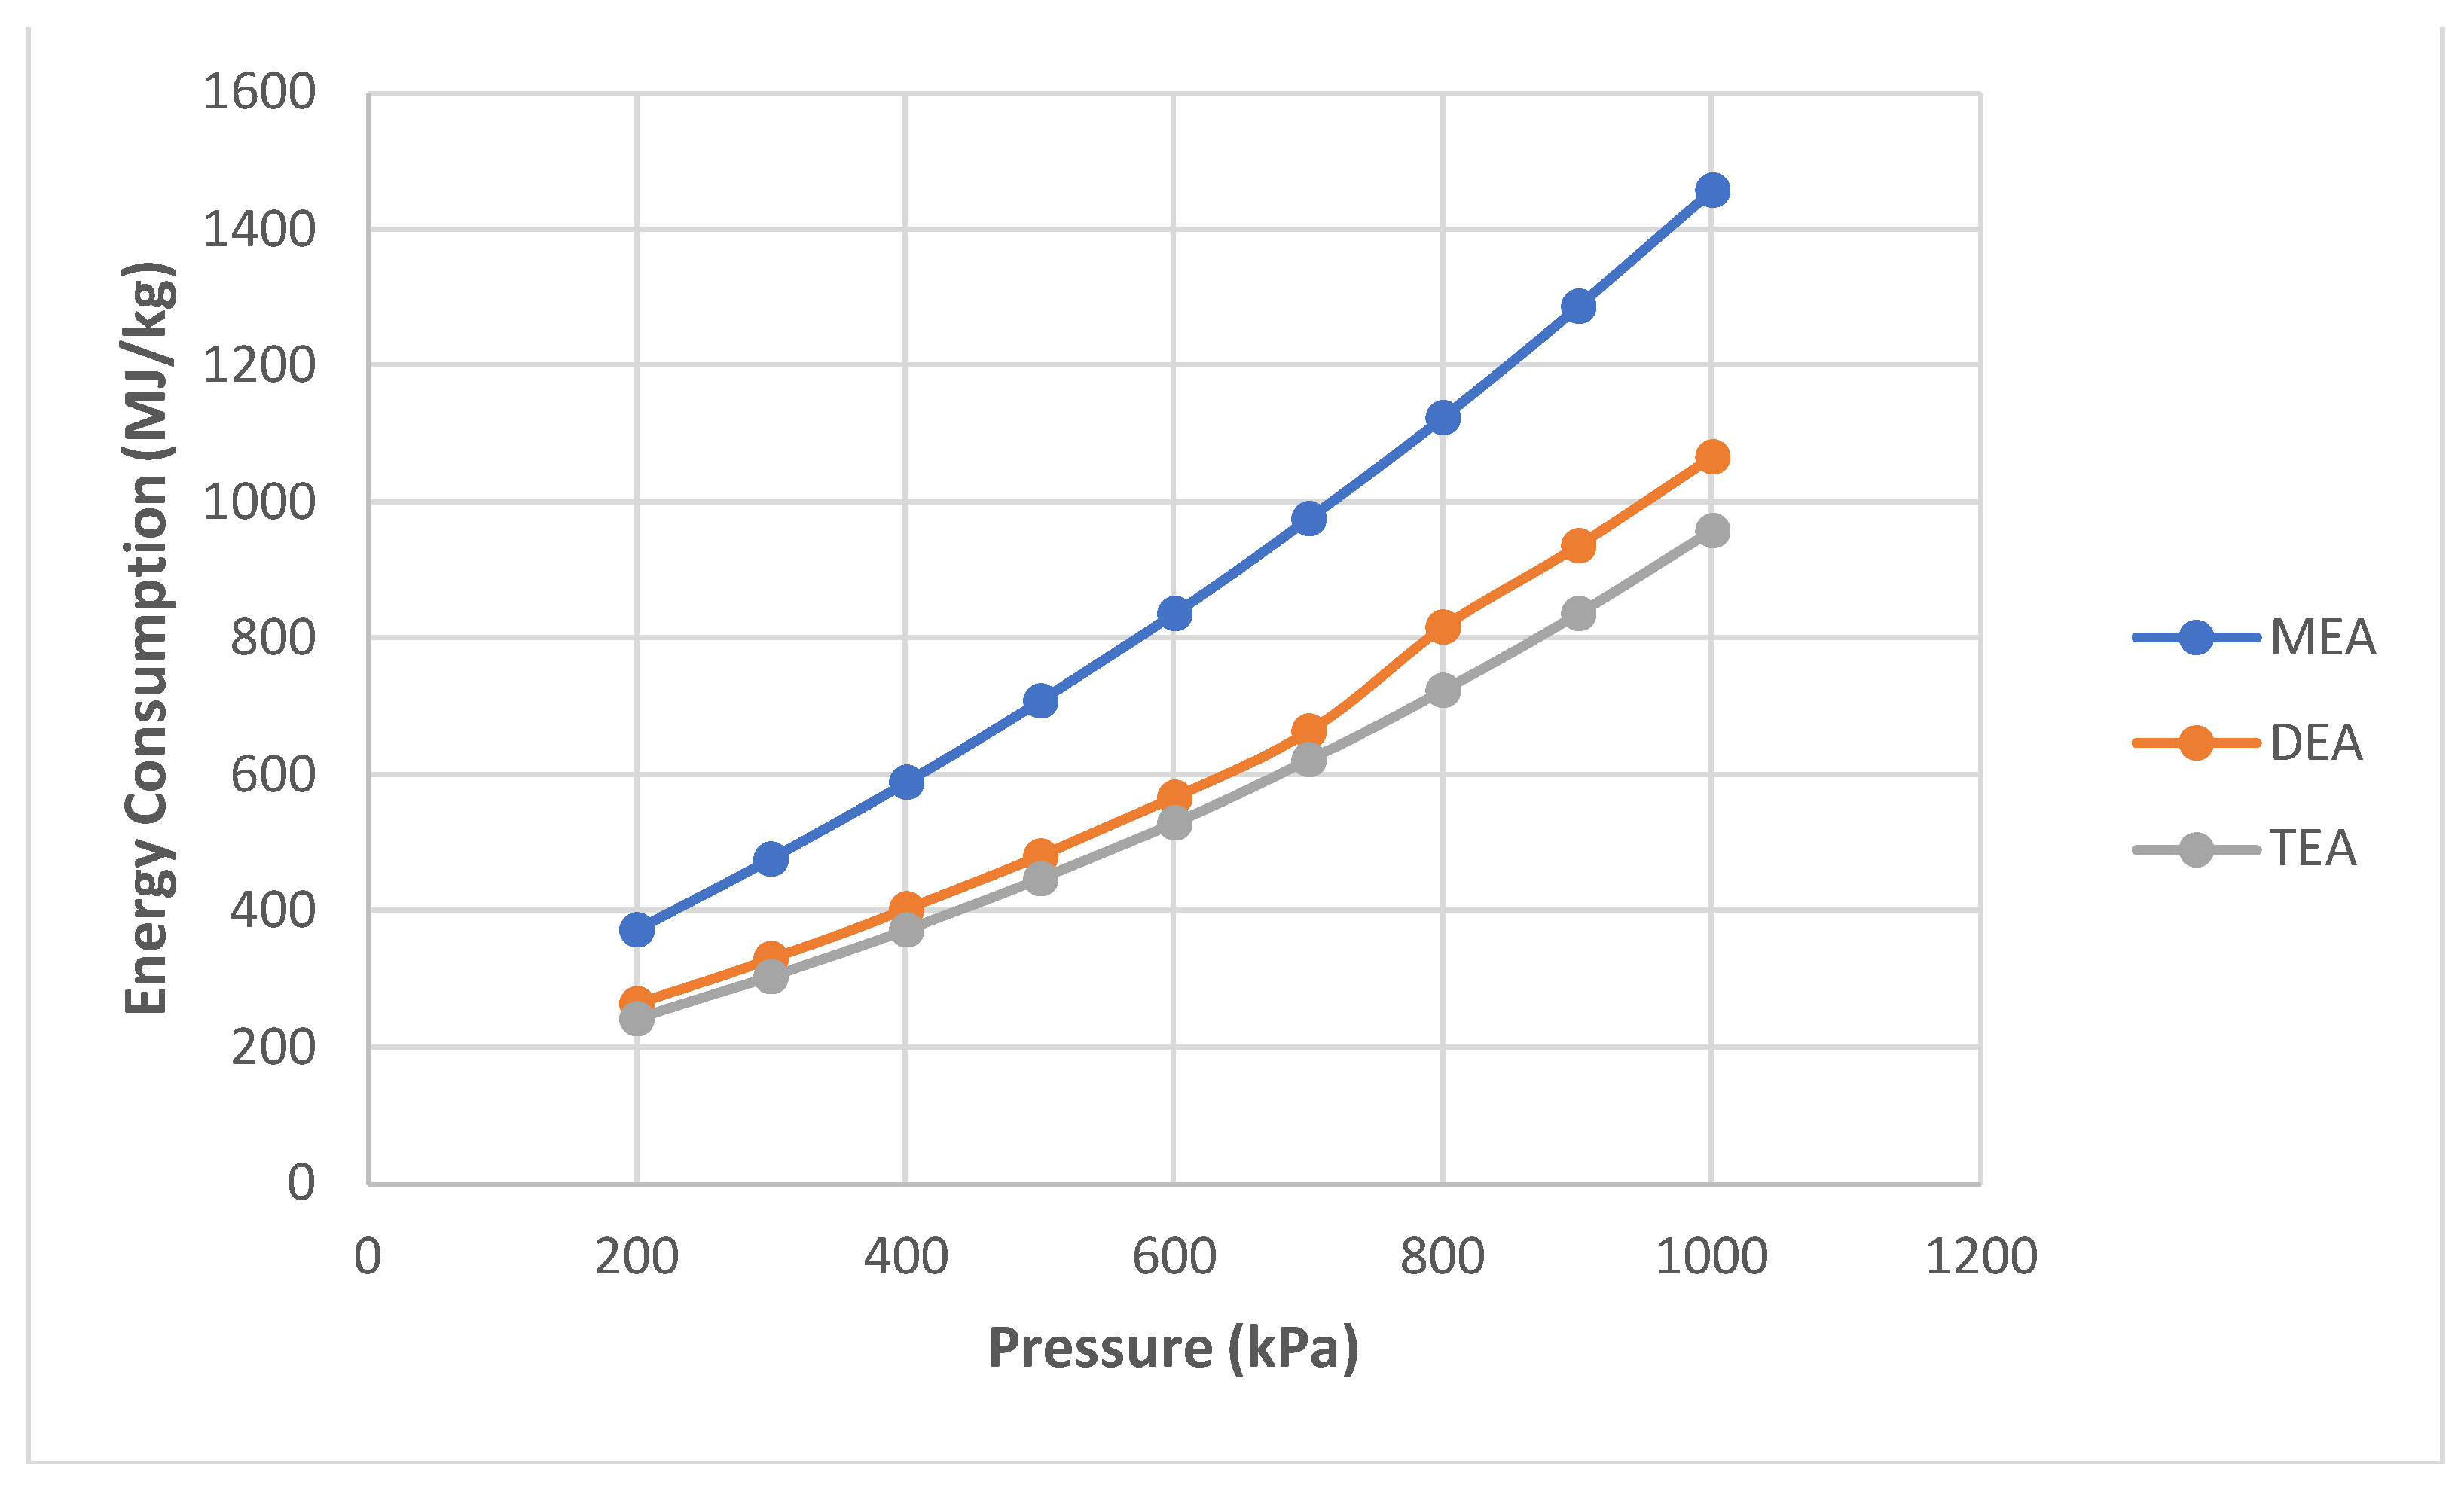

Table 1.
Reaction Kinetic Equations for CO2 Absorption [12].
Table 1.
Reaction Kinetic Equations for CO2 Absorption [12].
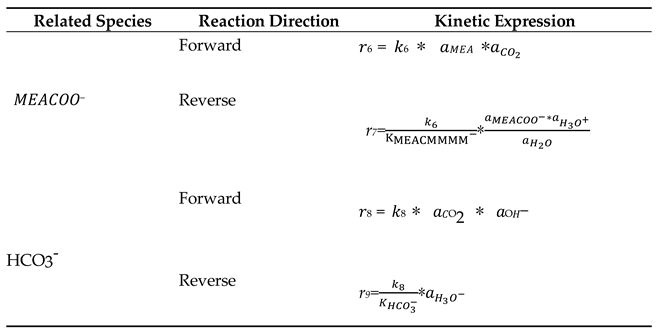
Table 2.
Reaction Kinetic Equations for CO2 Absorption [12].
Table 2.
Reaction Kinetic Equations for CO2 Absorption [12].
| Related Species | Reaction Direction | kj0 (kmol/m3. s) | εj (kJ/gmol) |
|---|---|---|---|
| MEACOO- | Forward | 3.02 × 10¹⁴ | 41.20 |
|
Reverse (Absorption) |
5.52 x 10²³ | 69.05 | |
|
Reverse (Desorption) |
6.56 x 1027 | 95.24 | |
| HC | Forward | 1.33 x 10¹⁷ | 55.38 |
| Reverse | 6.63 x 10¹⁶ | 107.24 | |
| Forward | 3.02 x 10¹⁴ | 41.20 |
Table 3.
Types of processes recommended for this package ([45]).
Table 3.
Types of processes recommended for this package ([45]).
| Acid Gases | CO2, H2S, COS, CS2 |
| Hydrocarbons | CH4, C12 |
| Olefins | C2=, C3=, C4=, C5= |
| Mercaptans | M-Mercaptan, E-Mercaptan |
| Non-Hydrocarbons | H2, N2, O2, CO, H2O |
| Aromatics | C6H6, Toluene, e-C6H6, m-Xylene |
| Acid Gases | CO2, H2S, COS, CS2 |
| Hydrocarbons | CH4, C12 |
| Olefins | C2=, C3=, C4=, C5= |
Table 4.
Limits for adhering to the amine package ([45]).
Table 4.
Limits for adhering to the amine package ([45]).
| Amine Name | Concentration (Weight %) |
Acid Gas Partial Pressure (psia) |
T oF |
|---|---|---|---|
| MEA | 15-20 | 0.00001-300 | 77-260 |
| DEA | 25-35 | 0.00001-300 | 77-260 |
| TEA, MDEA | 35-50 | 0.00001-300 | 77-260 |
| DGADEA/MDEA | 45-65 | 0.00001-300 | 77-260 |
| 35-50 | 0.00001-300 | 77-260 | |
| MEA/MDEA | 35-50 | 0.00001-300 | 77-260 |
Table 5.
Base case specification data.
| Description | Value/Selection |
|---|---|
| Flue gas temperature | 51.1 °C |
| Flue gas pressure | 101.7 kPa |
| Flue gas flowrate | 85000 kmole/h |
| MEA temperature | 40 °C |
| MEA pressure | 101.3 kPa |
| MEA flowrate (1st iteration) | 120,000 kmole/h |
| CO2 in inlet | 14.9 mole-% |
| MEA in inlet (1st iteration) | 30 mass-% |
| Stages in absorber | 10 |
| Temperature of absorber | 40 °C |
| Pressure of absorber | 110 kPa |
| Murphree efficiency in the absorber | 0.25 |
| Pressure of desorber | 190 kPa |
| Reflux ratio of desorber | 0.3 |
| Murphree efficiency in the desorber | 1.0 |
| Temperature of reboiler | 120 °C |
| Properties Package | Amine Package |
Table 6.
Validation data of simulated reaction kinetics against Zhang et al. (2013).
| Reaction Direction | Zhang et al. (2013) kj0 (kmol/m3. s) |
Zhang etal. (2013) εj (kJ/gmol) |
HYSYS Simulation kj0 (kmol/m3. s) |
|---|---|---|---|
| Forward (Absorption) | 3.02 x 10¹⁴ | 41.20 | 3.02 x 10¹⁴ |
| Reverse (Absorption) | 5.52 x 10²³ | 69.05 | 5.52 x 10²³ |
| Forward (Desorption) | 1.33 x 10¹⁷ | 55.38 | 1.33 x 10¹⁷ |
| Reverse (Desorption) | 6.63 x 10¹⁶ | 107.24 | 6.63 x 10¹⁶ |
| Reverse (Desorption) | 6.63 x 10¹⁶ | 107.24 | 6.63 x 10¹⁶ |
Disclaimer/Publisher’s Note: The statements, opinions and data contained in all publications are solely those of the individual author(s) and contributor(s) and not of MDPI and/or the editor(s). MDPI and/or the editor(s) disclaim responsibility for any injury to people or property resulting from any ideas, methods, instructions or products referred to in the content. |
© 2024 by the authors. Licensee MDPI, Basel, Switzerland. This article is an open access article distributed under the terms and conditions of the Creative Commons Attribution (CC BY) license (https://creativecommons.org/licenses/by/4.0/).
Copyright: This open access article is published under a Creative Commons CC BY 4.0 license, which permit the free download, distribution, and reuse, provided that the author and preprint are cited in any reuse.


