1. Introduction
The burning of carbon carriers to generate heat and electricity is an important industrial source of air pollution worldwide. Despite the development of nuclear and alternative energy, thermal power plants that burn fossil fuels (coal, petroleum products, or natural gas) will retain a significant share of the energy balance for a long time [
1]. In this regard, it is of particular interest to reduce CO
2 emissions from the combustion of organic fuels through their capture and subsequent use or storage.
Currently, one of the main strategies for reducing greenhouse gas emissions is setting prices for carbon dioxide emissions, either through quotas or taxes on CO
2. In July 2019, the European Union's Emissions Trading System (EU ETS) increased the price of carbon dioxide from 4.38 euros to 30 euros per tonne of CO
2 equivalent. This is the first and largest carbon market in the world, which regulates greenhouse gas emissions from large companies in the energy and industrial sectors [
2]. This applies to 31 countries (the European Union, Iceland, Norway and Liechtenstein), and, moreover, other countries such as China, South Korea, Canada, Japan, New Zealand, Switzerland and the United States have established their own national or regional systems within the EU ETS framework [
3,
4].
The Financial Times reported that, as of 2023, the price of carbon dioxide emission quotas in Europe exceeded €100 per ton for the first time. The cost of quotas traded under the EU's Emissions Trading System (ETS) has reached a record €101 per tonne, while prices have increased fivefold over the past three years. The recent rise in the price of quotas is due to the fact that, against the backdrop of rising natural gas prices in Europe, electricity producers have been forced to switch to coal, which is a cheaper but also dirtier fuel, since burning coal releases approximately twice as much CO2 as using gas. In this regard, upgrading existing technologies and developing new approaches to capturing CO2 from flue gases remains a pressing issue.
Important factors to consider when choosing a capture system include the concentration of CO
2 in the gas stream, the pressure of the gas and the type of fuel (solid or gaseous). The industry has implemented several systems for reducing CO
2 emissions, including pre-combustion capture, post-combustion and oxygen treatment [
5].
Carbon dioxide capture methods can be divided into physical (physical absorption, adsorption and membrane method) and chemical (chemical absorption, catalytic hydrogenation and enzymatic extraction). The most common post-combustion CO
2 capture is monoethanolamine (MEA) absorption [
6]. The MEA absorption technology is currently the only commercially used technology [
7,
8]. However, the capital and operating capex of absorbing MUA are high [
9].
Membrane gas separation has become an attractive capture technology, which has advantages over the alternative capture method, namely: simplicity, compactness, ease of scaling, compatibility in integrated systems, low energy consumption, environmental friendliness, technological flexibility and the possibility of operation exclusively using electricity. The main problem regarding the application of membrane technology for the recovery of CO2 from flue gas is the low pressure of the feed stream, which does not allow for the generation of a high driving force for the process. The compression of flue gas streams is economically impractical due to the very high flow rates involved (about hundreds of m3/s); therefore, the only solution is to apply a vacuum, sweeping, or both in the permeate side.
In the paper [
10] one-stage schemes for capturing CO
2 from flue gases of a coal-fired thermal power plant are considered when implementing two options for creating the driving force of the mass transfer process with an equal pressure drop: compression of the initial flue gas stream and pumping of the permeate stream. The efficiency of the vacuum circuit is shown. The authors' calculations showed that the total energy consumption is reduced by 45%, and the optimal vacuum value is 0.22 bar, while a lower permeate pressure is impractical. The authors also compared two one-stage schemes with different flow arrangements in a membrane module. The calculation criterion was capture of 2.1% CO
2 in the retentate. To achieve this criterion, it was found that when the module is operating in counter-current mode, the required membrane area is reduced by 40%, and energy consumption is reduced by 28%. In addition, the counter-current mode allows to achieve 40.6% of the CO
2 content in permeate, and in the cross-flow mode - 28.9%. The calculations were carried out in relation to a membrane with a CO
2 permeability of 1000 GPU.
In [
11], an economic assessment of the CO
2 capture process was carried out for membranes with different CO
2/N
2 selectivity (50, 150, and 450) for three driving force embodiments: vacuum scheme, compression of the initial flue gas flow and their combination. Calculations have shown that for membranes with a CO
2 permeability of ~1000 GPU and a CO
2/N
2 selectivity of < 25, the use of a vacuum scheme or its combination with compression of the supplied flow is economically justified. For membranes with a higher permeability to CO
2, it is preferable to use only a vacuum scheme.
In [
12], a two-stage separation was considered with various options for organizing flows in a membrane module to achieve 95% CO
2 with an capture of 50 to 90%. It was found that the permeate supply scheme of the first stage to the second stage is more energy efficient, but at the same time a larger membrane area is needed. As for the supply of retentate to the second stage, the total required membrane area is smaller, but energy consumption has increased due to increased pressure to provide the necessary driving force for CO
2 transfer.
With regard to the membranes used in this field, a membrane with a lightweight transport was proposed in [
13], i.e., a polymer with a "carrier component" embedded in the polymer structure. The polyvinylamine-based membrane (PVAm) contains an amino group that, in the presence of water vapor, provides mass transfer of CO
2 through the membrane in the form of bicarbonate ion (HCO
3-) (it is assumed that a reversible chemical reaction occurs during the transfer of CO
2 through the membrane). The authors show that the effectiveness of such a membrane increases upon contact with water. Water vapor was used as a purge when supplied to the first stage of membrane separation along with flue gases. This membrane material is undoubtedly of interest, but currently it is not commercially available and is insufficiently characterized in terms of permeability for many components of gas mixtures, including related flue gas components (SOx, NOx and H
2S). An assessment of the potential of using such membranes for CO
2 capture is presented in [
14]. The properties of these materials and membranes usually strongly depend on the activity of water vapor. This feature complicates the calculation of the separation process and makes it less likely to predict the characteristics of the process. Therefore, such types of membranes were not considered in this work. In addition, due to the need for millions of square meters of membrane, industrial scale membrane production is required to handle typical flue gas flows.
The problem of reducing CO
2 emissions from flue gases has been studied in depth for a long time. MTR has achieved great success in this area by developing several generations of Polaris membranes that have successfully passed laboratory and pilot tests. Pilot plants using these membranes have been developed and launched. However, no work has been found in the literature on membrane CO
2 capture from flue gases, taking into account the presence of water vapor. Water vapors in flue gases are contained in an equivalent amount with CO
2, and their presence can affect the mass transfer of carbon dioxide due to the high permeability of water vapor in polymer membranes by diluting the CO
2 stream in permeate, reducing its partial pressure and increasing the driving force of the separation process. We conducted such a study earlier [
15], where the presence of water vapor in flue gases was taken into account when modeling the membrane process of CO
2 capture using the example of a wide range of commercially produced polymer gas separation membranes. The dependences of the required membrane area, the concentration of CO
2 in permeate and retentate were obtained with varying permeate pressure in the range from 0.2 to 0.5 bar in one-stage step separation using the example of a membrane module operating in a cross-flow mode. Based on the simulation results, promising polymer materials such as PPO, PDMS, and the Polaris (Gen-2) membrane were identified for the development of schemes for membrane CO
2 capture from the flue gas of thermal power plants to achieve a total recovery rate of ≥ 80% of the initial stream.
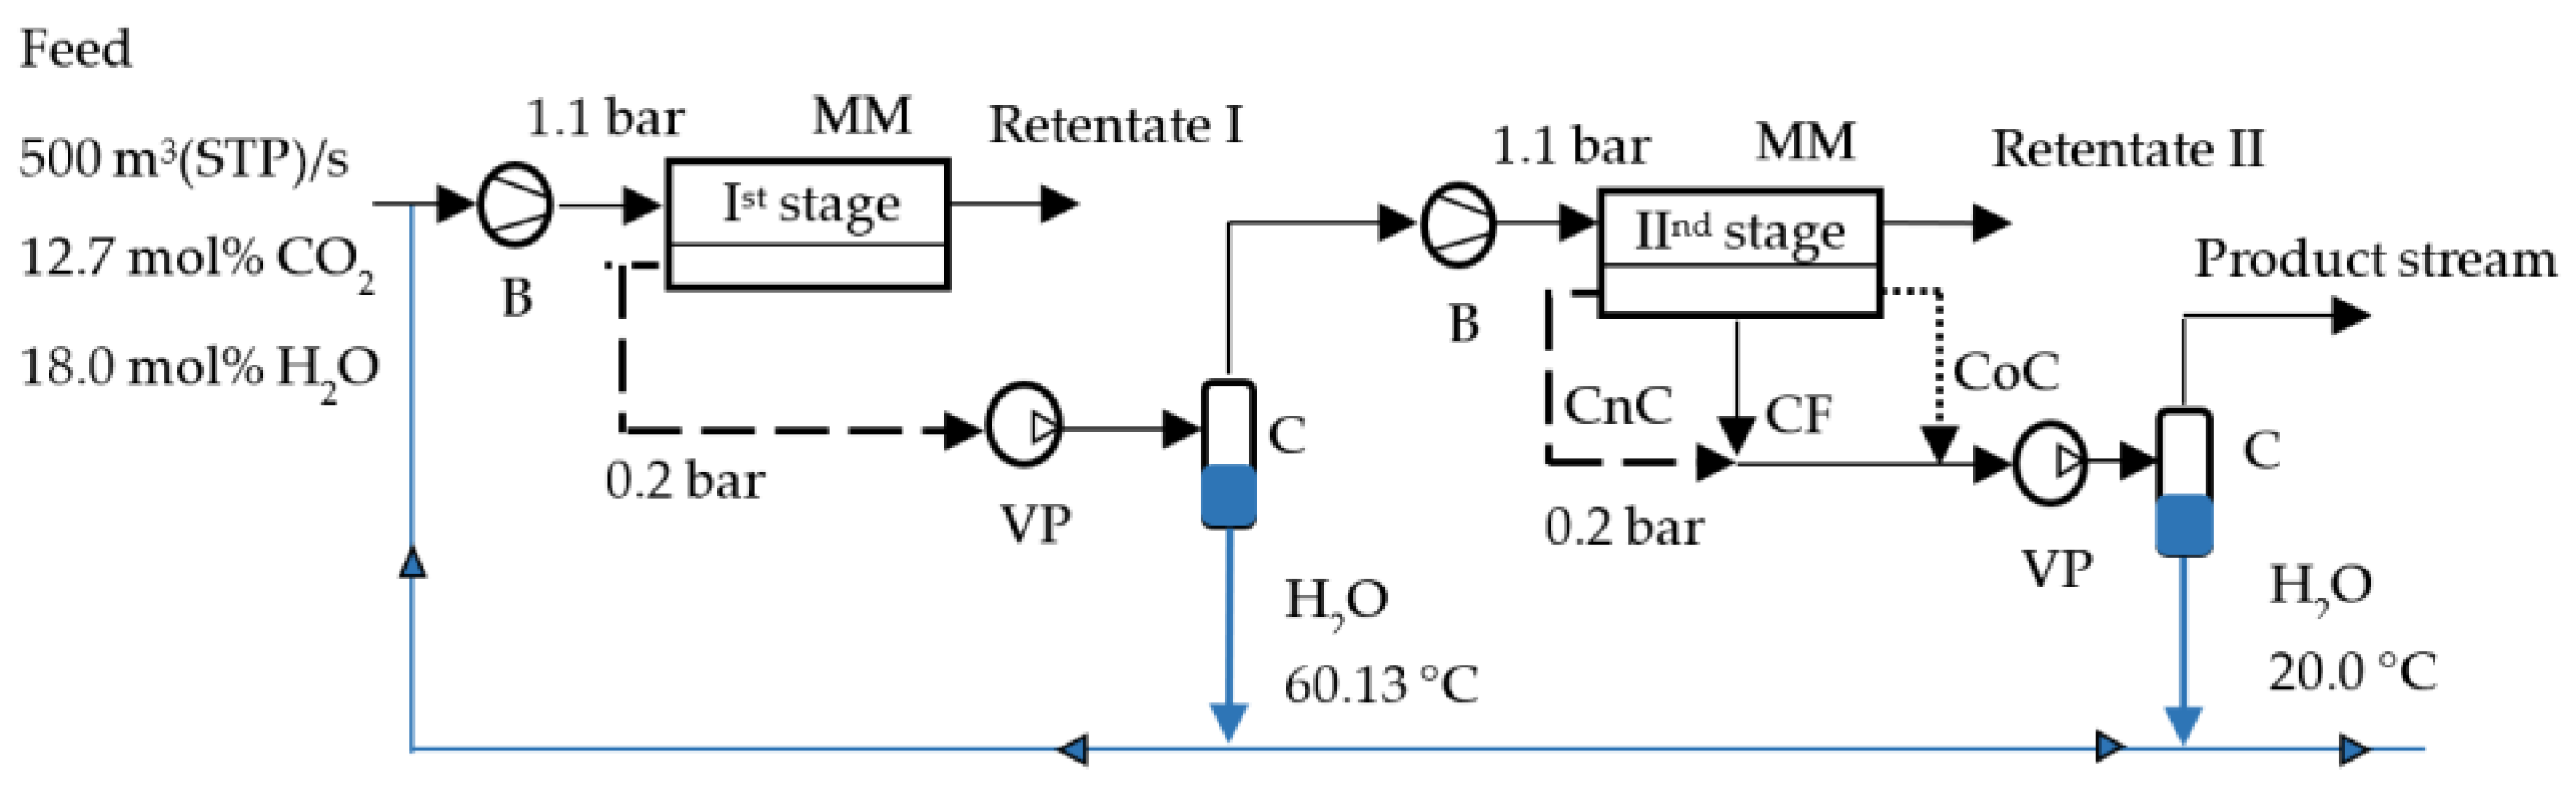
In this paper, a simulation of the CO2 capture process from the flue gases of a thermal power plant was carried out, taking into account the presence of water vapor. A two-stage vacuum capture scheme with partial condensation of water vapor after the first stage and with almost complete condensation after the second stage was considered in combination with various options for organizing flows in the membrane module at each stage of separation.
3. Results and Discussion
Earlier in the paper [
15], it was said that the presence of water vapor improves mass transfer of CO
2. However, it has not been shown how taking their presence into account affects the required membrane area value when achieving the same level of CO
2 recovery. In this paper, a simulation of the membrane process for CO
2 capture from power plant flue gases is conducted, taking into account the presence of water vapor in various operating modes of the membrane module (cross-flow mode, counter-current mode and cocurrent-flow mode).
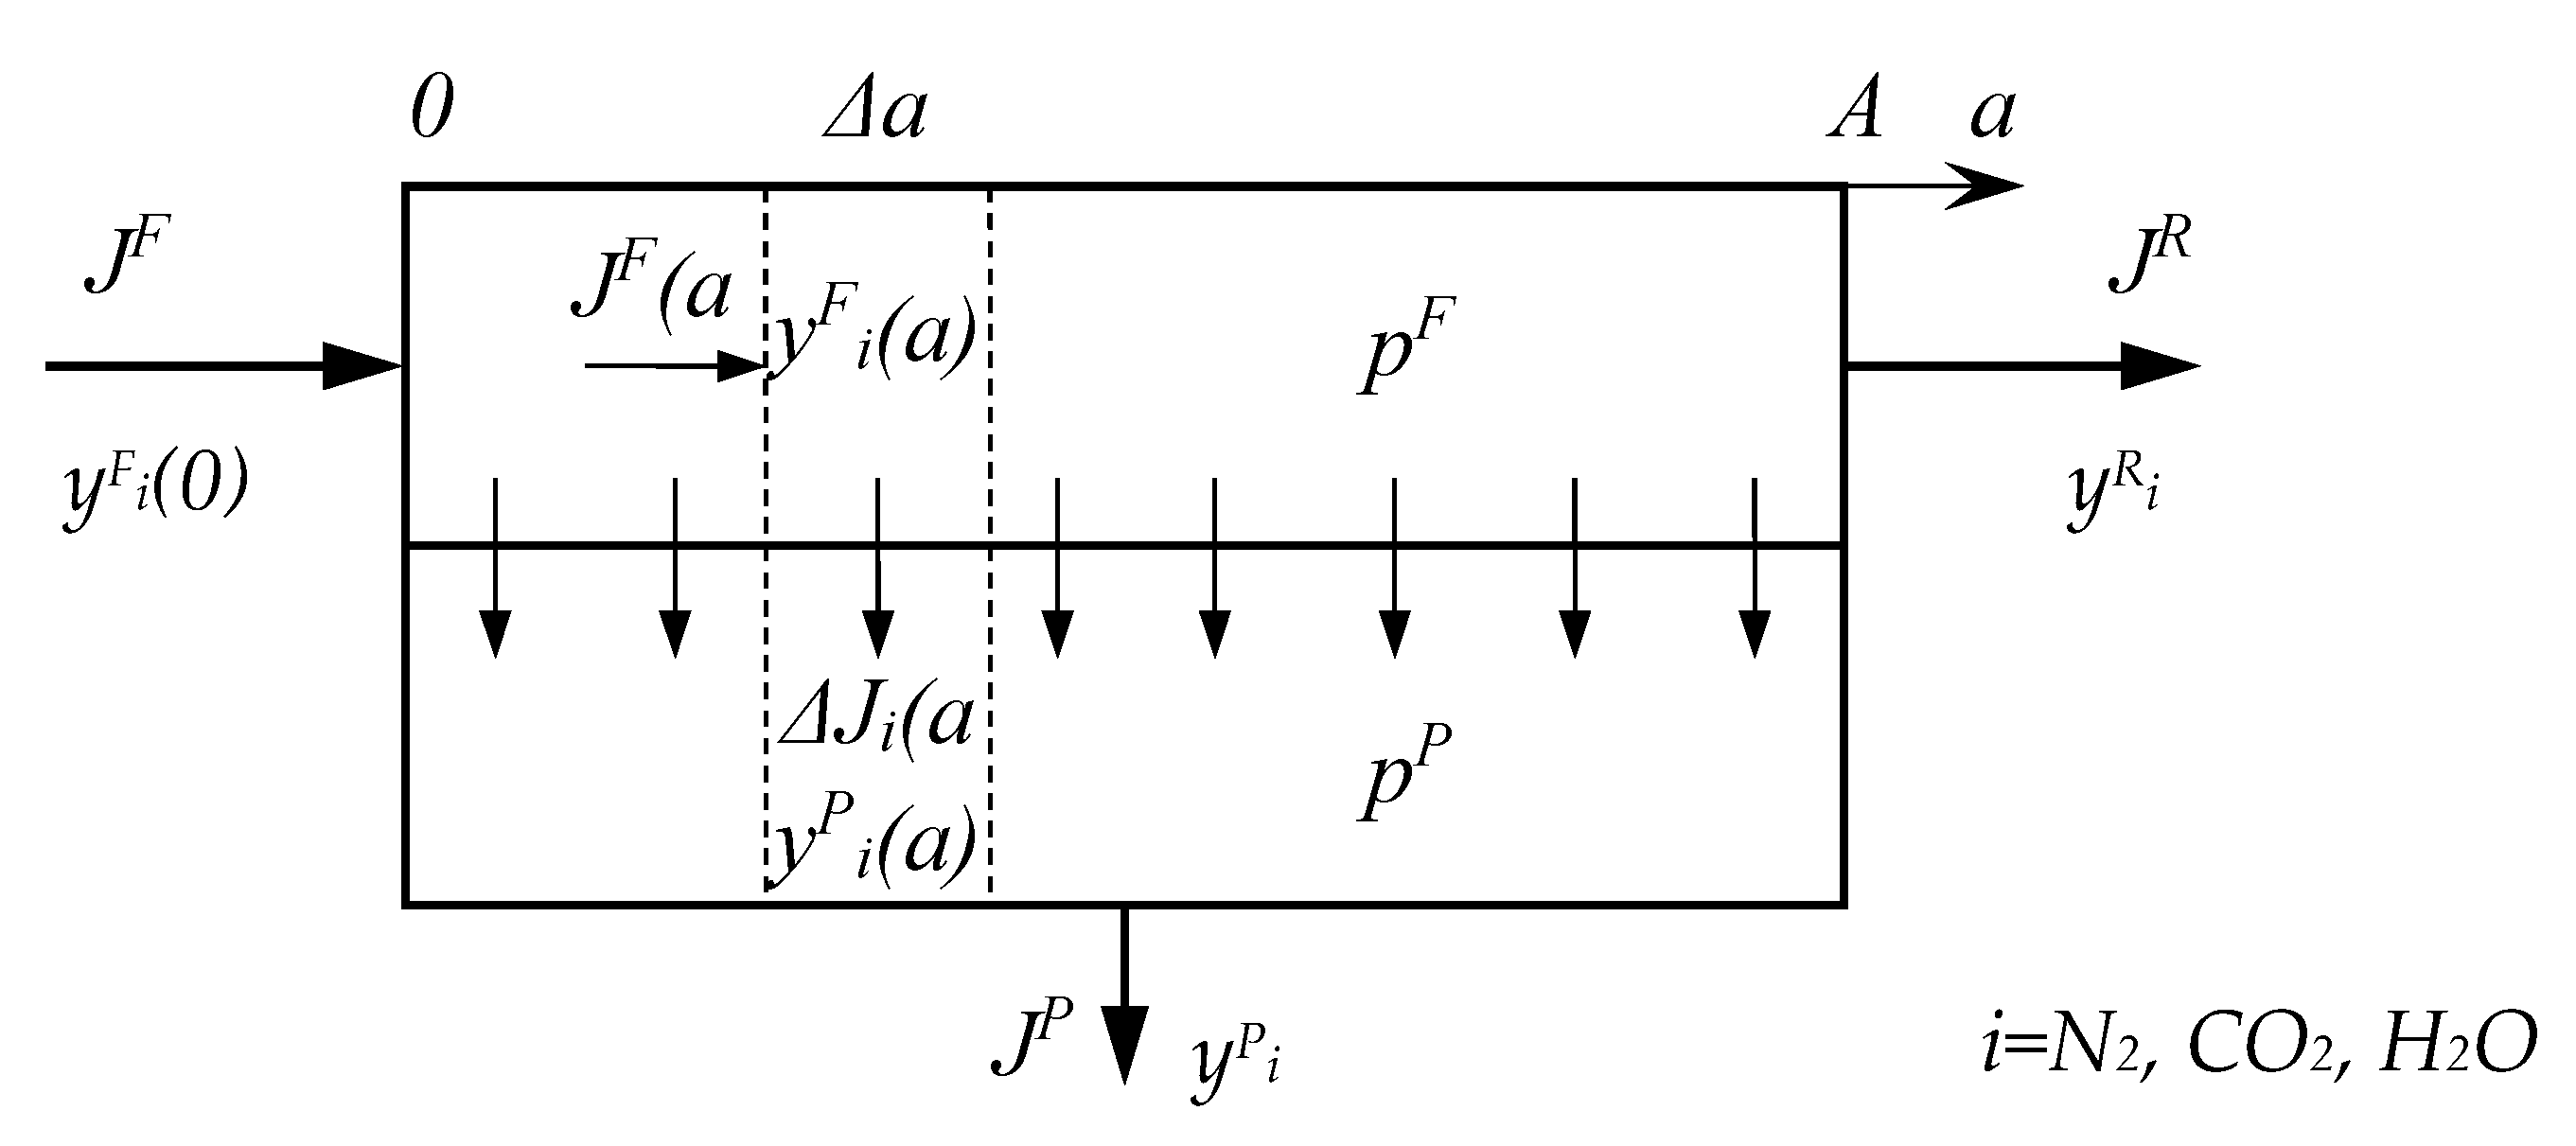
First of all, a simulation of the CO
2 capture process was carried out using the example of a one-stage scheme (
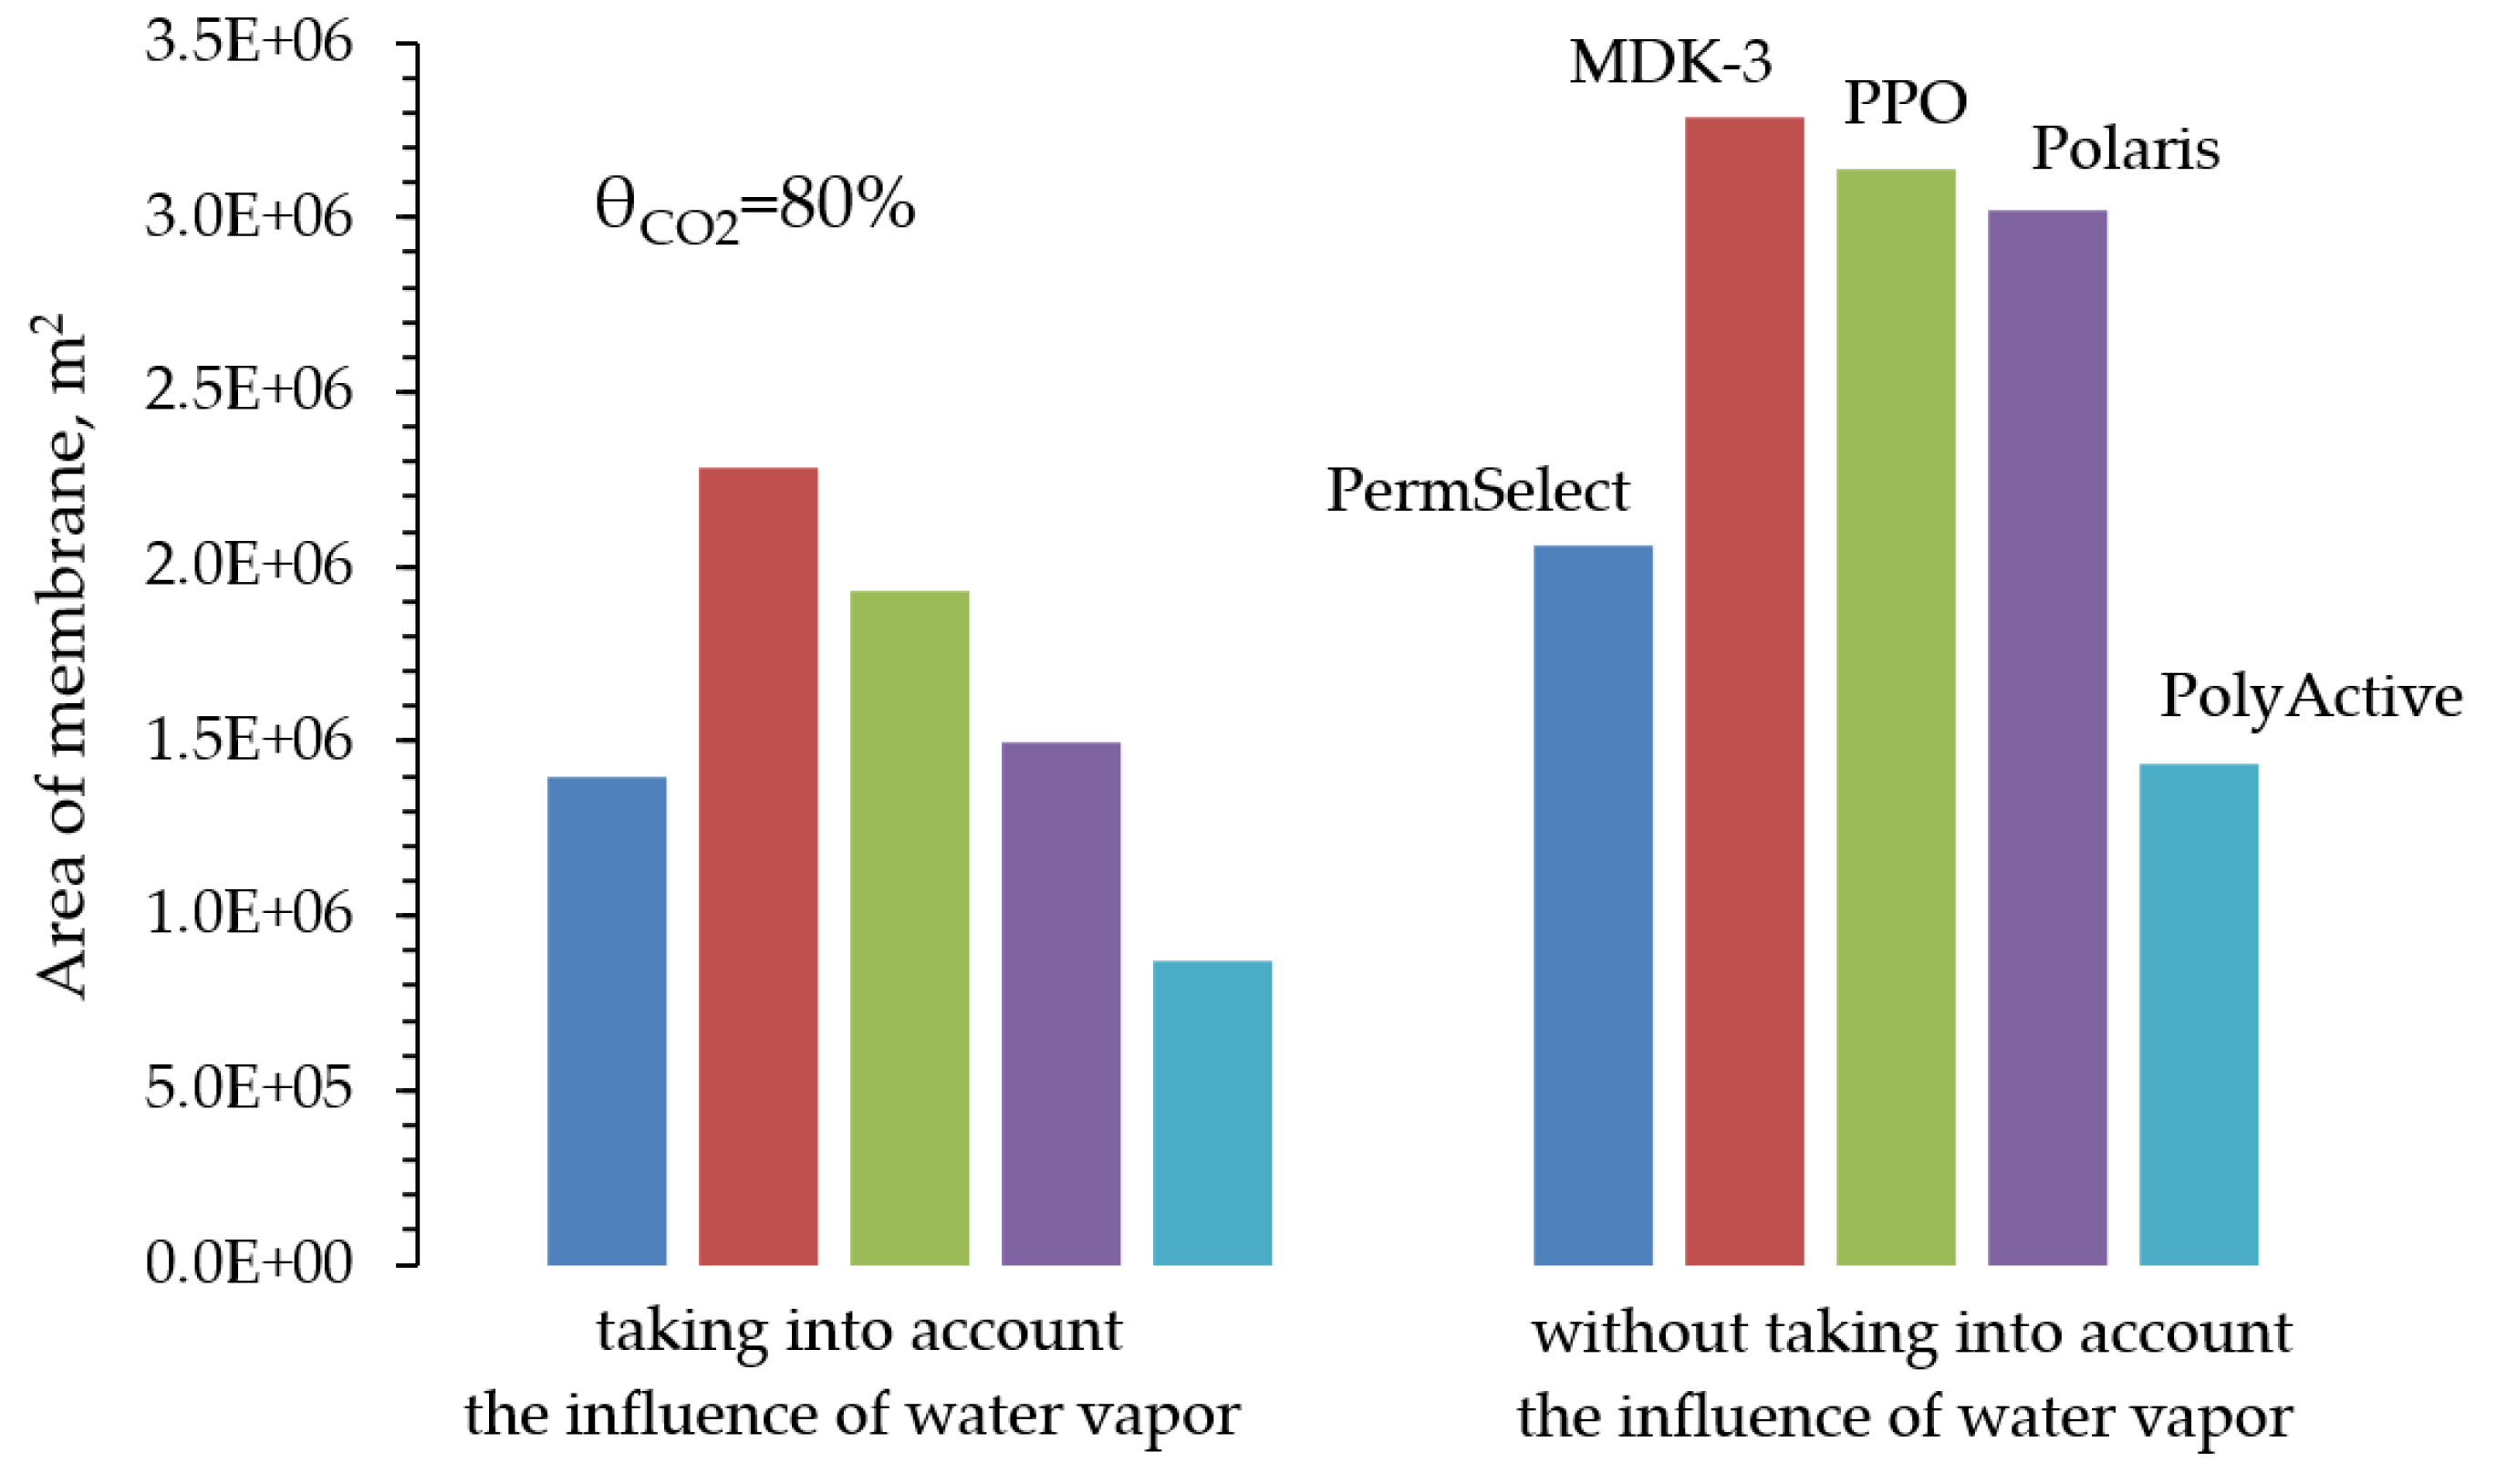
Figure 1) during the implementation of three modes of operation of the membrane module. The main criterion was to achieve a 80% degree of recovery for two cases: separation without taking into account the presence of water vapor and with it taken into account. The simulation results (
Figure 3) showed that taking into account the presence of water vapor makes it possible to reduce the required area of all the membranes considered by an average of 1.6 times. The text of the paper presents a comparison only for the case of cross-flow mode, a similar pattern is observed for other modes of flows organization in the membrane module.
One stage separation not allow to achieve high concentration of CO
2 in permeate. In order to fit the specification delivered by the International Energy Agency, i.e. a CO
2 recovery of 80% with a purity, of at least 80% [
26] using reasonable parameters of the process (pressures of feed and permeate streams first of all), it is necessary to apply two- or multi-stage separation.
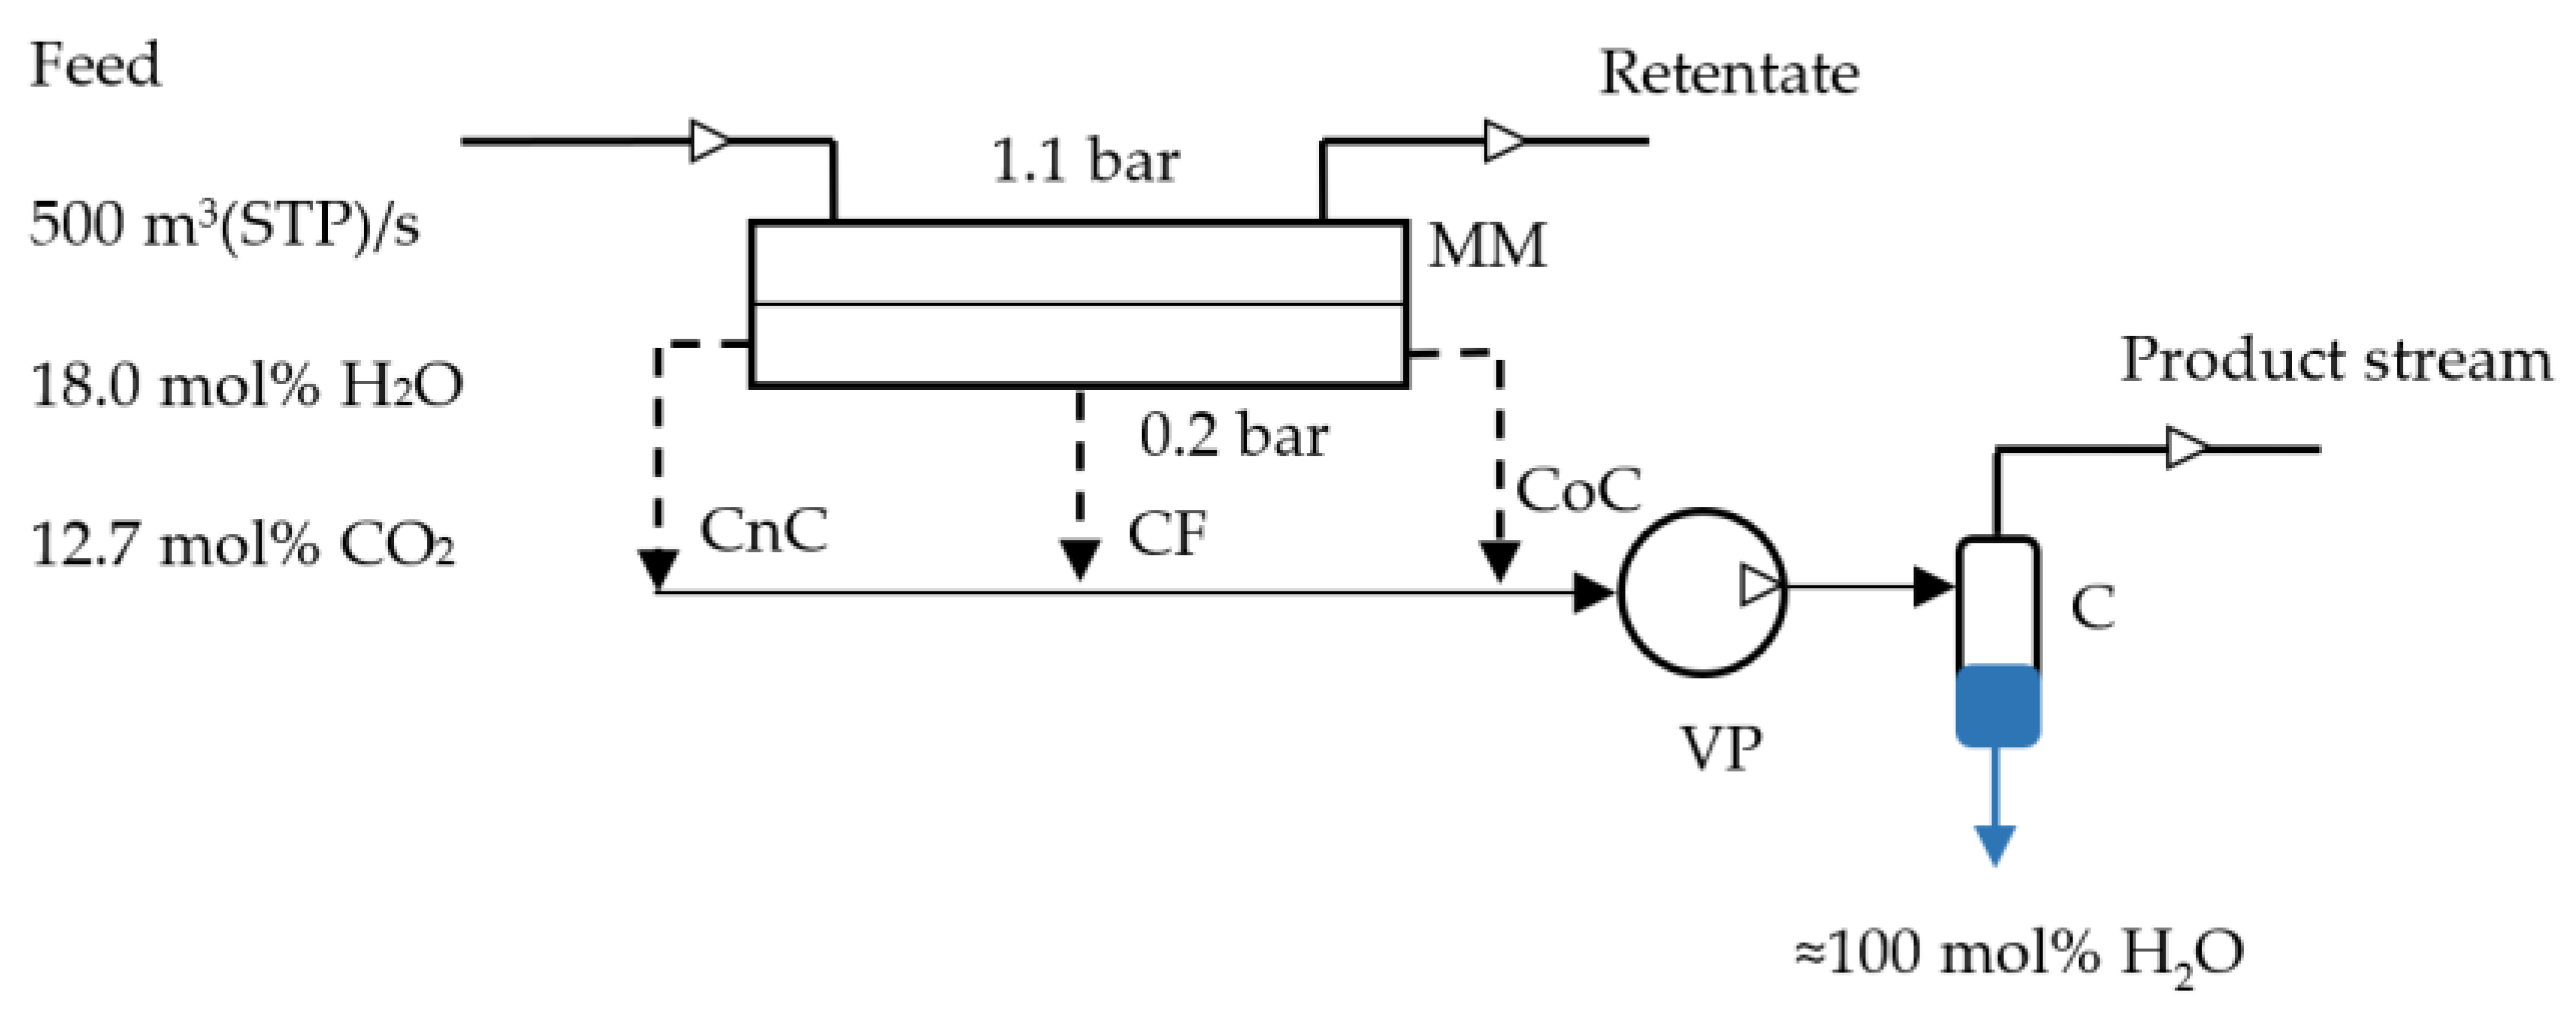
In this paper, we considered a two-stage vacuum scheme for CO
2 capture from flue gases with partial condensation of water vapor between the stages (
Figure 2) at different operating modes of the membrane module at both stages. Since we have already shown that the presence of water vapor improves CO
2 mass transfer, the temperature of the permeate flow condenser after the first stage was set so that the water vapor content in the feed stream of the second stage was proportional to its initial content in the flue gases. To achieve the required values of 80% CO
2 recovery with a purity of at least 80%, it is necessary to consider combinations of membrane module operating modes at the first and second stages. This part of the modeling will allow us to select the optimal combination of modes that provide the minimum required area of the membranes under consideration and to understand the range of CO
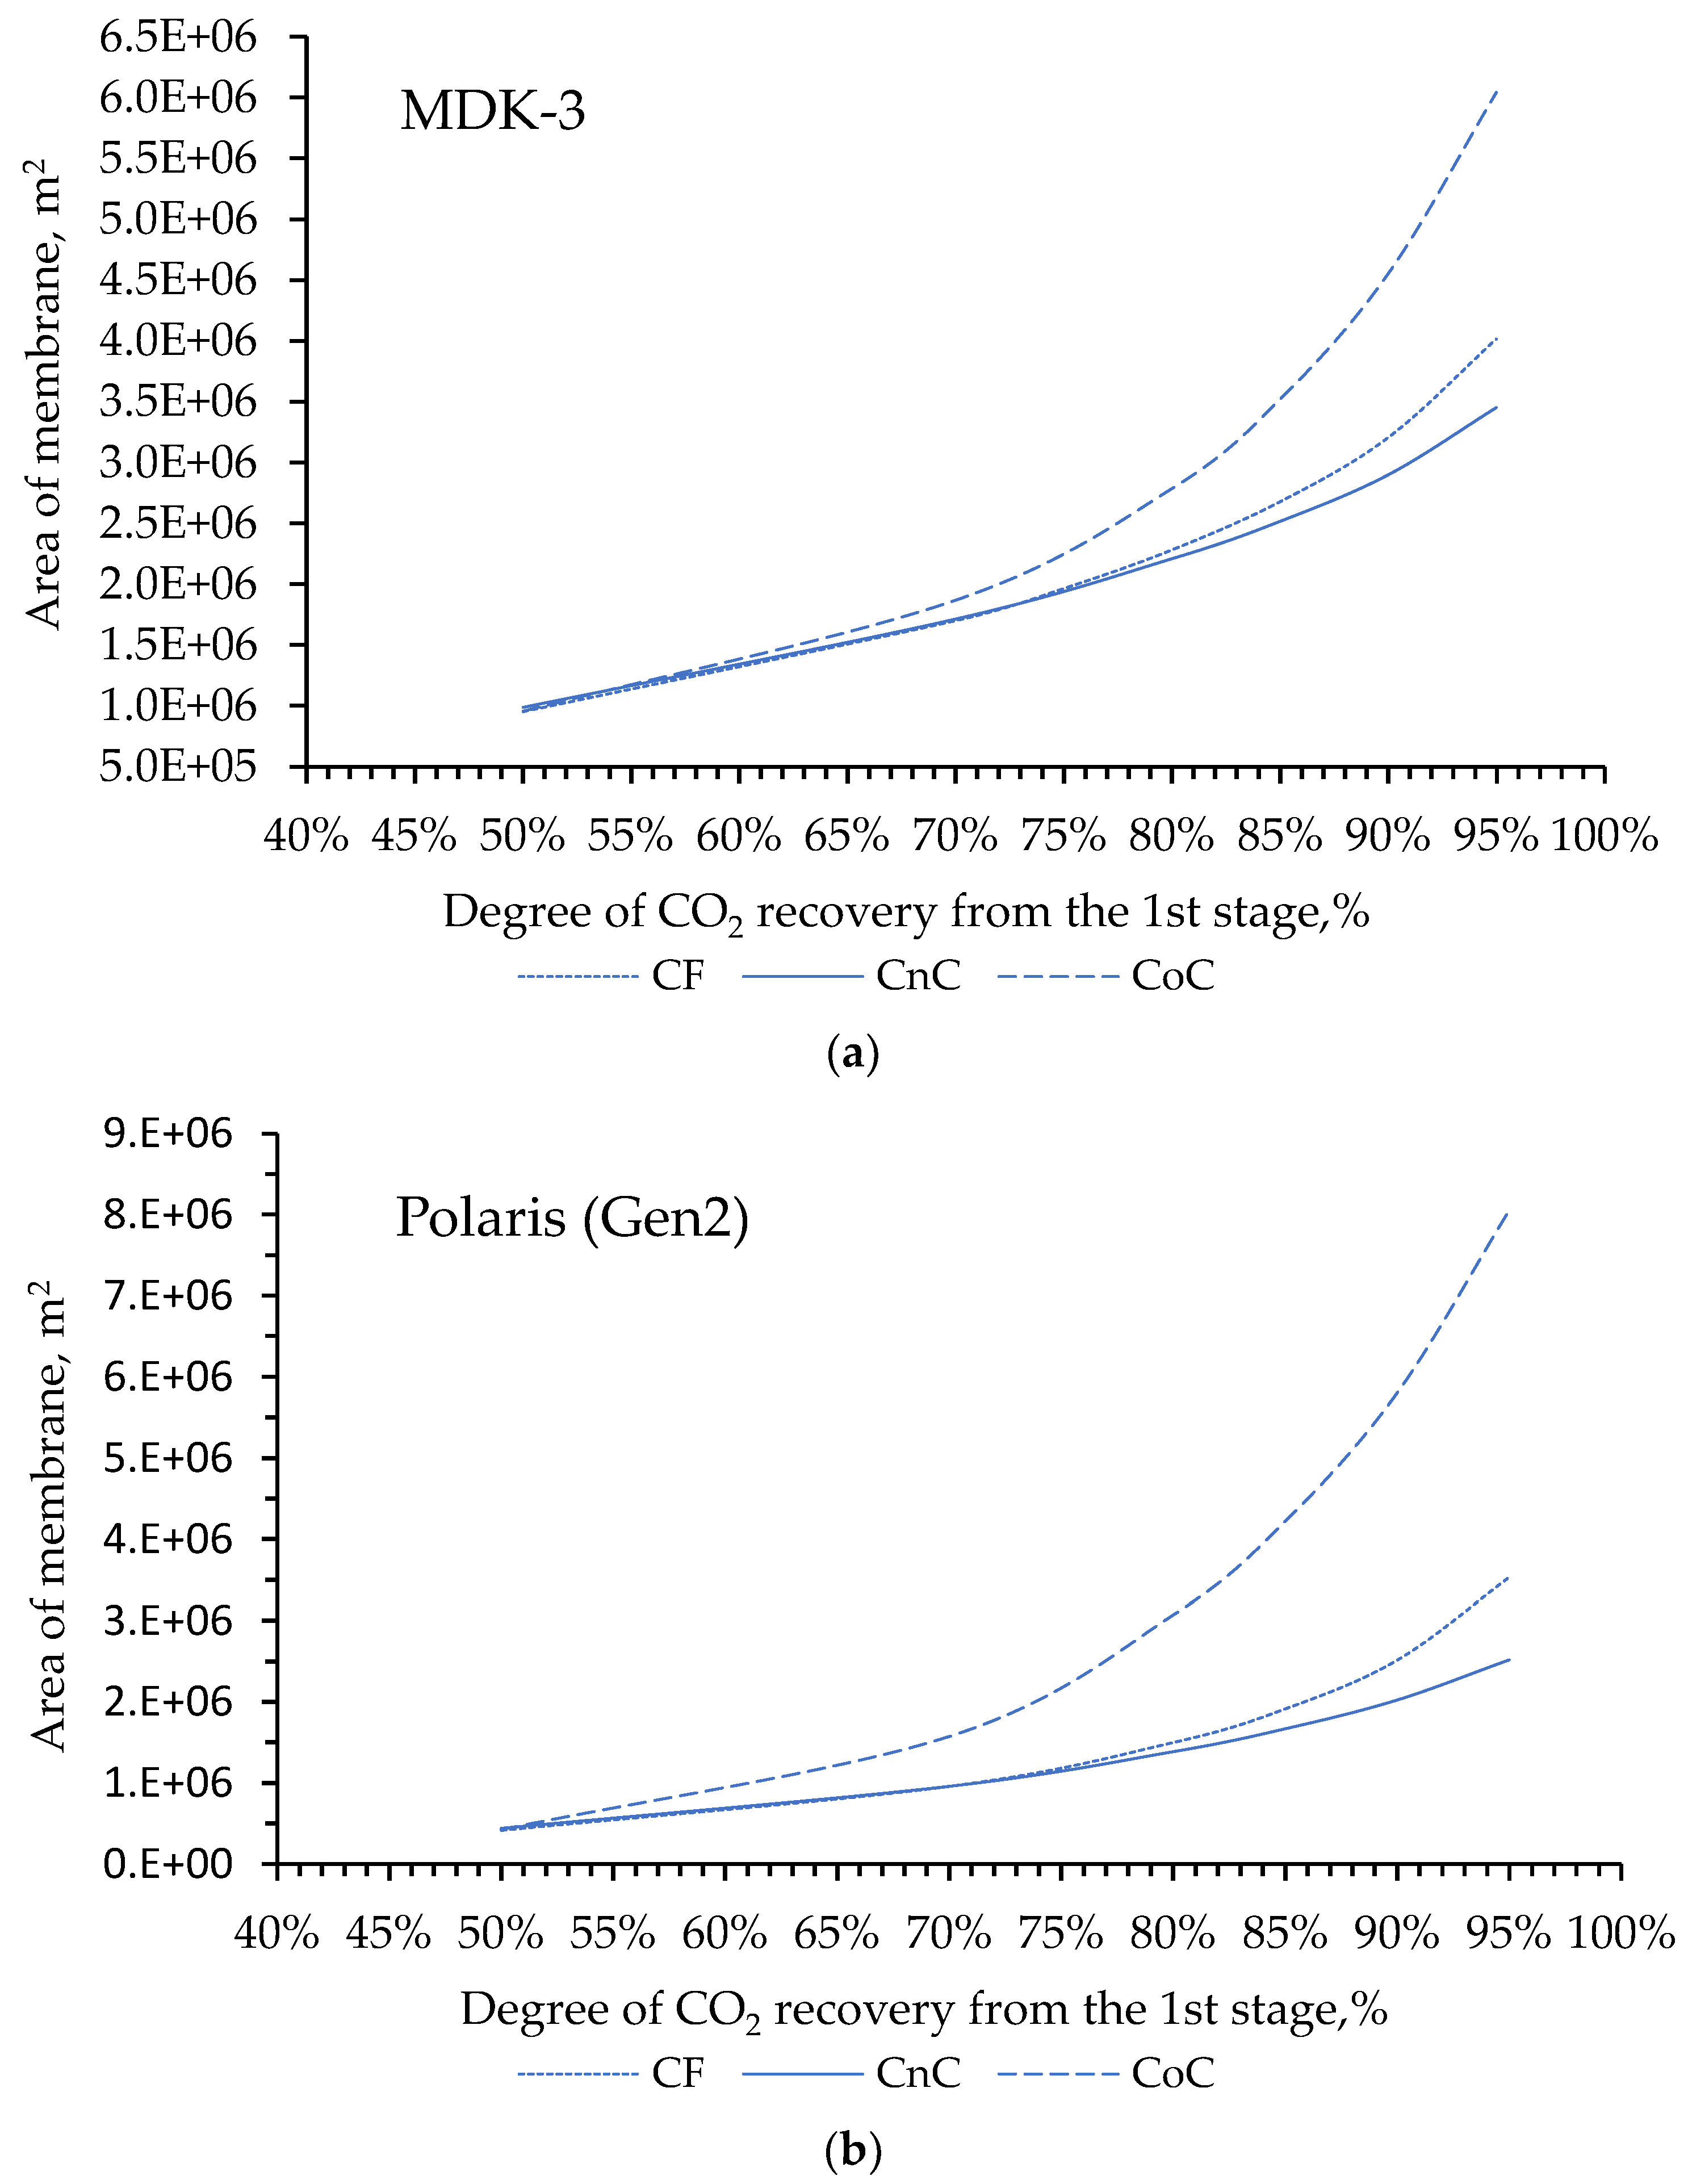
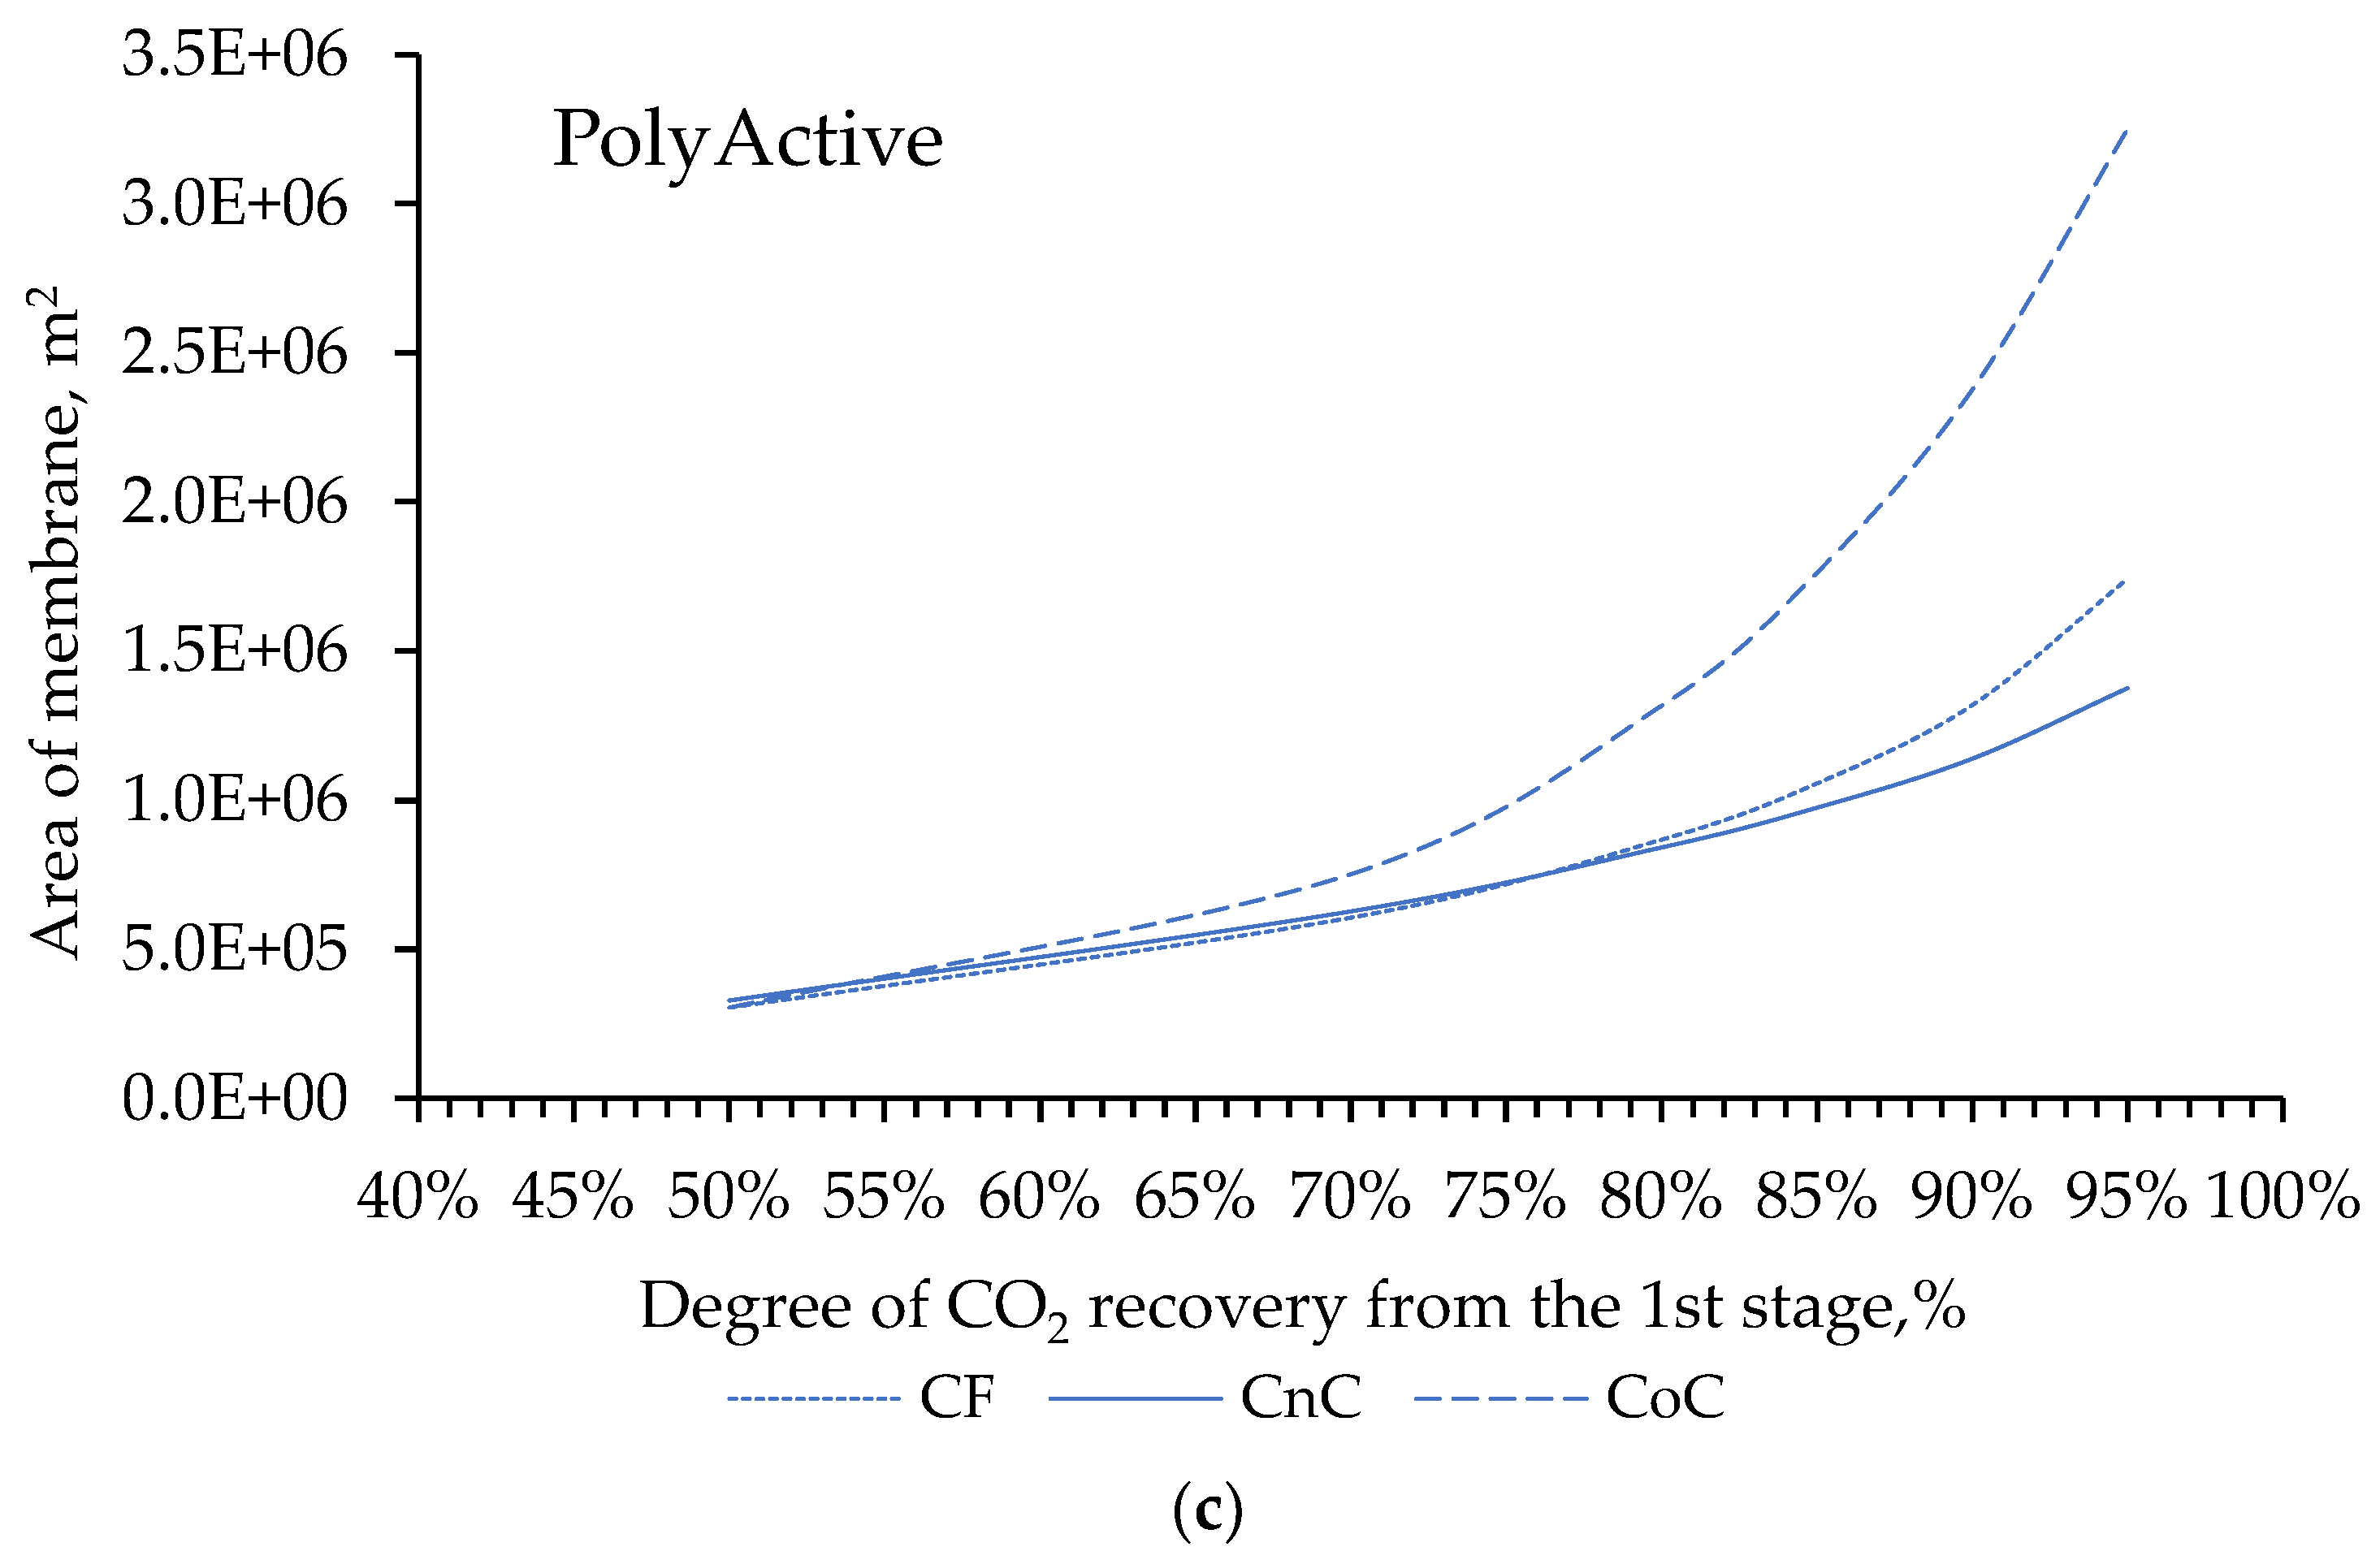
2 concentration in the product stream. In this regard, the next stage of our work modeling consisted in choosing the flow organization mode in the membrane module at the first stage of the two-stage scheme (
Figure 4).
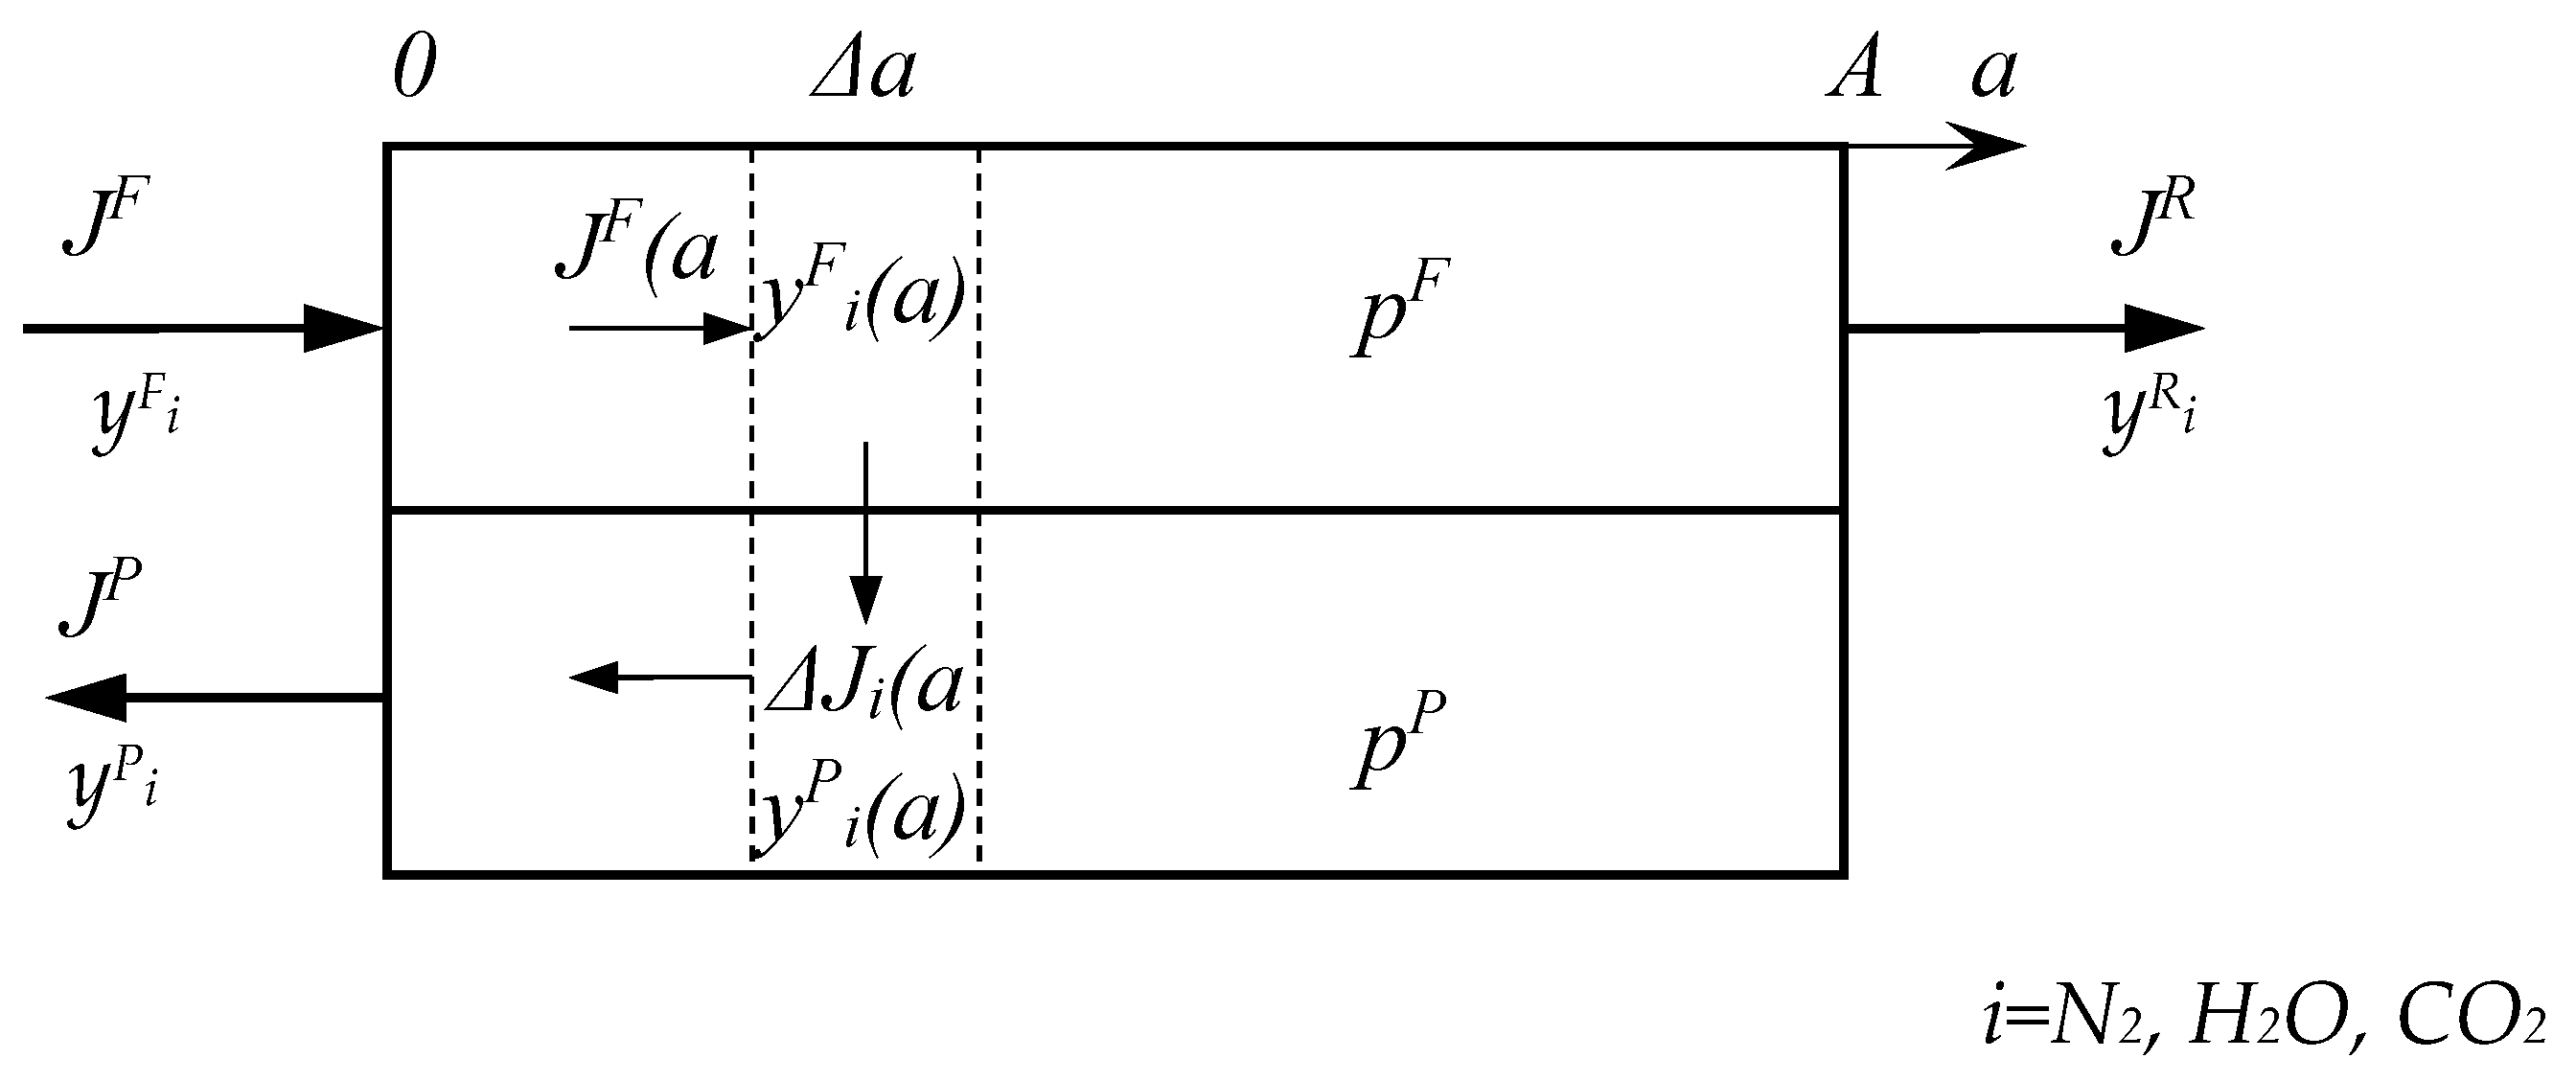
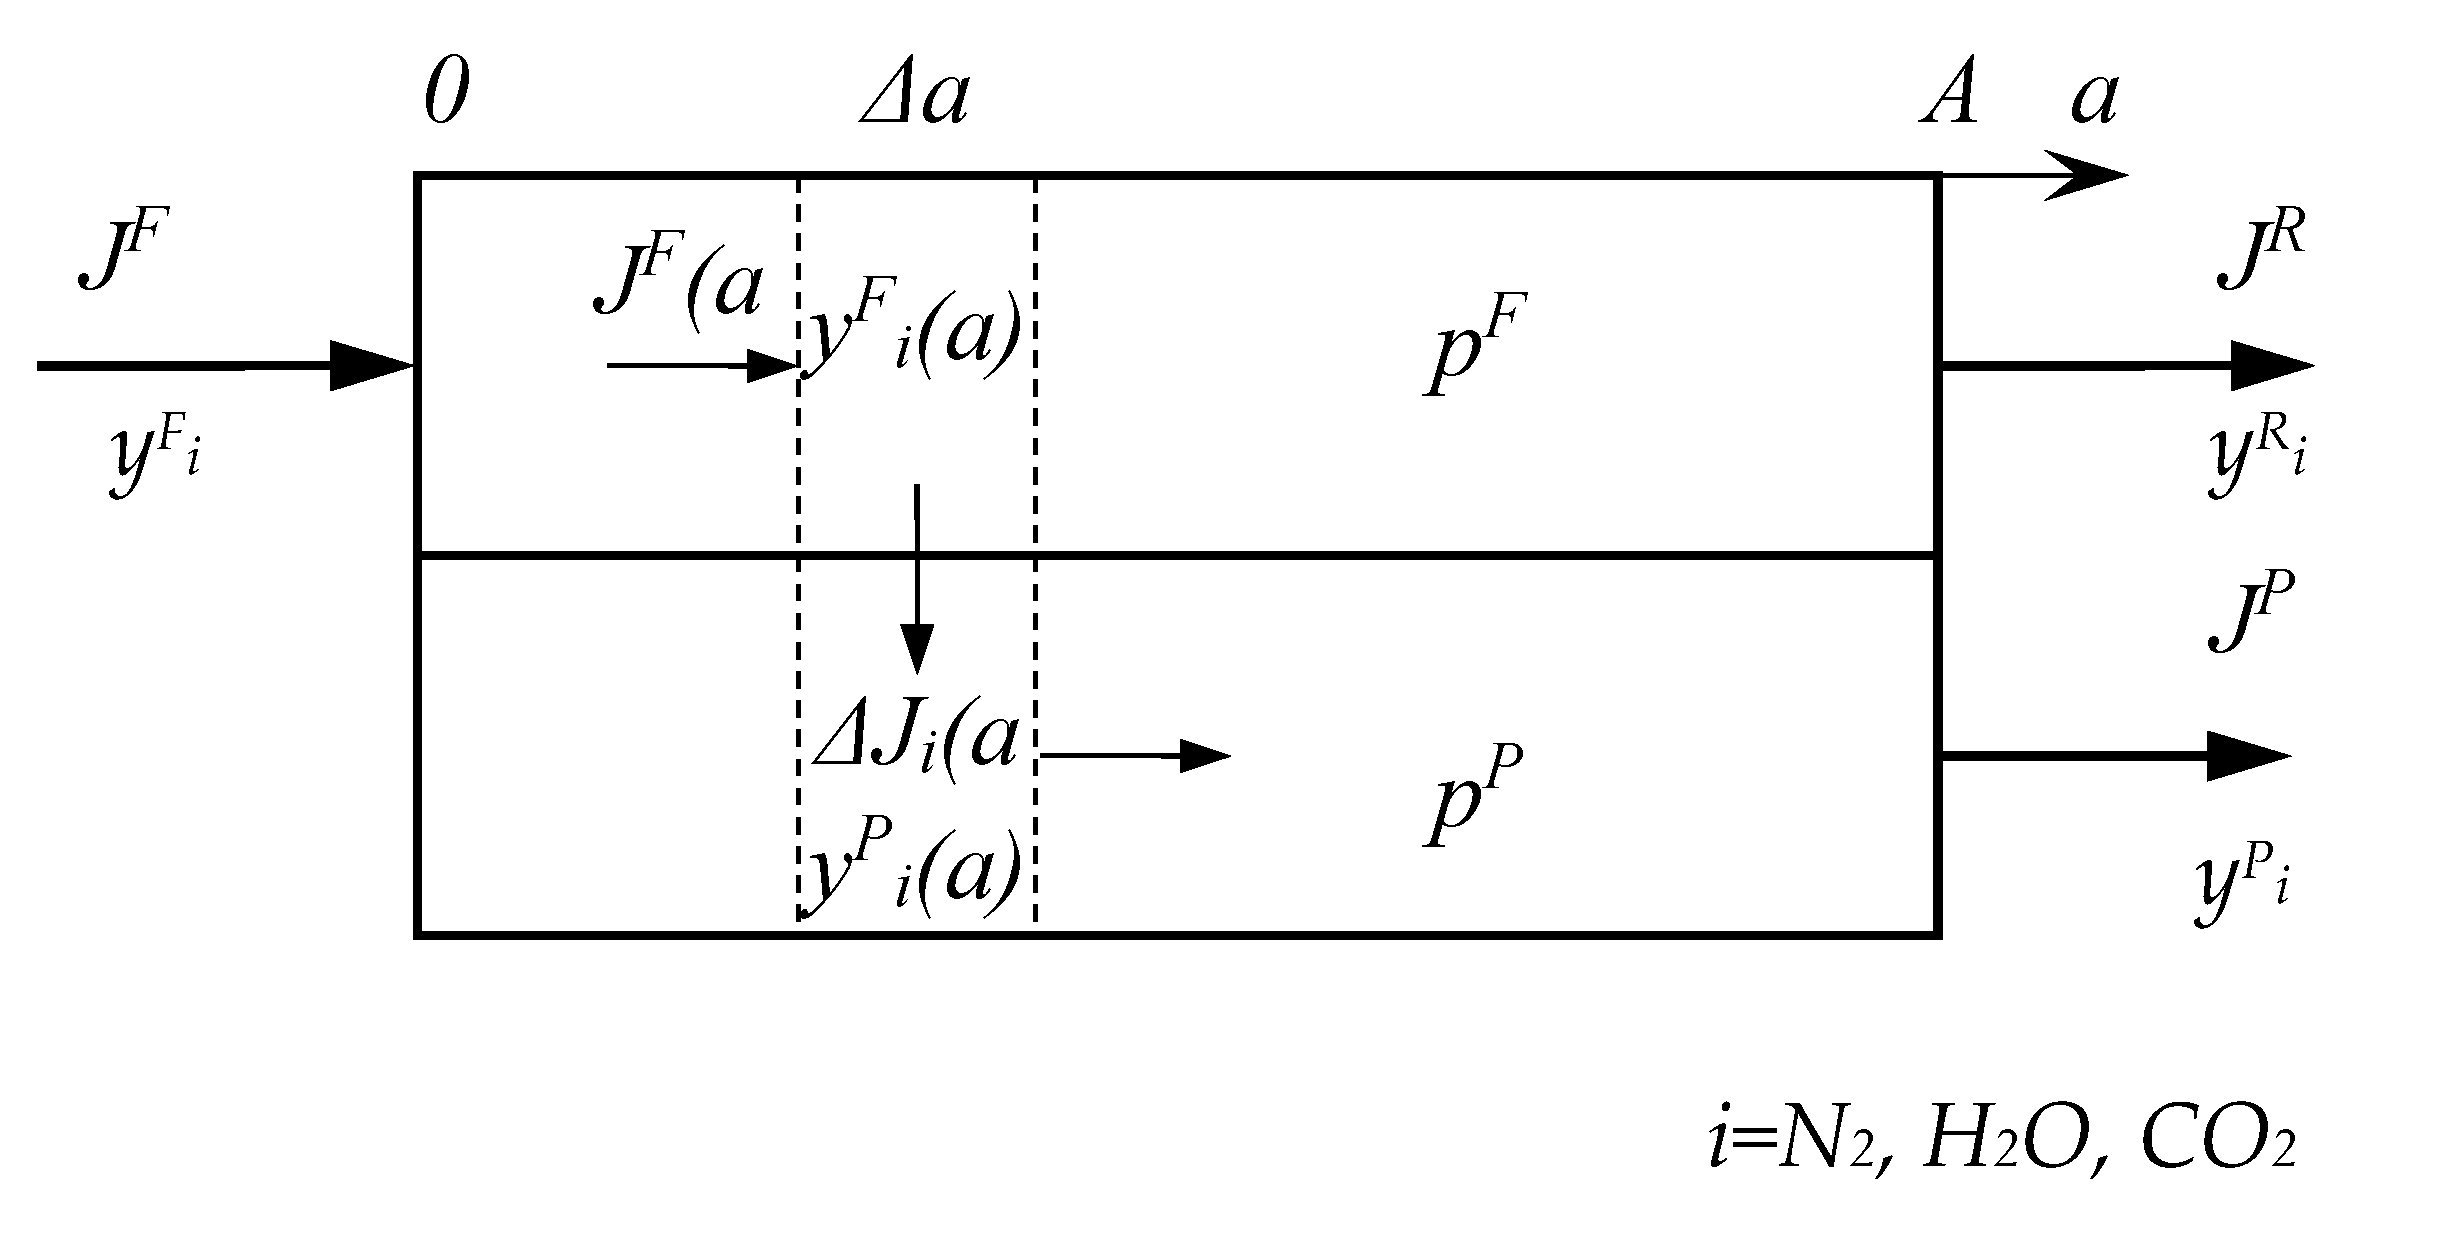
Simulation results shows that for the degree of CO
2 extraction < 80% in one stage, cross-flow and counter-current modes provide equal indicators for the required membrane area, and the co-current mode turns out to be less advantageous already with a degree of CO
2 extraction > 60%. The dependencies are similar for all selected membranes (
Figure 4a, 4b and 4c), including for PermSelect and PPO membranes not shown in the text. In this regard, in the area of low CO
2 extraction values at the first stage, any flow organization mode in the membrane module can be selected, and in the high area, a counter-current has a slight advantage over the cross-flow mode. Therefore, to select the operating mode of the module at the second stage, the counter-current mode was selected for the first stage.
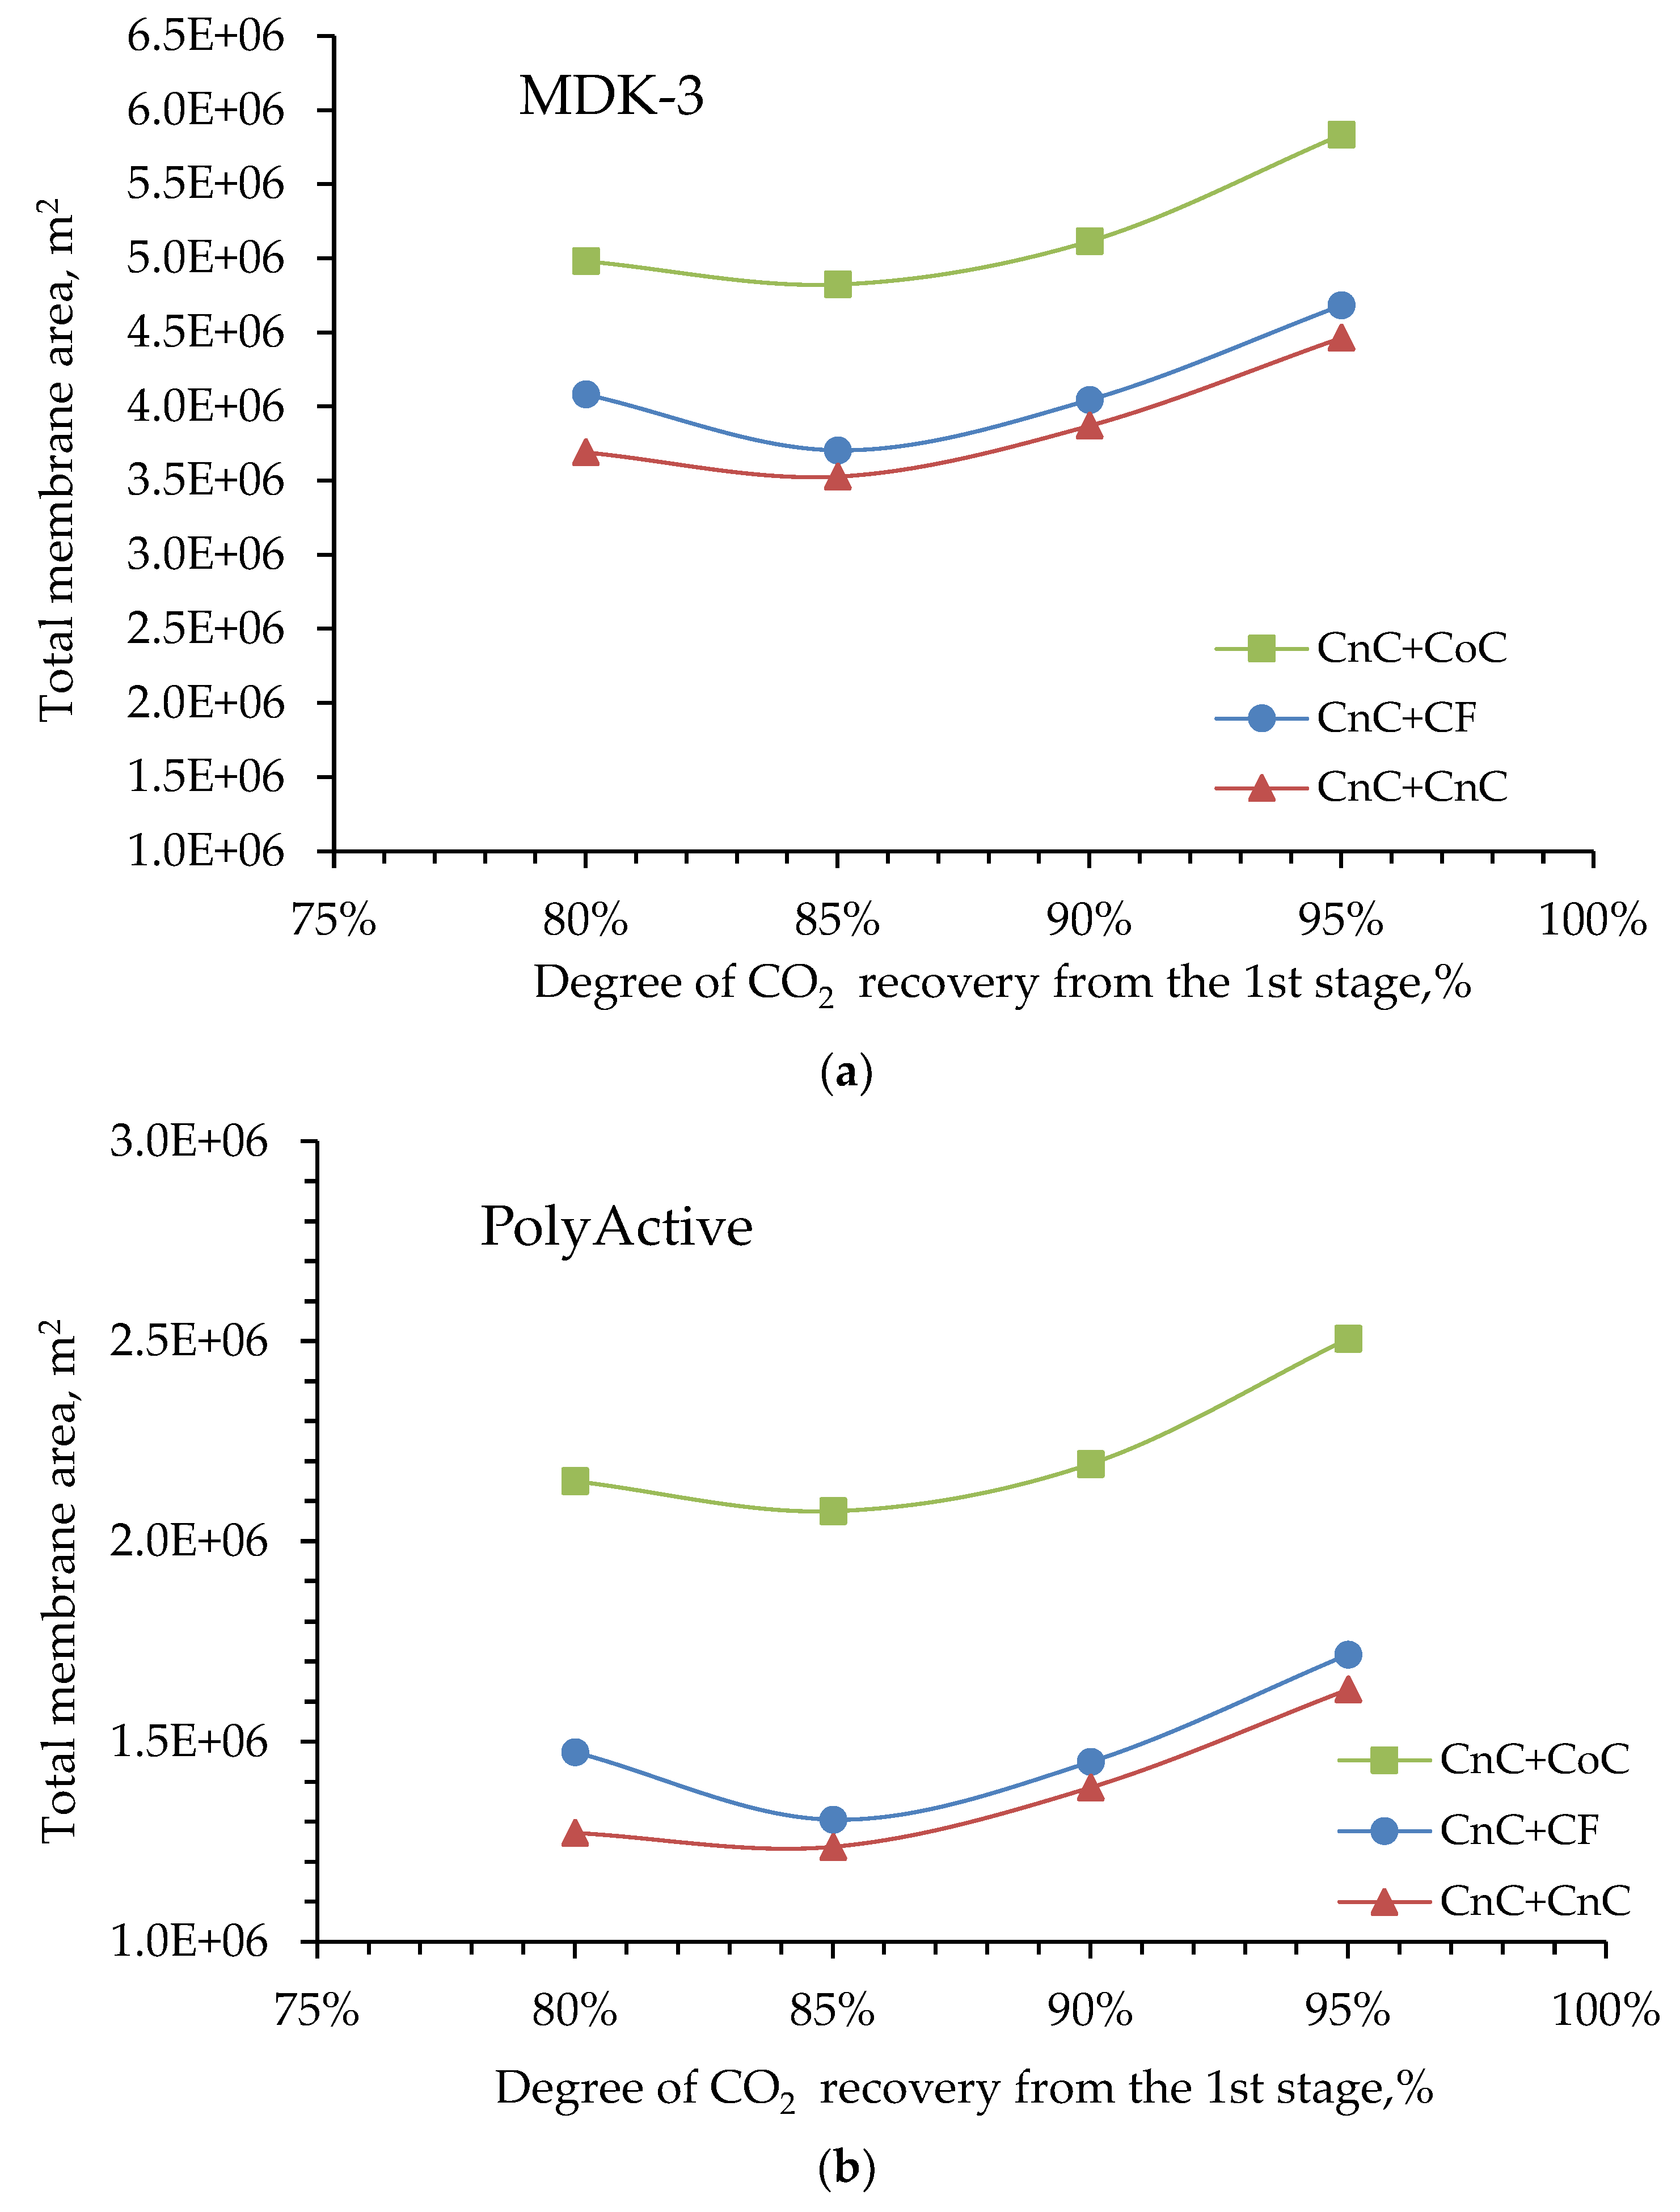
Next, combinations of the selected mode in the first stage with three different modes in the second stage were considered. The criterion for calculating was achieving 80% CO
2 capture after two stages. Dependences of the required total membrane area (
Figure 5) and final CO
2 concentration on its capture degree at first stage were obtained to satisfy the stated criterion (
Figure 6). Modeling results showed that if CO
2 is captured at first stage by ≥85%, there is no significant difference in required membrane area when counter-current or cross-flow are used in second stage. Advantage of counter-current mode is 5% average. Article provides these dependences as an example for MDK-3 and PolyActive membranes (
Figure 5a and 5b). Similar dependences were found for all other membranes studied in this paper.
The dependences of the CO
2 concentration in the product stream after two stages, depending on the degree of its capture at the first stage (
Figure 6a and 6b), showed that the combination of CnC+CnC allows on average, capturing 5% more CO
2 than the flow organization option of CnC+CF. The dependences for membranes considered in this paper had a similar shape. Only two were presented in the text as examples: for the MDK-3 and PolyActive membranes.
The option with cocurrent-flow mode at the second stage for all membranes at high degrees of CO2 capture was much worse: 1.5 times worse in membrane area and almost 2 times worse in concentration.
In light of the results obtained, the CnC+CnC combination was chosen to compare the required membrane areas and final CO2 concentration in the product stream for all membranes.
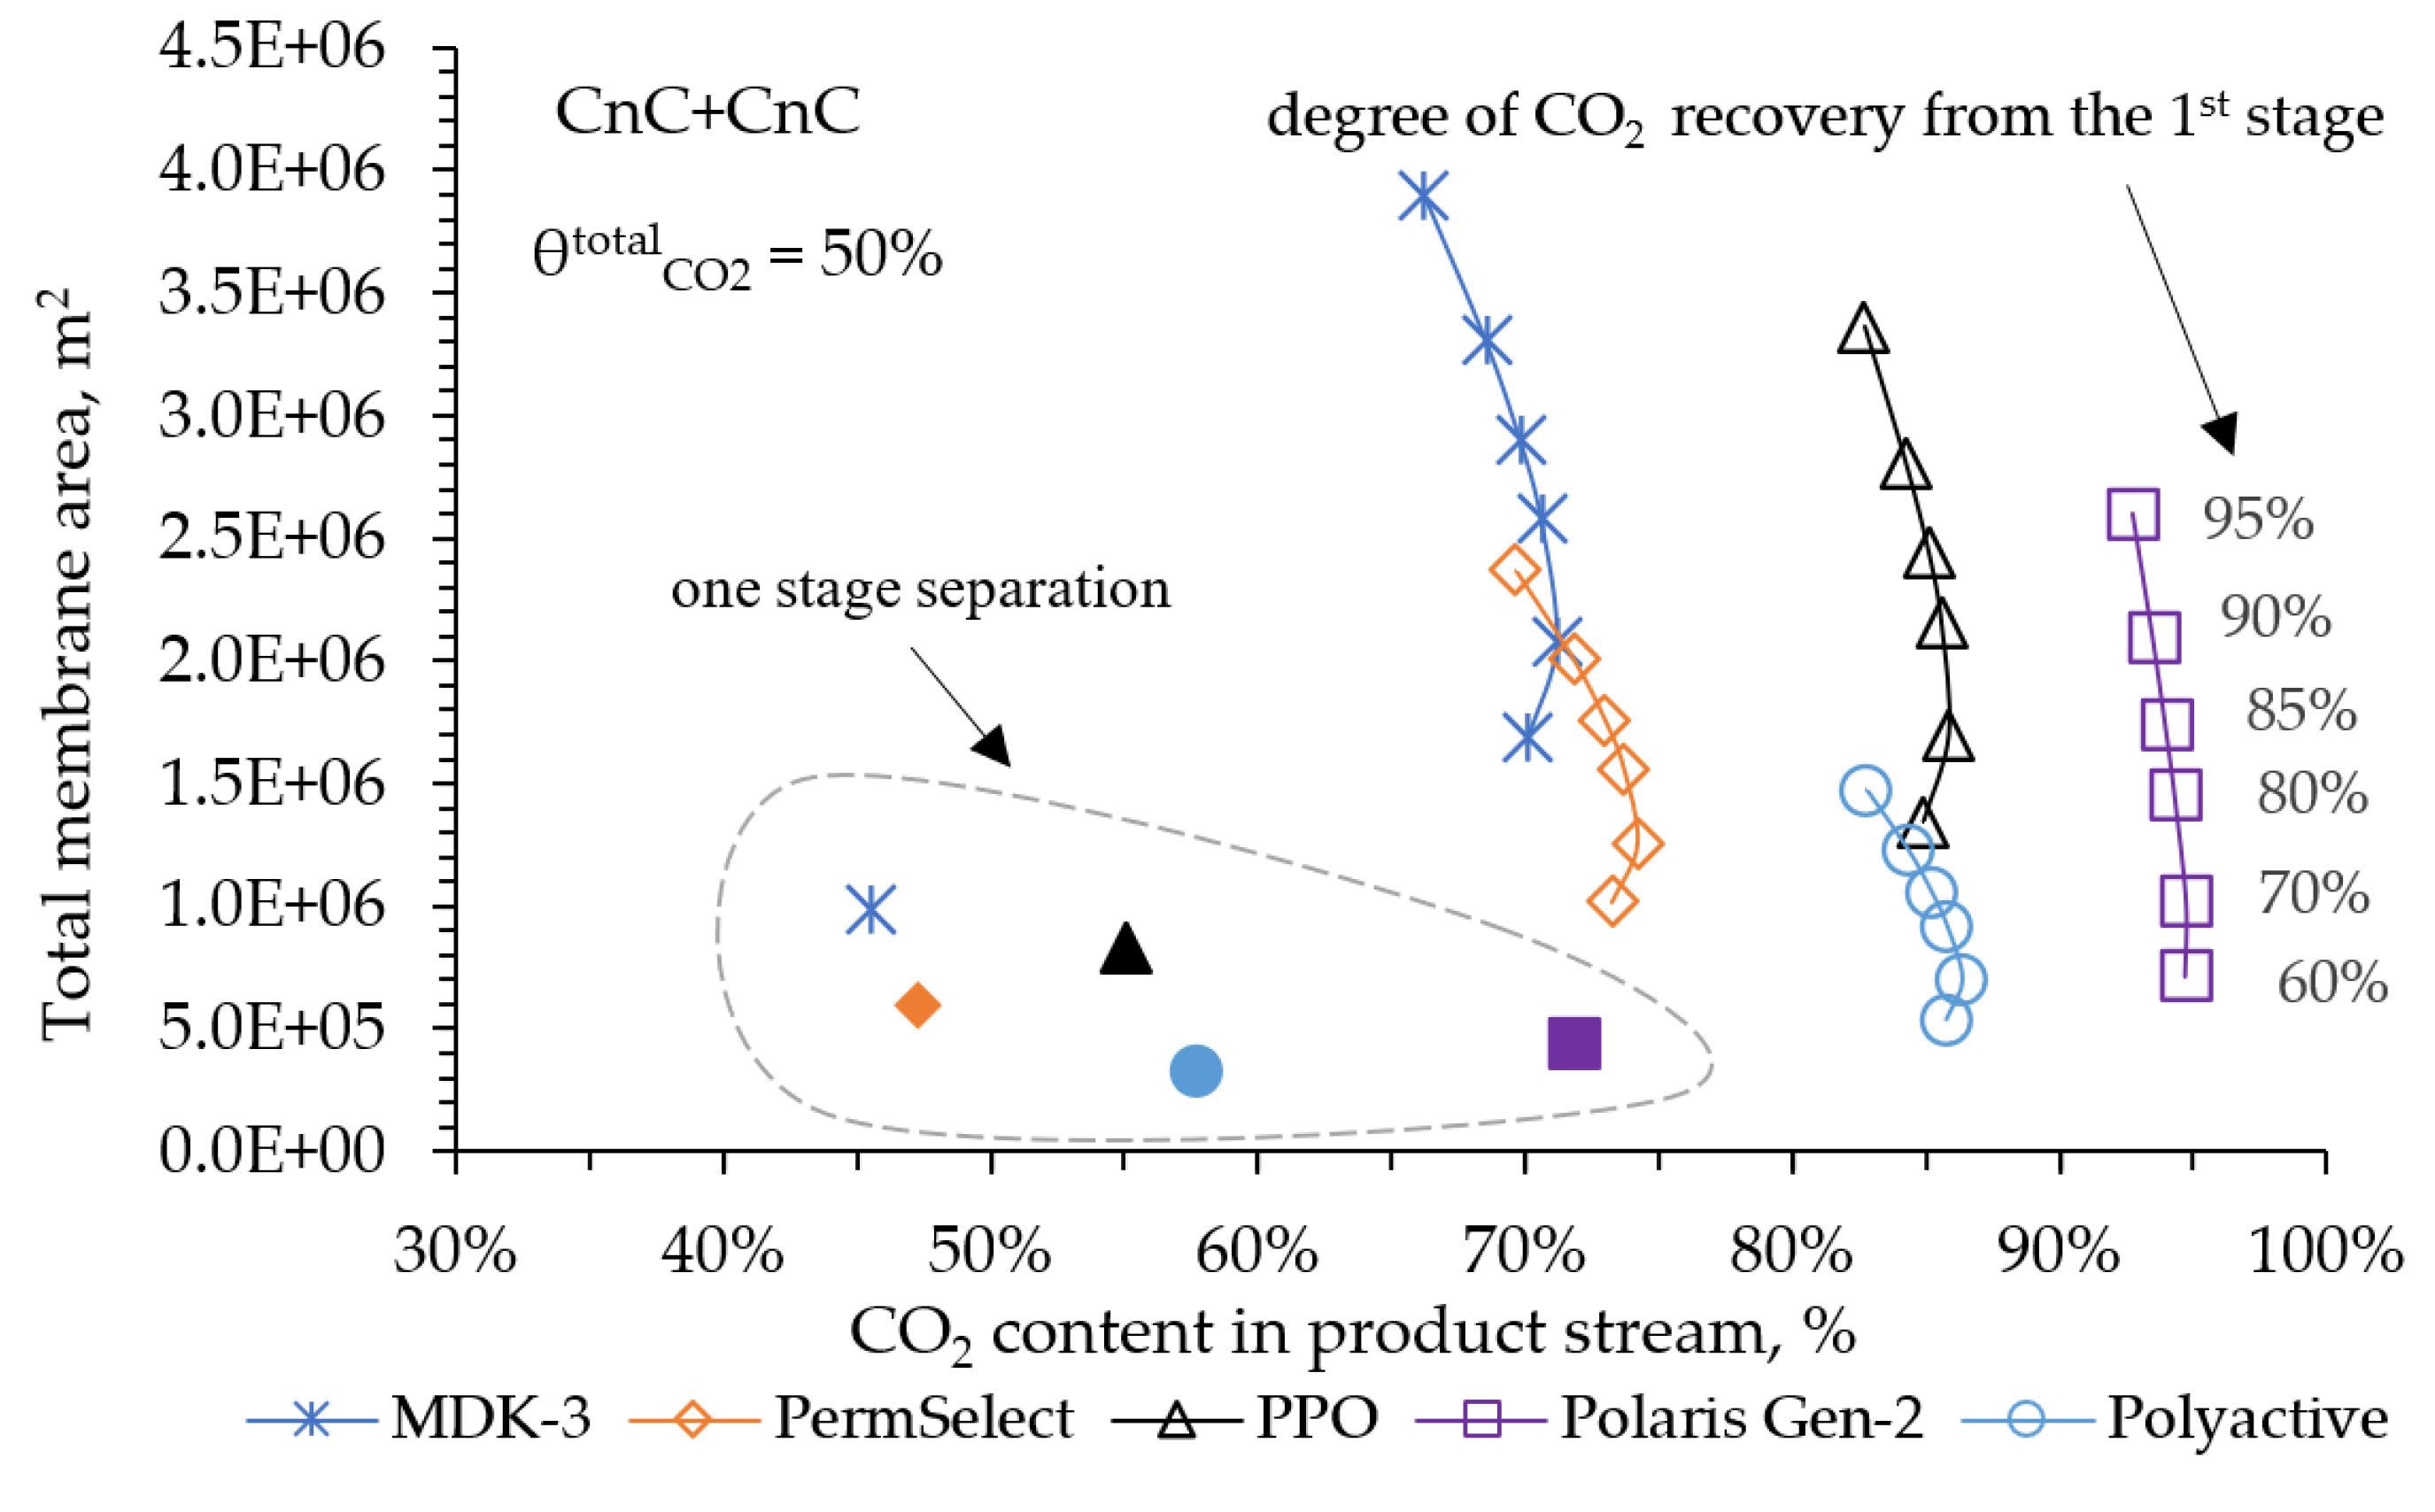
In the modeling process at this stage, two cases were considered. The first case considered where the final concentration of CO
2 in the product stream was the more significant indicator. In this regard, a low 50% CO
2 capture was set. This approach will allow us to understand which of the membranes considered can provide a higher CO
2 content in the product stream and to estimate the value of the required membrane areas. This case initially does not meet the requirements of the IEA specification due to the low CO
2 capture value, but can be informative for those processes where it is more important to obtain high CO
2 concentrations at the output. The results of the modeling for a 50% CO
2 capture after two stages are shown in
Figure 7.
For all the membranes under consideration, at a 50% CO2 capture in two stages, with a variation in the CO2 capture degree in the first stage between 60 and 95%, the optimal is observed in the ratio between the required area and the CO2 concentration in the product stream. Thus, with 70% CO2 capture in the first stage, it is possible to achieve its maximum concentration after two stages with the minimum required membrane area. The PolyActive, PPO and Polaris (Gen 2) membranes allow obtaining from 86 to 95 mol% CO2 in the product stream. The PolyActive and PPO membranes provide equal indicators for CO2 content in the product stream, but using PolyActive requires 2.4 times less membrane area. Using the Polaris membrane (Gen 2), it is possible to obtain 95 mol% of CO2, which is approximately 9 mol% higher than the PolyActive membrane provides. However, in this case, the required area will be 1.5 times larger. Also on the plot, for comparison, the indicators of separation in one stage separation are shown (the data are dotted). These results show us that at 50% CO2 capture in one stage, to achieve its concentration values on average 30% lower than when implementing a two-stage scheme.
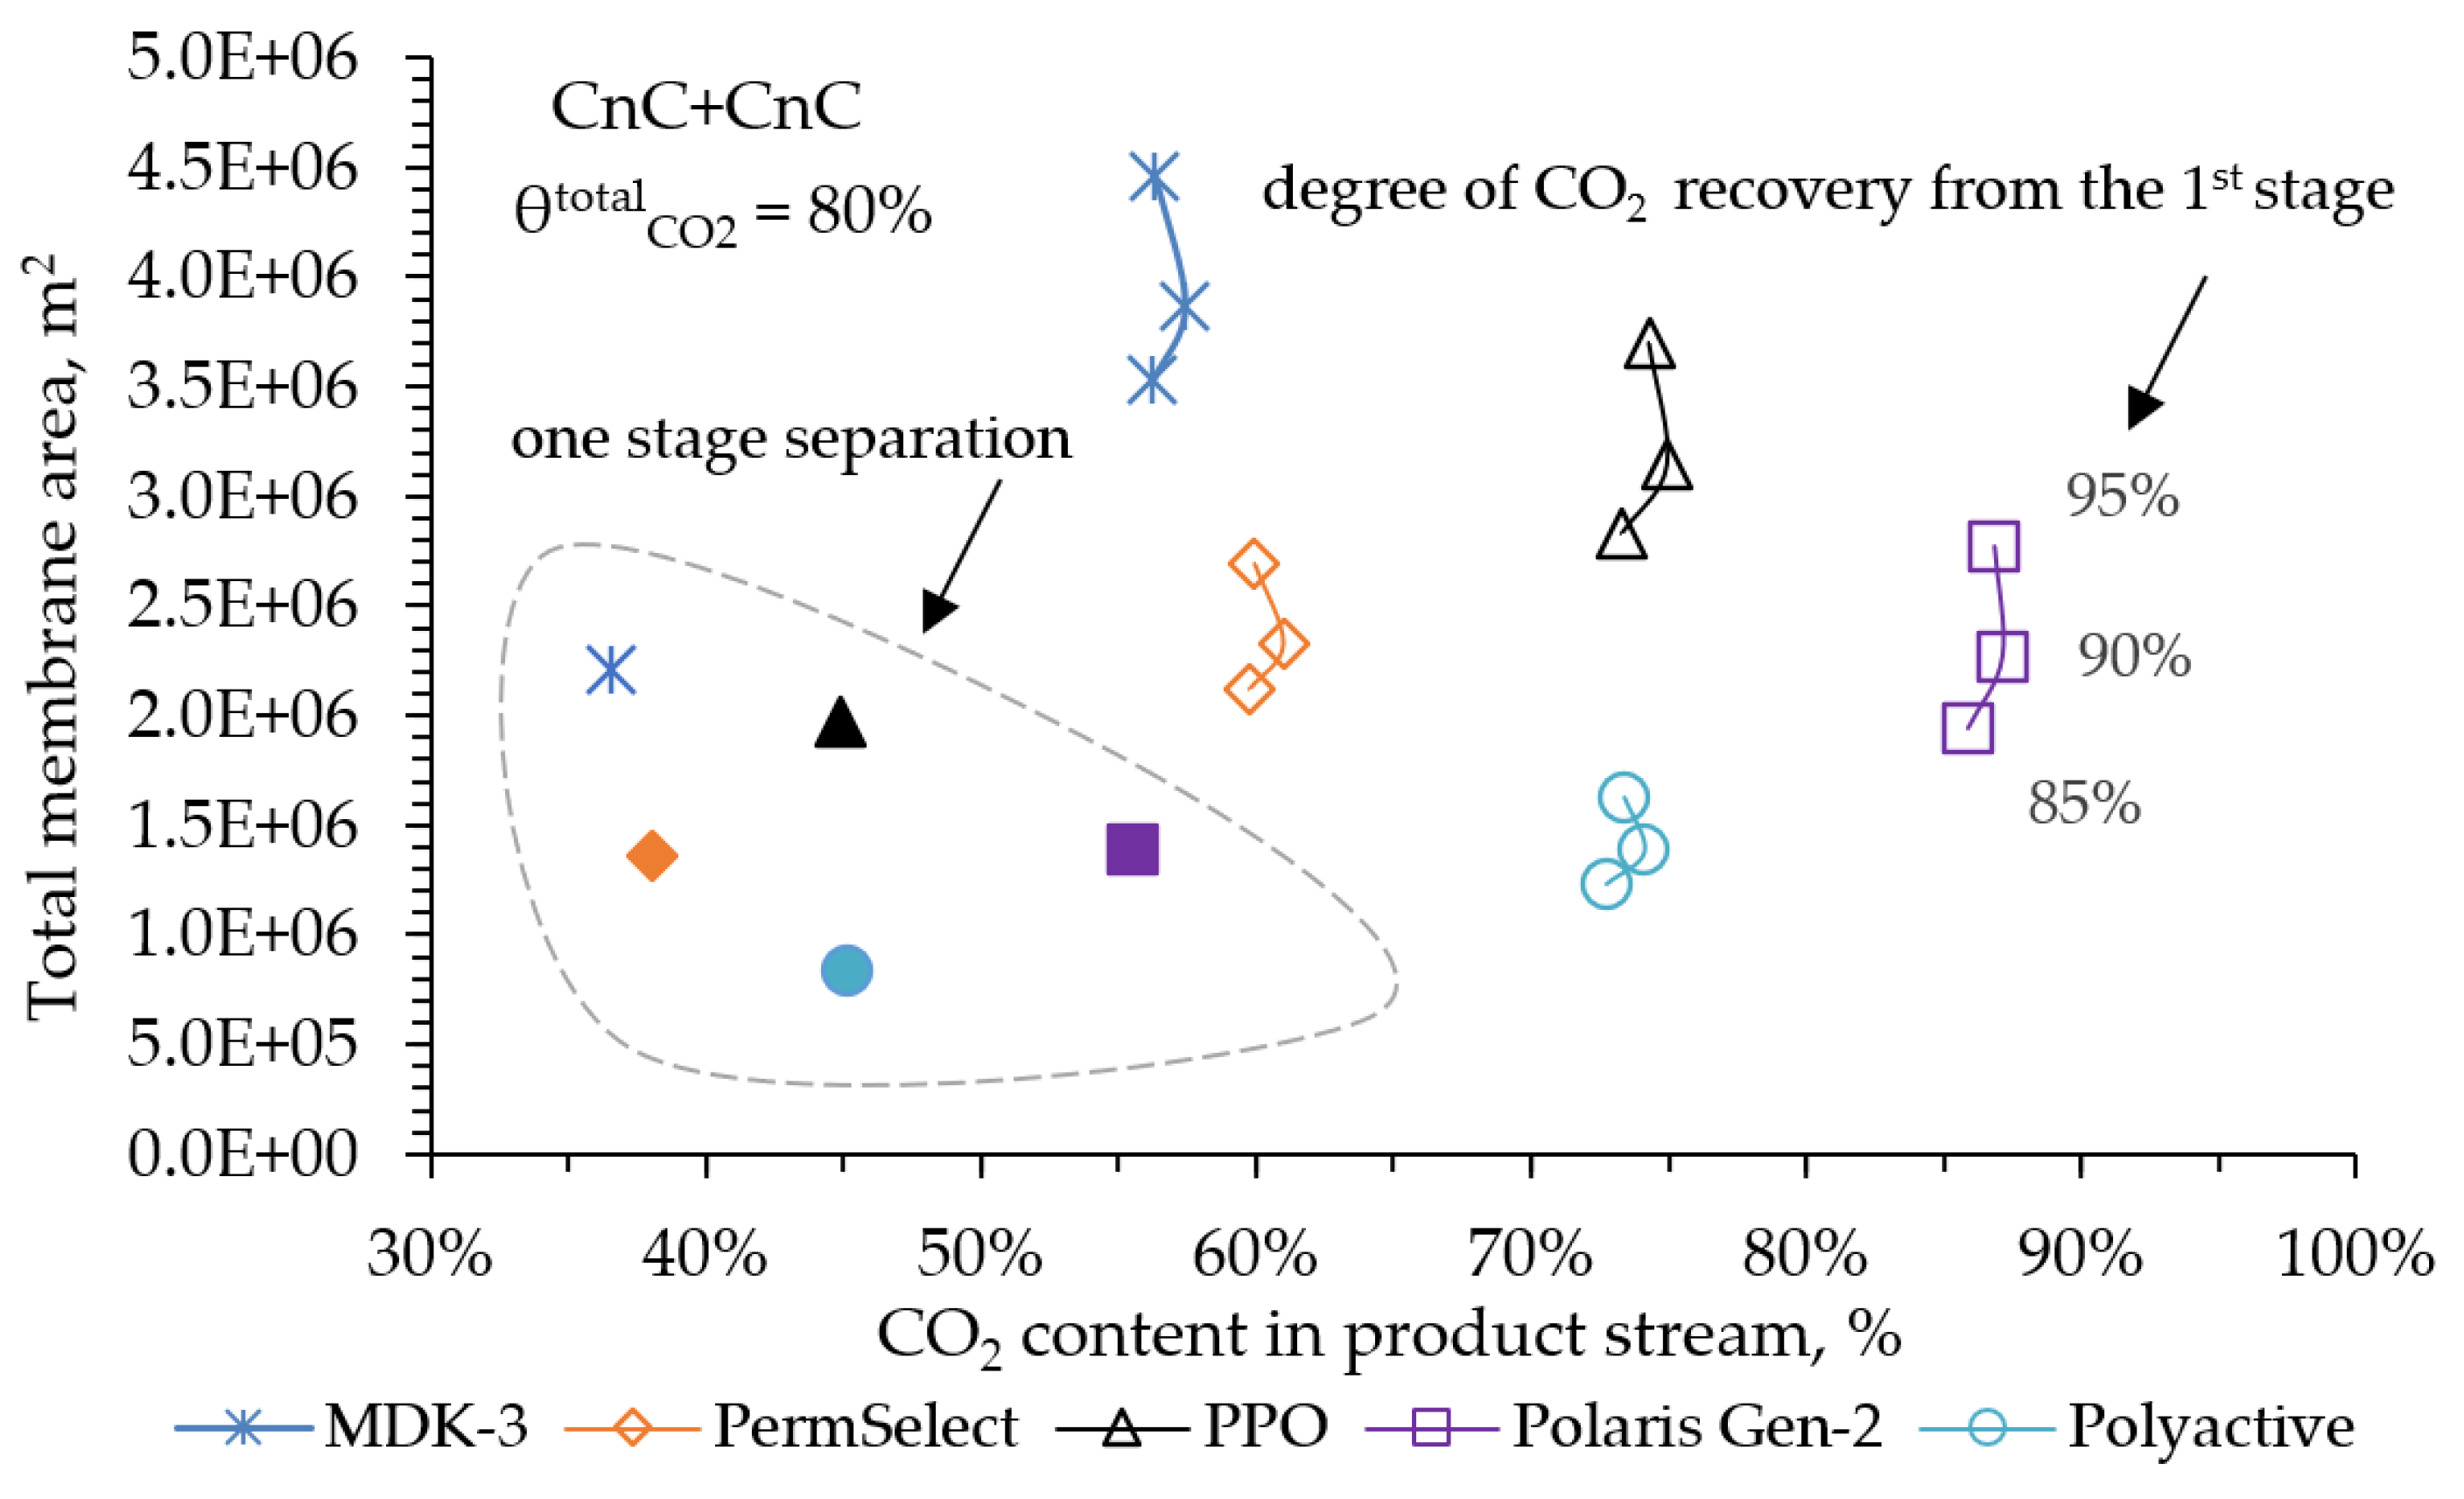
In the second case, an option was considered, where the degree of CO2 capture was more important parameter. The calculation criterion was to achieve the final degree of capture equal to 80%, which meets the IEA specifications already. In this case, we were also interested in understanding what values of final CO2 concentration in the product stream and total required membrane areas could be provided by the membranes considered in this paper. The simulation results are shown in
Figure 8.
In the obtained dependence for all membranes and in this case the optimal value for the degree of CO
2 capture at the first stage is distinguished, providing the maximum final concentration of CO
2 with the minimum required membrane area for two-stage separation. In this case, the optimal value of CO
2 capture at the first stage is 90%. Similar to
Figure 7, on the
Figure 8 PPO and PolyActive membranes provide equal values of CO
2 concentration in the product stream ~ 75 mol%. However, when using the PolyActive membrane the required membrane area is 2.3 times less. The Polaris (Gen-2) membrane allows capture about 87 mol% of CO
2, which is 13 mol% more than when using the PolyActive membrane. At the same time, the area of the Polaris (Gen-2) membranes will be required 1.6 times more.
The single markers on the Figure indicate the results of modeling a single-stage process also with a CO
2 capture degree of 80%. Calculations show that with a single-stage separation to achieve the same value of the overall CO
2 capture degree as with a two-stage separation, its final concentration is on average 30 mol% lower. In this case, if we consider the extreme points of CO
2 capture from the second stage at 0 and 100%, then the values of the final concentration and the total required area with a two-stage separation will approach the values obtained in the calculation of the single-stage separation. That is, when considering these two extreme points of the two-stage scheme, it is reduced to a single-stage one. In this regard,
Figure 7 and
Figure 8 show the optima for CO
2 capture at the first stage to achieve a given overall CO
2 capture degree with a two-stage separation.
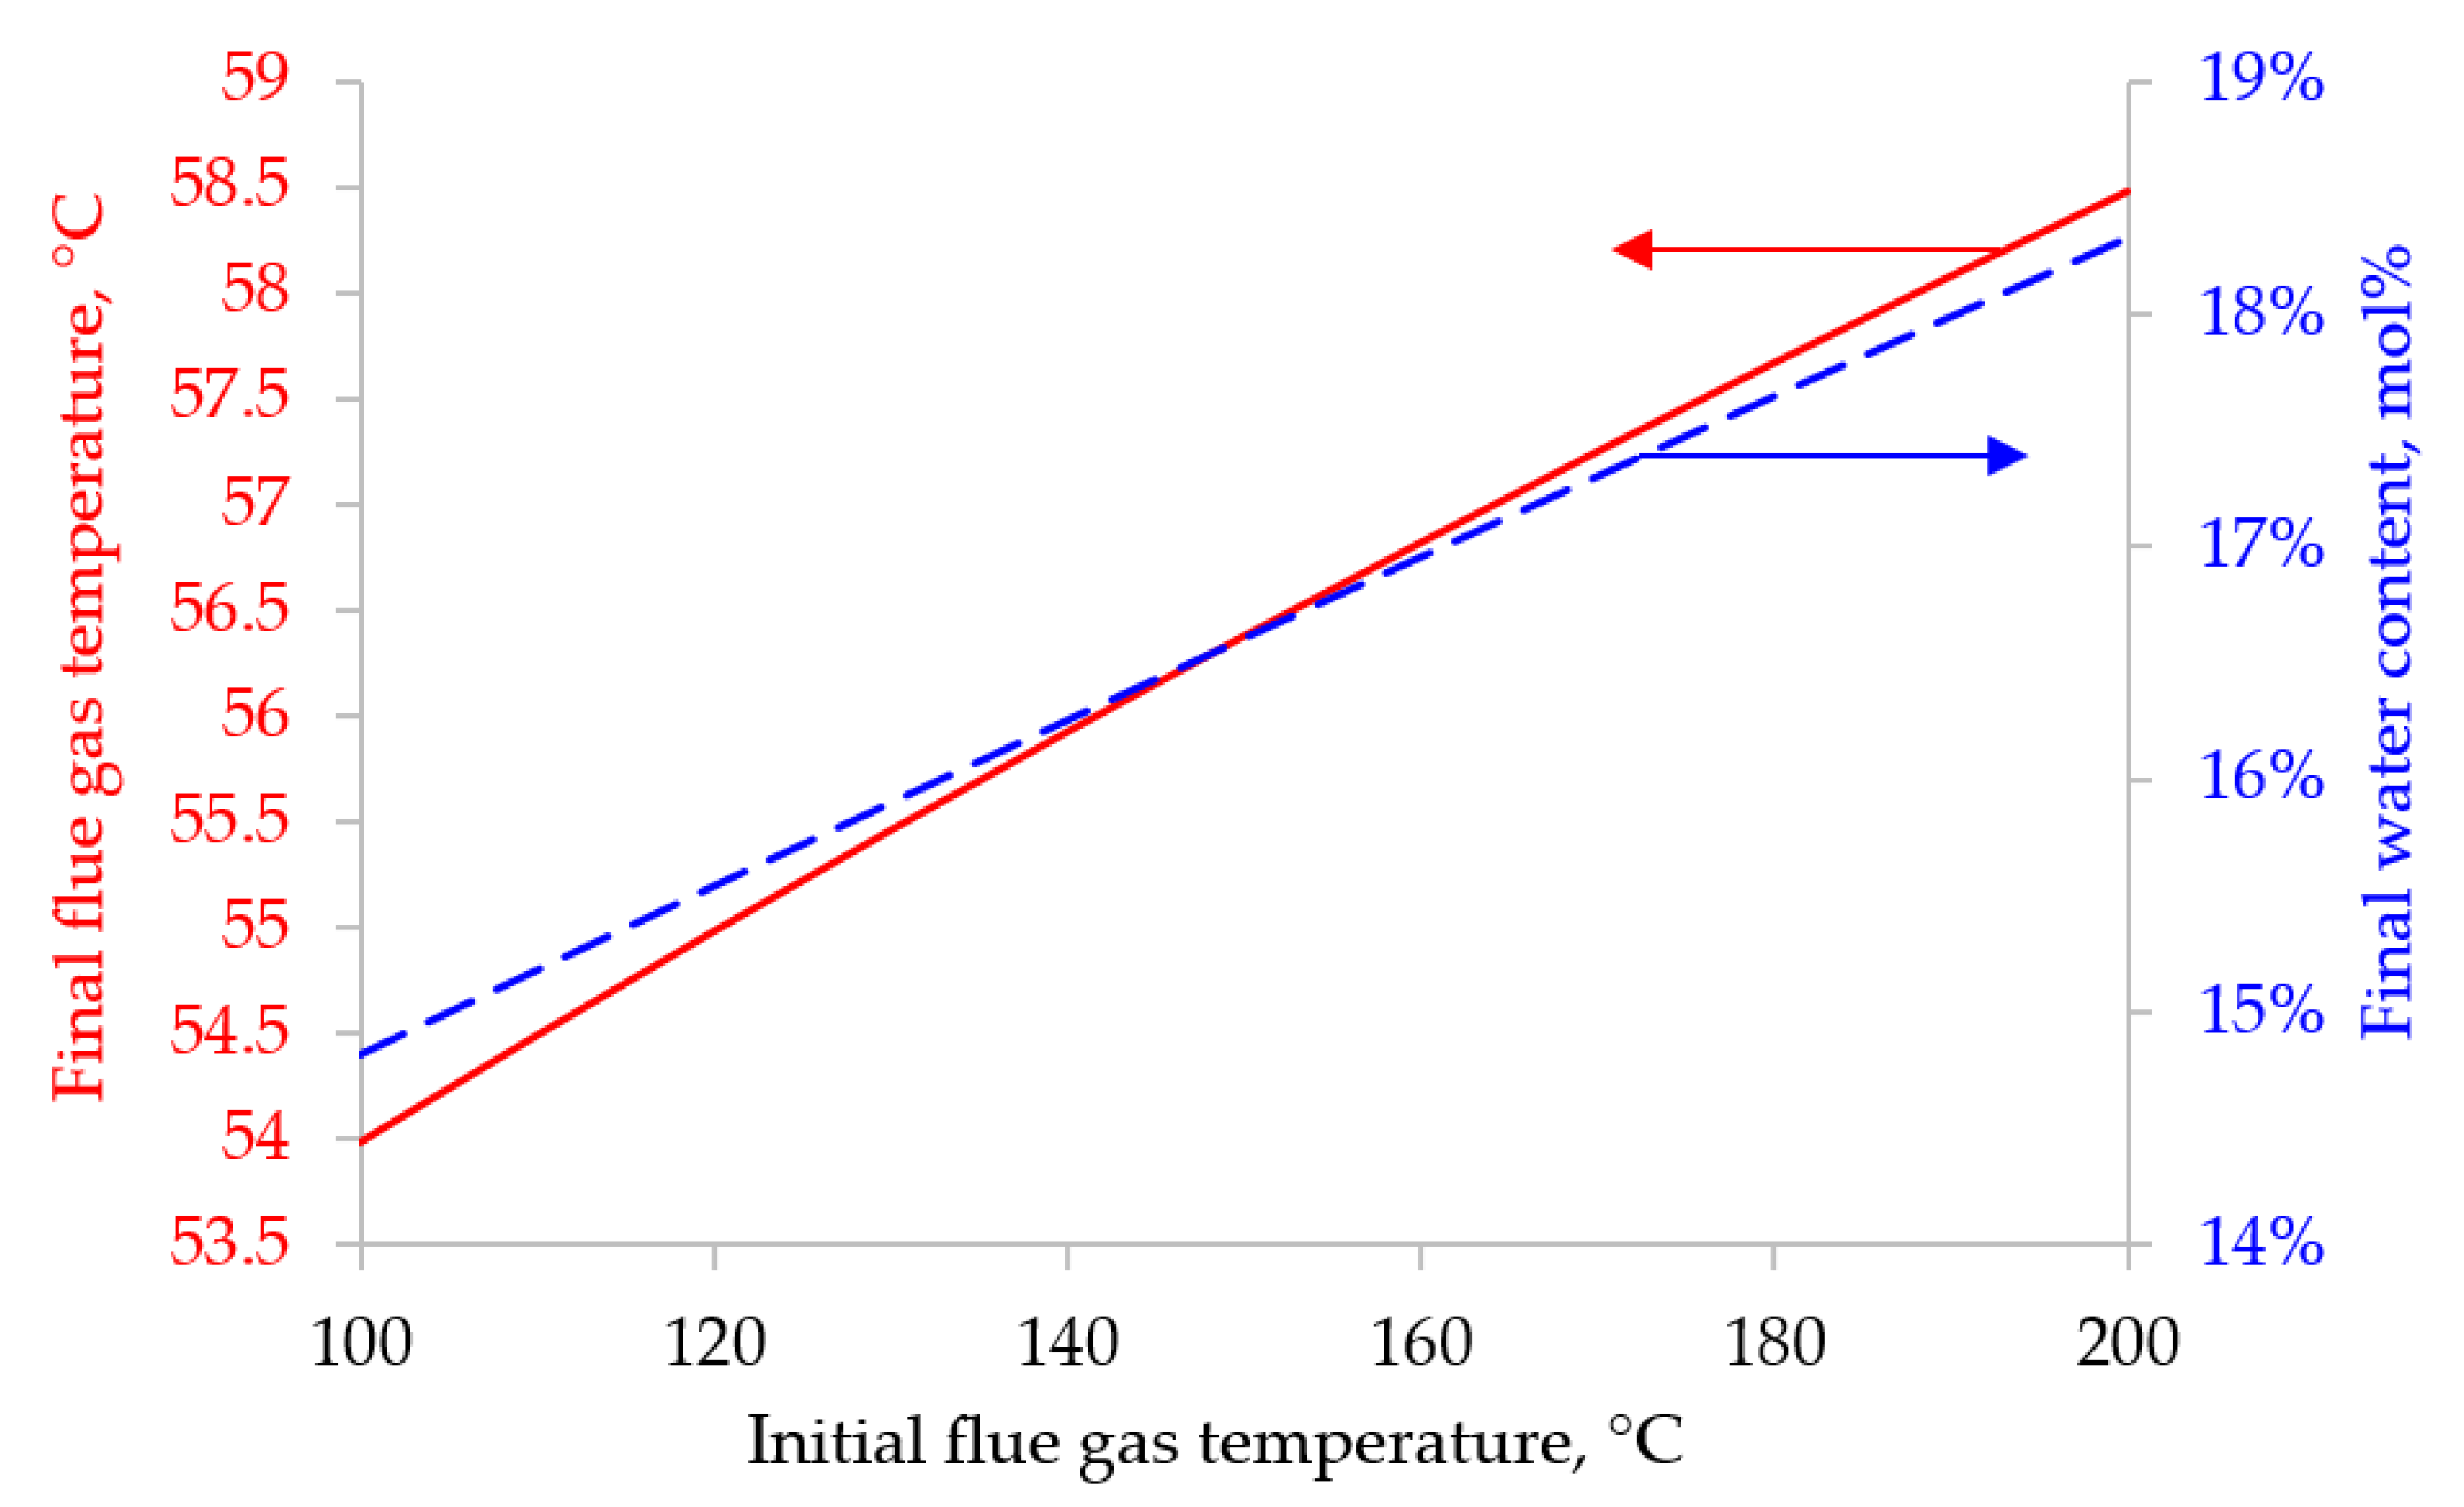
Also in our work, we propose the option of partial use of water obtained as a result of condensation of water vapor after the first and second stages of membrane separation as shown in
Figure 2. Since most polymer membranes are applicable in a very limited range of operating temperatures (up to 100 °C), and the flue gas temperature at the outlet of the pipe is always above 120 °C, the flue gas flow must be cooled. As a cooling agent of the initial flue gas flow, it is proposed to inject water before applying flue gas to the first stage of membrane separation. The following initial data were selected for the calculation: the water vapor content in the initial stream was 13 mol%, the cooling water temperature was 25 °C. The results of calculating the flue gas temperature change due to water injection are shown in
Figure 9 and
Figure 10.
When modeling the two-stage CO
2 capture from the flue gases of a thermal power plant, the initial flow temperature was set at 60.13 °C. This temperature corresponds to a water vapor content of 18 mol%. According to the results shown in
Figure 9, these data correspond to an initial flue gas temperature range of 180 to 200 °C. And as the results shown in
Figure 10, in order to cool the initial flue gas flow with such a temperature to 60.13 °C, 0.045 - 0.052 kg/m
3 (STP) of cold water with a temperature of 25 °C must be injected into the initial flow before feeding it to the first stage of membrane separation.
This study does not discuss all the issues of using gas separation membranes to extract CO2 from flue gases. For example, most of the membranes under consideration are hollow fibers, which, in real use, can lead to problems such as a noticeable drop in inlet pressure (additional energy consumption) and outlet pressure (loss of vacuum) or capillary condensation of water vapor inside the hollow fibers. The stability of membrane materials under technological conditions in the presence of typical impurities in flue gases also requires special studies, as was done by MTR.
4. Conclusions
Our calculations demonstrate that the presence of water vapor in the flue gases of a thermal power plant impacts the mass transfer of CO2 during its extraction using the membrane method. This occurs because the CO2 is diluted in the permeate with water vapor, reducing its partial pressure and increasing the driving force for its transfer. This, in turn, affects the required membrane area.
Therefore, when considering the influence of water vapor on the release of CO2 from flue gases, the required membrane area is approximately 1.6 times smaller than without considering their influence. This applies to various types of gas separation membranes and different CO2 capture degree.
The final value of the required membrane area (one of crucial factor of capital expenses) and the CO2 concentration in the product stream are also affected by the flow modes within the membrane module. Having examined three different flow modes in the membrane module for single-stage CO2 capture it was discovered that when the capture degree is below 80%, the cross-flow and counter-current modes provide close indicators for the membrane area, while the cocurrent-flow mode proves to be less efficient even when the capture degree exceeds 60%. In this context, in the area of low capture degree, any flow pattern within the membrane module can be chosen, while in the area of high capture degree, the counter-current mode has a slight advantage over the cross-flow mode.
When considering the vacuum two-stage scheme, we found that both at low and high values of the CO2 capture degree, the combination of counter-current mode in the first and second stages is optimal. However, the combination of counter-current in the first stage and cross-flow mode in the second stage was about 7% less effective in terms of separation.
Two cases were further considered:
- (1)
when a higher CO2 content in the stream is required, and
- (2)
when the amount of CO2 capture is more important.
In both cases, there is an optimum combination of membrane area in the first and second stages that achieves the maximum CO2 content in the product stream. For case 1, where total capture was 50%, the optimum was 70% capture at the first stage. There the Polaris (Gen-2) membrane allows for a maximum CO2 content of 95 mol% in the product stream with the minimum required membrane area. Both PolyActive and PPO membranes achieve a similar CO2 content (~ 86 mol%) in the product stream, but in the use of PolyActive membrane, the required membrane area is 2.4 times less.
For case 2, where the CO2 total capture degree was 80%, the optimal CO2 capture degree at the first stage was 90%. Using the Polaris (Gen-2) membrane, we can obtain ~ 87 mol% CO2 in the product stream. Both PolyActive and PPO membranes would achieve 75 mol% CO2, but using a PolyActive membrane would require 2.3 times smaller area compared to a PPO-based membrane.
We also offer a solution for the partial use of water vapor condensate after each stage of membrane separation to cool the initial flue gas stream. The dependencies of the final temperature of the flue gases and the concentration of water vapor in the initial stream after water injection, as well as the dependence of the flow rate of the injected water on the initial temperature of the flue gases, are shown.