
Submitted:
06 August 2024
Posted:
08 August 2024
You are already at the latest version
Abstract
Carbon capture, utilization, and storage (CCUS) considered a the key strategy for reducing the emissions of anthropogenic carbon dioxide from power generation plants, can be achieved by three main technologies: oxy-fuel combustion, pre-combustion, and post-combustion capture.
Post-combustion carbon capture (PCC), where CO2 is removed after the fuel burning, is a crucial solution for reducing greenhouse gas emissions from natural gas power plants (NGPPs). However, high costs and energy penalties associated with PCC technologies hinder their widespread adoption.
Recent advancements in hybrid PCC configurations have shown promise in improving efficiency and reducing costs. In effect, six PCC hybrid configurations below were identified as feasible process routes:
• 2S-AB +AD: Two-stage Absorption + Adsorption hybrid
• 2S-AB +MB: Two-stage Absorption + Membrane hybrid
• 2S-AD +AB: Two-stage Adsorption + Absorption hybrid
• 2S-AD +MB: Two-stage Adsorption + Membrane hybrid
• 2S-MB +AB: Two-stage Membrane + Absorption hybrid
• 2S-MB +AD: Two-stage Membrane + Adsorption hybrid
Each hybrid has its own technical and economic challenges that need to be investigated in order to identify the best technique for carbon capture. In this paper, we performed Aspen Hysys design simulation of the six hybrids PCC configurations and also their economic evaluations using parameters like investment costs, operating costs, net present value, and rate of return, culminating in the use of three assessment parameters namely, levelized cost of electricity (LCOE), carbon emission intensity (CEI) and cost of carbon avoidance (COA), to evaluate the six hybrids PCC configurations and to determine the most viable option.
Overall, it was found by dimensional analysis that the post combustion carbon capture using 2S-MB +AB: Two-stage Membrane + Absorption hybrid is the most viable for capturing CO2 from power generation plants and is hereby recommended. However, the choice of materials (membranes and absorbents) needs to be evaluated so as determined the best optimal configuration for commercialization.
Keywords:
CO2 capture
; post-combustion carbon capture
; hybrid configurations
; design
; simulation
; economic evaluations
; dimensional analysis
Highlights
The research focuses on natural gas power plants, addressing the need for efficient carbon capture solutions in this sector.
Hybrid post-combustion carbon capture configurations combining absorption, adsorption and membrane technologies were investigated for cost-effective carbon capture in natural gas power plants.
A comprehensive dimensional analysis was applied to identify key parameters influencing costs and optimize system design.
Cost reduction strategies were identified, including process optimization, equipment selection, and operational improvements
Comparative studies of hybrid configurations were performed to determine the most cost-effective solution for carbon capture.
Overall, it was found by dimensional analysis that the post combustion carbon capture using Two-stage Membrane + Absorption hybrid is the most viable for capturing CO2 from power generation plants.
The findings provide valuable insights for industry professionals, researchers, and policymakers working towards cost-effective carbon capture and reduction of greenhouse gas emissions.
1. Introduction
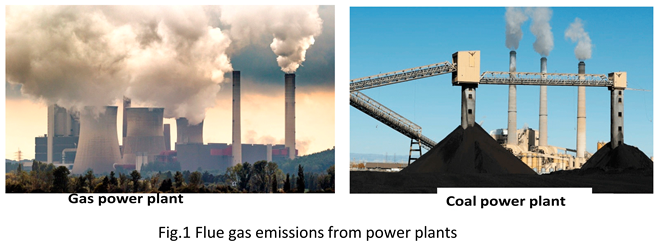
The increasing global concern about climate change and greenhouse gas emissions has led to a growing interest in carbon capture and storage (CCS) technologies. The generation of electricity from fossil fuels remains a significant source of carbon emissions, contributing to climate change and air pollution. Power plants burning coal, natural gas, and oil release large quantities of carbon dioxide (CO2), nitrogen oxides (NOx), sulfur dioxide (SO2), and particulate matter (PM) into the atmosphere (Figure 1).
Carbon emissions from power plants are a primary driver of global warming, accounting for approximately 42% of total CO2 emissions worldwide (IPCC, 2022). The combustion of fossil fuels releases CO2, which accumulates in the atmosphere, trapping heat and leading to global warming (Hansen et al., 2020). Rising temperatures have severe consequences, including: Sea-level rise and ocean acidification (Church et al., 2021); Extreme weather events like heatwaves, droughts, and floods (IPCC, 2021); Changes in precipitation patterns and water scarcity (Hansen et al., 2020); Loss of biodiversity and ecosystem disruption (WWF, 2022)
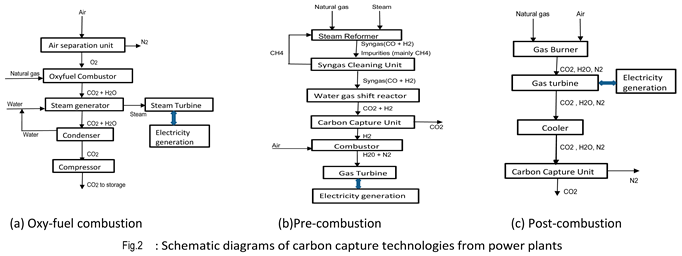
Thus, power plants are a significant source of carbon dioxide (CO2) emissions that causes global warming and drives climate change. The quest to mitigate climate change has brought attention to the significant contribution of power plants to global carbon emissions. As the world transitions to a low-carbon economy, the need to reduce greenhouse gas emissions from power generation has become increasingly urgent. Carbon capture and storage (CCS) technologies have emerged as a crucial strategy for reducing emissions from power plants and implementing CCS technologies in these plants is crucial in reducing their carbon footprint. Among the various CCS options, oxy-fuel combustion, pre-combustion, and post-combustion technologies have shown promise (Figure 2), however post- combustion capture is the preferred method since it can be easily retrofitted into the existing power plants (Figure 2c) and has cost-benefit advantage (Obi, D et.al 2024).
Several technologies are available to separate and capture CO2 from power plant flue gas through post-combustion strategy, such as absorption, adsorption, and membrane separations through the use of absorbents, adsorbents and membrane materials respectively, and the improvement of process designs/configurations (single, double, multi-stage and hybrid).
Post-combustion carbon capture (PCC) is a crucial solution for reducing greenhouse gas emissions from natural gas power plants (NGPPs), which account for approximately 20% of global CO2 emissions (IEA. 2022) However, high costs and energy penalties associated with PCC technologies hinder their widespread adoption (NOAA. 2022, Boot-Handford et al. 2020). Recent advancements in hybrid PCC configurations have shown promise in improving efficiency and reducing costs (Li et al. 2022, Wang et al. 2022. These hybrid systems combine different capture technologies, such as chemical solvents, membranes, and adsorbents, to leverage their strengths and minimize weaknesses (Zhang et al. 2022, Smith et al. 2022). Dimensional analysis has emerged as a valuable tool for optimizing system design, reducing costs, and enhancing performance (Peters et al. 2020, Liu et al. 2022).
This study aims to investigate the cost optimization and cost-effectiveness of hybrid PCC configurations in NGPPs through dimensional analysis. By comparing different hybrid configurations, this research seeks to identify the most cost-effective solutions for carbon capture in NGPPs, aligning with global efforts to combat climate change.
2. Methodology
Six hybrid configurations have been identified as the feasible routes for PCC (Obi D. et al.2024). They include:
- 2S-AB +AD: Two-stage Absorption + Adsorption hybrid
- 2S-AB +MB: Two-stage Absorption + Membrane hybrid
- 2S-AD +AB: Two-stage Adsorption + Absorption hybrid
- 2S-AD +MB: Two-stage Adsorption + Membrane hybrid
- 2S-MB +AB: Two-stage Membrane + Absorption hybrid
- 2S-MB +AD: Two-stage Membrane + Adsorption hybrid
Thus, eight techno-economic parameters are used to comprehensively evaluate the CCS methods (Figure 1) to determine the best process route. They include:
- Total investment cost (TIC)
- Total Product cost (TPC)
- Net present value (NPV)
- Rate of return on investment (ROI)
- Discounted Cash-Flow Rate of Return (DCFRR)
- Levelized cost of electricity (LCOE)
- Carbon emission intensity (CEI)
- Cost of carbon avoidance (COA)
2.1. Total Investment Cost
The total investment cost (TIC) of a project is the sum of the fixed and working capital needed to start the project. Thus, TIC comprise of purchased equipment costs, installation costs and working capital to start up the plant. Total Investment cost is determined following standard process design cost estimation procedure, as explained in (Peters et al 2017), where the purchased cost of the major equipment is used as the basis of the factorial method to determine the remaining costs.
Purchased equipment costs are based on dimensions obtained from the simulation in Aspen HYSYS V12. The major equipment includes Reactors, separation equipment, storage vessels, pumps, compressors, blowers, heat exchangers). Calculation of each equipment cost will be done using Aspen In-Plant Cost Estimator, based on equipment dimensioning parameters obtained by simulation using Aspen Plus.
After determining the major equipment costs, the remaining costs to be factored depending on the type of process plant which for this case of fluid processing plant are as shown in Table 1:
2.2. Operating Costs
Operating costs is the cost of running the plant and producing the product hence also known as total product cost or production cost (TPC). An estimate of the TPC is needed to judge the viability of a project, and to make choices between possible alternative processing schemes.
They are divided into two groups:
Fixed operating costs: costs that do not vary with production rate. These are the bills that must be paid whatever the quantity produced.
Variable operating costs: costs that are dependent on the amount of product produced.
These costs can be estimated from the flowsheet, using factorial method as shown in Table 2.
2.3. Net Present Value (NPV)
Net Present Value (NPV) is a financial metric that measures the value of an investment by calculating the present value of all expected future cash flows and comparing this to the initial investment. The NPV formula is:
where:
NPV = Net Present Value
NCFt = Net Cash flow at time period, t
t = required return or discount rate (or cost of capital)
t = time period (yearly)
TCI = total capital investment (Initial Investment, negative cash flow)
The key benefit of NPV is the fact that it considers the time value of money (TVM), translating future cash flows into the value of today’s money (dollars). Because inflation can erode buying power, NPV provides a much more useful measure of a project’s potential profitability. In addition, net present value formulas provide a single, clear number that can compare with the initial investment to work out the success of a project or investment. The discount rate (r) reflects the opportunity cost of capital, risk, and inflation. A higher discount rate means that future cash flows are worth less today, and a lower discount rate increases the NPV.
2.4. Discounted Cash-Flow Rate of Return
Discounted Cash Flow Rate of Return (DCFRR) is the rate of return that equates the present value of future cash flows with the investment’s cost. In other words, it is the discount rate that makes the net present value (NPV) of the cash flows equal to zero.
The formula for calculating DCFRR is:
DCFRR = r
Where:
r = discount rate that satisfies the equation:
To calculate DCFRR, you need to iterate the value of r until the NPV equals zero. This is done using financial software or programming languages: Excel, Python. DCFRR and is a measure of the maximum rate that the project could pay and still break even. Finding the discount rate that just pays off the project investment over the project’s life is analogous to paying off a mortgage. The more profitable the project is, the higher the DCFRR that it can afford to pay. DCFRR provides a useful way of comparing the performance of capital for different projects; independent of the amount of capital used and the life of the plant, or the actual interest rates prevailing at any time. Other names for DCFRR are interest rate of return and internal rate of return.
2.5. Levelized Cost of Electricity (LCOE)
LCOE is the average net present cost of producing energy for a specific system, considering all costs over the system’s lifetime. building and operating the asset per unit of total electricity generated over an assumed lifetime. Calculating the LCOE is related to the concept of assessing a project’s net present value. Like using NPV, the LCOE can be used to determine whether a project will be a worthwhile venture. The LCOE is also an important calculation to compare different energy-producing technologies, regardless of unequal life spans, differing capital costs, size of the projects, and the differing risk associated with each project.
The formula for determining the LCOE for carbon capture from natural gas power plants is as follows:
2.6. CO2 Emission Intensity
Carbon intensity, also known as emission intensity, is the measurement of emissions of CO2 per unit of a specific activity or industrial process, in this case power plant with carbon capture (Moro and Hermers, 2017; EPA 2024). The formula for calculating carbon emissions intensity is (IPCC, 2023):
Total Carbon Dioxide (CO2) Emissions are the sum of Direct Emissions and Indirect Emissions (energy and non-energy related)
2.7. Cost of CO2 Avoidance (COA)
Cost of Carbon Avoidance (COA) is a metric used to evaluate the cost-effectiveness of carbon capture and storage (CCS) projects (Roussanaly, S. (2019). It represents the cost of avoiding one ton of carbon dioxide (CO2) emissions. The formula for COA is:
Where:
Total Project Cost includes all costs associated with the CCS project, such as capital costs, operating costs, and maintenance costs.
Total CO2 Emissions Avoided represents the total amount of CO2 emissions that are avoided or reduced as a result of the CCS project.
The COA is typically expressed in terms of cost per ton of CO2 avoided, such as $/tCO2
3. Results and Discussion
Table 3 shows the field data (composition, properties, operating conditions and flowrate) of the Nigerian natural gas power plant used in the analysis.
The Aspen simulation results-based power plant specifications shown in Table 3 are shown in Table 4:
3.1. Discussion and Analyses
The summary of the results is shown in Table 5:
In carbon capture from natural gas power plants, a lower investment cost is generally preferred over a higher investment cost. This is because lower investment costs mean: Less upfront capital expenditure requirements, greater affordability and accessibility for carbon capture technology, potential for faster returns on investment and higher investment costs. On the other hand, high investment cost can: Increase the financial burden on investors or plant owners, delay or discourage investment in carbon capture technology, limit the adoption and deployment of carbon capture technology. Thus, from Table 5, 2S-AB + MB has the lowest Investment cost of $968,542,029.00 while 2S-AD + MB has the highest investment cost of $974,645,217.00.
However, it’s important to consider other factors when evaluating the overall viability and effectiveness of carbon capture technology in natural gas power plants. For instance, a lower LCOE is generally preferred in carbon capture from natural gas power plants, as it indicates a lower cost of electricity generation and increased efficiency. A lower LCOE suggests that the cost of capturing carbon dioxide is minimized, making the technology more competitive with other forms of electricity generation. A higher LCOE, on the other hand, indicates a higher cost of electricity generation, which may make the technology less competitive and less economically viable. Thus, in Table 5, 2S-AB + MB has the LCOE of $651.1117874/MWh, higher than 2S-AD + MB with LCOE of $545.5409734/MWh while 2S-AD + AB has the lowest value of $503.4920413/MWh and 2S-MB + AB has the highest value of $721.2756674/MWh.
In carbon capture from natural gas power plants, a lower operating cost is generally preferred over a higher operating cost. This is because lower operating cost (total production cost) means: Higher profits or lower electricity costs for consumers, increased competitiveness in the market, greater flexibility to invest in maintenance, upgrades, or research and development. On the other hand, high operating costs can lead to: Reduced profits or higher electricity costs for consumers, decreased competitiveness in the market and reduced flexibility to invest in maintenance, upgrades, or research and development. Thus, oxyfuel combustion has the highest NPV while Post-combustion capture has the least. Similarly, a higher NPV (Net Present Value) is generally preferred over a lower NPV because higher NPV indicates higher profits or economic benefits, which make the project more financially viable and attractive to investors. Higher NPV also suggests that the project will generate more value over its lifetime, which can help offset the costs of carbon capture and storage. On the other hand, lower NPV may indicate that the project is less financially viable or may not generate enough value to justify the investment.
Thus, from Table 5, 2S-AB + MB has the lowest in both operating costs and NPV while 2S-AD + MB has the highest in both.
A lower CEI is preferred in carbon capture from natural gas power plants. CEI measures the amount of greenhouse gas emissions per unit of electricity generated, typically measured in kgCO2/KWh or tCO2/MWh. A lower CEI indicates that the power plant emits less greenhouse gases per unit of electricity generated, making it a cleaner and more efficient and effective operation. On the other hand, a higher CEI indicates higher greenhouse gas emissions per unit of electricity generated, which may make the technology less competitive and potentially less viable. Thus, from Table 5, 2S-AD + AB has the lowest CEI of 0.147 kgCO2/kWh while 2S-MB + AB has the highest value of 0.2042 kgCO2/kWh.
COA represents the cost of avoiding a unit weight measure of greenhouse gas emissions, typically measured in $/tCO2. Thus, a lower COA is preferred in carbon capture from natural gas power plants because it means improved capture technology, increased efficiency in the power generation process, economics of scale and more government incentives and policies. On the other hands, higher COA indicates a higher cost of avoiding greenhouse gas emissions, which may make the technology less competitive and potentially less viable. Thus, from Table 5, 2S-AD + MB has the lowest COA value of $3414.270038/ton CO2 while 2S-AB + MB has the highest COA of $3543.465509/ton CO2.
3.2. Dimensional Analysis
It can be seen from the Table 5 and discussions above that each technology does not have it all as each have its own merits and demerits. Thus, in order to properly identify the best technological option for carbon capture from natural gas power plants gases, the seven techno-economic factors identified and evaluated should be properly related to a cost factor CF, thus:
This is done here through dimensional analysis. Dimensional analysis is a mathematical technique used to analyze the relationships between physical quantities and their units (Zohuri, B. 2017; Swanson & Yang. 2020). It involves identifying the dimensions of a physical quantity, such as length, mass, time, etc., and manipulating them to: Check the consistency of equations and formulas, identify the relationships between physical quantities, simplify complex expressions and hence fit appropriate equation to them. From their relations (eq.1 to eq.6), TCI, OPC, NPV and NCF are already factored into LCOE, CEI and COA. Thus eq.7 reduces to:
Based on dimensional analysis the units of each term in eq.2 are determined as follows:
(i) CF
The cost factor is in dollars ($). In dimensional analysis, the components of $ can be broken down as follows:
Dollar (USD) = unit of currency (U). Thus $ is a dimensionless quantity, but it can be considered as a unit of: Value (V), Price (P), Cost (C). In terms of dimensional analysis, dollars can be expressed as: USD = V = P = C= L²M/T (in SI units), where: L = length, M = mass, T = time. This shows that dollars are a dimensionless quantity, but they can be related to physical quantities like value, price, or cost, which have dimensions similar to energy or work (L²M/T). Thus:
CF = L²M/T
(ii) LCOE
In dimensional analysis, the components of Levelized Cost of Electricity (LCOE) can be broken down as follows:
- LCOE = Cost of Electricity (COE) = Energy Cost (EC) = $/MWh (or $/kWh). Breaking down the dimensions:
- $ = USD (unit of currency) = V = P = C (value, price, cost) = LM/T (dimensionally)
MWh (or kWh) = Energy (E) = MLT⁻² (dimensionally). So, LCOE can be expressed as: LCOE = $/MWh = (LM/T) / (MLT⁻²) = L⁻¹T⁻¹. Therefore, the dimensional analysis of LCOE is:
LCOE = L⁻¹T⁻¹
This shows that LCOE is a measure of cost per unit energy, with dimensions inverse to those of energy (1/ET).
(iii) CEI
In dimensional analysis, the components of CEI can be broken down as follows:
CEI = Carbon Emissions (CE) per unit of Electricity Generated (EG)
This shows that CEI is a measure of mass per unit energy, with dimensions of mass per unit time and length (M/LT).
Therefore, the dimensional analysis of CEI is:
CEI = ML-1 T-1
(iv) COA
In dimensional analysis, the components of Cost of Avoided Carbon Emissions (COA) can be broken down as follows:
- COA = Cost (C) per unit of Avoided Carbon Emissions (ACE) = C/ACE = $/tCO2 (or $/kgCO2)
Breaking down the dimensions:
- $ = USD (unit of currency) = V = P = C (value, price, cost) = LM/T (dimensionally)
- tCO2 (or kgCO2) = Mass of Carbon Dioxide (M)
So, COA can be expressed as:
COA = $/tCO2 = (LM/T) / M= L/T
Therefore, the dimensional analysis of COA is:
COA = LT-1
This shows that COA is a measure of cost per unit mass, with dimensions of length per unit time (L/T).
Substituting into eq.8:
L²M/T = f(1/LT, M/LT, L/T)
Using dimensional analysis eq.8 becomes:
CF = (LCOE)a (CEI)b (COA)c
And eq. 13 becomes
L²MT-1 = (L-1 T-1)a (ML-1 T-1)b (L T-1 )c
Thus:
For L: 2 = - a - b + c
For T: -1 = - a- b – c
For M: 1 = b
Solving: a= -3/2; b=1; c= 3/2
Substituting into eq.14:
CF = (LCOE)-3/2 (CEI)1 (COA )3/2
Rearranging:
So, using eq.17 the CF for each capture technology is evaluated as follows:
| 7. Levelized cost of electricity (LCOE): $/MWh | 582.9698033 | 651.1117874 | 503.4920413 | 545.5409734 | 721.2756674 | 606.9620734 |
| 8. Total carbon emissions | 36750 | 36750 | 36750 | 36750 | 36750 | 36750 |
| 9. Carbon emissions intensity (CEI): kg CO2/kWh | 0.167045455 | 0.18375 | 0.147 | 0.159782609 | 0.204166667 | 0.175 |
| 10. Cost of avoided carbon (COA): $/ton CO2 | 3489.887258 | 3543.465509 | 3425.115927 | 3414.270038 | 3532.778779 | 3468.354705 |
2S-AB +AD: Two-stage Absorption + Adsorption hybrid: CF = 0.167(3489.89/582.97)3/2 = 2.45
2S-AB +MB: Two-stage Absorption + Membrane hybrid: CF = 0.184 (3543.47/651.11)3/2 = 2.34
2S-AD +AB: Two-stage Adsorption + Absorption hybrid: CF = 0.147 (3425.12/503.49)3/2 = 2.61
2S-AD +MB: Two-stage Adsorption + Membrane hybrid: CF = 0.160(3414.27/545.54)3/2 = 2.51
2S-MB +AB: Two-stage Membrane + Absorption hybrid: CF = 0.204 (3532.78/721.28)3/2 = 2.21
2S-MB +AD: Two-stage Membrane + Adsorption hybrid: CF = 0.175 (3468.35/606.96)3/2 = 2.39
CF actually represents the comparative cost of capturing one tCO2. So, the lower the value of CF the more viable the capture process in terms of overall consideration of the contending factors. Thus, based on this, post combustion carbon capture using 2S-MB +AB: Two-stage Membrane + Absorption hybrid with the lowest CF of is the most viable choice technology for PCC from natural gas power plants.
4. Conclusions and future direction
The primary goal of carbon capture is to reduce emissions. In this paper six feasible hybrid PCC configurations were considered namely:
- 2S-AB +AD: Two-stage Absorption + Adsorption hybrid
- 2S-AB +MB: Two-stage Absorption + Membrane hybrid
- 2S-AD +AB: Two-stage Adsorption + Absorption hybrid
- 2S-AD +MB: Two-stage Adsorption + Membrane hybrid
- 2S-MB +AB: Two-stage Membrane + Absorption hybrid
- 2S-MB +AD: Two-stage Membrane + Adsorption hybrid
Each has its own merits and demerits thus comprehensive techno-economic parameters were utilized to assess them to determine the most viable. They include:
- Total investment cost (TIC)
- Total Product cost (TPC)
- Net present value (NPV)
- Discounted Cash-Flow Rate of Return (DCFRR)
- Levelized cost of electricity (LCOE)
- Carbon emission intensity (CEI)
- Cost of carbon avoidance (COA)
No single technology has all the beneficial attributes of all thus dimensional analysis was used on the parameters to pinpoint the most viable one. Overall, it was found by dimensional analysis that the post combustion capture method using 2S-MB +AB: Two-stage Membrane + Absorption hybrid is the most viable for capturing CO2 from natural gas power generation plants and is hereby recommended.
However, the materials used in these analyses are amine solvents for absorption, activated carbon for adsorption and ceramic membrane for membrane separation, thus there is the need to perform these analyses on different absorbents, adsorbents and membrane materials so as determined the best optimal configuration for commercialization.
Nomenclature
| 2S-AB +AD: | Two-stage Absorption + Adsorption hybrid |
| 2S-AB +MB: | Two-stage Absorption + Membrane hybrid |
| 2S-AD +AB: | Two-stage Adsorption + Absorption hybrid |
| 2S-AD +MB: | Two-stage Adsorption + Membrane hybrid |
| 2S-MB +AB: | Two-stage Membrane + Absorption hybrid |
| 2S-MB +AD: | Two-stage Membrane + Adsorption hybrid |
| APC | Annual Product cost |
| CCS | Carbon capture and storage |
| CO2 | Carbon dioxide |
| CEI | Carbon emission intensity |
| COA | Cost of carbon avoidance |
| DCFRR | Discounted Cash-Flow Rate of Return |
| H2 | Hydrogen |
| KgCO2 | Kilogram of CO2 captured |
| KWh | Kilowatt-hour |
| LCOE | Levelized cost of electricity |
| MWh | Megawatt-hour |
| NGPPs | Natural gas power plants |
| NCF | Net cash flow |
| NPV | Net present value |
| NOx | Nitrogen oxides |
| PM | Particulate matter |
| PCC | Post-combustion carbon capture |
| PEC | Purchased Equipment cost |
| SO2 | Sulfur dioxide |
| tCO2/ton | Tons of CO2 captured |
| TIC | Total investment cost |
| TCI | Total capital investment |
References
- A.G. Olabi, Khaled Obaideen, Khaled Elsaid, Tabbi Wilberforce, Enas Taha Sayed, Hussein M. Maghrabie, Mohammad Ali Abdelkareem, Assessment of the pre-combustion carbon capture contribution into sustainable development goals SDGs using novel indicators, Renewable and Sustainable Energy Reviews, Volume 153, 2022, 111710, ISSN 1364-0321. [CrossRef]
- Adamu, Abdullahi & Russo Abegão, Fernando & Boodhoo, Kamelia. Process intensification technologies for CO2 capture and conversion – a review. BMC Chemical Engineering. 2020, 2. [CrossRef]
- Bahman, N., Al-Khalifa, M., Al Baharna, S. et al. Review of carbon capture and storage technologies in selected industries: potentials and challenges. Rev Environ Sci Biotechnol 22, 451–470 (2023). [CrossRef]
- CHAPTER 10 - Discounted Cash Flow Rate of Return, Editor(s): GEORGE S. KOCH, Computer Methods in the Geosciences, Pergamon, Volume 8, 1990, Pages 119-127, ISSN 1874-561X, ISBN 9780080402819. [CrossRef]
- Church, J. A., Clark, P. U., Cazenave, A., Gregory, J. M., Jevrejeva, S., Levermann, A., ... & Zicker, S. S. Sea level change. In Climate Change 2021: The Physical Science Basis. Contribution of Working Group I to the Sixth Assessment Report of the Intergovernmental Panel on Climate Change (pp. 1137-1216). Cambridge University Press. 2021. [CrossRef]
- Cong Chao, Yimin Deng, Raf Dewil, Jan Baeyens, Xianfeng Fan, Post-combustion carbon capture, Renewable and Sustainable Energy Reviews, Volume 138, 2021, 110490, ISSN 1364-0321. [CrossRef]
- EPA. Air Pollution and Health. United States Environmental Protection Agency, 2022.
- Hansen, J., Sato, M., Ruedy, R., Lo, K., Lea, D. W., & Medina-Elizondo, M. Ice melt, sea level rise and superstorms: Evidence from paleoclimate data, climate modeling, and modern observations that 2°C global warming above the preindustrial level would be dangerous. Atmospheric Chemistry and Physics 2020, 20(19), 10655-10665. [CrossRef]
- Hospital-Benito, D. & Lemus, Jesus & Moya, Christine & Santiago, Rubén & Paramio, C. & Palomar, J.. Aspen Plus supported design of pre-combustion CO2 capture processes based on ionic liquids. Separation and Purification Technology. 2022, 290. 12084. [CrossRef]
- . [CrossRef]
- Huang, Xiaoting & Ai, Ning & Li, Lan & Jiang, Quanda & Wang, Qining & Ren, Jie & Wang, Jiawei. Simulation of CO2 Capture Process in Flue Gas from Oxy-Fuel Combustion Plant and Effects of Properties of Absorbents. Separations. 2022, 9. 95. [CrossRef]
- Intergovernmental Panel on Climate Change (IPCC). Climate Change 2021: The Physical Science Basis. Contribution of Working Group I to the Sixth Assessment Report of the Intergovernmental Panel on Climate Change. Cambridge University Press. 2021.
- Intergovernmental Panel on Climate Change (IPCC). Climate Change and Land: an IPCC special report on climate change, desertification, land degradation, sustainable land management, food security, and greenhouse gas fluxes in terrestrial ecosystems. Cambridge University Press. 2022.
- International Energy Agency (IEA) (2022). Global Energy Review 2022.).
- IPCC Emission Factor Database (2023). IPCC Emissions Factor Database | GHG Protocol.
- Li et al. Hybrid post-combustion carbon capture process for natural gas power plants. Journal of Cleaner Production 2022, 377, 134111, Wang et al. Optimization of hybrid post-combustion carbon capture process for natural gas combined cycle power plants. Fuel 2022, 324, 123264.
- Li, J. Li, J., Wang, T., Liu, P. et al. Dynamic modelling and simulation of a post-combustion CO2 capture process for coal-fired power plants. Front. Chem. Sci. Eng. 16, 198–209 (2022). [CrossRef]
- Max Peters. Plant Design and Economics for Chemical Engineers 5th Edition. Google book. WEB Jan 16, 2019. https://archive.org/details/plantdesignecono0000pete.
- Moro, A., Helmers, E. A new hybrid method for reducing the gap between WTW and LCA in the carbon footprint assessment of electric vehicles. Int J Life Cycle Assess 22, 4–14 (2017). [CrossRef]
- National Oceanic and Atmospheric Administration (NOAA). Global CO2 emissions from fossil fuel combustion, 2022. Boot-Handford et al. Carbon capture and storage: A review of the current state of the art. Energy & Environmental Science 2020, 13(10), 2831-2851).
- Obi, D., Onyekuru, S., & Orga, A. Review of recent process developments in the field of carbon dioxide (CO2) capture from power plants flue gases and the future perspectives. International Journal of Sustainable Energy 2024, 43(1). [CrossRef]
- Peters et al. Plant design and economics for chemical engineers. McGraw-Hill, Liu et al. (2022). Cost optimization of carbon capture processes using dimensional analysis. Energy 2020, 238, 122102).
- Roussanaly, S. Calculating CO2 avoidance costs of Carbon Capture and Storage from industry. Carbon Management 2019, 10(1), 105–112. [CrossRef]
- Sujeet Yadav, S.S. Mondal, A review on the progress and prospects of oxy-fuel carbon capture and sequestration (CCS) technology, Fuel, Volume 308, 2022, 122057, ISSN 0016-2361. [CrossRef]
- Swanson, Norman R. (editor), Yang, Xiye. Recent Advances in Theory and Methods for the Analysis of High Dimensional and High Frequency Financial Data- from Econometrics (MDPI); 2020, 9783036508528, 9783036508535. [CrossRef]
- Wai Lip Theo, Jeng Shiun Lim, Haslenda Hashim, Azizul Azri Mustaffa, Wai Shin Ho, Review of pre-combustion capture and ionic liquid in carbon capture and storage, Applied Energy, Volume 183, 2016, Pages 1633-1663, ISSN 0306-2619. [CrossRef]
- Wall Street Prep. Net Present Value (NPV) | Formula + Calculator. Retrieved from (Return on Assets (ROA) | Formula + Calculator (wallstreetprep.com)), 2024.
- WallStreetMojo. DCFROr (Discounted Cash Flow Rate of Return). 2024. Retrieved from (https://www.wallstreetmojo.
- Zhang et al. Recent advances in hybrid carbon capture technologies. Chemical Engineering Journal 2022, 427, 131921, Smith et al. Dimensional analysis for process intensification and optimization. Chemical Engineering Research and Design 2022, 177, 102-115.
- Zohuri, B. Principles of the Dimensional Analysis. In: Dimensional Analysis Beyond the Pi Theorem, 2017.

Table 1.
Factorial method of Total Investment cost estimation.
| Direct Cost | ||
|---|---|---|
| Item | $ | |
| f1 | Purchased Equipment cost: from Aspen Plus flowsheet simulation | PEC |
| F2 | Purchased Equipment installations | 12% of PEC |
| F3 | Instrumentation and control (installed) | 12% of PEC |
| F4 | Piping (installed) | 20% of PEC |
| F5 | Electrical (installed) | 10% of PEC |
| F6 | Buildings (including process/services) | 18% of PEC |
| F7 | Yard improvement | 10% of PEC |
| F8 | Service facilities(installed) | 20% of PEC |
| F9 | Land | 5% of PEC |
| TOTAL DIRECT COST:∑(f1---f9) | DC | |
| Indirect Cost | ||
| f10 | Items | $ |
| F11 | Engineering Supervision | 12% of PEC |
| F12 | Construction expenses: EC | 15% of PEC |
| TOTAL INDIRECT COST:∑(f10---f12) | IC | |
| Other costs ($) | ||
| Items | $ | |
| F13 | Contractors’ fee | 10% of (DC +IC) |
| F14 | Contingency | 15% of (DC + IC) |
| TOTAL OTHER COSTS:∑(f13—f14) | OC | |
| Fixed Project Cost: DC + IC + OC | FPC | |
| Working Capital: 15% of FPC | WC | |
| Total Capital Investment: FPC + WC | TCI |
Table 2.
Operating capital/Total production cost determination.
| Operating/Production Cost | ||
|---|---|---|
| Variable Operating Cost | ||
| Items | Cost ($) | |
| F1 | Raw materials | 15% of TCI |
| F2 | Utilities | 5% of TCI |
| F3 | Miscellaneous materials | 1% of FPC |
| Total Variable Cost:∑(f1---f3) | VC | |
| Fixed Operating Capital | ||
| F4 | Maintenance cost (MC) | 10% of FPC |
| F5 | Operating Labour cost (OLC) | 50% of TCI |
| F6 | Laboratory Cost (LC) | 21% of OLC |
| F7 | Supervision Cost (SC) | 10% of OLC |
| F8 | Plant Overheads cost (POC) | 65% of OLC |
| F9 | Insurance Costs (IC) | 1% of FWC |
| F10 | Local taxes | 2% of FPC |
| Total Fixed Costs:∑(f4---f10) | FC | |
| General Overheads Cost: 8.5% of (VC + FC) | GOC | |
| Operating cost/ Production Cost: VC + FC + GOC | OPS | |
Table 3.
Field data of typical Nigerian natural gas .
| 1: Molar composition | |
| Chemical Compound | % mole |
| Methane | 90.19 |
| Ethane | 6.94 |
| Propane | 2.09 |
| N-butane | 0.361 |
| I-butane | 0.414 |
| N-pentane | 0.005 |
| I-pentane | 0.007 |
| 2. Operating conditions | |
| Gas flow rate, MMSCFD | 7498656 |
| Inlet temperature, °C | 45.94 |
| Inlet pressure, bar | 147.5 |
| 3. Gas properties | |
| Gas gravity, kg/m³ | 0.182 |
| Gas specific heat capacity, J/kgK | 2170 |
| Thermal capacity, MW | 1470 |
| 4. Ambient conditions | |
| Ambient pressure, bar | 143.27 |
| Ambient temperature, °C | 15 |
Table 4.
Aspen Simulation Results.
| 2S-AB +AD | 2S-AB +MB | 2S-AD +AB |
| Two-stage absorber: | Two-stage absorber: | Adsorber Stage 1 |
| Solvent: MEA (monoethanolamine) | Solvent: MEA (monoethanolamine) | Adsorbent: Zeolite 13X |
| Flow rate: 550 kg/s | Flow rate: 500 kg/s | Bed dimensions: 7 m diameter, 15 m height |
| Column dimensions: 12 m diameter, 25 m height | Column dimensions: 10 m diameter, 20 m height | Adsorption cycle: 3 hours |
| Operating conditions: 45°C, 1.8 bar | Operating conditions: 40°C, 1.5 bar | Desorption cycle: 2 hours |
| Inlet CO2 concentration: 12% (v/v) | ||
| Adsorber: | Membrane: | Outlet CO2 concentration: 6% (v/v) |
| Adsorbent: Zeolite 13X | Type: Polyamide | |
| Bed dimensions: 6 m diameter, 12 m height | Surface area: 1000 m² | Adsorber Stage 2 |
| Adsorption cycle: 2.5 hours | Selectivity: CO2/N2 = 50 | Adsorbent: Zeolite 13X |
| Desorption cycle: 1.5 hours | Permeance: 100 GPU (gas permeance unit) | Bed dimensions: 7 m diameter, 15 m height |
| Capture efficiency: 92% | Capture efficiency: 90% | Adsorption cycle: 3 hours |
| CO2 purity: 96% | CO2 purity: 95% | Desorption cycle: 2 hours |
| Membrane area: 5000 m² | Inlet CO2 concentration: 6% (v/v) | |
| Integration | Outlet CO2 concentration: 3% (v/v) | |
| Flue gas flow rate: 2200 kg/s | Integration | |
| - CO2 concentration: 11% (v/v) | Flue gas flow rate: 2000 kg/s | Absorber |
| Capture system energy consumption: 11% of power plant output | CO2 concentration: 10% (v/v) | Solvent: MEA (monoethanolamine) |
| Recycle ratio: 0.6 (absorber outlet to adsorber inlet) | Capture system energy consumption: 10% of power plant output | Flow rate: 600 kg/s |
| - CO2 capture rate: 1.3 million tons per year | Recycle ratio: 0.5 (absorber outlet to membrane inlet) | Column dimensions: 15 m diameter, 30 m height |
| Power plant efficiency penalty: 11.2% | CO2 capture rate: 1.2 million tons per year | Operating conditions: 50°C, 2.0 bar |
| Power Generation $ 1. Gas Turbine: 120,000,000 2. Heat Recovery Steam Generator (HRSG): 80,000,000 3. Steam Turbine: 50,000,000 4. Generator: 20,000,000 Carbon Capture System 1. Absorption Stage: Absorber Column: 2,500,000 Lean Amine Tank: 1,500,000 Rich Amine Tank: 1,000,000 Heat Exchangers: 2,000,000 Pumps and Valves: 1,400,000 2. Adsorption Stage: Adsorber Vessels (2-3): 2,250,000 Zeolite or Activated Carbon Adsorbent: 1,000,000 Desorption Heat Exchangers: 1,150,000 Pumps and Valves: 700,000 : 3. Hybrid System Components: Inter-stage Heat Exchanger: 1,000,000 Flash Tank: 500,000 Pumps and Valves: 1,400,000 |
Power plant efficiency penalty: 10.5% | Inlet CO2 concentration: 3% (v/v) |
| Power Generation $ 1. Gas Turbine: 120,000,000 2. Heat Recovery Steam Generator (HRSG): 80,000,000 3. Steam Turbine: 50,000,000 4. Generator: 20,000,000 Carbon Capture System 1. Absorption Stage: - Absorber Column: 2,500,000 - Lean Amine Tank: 1,500,000 - Rich Amine Tank: 1,000,000 - Heat Exchangers: 2,000,000 - Pumps and Valves: 1,400,000 2. Membrane Stage: Membrane Modules: 1,800,000 Compressors: 1,350,000 Heat Exchangers: 500,000 Pumps and Valves: 700,000 3. Hybrid System Components: Inter-stage Heat Exchanger: 1,000,000 Flash Tank: 500,000 Pumps and Valves: 1,400,000 |
Outlet CO2 concentration: 0.5% (v/v) | |
| Integration | ||
| CO2 capture rate: 1.5 million tons per year | ||
| Power plant efficiency penalty: 12.5% | ||
| Capture system capital cost: $600 million | ||
| Operating cost: $150 million per year | ||
| CO2 purity: 98% | ||
| Capture efficiency: 95% | ||
| Power Generation $ 1. Gas Turbine: 120,000,000 2. Heat Recovery Steam Generator (HRSG): 80,000,000 3. Steam Turbine: 50,000,000 4. Generator: 20,000,000 Carbon Capture System 1. Adsorption Stage: Adsorber Vessels (2-3): 4,500,000 Zeolite or Activated Carbon Adsorbent: 2,000,000 Desorption Heat Exchangers: 2,300,000 Pumps and Valves: 1,400,000 2. Absorption Stage: Absorber Column: 1,250,000 Lean Amine Tank: 750,000 Rich Amine Tank: 500,000 Heat Exchangers: 1,000,000 Pumps and Valves: 700,000 3. Hybrid System Components: Inter-stage Heat Exchanger: 1,000,000 Flash Tank: 500,000 Pumps and Valves: 1,400,000 | ||
| 2S-AD +MB | 2S-MB +AB | 2S-MB +AD |
| Two-stage adsorber: | Two-stage membrane: | Two-stage membrane: |
| Adsorbent: Zeolite 13X | Type: Polyamide | Type: Polyamide |
| Bed dimensions: 8 m diameter, 18 m height | Surface area: 1500 m | Surface area: 1800 m |
| Adsorption cycle: 3.5 hours | Selectivity: CO2/N2 = 70 | Selectivity: CO2/N2 = 80 |
| Desorption cycle: 2.5 hours | Permeance: 150 GPU (gas permeance unit) | Permeance: 180 GPU (gas permeance unit) |
| Membrane: | Absorber: | Adsorber: |
| Type: Polyamide | Solvent: MEA (monoethanolamine) | Adsorbent: Zeolite 13X |
| Surface area: 1200 m² | Flow rate: 700 kg/s | Bed dimensions: 10 m diameter, 20 m height |
| Selectivity: CO2/N2 = 60 | Column dimensions: 18 m diameter, 35 m height | Adsorption cycle: 4 hours |
| Permeance: 120 GPU (gas permeance unit) | Operating conditions: 55°C, 2.2 bar | Desorption cycle: 3 hours |
| Capture efficiency: 96% | Capture efficiency: 97% | Capture efficiency: 98% |
| -CO2 purity: 99% | CO2 purity: 99.5% | CO2 purity: 99.8% |
| Integration_ | Integration | Integration |
| Flue gas flow rate: 2600 kg/s | Flue gas flow rate: 2800 kg/s | Flue gas flow rate: 3000 kg/s |
| CO2 concentration: 13% (v/v) | CO2 concentration: 14% (v/v) | CO2 concentration: 15% (v/v) |
| Capture system energy consumption: 13% of power plant output | Capture system energy consumption: 14% of power plant output | Capture system energy consumption: 15% of power plant output |
| Recycle ratio: 0.8 (adsorber outlet to membrane inlet) | - Recycle ratio: 0.9 (membrane outlet to absorber inlet) | Recycle ratio: 0.95 (membrane outlet to adsorber inlet) |
| - CO2 capture rate: 1.9 million tons per year | CO2 capture rate: 2.1 million tons per year | |
| - Power plant efficiency penalty: 15.2% | Power plant efficiency penalty: 16.5% | |
| Power Generation $ 1. Gas Turbine: 120,000,000 2. Heat Recovery Steam Generator (HRSG): 80,000,000 3. Steam Turbine: 50,000,000 4. Generator: 20,000,000 Carbon Capture System 1. Adsorption Stage: Adsorber Vessels (2-3): 4,500,000 Zeolite or Activated Carbon Adsorbent: 2,000,000 Desorption Heat Exchangers: 2,300,000 Pumps and Valves: 1,400,000 2. Membrane Stage: Membrane Modules: 1,800,000 Compressors: 1,350,000 Heat Exchangers: 500,000 Pumps and Valves: 700,000 3. Hybrid System Components: Inter-stage Heat Exchanger: 1,000,000 Flash Tank: 500,000 Pumps and Valves: 1,400,000 |
Power Generation $ 1. Gas Turbine: 120,000,000 2. Heat Recovery Steam Generator (HRSG): 80,000,000 3. Steam Turbine: 50,000,000 4. Generator: 20,000,000 Carbon Capture System 1. .Membrane Stage: Membrane Modules: 3,600,000 Compressors: 2,700,000 Heat Exchangers: 1,000,000 Pumps and Valves: 1,400,000 2. Absorption Stage: Absorber Column: 1,250,000 Lean Amine Tank: 750,000 Rich Amine Tank: 500,000 Heat Exchangers: 1,000,000 Pumps and Valves: 700,000 3. Hybrid System Components: Inter-stage Heat Exchanger: 1,000,000 Flash Tank: 500,000 Pumps and Valves: 1,400,000 |
Two-stage membrane: |
| Type: Polyamide | ||
| Surface area: 1800 m | ||
| Selectivity: CO2/N2 = 80 | ||
| Permeance: 180 GPU (gas permeance unit) | ||
| Adsorber: | ||
| Adsorbent: Zeolite 13X | ||
| Bed dimensions: 10 m diameter, 20 m height | ||
| Adsorption cycle: 4 hours | ||
| Desorption cycle: 3 hours | ||
| -Capture efficiency: 98% | ||
| Power Generation $ 1. Gas Turbine: 120,000,000 2. Heat Recovery Steam Generator (HRSG): 80,000,000 3. Steam Turbine: 50,000,000 4. Generator: 20,000,000 Carbon Capture System 1. . Membrane Stage: Membrane Modules: 3,600,000 Compressors: 2,700,000 Heat Exchangers: 1,000,000 Pumps and Valves: 1,400,000 2. Adsorption Stage: Adsorber Vessels (2-3): 2,250,000 Zeolite or Activated Carbon Adsorbent: 1,000,000 Desorption Heat Exchangers: 1,150,000 Pumps and Valves: 700,000 3. Hybrid System Components: Inter-stage Heat Exchanger: 1,000,000 Flash Tank: 500,000 Pumps and Valves: 1,400,000 |
Table 5.
Investment costs/techno-economic parameters determination.
| Table 5a: Purchased cost of major equipment for the three capture technologies | ||||||
|---|---|---|---|---|---|---|
| Item | 2S-AB +AD | 2S-AB +MB | 2S-AD +AB | 2S-AD +MB | 2S-MB +AB | 2S-MB +AD |
| Power Generation | ||||||
| 1. Gas Turbine: | 120,000,000 | 120,000,000 | 120,000,000 | 120,000,000 | 120,000,000 | 120,000,000 |
| 2. Heat Recovery Steam Generator (HRSG): | 80,000,000 | 80,000,000 | 80,000,000 | 80,000,000 | 80,000,000 | 80,000,000 |
| 3. Steam Turbine: | 50,000,000 | 50,000,000 | 50,000,000 | 50,000,000 | 50,000,000 | 50,000,000 |
| 4. Generator: | 20,000,000 | 20,000,000 | 20,000,000 | 20,000,000 | 20,000,000 | 20,000,000 |
| Carbon Capture System | ||||||
| 1. Absorption Stage: | ||||||
| - Absorber Column: | 2,500,000 | 2,500,000 | 1,250,000 | 1,250,000 | ||
| - Lean Amine Tank: | 1,500,000 | 1,500,000 | 750,000 | 750,000 | ||
| - Rich Amine Tank: | 1,000,000 | 1,000,000 | 500,000 | 500,000 | ||
| - Heat Exchangers: | 2,000,000 | 2,000,000 | 1,000,000 | 1,000,000 | ||
| - Pumps and Valves: | 1,400,000 | 1,400,000 | 700,000 | 700,000 | ||
| 2. Adsorption Stage: | ||||||
| - Adsorber Vessels (2-3): | 2,250,000 | 4,500,000 | 4,500,000 | 2,250,000 | ||
| - Zeolite or Activated Carbon Adsorbent: | 1,000,000 | 2,000,000 | 2,000,000 | 1,000,000 | ||
| - Desorption Heat Exchangers: | 1,150,000 | 2,300,000 | 2,300,000 | 1,150,000 | ||
| - Pumps and Valves: | 700,000 | 1,400,000 | 1,400,000 | 700,000 | ||
| 3. Membrane Stage: | ||||||
| - Membrane Modules: | 1,800,000 | 1,800,000 | 3,600,000 | 3,600,000 | ||
| - Compressors: | 1,350,000 | 1,350,000 | 2,700,000 | 2,700,000 | ||
| - Heat Exchangers: | 500,000 | 500,000 | 1,000,000 | 1,000,000 | ||
| - Pumps and Valves: | 700,000 | 700,000 | 1,400,000 | 1,400,000 | ||
| 4. Hybrid System Components: | ||||||
| - Inter-stage Heat Exchanger: | 1,000,000 | 1,000,000 | 1,000,000 | 1,000,000 | 1,000,000 | 1,000,000 |
| - Flash Tank: | 500,000 | 500,000 | 500,000 | 500,000 | 500,000 | 500,000 |
| - Pumps and Valves: | 1,400,000 | 1,400,000 | 1,400,000 | 1,400,000 | 1,400,000 | 1,400,000 |
| TOTAL PURCHASED COST OF MAJOR EQUIPMENT (PCE | 286,400,000 | 285,650,000 | 287,300,000 | 287,450,000 | 285,800,000 | 286,700,000 |
| Table 5b: Total investment cost determination by factorial method. | ||||||
| Direct Cost | 2S-AB +AD | 2S-AB +MB | 2S-AD +AB | 2S-AD +MB | 2S-MB +AB | 2S-MB +AD |
| Item | Cost ($) | |||||
| Purchased Equipment cost (PEC) | 286400000 | 285650000 | 287300000 | 287450000 | 285800000 | 286700000 |
| Purchased Equipment installations: 12% of PEC | 34368000 | 34278000 | 34476000 | 34494000 | 34296000 | 34404000 |
| Instrumentation(installed) and control: 12% of PEC | 34368000 | 34278000 | 34476000 | 34494000 | 34296000 | 34404000 |
| Piping (installed): 20% of PEC | 57280000 | 57130000 | 57460000 | 57490000 | 57160000 | 57340000 |
| Electrical (installed): 10% of PEC | 28640000 | 28565000 | 28730000 | 28745000 | 28580000 | 28670000 |
| Buildings (including process/services): 18% of PEC | 51552000 | 51417000 | 51714000 | 51741000 | 51444000 | 51606000 |
| Yard improvement: 10% of PEC | 28640000 | 28565000 | 28730000 | 28745000 | 28580000 | 28670000 |
| Service facilities(installed): 20% of PEC | 57280000 | 57130000 | 57460000 | 57490000 | 57160000 | 57340000 |
| Land: 5% of PEC | 14320000 | 14282500 | 14365000 | 14372500 | 14290000 | 14335000 |
| TOTAL DIRECT COST (DC) | 592848000 | 591295500 | 594711000 | 595021500 | 591606000 | 593469000 |
| Indirect Cost | ||||||
| Items | Cost ($) | Cost ($) | Cost ($) | Cost ($) | Cost ($) | Cost ($) |
| Engineering Supervision; 12% of PEC | 34368000 | 34278000 | 34476000 | 34494000 | 34296000 | 34404000 |
| Construction expenses: 15% of PEC | 42960000 | 42847500 | 43095000 | 43117500 | 42870000 | 43005000 |
| TOTAL INDIRECT COST(IC) | 77328000 | 77125500 | 77571000 | 77611500 | 77166000 | 77409000 |
| DC + IC | 670176000 | 668421000 | 672282000 | 672633000 | 668772000 | 670878000 |
| Other costs ($) | ||||||
| Items | Cost ($) | Cost ($) | Cost ($) | Cost ($) | Cost ($) | Cost ($) |
| Contractors’ fee: 10% of (DC +IC) | 73719360 | 73526310 | 73951020 | 73989630 | 73564920 | 73796580 |
| Contingency: 15% of (DC + IC) | 100526400 | 100263150 | 100842300 | 100894950 | 100315800 | 100631700 |
| TOTAL OTHER COSTS (OC) | 174245760 | 173789460 | 174793320 | 174884580 | 173880720 | 174428280 |
| Fixed Project Cost (FPC): DC + IC + OC | 844421760 | 842210460 | 847075320 | 847517580 | 842652720 | 845306280 |
| Working Capital (WC): 15% of FPC | 126663264 | 126331569 | 127061298 | 127127637 | 126397908 | 126795942 |
| Total Capital Investment (TCI): FPC + WC | 971,085,024.00 | 968,542,029.00 | 974,136,618.00 | 974,645,217.00 | 969,050,628.00 | 972,102,222.00 |
| Table 5c: Operating/Production Cost | ||||||
| Variable Operating Cost | ||||||
| Items | 2S-AB +AD | 2S-AB +MB | 2S-AD +AB | 2S-AD +MB | 2S-MB +AB | 2S-MB +AD |
| Raw materials: 15% of TCI | 145662753.6 | 145281304.4 | 146120492.7 | 146196782.6 | 145357594.2 | 145815333.3 |
| Utilities: 5% of TCI | 48554251.2 | 48427101.45 | 48706830.9 | 48732260.85 | 48452531.4 | 48605111.1 |
| Miscellaneous materials: 1% of FPC | 18999489.6 | 18949735.35 | 19059194.7 | 19069145.55 | 18959686.2 | 19019391.3 |
| Total Variable Cost (A) | 213216494.4 | 212658141.2 | 213886518.3 | 213998189 | 212769811.8 | 213439835.7 |
| Fixed Operating Capital | ||||||
| Maintenance cost (MC): 10% of FPC | 84442176 | 84221046 | 84707532 | 84751758 | 84265272 | 84530628 |
| Operating Labour cost (OLC): 50% of TCI | 485542512 | 484271014.5 | 487068309 | 487322608.5 | 484525314 | 486051111 |
| Laboratory Cost (LC): 21% of OLC | 101963927.5 | 101696913 | 102284344.9 | 102337747.8 | 101750315.9 | 102070733.3 |
| Supervision Cost (SC): 10% of OLC | 48554251.2 | 48427101.45 | 48706830.9 | 48732260.85 | 48452531.4 | 48605111.1 |
| Plant Overheads cost (POC): 65% of OLC | 315602632.8 | 314776159.4 | 316594400.9 | 316759695.5 | 314941454.1 | 315933222.2 |
| Insurance Costs (IC): 1% of FWC | 8444217.6 | 8422104.6 | 8470753.2 | 8475175.8 | 8426527.2 | 8453062.8 |
| Local taxes: 2% of FPC | 16888435.2 | 16844209.2 | 16941506.4 | 16950351.6 | 16853054.4 | 16906125.6 |
| Total Fixed Costs (B) | 591095232 | 589547322 | 592952724 | 593262306 | 589856904 | 591714396 |
| Direct Operating Cost (DOC): A + B | 804311726.4 | 802205463.2 | 806839242.3 | 807260495 | 802626715.8 | 805154231.7 |
| General Overheads Cost(C): 8.5% of DOC | 68366496.74 | 68187464.37 | 68581335.6 | 68617142.07 | 68223270.84 | 68438109.69 |
| Annual Production Cost (APC): A + B + C | 1085894718 | 1083051069 | 1089307096 | 1089875826 | 1083619798 | 1087032177 |
| Table 5d: Annual sales revenue/ assessment factors determination | ||||||
| Unit output kW,q | 1470 | 1470 | 1470 | 1470 | 1470 | 1470 |
| Forecast sales volume(yearly) kW, (Q) | 12877200 | 12877200 | 12877200 | 12877200 | 12877200 | 12877200 |
| Forecast sales prize($/Kw-hr.)) SP | 100 | 100 | 100 | 100 | 100 | 100 |
| Annual sales revenue (ASR): Q x SP | 1287720000 | 1287720000 | 1287720000 | 1287720000 | 1287720000 | 1287720000 |
| Net Cash flow (NCF): ASR – APC | 201825282.5 | 204668931.3 | 198412903.8 | 197844174 | 204100201.6 | 200687822.9 |
| Rate of Return (ROR) | ||||||
| ROR = (NCF)/(TCI) | 0.207834821 | 0.21131652 | 0.203680778 | 0.202990966 | 0.210618719 | 0.206447242 |
| %ROR = ROR x 100 | 20.78348213 | 21.13165203 | 20.36807776 | 20.29909659 | 21.06187186 | 20.64472422 |
| Net Present Value (NPV) | ||||||
| Project life, n: | 25 | 25 | 25 | 25 | 25 | 25 |
| NPV= n x NCF/(1+ROR) − TCI, $ | 3,206,333,917.99 | 3,255,558,936.82 | 3,146,825,257.93 | 3,136,860,597.13 | 3,245,740,503.51 | 3,186,550,885.23 |
| Levelized Cost of Electricity (LCOE) | ||||||
| Net annual electricity generation/consumption(E), MW: | 220,000 | 200,000 | 250,000 | 230,000 | 180,000 | 210,000 |
| LCOE = NPV/ (n x E): | 582.9698033 | 651.1117874 | 503.4920413 | 545.5409734 | 721.2756674 | 606.9620734 |
| Carbon emission intensity (CEI) | ||||||
| Total CO2 Emissions(@300Kg/MW-hr) by IPCC | 36750 | 36750 | 36750 | 36750 | 36750 | 36750 |
| CEI = Total CO2 Emissions/E | 0.167045455 | 0.18375 | 0.147 | 0.159782609 | 0.204166667 | 0.175 |
| Cost of CO2 Avoidance (COA) | ||||||
| COA = LCOE / CEI, $/ton (IPCC) | 3489.887258 | 3543.465509 | 3425.115927 | 3414.270038 | 3532.778779 | 3468.354705 |
Table 6.
Summary of the evaluated techno-economic assessment parameters.
| Item | 2S-AB + AD | 2S-AB + MB | 2S-AD + AB | 2S-AD + MB | 2S-MB + AB | 2S-MB + AD |
|---|---|---|---|---|---|---|
| 1. Total investment cost (TIC): $ million | 971,085,024.00 | 968,542,029.00 | 974,136,618.00 | 974,645,217.00 | 969,050,628.00 | 972,102,222.00 |
| 2. Total product cost or operating capital (TPC): $ million/year | 1085894718 | 1083051069 | 1089307096 | 1089875826 | 1083619798 | 1087032177 |
| 3. Net present value (NPV): $ million | 3,206,333,917.99 | 3,255,558,936.82 | 3,146,825,257.93 | 3,136,860,597.13 | 3,245,740,503.51 | 3,186,550,885.23 |
| 4. Return on investment (ROI): % | 20.78348213 | 21.13165203 | 20.36807776 | 20.29909659 | 21.06187186 | 20.64472422 |
| 5. Discounted cash flow return on investment (DCFROI) or discounted cash flow return on rate (DCFRR): % | 12.15 | 10.14 | 8.12 | 7.11 | 8.12 | 6.1 |
| 6. Net annual electricity consumption kWh/ton | 220 | 200 | 250 | 230 | 180 | 210 |
| 7. Levelized cost of electricity (LCOE): $/MWh | 582.9698033 | 651.1117874 | 503.4920413 | 545.5409734 | 721.2756674 | 606.9620734 |
| 8. Total carbon emissions | 36750 | 36750 | 36750 | 36750 | 36750 | 36750 |
| 9. Carbon emissions intensity (CEI): kg CO2/kWh | 0.167045455 | 0.18375 | 0.147 | 0.159782609 | 0.204166667 | 0.175 |
| 10. Cost of avoided carbon (COA): $/ton CO2 | 3489.887258 | 3543.465509 | 3425.115927 | 3414.270038 | 3532.778779 | 3468.354705 |
Disclaimer/Publisher’s Note: The statements, opinions and data contained in all publications are solely those of the individual author(s) and contributor(s) and not of MDPI and/or the editor(s). MDPI and/or the editor(s) disclaim responsibility for any injury to people or property resulting from any ideas, methods, instructions or products referred to in the content. |
© 2024 by the authors. Licensee MDPI, Basel, Switzerland. This article is an open access article distributed under the terms and conditions of the Creative Commons Attribution (CC BY) license (http://creativecommons.org/licenses/by/4.0/).
Copyright: This open access article is published under a Creative Commons CC BY 4.0 license, which permit the free download, distribution, and reuse, provided that the author and preprint are cited in any reuse.


