
Submitted:
04 July 2025
Posted:
07 July 2025
You are already at the latest version
Abstract
In this work, an economic analysis of a carbon capture and methanation process plant was performed, for implementation at Goroubanda Power Plant, in Niamey-Niger. Furthermore, a simulation of carbon capture via adsorption employing aspen adsorption software was also performed, for reducing both, the cost of investment and the environmental impacts of the project, knowing that, Adsorption process is more cost effective and less pollutant. The economic analysis results showed that the project is economically feasible with a return on investment of 13%, a payback period of 9.4 years, and a synthetic natural gas cost of 0.32 €/MWh. Further findings showed that the adsorption process has the potential to replace the considered absorption process in economic analysis. Overall, the study's findings provide a substantial contribution to the field of sustainable energy and carbon emissions reduction.
Keywords:
Climate Change
; Carbon Capture
; Utilization and Storage
; Renewable Energy Storage
; Synthetic Natural Gas
; Sustainability
; Goroubanda Power Plant-Niger
1. Introduction
Over time, variations in temperature and weather patterns are referred to as climate change. Global warming and climate change are two of today's most serious environmental issues, with greenhouse gas emissions being the primary cause. These variations could have been artificial or natural. Nevertheless, human endeavours have been generating these shifts fuelling climate change throughout the end of the nineteenth century. The primary activity performed by humans that emits harmful greenhouse gases directly into the atmosphere is the consumption of fossil fuels that include natural gas and coal Figure 1. The main considered gases that cause global warming include carbon dioxide (CO2) and methane (CH4).
The continual consumption of fossil fuels is a hindrance to minimizing the phenomenon of global warming through decreasing emissions of greenhouse gases [1]. Carbon dioxide emitted by fossil fuel combustion makes up sixty-five percent of the total amount of greenhouse gases[2]. The increased amount of greenhouse gases (GHGs) in the nearest (troposphere) atmosphere increases the earth's global temperature by trapping heat from the sun. The aforementioned phenomenon is a significant factor contributing to climate change. The contribution of consuming fossil fuels to climate change is obvious, as they emit greenhouse gases, mainly CO2, into the atmosphere, once burnt. Global net-zero greenhouse gas (GHG) emissions must be achieved in order to meet the Paris Agreement's climate target of keeping global average temperature to well below 2°C and reducing temperature increases to 1.5°C [3].
Despite understanding that the consumption of fossil fuels contributes to climate change and has a number of negative environmental consequences, the vast majority of countries' energy systems, both developed and developing, rely on fossil fuels [4]. Furthermore, fossil fuels are currently the primary sources of energy used in the transportation, industrial, and electrical energy generation sectors, as well as practically all other sectors where energy need to be supplied [5]. To decrease or eliminate the emissions of carbon dioxide (CO2) caused by the consumption of fossil fuels, which could contribute to meeting the Paris Agreement's objective of decreasing greenhouse gas emissions in the atmosphere, low-carbon technologies such as renewable energy sources (RES) and carbon capture, utilization, and storage (CCUS) must be implemented on a wide scale [6]. As a result, numerous European Union (EU) countries, including Norway, Germany, and Denmark, are considering renewable energy options. After a study to determine whether a 100% renewable European power system is achievable by 2050. It was found that a 100% renewable power system will still require a large flexible zero-carbon storage capacity to balance variable renewable energy generation [7]. To tackle this, the world has begun to emphasize carbon capture and utilization technologies together with renewable energy. CCU technologies enable the integration of renewable energies in an energy system through storage and a continuous utilization of fossil fuels as there is no emission.
Carbon capture and utilization is the best technology to halt emissions of CO2 coming from burning fossil fuels or any carbon-based energy source. It consists of separating CO2 from industries and energy-related sources and transporting it to a storage location for other applications or long-term isolation from the atmosphere [8]. CCU has the technical potential to serve as a carbon source for chemicals production decoupling the production of chemicals such as methanol and ethanol from fossil fuels, reducing GHG annual emissions by up to 3.5 Gt CO2-eq in 2030 [9]. In addition, it was found that an energy system consisting of fossil fuels, hydrogen, bio-fuels and renewable energy sources could be a good initiative for energy transition and combating climate change [10]. In this present work, an economic feasibility study will be conducted for the implementation of carbon capture and methanation (with green hydrogen) project in a power plant located in Goroubanda, Niamey-Niger, together with a carbon capture simulation via Adsorption process.
2. Materials and Methods
In this work, a feasibility study of decarbonizing a specific power-producing plant located in Goroubanda, Niamey-Niger was conducted through an economic analysis, and a simulation of a carbon capture system. One of the absorption processes was used to absorb CO2 from exhaust gas generated by combustion in the power plant. The post-combustion CO2 capture technology was chosen based on the fuel utilized by the plant and the operating conditions of the plant (combustion process for power generation).
2.1. Materials
The main focus of this work was on process simulation and analysis. A combination of software tools and a spreadsheet (Excel) were used as materials to conduct the research. The materials employed are as follows:
- ○
- Excel for the economic analysis of the project and some calculations.
- ○
- Aspen Adsorption software for simulating CO2 capture system via adsorption phenomena.
- ○
- QGIS software for mapping the study area.
2.2. Methods
2.2.1. Economic Analysis
Economic assessment is a special aspect to analysing the possibility of any technology to be practically applicable. Costs for both operations and investments of the overall project were assessed. According to the ratio factors suggested by Peter and Timmerhaus [11] for fluid processing plants, the total capital investment (CAPEX) was calculated using the methodology bellow, together with the capital investment (x) of the equipment .
where TDC is the total direct cost and TIC the total indirect cost of goods, summarized in Table 1 and RF is the ratio factor for direct, indirect, and working capital.

Table 1.
Capital Expenditure Calculation Formula.
| Type | Item(i) | Ratio Factor | Cost(euro) |
|---|---|---|---|
| Direct cost | Purchased equipment(delivered) | 1.00 | X |
| Purchased equipment installation | 0.47 | X*0.47 | |
| piping | 0.36 | X*0.36 | |
| Instrumentations and controls | 0.68 | X*0.68 | |
| Electrical systems | 0.11 | X*0.11 | |
| Buildings (including services) | 0.18 | X*0.18 | |
| Yard improvements | 0.10 | X*0.10 | |
| Service facilities | 0.70 | X*0.70 | |
| Total direct cost | Y=X*3.6 | ||
| Indirect cost | Engineering and supervision | 0.33 | Y*0.33 |
| Construction expenses | 0.41 | Y*0.41 | |
| Legal expenses | 0.04 | Y*0.04 | |
| Contractor’s fee | 0.22 | Y*0.22 | |
| contingency | 0.44 | Y*0.44 | |
| Working capital | 0.89 | Y*0.89 | |
| Total indirect cost | Z=Y*2.33 | ||
| Total capital investment (CAPEX) | =Y+Z |
Table 2.
Operational Expenditure (OPEX)Calculation Formula.
| type | Item(j) | Cost |
|---|---|---|
| Fix OPEX | Operating labour | 5 labours/shift, 3 shift/day |
| Supervisory & clerical labour | 20% Operating labour | |
| Maintenance & repairs | 3% CAPEX | |
| Operating supplies | 15% M&R | |
| Catalyst | 90€/kg | |
| Solvent | 1€/kg | |
| Variable OPEX | hydrogen | 2.34$/kg~2.17€/kg |
| Cooling Water | 0.025€/ton | |
| Energy consumption | 9.3€/kWh | |
| Total OPEX | = FOPEX + VOPEX |
2.2.2. Aspen Adsorption Simulation
The simulation of CO2 capture with Aspen Adsorption software was made in three steps with silicate based adsorbent material on a single bed.
- ○
- Creation of the simulation model
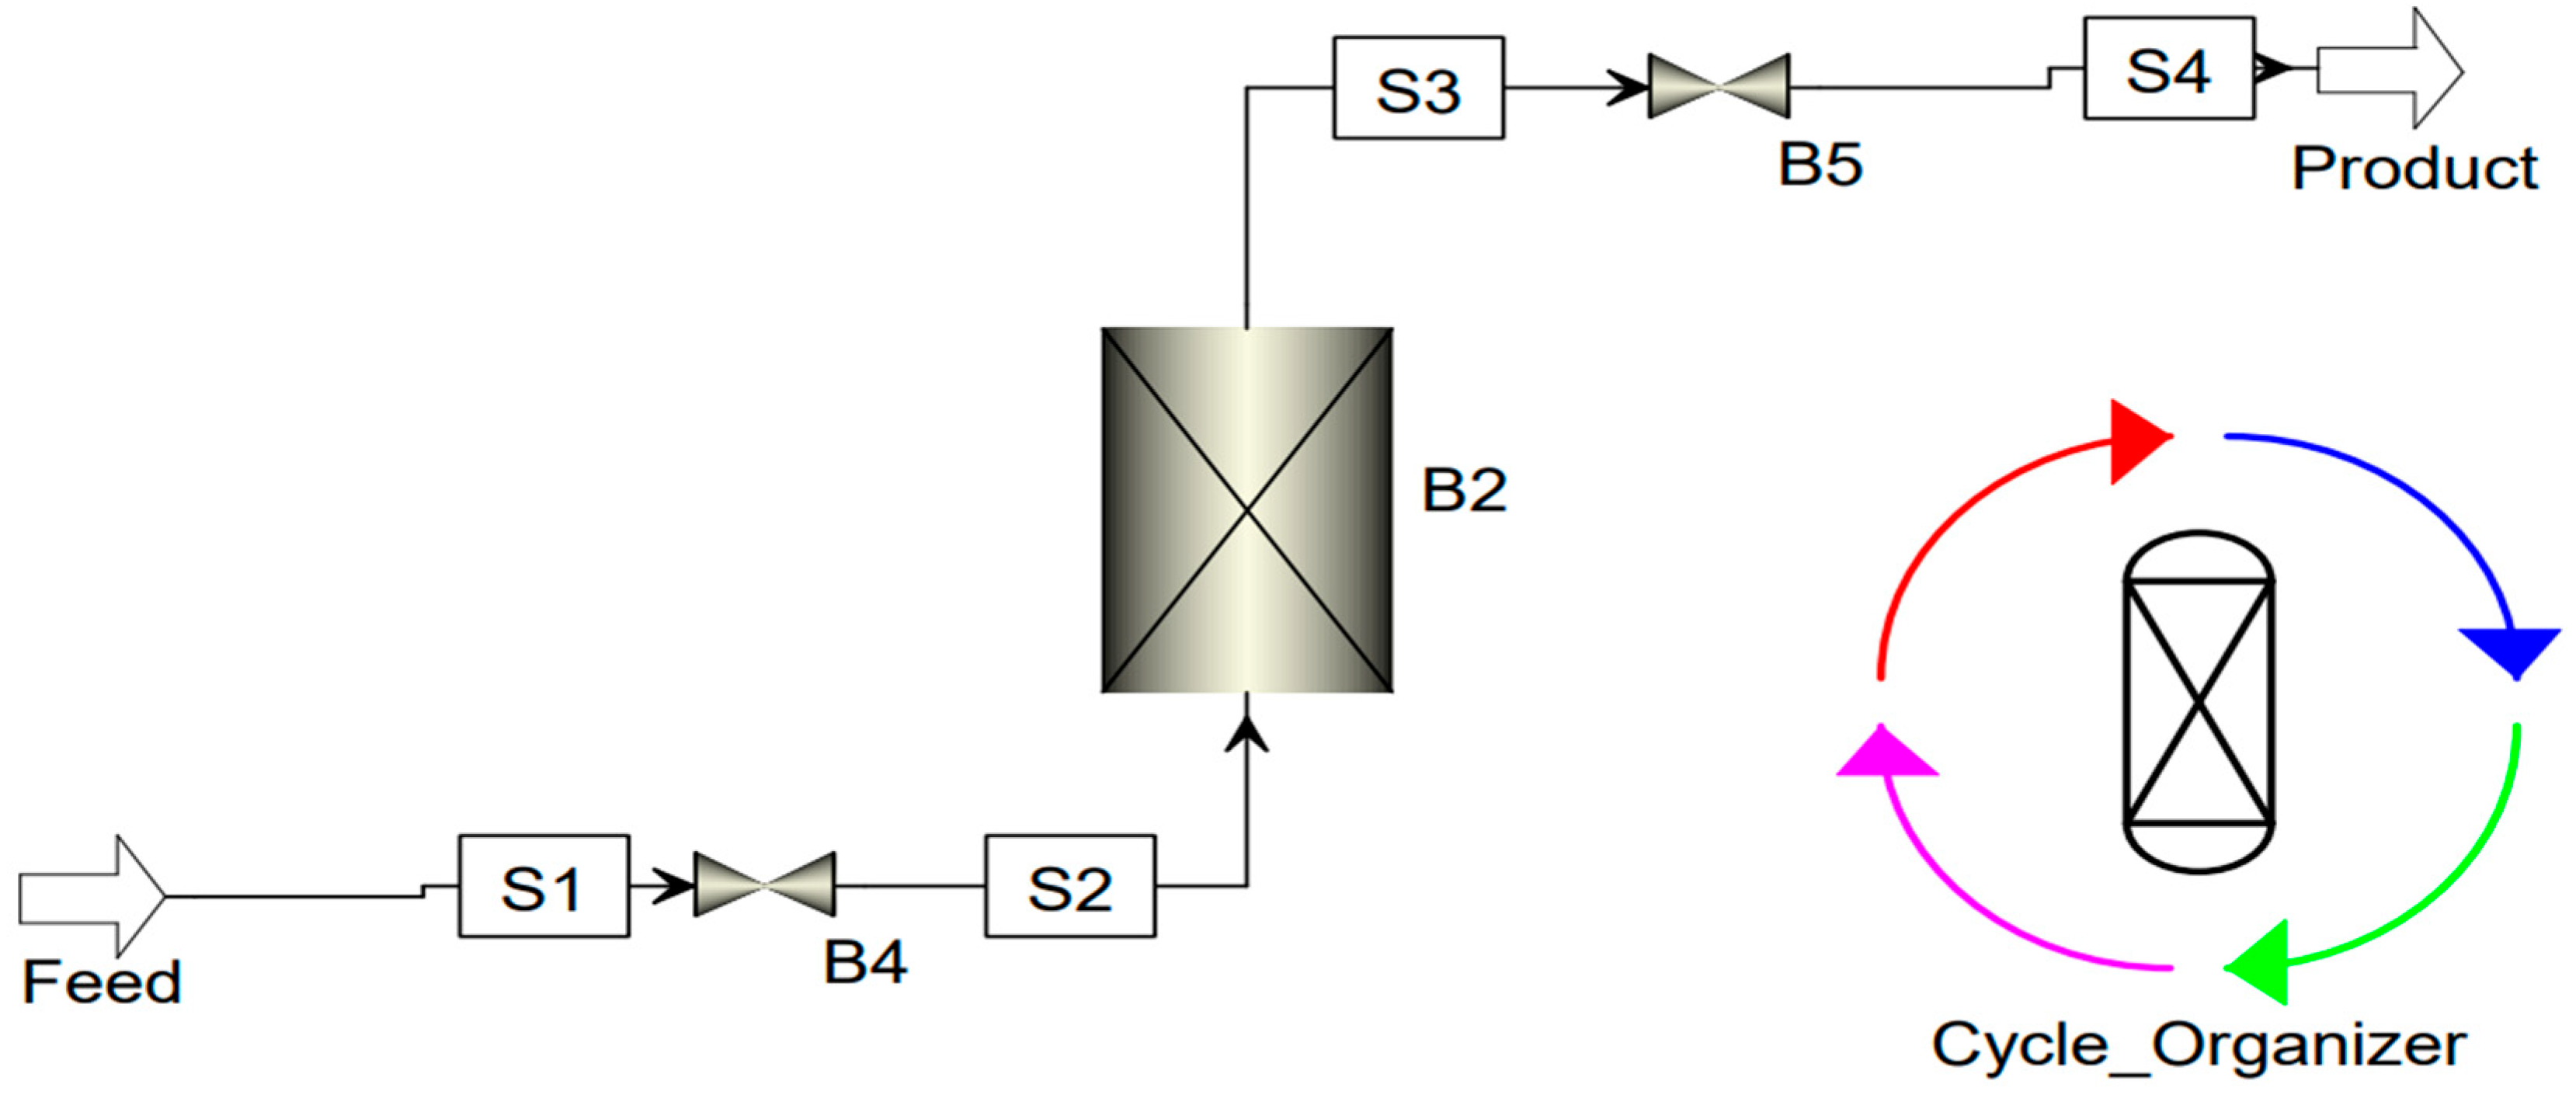
After launching Aspen Adsorption, a new simulation model was created. The components used to build up the model are gas feed and product, valves, adsorption bed and cycle organizer.
- ○
- Specification on some parameters
Specifications on feed gas, feed valve, adsorption column, and product valve and gas product were carried out. The specifications were mainly on temperature, pressure, feed property and composition, feed flowrate, bed height and diameter, time taken for each step of the three etc.
- ○
- Running simulation
After the specifications, the simulation was executed by running the established model. The software has calculated and simulated the behaviour of the adsorption process based on the specifications made. The system was controlled by the cycle organizer.
3. Case Study
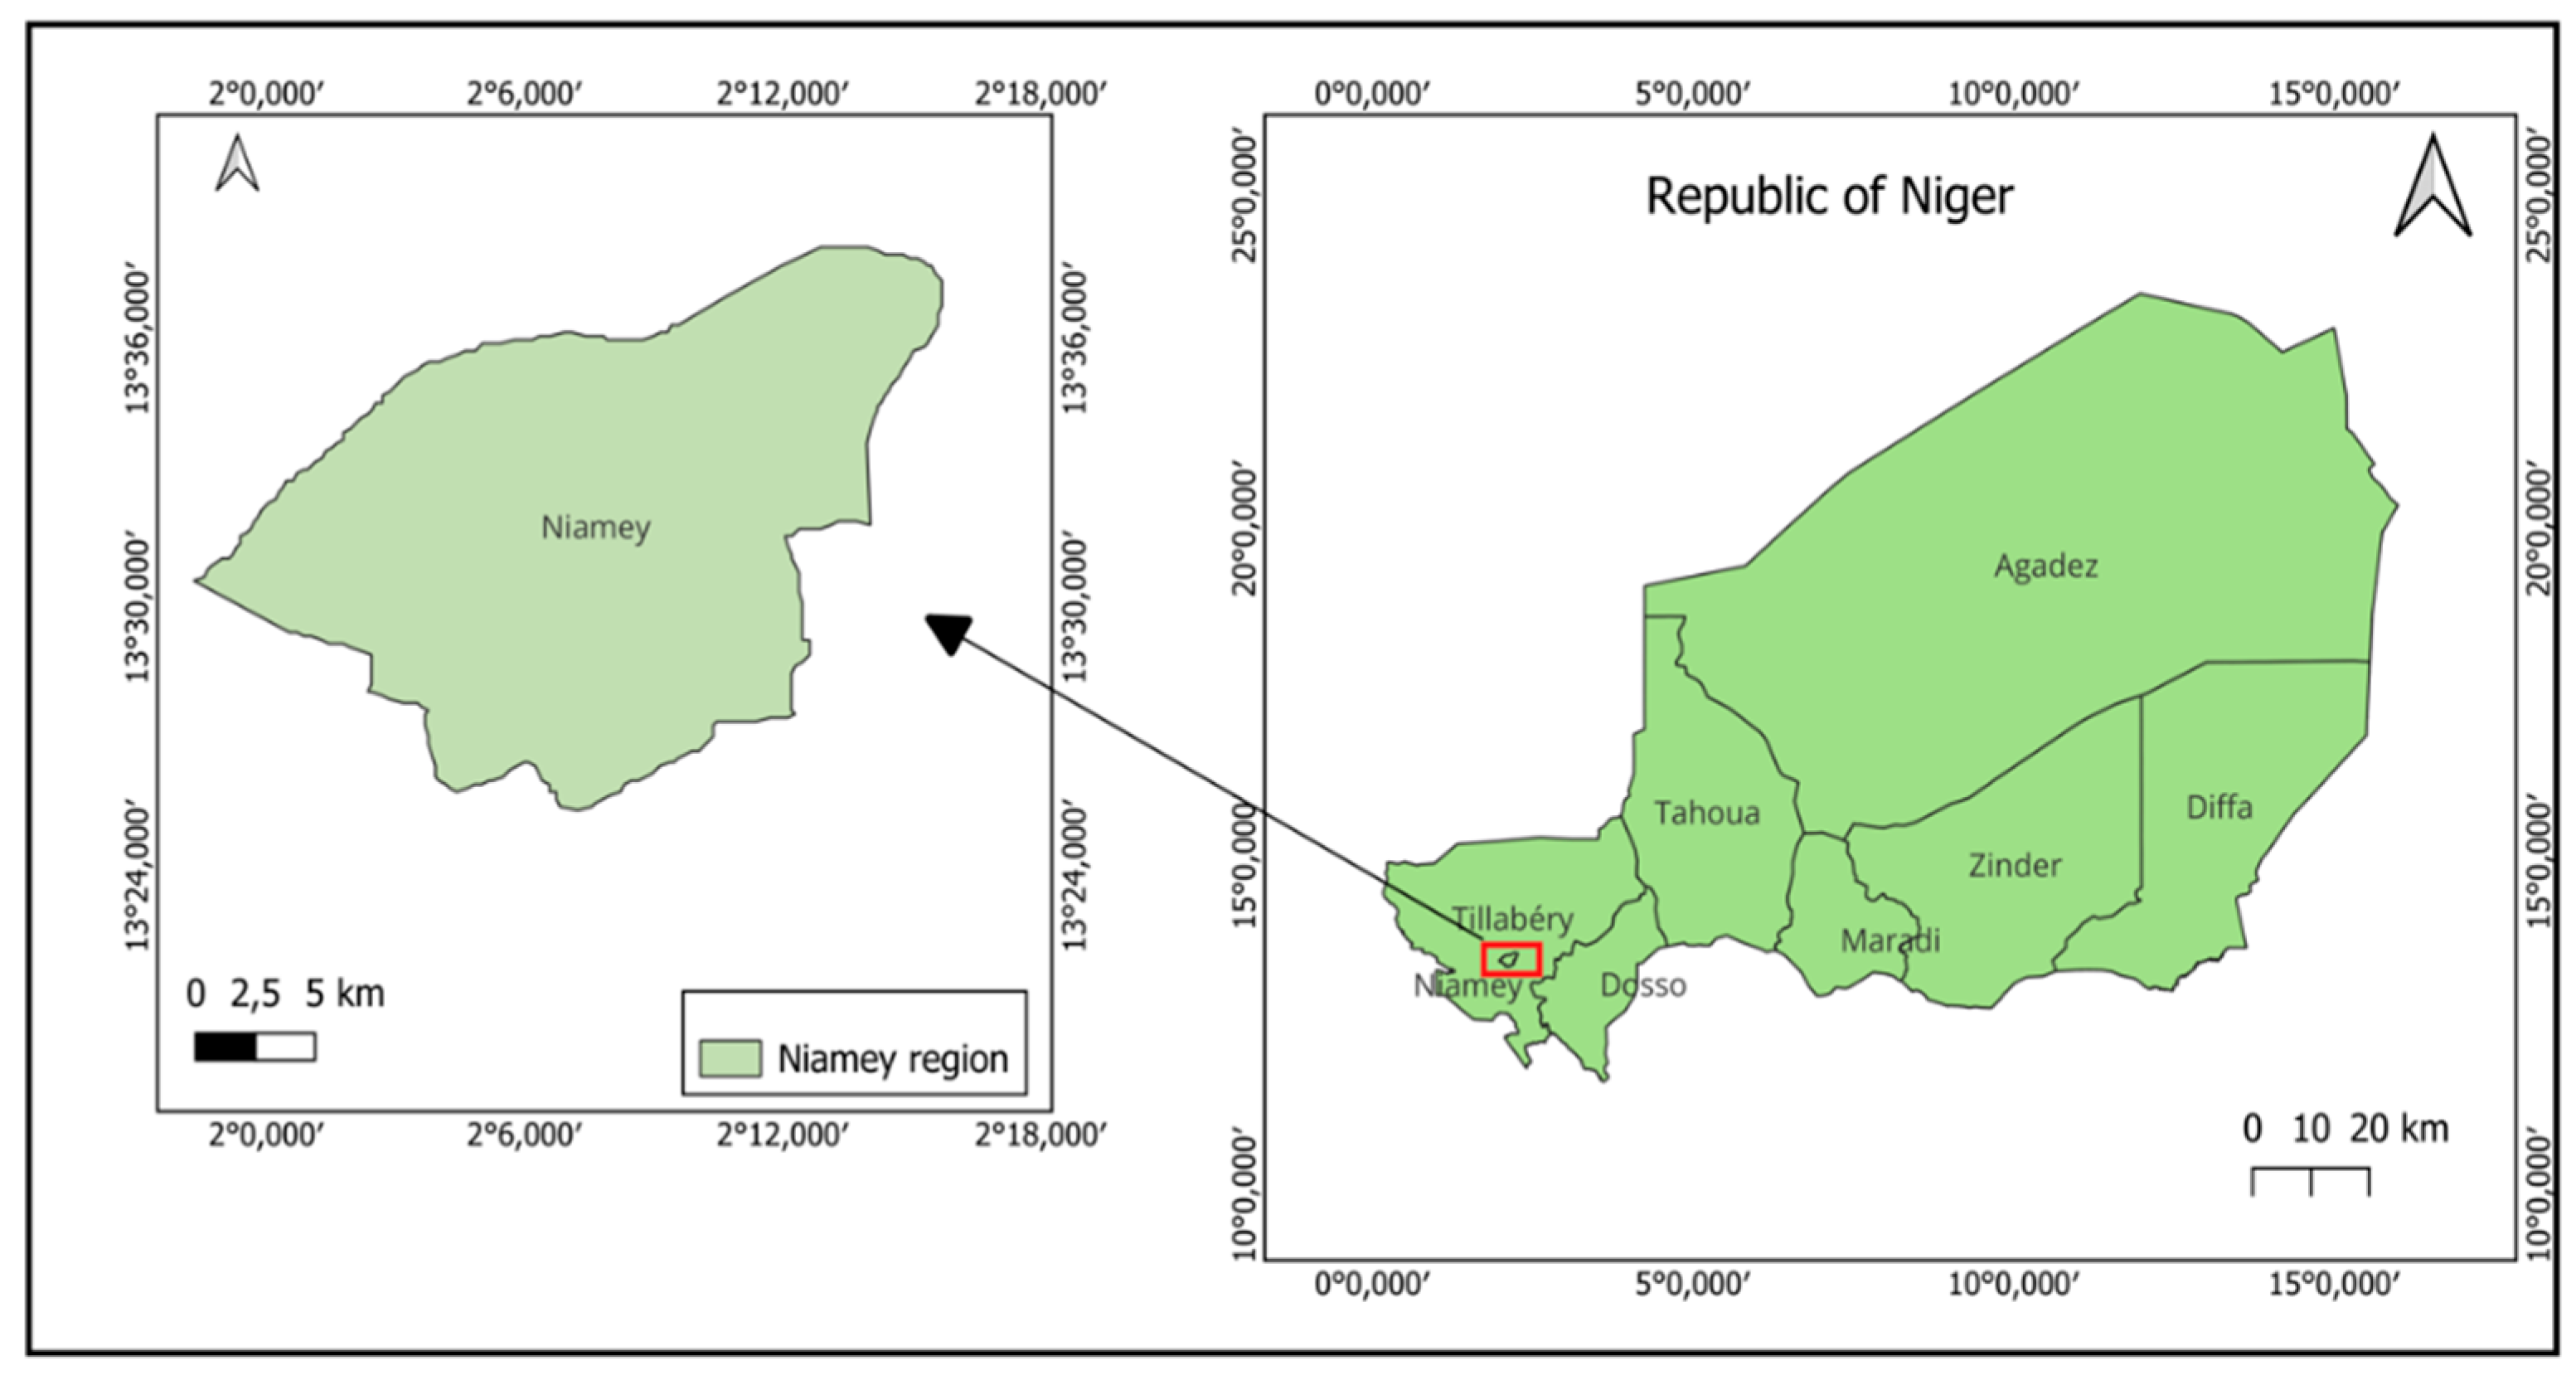
The Goroubanda diesel-based power plant, located 5km south of Niamey with four 20 MW diesel turbines was built by Sinohydro, which started construction in April 2013. The construction of lines and substations was carried out by the Chinese company TBEA. This plant was built with the aim of improving the power supply of Niamey and reducing dependence on the interconnection with Nigeria.
In addition, with four MAN 18V48/60TS engines already in operation on-site, the installation of another of the same kind has increased the power plant's total capacity by 20 MW, bringing it to more than 100 MW. "After this expansion, the Goroubanda power plant will provide more than 45% of Niger's power generation capacity ’’Saab stated’’[12]. Despite that, Niger remains one of Africa's countries with the lowest electrification rate.
The work presented here aims to create an additional energy generation capacity of the Goroubanda power plant to promote the economic and social development of Niger. As impact, this project may be involved in making the power plant ‘’green’’, reducing CO2 emissions and help to integrate renewable energy into the Niger’s energy system.
Figure 2.
Study area map.
3.1. Economic Analysis
In the economic evaluation of the present project, the following has been determined:
- ❖
- Total CAPEX and OPEX of the project
- ❖
- Levelized cost of the product (LC) and net present value (NPV)
- ❖
- Return on investment, payback period and sensitivity analysis
The methodology used to calculate the CAPEX and OPEX which were used to calculate the remaining parameters was shown in 2.2.1. The cost of the main equipment for CO2 capturing, methanation and gas upgrading was estimated to be around 28.14M€ and taken reference from a similar project [11]. The annualized CAPEX is calculated by multiplying the CAPEX with the capital recovery factor (CRF) which was calculated the using equation below.
Where, n=number of years and i = interest rate.
Table 3.
Main equipment of the process.
| Main equipment | CO2 capture | CO2 methanation | Gas upgrading |
|---|---|---|---|
| Columns(absorber/stripper) | ✓ | - | - |
| Reactor | - | ✓ | - |
| Compressors | ✓ | ✓ | ✓ |
| Turbine | - | ✓ | - |
| Heat exchangers (Heaters/coolers) | ✓ | ✓ | ✓ |
| Flash tanks | ✓ | ✓ | - |
| Membrane | - | - | ✓ |
For estimating the amount of CO2 that the plant can generate, it is important to know the fuel consumption rate in litters per hour or the specific fuel consumption rate in litres per kilowatt-hour (l/kWh). It was assumed in this work that the fuel consumption rate is at 0.28 l/kWh (The assumption was based on diesel generators used in the power plant). Also, it has to be mentioned that diesel fuel contains approximately 2640 grams of carbon per litre. The combustion process of diesel fuel releases about 2.66 kg of CO2 for every kilogram of carbon burned.
Hourly fuel consumption calculation:
Carbon content in the fuel calculation:
CO2 emissions calculation:
Therefore, this power plant running on diesel fuel with a capacity of 100MW can generate 2511.26kg/h or 2.51 metric tons/hour of CO2.
3.1.1. CAPEX and OPEX Estimation
The Capital Expenditure and Operational Expenditure Estimation using the formulas given in 2.2.1.
Table 4.
CAPEX Calculation.
| Items | DC (€) | IC (€) | CAPEX (€) |
|---|---|---|---|
| Total equipment cost | 28,140,000 | - | 28,140,000 |
| Purchased equipment Installation | 13,225,800 | - | 13,225,800 |
| piping | 10,130,400 | - | 10,130,400 |
| Instrumentations and controls | 19,135,200 | - | 19,135,200 |
| Electrical systems | 3,095,400 | - | 3,095,400 |
| Buildings (including services) | 5,065,200 | - | 5,065,200 |
| Yard improvements | 2,814,000 | - | 2,814,000 |
| Service facilities | 19,698,000 | - | 19,698,000 |
| Engineering and supervision | - | 33,430,320 | 33,430,320 |
| Construction expenses | - | 41,534,640 | 41,534,640 |
| Legal expenses | - | 4,052,160 | 4,052,160 |
| Contractor’s fee | - | 22,286,880 | 22,286,880 |
| contingency | - | 44,573,760 | 44,573,760 |
| Working capital | - | 90,160,560 | 90,160,560 |
| Total Cost | 101,304,000 | 236,038,320 | 337,342,320 |
Based on the capital expenditure records, the calculation of the annualized CAPEX was then proceeded using a discounted cash flow analysis. This analysis incorporates the time value of money by discounting future cash flows to their present value based on an appropriate interest rate. The aim of performing this calculation was to obtain a more accurate representation of the annualized CAPEX, factoring in the opportunity cost of investing in this project. This provided valuable insights for financial planning and decision making. The lifetime of the main equipment was assumed to be 25 years and the interest rate was 8% [13]. Using equation 2, the calculation of CRF was done as follows:
To calculate the total operating cost, the yearly amount of CO2 to be collected from the plant needs to be known. For that, two assumptions were supposed to be made. First, it was assumed that the plant works 8 hours per day (this is the standard time of a production shift in Niger) and second, it works 365 days per year. From that, one can conclude that the plant works 2920 hours per year. As mentioned earlier 3.1, this plant can generate 2.51 tons/hour. Considering the assumptions, the plant generates about 7329.2 tons of CO2 per year.
After knowing the amount of CO2 to be generated yearly, the amount of hydrogen needed per year needs to be calculated. From the balanced equation of CO2 methanation with hydrogen, it can be seen that four (4) moles of hydrogen are required to react with one mole of CO2 to produce one mole of methane.
To calculate the amount of hydrogen needed, one needs to convert the mass of CO2 to moles using the molar mass of CO2 (44.01g/mol) and then use the stoichiometric ratio.
Given:
Mass of CO2=7329.2 tons=7329.2 *1000kg=7329200kg
Molar mass of CO2=44.01g/mol
Molar mass of H2=2.02g/mol
Step 1: Conversion of mass of CO2 to moles
Step 2: Calculation of moles of hydrogen
Step 3: Conversation of moles of hydrogen to tons
The yearly cost of green hydrogen needed was calculated as follows:
For calculating the cost of catalyst, the daily captured CO2 needs to be known. As mentioned, the plant generates 2.51 tons/hour which means it generates 20.08tons/day as it works eight (8) hours per day.
Knowing the loading of the catalyst (5%) together with daily mass of CO2 captured, the mass of the catalyst needed daily can be estimated.
According to Table 2, the price of the catalyst is 90€/kg, which means 90000€/ton. In this work, the catalyst has been assumed to be changed once per year. The cost of the total catalyst needed was multiplied by two (2) to have the yearly cost of the catalyst.
The daily amount of solvent required is calculated using the following formula.
Solvent also was considered to be changed once per year.
According to [14], 2.4 kg of water is required for the process of capturing one ton of CO2. In this work, only the cost of water required for CO2 capture is considered. The produced water was continuously used for the remaining needs.
It was observed by [11], that a total amount of energy of around 0.05MW is required for the methanation of 9.09 tons of CO2 per hour. Taking that as a reference, the hourly amount of energy needed in this thesis was evaluated as follows:
Table 5.
OPEX Calculation.
| FOPEX | Cost (€) |
|---|---|
| Operating labour | 22,824 |
| Supervisory & clerical labour | 4,564.8 |
| Maintenance & repairs | 941,185.07 |
| Operating supplies | 141,177.76 |
| Catalyst | 180,000 |
| Solvent | 334,660 |
| VOPEX | |
| Hydrogen | 2,920,603 |
| Cooling water | 0.00120 |
| Energy consumption | 380,184 |
| TOPEX | 4925,198.63 |
3.1.2. Levelized Cost of the Produced SNG
The cost of the methane gas produced per ton and megawatt-hour has been evaluated considering the operating and fixed expenses using the following formulas:
To convert tons into megawatt-hours, following conversions have to be done:
1 ton is equal to 1000kg, 1kg of methane is equal to 5.55 MJ and 1 MWh is equal to 3.6 MJ. Therefore, the levelized cost of methane per MWh is calculated as follows:
3.1.3. Calculation of Net Present Value, Return on Investment and Payback Period
A comprehensive financial analysis of the project has been performed, including the calculation of key financial metrics such as net present value, return on investment, and payback period. By evaluating these metrics, it was gained into the project’s profitability, investment efficiency, and time required to recoup the initial investment. This analysis provided a robust financial assessment, helping in making decisions and determining the project’s financial viability. Below are given the different formulas for the calculations and a table summarizing the results obtained using Excel.
Table 6.
Results Summary of NPV, ROI, PP.
| Net Present Value (€) | Return on investment (%) | Payback Period |
|---|---|---|
| 45205609.76 | 13 | 9.4 |
3.2. Aspen Adsorption Simulation
Due to its lower energy consumption and less reliance on chemical processes, the adsorption process is currently considered more cost-effective and less pollutant than the absorption approach for carbon capture.
These factors highlight the reasons why in this work it was found important to integrate the Adsorption simulation using aspen adsorption, in the project. The simulation was done with the purpose of replacing the considered carbon capture unit in case it requires more energy input and presents very high pollution.
The simulation was done in a three-step cycle monitored by a cycle organizer on a single bed (This is an ideal way to simulate the adsorption process in Aspen Adsorption software). The first step was adsorption followed by heating for desorption and then cooling, for the bed to restart the adsorption. The process was an adiabatic adsorption of CO2 on a single bed of Silicate based adsorbent.
Table 7.
Feed properties.
| Property | Value |
|---|---|
| Flowrate(kmol/s) | 8e-7 |
| Pressure(bar) | 10 |
| Temperature(K) | 298 |
| Composition (molar fraction) | |
| N2 | 67% |
| CO2 | 12% |
Table 8.
Summary of the three-step cycle configuration.
| ADSORPTION | HEATING | COOLING | |
|---|---|---|---|
| B4 | Completely opened | closed | Opened |
| B5 | Opened with a constant flow rate | Opened | Closed |
| DURATION(MN) | 60 | 80 | 60 |
Figure 3.
Process flowsheet of the three-step cycle simulation on a single bed.
4. Results and Discussion
4.1. Economic Analysis
In the total initial investment of the project, it could be observed that the capital expenditure (CAPEX) is very high compared to operational expenditure (OPEX). This is because the cost of transportation of the main equipment from Germany (as they were considered to be bought there) to Niger is integrated in the ration factor of each unit. The OPEX is also very high comparing to that one (1.71 M€/year) found by [15], just because of cost of green hydrogen 2.9 M€/year is considered in the operating cost. Apart from green hydrogen, all the remaining required inputs were found cheap. In addition, the annualized capital expenditure (ACAPEX) may be seen as very high, which is because of the considered interest rate of 8%. In this work, after the first investment, the OPEX is included in the discounted cash inflow. This means that the cash inflow is discounted in such a way that the operating cost is being taken from it.
The levelized cost of the produced SNG, was very cheap compared to the one found by [16] (about 3.6 M€/ton) after making an economic analysis of the power to gas route in Germany. This fact is also understandable because the cost of SNG in Germany cannot be the same in Africa (Niger). A positive net present value found in this study means that the discounted cash inflow for 25 years (lifetime of the project) is much greater than the initial investment of the project. The ROI of 13% represents the return on investment expressed as a percentage of the initial investment. A greater ROI signifies a better return on investment in comparison to the initial investment. The present ROI indicates that the project is likely to generate 13% of the initial investment each year. The obtained result on the payback period indicates that it may take 9.4 years to generate cash inflow that recoup the initial investment.
Table 9.
Total Result of Economic Analysis.
| Variable(s) | Value(s) |
|---|---|
| CAPEX | 337342320€ |
| ACAPEX | 31372835.76€ |
| OPEX | 4925198.63€ |
| LC(CH4) | 4952.52€/ton |
| NPV | 45205609.76€ |
| ROI | 13% |
| PP | 9.4 years |
4.2. Carbon Capture Simulation
After settling all the parameters in the adsorption software, different specifications were made for the different steps in the cycle organizer in order to control the cycle. The simulation was run after putting all the inputs and making all the specifications to make a maximum of three cycles. Later on, two analyses were made together with a sensitivity analysis. Analysis of the adsorption bed performances and analysis of the composition of outlet stream.
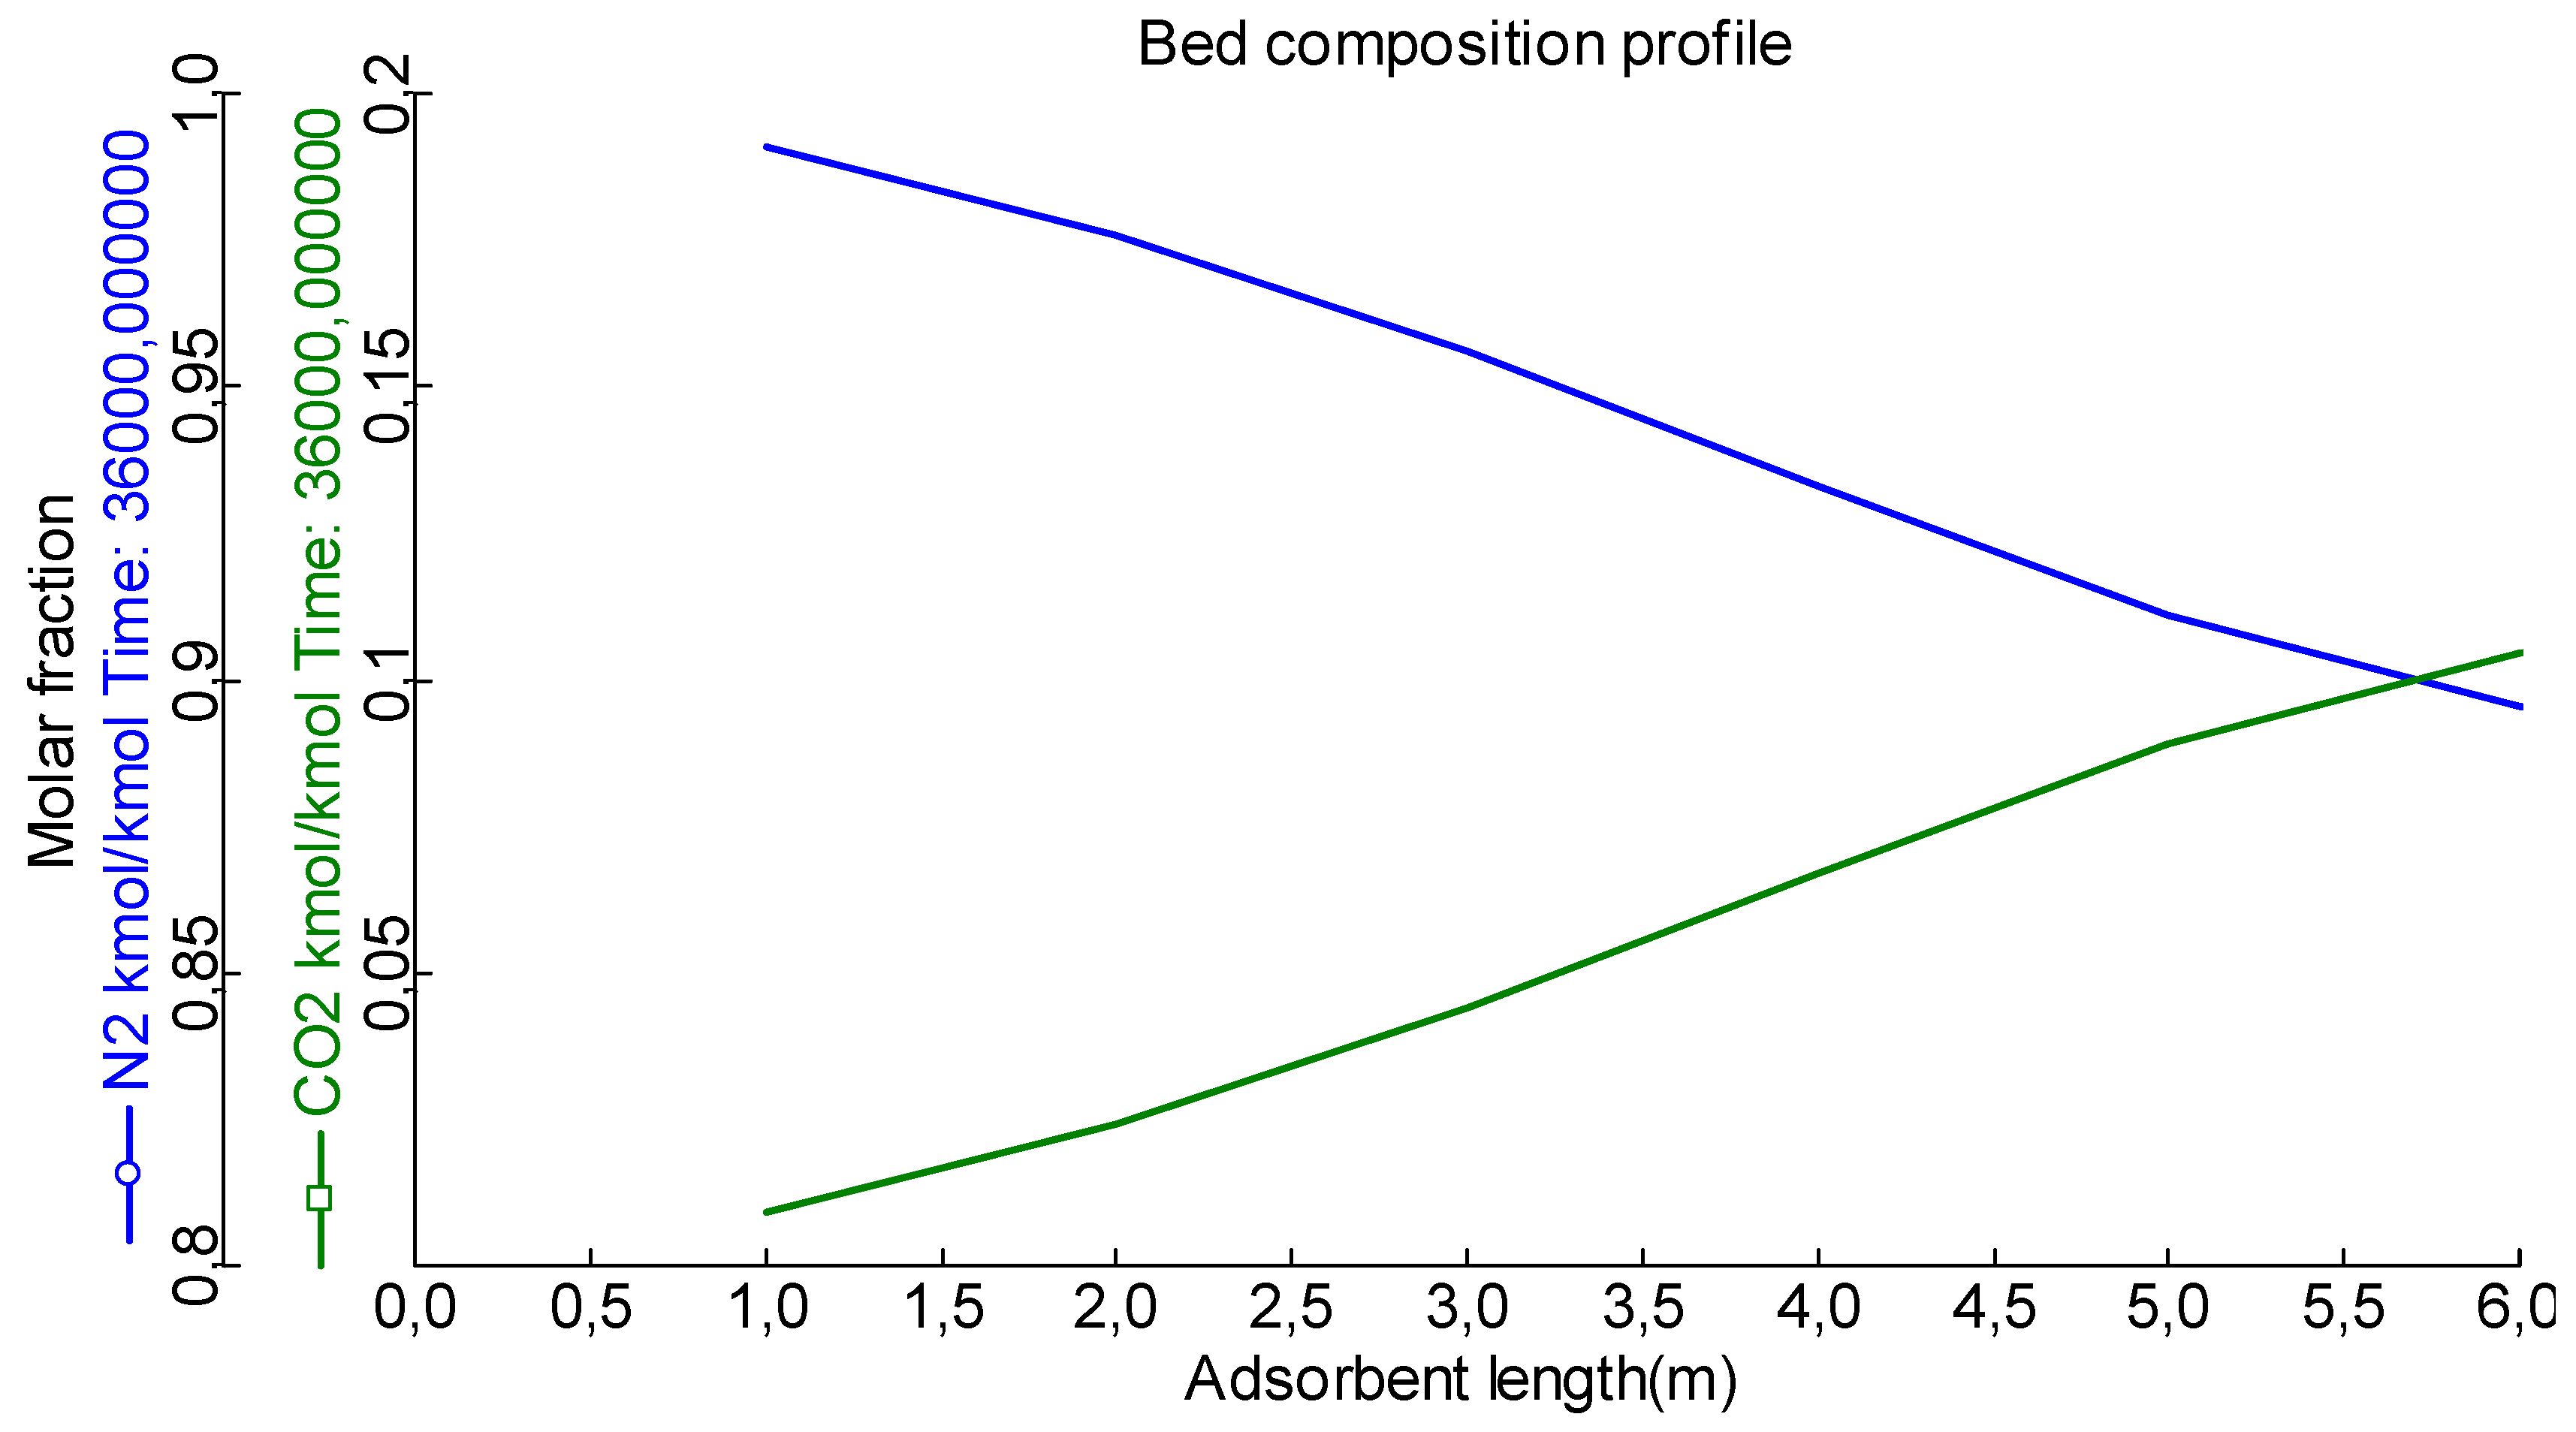
Analysing the breakthrough curve, it is possible to conclude that, the adsorption bed is capable of performing a continuous adsorption procedure for CO2 capture. This means that as the CO2-containing gas stream passes over the bed material, the CO2 molecules are preferentially captured and retained. The bed can continuously adsorb CO2 over an extended period of time without requiring frequent regeneration or replacement of the adsorbent material. This continuous adsorption process enables the efficient and continuous removal of CO2 from the gas stream, making the adsorption bed a viable solution for carbon capture and storage applications or other CO2 removal operations.
Figure 4.
Breakthrough curve.
In Figure 5, is shown the outlet stream composition of the first step (adsorption) of the cycle. Due to the effective adsorption process occurring within the bed, the mole fraction of CO2 in the outlet stream gas is unusually low. The adsorption bed material selectively absorbs and holds CO2 molecules as the gas stream passes through it, effectively eliminating them from the gas phase. Because of this excellent adsorption mechanism, only a tiny quantity of CO2 molecules remains in the outflow stream. The bed maximizes separation efficiency through the continuous adsorption process by selectively adsorbing CO2 while allowing other gases to pass through relatively unimpeded. This selectivity reduces the concentration of CO2 in the outflow stream significantly, resulting in a very small mole fraction.
Unlike the relatively small mole fraction of CO2 in the outflow stream, the mole fraction of the remaining gas components increases continuously. This phenomenon results from selective CO2 adsorption within the bed, resulting in a relative enrichment of non-CO2 gases in the exit stream. As the CO2 molecules are selectively captured and retained by the adsorption bed, the gas stream that exits the bed contains a higher proportion of non-CO2 components. While the CO2 is successfully removed by the bed, the remaining gases flow through relatively un-adsorbed. This causes a progressive accumulation of non-CO2 gases, resulting in a rising mole fraction in the exit stream.
A sensitivity analysis was also made to see the effect of varying some parameters such as flue gas temperature, adsorption bed height and the flue gas flow rate. The initial temperature, flow rate of flue gas and bed height were respectively as follows: 298K, 8e-7kmol/s and 0.6m.
Figure 6 shows the CO2 adsorption from the flue gas at three different temperatures. It may be observed that, increasing flue gas temperature results in an increase in CO2 adsorption at a short time as the molar fraction of CO2 decreases in the flue gas. Adsorption of CO2 contained in a flue gas at high temperatures has the advantage of reducing time to reach the maximum of adsorption. With a temperature of 450K and 350K, the maximum adsorption is reached at about 9500 seconds while with a temperature of 298K, the maximum adsorption is reached at around 12400 seconds. Higher temperatures increase the kinetic energy of molecules, which can speed up adsorption. When a rapid adsorption process is needed, this can be advantageous. It is crucial to remember, however, that extremely high temperatures might cause desorption or thermal breakdown of the adsorbate, which can reduce overall adsorption effectiveness.
The flow rate of flue gas is also another parameter to consider. Figure 7 demonstrates the adsorption of CO2 at three different flue gas flow rates. In the considered figure, the two graphs corresponding to the adsorption of CO2 from the flue gas at 4e-7kmol/s and 1e-6kmol/s are decreasing. This means that, there is more CO2 adsorption at a flow rate of 4e-7 kmol/s and 1e-6 kmol/s compared to the remaining considered flow rate. In conclusion, at a temperature of 298K and an adsorption bed height of 0.6m (remember in this case, temperature and bed height were kept constant), the flow rates of 4e-7kmol/s and 1e-6kmol/s are more suitable for an effective rapid CO2 in adsorption.
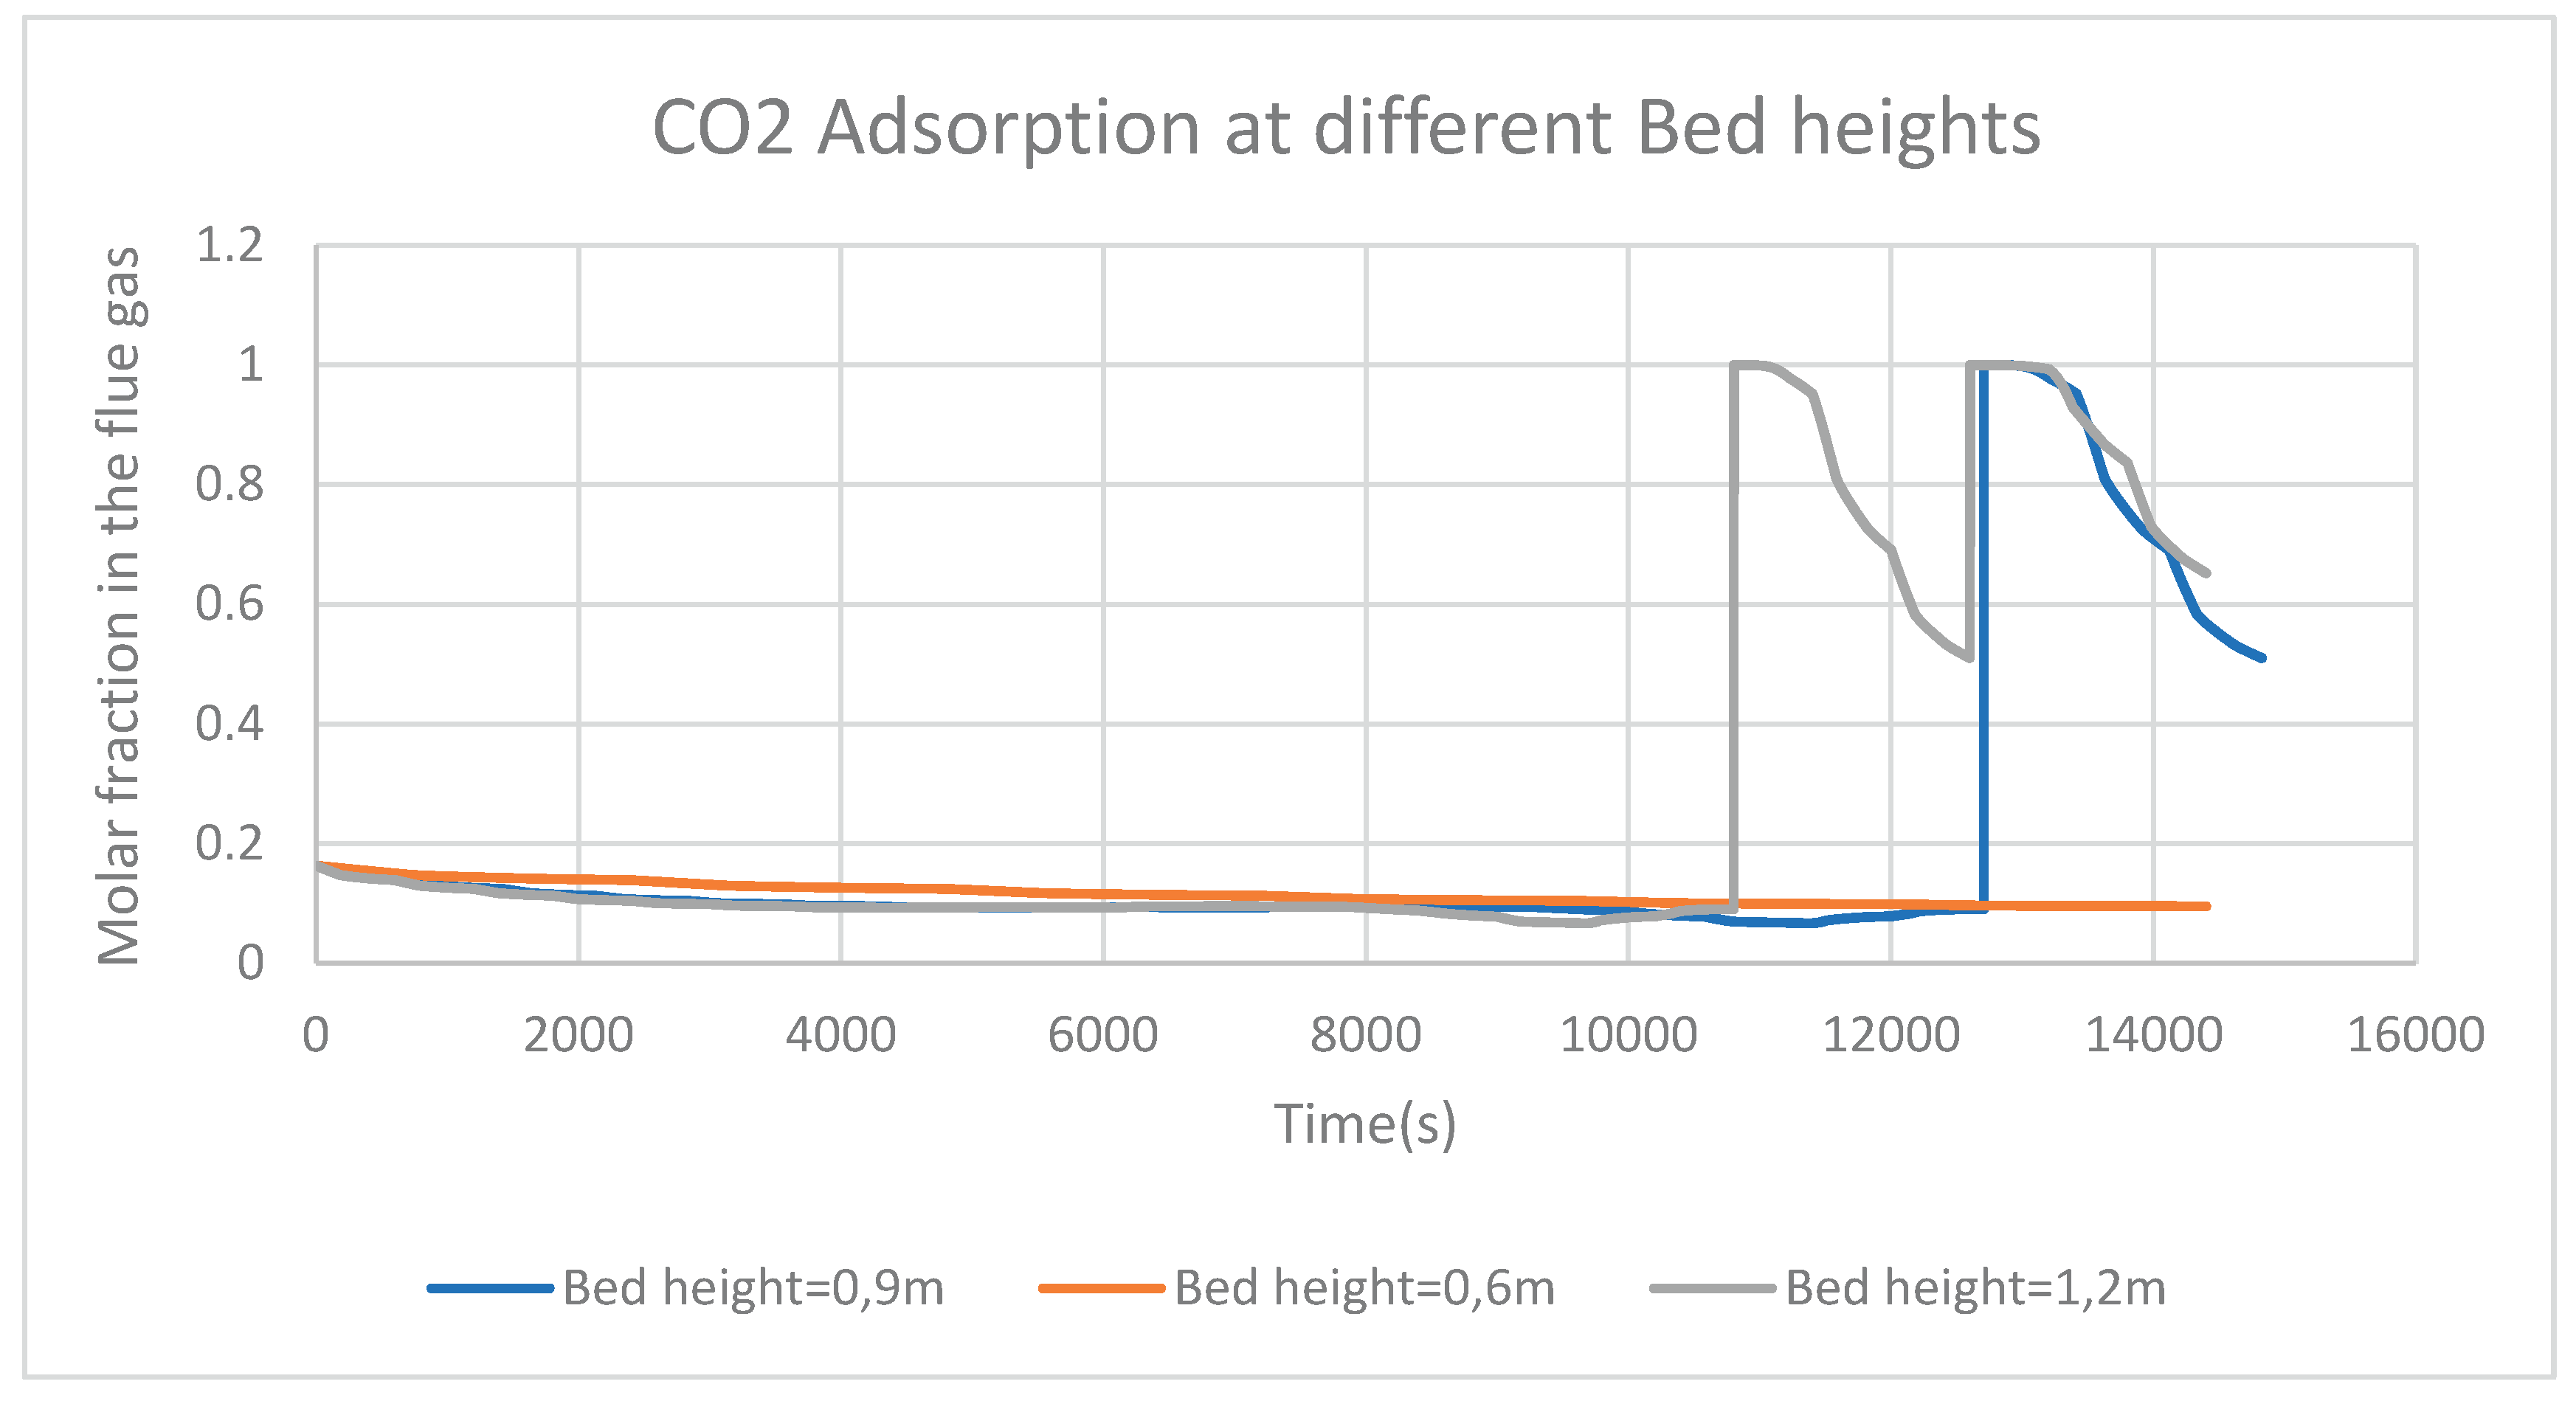
Figure 8 represents the CO2 adsorption phenomenon at three different heights of the adsorption bed. It can be understood from the figure that, the height of the adsorption bed does not impact in general, the adsorption process for a short time process. However, when the flue gas takes more time in the adsorption column, it may be seen on the figure that, at a bed height of 0.9 meter and 1.2 meter, a sudden high rate of CO2 adsorption takes place from time to time.
[17] has found that decreasing the flow rate of input increases the time taken to achieve the maximum adsorption, increasing temperature decreases the time taken to reach the maximum value of adsorption and increasing the bed height increases also the time taken to achieve the maximum adsorption. As well, in this work, it was found that, increasing temperature reduces the time taken for maximum adsorption. However, an increase in flow rate does not have any relation with adsorption time, and the bed height variation also does not have effect on adsorption time. The similarity observed here is due to the fact that the temperature is more related to the reaction not generally to the input, adsorbent and adsorption column characteristics. It is common that, increasing temperature augments the reaction rate. The differences noticed may be due to the difference in adsorbate and adsorbent used in both cases.
5. Conclusion
This study aimed to investigate the economic feasibility for implementing a carbon capture and methanation project. The results indicate that, the project is economically feasible with a return on investment of 13%, a payback period of 9.4 years and a synthetic natural gas cost of 0.32 €/MWh.
In addition, the study had also the goal of conducting a carbon capture simulation with Aspen Adsorption software for reducing the environmental impacts coming out of the project’s system, and for reducing as well the cost of initial investment, and the cost of some of the inputs. The adsorption process simulation findings show that, it is successful at producing continuous CO2 adsorption while keeping a very low mole fraction of CO2 in the outflow stream. Because of the bed's selective adsorption characteristics, CO2 molecules can be efficiently removed from the gas phase, resulting in a highly pure exit stream. The flue gas temperature has the effect of reducing the adsorption time taken to reach the maximum value when it is increased.
References
- S. Mukherjee, P. Kumar, A. Yang, and P. Fennell, ‘Energy and exergy analysis of chemical looping combustion technology and comparison with pre-combustion and oxy-fuel combustion technologies for CO2 capture’, J. Environ. Chem. Eng., vol. 3, no. 3, pp. 2104–2114, 2015. [CrossRef]
- P. Bains, P. Psarras, and J. Wilcox, ‘CO2 capture from the industry sector’, Prog. Energy Combust. Sci., vol. 63, pp. 146–172, 2017. [CrossRef]
- C. Bataille et al., ‘A review of technology and policy deep decarbonization pathway options for making energy-intensive industry production consistent with the Paris Agreement’, J. Clean. Prod., vol. 187, pp. 960–973, 2018. [CrossRef]
- F. Martins, C. Felgueiras, M. Smitkova, and N. Caetano, ‘Analysis of fossil fuel energy consumption and environmental impacts in european countries’, Energies, vol. 12, no. 6, pp. 1–11, 2019. [CrossRef]
- L. Zheng, Overview of oxy-fuel combustion technology for carbon dioxide (CO 2 ) capture. Woodhead Publishing Limited, 2011. [CrossRef]
- Nogalska, A. Zukowska, and R. Garcia-Valls, ‘Atmospheric CO2 capture for the artificial photosynthetic system’, E3S Web Conf., vol. 22, 2017. [CrossRef]
- W. Zappa, M. Junginger, and M. van den Broek, ‘Is a 100% renewable European power system feasible by 2050?’, Appl. Energy, vol. 233–234, no. July 2018, pp. 1027–1050, 2019. [CrossRef]
- R. Wennersten, Q. Sun, and H. Li, ‘The future potential for Carbon Capture and Storage in climate change mitigation - An overview from perspectives of technology, economy and risk’, J. Clean. Prod., vol. 103, pp. 724–736, 2015. [CrossRef]
- Kätelhön, R. Meys, S. Deutz, S. Suh, and A. Bardow, ‘Climate change mitigation potential of carbon capture and utilization in the chemical industry’, Proc. Natl. Acad. Sci. U. S. A., vol. 166, no. 23, pp. 11187–11194, 2019. [CrossRef]
- M. Kalkuhl, O. Edenhofer, and K. Lessmann, ‘The Role of Carbon Capture and Sequestration Policies for Climate Change Mitigation’, Environ. Resour. Econ., vol. 60, no. 1, pp. 55–80, 2015. [CrossRef]
- R. Chauvy, L. Dubois, P. Lybaert, D. Thomas, and G. De Weireld, ‘Production of synthetic natural gas from industrial carbon dioxide’, Appl. Energy, vol. 260, no. November 2019, p. 114249, 2020. [CrossRef]
- Chad, ‘MAN Energy Solutions to install 110 MW sub-Saharan generation capacity’, pp. 49–50, 2022.
- C. Zhang et al., ‘Direct conversion of carbon dioxide to liquid fuels and synthetic natural gas using renewable power: Techno-economic analysis’, J. CO2 Util., vol. 34, no. June, pp. 293–302, 2019. [CrossRef]
- Li, W. Leigh, P. Feron, H. Yu, and M. Tade, ‘Systematic study of aqueous monoethanolamine (MEA)-based CO2 capture process: Techno-economic assessment of the MEA process and its improvements’, Appl. Energy, vol. 165, pp. 648–659, 2016. [CrossRef]
- R. Chauvy, D. Verdonck, L. Dubois, D. Thomas, and G. De Weireld, ‘Techno-economic feasibility and sustainability of an integrated carbon capture and conversion process to synthetic natural gas’, J. CO2 Util., vol. 47, no. December 2020, p. 101488, 2021. [CrossRef]
- R. Peters, M. Baltruweit, T. Grube, R. C. Samsun, and D. Stolten, ‘A techno economic analysis of the power to gas route’, J. CO2 Util., vol. 34, no. July, pp. 616–634, 2019. [CrossRef]
- M. S. P. Maksimov, ‘Lappeenranta- Lahti University of Technology LUT School of Engineering Science Degree Program of Chemical Engineering Master ’ s Thesis Zubair Riaz MODELLING OF GAS SEPARATIONS USING ASPEN ADSORPTION ® SOFTWARE Examiners : Docent Arto Laari Professor Tuom’, 2021.
Figure 1.
Repartition of greenhouse gases by source.

Figure 5.
Mole fractions of the components in the product stream.
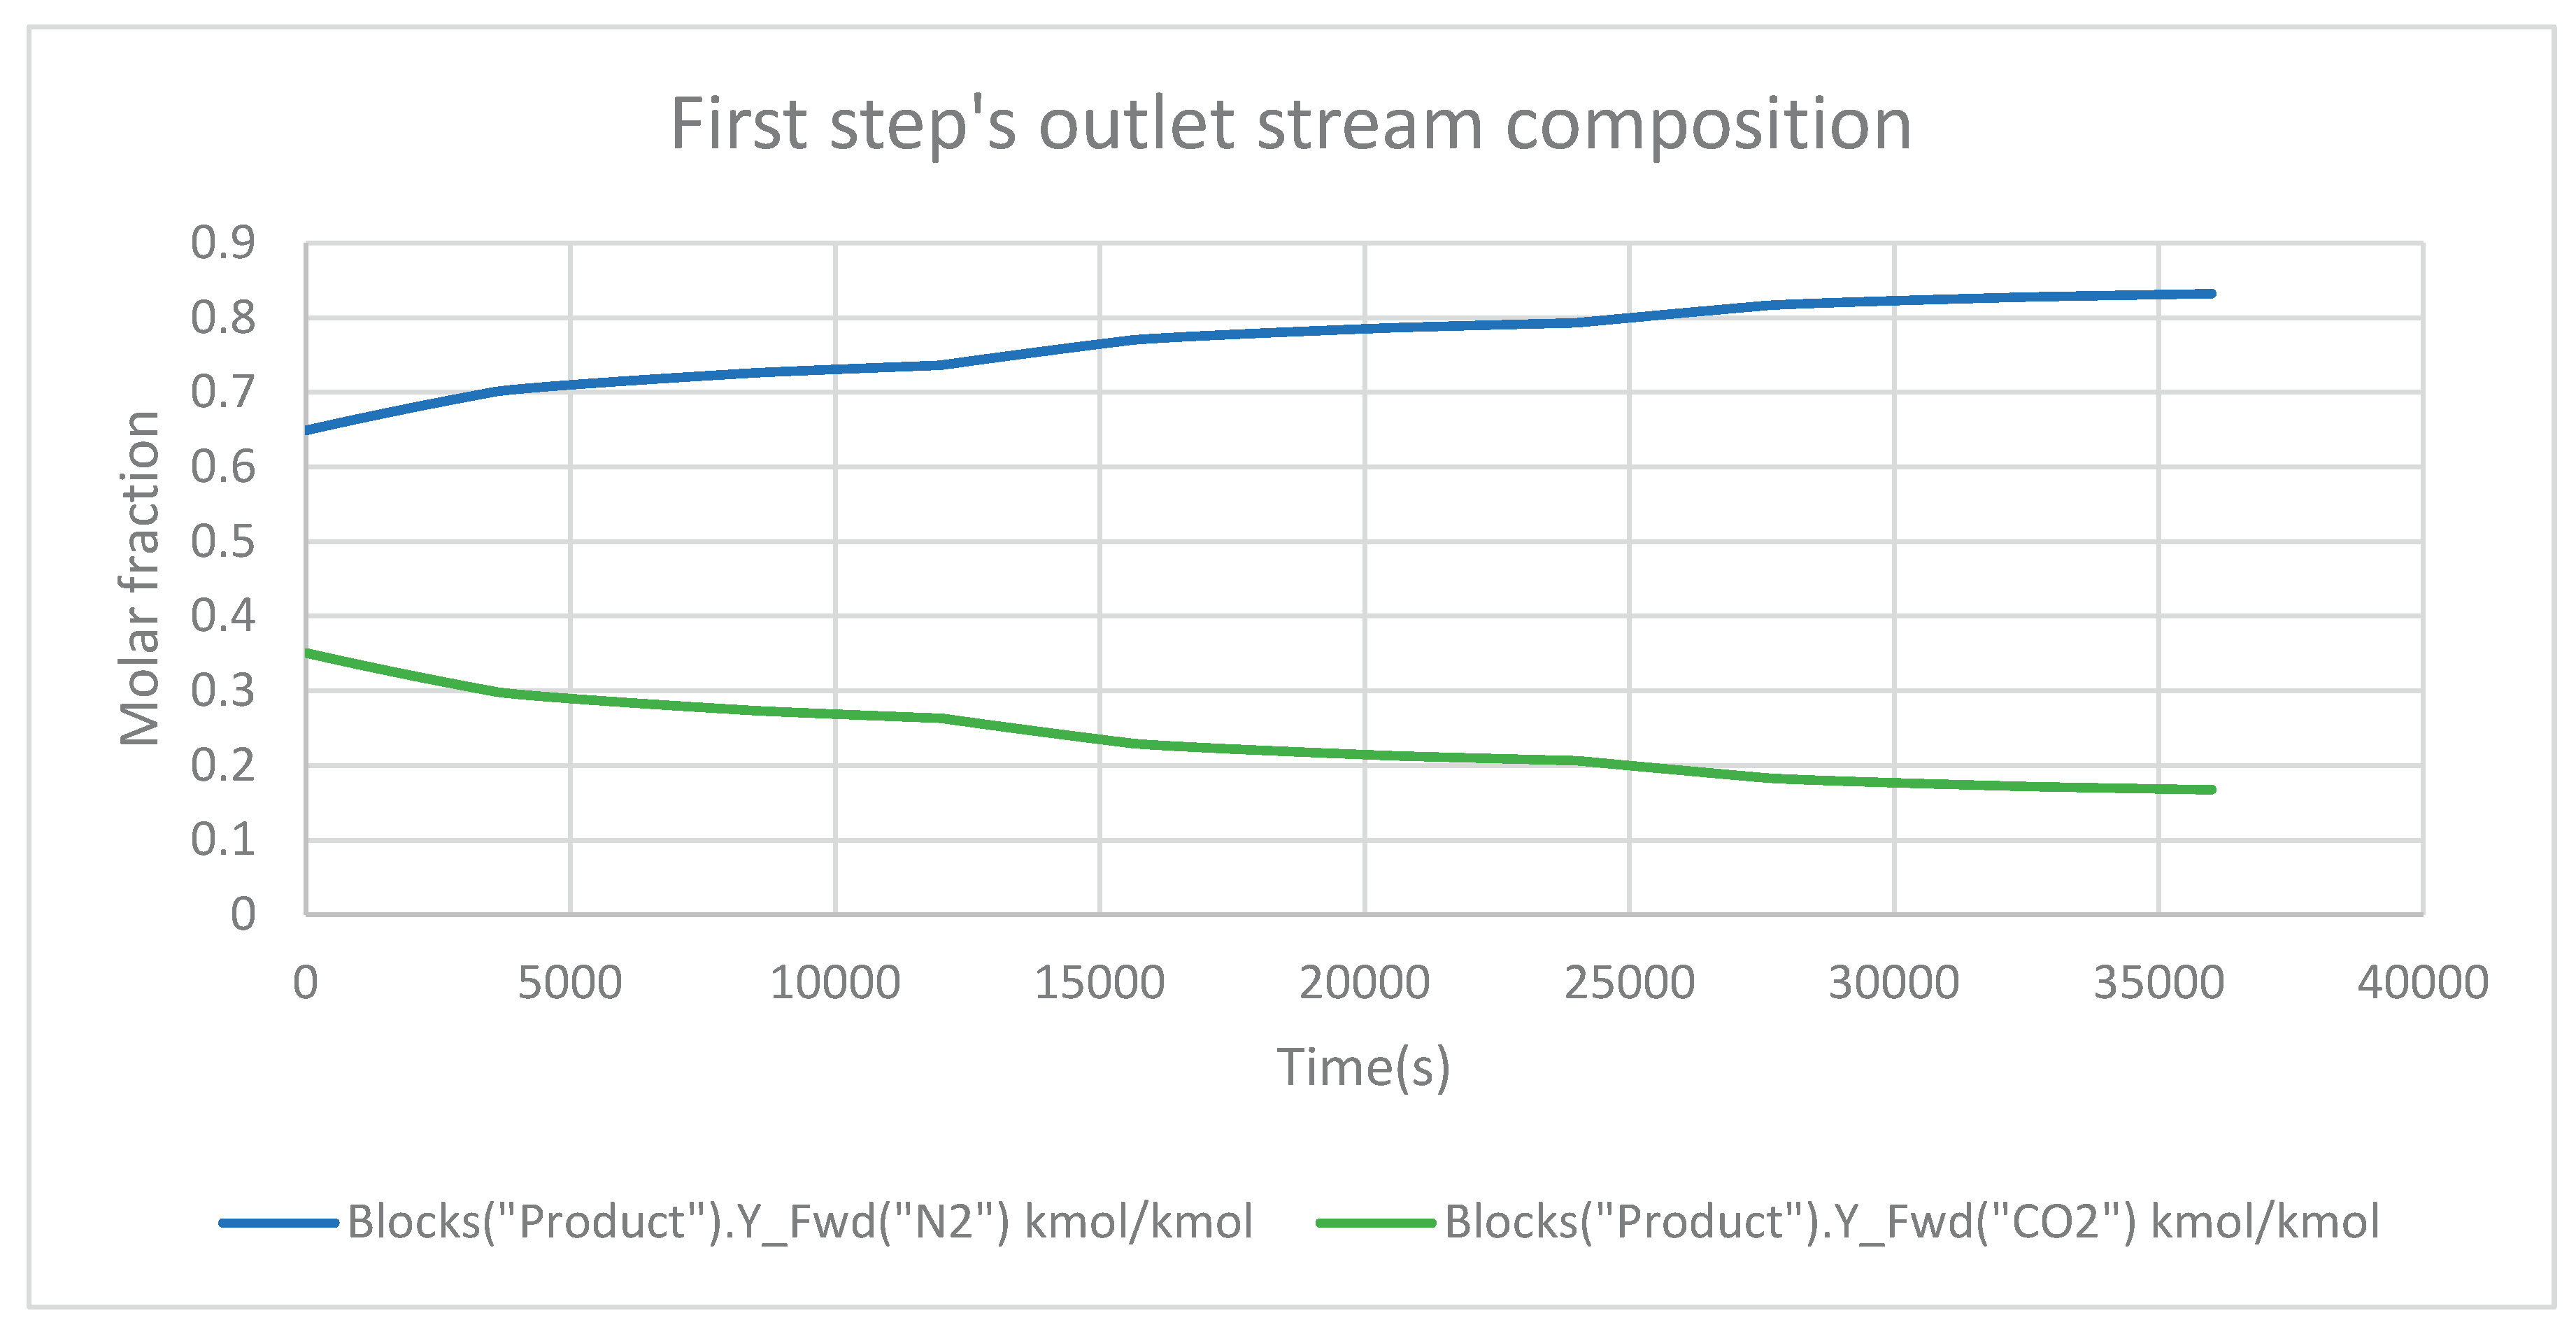
Figure 6.
Adsorption process at different temperatures.
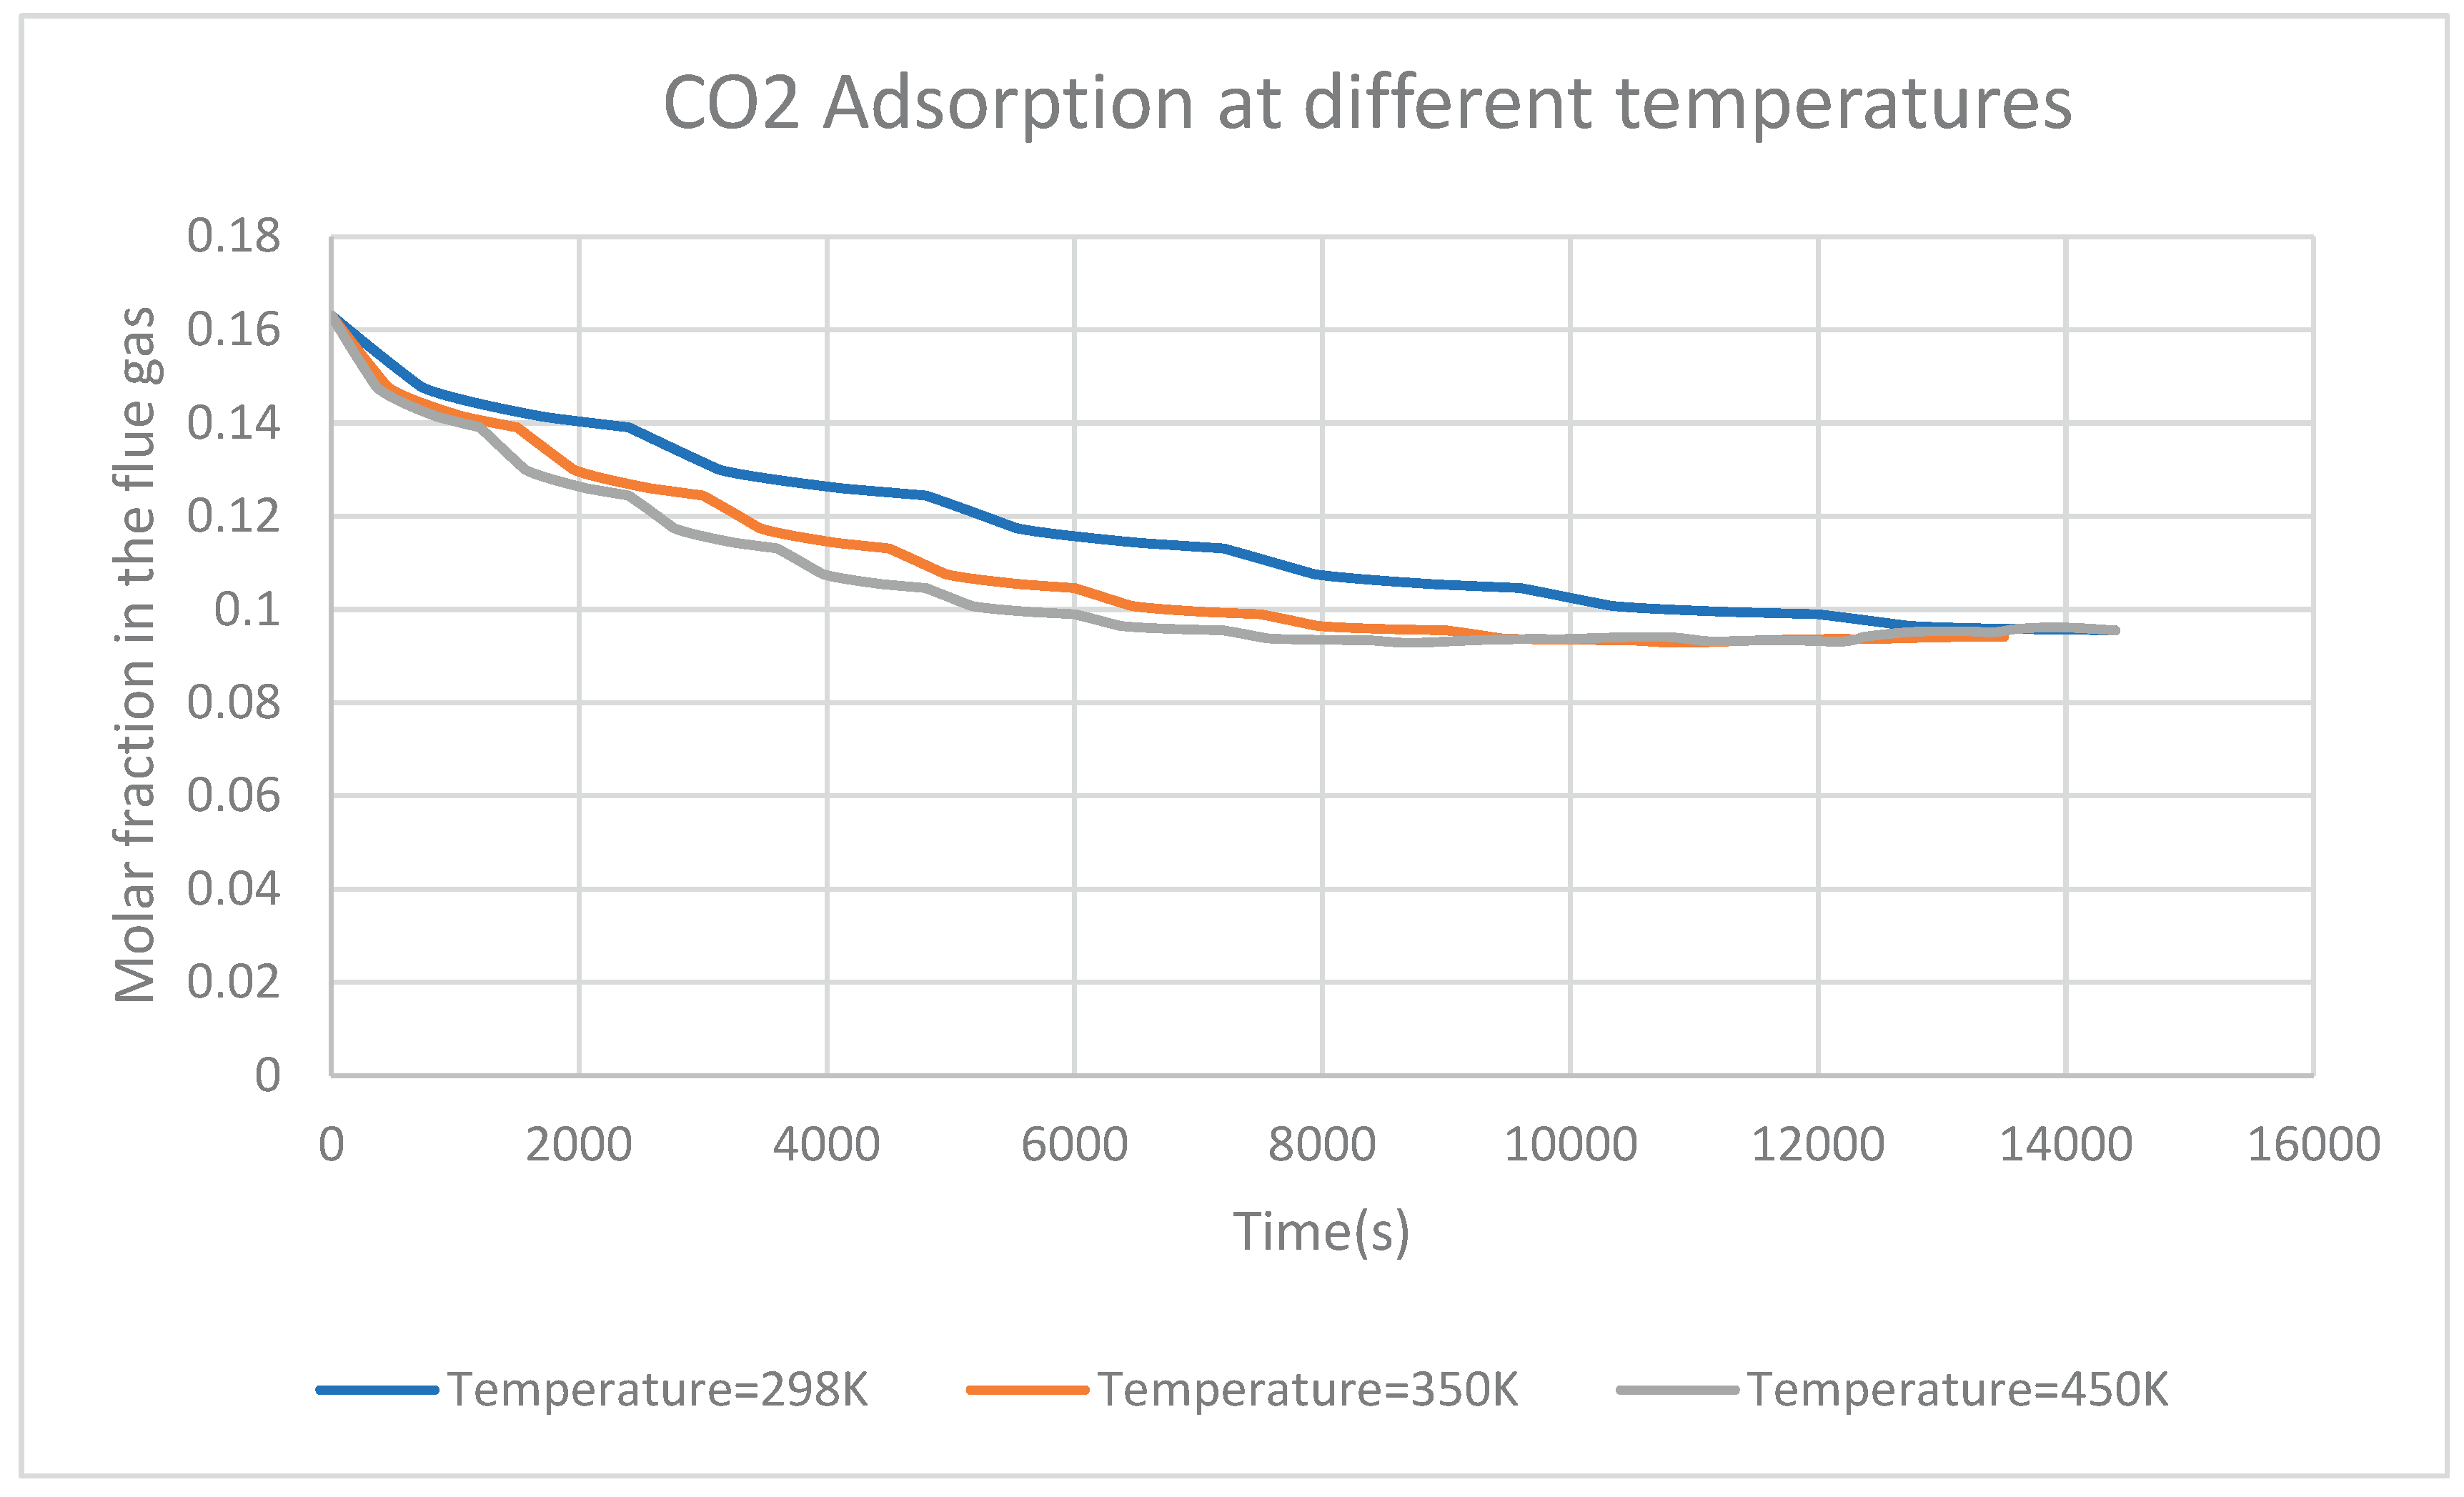
Figure 7.
Adsorption process at three different flue gas flow rates.
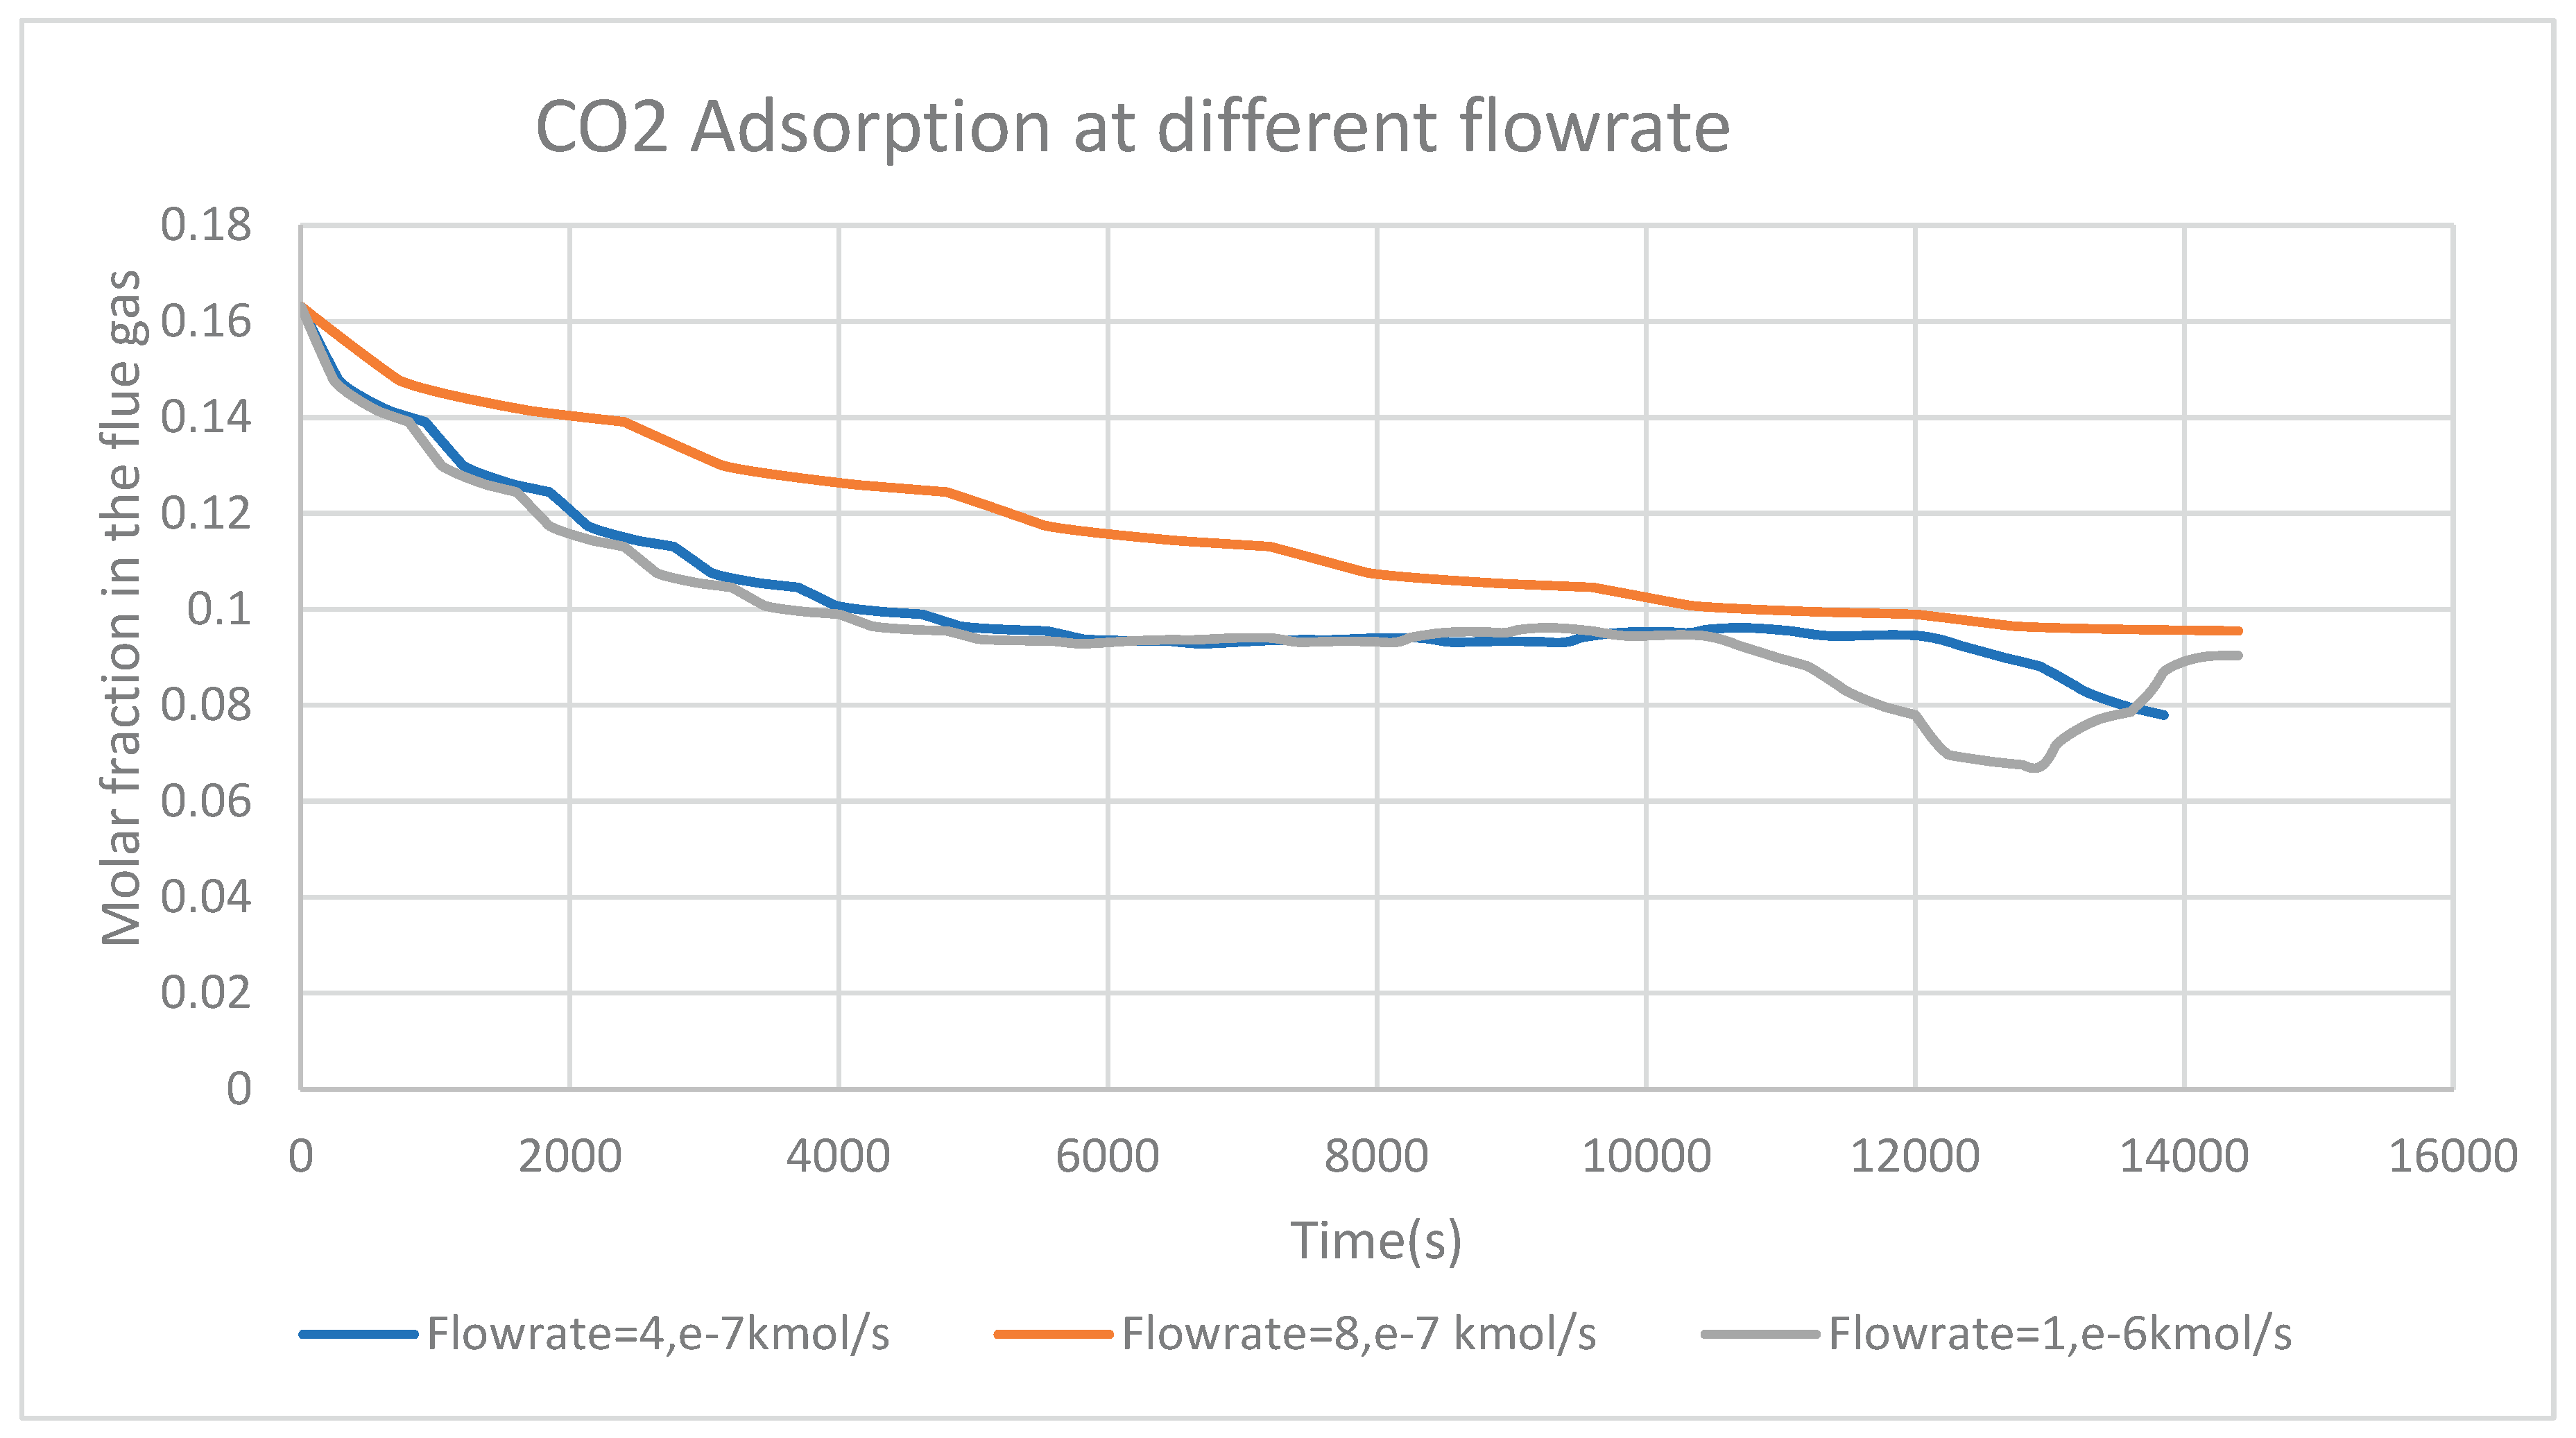
Figure 8.
Adsorption process at different bed heights.
Disclaimer/Publisher’s Note: The statements, opinions and data contained in all publications are solely those of the individual author(s) and contributor(s) and not of MDPI and/or the editor(s). MDPI and/or the editor(s) disclaim responsibility for any injury to people or property resulting from any ideas, methods, instructions or products referred to in the content. |
© 2025 by the authors. Licensee MDPI, Basel, Switzerland. This article is an open access article distributed under the terms and conditions of the Creative Commons Attribution (CC BY) license (http://creativecommons.org/licenses/by/4.0/).
Copyright: This open access article is published under a Creative Commons CC BY 4.0 license, which permit the free download, distribution, and reuse, provided that the author and preprint are cited in any reuse.


