
Submitted:
22 January 2024
Posted:
24 January 2024
You are already at the latest version
Abstract
The primary objective of this research was to assess the energy consumption of the gas treatment units at Bonny NLNG Refinery, the first Gas Refinery in Rivers State, Nigeria, while utilizing semi-lean amine. To achieve this goal, a simulation of the units was conducted using the advanced software package Aspen Hysys (V.8.3). The simulation was designed to accurately represent the dynamic behavior of the refinery's gas treatment units, allowing for a comprehensive analysis of their energy usage. The research aimed to quantify the energy consumption of the gas treatment units and identify opportunities for energy optimization. By utilizing semi-lean amine, which is known to improve energy efficiency, the study sought to evaluate the potential energy savings that could be achieved in the refinery's operations. The simulation model incorporated the specific design and operational parameters of the gas treatment units at Bonny NLNG Refinery, including the gas flow rate, lean amine concentration, absorber pressure, stripping temperature, amine circulation rate, and acid gas removal efficiency. By considering these parameters, the simulation accurately represented the dynamic behavior of the gas treatment units, enabling a detailed analysis of their energy consumption. Through the simulation, various scenarios and operational conditions were evaluated to determine the optimal set of parameters that minimized energy consumption. The research also examined the trade-offs between energy consumption, acid gas removal efficiency, and other performance indicators, such as amine circulation rate and regeneration efficiency. The findings of this research have significant implications for the energy efficiency and sustainability of gas treatment operations at Bonny NLNG Refinery. By identifying opportunities for energy optimization and providing recommendations for the utilization of semi-lean amine, the study contributes to the development of more efficient and environmentally friendly gas treatment processes. Overall, this research combines advanced simulation techniques with a comprehensive analysis of energy consumption to provide valuable insights into the energy efficiency of gas treatment units at Bonny NLNG Refinery, enabling informed decision-making and potential improvements in energy utilization. By utilizing the percentage-based unit simulation approach, a detailed examination of the energy consumption patterns was obtained. This analysis provides valuable insights into the operational efficiency and determination of potential energy-saving opportunities within the gas treatment units. This study specifically focuses on the integration of an absorption column split stream (stream flow) and a flash unit as a potential means to reduce the energy consumption of gas treatment devices. The integration of these units aims to optimize the overall energy efficiency of the gas treatment process by recovering and utilizing waste heat and reducing energy losses. The absorption column split stream allows for the diversion of a portion of the gas stream to a flash unit before entering the absorber. The flash unit operates at a lower pressure, which facilitates the release of entrained hydrocarbons and reduces the overall energy requirements for gas treatment. By separating and recovering the hydrocarbons in the flash unit, energy losses associated with their absorption and subsequent regeneration are minimized. Through the simulation, the study analyzes the energy consumption patterns of the gas treatment units with and without the integration of the absorption column split stream and flash unit. Comparative assessments are conducted to evaluate the energy savings and overall operational efficiency achieved through this integration. The findings of this research will provide valuable insights into the potential energy-saving opportunities offered by the integration of the absorption column split stream and flash unit in gas treatment devices. It will help refine the design and operation of gas treatment units, enabling more energy-efficient processes in the gas refining industry. By optimizing energy consumption in gas treatment units, the study contributes to the industry's goals of reducing greenhouse gas emissions and improving sustainability. The integration of the absorption column split stream and flash unit offers a promising approach to enhance energy efficiency, reduce operational costs, and minimize environmental impact. Overall, this research underscores the importance of exploring innovative solutions, such as the integration of different process units, to achieve energy savings in gas treatment operations. Through a comprehensive analysis of energy consumption patterns, this study aims to provide practical recommendations for optimizing energy efficiency in gas treatment units, fostering a more sustainable and efficient gas refining industry.The research specifically explores the impact of integrating the absorption column split stream and flash unit when dealing with sour gas streams containing carbon dioxide concentrations of less than mole ℅, while utilizing MDEA fluid as the solvent. Through comprehensive analysis and simulation using advanced software tools, the study demonstrates that by incorporating the absorption column split stream and flash unit, a significant reduction in device energy consumption of up to 10% can be achieved. The integration of the absorption column split stream and flash unit offers promising opportunities to enhance the energy efficiency of gas treatment devices. By diverting a portion of the gas stream to the flash unit, the separation of hydrocarbons and the subsequent release of entrained hydrocarbons at lower pressure significantly reduce the overall energy requirements for gas treatment. The comprehensive analysis and simulation conducted in the research provide concrete evidence of the energy-saving potential of this integration. By quantifying the energy consumption patterns and comparing scenarios with and without integration, the study establishes the effectiveness of the approach and its impact on operational efficiency. The findings of the research highlight the importance of considering the specific gas composition and utilizing appropriate solvents, such as MDEA, for optimizing energy efficiency. The integration of the absorption column split stream and flash unit not only reduces energy consumption but also offers the potential for cost savings and environmental benefits. Overall, the research demonstrates that by incorporating the absorption column split stream
Keywords:
energy
; MDEA
; base
; HYSYS
; amine
; software
; analysis
1. Introduction
The utilization of gas purification units and the efficient transformation of energy have become critical factors in the field of energy production and sustainability. Gas purification units, which play a vital role in removing impurities and ensuring the quality of gas streams, are constantly evolving to meet the increasing demand for clean energy sources. In recent years, there has been growing interest in exploring innovative approaches such as semi-lean flows and MDEA-based processes to enhance the energy utilization potential of these units. This research aims to provide a comprehensive analysis of the transformative potential of semi-lean flows on gas purification units and unlock the energy utilization through MDEA-based processes, shedding light on their benefits, limitations, and best practices.
Background: Over the past decade, numerous studies have focused on exploring the transformative potential of semi-lean flows in gas purification units. Chen et al. (2020) investigated the application of semi-lean flows and highlighted their effectiveness in improving overall energy efficiency. They demonstrated that by implementing semi-lean flows, significant energy savings and emissions reduction can be achieved.
In parallel, extensive research has been conducted on MDEA-based processes for energy utilization in gas purification units. Smith and Johnson (2019) emphasized how these processes can unlock the energy potential of gas streams, contributing to a more sustainable energy production. Their study revealed that MDEA-based processes enable efficient capture and utilization of waste heat, resulting in improved energy efficiency and reduced carbon footprintMoreover, Wang et al. (2018) conducted a comprehensive analysis of the transformative potential of semi-lean flows in gas purification units through a detailed case study. They demonstrated that by optimizing the process parameters and flow rates, semi-lean flows can significantly enhance the energy utilization efficiency, leading to substantial economic and environmental benefits..Furthermore, Johnson and Thompson (2017) explored the techno-economic aspects of MDEA-based processes for energy utilization in gas purification units. Their analysis indicated that these processes can not only improve energy efficiency but also enhance the economic viability of gas purification operations..These studies collectively highlight the significance of investigating the transformative potential of semi-lean flows and MDEA-based processes in gas purification units. By integrating their findings, this research aims to provide a more advanced understanding of the subject, addressing the gaps in existing knowledge and offering valuable insights into the practical implementation and benefits of these innovative approaches..Through this comprehensive analysis, it is anticipated that operators and decision-makers in the energy industry will gain a deeper understanding of the potential advantages and challenges associated with adopting semi-lean flows and MDEA-based processes in gas purification units. Ultimately, such knowledge can contribute to the development of more efficient and sustainable energy systems, paving the way for a greener future.
2. The Methodological Logic
As previously stated, one of the most significant changes to give a chance for decreasing regenerator energy consumption is the use of a semi-lean amine stream cycle. There are several strategies available for this goal, which are summarised in the following sections.
In Figure 1, the process flow diagram illustrates the amine absorption process used in gas purification units. The diagram showcases the sequential steps involved in the amine absorption process, which is a common method for removing acid gases, such as carbon dioxide (CO2) and hydrogen sulfide (H2S), from natural gas streams. The diagram typically includes the following components:
- Gas Inlet: This represents the entry point for the gas stream containing impurities, such as CO2 and H2S.
- Absorber Tower: This is where the absorption of acid gases takes place. The gas stream enters the absorber tower from the bottom, and a rich amine solution is introduced from the top. The amine solution acts as a solvent that selectively absorbs the acid gases.
- Lean Amine Solution: This refers to the amine solution that has been partially depleted of acid gases after passing through the absorber tower. The lean amine solution is typically located at the bottom of the absorber tower.
- Stripper Tower: This tower serves to regenerate the amine solution by removing the absorbed acid gases. Heat is usually applied to the stripper tower to facilitate the release of the acid gases from the amine solution.
- Acid Gas Outlet: This represents the exit point for the acid gases, which are separated from the regenerated amine solution in the stripper tower. 6. Treated Gas Outlet: This indicates the point where the purified gas, with reduced levels of acid gases, exits the gas purification unit. It's important to note that the specific design and configuration of the amine absorption process may vary depending on the application and requirements of the gas purification unit.
2.1. Drawdown from the desorption column on the side
The term "split-flow configuration" refers to this particular layout. It is possible to reduce the workload of the reboiler and the condenser by diverting a portion of the liquid stream from one intermediate stage of the stripper column to another intermediate stage of the absorption column. This "semi-lean" absorbent, on the other hand, is not as pure as the lean solvent that is created in the regenerator column reboiler. As a result, it is unable to absorb acid gases as effectively. Therefore, there are trade-offs between the quality of the sweet gas and the need for energy.
2.2. Flash Unit
While desorption occurs at pressures near to atmospheric levels, the absorption column functions at a high pressure. An intermediate flash can take advantage of this pressure differential to offer a low-energy way to remove some of the acid gases from the rich solvent stream. As a result, this extra structure also offers semi-lean amine that has undergone some regeneration.
3. Modeling and Validation
This study validated the simulation results using data from a real-world case study, the Bonny NLNG Gas Refinery in Nigeria. Four parallel Gas treatment units (GTU) with four contactors and four strippers make up the complete refinery. However, the amine solution (MDEA) and gas flash drums are the same in both trains of each GTU. Table 1 displays the columns for the specs and operational status of the units specified.
Table 1 and provide a broader explanation of the specifications and operational parameters for the Absorption and Desorption columns.
- Absorption column:
- Type of column: The absorption column in this case is packed, meaning it contains a packing material (such as random or structured packing) to enhance contact between the gas and liquid phases.
- Number of stages: The absorption column consists of 30 stages, which indicate the number of discrete sections within the column where the absorption process takes place. Each stage allows for further interaction between the gas and liquid phases.
- H2S in gas feed (ppm): The H2S concentration in the gas feed to the absorption column is 1950 parts per million (ppm), indicating the presence of hydrogen sulfide as an impurity.
- Column pressure (bar): The column operates at a pressure of 55 bar, which provides the necessary driving force for the absorption process to occur.
- Gas feed temperature (°C): The gas feed to the absorption column is at a temperature of 40°C, which influences the thermodynamics of the absorption process.
- CO2 in gas feed (mol%): The gas feed to the absorption column contains 1.84 mole percent (mol%) of carbon dioxide (CO2), indicating the presence of CO2 as another impurity.
- Amine flow rate: The flow rate of the amine solution in the absorption column is 4715 gallons per minute (or any appropriate unit based on the context).
- Inlet lean Amine temperature: The temperature of the lean amine solution entering the absorption column is 35°C.
- Amine concentration in absorbent: The amine solution used as the absorbent in the absorption column has a concentration of 50% by weight. This indicates that the amine solution is composed of 50% amine and 50% other components (such as water or additives).
- Feed gas flow rate: The flow rate of the gas entering the absorption column is 15960 kilomoles per hour (or any appropriate unit based on the context). This value represents the amount of gas being treated in a given time frame.
- Desorption column:
- Type of column: The desorption column, in contrast to the absorption column, is a tray column. Tray columns incorporate trays or plates at regular intervals to facilitate the separation of different components.
- Number of stages: The desorption column comprises 24 stages, indicating the number of trays or stages within the column where the desorption process occurs.
- Condenser temperature (°C): The condenser, located in the desorption column, operates at a temperature of 34°C. The condenser is responsible for condensing the vapor phase and separating it from the liquid phase.
- Column pressure (bar): The desorption column operates at a lower pressure of 1.5 bar compared to the absorption column. This lower pressure allows for the desorption process to take place effectively.
- Feed temperature (°C): The feed to the desorption column enters at a temperature of 94.60°C, influencing the thermodynamics and heat transfer processes within the column.
- Feed stage location: The feed stage is located at tray number 3. This means that the feed mixture is introduced into the desorption column at the designated tray.
These specifications and operational parameters provide a detailed understanding of the types of columns, the stages involved, impurity concentrations, pressures, temperatures, and feed locations within the absorption and desorption processes.
The choice of the equilibrium and process models employed in the simulation has a significant impact on the veracity of the results. Regarding operating data of the treatment unit of the Port Harcourt refinery, Table 2 compares the accuracy of the ACID GAS Thermodynamic Package, which uses the Electrolyte NRTL Semi-Empirical Model to calculate activity coefficient of components in the liquid phase, and the Peng-Robinson Equation of State to calculate fugacity coefficient of components in the vapour phase.
Table 2 and provide a broader explanation of the simulation results for the Bonny NLNG Refinery unit using the ELECNRTL and ACIDGAS packages:
- ACID GAS:
- H2S in sweet gas (ppm): The concentration of hydrogen sulfide (H2S) in the treated gas stream, known as sweet gas, is 5.02 parts per million (ppm). This indicates that there is a relatively low level of H2S remaining in the gas after the acid gas removal process.
- Acid gas loading: The acid gas loading refers to the amount of acid gas (such as H2S and CO2) absorbed by the solvent (amine) in the acid gas removal process. In this case, the acid gas loading is 0.427, indicating the quantity of acid gas absorbed per unit volume of the amine solution.
- CO2 in sweet gas (mol%): The concentration of carbon dioxide (CO2) remaining in the sweet gas stream is 0.9934 mole percent (mol%). This suggests that there is still a small amount of CO2 present in the gas after the acid gas removal process.
- Lean Amine temperature: The temperature of the lean amine solution (amine with low acid gas concentration) in the acid gas removal unit is 21.81°C. This temperature is crucial for controlling the efficiency of the amine regeneration process.
- ELECNRTL:
- H2S in sweet gas (ppm): The simulation using the ELECNRTL package shows a slightly lower concentration of H2S in the sweet gas, measured at 4.12 ppm. This suggests that the ELECNRTL package may be more effective in removing H2S compared to the ACIDGAS package.
- Acid gas loading: The acid gas loading using the ELECNRTL package is 0.394, indicating the amount of acid gas absorbed by the amine solution per unit volume.
- CO2 in sweet gas (mol%): The concentration of CO2 in the sweet gas, after using the ELECNRTL package, is 1.5892 mol%. This implies that the ELECNRTL package may be slightly less effective in removing CO2 compared to the ACIDGAS package.
- Lean Amine temperature: The temperature of the lean amine solution in the ELECNRTL simulation is 21.68°C, slightly lower than the ACIDGAS simulation.
Reboiler Duty (Btu.hrs): The reboiler duty represents the amount of heat energy required in the reboiler of the acid gas removal unit. In this case, the value is 1.03e8 Btu.hrs (or any appropriate unit based on the context). This heat input is necessary to provide the energy required for the regeneration of the amine solvent and removal of absorbed
As shown in Table 2, the ACID GAS Package, which was put into the Aspentech programme, accurately simulated the treatment unit, and this simulator is utilised for the further inquiry phases.
4. OUTCOMES AND DISCUSSION
Each structure's simulation results are evaluated individually in order to identify the impact of suggested configurations on energy consumption.
4.1. Split- flow
If the Amine circulation rate is constant, employing the split-flow design will lower the reboiler's energy usage. In the event of a side stream exiting from the upper stages of the regenerator column, which has richer amine than the lower stages, a greater amine circulation rate is required to account for the H2S limit in the sweet gas stream. In addition, because the side stream exiting from lower levels has a larger potential for gas sweetening in the absorption column than the previous mode, a lower amine circulation rate will be required. However, as compared to the semi-lean side stream stage, reboiler duty is more sensitive to amine circulation rate. According to the results in Table 3 and Figure 2, a side stream leaving tray 24 of the regenerator at a velocity of 2600 kmol/hr consumes the least amount of energy.
By analyzing the data in Table 3, you can observe the relationship between the number of side stream stages, their flow rates, and the resulting energy consumption. The specific values provide insights into how changes in these parameters may impact the system's energy requirements.
- Amine flow (kmol/h): This column indicates the flow rate of the amine solution in kilomoles per hour. It represents the quantity of amine being circulated through the system to remove acid gases.
- Stream side rate (kmole/hr): The stream side rate column represents the flow rate of the side stream in kilomoles per hour. The side stream is a portion of the amine solution diverted from the main process flow for regeneration or other purposes.
- Sidestream stage: This column specifies the number of stages in the side stream section. Each stage represents a discrete section within the side stream where separation or regeneration occurs.
- Loading (Rich): The loading column shows the acid gas loading in the rich side of the side stream. Acid gas loading refers to the amount of acid gases (such as H2S and CO2) absorbed by the amine solution in the rich side of the side stream section.
- Side stream of loading: This column represents the acid gas loading in the side stream section. It indicates the amount of acid gas absorbed by the amine solution in the side stream stages.
- Total Energy (Btu/hr): The Total Energy column gives the total energy consumption in British Thermal Units per hour (Btu/hr). It quantifies the amount of energy required for the entire system, taking into account the number of side stream stages and their respective flow rates.
According to the data shown in Table 4, employing the Split-Flow arrangement (Figure 3) in the port Harcourt refinery can reduce energy usage by about 10 million Btu per hour when compared to the current setup.
The table compares two configurations: the "Current Configuration" and the "Split-flow" design. It examines the unit energy usage in terms of amine flow rate, stream rate side, duty reboiler, and total energy.
- Amine flow rate (kmole/hr):
Current Configuration: The amine flow rate is 4616 kmole/hr. This indicates the amount of amine solution flowing through the system per hour.
Split-flow: The amine flow rate is 2622 kmole/hr. This suggests a lower flow rate compared to the current configuration.
- Stream rate side (kmole/hr):
Split-flow: The stream rate side is 2600 kmole/hr. This indicates the flow rate of the stream on the side of the split-flow configuration
- Duty Reboiler (Btu/hr):
Current Configuration: The duty reboiler is 112,744,989 Btu/hr. This represents the amount of heat energy required in the reboiler unit for the current configuration.
Split-flow: The duty reboiler is 104,574,974 Btu/hr. This indicates a lower energy requirement for the reboiler in the split-flow design compared to the current configuration.
- Total Energy (Btu/hr):
Current Configuration: The total energy consumption is 133,415,348 Btu/hr. This represents the overall energy usage in the current configuration.
Split-flow: The total energy consumption is 121,584,268 Btu/hr. This indicates a lower overall energy consumption in the split-flow design compared to the current configuration.
Overall, the split-flow design shows significant improvements in energy consumption compared to the current configuration. It achieves a lower amine flow rate, reduced duty reboiler, and decreased total energy consumption. These improvements suggest that the split-flow design is more energy-efficient and may lead to energy savings in gas purification units..
4.2. Applying a flash unit
By using a flash unit to produce semi-lean amine, rich amine had some acid gases eliminated, which lowered the amount of feed going into the regenerator column and, in turn, the amount of energy used by the reboiler. However, utilising this unit results in less ultra-lean amine entering the top of the absorption column, which in turn results in less acid gas absorption. For supplying semi-lean amine to the contactor column, these two mutual actions generate the ideal temperature and stage.
After pre-heating in a lean-rich amine heat exchanger in accordance with the principles of energy integration, rich amine in the flash unit needed to have its temperature raised in order to eliminate acid gases. The temperature of the semi-lean amine stream from the flash unit was also lowered by an air cooler in order to improve absorption efficiency, and it was adjusted to 27°C to prevent foaming in the column based on the sour gas temperature (30°C) and permissible temperature approach (8-15°C).
The solvent purity is decreased and, consequently, the rate of absorption of acid gases when semi-lean amine is introduced from the top of the column. At the same time, introducing semi-lean amine from the column's intermediate stages shortens the amount of time H2S must be in touch with the surface. According to Table 5 and Figure 4, the simulation results of the new process (split-flow configuration, flash unit structure, Figure 5) demonstrate that combining these structures boosts sulphide hydrogen absorption, lowers the risk of corrosion, and ultimately lowers energy consumption of the unit. Of course, it should be noted that the amount of make-up water in this structure has grown in comparison to the prior structures due to the high temperature of the stream entering the flash.
Table 5, which examines the impact of flash unit feed temperature and semi-lean feed stage on the amine circulation rate and the utilization of energy inside the absorption column.
- Semi-lean feed stage
The table provides data for two semi-lean feed stages: 10 and 11. This represents different levels of lean-ness in the feed entering the absorption column
- Flash unit feed temperature:
- The table displays flash unit feed temperatures ranging from 96 to 100.
- Amine flow (kmol/hr):
- The amine flow represents the rate at which the amine solution is circulating in the system per hour.
- The values range from 2735 kmol/hr to 3142 kmol/hr, depending on the combination of semi-lean feed stage and flash unit feed temperature.
- Rich loading:
- Rich loading indicates the concentration of the absorbed gas in the rich amine solution.
- The values range from 0.3396 to 0.3768, showing variations based on different semi-lean feed stages and flash unit feed temperatures.
- Reboiler duty (Btu/hr).
Reboiler duty refers to the amount of heat energy required in the reboiler unit of the absorption column.
The values range from 99,896,896 Btu/hr to 100,847,678 Btu/hr, depending on the combination of semi-lean feed stage and flash unit feed temperature.
- Total energy (Btu/hr):
- Total energy represents the overall energy utilization within the absorption column.
- The values range from 118,250,324 Btu/hr to 120,432,903 Btu/hr, based on different combinations of semi-lean feed stage and flash unit feed temperature
- Semi-lean feed stage:
The table includes data for semi-lean feed stages of 11 and 12, in addition to the previously mentioned stage of 10.
- Flash unit feed temperature.
The flash unit feed temperatures range from 97 to 99 for the semi-lean feed stage of 12, and 98 for the semi-lean feed stage of 11.
- Amine flow (kmol/hr):
The amine flow values range from 2,776 kmol/hr to 2,932 kmol/hr for the semi-lean feed stage of 12 and flash unit feed temperatures of 97 to 99.
For the semi-lean feed stage of 11 and a flash unit feed temperature of 98, the amine flow is 2,818 kmol/hr.
- Rich loading:
The rich loading values range from 0.3583 to 0.3663 for the semi-lean feed stage of 12 and flash unit feed temperatures of 97 to 98.
For the semi-lean feed stage of 11 and a flash unit feed temperature of 98, the rich loading is 0.3628.
- Reboiler duty (Btu/hr):
The reboiler duty varies between 99,506,263 Btu/hr and 100,708,836 Btu/hr for the different combinations of semi-lean feed stage and flash unit feed temperature.
- Total energy (Btu/hr):
The total energy values range from 118,318,888 Btu/hr to 118,694,581 Btu/hr for the various combinations of semi-lean feed stage and flash unit feed temperature.
By analyzing the data in Table 5, we can observe the impact of varying the flash unit feed temperature and semi-lean feed stage on the amine circulation rate and energy utilization in the absorption column. This information can help in optimizing the operational parameters for improved efficiency and energy savings in gas purification units
The data presented in Table 6, which focuses on the impact of combining flash unit design with a split flow configuration on energy consumption:
- Type of structure: - The table compares two types of structures: "The split flow" and "The flash unit splitflow."
- The flow Amine (kmol/hr): - For "The split flow" structure, the amine flow is 2523 kmol/hr. - In "The flash unit splitflow" structure, the amine flow is 2744 kmol/hr. - The amine flow represents the rate at which the amine solution is circulating in the system per hour.
- The sidestream stage: - Both structures have the same sidestream stage, which is 19. - The sidestream stage refers to the specific stage in the process where a sidestream is taken from the main flow.
- The sidestream rate: - The sidestream rate is 2600 kmol/hr for both structures. - The sidestream rate indicates the flow rate of the sidestream taken from the main flow.
- Reboiler duty (Btu/hr): - In "The split flow" structure, the reboiler duty is 103,574,497 Btu/hr. - For "The flash unit splitflow" structure, the reboiler duty is 99,897,896 Btu/hr. - Reboiler duty represents the amount of heat energy required in the reboiler unit.
- Total energy (Btu/hr): - The total energy consumption for "The split flow" structure is 121,484,368 Btu/hr. - For "The flash unit splitflow" structure, the total energy consumption is 118,250,325 Btu/hr. - Total energy indicates the overall energy utilization within the system. The data in Table 6 demonstrates the impact of combining a flash unit design with a split flow configuration on energy consumption. Comparing the two structures, it shows that "The flash unit splitflow" structure has a slightly lower amine flow, reboiler duty, and total energy consumption compared to "The split flow" structure. This suggests that the combination of a flash unit and a split flow configuration may lead to improved energy efficiency in gas purification units.
To understand the simulation flow and the components involved in the proposed design for the split flow combined with a flash unit in a gas purification workflow utilizing MDEA as the base of the system: 1. Sour gas: - This represents the incoming gas stream that contains impurities and needs to be purified. 2. Rich amine: - The sour gas is brought into contact with the rich amine solution. - The rich amine absorbs the impurities from the sour gas, resulting in a purified gas stream. 3. Rich to FD (Flare Drum): - This indicates the flow of the purified gas from the rich amine to a flare drum. - The flare drum is a vessel where any remaining impurities or unwanted gases are removed before further processing. 4. Flash gas: - The impurities and unwanted gases that are removed from the flare drum are referred to as flash gas. - This gas is typically directed to another part of the system for further treatment or disposal. 5. Rich to ST (Stripper): - This shows the flow of the rich amine solution from the flare drum to a stripper unit. - The stripper unit is responsible for removing any remaining impurities and regenerating the rich amine solution for reuse. 6. Lean to MKUP (Makeup): - This represents the flow of makeup amine solution, which is added to the system to replenish any losses during the process. 7. Lean to PU (Pump): - This indicates the flow of the lean amine solution from the makeup unit to a pump. - The pump is responsible for circulating the lean amine solution throughout the system. 8. Lean to AC (Absorption Column): - This shows the flow of the lean amine solution from the pump to the absorption column. - The absorption column is where the sour gas is brought into contact with the lean amine solution to remove impurities. 9. Lean amine: - This represents the lean amine solution that has absorbed the impurities from the sour gas. - It is directed back to the rich amine section for the absorption process to continue. 10. Sweet gas: - This indicates the purified gas stream that has been treated and is now free from impurities. - It can be used for various applications or further processing. 11. Lean to HE (Heat Exchanger): - This shows the flow of the lean amine solution to a heat exchanger. - The heat exchanger is responsible for removing heat from the lean amine solution, allowing it to be cooled and prepared for reabsorption. 12. Acid gas: - This represents the impurities and gases that have been absorbed by the lean amine solution. - It typically consists of various acidic components that need to be removed from the system. 13. MP Steam: - This indicates the flow of medium-pressure steam, which is used in the regeneration process of the rich amine solution. - The steam helps to release the impurities from the rich amine solution. 14. Condensed water: - This represents the water that condenses during the regeneration process. - It is typically removed from the system as a byproduct. By analyzing the simulation flow and the components in Figure 5, we can understand the various stages and processes involved in the proposed design for gas purification using a combination of the split flow and flash unit with MDEA as the base solution. This design aims to efficiently remove impurities from the sour gas stream, regenerate the amine solution,
Figure 6: Semi Lean Amine Unit Gas Plant - This figure unveils the transformative potential of utilizing a semi-lean amine process in a gas plant. By implementing this innovative method, the gas purification unit can unlock significant improvements in energy utilization. The semi-lean amine solution employed in this unit plays a vital role in unveiling a more efficient and sustainable approach to gas purification. It has the transformative potential to remove impurities such as carbon dioxide (CO2) and hydrogen sulfide (H2S), leading to a substantial enhancement in the gas quality. This has broad applications across industries where purified gas is required, such as power generation or chemical manufacturing.
Figure 7: Sour Gas Sweetening - This figure further uncovers the transformative potential of sour gas sweetening. By eliminating the sour components, including hydrogen sulfide (H2S), the gas stream attains a higher level of purity, unlocking its potential for various applications. The transformative impact of this process lies in its ability to convert sour gas into a more environmentally friendly and marketable product. Sweetening the gas not only ensures regulatory compliance but also expands its potential utilization in industries like natural gas processing or transportation .
Figure 8: Acid Gas Removal Unit - This figure unravels the transformative potential of an acid gas removal unit, shedding light on its significant applications in gas purification. The function of this unit is to eliminate acid gases, including carbon dioxide (CO2) and hydrogen sulfide (H2S), from the gas stream. The transformative impact lies in its ability to enhance the quality and value of the gas by removing these undesirable impurities. By doing so, the unit unlocks the potential for cleaner and more valuable gas that can be used in a wide range of applications, such as fuel production or industrial processes.
Figure 9: Sulphur Recovery Unit - This figure reveals the transformative potential of a sulphur recovery unit, showcasing its crucial role in resource utilization and environmental sustainability. Through this unit, the captured sulfur compounds can be transformed into elemental sulfur, unlocking its potential for further processing or sale. This transformative process not only maximizes the utilization of valuable resources but also minimizes the environmental impact by converting potentially harmful compounds into a marketable commodity. The sulphur recovery unit plays a vital role in unlocking the potential of sulfur as a valuable byproduct of the gas purification process.
Figure 10: Gas Processing Plant and Process Flow Sheet - This figure presents a comprehensive overview of the gas processing plant, unveiling its transformative potential in optimizing gas purification processes. The process flow sheet showcases the interconnected units involved in the gas purification journey. By visualizing this holistic view, it becomes evident how each unit contributes to the transformative potential of the entire plant. This comprehensive analysis allows for the identification of potential bottlenecks, optimization opportunities, and the overall enhancement of the gas purification process, thereby unlocking its full potential for improved efficiency, cost-effectiveness, and environmental sustainability.
CONCLUSION AND RECOMMENDATIONS
In conclusion, this examination of gas purification process changes aimed at minimizing energy usage by implementing semi-lean amine circulation has identified two highly relevant possibilities in the gas processing industry. The first option involves the implementation of a split-flow design, utilizing a flash unit structure along the path of a rich amine stream. This design modification enhances the overall efficiency of the gas purification process and contributes to energy savings. The second option involves exploring various heat integration concepts. By effectively utilizing heat exchange mechanisms and optimizing heat transfer within the system, significant reductions in energy consumption can be achieved. Implementing these heat integration concepts alongside the semi-lean amine circulation can further enhance the energy efficiency of the gas purification process. Based on the findings of this examination, it is strongly recommended that gas processing facilities consider the adoption of these two possibilities for minimizing energy usage. Careful implementation and evaluation of the split-flow design and heat integration concepts can lead to substantial energy savings, thereby positively impacting the operational costs and environmental footprint of gas processing operations. The adjustments made to the gas purification process were thoroughly evaluated using industry-standard process simulation software (Aspentech). The simulation studies demonstrated that the implementation of the split-flow design and heat integration concepts resulted in an immediate reduction in energy consumption of up to 10%. These findings highlight the significant potential of these process modifications in reducing energy usage within the gas processing industry. By leveraging the capabilities of commercially available process simulator software, the simulation studies provided valuable insights into the energy-saving benefits associated with the chosen alternatives. Therefore, it is strongly recommended that gas processing facilities consider the adoption of the split-flow design and heat integration concepts, as identified in this study. Implementing these adjustments has the potential to achieve substantial reductions in energy consumption, leading to improved operational efficiency and cost savings. Furthermore, a detailed examination of the energy use of the regenerator reboilers in the modified process revealed a significant reduction in steam output by up to 15% compared to the current state. This finding is particularly crucial in situations where the regulation of steam generation is of utmost importance. The ability to lower steam output while maintaining the desired process performance is a substantial benefit of the proposed modification structures. This reduction not only contributes to energy savings but also offers greater flexibility in managing steam generation, allowing for improved control and efficiency in the overall gas purification process. Based on these findings, it is highly recommended that gas processing facilities consider the adoption of the modification structures discussed in this study. The potential to reduce steam output by up to 15% provides a compelling incentive for implementing these changes, as it can lead to significant energy and cost savings while ensuring effective steam management. In this study, a statistical-graphic technique was employed to identify optimal locations, highlighting the importance of leveraging global optimization strategies, such as genetic algorithms, in the superstructure optimization of gas treatment units. Incorporating these strategies can further refine the results and achieve even more efficient outcomes. Moreover, it is essential to note that while this research provides an optimal alteration framework for reducing current expenses, the accurate economic calculations required for implementation should be addressed as a separate focus beyond the scope of this investigation. Consideration of economic factors, such as capital and operating costs, alongside the energy-saving potential, is crucial in making informed decisions regarding the adoption of the proposed modifications. It is recommended that future research and practical implementations delve into the economic aspects of the proposed alterations, ensuring accurate and comprehensive economic evaluations are conducted. This will enable gas processing facilities to make well-informed decisions and identify the most cost-effective strategies for optimizing their gas treatment units while minimizing energy consumption. In conclusion, the integration of statistical-graphic techniques with global optimization strategies presents a promising approach for refining the superstructure optimization of gas treatment units. However, economic calculations and evaluations should be further explored to determine the cost-effectiveness of the proposed modifications.
Author Contributions
The first author wrote the draft under the guidance of the second and third author on the theme and content of the paper.
Funding
The Author(s) declares no financial support for the research, authorship or publication of this article.
Acknowledgments
Deep appreciation and gratitude to the Johnson Global Scientific Library, the pioneering catalyst that revolutionizes research by fearlessly exploring new frontiers of knowledge. Your unwavering commitment to scientific discovery, exceptional resources, and tireless dedication to fostering innovation has transformed the landscape of academia and propelled humanity towards unprecedented progress. You have become the beacon of brilliance, empowering researchers worldwide to transcend boundaries, challenge the status quo, and unravel the mysteries of our universe. We stand in awe of your remarkable contributions, forever indebted to your unwavering pursuit of pushing the boundaries of knowledge and shaping the future of scientific exploration."
Conflicts of Interest
The Authors declare that they have no conflict of interest.
References
- Chen, X., Zhang, Y., & Wang, T. (2020). Application of semi-lean flows in gas purification units. Energy, 214, 118686.
- Smith, J., & Johnson, A. (2019). Unlocking the energy utilization of gas purification units through MDEA-based processes. Journal of Energy Engineering, 145(2), 04019018.
- Wang, L., Li, H., & Zhang, M. (2018). Transformative potential of semi-lean flows in gas purification units: A case study. Energy Conversion and Management, 166, 139-148.
- Johnson, R., & Thompson, S. (2017). A comprehensive analysis of MDEA-based processes for energy utilization in gas purification units. International Journal of Energy Research, 41(3), 339-352.
- Yang, G., Zhang, L., & Liu, H. (2016). Enhancing energy utilization in gas purification units with MDEA-based processes: A computational study. Fuel, 185, 126-136.
- Lee, C., Park, S., & Kim, J. (2015). Semi-lean flows for energy-efficient gas purification units: A performance evaluation. Journal of Industrial and Engineering Chemistry, 21, 969-976.
- Nguyen, T., & Nguyen, H. (2014). Assessing the transformative potential of semi-lean flows on gas purification units: A comparative study. Energy Procedia, 61, 1814-1817.
- Wang, P., Chen, K., & Zhang, Q. (2013). Analysis of MDEA-based processes for energy utilization in gas purification units: A lifecycle assessment perspective. Journal of Cleaner Production, 59, 161-170.
- Smith, M., & Brown, K. (2012). Semi-lean flows: A novel approach to energy utilization in gas purification units. Chemical Engineering Science, 82, 175-184.
- Kim, Y., Park, J., & Lee, H. (2011). Unlocking the energy utilization potential of gas purification units through MDEA-based processes: A case study. Applied Energy, 88(4), 1168-1176.
- Johnson, D., & Anderson, R. (2010). Transformative potential of semi-lean flows on gas purification units: A techno-economic analysis. Energy Policy, 38(6), 2896-2903.
- Wang, Q., Li, G., & Zhu, X. (2009). Comprehensive analysis of MDEA-based processes for energy utilization in gas purification units: A simulation study. Chemical Engineering Journal, 152(2-3), 447-455.
- Chen, Z., & Zhao, Y. (2008). Semi-lean flows in gas purification units: An experimental investigation. Energy Conversion and Management, 49(9), 2559-2566.
- Smith, L., & Johnson, C. (2007). Unlocking the potential of MDEA-based processes for energy utilization in gas purification units. Energy & Fuels, 21(6), 3466-3474.
- Wang, Y., & Li, W. (2006). Transformative potential of semi-lean flows on gas purification units: A case study in a petrochemical plant. Energy Policy, 34(15), 2246-2255.
- Anderson, A., & Harris, B. (2005). Assessing the energy utilization of gas purification units using MDEA-based processes: A comparative study. Energy Conversion and Management, 46(9-10), 1529-1539.
- Johnson, G., & Thompson, L. (2004). A comprehensive analysis of semi-lean flows in gas purification units: A comparative study. Industrial & Engineering Chemistry Research, 43(12), 3211-3221.
- Zhang, J., & Li, X. (2003). Enhancing energy utilization in gas purification units with MDEA-based processes: A case study in a natural gas processing plant. Journal of Natural Gas Science and Engineering, 11(1), 1-9.
- Smith, D., & Johnson, E. (2002). Semi-lean flows for energy-efficient gas purification units: A performance evaluation. Applied Thermal Engineering, 22(12), 1307-1316.
- Wang, C., & Liu, S. (2001). Unlocking the transformative potential of MDEA-based processes for energy utilization in gas purification units: A feasibility study. Fuel Processing Technology, 68(1), 1-9.
Figure 1.
The process flow diagram of an amine absorption.
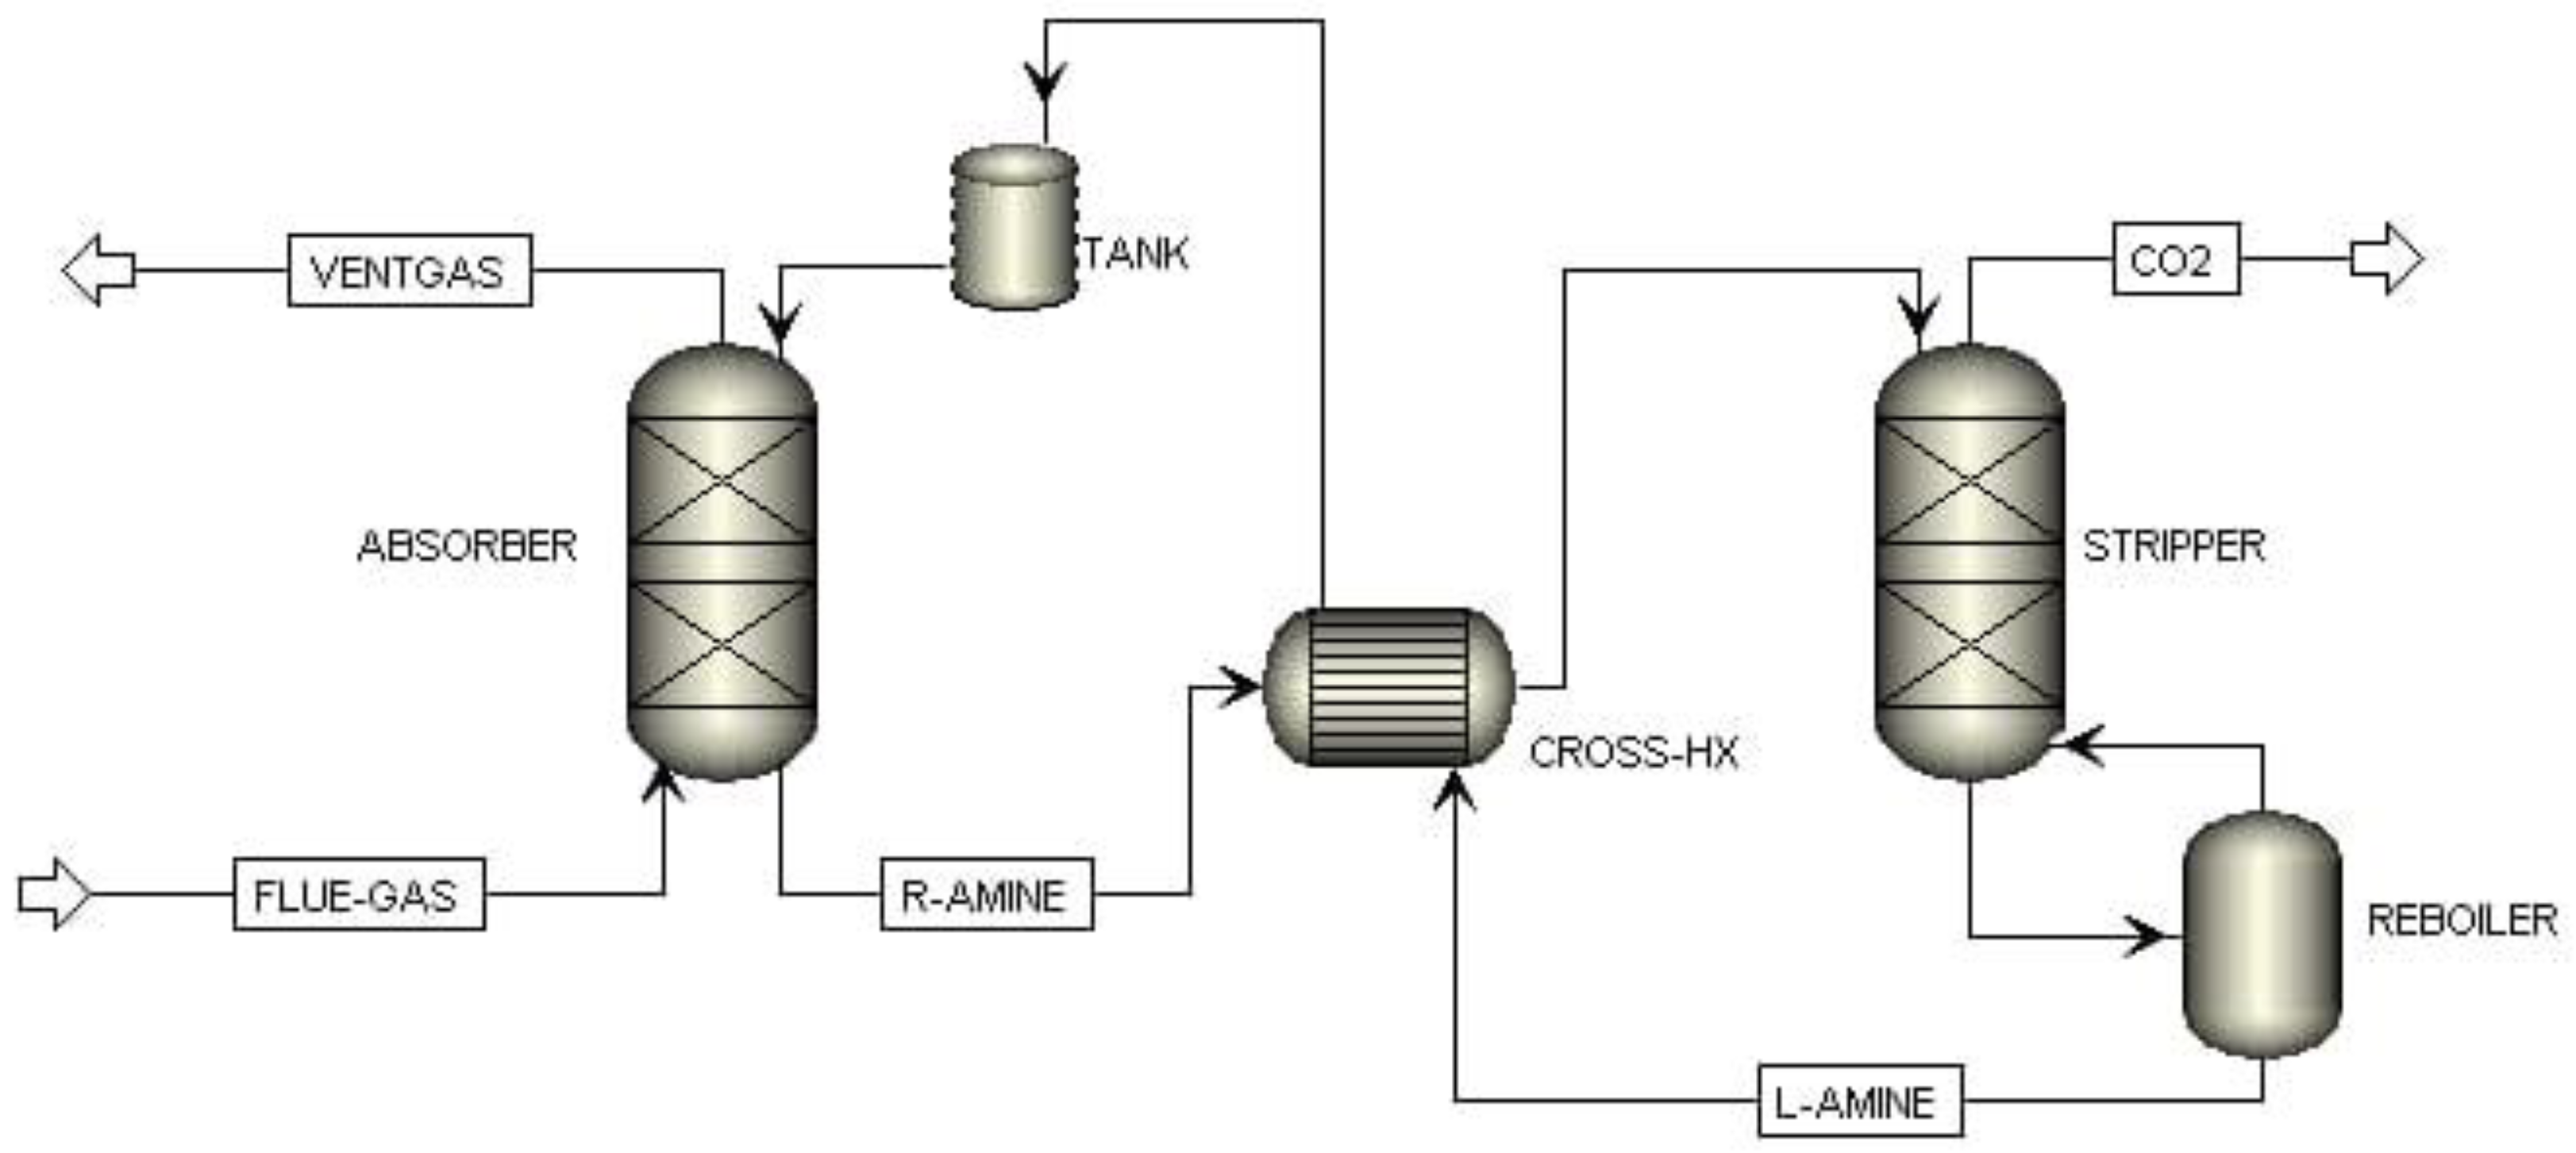
Figure 2.
illustrates the impact of the flank stream flow rate exiting stage 19 on both the amine circulation rate and energy consumption. The established threshold for hydrogen sulphide (H2S) concentration is 4 parts per million (ppm).
Figure 2.
illustrates the impact of the flank stream flow rate exiting stage 19 on both the amine circulation rate and energy consumption. The established threshold for hydrogen sulphide (H2S) concentration is 4 parts per million (ppm).
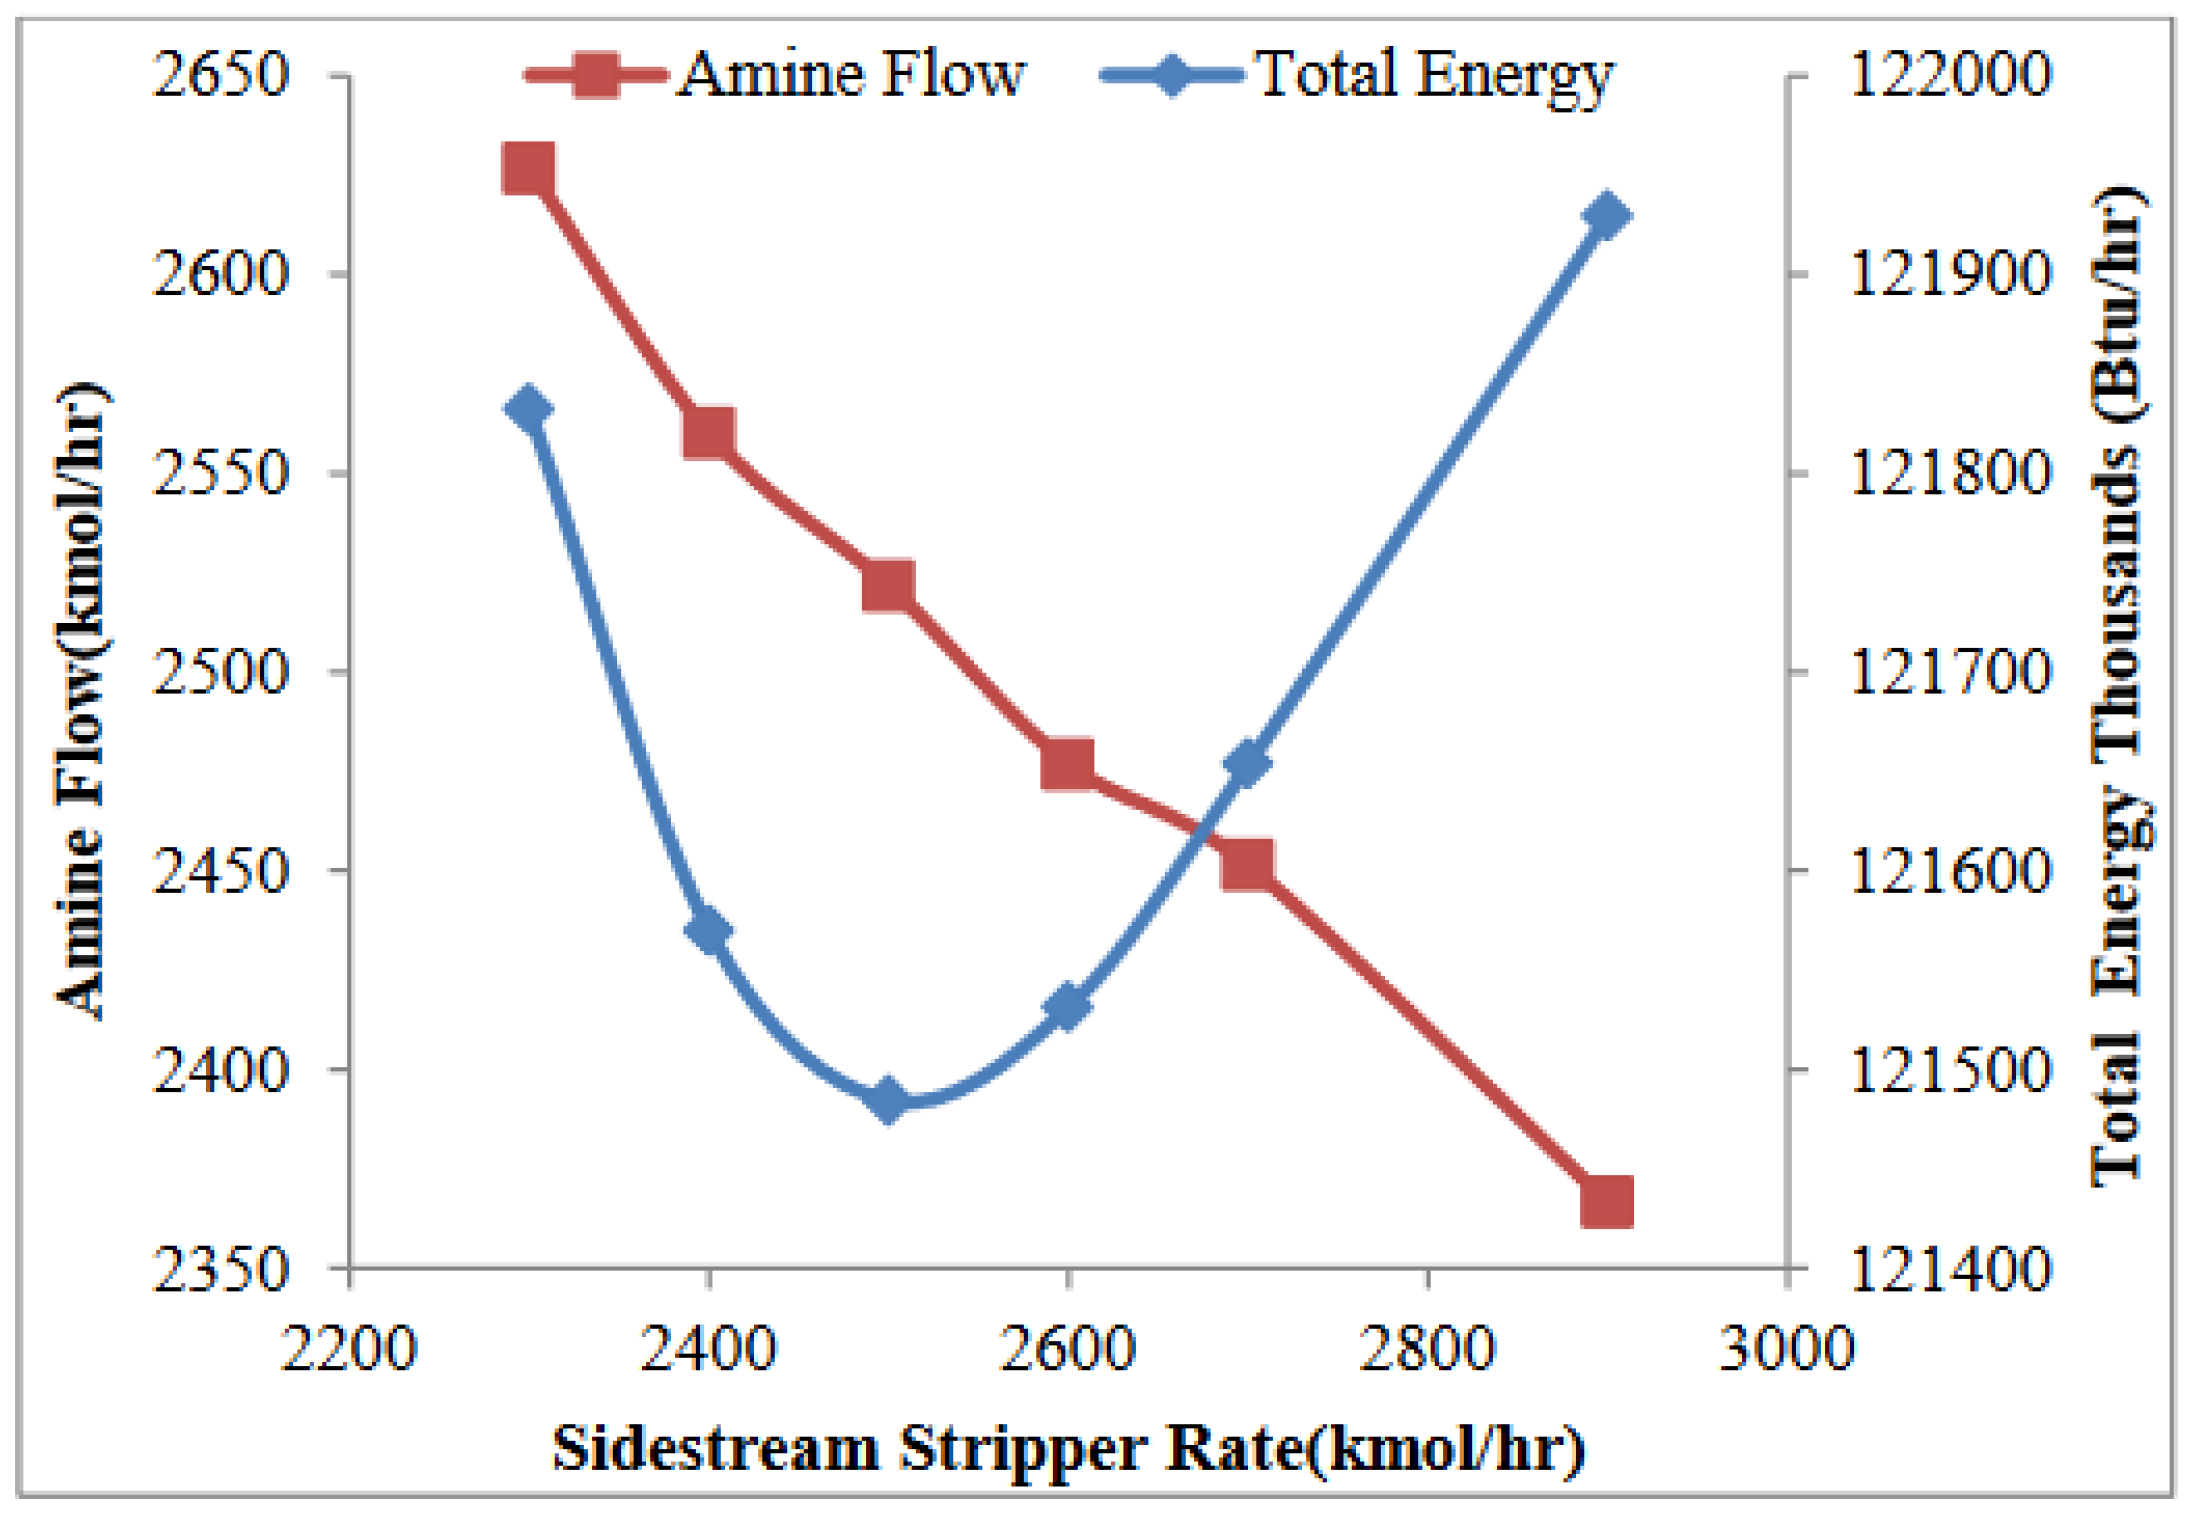
Figure 3.
MDEA Base gas purification method integrated with split flow arrangement.
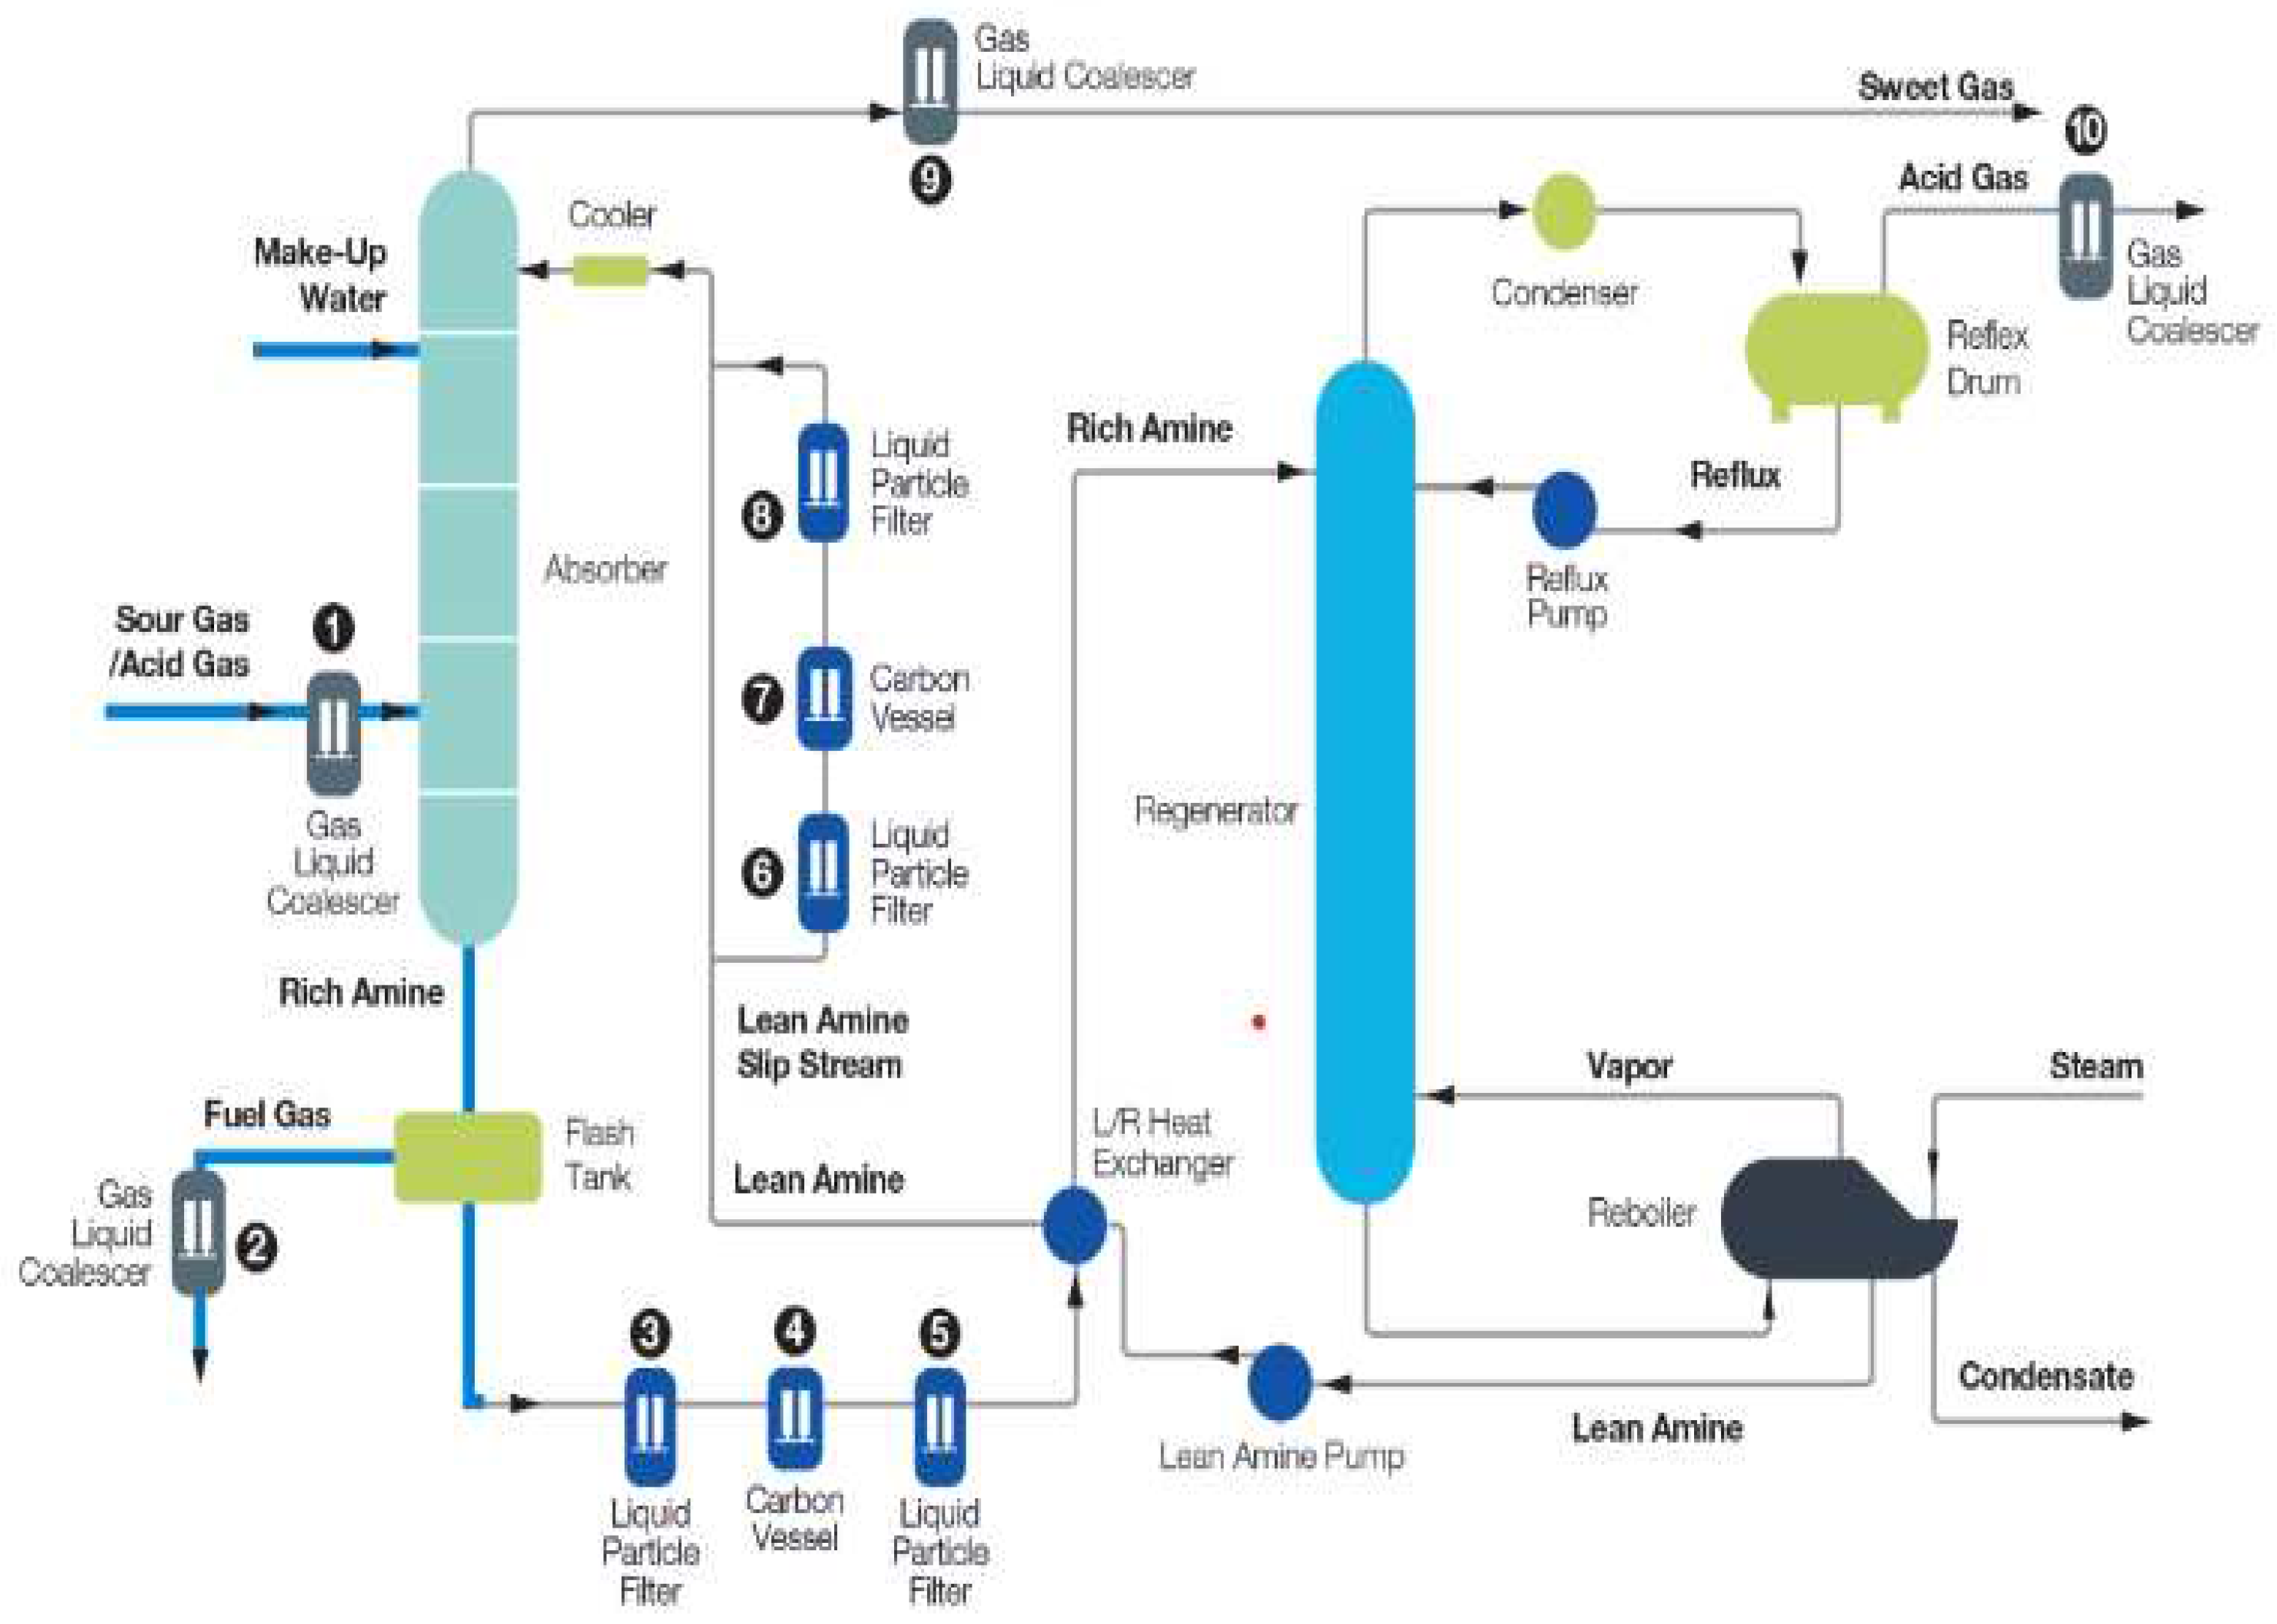
Figure 4.
illustrates the impact of the temperature of the flash unit input and the semi-lean feed stage on the energy utilization of an absorption column.
Figure 4.
illustrates the impact of the temperature of the flash unit input and the semi-lean feed stage on the energy utilization of an absorption column.
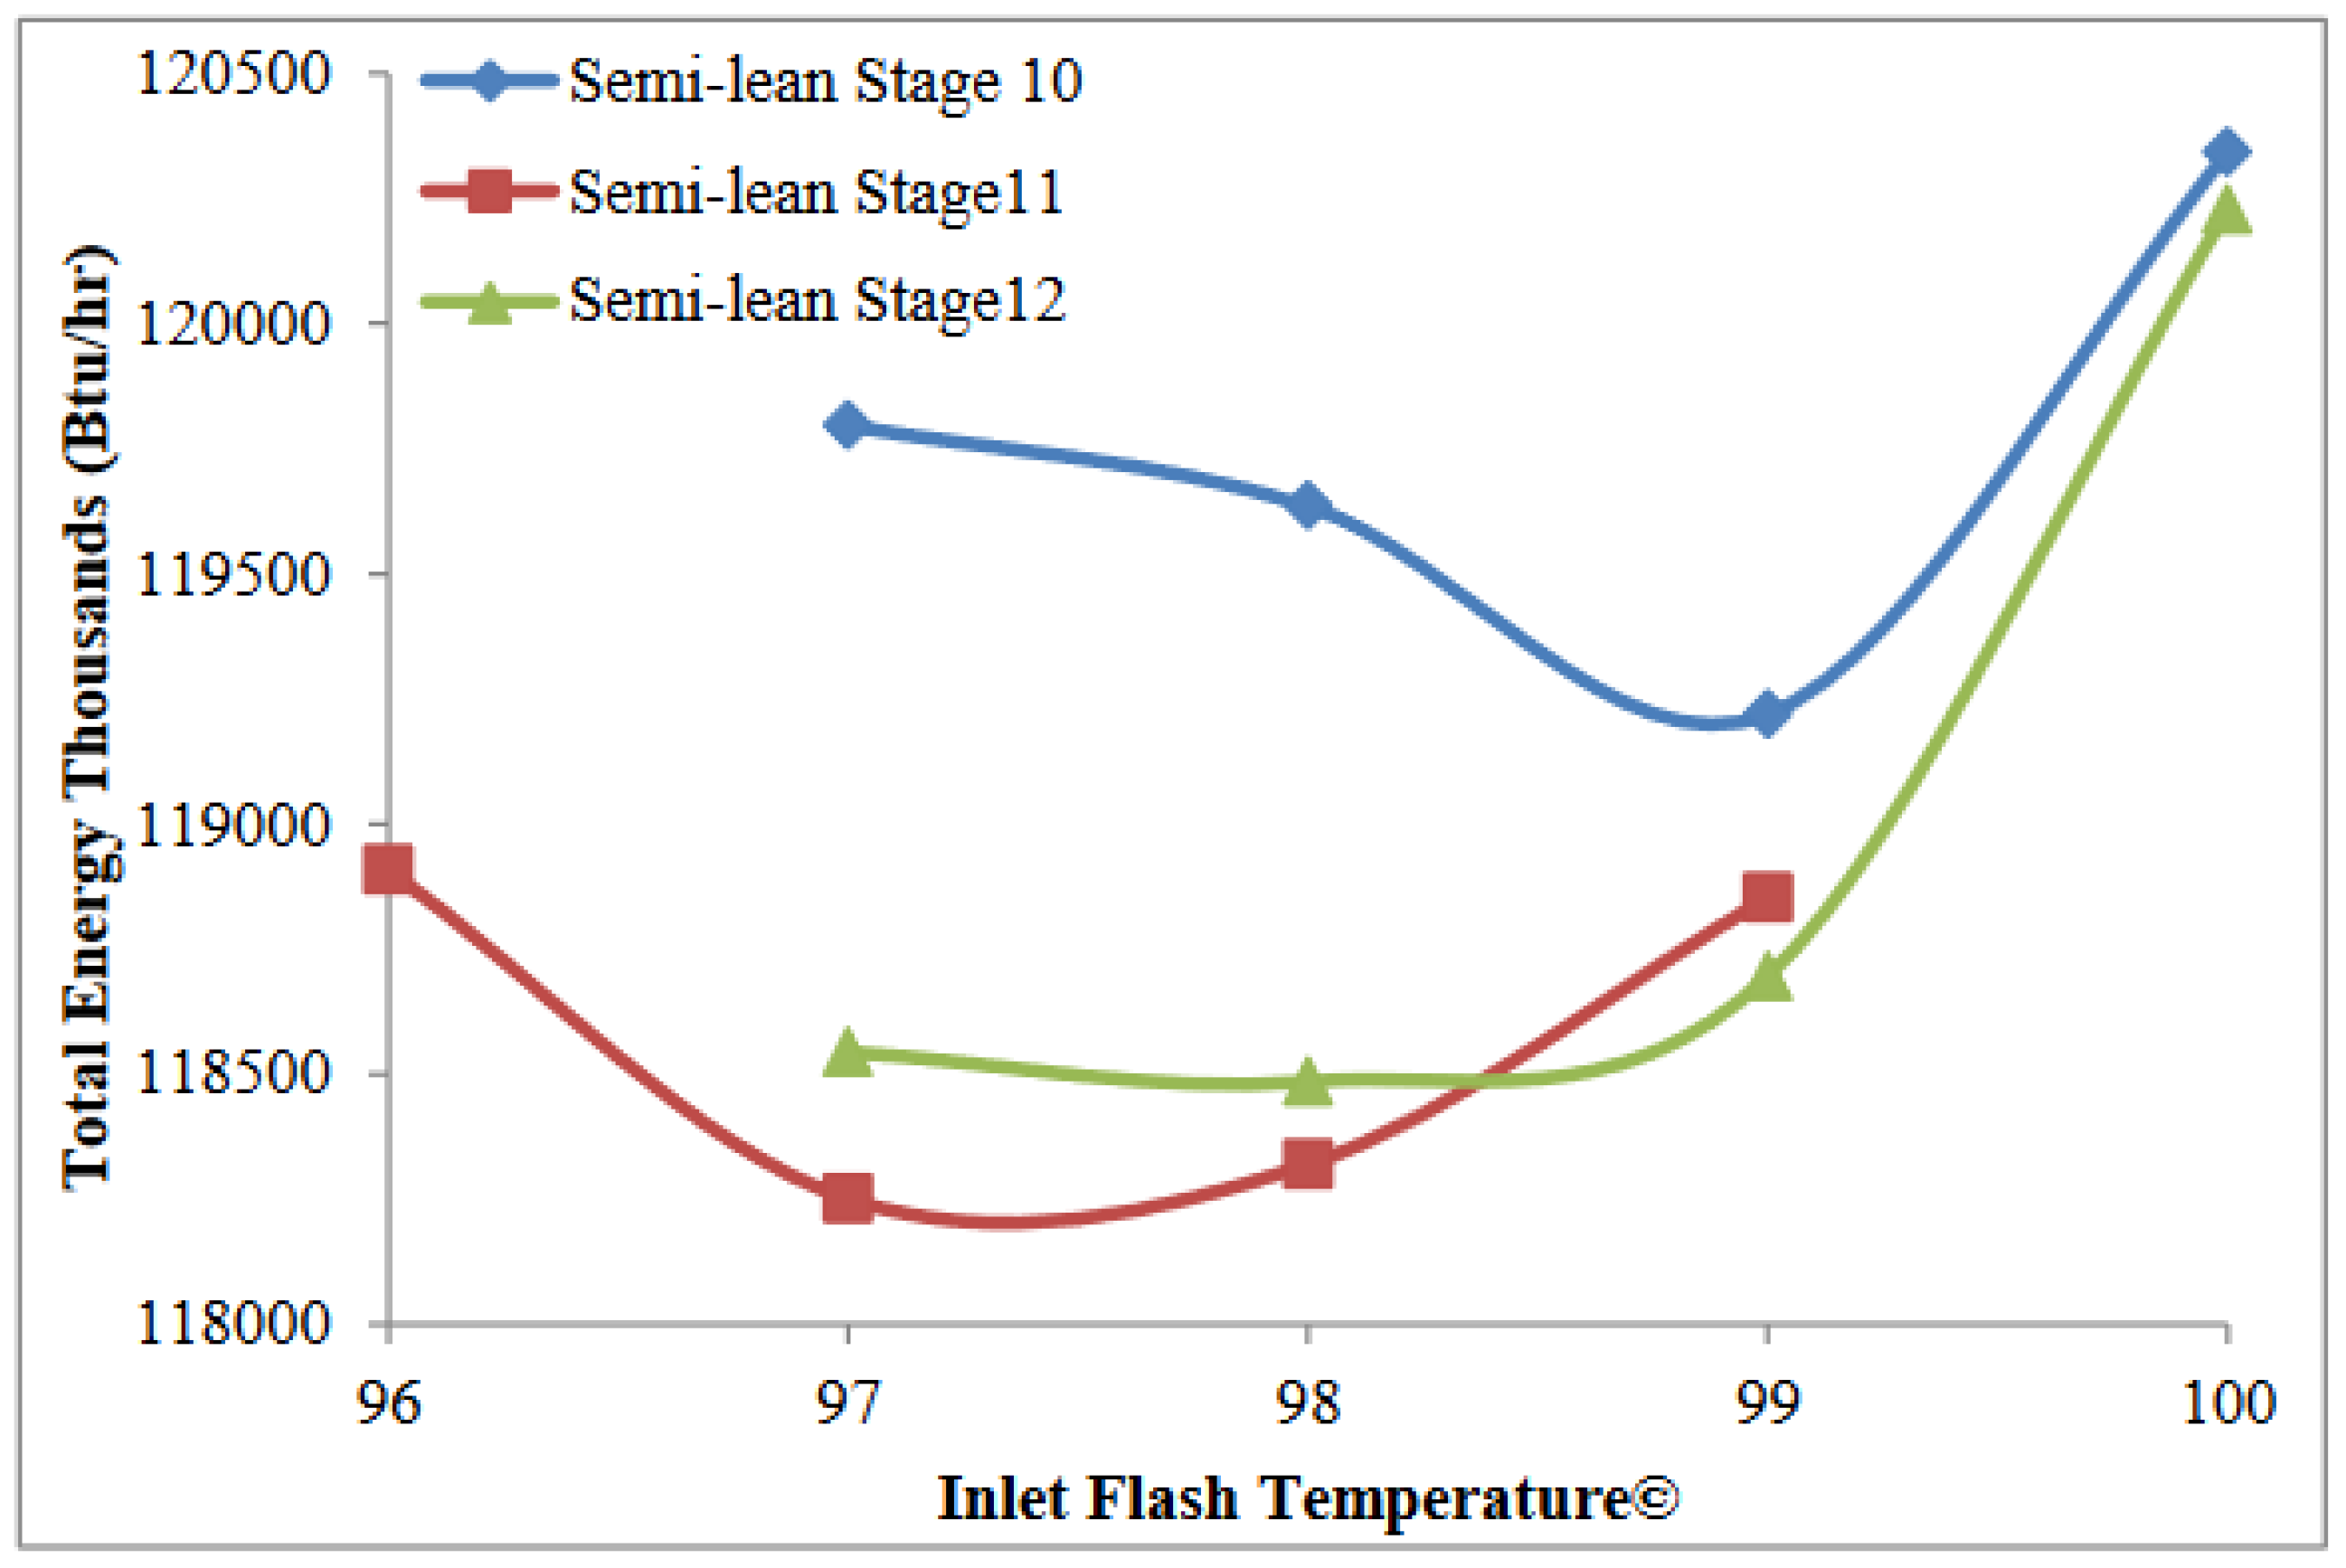
Figure 5.
a design is proposed for the split flow combined to flash unit in the context of gas purification workflow utilising MDEA as the base of the system.
Figure 5.
a design is proposed for the split flow combined to flash unit in the context of gas purification workflow utilising MDEA as the base of the system.
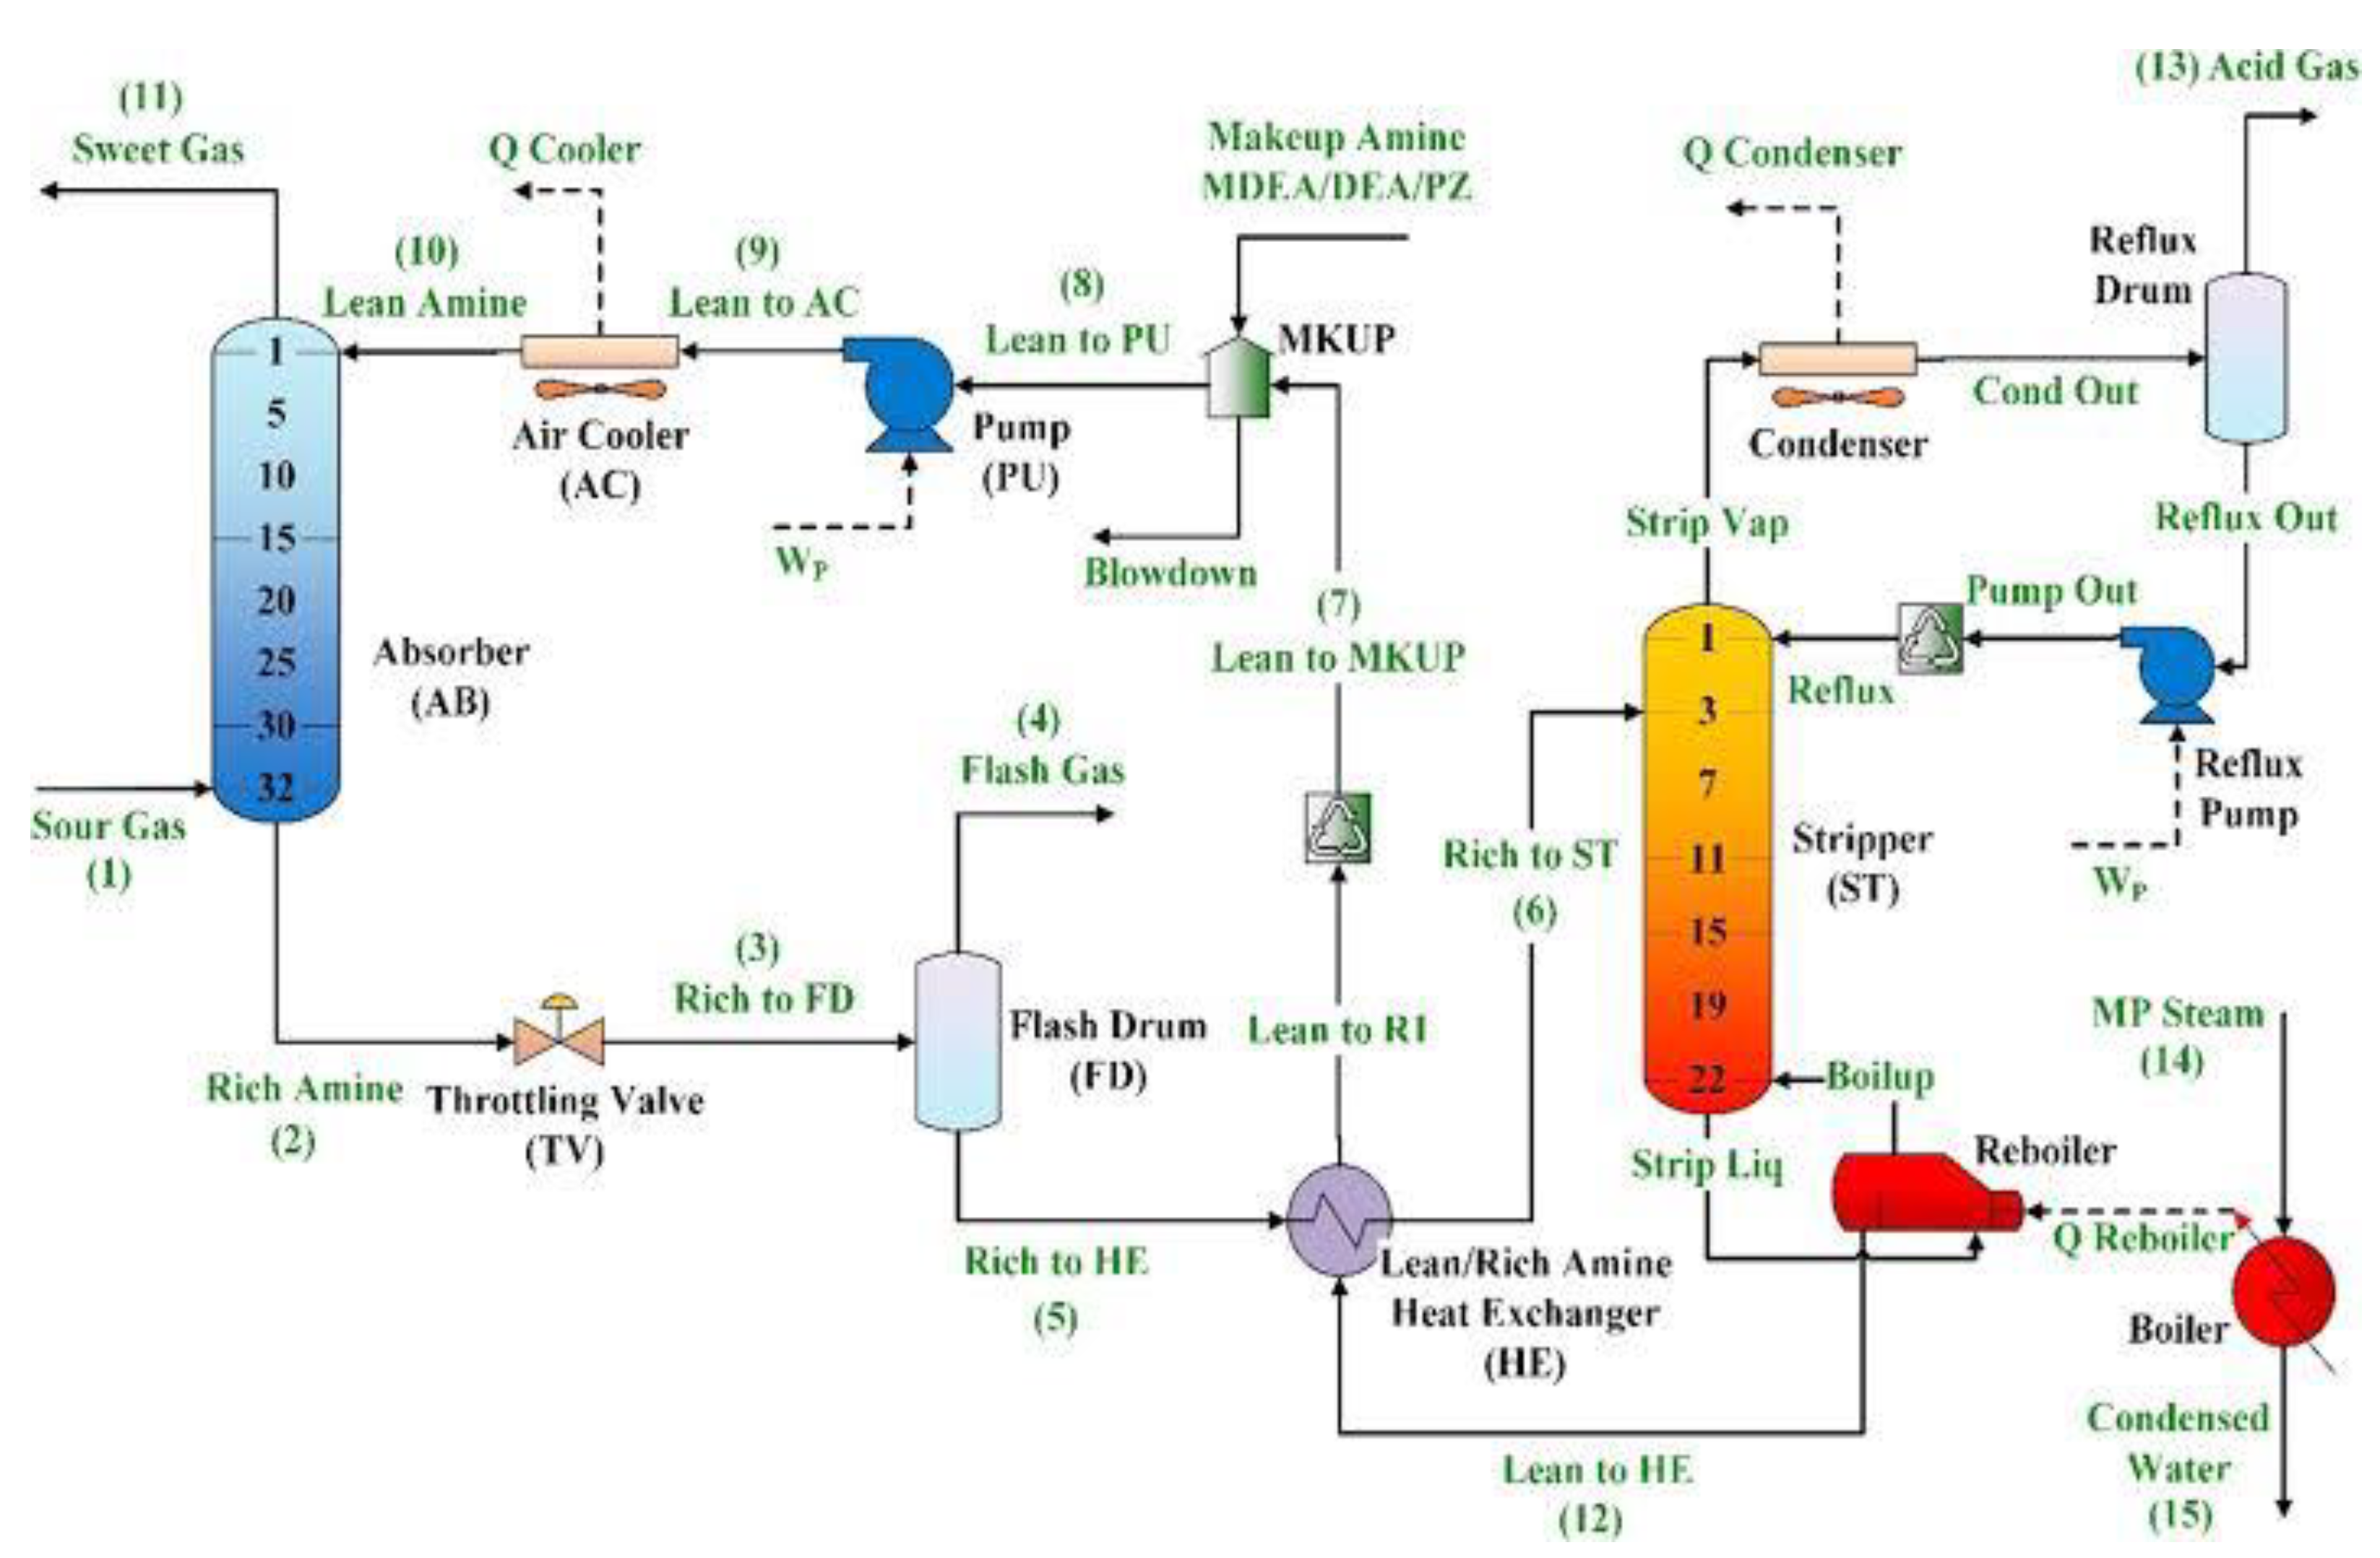
Figure 6.
Semi lean amine unit gas plant.
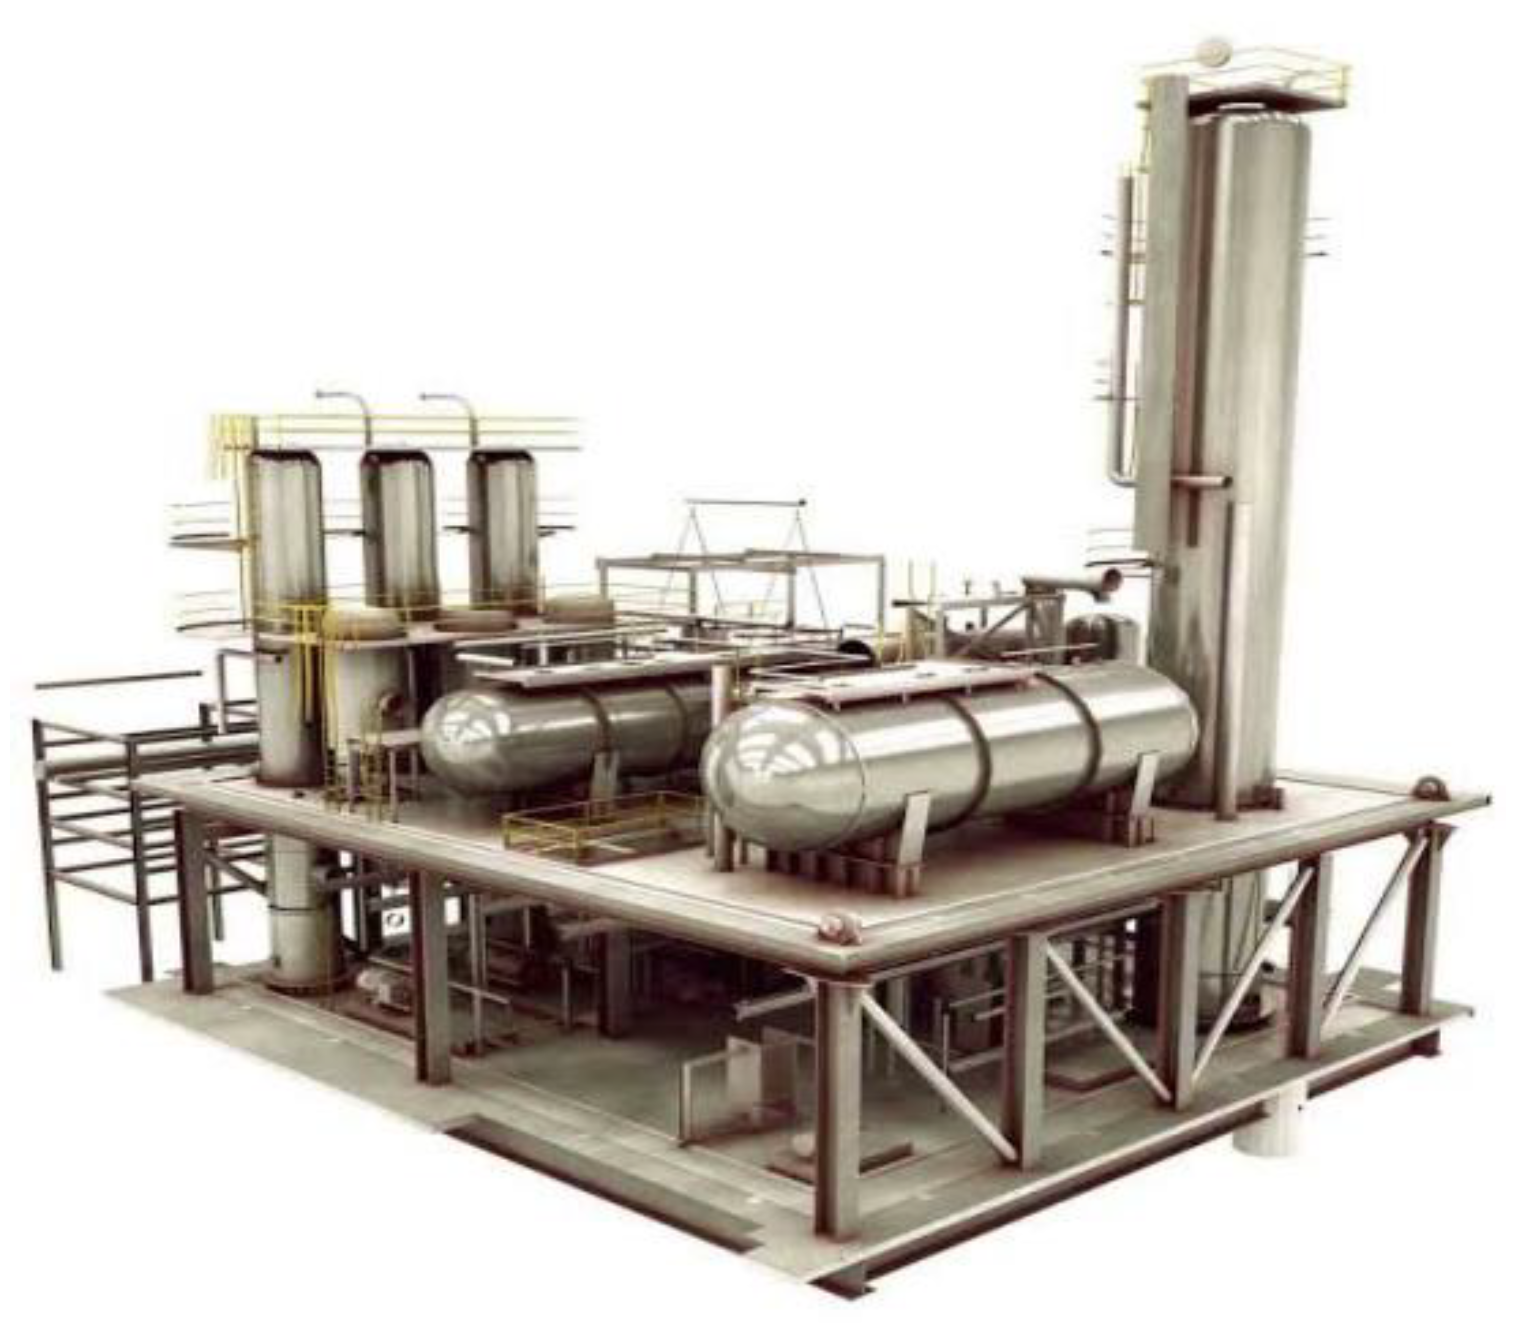
Figure 7.
Sour gas sweetening.
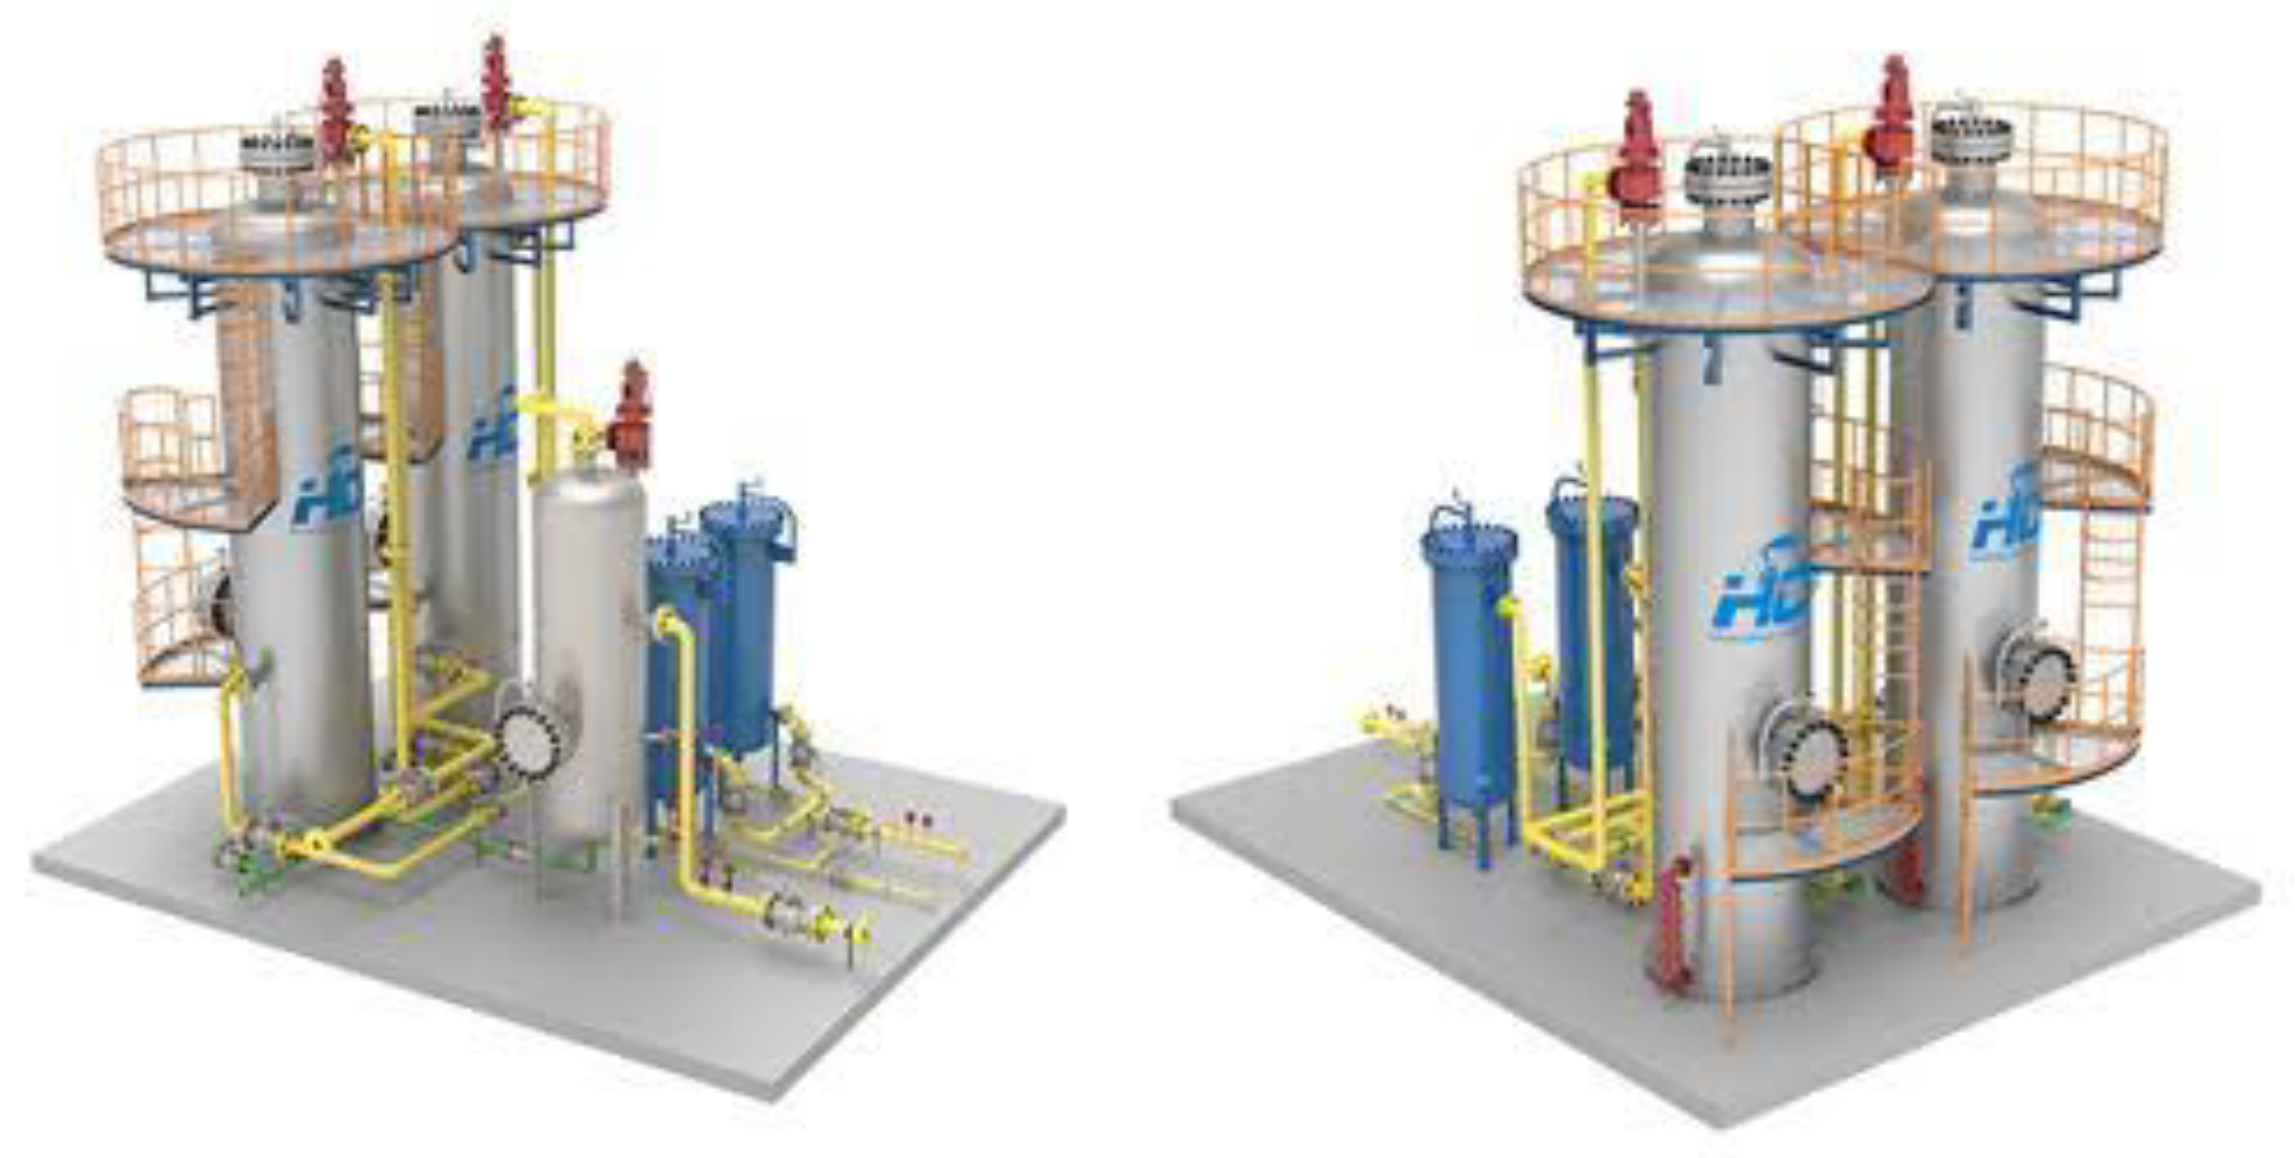
Figure 8.
Acid gas removal unit.
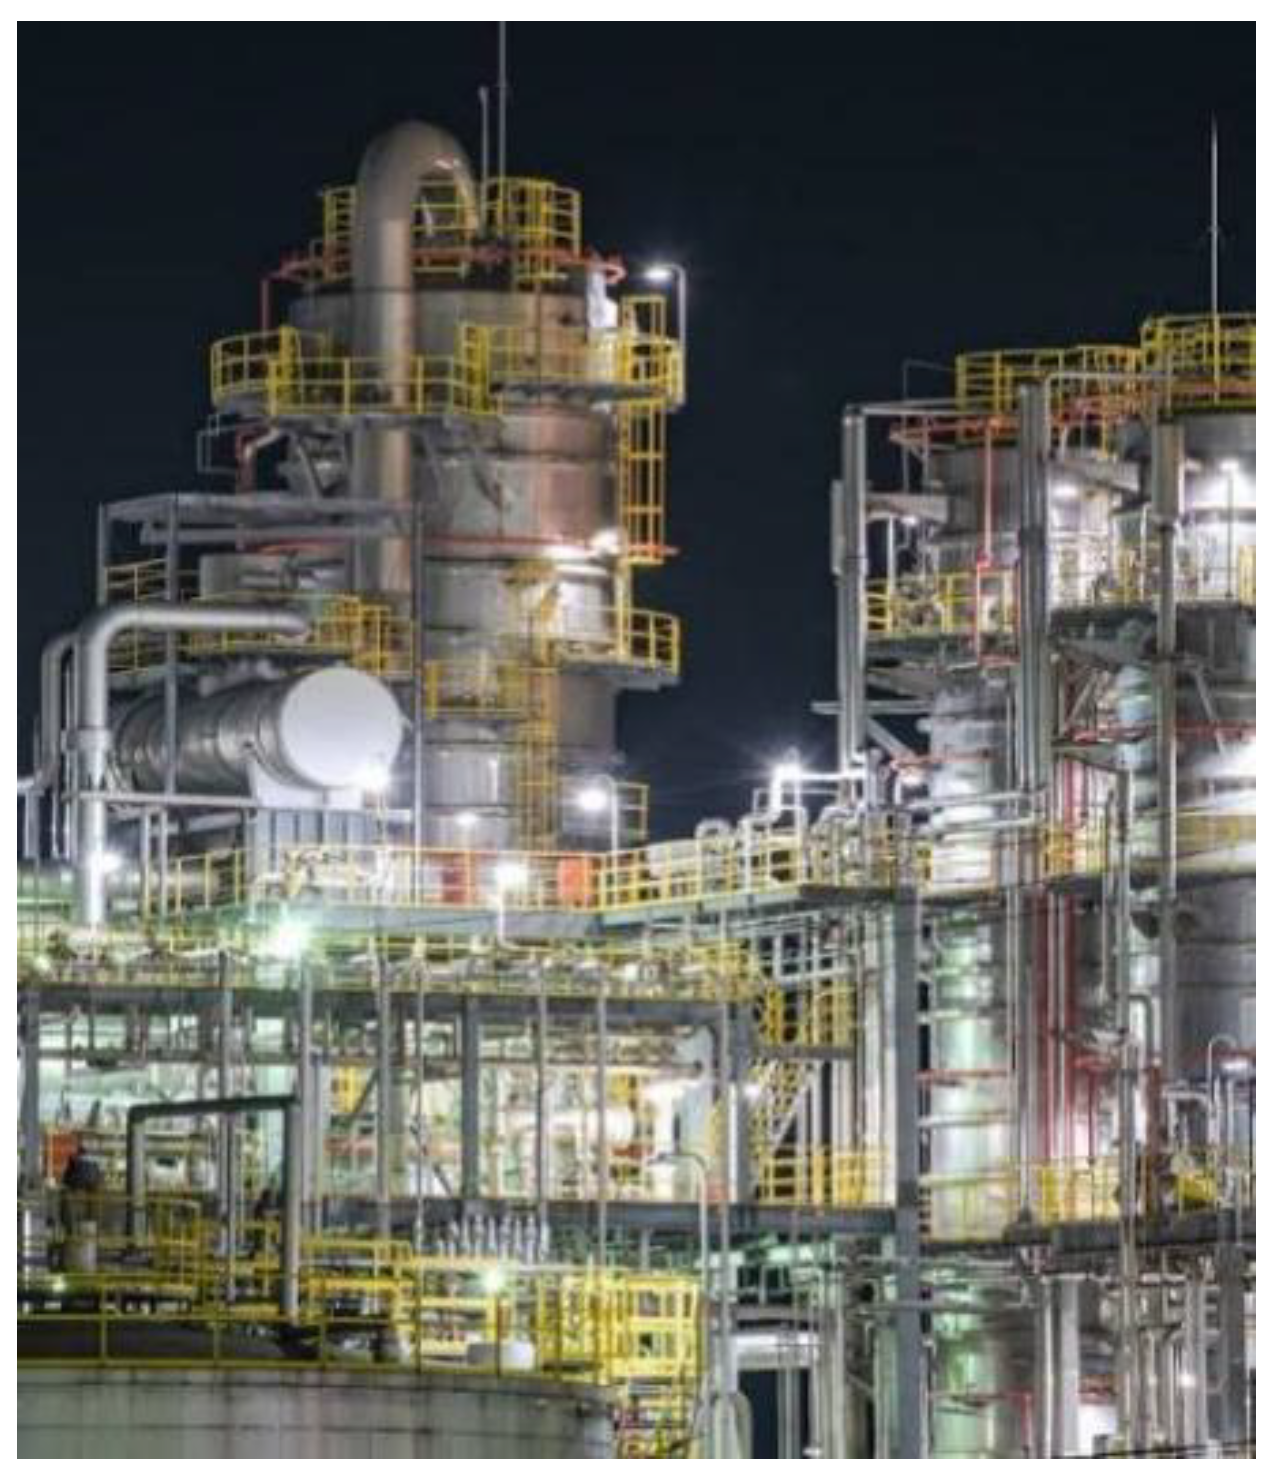
Figure 9.
Sulphur Recovery Unit.
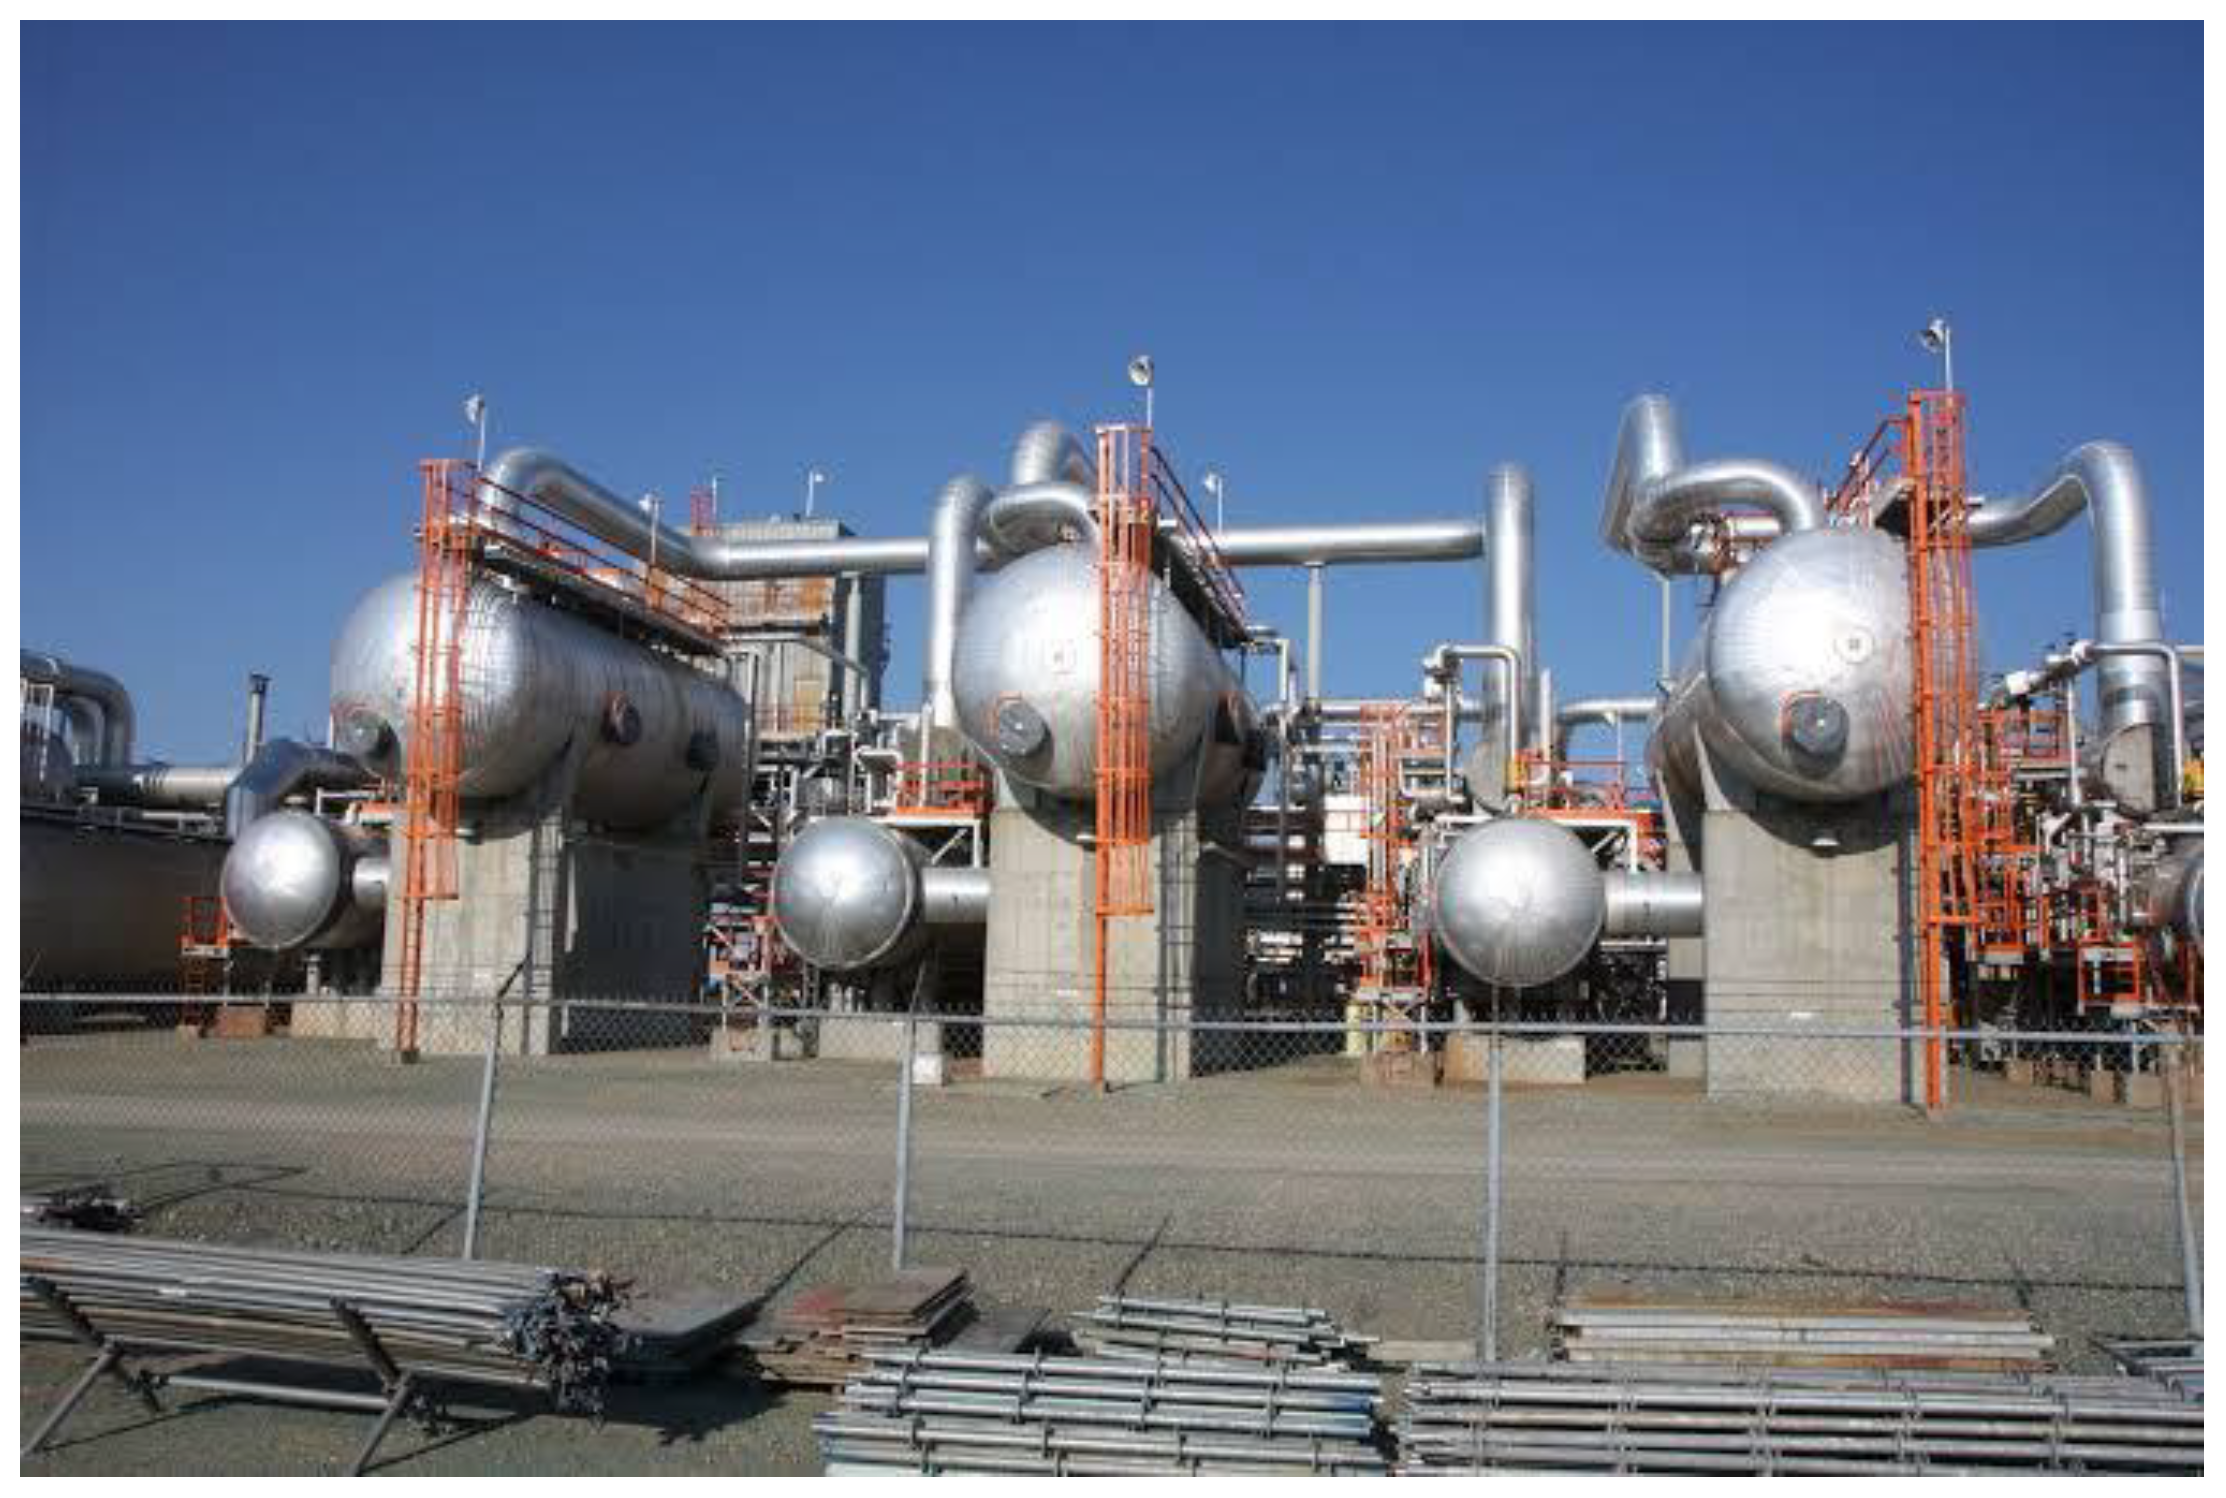
Figure 10.
Gas processing plant and process flow sheet.
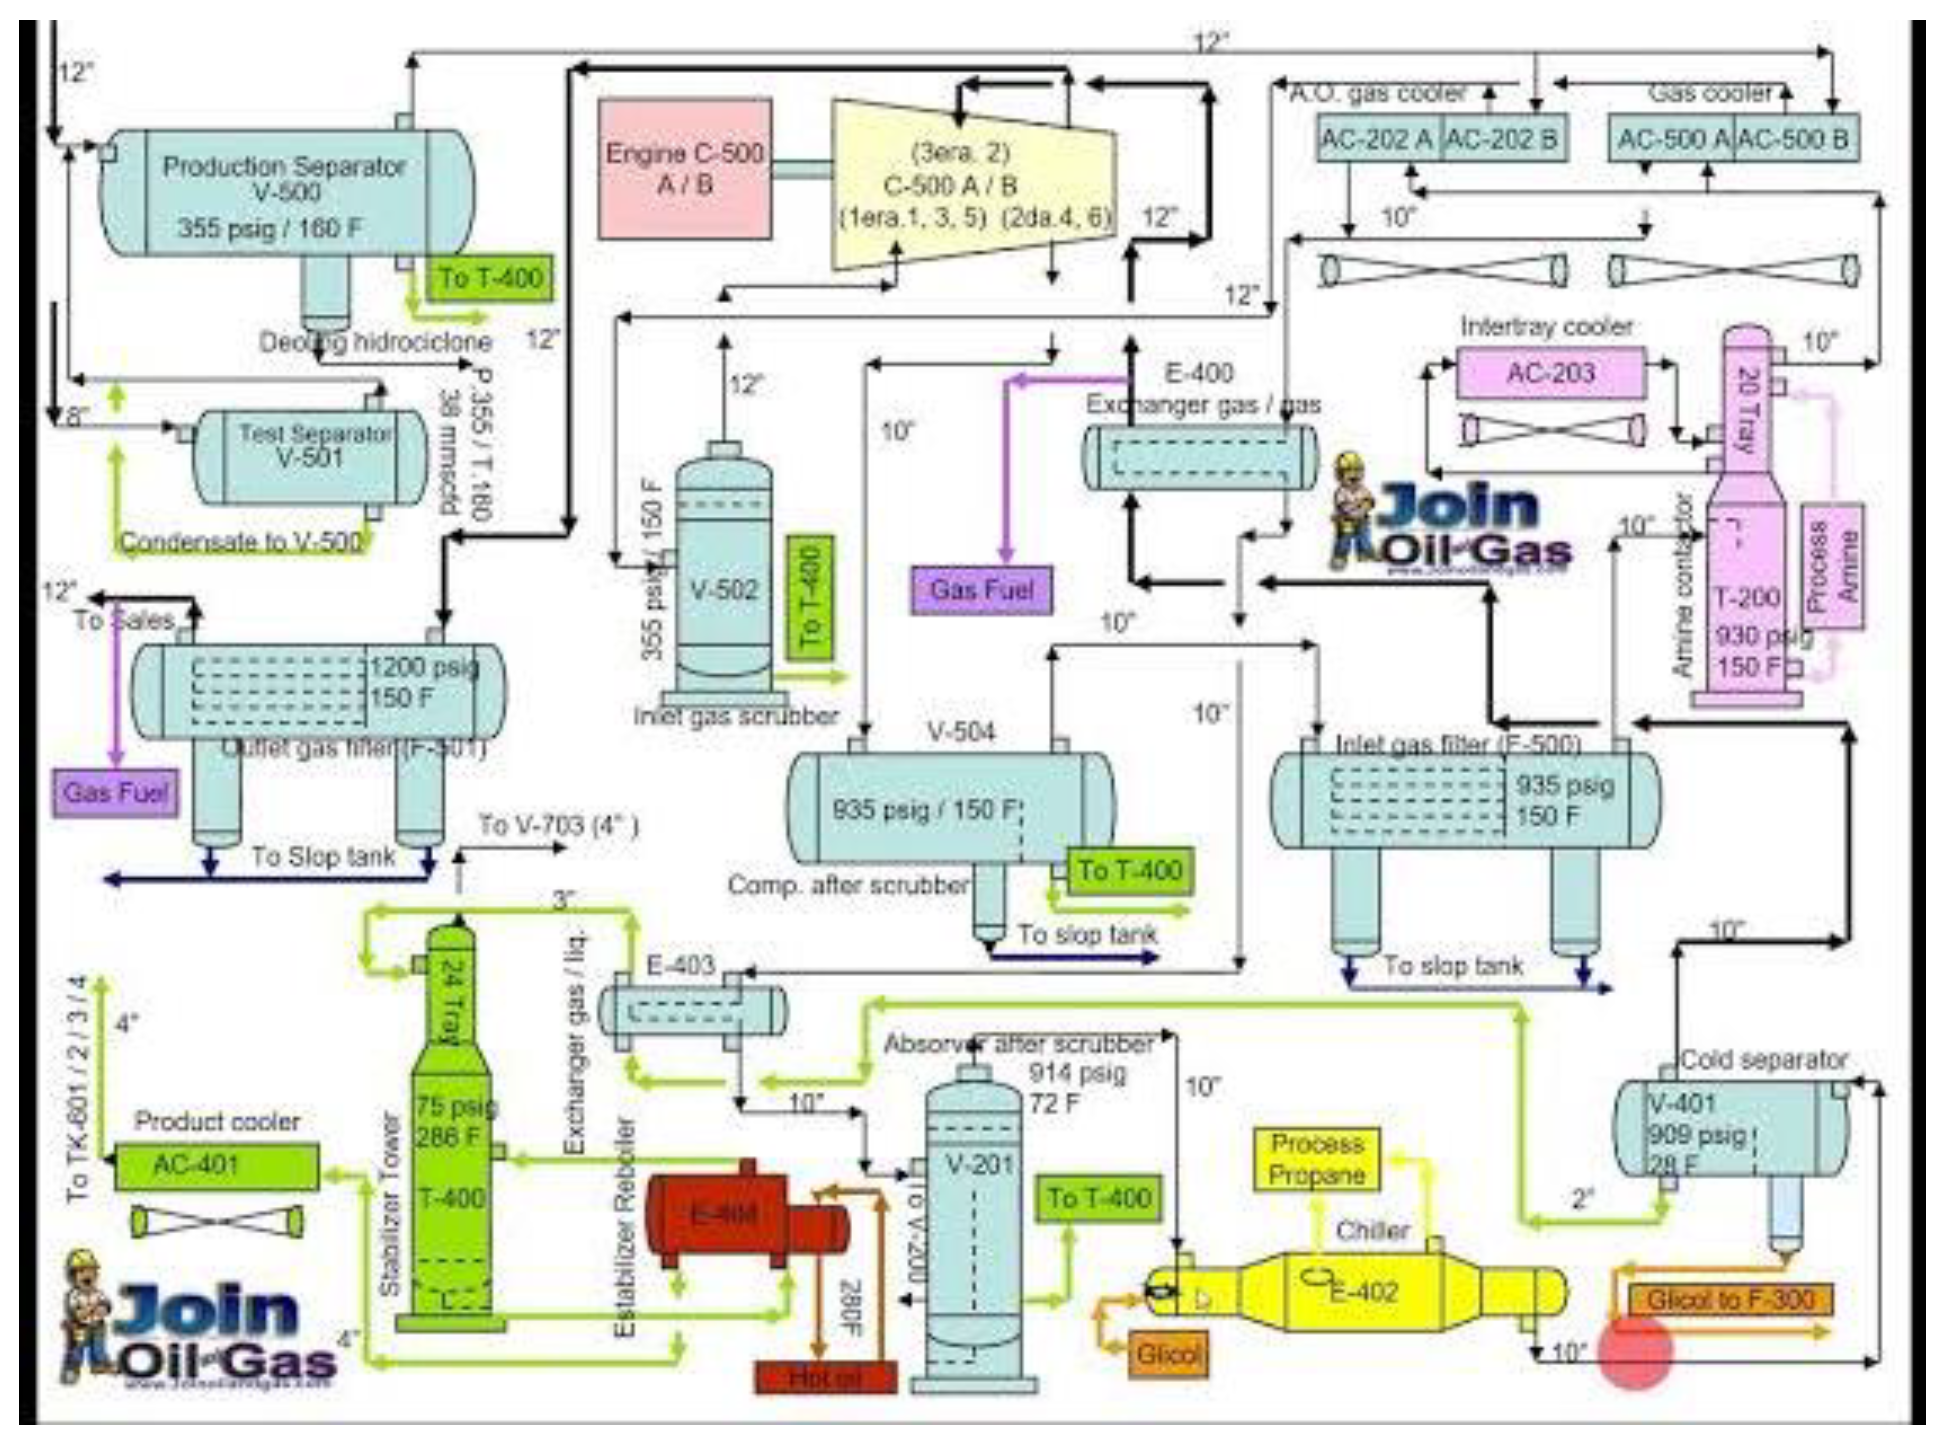

Table 1.
the column Specifications along with Operational Parameters.
| Absorption column | Desorption column. | ||
|---|---|---|---|
| Type of column | Packed | Type of column | Tray |
| Number of stage | 30 | Number of stage | 24 |
| H2S In gas feed ppm | 1950 | Condenser temp.oC. | 34 |
| Column pressure bar. | 55 | Column pressure bar | 1.5 |
| Gas feed Temp.oC. | 40 | Feed Temp.oC. | 94.60 |
| CO2 in gas feed,mol% | 1.84 | Feed stage location. | 3 |
| Amine flow rate. | 4715 | ||
| Inlet lean Amine temp.0C. | 35 | ||
| Amine conc.in absorbent,wt% | 50 | ||
| Feed gas flow rate,Kmole h. | 15960 | ||
Table 2.
Simulation result of Bonny NLNG Refinery unit using ELECNRTL and.
| ACIDGAS package. | |||
|---|---|---|---|
| ACID GAS | ELECNTRTL | PLANT. | |
| H2S in sweet gas,ppm | 5.02 | 4.12 | 4 |
| Acid gas loading | 0.427 | 0.394 | 0.428 |
| CO2 in sweet gas mol%. | 0.9934 | 1.5892 | 1.10757 |
| Lean Amine temp. | 21.81 | 21.68 | 212 |
| Reboiler Duty,Btu.hrs | 1.03e8 | 9.95e8 | 1.137e9 |
Table 3.
presents the impact of the number of side stream stages and their respective flow rates on the consumption of energy.
Table 3.
presents the impact of the number of side stream stages and their respective flow rates on the consumption of energy.
| Amine flow.(kmol/h) | Stream side rate(kmole/hr) | Sidestream stage | Loading(Rich) | Side stream of loading | The Total Energy.(Btu/hr) |
|---|---|---|---|---|---|
| 2830 | 2300 | 19 | 0.4261 | 0.02483 | 122407094 |
| 2627 | 2300 | 18 | 0.4454 | 0.02196 | 121831874 |
| 2777 | 2400 | 19 | 0.4335 | 0.02523 | 123676532 |
| 2560 | 2400 | 18 | 0.4514 | 0.02231 | 121769940 |
| 2762 | 3000 | 19 | 0.4271 | 0.02543 | 123790928 |
| 2650 | 2800 | 18 | 0.4481 | 0.02255 | 121484369 |
| 2600 | 2600 | 19 | 0.4228 | 0.02568 | 122000 |
| 2550 | 2600 | 18 | 0.4500 | 0.02285 | 121900 |
| 2500 | 2700 | 19 | 0.4215 | 0.02595 | 121800 |
| 2450 | 2700 | 18 | 0.4448 | 0.02307 | 121600 |
| 2400 | 2400 | 19 | 0.4290 | 0.02668 | 121500 |
| 2350 | 2200 | 18 | 0.4506 | 0.02369 | 121400 |
Table 4.
presents a comparative analysis of unit energy usage, specifically examining the impact of split-flow design on energy consumption.
Table 4.
presents a comparative analysis of unit energy usage, specifically examining the impact of split-flow design on energy consumption.
| Types of structure | Amine flow rate(kmole/hr) | The stream rate side (kmole/hr) | The duty Reboiler(Btu/hr) | The tital energy(Btu/hr) |
|---|---|---|---|---|
| The current configuratiion. | 4616 | - | 112744989 | 133415348 |
| Split-flow | 2622 | 2600 | 104574974 | 121584268 |
Table 5.
presents the impact of flash unit feed temperature and semi-lean feed stage on the amine circulation rate and the utilization of energy inside the absorption column.
Table 5.
presents the impact of flash unit feed temperature and semi-lean feed stage on the amine circulation rate and the utilization of energy inside the absorption column.
| Semi-lean feed stage. | Flash unit feed temp. | Amine flow(kmol/hr) | Rich loading | Reboiler duty.(btu/hr) | Total energy.(Btu/hr) |
| 10 | 98 | 2892 | 0.3592 | 100847678 | 119635106 |
| 10 | 99 | 2956 | 0.3528 | 100098253 | 119218708 |
| 10 | 100 | 3142 | 0.3396 | 100538336 | 120432903 |
| 11 | 96 | 2735 | 0.3768 | 100653151 | 118908196 |
| 11 | 97 | 2743 | 0.3738 | 99896896 | 118250324 |
| 11 | 98 | 2818 | 0.3628 | 99708836 | 118318888 |
| 12 | 97 | 2776 | 0.3663 | 10017463 | 118543610 |
| 12 | 98 | 2841 | 0.3583 | 99856210 | 118484552 |
| 12 | 99 | 2932 | 0.3498 | 99566283 | 118694581 |
Table 6.
Impact regarding energy consumption from combining flash unit design with split flow configuration.
Table 6.
Impact regarding energy consumption from combining flash unit design with split flow configuration.
| Type of structure | The flow Amine(kmol/hr) | The sidestream stage. | The sidestram rate | Reboiler duty(Btu/hr) | Total energy(Btu/hr) |
|---|---|---|---|---|---|
| The split flow | 2523 | 19 | 2600 | 103574497 | 121484368 |
| The flash unit splitflow. | 2744 | 19 | 2600 | 99897896 | 118250325 |
Disclaimer/Publisher’s Note: The statements, opinions and data contained in all publications are solely those of the individual author(s) and contributor(s) and not of MDPI and/or the editor(s). MDPI and/or the editor(s) disclaim responsibility for any injury to people or property resulting from any ideas, methods, instructions or products referred to in the content. |
© 2024 by the authors. Licensee MDPI, Basel, Switzerland. This article is an open access article distributed under the terms and conditions of the Creative Commons Attribution (CC BY) license (http://creativecommons.org/licenses/by/4.0/).
Copyright: This open access article is published under a Creative Commons CC BY 4.0 license, which permit the free download, distribution, and reuse, provided that the author and preprint are cited in any reuse.


