
Submitted:
24 January 2024
Posted:
25 January 2024
You are already at the latest version
Abstract
Disulfiram (DSF), an anti-alcoholism medicine, exerts treatment effects in patients suffering from persistent Borreliosis and also exhibits anti-cancer effects by its copper chelating derivatives. Since chronic/persistent borreliosis is characterized by increased amounts of proinflammatory macrophages, this study investigated opsonin-independent phagocytosis, migration and surface marker expression of in vivo activated human monocyte-derived macrophages and dendritic cells with and without DSF treatment. Phagocytosis of non-opsonized Dynabeads® M-450 and migration of macrophages and dendritic cells were monitored using live cell analyzer Juli™ Br for 24h by imaging every 3.5 min. Results were analyzed by a newly developed software based on the differential phase contrast images of cells before and after ingestion of Dynabeads bearing an electron dense iron core. As a control, phagocytosis was also monitored by visual counting of ingested beads. DSF decreased the phagocytic capacities exhibited by global macrophages and dendritic cells. DSF also impaired the migration of human monocyte-derived macrophages and dendritic cells (hMDMD) and significantly reduced the expression densities of surface antigens CD45 and CD14. In cells consisting of anti-inflammatory M2 macrophages, DSF led to a remarkable cell death and also increased oxidative stress as determined by MitoSox staining. Mitochondrial oxidative stress was a prominent feature in M2 macrophages which were more sensitive to DSF-induced cytotoxicity.
Keywords:
in vivo activated macrophages
; dendritic cells
; software to monitor phagocytosis and migration
; disulfiram
; mitochondria
; oxidative stress
1. Introduction
Macrophages and dendritic cells play a key role in sterile and infection associated inflammation. Pro-inflammatory cytokines induced by such macrophages and dendritic cells explain a number of clinical features in persistent infections such as borreliosis [1,2]. In addition to cytokine secretions, macrophages and dendritc cells are active in phagocytosis of infectious agents, migrate to sites of infection and are responsible for local and systemic pain [1]. Generally, M1 macrophages are primary effectors of infection and inflammation [3], secondly these M1 macrophages may polarize to anti-inflammatory M2 macrophages which counteract inflammation and improve tissue reconstitution [4]. This balance is severely impaired in conditions, when the pathogen is not appropriately eliminated from the body or when anti-inflammatory macrophages are overactivated in the presence of malignancies [1]. Surface antigen CD38 [5,6] is responsible for immune cells’ activation and is accepted as a typical M1 marker while CD163 is well known as a typical M2 marker [7].
Various drugs are in clinical use, which influence phagocytosis and migration [8,9]. Disulfiram (DSF) is, a well-established drug to treat alcoholism by inhibiting aldehyde dehydrogenase (ALDH) [10]. Since recently, DSF has been considered as an anti-cancer agent by blocking NF-kB pathway, increasing reactive oxygen species (ROS) formation and subsequent apoptosis in several types of human cancer [10]. In vitro studies showed that DSF derivatives chelate zinc and copper [11] to explain cytotoxicity of tumors as well as human macrophages and consecutively inhibit macrophage phagocytosis [12]. Particles phagocytosed by macrophages are generally categorized by being opsonized or non-opsonized [13]. The opsonized particles, such as IgG-coated and complement (iC3b fragment)-coated particles [14], are considered as conventional phagocytosis. In contrast, the non-opsonized particles directly phagocytosed by macrophages, such as the environmental dust, quartz, and silica engulfed by alveolar macrophages as well as uncoated latex beads [15,16,17] and Dynabeads® M-450 Epoxy employed in this study.
The behavior of a certain cell population during an experiment can be observed using time-lapse recordings, essentially taking individual images of a defined visual field during microscopy, every few minutes. The resulting video usually contains large amounts of data (movement, geometry, behavior of the cells). Although much of this information can be judged by the naked eyes, an automatized evaluation is highly desired. Human interaction can be time-consuming and is also more prone to errors caused for example by fatigue or biased classification of the cells [18]. Digital image processing is of major interest in medical research. A number of mathematical formulas and algorithms have been developed to quantify and evaluate cell appearance and behavior in different microscopic scenarios. Using these methods, for example, Matlab [19], cell movement and phagocytosis of different cell populations can be evaluated and quantified.
The current study used in-vivo activated and in-vitro cultured macrophages and dendritic cells derived from monocytes of patients with infections and malignancies to establish the use of a software which quantifies i) the kinetics of phagocytosis and ii) the migration behaviour exhibited by these cultures using 24 h videos. We here questioned the effect of DSF on phagocytosis of cultured macrophages and dendritic cells for non-opsonized particles based on the established software as well as the potential mechanisms.
2. Materials and methods
2.1. Reagents
Disulfiram was purchased from Tocris (UK). Disulfiram 50 nM was dissolved in DMSO with a final DMSO concentration 0.01%. Dynabeads® M-450 Epoxy was purchased from Invitrogen (USA).
2.2. Cell preparation
Human monocytes were enriched by plastic adherence and subsequent in vitro culture. The patients blood samples were submitted for immune phenotypic analysis and suffered from different diseases (n=1 Borreliosis, n=1 chronic fatigue syndrome, n=1 motor neuron disease, n=1 pancreatic cancer, n=1 major depressive disorder, n=1 post coronavirus vaccination, n=3 coronavirus disease, and n=3 glioblastoma °IV before surgery, approved by the Ethics Committee of Ulm University U111-1179-3127, NCT02751138, 150/16, 82/07, 255/21, 98/2019, 400/2020). In detail, heparinized peripheral blood mononuclear cells (PBMCs) were separated using Ficoll gradient (Biocoll, www.biochrom.de) centrifugation. Six x105 cells/mL PBMCs were seeded into plastic T25 tissue culture flasks with Iscove’s Modified Dulbecco’s Medium (IMDM, www. bioscience.lonza.com) supplemented with 10% fetal calf serum (FCS, www.biochrom.com), and antibiotics (8 μg/ml gentamycin (www.merkgroup.com) and 10 μg/ml BM cyclin (www.sigmaaldrich.com) at 37 °C in a humidified atmosphere containing 5% CO2 over night. Nonadherent cells were removed by washing twice with IMDM medium and adherent cells (monocytes and dendritic cells) were cultured in IMDM medium for further experiments. After 21-28 days of culture, the adherent fraction of the cell culture (hMDMD), was subjected to phenotyping in order to distinguish monocyte-derived macrophages from dendritic cells The hMDMD cultures were then treated with 50 nmol.L-1 of disulfiram (DSF) (www.tocris.com) or DMSO as vehicle control (0.01% v/v final concentration) for 24 h at 37 °C in 5% CO2.
2.3. Macrophage images based on Phase-contrast microscopy
Morphological characteristics of the hMDMD were monitored by phase-contrast microscopy using a Nikon eclipse TS2 microscope and 20x-40x phase contrast objective (nikon.com). Images were taken using NIS Elements Vs. 4.6 software (nikon.com).
2.4. Cytospin preparation and Wright-Giemsa stain
Adherent hMDMD were detached by incubating the adherent cell layer in PBS (Phosphate-Buffered Saline) with 0.002% of EDTA at room temperature, washed with PBS (containing 0.5% FCS, and resuspended at a final concentration of 5x10⁵ cell/ml. Glass microscope slides were labeled, placed under the cardboard filter, and assembled with the sample chambers into appropriate slots in the balanced cytospin centrifuge (Shandon.com). A cell suspension of 100-200μl was pipetted into each sample chamber and spun at 300g for 5 min. Slides with flatted and dispersed cells were dried overnight and saubsequently stained by Wright’s Giemsa staining using the Hemocolor® solutions 1-3. Images were taken with a 60x objective.
2.5. Monitoring phagocytosis by video microscopy
The hMDMD in T-25 culture flasks were counted by phase contrast microscopy using NIS Elements Vs. 4.6 software (nikon.com), then treated with either disulfiram (DSF) of 50 nmol.L-1 or DMSO as vehicle control (0.01% v/v final concentration), and an equivalent of 20 Dynabeads® M-450 Epoxy were added per macrophage. Immediately after adding the Dynabeads, T-25 flasks were continuously observed by video microscopy using a Juli™ Br (Live cell analyzer, vwr.com) incubator microscope equipped with a 4x objective. A time-lapse sequence was recorded with a frame rate of one image per 3.5 minutes for 24 h at 37 °C in a humidified atmosphere.
For cell movement analysis, a multiple-object tracking method implemented in MatLab (The MathWorks, Natick, USA, www. mathworks.com) was used to track the Dynabead conglomerates forming inside the cells. A review and, if necessary, correction of the tracks was performed by a human operator. Centroids of the detected conglomerates were used as an approximation for the position of the corresponding cell.
For phagocytosis analysis in the time-lapse videos of Dynabeads experiments, a custom pattern recognition and classification method was implemented in MatLab. The algorithm detects conglomerates of beads and uses image analysis tools to determine (i) the quantity of beads in the conglomerate and (ii) if the conglomerate is ingested in a cell or not.
2.6. Metabolic characterization cultured macrophages and dendritic cells activated in vivo.
The supernatant of cell culture was collected from in-vitro cultured dendritic cells and macrophages before and after treatment with 50 nmol.L-1 disulfiram (DSF), or DMSO as vehicle control (0.01% v/v final concentration) for 24 h. Cell debris from the supernatant was removed by centrifugation before measurement. Levels of glucose and lactate were detected automatically by ABL8000 FLEX blood gas analyzer (www.radiometer.de) according to the manufacturer’s protocol.
2.7. Flow cytometry
For surface phenotypic markers assessment, macrophages were stained with fluorophore-labeled extracellular antibodies IgG1 (bioclone.com), IgG2a (bioclone.com) CD45 (bdbiosciences.com), CD14 (bdbiosciences.com), CD163 (miltenyibiotec.com), CD38 (bdbiosciences.com), HLA-DR (clone L243, biolegend.com) for 30 min protected from light on ice, washed with PBS (thermofisher.com) containing 0.25% FCS (biochrom.com) and 0.1% sodium azide (lab.honeywell.com) and measured by flow cytometry. For the analysis of mitochondrial mass we used MitotrackerTM (thermofisher.com) and for mitochondrial ROS analysis we used MitosoxTM (sigmaaldrich.com). Macrophages were detached from culture flasks, washed with prewarmed HBSS (thermofisher.com), and incubated with 500nM MitotrackerTM or 5 μM MitoSOXTM in HBSS at 37°C and 5% CO2 for 20 min. Then cells were washed with pre-warmed HBSS and immediately analyzed by flow cytometry. For the measurement of a late apoptosis/necrosis process, macrophages were collected and incubated with propidium iodide (sigmaaldrich.com) (0.1 mg/ml) for 5 min at room temperature for 5 min and then analyzed by flow cytometry. At least 5x10³ cell events were collected for measurement by flow cytometry. The forward scatter (FSC) and the side scatter (SSC) parameters were used to reflect cell cize and cell complexity respectively. Emission of antibody-labeled phycoerythrin (PE) and fluorescein isothiocyanate (FITC) were detected at 525 nm and 575 nm, respectively. Measurement was performed using FACSCalibur™ device (bdbiosciences.com). Analysis was implemented using CellQuest™ software vs. 5 (bdbiosciences.com). Mean fluorescence intensities were calculated as: [%positive gated for marker] * [axis mean of positive gated quadrants for marker] - [%positive gated for isotype of marker antibody] * [axis mean of positive gated quadrants for isotype of marker antibody].
2.8. Statistics
All data analysis and graphical representation were performed using GraphPadPrism vs. 9.1.1 (www.graphpad.com). Unpaired two-tailed t-test was used for comparing data between two groups within the same time point. The difference was considered to be significant for p < 0.05.
3. Results
3.1. Quantification of functional phenotypes expressed by cultured macrophages
3.1.1. Phagocytosis
Cultured macrophages were subjected to live video microscopy using the Juli™ Br device. For quantification of phagocytosis and visually improved detection, Dynabeads® M-450 Epoxy were added to the hMDMD cultures at a concentration ratio of 1 macrophage to 15-20 DynaBeads. Following bead incubation, the phagocytosing macrophages were studied according to their efficacy to take up Dynabeads and their movement during cell culture. The algorithm applied for phagocytosis activity operates as follows: First, all conglomerated DynaBeads were counted in an image using brightness (cells) and contrast values (for DynaBeads) were combined with thresholds in size; Second, classification of any given detection into free and ingested conglomerates was performed and color coded (Figure 1). For the distinction of Dynabead conglomerates and ingested Dynabeads by active macrophages, the following parameters were taken into account: (i) Size of the conglomerate; (ii). Position of the conglomerate using a mask which was generated from the movement analysis data to estimate the cell positions. Conglomerates coincident with the position of a cell were classified as ingested; iii) Image contrast of adjacent pixels (cell borders show stronger contrasts than empty spaces, a conglomerate with low contrast in its surrounding is likely a free Dynal Bead); (iv) Counting of beads in all detected free conglomerates (and sorting out artifacts) was achieved as follows: (i) Creation of a size-brightness diagram for all detections; (ii). Hotspots of the diagram corresponding to conglomerates of one, two, three, etc. Dynabeads, respectively; (iii). Outliers with large sizes but similar brightness corresponded to larger conglomerates in which ingested bead numbers could be estimated by phase contrast density and cell size. Summing up all cell-free beads and conglomerate numbers, the program returns the number of free beads in every image. Assuming the experiment started without any ingested beads, subtracting this number from a bead count of the first image of the experiment yielded the total number of ingested beads. Resulting numbers were post-processed with smoothing filters to reduce noise and to allow normalization by the number of beads and cells in the defined visual field of the entire video.
3.1.2. Cell movement analysis for migration distance velocity
For cell movement analysis, three types of migration paths were identified from data based on the method ‘multiple-object tracking’ implemented in our software for every cultured macrophage: (i) the (raw) path as a sequence of the cell’s centroids between frames, (ii) a smoothed path of the cell using a robust linear regression (20 frames window), omitting stationary oscillations of the cell and reducing the influence of noisy centroid detections and (iii) the effective path of the cell between start and end of its path, i.e. its endpoint minus its starting point, named Euclidian distance [20] travelled by an individual macrophage (Figure 2). Mean cell velocities for the three path options were derived from all cells in a given visual frame. High velocities as exemplified in Figure 2a represent strong oscillations, while high velocities in Figure 2b correspond to a defined direction of cell. The velocity derived from path analysis in Figure 2c implies chemotactic effects, which is related to the final Euclidian distance.
3.2. Identification of macrophage phenotypes
Before investigating the potential mechanism of opsonin-independent phagocytosis regulated by DSF, we first identified the phenotypes of cultured macrophages derived from individual diagnosis. The expression of phenotypic markers was determined using flow cytometry. Table 1 exhibits the speculated phenotype of all engaged macrophages with their donors of diagnosis, age, as well as gender. In all CD45-expressing cell cultures, phenotype with negative expression of CD14 as well as other phenotypic markers was defined a dendritic cell (DC in which cells with negative or low expression of the other phenotypic markers was designated as immature dendritic cells (iDC) [21] and those with positive expression of Kv1.3 were defined as mature dendritic cells (mDC) [22]. Dendritic cells with coexpression of CD163 and CD141 accompanied by the positive expression of CD14 was designated as DC-10 [23]. Phenotype only with positive expression of CD38 was defined as M1. Macrophages only with high expression of CD163 were defined as M2c. Macrophages with the combination of CD163 and CD206 expression were defined as M2a. Macrophages with co-expression of CD38 and CD163 were designated as M1+M2.
3.3. Modulation of macrophage and dendritic cell function and viability by DSF
3.3.1. Correlation of reduced phagocytosis and cell death induced by DSF
Using the here developed software and algorithm (Figure 1), we observed a significant difference between phagocytosis of non-opsonized Dynabeads® M-450 Epoxy in untreated and DSF-treated hMDMD. As shown in Figure 3, the cell densities of DSF-treated hMDMD from a GBM patient #20315 with a classical CD14neg. dendritic cell (DC) phenotype (CD45+/CD14-) was remarkably lower when compared to the untreated hMDMD. In parallel, the number of ingested beads (green) was remarkably lower in DSF-treated hMDMD when compared to the non-treated cells. The observation shown in Figure 3 was confirmed by the analysis of 4 other hMDMD isolates (1 from another GBM patient #20331 with cDC phenotype, 1 from a patient of chronic borreliosis #20725 with an M2a phenotype, 1 from a major depressive disorder patient #21161 with cDC phenotype, and 1 from a patient suffering from a post-Coranoa virus vaccination disease (post-VAC syndrome) #21164 with an M2a phenotype) (Figure 4). The results of these experiments further showed that the macrophages with highest phagocytic activity were affected most by DSF treatment (Figure 5).
Based on the algorithm presented in 3.1.1 (Figure 1), the kinetic analysis of phagocytosis of DSF-treated hMDM from #20231-Xanthogranuloma and #20315-GBM was performed. Likewise, Euclidian distance (according to Figure 2c) [20], and migration speed of hMDMD from #20231 and #20315 were analyzed using the ‘multiple-object tracking’ method described and presented in 3.1.2 (Figure 2b). As shown in Figure 6A, untreated hMDMD revealed a rapid capacity for taking up Dynabeads® M-450 Epoxy in the first 3.5 min, and gradually attenuated their activity for the rest of the observation time of 24 h. Both hMDMD cultures (#20231 cDC), and #20315 iDC) behaved similarly. DSF-treated hMDM from #20231 were not affected by DSF treatment (Figure 6B), but phagocytosis of hMDMD from #20315 was fully inhibited during the first hour of observation and effector cells continued with a slower bead uptake for the rest of the observation time (Figure 6A). Their capacity for bead uptake increased slowly but did not reach a plateau similar to the trajectory of untreated hMDMD during the entire process. Likely, the mean of migration speed of DSF-treated hMDMD from #20315 was generally lower when compared to untreated hMDMD (Figure 6C). However, the mean of migration speed of DSF-treated hMDMD from #20231 even increased after DSF treatment (Figure 6D). The mean of Euclidian distance of DSF-treated hMDMD was also remarkably lower as compared to the untreated hMDMD although the untreated hMDMD showed a higher heterogeneity when analyzed for individual cells in hMDMD from #20315 (Figure 6E). By contrast, the mean of Euclidian distance of DSF-treated hMDMD from #20231 did not change significantly when compared to the untreated cells. These results indicated a heterogeneous alteration of phagocytosis and cell migration speed by dendritic cells with different subtypes modulated by DSF. Therefore, we further investigated the mechanism of DSF in the modulation of phagocytosis in different subytpes of macrophages and dendritic cells.
3.3.2. Correlation of DSF-induced mitochondrial ROS and cell death
We then questioned whether DSF treatment and changes in phagocytic capacity were due to DSF induced cell death, changes of mitochondrial membrane potential and/or mitochondrial oxgen radical formation . We used three reagents to assess the cytotoxicity of DSF on hMDMD: 1). Mitotracker® Red, a probe detecting live mitochondria mass and membrane potential; 2). MitoSOX® Red, the mitochondrial superoxide indicator; and 3). Propidium iodide (PI), a necrotic cell detector. As shown in Figure 8A, mitochondrial mass of cultured hMDMD with M1 and M2a were selectively decreased by DSF. By contrast, mitosox staining was significantly upregulated in cultured hMDMD from all phenotypes identified in different patients. Especially 2 COVID-19 patients with a significant number of M2a macrophages (#20705 and #20373)increased mitochondrial ROS, whereas two cultures with cDC (#21161 and #21163) exhibited a decrease of ROS levels by DSF treatment (Figure 8B). Meanwhlie, PI staining shows that 3 macrophage cultures with M2a phenotype (#20373, #21164, and #20705) experienced significant cell death (Figure 8C). M1 (#20643) and M2c (#21162) displayed a slight increase of cell death whereas cultures with iDC (#20650) and cDC (#21161 and #21163) did not show a decreased tendency to cell death upon DSF treatment (Figure 8C). In this case, DSF-induced cell death appeared to correlate with mitochondrial ROS formation, preferentially in M2a polarized cells. M2a hMDMD relying on mitochondrial oxidative phosphorylation were more susceptible to the cytotoxic effect of DSF.
Additionally, we asked whether the reduction of the mitotracker staining was due to the release or extrusion of mitochondria from DSF-treated macrophages. As shown in the representative population of untreated hMDMD gated in Supplementary Figure 1, exosomes contained mitochondrial mass which likely originated from cultured macrophages. As shown in Supplementary Figure 2, the amount of isolated mitochondria in DFS treated macrophages was not different from non-treated hMDMD. Likewise, exosomes also contained a small qauntity of ROS generated by mitochondria, particularly in hMDMD with M2 phenotypes derived from the same 2 COVID-19 patients #20373 and #20705. However, DSF played a heterogeneous role in the regulation of mitochondrial ROS levels in exosomes population. These results suggest that the exosomes’ fraction detected by flow cytometry contained mitochondria but the effect of DSF on mitochondrial function of hMDMD was apparently independent from mitochondrial fragments in these exosomes.
3.3.3. Correlation between glycolytic metabolism and macrophages phenotype regulated by DSF
Since macrophage polarization and activities are specifically determined by their metabolic processes, we eveluated the glycolytic level of cell cultures. Glucose, the fuel consumed in glycolysis and lactate, the inevitable end product of glycolysis were assessed. As shown in Figure 9, the level of glucose consumption was approximately proportional to that of lactate generation in each cell culture. However, one macrophage culture with M2 (M2a and M2c) and cDC unexpectedly showed the highest consumption of glucose and production of lactate when compared with M1 and iDC phenotypes. Accordingly, the cultured macrophage phenotypes were not strictedly reflected by the levels of indicative metabolism involved in phenotypic macrophages, which might be impacted by the in vivo activated immune response, e.g., the micromillieu of COVID-19.
Further we calssified macrophages into two groups with low and high levels of glycolysis respectively by the cut-off of lactate production 7.6 mmol/L. As for the lactate production shown in Figure 10B, DSF potentially enhanced the level of glycolysis in macrophages with either low and high level of glycolysis but the difference was not statistically significant. In particular, the lactate production of a macrophage culture with M1 phenotype and low glycolysis derived from post COVID-19 was significantly increased by DSF treatment (Figure 10B, a white dot from 7.6 to 9.1 mmol/L).
3.3.4. Modulation of surface antigens expression by DSF
To explore the propensity of disulfiram to induce macrophage polarization, we evaluated the effect of disulfiram on a number of surface antigens and whether this is correlated with inhibition on phagocytosis by DSF in two cell populations from macrophages and dendritic cells classified by glycolytic levels. We first assessed the expression of leukocyte common antigen CD45 and macrophage representative marker CD14 which reflected the physiological function of macrophages and dendritic cells. As shown in Figure 11A,B, cells with higher glycolysis selectively showed relatively low expression of CD45 and CD14 as compared to those macrophage population with lower glycolytic activity. Nevertheless, DSF markedly decreased the expression of these two markers in global populations of macrophages and dendritic cells. Likely, macrophages with higher glycolysis manifested with lower expression of CD38 and CD163 despite of one cell culture derived from a patient with glioblastoma IV (Figure 11C,D green symbol). The expression of human leukocyte antigen (HLA-DR) was not altered by DSF (Figure 11E).
4. Discussion
This study evaluated the effect by DSF, an inhibitor of ALDH on functional, phenotypic and morphological charcteristics of human monocyte-derived macrophages and dendritic cells (hMDMD) from patients with different diseases. Macrophage- and dendritic cells associated phagocytosis and migration were tested by video-microscopy. DSF generally resulted in reduced phagocytosis and migration of both: velocity and migration path, determined as Euclidian distance. These results correspond to findings linked to the blockacde of SOCS3, a transcription factor [20]. The reduced capacity for phagocytosis was most pronounced by the effect on macrophages with high phagocytic activity suggesting a significant effect on the cytoskeleton and velocity of particle uptake since macrophages ingesting more than 10 beads/cell move significantly faster to reach Dynabeads for phagocytosis. Phagocytosis is a highly energy consuming process [24] and therefore, the reduced phagocytosis mediated by DSF was linked to lower amounts of mitochondria as well as increased mitochondrial stress. Increased oxidative stress by DSF has been prviolusly decribed in the context of DSF serving as an anti-neoplastic agent [10].
Phagocytosis is a specialized characteristic of macrophages within the complex network of cellular immunity. Since known for a long time, phagocytosis requires membrane rearrangement and is physiologically mediated by the specific receptors [14]. To explore the effect of disulfiram on macrophage phagocytosis migration path and velocity, we here used the newly established method to analyze the kinetics of phagocytosis and chemotaxis for non-opsonized particles. We found that disulfiram exhibited inhibition of general macrophages phagocytosis but the correlation with its cytotoxicity to mitochondria was more evidently found in M2a, M2c and iDC cultures. Migration velocities and migration paths were also influenced which may indicate alterations of the cytoskeleton which could correlate with a reduced expression densitiy of several surface antigens. But this effect was not restricted to M2a, M2c and iDC phagocytes.
In this study, we applied non-opsonized Dynabeads® M-450 Epoxy to monitor and quantify ingestion by phagocytes. Consecutively, rapid ingestion of Dynabeads® M-450 Epoxy by the majority of cultured human monocyte-derived macrophages can be observed. Since the hydrophobic residues of Dynabeads® M-450 Epoxy can bind to amino residues of proteins, they develop a high affinity for the cell membrane components such as cholesterol and phospholipids in the culture medium at neutral pH [25]. On the other hand, Gu and colleagues found that the inhibitory effect of serum on non-opsonized particles uptake was determined by the negatively charged serum glycoproteins [26], which constitute the main proportion of serum nutrients derived from bovine sources [27].
In our observation, disulfiram alone displayed a notable toxicity on human monocyte-derived macrophages. Using Mitotracker® Red as a probe, we found that DSF selectively impaired mitochondrial mass and membrane potential of in vitro cultured macrophages and dendritic cells. Mitotracker® Red is a cell-permeable dye which binds to thiol-reactive chloromethyl groups in mitochondial membrane. This fluorescent dye reflects mitochondrial mass and iots metabolic activity level in live cells. High fluorescent intensity of Mitotracker® Red manifests a large amount of vital cellular mitochondrion based on mitochondrial membrane potential [28]. Concomitantly, disulfiram increased the oxidative stress of macrophages especially in M2 as detected by MitoSOX® Red. This probe is a mitochondrial superoxide indicator reflecting the level of cellular oxidative stress caused by reative oxygen spycies (ROS), which are generated by mitochondria and also play an essential role in cell damage [29]. As one of the regulators in phagocytosis, intracellular ROS produced by macrophages themselves relies on NADPH-Oxidase activity (NOX2). Increased ROS level is involved in the phagocytic process [30]. In this study, the increased mitochondrial ROS of hMDMD corresponded to an impaired phagocytic capacity. This could be a reflection of the impairment on mitochondrial function for the physiological balance. The cytoxocicity of disulfiram was also reflected by the decrease of a number of surface antigens including leukocyte common pathogen CD45 which regulates the cell proliferation, migration, and immune recognition [31,32]. Energy delpletion may also play a role in intracellular trafficking [33], therefore we studied the modulation of surface expressed antigens after DSF treatment and also found significant reduction of CD14 expression. However, the surface expression of HLA-DR detected by the L243 antibody which detects HLA-DR including the MHC I-chain bound HLA-class II molecules [34] was not negatively affected by DSF. These results indicate that trafficking of membrane proteins may underly different molecular mechanisms [35]. The insensitivity of HLA-DR to DSF is of high relevance due to its importance in immune regulation [36].
Since recently, the effect by DSF has been attributed to its metabolic compounds arising from cytochrome p450 2E1 metabolism [37], the polymorphic properties of Cyp450 2E1 may easily explain variations of DSF efficacy but these may be equally due to the macrophage subtype providing different amounts of mitochondria such as in M1 (with low mitochondrial contents) and M2 (with high mitochondrial contents and preserved oxidative phosphorylation) [38]. In general, M1 Macrophages rely on glycolysis for ATP generation [39] which entiltle M1 to be less dependent on mitochondrial activities. By contrast, M2 macrophages should display high levels of mitochondrial oxidative phosphorylation [40]. Since M2 macrophages perform oxidative phosphorylation [40], the toxicity related to ROS in mitochondria is more significant but not exclusive in the M2 subtypes identified in the current study. Therefore, it could be explained that disulfiram-treated M2 in this study experienced more significant oxidative stress and cell death as compared to M1 macrophages. However in the current study, glycolysis was not observed as a specific feature of M1 phenotype. In contrast, it was found more strongly performed in macrophages of M2 and dendritic cells when compared with M1 (Figure 9). These results might be in accordant with the evidence that glycolysis could be inhibited by the preventive machinery from glucose depletion; on the other hand, glycolysis could be essential for M2 activation [41].
In addition, disulfiram has been identified as a potent PLpro inhibitor and MPro inhibitor of SARS-COV2 [42,43,44]. Further, disulfiram has been described to exhibit antiviral activity in cell culture targeting nsp13,m nsp14 of SARS-CoV2, and inhibiting pyroptosis by gasdermin D inhibition [45,46]. These observations support the current analysis focusing on macrophage function and could be the potential evidence to explain the higher sensitivity of cultured macrophages derived from COVID-19 patients in response to disulfiram induced effects (Figures 8B,C and 10B). Besides, disulfiram has also been used as an antimicrobial to treat Lyme borreliosis for decades. It alleviated the pathogenicity of Lyme borreliosis by inhibiting the growth of B. burgdorferi (Bb), reducing the pro-inflammatory cytokines, e.g. TNF, IL-1β, IFNγ, the levels of Bb-specific immunoglobulins, e.g. IgM and IgG as well as the ratio of activated leukocytes, e.g. CD19+ B cells, whereas it increased CD3+CD4+, naïve, effector and memory T cells for bacteria elimination [47]. Disulfiram was also identified to inhibit B. burgdorferi growth by its high affinity for metal ions zinc and manganese which are necessary for the spirochaetes’ metabolism [48]. Likewise, disulfiram combined with zinc enhanced the toxicity of zinc on macrophage phagocytosis [12], because diethyldithiocarbamate (DDTC), a unique metabolite of disulfiram, played a crucial role to chelate metal ions, e.g. copper and zinc, as well as metal-containing enzymes which are indispensable in cell activities (Lanz et al. 2023).
Monocytes, macrophages and dendritic cells share many features including some phenotypic markers [49]. In vivo, monocytes originate from hematopoietic stem cells (HSCs) and differentiate into tissue-resident macrophages or dendritic cells (DCs) when they encounter danger and pathogen-derived signals in the circulation [50]. The in vitro differentiation of monocytes should mimic the model for the in-vivo process by monocytes’ maturation. Having this concept in mind, we cultured the plastic-adherent fraction of antigen presenting cells from blood samples in-vitro, without a selective differentiation stimulus. Our aim was to investigate the closest phenotype of the monocytes from blood donors of patients. For characterization of monocyte-derived macrophages we here applied flow cytometry and selectively included markers defining classical CD14- dendritic cell (DC) [51], M1, and M2 specific antigen expression [52,53], and subclassified dendritic cells due to a low expression densitiy of CD14, its complete absence and the co-expressionof CD141, CD209 and CD206, CD163. Preactivation states were defined as either fully activated and matured macrophage subtypes, M1, and M2. The expression of CD163 and CD38 was found to disntinguish M1 vs. M2 polarized macrophage cultures best. CD38 expression densities are related to immune activation and was recognized to distinguish M1 form the other phenotypes [54]. In the present study, the expression of CD38 displayed a drastic decrease during the in vitro monocyte differentiation. CD38 is a special enzyme responsible for the conversion of NAD to cyclic ADP-ribose (cADPR) and the activation of the Ca+ signaling, which plays a crucial role in inflammatory pathways [55]. The CD38 antigen, provides signal induction for T- and B- lymphocyte activation [56]. In our data set of blood-derived leukocyte phenotypes, CD38 was consistently expressed by monocytes from both healthy donor and patients. Upon in vitro culture, CD38 was found to be strikingly decreased to a quiescent level, suggesting the enzymatic activity of CD38 might be sensitive to the environment where the cells were exposed. However, higher fluorescence intensity of CD38 in monocytes in vivo also corresponded to an M1 phenotype in cultured macrophages (Suppl. Table 1), indicating that CD38 is indeed a reliable M1 marker for investigation. In contrast, CD163 level of some macrophage cultures experienced an increase or decrease during in vitro culture. The scavenger receptor CD163 expression is restricted to the monocyte/macrophage lineage [57]. Increased CD163 expression defines the anti-inflammatory phase in which immune cells may counterregulate inflammation [58]. As such, a higher level of CD163 in dendritic cell cultures of glioblastoma patients, may reflect an inflammatory property. More markers need to be tested to subclassify dendritic cells related to a tumor environment [2].
Limitations of In this study could be decribed as following: automated video microscopy analysis was classified into automated cell movement analysis in addition to automated phagocytosis analysis. For cells on their own, the images provided by the live cell analyzer Juli™ Br lack the necessary phase contrast and detail to implement a reliable detection and tracking algorithm. As a workaround, detection and tracking was performed on conglomerates of dynal beads, which in most cases coincide with phagocyting cells. Erroneous detections (e.g. free conglomerates) were excluded by a series of filters and results were verified by a human operator in a later step. Apart from detecting noise, this procedure facilitates a reliable movement analysis for phagocyting cells, however, non-phagocyting cells were not analyzed with this approach and require a setup with better optics. The smoothing of the cell path (Figure 2b) is necessary to eliminate the noise caused e.g. by small oscillations of the cell. The mathematical parameters and type of this smoothing were determined heuristically. While these smoothed paths yielded a more realistic image of the cells’ migration, the heuristic approach makes it difficult to directly compare migration velocities to different research work simply by the ‘multiple-object tracking’ method. For the limitations of automated phagocytosis analysis, in order to determine if a specific cell conglomerate has been ingested by a cell or not, the automated algorithm tries to look for indications of a present cell around the conglomerate. As mentioned above, cell contrast in the live cell analyzer Juli™ Br images is scarce. In order to enhance detection accuracy, the algorithm was also provided data from the cell movement analyses to aid cell detection. After the analysis, a human operator evaluated the results for probability and adjusted detection parameters, if necessary. A smoothing filter further reduced the influence of erroneous detections. While the live cell analyzer Juli™ Br guarantees comparable conditions during multiple experiments, the amount of cells and Dynal Beads in every experiment varies, introducing statistical dependencies. To try account for this in the phagocytosis analyses, the amount of beads ingested was normalized to the amount of cells and/or the amount of Dynal Beads present in the respective experiment. To better discriminate the effects of DSF on the viability of activated macrophages and dendritic cells, another set of experiments will be necessary including activation of these cultures with pattern recognition receptors such as Toll-like ligands and pathogens, especially those involved in borreliosis.
Author Contributions
Conceptualization and methodology, C.L. and M.S.; formal analysis, C.L.; investigation, C.L. and M.S.; writing—original draft preparation, C.L.; software and analysis, J.S.; writing—reviewing and editing, C.L. and M.S. All authors have read and agreed to the published version of the manuscript.
Funding
This research was funded by European Union’s Horizon 2020 research and innovation program VirA (grant agreement no. 952376, www.vira-twinning.eu), and by the Faberstiftung Stuttgart, Germany.
Acknowledgments
We thank Dr. Christian Scheiber for helpful discussion. We also would like to thank Jule Lehmann for technical support.
References
- Hein, T.M.; Sander, P.; Giryes, A.; Reinhardt, J.O.; Hoegel, J.; Schneider, E.M. Cytokine Expression Patterns and Single Nucleotide Polymorphisms (SNPs) in Patients with Chronic Borreliosis. Antibiotics (Basel) 2019, 8. [Google Scholar] [CrossRef]
- Del Prete, A.; Salvi, V.; Soriani, A.; Laffranchi, M.; Sozio, F.; Bosisio, D.; Sozzani, S. Dendritic cell subsets in cancer immunity and tumor antigen sensing. Cell Mol Immunol 2023, 20, 432–447. [Google Scholar] [CrossRef]
- Malyshev, I.; Malyshev, Y. Current Concept and Update of the Macrophage Plasticity Concept: Intracellular Mechanisms of Reprogramming and M3 Macrophage “Switch” Phenotype. Biomed Res Int 2015, 2015, 341308. [Google Scholar]
- Sica, A.; Mantovani, A. Macrophage plasticity and polarization: in vivo veritas. J Clin Invest 2012, 122, 787–95. [Google Scholar] [CrossRef]
- Jablonski, K.A.; Amici, S.A.; Webb, L.M.; Jde, D.R.-R.; Popovich, P.G.; Partida-Sanchez, S.; Guerau-de-Arellano, M. Novel Markers to Delineate Murine M1 and M2 Macrophages. PLoS One 2015, 10, e0145342. [Google Scholar] [CrossRef]
- Dwivedi, S.; Rendón-Huerta, E.P.; Ortiz-Navarrete, V.; Montaño, L.F. CD38 and Regulation of the Immune Response Cells in Cancer. J Oncol 2021, 2021, 6630295. [Google Scholar] [CrossRef]
- Hu, J.M.; Liu, K.; Liu, J.H.; Jiang, X.L.; Wang, X.L.; Chen, Y.Z.; Li, S.G.; Zou, H.; Pang, L.J.; Liu, C.X.; Cui, X.B.; Yang, L.; Zhao, J.; Shen, X.H.; Jiang, J.F.; Liang, W.H.; Yuan, X.L.; Li, F. CD163 as a marker of M2 macrophage, contribute to predicte aggressiveness and prognosis of Kazakh esophageal squamous cell carcinoma. Oncotarget 2017, 8, 21526–21538. [Google Scholar] [CrossRef]
- Silva, A.L.; Peres, C.; Conniot, J.; Matos, A.I.; Moura, L.; Carreira, B.; Sainz, V.; Scomparin, A.; Satchi-Fainaro, R.; Préat, V.; Florindo, H.F. Nanoparticle impact on innate immune cell pattern-recognition receptors and inflammasomes activation. Semin Immunol 2017, 34, 3–24. [Google Scholar] [CrossRef] [PubMed]
- Ehrchen, J.M.; Roth, J.; Barczyk-Kahlert, K. More Than Suppression: Glucocorticoid Action on Monocytes and Macrophages. Front Immunol 2019, 10, 2028. [Google Scholar] [CrossRef] [PubMed]
- Lu, C.; Li, X.; Ren, Y.; Zhang, X. Disulfiram: a novel repurposed drug for cancer therapy. Cancer Chemother Pharmacol 2021, 87, 159–172. [Google Scholar] [CrossRef] [PubMed]
- Najlah, M.; Suliman, A.S.; Tolaymat, I.; Kurusamy, S.; Kannappan, V.; Elhissi, A.M.A.; Wang, W. Development of Injectable PEGylated Liposome Encapsulating Disulfiram for Colorectal Cancer Treatment. Pharmaceutics 2019, 11. [Google Scholar] [CrossRef]
- Parny, M.; Bernad, J.; Prat, M.; Salon, M.; Aubouy, A.; Bonnafé, E.; Coste, A.; Pipy, B.; Treilhou, M. Comparative study of the effects of ziram and disulfiram on human monocyte-derived macrophage functions and polarization: involvement of zinc. Cell Biol Toxicol 2021, 37, 379–400. [Google Scholar] [CrossRef]
- Lu, Y.; Cao, L.; Egami, Y.; Kawai, K.; Araki, N. Cofilin contributes to phagocytosis of IgG-opsonized particles but not non-opsonized particles in RAW264 macrophages. Microscopy (Oxf) 2016, 65, 233–42. [Google Scholar] [CrossRef]
- Aderem, A.; Underhill, D.M. Mechanisms of phagocytosis in macrophages. Annu Rev Immunol 1999, 17, 593–623. [Google Scholar] [CrossRef]
- Palecanda, A.; Kobzik, L. Receptors for unopsonized particles: the role of alveolar macrophage scavenger receptors. Curr Mol Med 2001, 1, 589–95. [Google Scholar] [CrossRef]
- Kobzik, L. Lung macrophage uptake of unopsonized environmental particulates. Role of scavenger-type receptors. J Immunol 1995, 155, 367–76. [Google Scholar] [CrossRef] [PubMed]
- Palecanda, A.; Paulauskis, J.; Al-Mutairi, E.; Imrich, A.; Qin, G.; Suzuki, H.; Kodama, T.; Tryggvason, K.; Koziel, H.; Kobzik, L. Role of the scavenger receptor MARCO in alveolar macrophage binding of unopsonized environmental particles. J Exp Med 1999, 189, 1497–506. [Google Scholar] [CrossRef] [PubMed]
- Huth, J.; Buchholz, M.; Kraus, J.M.; Schmucker, M.; von Wichert, G.; Krndija, D.; Seufferlein, T.; Gress, T.M.; Kestler, H.A. Significantly improved precision of cell migration analysis in time-lapse video microscopy through use of a fully automated tracking system. BMC Cell Biol 2010, 11, 24. [Google Scholar] [CrossRef] [PubMed]
- Norling, M.; Karlsson-Lindsjö, O.E.; Gourlé, H.; Bongcam-Rudloff, E.; Hayer, J. MetLab: An In Silico Experimental Design, Simulation and Analysis Tool for Viral Metagenomics Studies. PLoS One 2016, 11, e0160334. [Google Scholar] [CrossRef] [PubMed]
- Gordon, P.; Okai, B.; Hoare, J.I.; Erwig, L.P.; Wilson, H.M. SOCS3 is a modulator of human macrophage phagocytosis. J Leukoc Biol 2016, 100, 771–780. [Google Scholar] [CrossRef] [PubMed]
- Patente, T.A.; Pinho, M.P.; Oliveira, A.A.; Evangelista, G.C.M.; Bergami-Santos, P.C.; Barbuto, J.A.M. Human Dendritic Cells: Their Heterogeneity and Clinical Application Potential in Cancer Immunotherapy. Front Immunol 2018, 9, 3176. [Google Scholar] [CrossRef]
- Kis-Toth, K.; Hajdu, P.; Bacskai, I.; Szilagyi, O.; Papp, F.; Szanto, A.; Posta, E.; Gogolak, P.; Panyi, G.; Rajnavolgyi, E. Voltage-gated sodium channel Nav1.7 maintains the membrane potential and regulates the activation and chemokine-induced migration of a monocyte-derived dendritic cell subset. J Immunol 2011, 187, 1273–80. [Google Scholar] [CrossRef] [PubMed]
- Comi, M.; Avancini, D.; de Sio, F.S.; Villa, M.; Uyeda, M.J.; Floris, M.; Tomasoni, D.; Bulfone, A.; Roncarolo, M.G.; Gregori, S. Coexpression of CD163 and CD141 identifies human circulating IL-10-producing dendritic cells (DC-10). Cell Mol Immunol 2020, 17, 95–107. [Google Scholar] [CrossRef]
- Moerke, C.; Mueller, P.; Nebe, B. Attempted caveolae-mediated phagocytosis of surface-fixed micro-pillars by human osteoblasts. Biomaterials 2016, 76, 102–14. [Google Scholar] [CrossRef] [PubMed]
- Mateo, C.; Grazu, V.; Guisan, J.M. Immobilization of enzymes on monofunctional and heterofunctional epoxy-activated supports. Methods Mol Biol 2013, 1051, 43–57. [Google Scholar] [PubMed]
- Gu, B.J.; Duce, J.A.; Valova, V.A.; Wong, B.; Bush, A.I.; Petrou, S.; Wiley, J.S. P2X7 receptor-mediated scavenger activity of mononuclear phagocytes toward non-opsonized particles and apoptotic cells is inhibited by serum glycoproteins but remains active in cerebrospinal fluid. J Biol Chem 2012, 287, 17318–17330. [Google Scholar] [CrossRef] [PubMed]
- Gauthier, J.D.; Feig, B.; Vasta, G.R. Effect of fetal bovine serum glycoproteins on the in vitro proliferation of the oyster parasite Perkinsus marinus: development of a fully defined medium. J Eukaryot Microbiol 1995, 42, 307–13. [Google Scholar] [CrossRef] [PubMed]
- Kholmukhamedov, A.; Schwartz, J.M.; Lemasters, J.J. Isolated mitochondria infusion mitigates ischemia-reperfusion injury of the liver in rats: mitotracker probes and mitochondrial membrane potential. Shock 2013, 39, 543. [Google Scholar] [CrossRef] [PubMed]
- Li, L.; Zhang, B.; Tao, Y.; Wang, Y.; Wei, H.; Zhao, J.; Huang, R.; Pei, Z. DL-3-n-butylphthalide protects endothelial cells against oxidative/nitrosative stress, mitochondrial damage and subsequent cell death after oxygen glucose deprivation in vitro. Brain Res 2009, 1290, 91–101. [Google Scholar] [CrossRef]
- Lo, H.M.; Chen, C.L.; Yang, C.M.; Wu, P.H.; Tsou, C.J.; Chiang, K.W.; Wu, W.B. The carotenoid lutein enhances matrix metalloproteinase-9 production and phagocytosis through intracellular ROS generation and ERK1/2, p38 MAPK, and RARβ activation in murine macrophages. J Leukoc Biol 2013, 93, 723–35. [Google Scholar] [CrossRef]
- Lai, J.C.; Wlodarska, M.; Liu, D.J.; Abraham, N.; Johnson, P. CD45 regulates migration; proliferation, and progression of double negative 1 thymocytes. J Immunol 2010, 185, 2059–70. [Google Scholar] [CrossRef] [PubMed]
- Saunders, A.E.; Johnson, P. Modulation of immune cell signalling by the leukocyte common tyrosine phosphatase, CD45. Cell Signal 2010, 22, 339–48. [Google Scholar] [CrossRef] [PubMed]
- Zwingmann, C.; Leibfritz, D.; Hazell, A.S. Energy metabolism in astrocytes and neurons treated with manganese: relation among cell-specific energy failure, glucose metabolism, and intercellular trafficking using multinuclear NMR-spectroscopic analysis. J Cereb Blood Flow Metab 2003, 23, 756–71. [Google Scholar] [CrossRef] [PubMed]
- Kummer, L.; Zaradzki, M.; Vijayan, V.; Arif, R.; Weigand, M.A.; Immenschuh, S.; Wagner, A.H.; Larmann, J. Vascular Signaling in Allogenic Solid Organ Transplantation - The Role of Endothelial Cells. Front Physiol 2020, 11, 443. [Google Scholar] [CrossRef]
- Thibodeau, J.; Moulefera, M.A.; Balthazard, R. On the structure-function of MHC class II molecules and how single amino acid polymorphisms could alter intracellular trafficking. Hum Immunol 2019, 80, 15–31. [Google Scholar] [CrossRef]
- Crux, N.B.; Elahi, S. Human Leukocyte Antigen (HLA) and Immune Regulation: How Do Classical and Non-Classical HLA Alleles Modulate Immune Response to Human Immunodeficiency Virus and Hepatitis C Virus Infections? Front Immunol 2017, 8, 832. [Google Scholar] [CrossRef]
- Vaglini, F.; Viaggi, C.; Piro, V.; Pardini, C.; Gerace, C.; Scarselli, M.; Corsini, G.U. Acetaldehyde; parkinsonism: role of CYP450. Front Behav Neurosci 2013, 7, 71. [Google Scholar] [CrossRef] [PubMed]
- Boscá, L.; González-Ramos, S.; Prieto, P.; Fernández-Velasco, M.; Mojena, M.; Martín-Sanz, P.; Alemany, S. Metabolic signatures linked to macrophage polarization: from glucose metabolism to oxidative phosphorylation. Biochem Soc Trans 2015, 43, 740–4. [Google Scholar] [CrossRef]
- Orihuela, R.; McPherson, C.A.; Harry, G.J. Microglial M1/M2 polarization and metabolic states. Br J Pharmacol 2016, 173, 649–65. [Google Scholar] [CrossRef]
- Mills, E.L.; O’Neill, L.A. Reprogramming mitochondrial metabolism in macrophages as an anti-inflammatory signal. Eur J Immunol 2016, 46, 13–21. [Google Scholar] [CrossRef]
- Liu, Y.; Xu, R.; Gu, H.; Zhang, E.; Qu, J.; Cao, W.; Huang, X.; Yan, H.; He, J.; Cai, Z. Metabolic reprogramming in macrophage responses. Biomark Res 2021, 9, 1. [Google Scholar] [CrossRef]
- Lin, M.H.; Moses, D.C.; Hsieh, C.H.; Cheng, S.C.; Chen, Y.H.; Sun, C.Y.; Chou, C.Y. Disulfiram can inhibit MERS and SARS coronavirus papain-like proteases via different modes. Antiviral Res 2018, 150, 155–163. [Google Scholar] [CrossRef]
- Fu, L.; Ye, F.; Feng, Y.; Yu, F.; Wang, Q.; Wu, Y.; Zhao, C.; Sun, H.; Huang, B.; Niu, P.; Song, H.; Shi, Y.; Li, X.; Tan, W.; Qi, J.; Gao, G.F. Both Boceprevir and GC376 efficaciously inhibit SARS-CoV-2 by targeting its main protease. Nat Commun 2020, 11, 4417. [Google Scholar] [CrossRef]
- Froggatt, H.M.; Heaton, B.E.; Heaton, N.S. Development of a Fluorescence-Based, High-Throughput SARS-CoV-2 3CL(pro) Reporter Assay. J Virol 2020, 94. [Google Scholar] [CrossRef]
- Hu, J.J.; Liu, X.; Xia, S.; Zhang, Z.; Zhang, Y.; Zhao, J.; Ruan, J.; Luo, X.; Lou, X.; Bai, Y.; Wang, J.; Hollingsworth, L.R.; Magupalli, V.G.; Zhao, L.; Luo, H.R.; Kim, J.; Lieberman, J.; Wu, H. FDA-approved disulfiram inhibits pyroptosis by blocking gasdermin D pore formation. Nat Immunol 2020, 21, 736–745. [Google Scholar] [CrossRef]
- Chen, T.; Fei, C.Y.; Chen, Y.P.; Sargsyan, K.; Chang, C.P.; Yuan, H.S.; Lim, C. Synergistic Inhibition of SARS-CoV-2 Replication Using Disulfiram/Ebselen and Remdesivir. ACS Pharmacol Transl Sci 2021, 4, 898–907. [Google Scholar] [CrossRef]
- Potula, H.S.K.; Shahryari, J.; Inayathullah, M.; Malkovskiy, A.V.; Kim, K.M.; Rajadas, J. Repurposing Disulfiram (Tetraethylthiuram Disulfide) as a Potential Drug Candidate against Borrelia burgdorferi In Vitro and In Vivo. Antibiotics (Basel) 2020, 9. [Google Scholar] [CrossRef] [PubMed]
- Troxell, B.; Ye, M.; Yang, Y.; Carrasco, S.E.; Lou, Y.; Yang, X.F. Manganese and zinc regulate virulence determinants in Borrelia burgdorferi. Infect Immun 2013, 81, 2743–52. [Google Scholar] [CrossRef] [PubMed]
- Grage-Griebenow, E.; Flad, H.D.; Ernst, M. Heterogeneity of human peripheral blood monocyte subsets. J Leukoc Biol 2001, 69, 11–20. [Google Scholar] [CrossRef] [PubMed]
- Coillard, A.; Segura, E. , In vivo Differentiation of Human Monocytes. Front Immunol 2019, 10, 1907. [Google Scholar] [CrossRef] [PubMed]
- del Hoyo, G.M.; Martín, P.; Vargas, H.H.; Ruiz, S.; Arias, C.F.; Ardavín, C. Characterization of a common precursor population for dendritic cells. Nature 2002, 415, 1043–7. [Google Scholar] [CrossRef] [PubMed]
- Gabrusiewicz, K.; Rodriguez, B.; Wei, J.; Hashimoto, Y.; Healy, L.M.; Maiti, S.N.; Thomas, G.; Zhou, S.; Wang, Q.; Elakkad, A.; Liebelt, B.D.; Yaghi, N.K.; Ezhilarasan, R.; Huang, N.; Weinberg, J.S.; Prabhu, S.S.; Rao, G.; Sawaya, R.; Langford, L.A.; Bruner, J.M.; Fuller, G.N.; Bar-Or, A.; Li, W.; Colen, R.R.; Curran, M.A.; Bhat, K.P.; Antel, J.P.; Cooper, L.J.; Sulman, E.P.; Heimberger, A.B. Glioblastoma-infiltrated innate immune cells resemble M0 macrophage phenotype. JCI Insight 2016, 1. [Google Scholar] [CrossRef] [PubMed]
- Tremble, L.F.; Forde, P.F.; Soden, D.M. Clinical evaluation of macrophages in cancer: role in treatment, modulation and challenges. Cancer Immunol Immunother 2017, 66, 1509–1527. [Google Scholar] [CrossRef] [PubMed]
- Li, W.; Li, Y.; Jin, X.; Liao, Q.; Chen, Z.; Peng, H.; Zhou, Y. CD38: A Significant Regulator of Macrophage Function. Front Oncol 2022, 12, 775649. [Google Scholar] [CrossRef]
- Malavasi, F.; Deaglio, S.; Funaro, A.; Ferrero, E.; Horenstein, A.L.; Ortolan, E.; Vaisitti, T.; Aydin, S. Evolution and function of the ADP ribosyl cyclase/CD38 gene family in physiology and pathology. Physiol Rev 2008, 88, 841–86. [Google Scholar] [CrossRef]
- Zilber, M.T.; Gregory, S.; Mallone, R.; Deaglio, S.; Malavasi, F.; Charron, D.; Gelin, C. CD38 expressed on human monocytes: a coaccessory molecule in the superantigen-induced proliferation. Proc Natl Acad Sci U S A 2000, 97, 2840–5. [Google Scholar] [CrossRef]
- Buechler, C.; Ritter, M.; Orsó, E.; Langmann, T.; Klucken, J.; Schmitz, G. Regulation of scavenger receptor CD163 expression in human monocytes and macrophages by pro- and antiinflammatory stimuli. J Leukoc Biol 2000, 67, 97–103. [Google Scholar] [CrossRef] [PubMed]
- Tippett, E.; Cheng, W.J.; Westhorpe, C.; Cameron, P.U.; Brew, B.J.; Lewin, S.R.; Jaworowski, A.; Crowe, S.M. Differential expression of CD163 on monocyte subsets in healthy and HIV-1 infected individuals. PLoS One 2011, 6, e19968. [Google Scholar] [CrossRef] [PubMed]
Figure 1.
Single frame of an experiment showing the classification of detected beads into free beads (red) and ingested beads (green) by cultured macrophages.
Figure 1.
Single frame of an experiment showing the classification of detected beads into free beads (red) and ingested beads (green) by cultured macrophages.
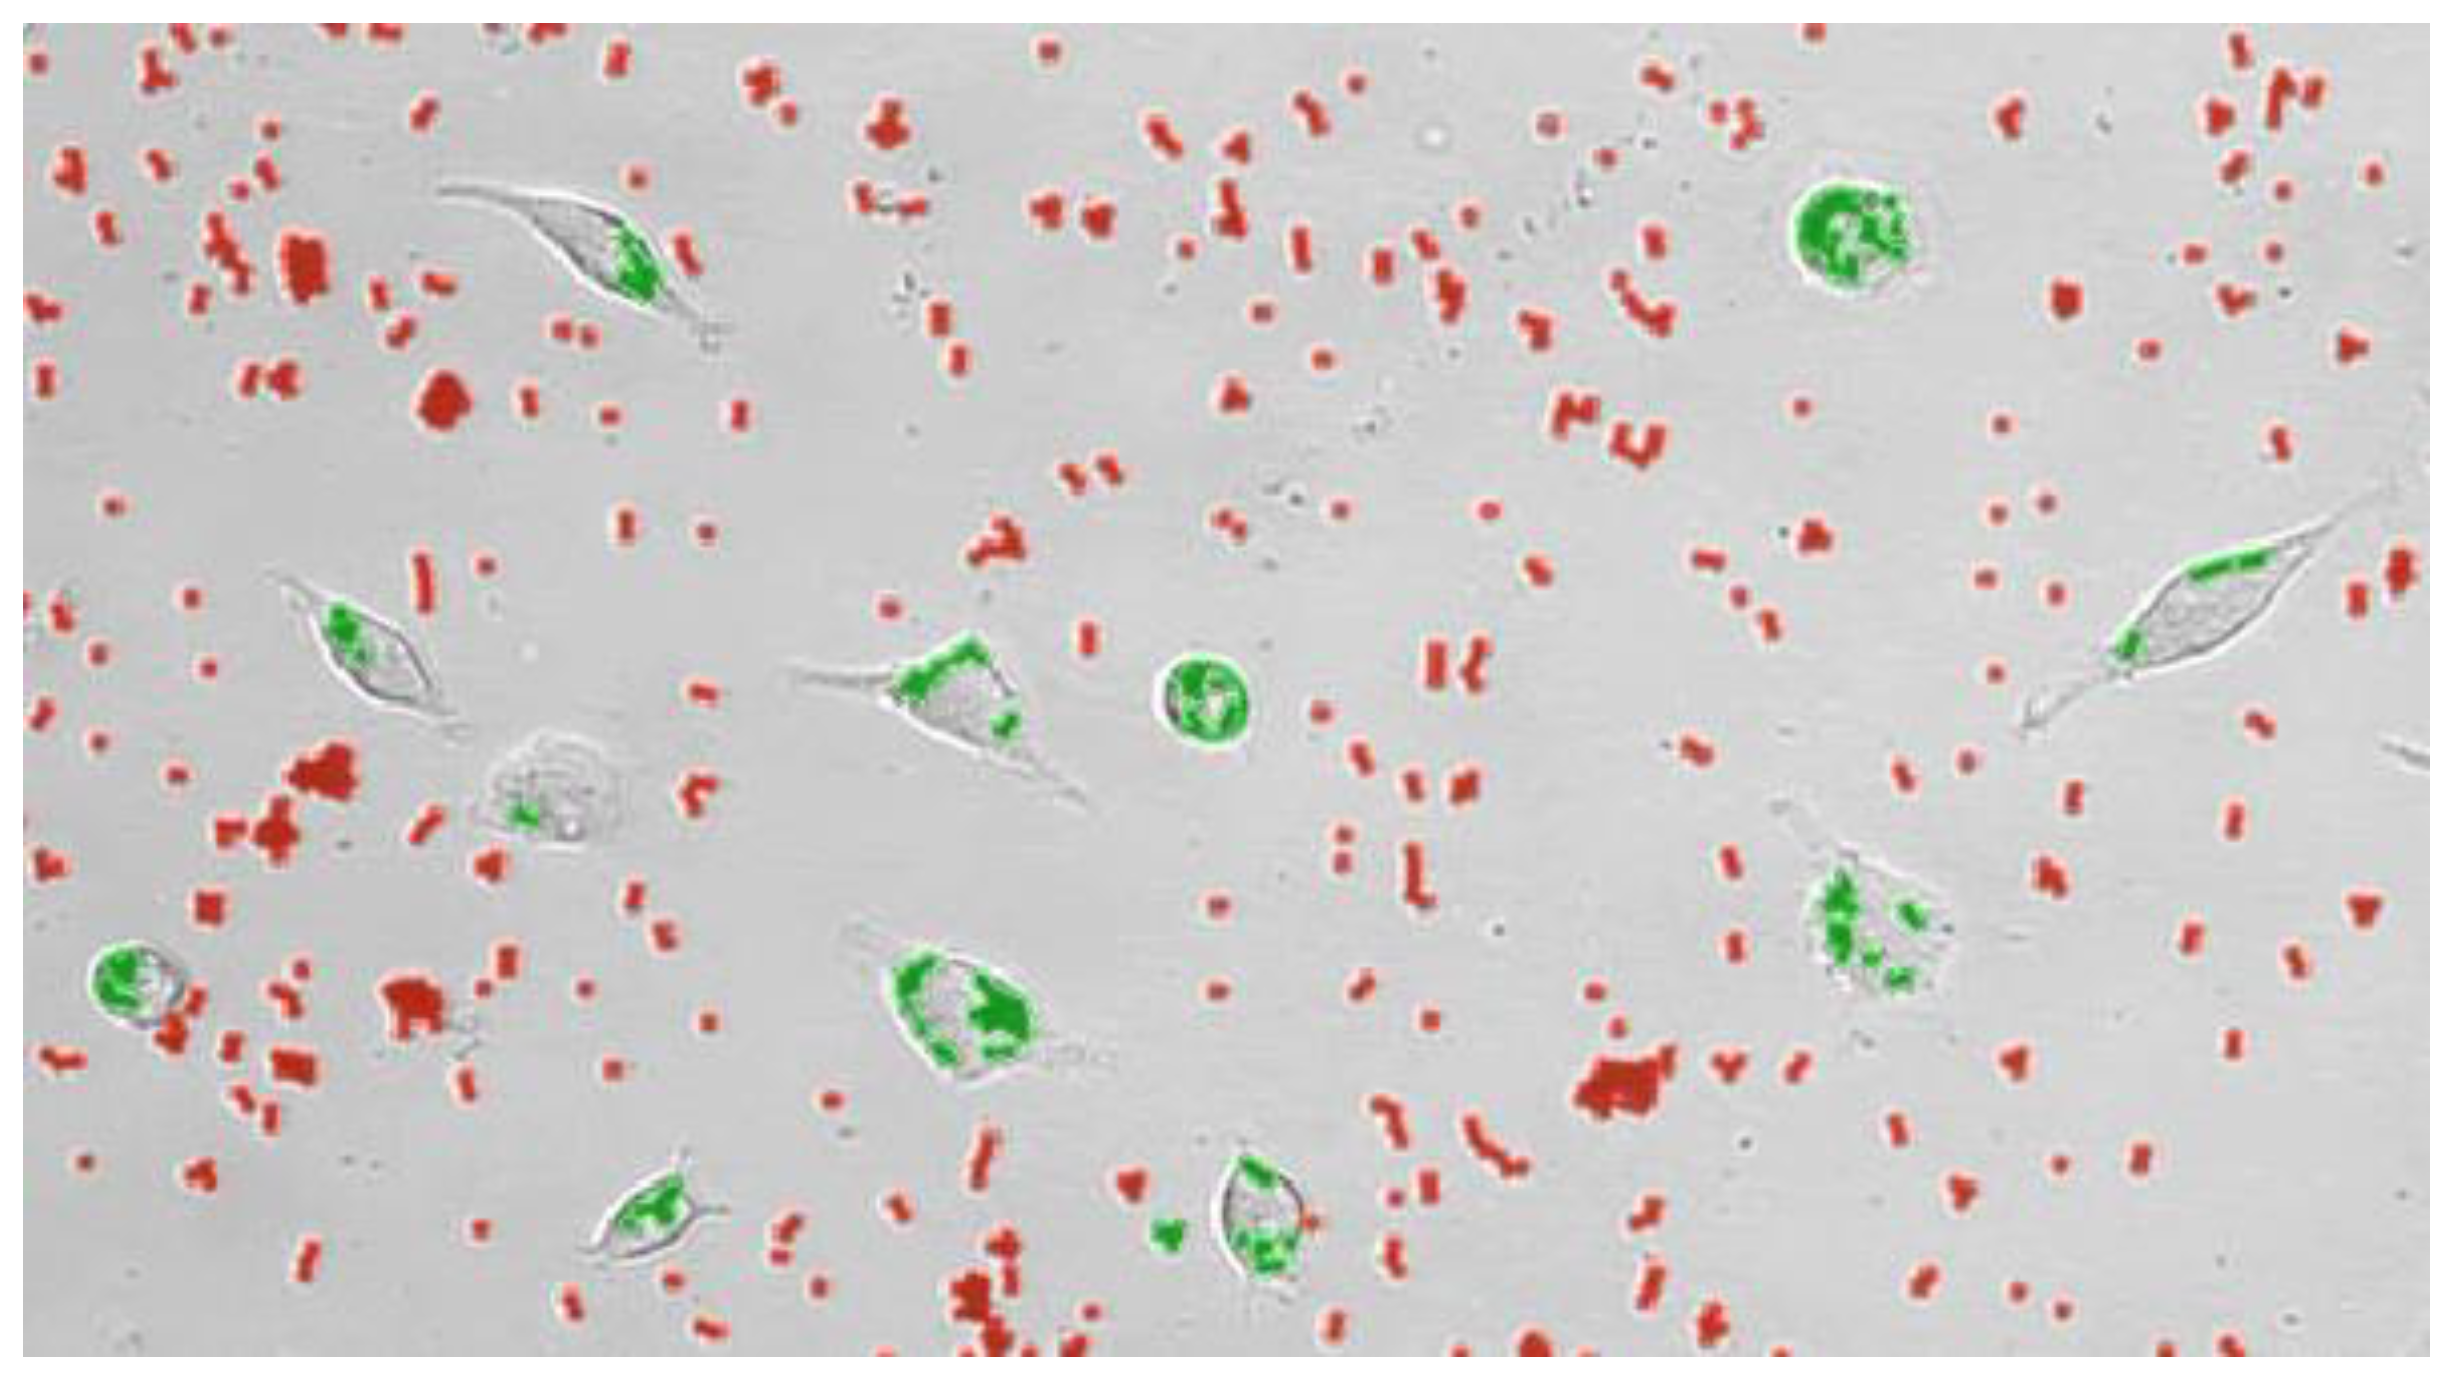
Figure 2.
Represeentative path of a migrating cell during a 24-hour experiment. Left: Path as a sequence of the cell’s centroids between frames (a). Middle: Scheme 1. px1.15 µm.
Figure 2.
Represeentative path of a migrating cell during a 24-hour experiment. Left: Path as a sequence of the cell’s centroids between frames (a). Middle: Scheme 1. px1.15 µm.
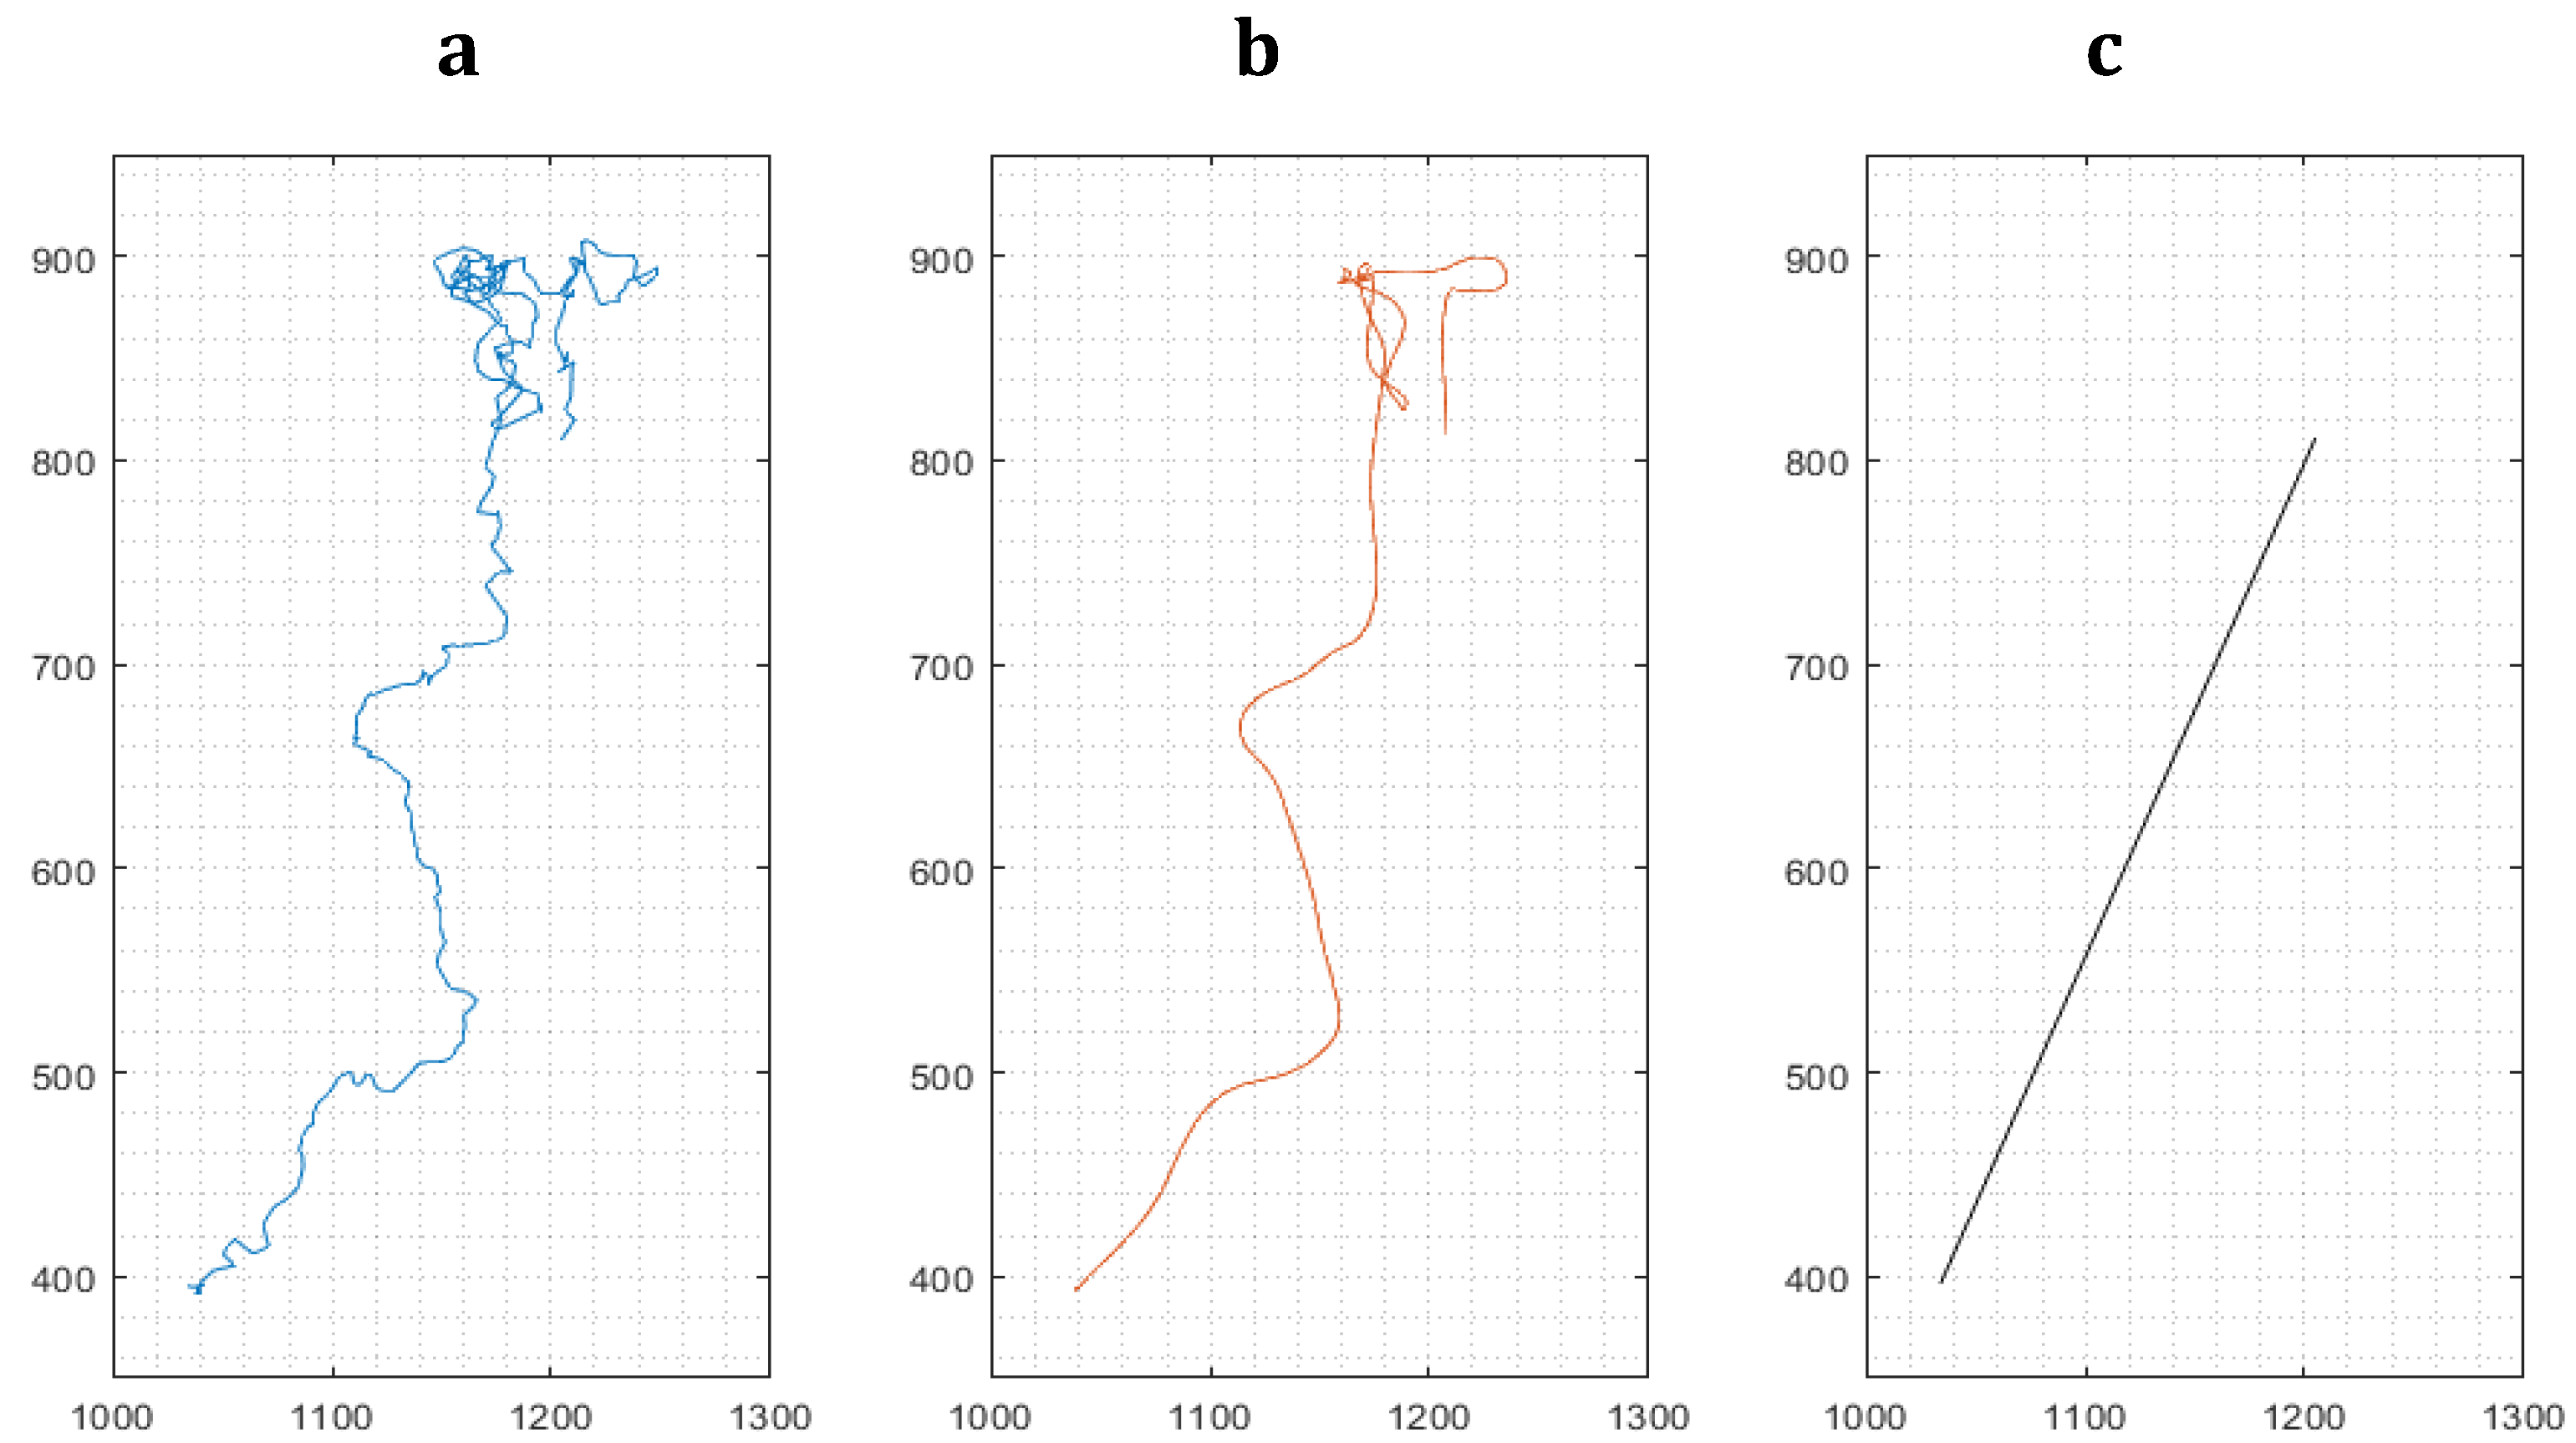
Figure 3.
Representative image of the classification of detected Dynabeads® M-450 Epoxy (red free beads labelled by red and ingested beads labelled by green) by our software based algorithm after 24-hour phagocytosis of hMDMD (#20315). Untreated hMDMD (left); DSF-treated hMDMD (right). DSF significantly decreased cell densities and the amount of ingested beads per cell when compared with the untreated control.
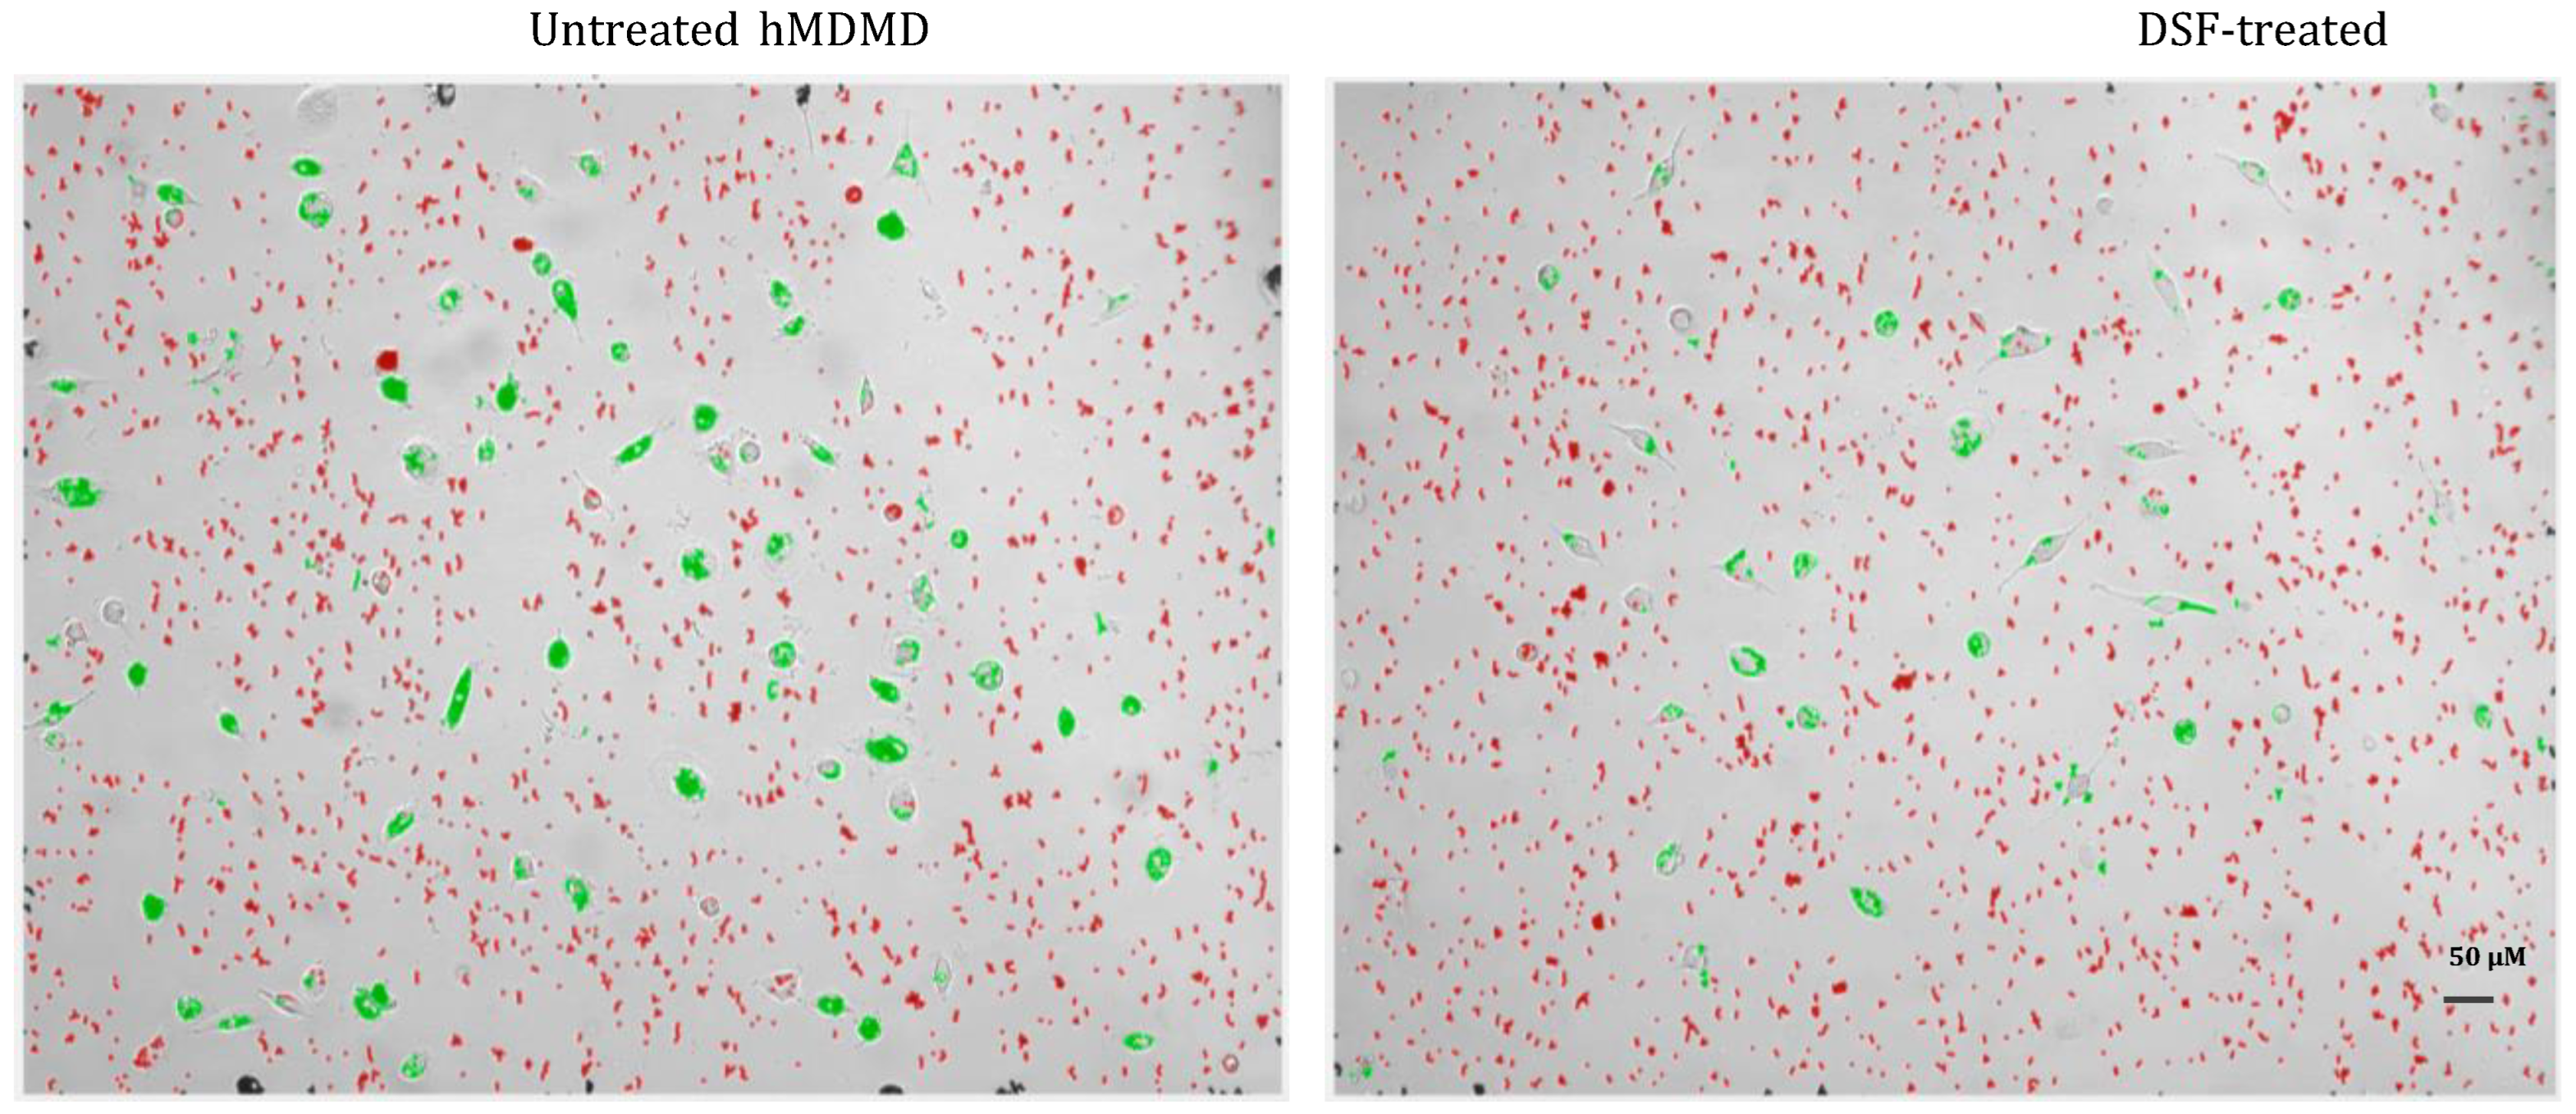
Figure 4.
DSF impairs phagocytosis of general hMDMD. Blood derived monocytes were cultured for 3-4 weeks, macrophages derived from patients #20315-Glioblastoma iDC), #20331- Glioblastoma (cDC), #20725-Borreliosis (M2a), #21161-Major depressive disorder (cDC), and #21164-Post coronavirus vaccination syndrome (M2a), were treated with DSF 50 nmol.L-1 or DMSO as vehicle control (0.01% v/v final concentration) at 37°C and 5% CO2 for 24 h, incubated with Dynabeads® M-450 Epoxy at a cell: 20 beads ratio for 24 hours in Juli™ Br instrument. Phagocytosis was assessed by counting the number of engulfed beads per cell by manual operation. The average of total bead numbers engulfed per macrophage or respective dendritic cells with and without DSF treatment during 24 h. Data are visualized as mean from n=5 macrophage cultures and evaluated by unpaired t-test (Control vs. DSF): * p<0.05.
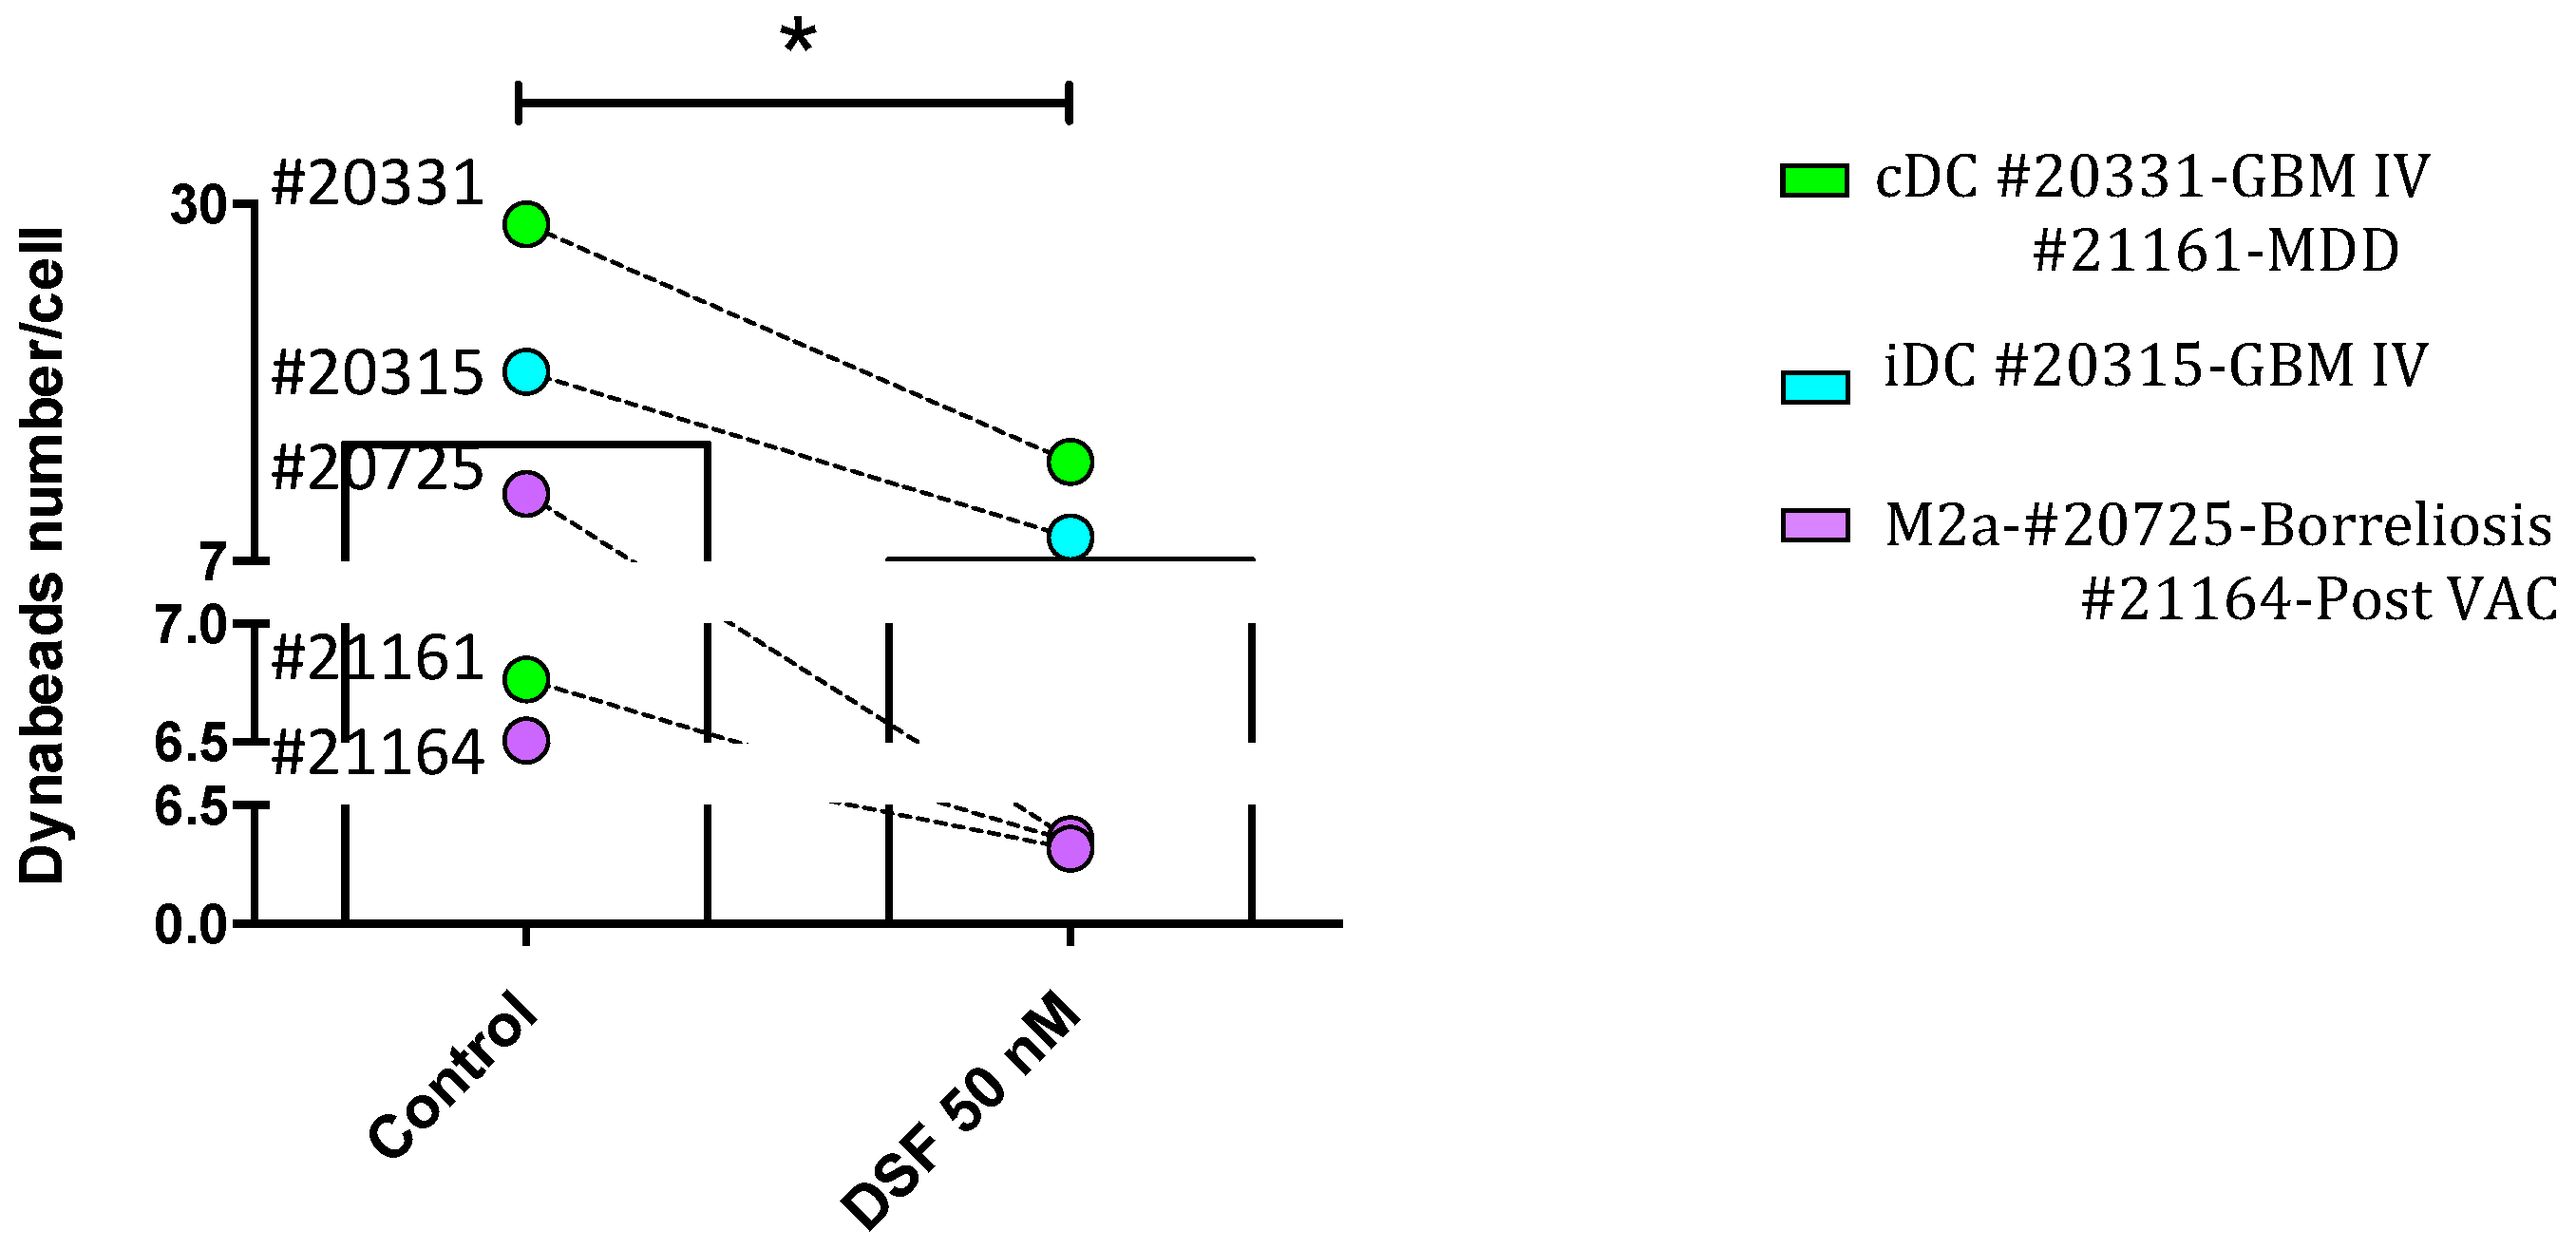
Figure 5.
DSF decreased the ratio of macrophages with high phagocytic capacity. Phagocytic capacities of hMDMD were classified by the number of engulfed beads: 1) 0 beads, no capacity (No of x-axis); 2) 1-10 beads, low capacity (Low of x-axis); and 3) >10 beads, high capacity (High of x-axis). Data are visualized as mean ± SEM from n=5 the same macrophage cultures as Figure 4 (#20315, #20331, #20725, #21161, #21164) and evaluated by unpaired t-test (Control vs. DSF): * p<0.05.
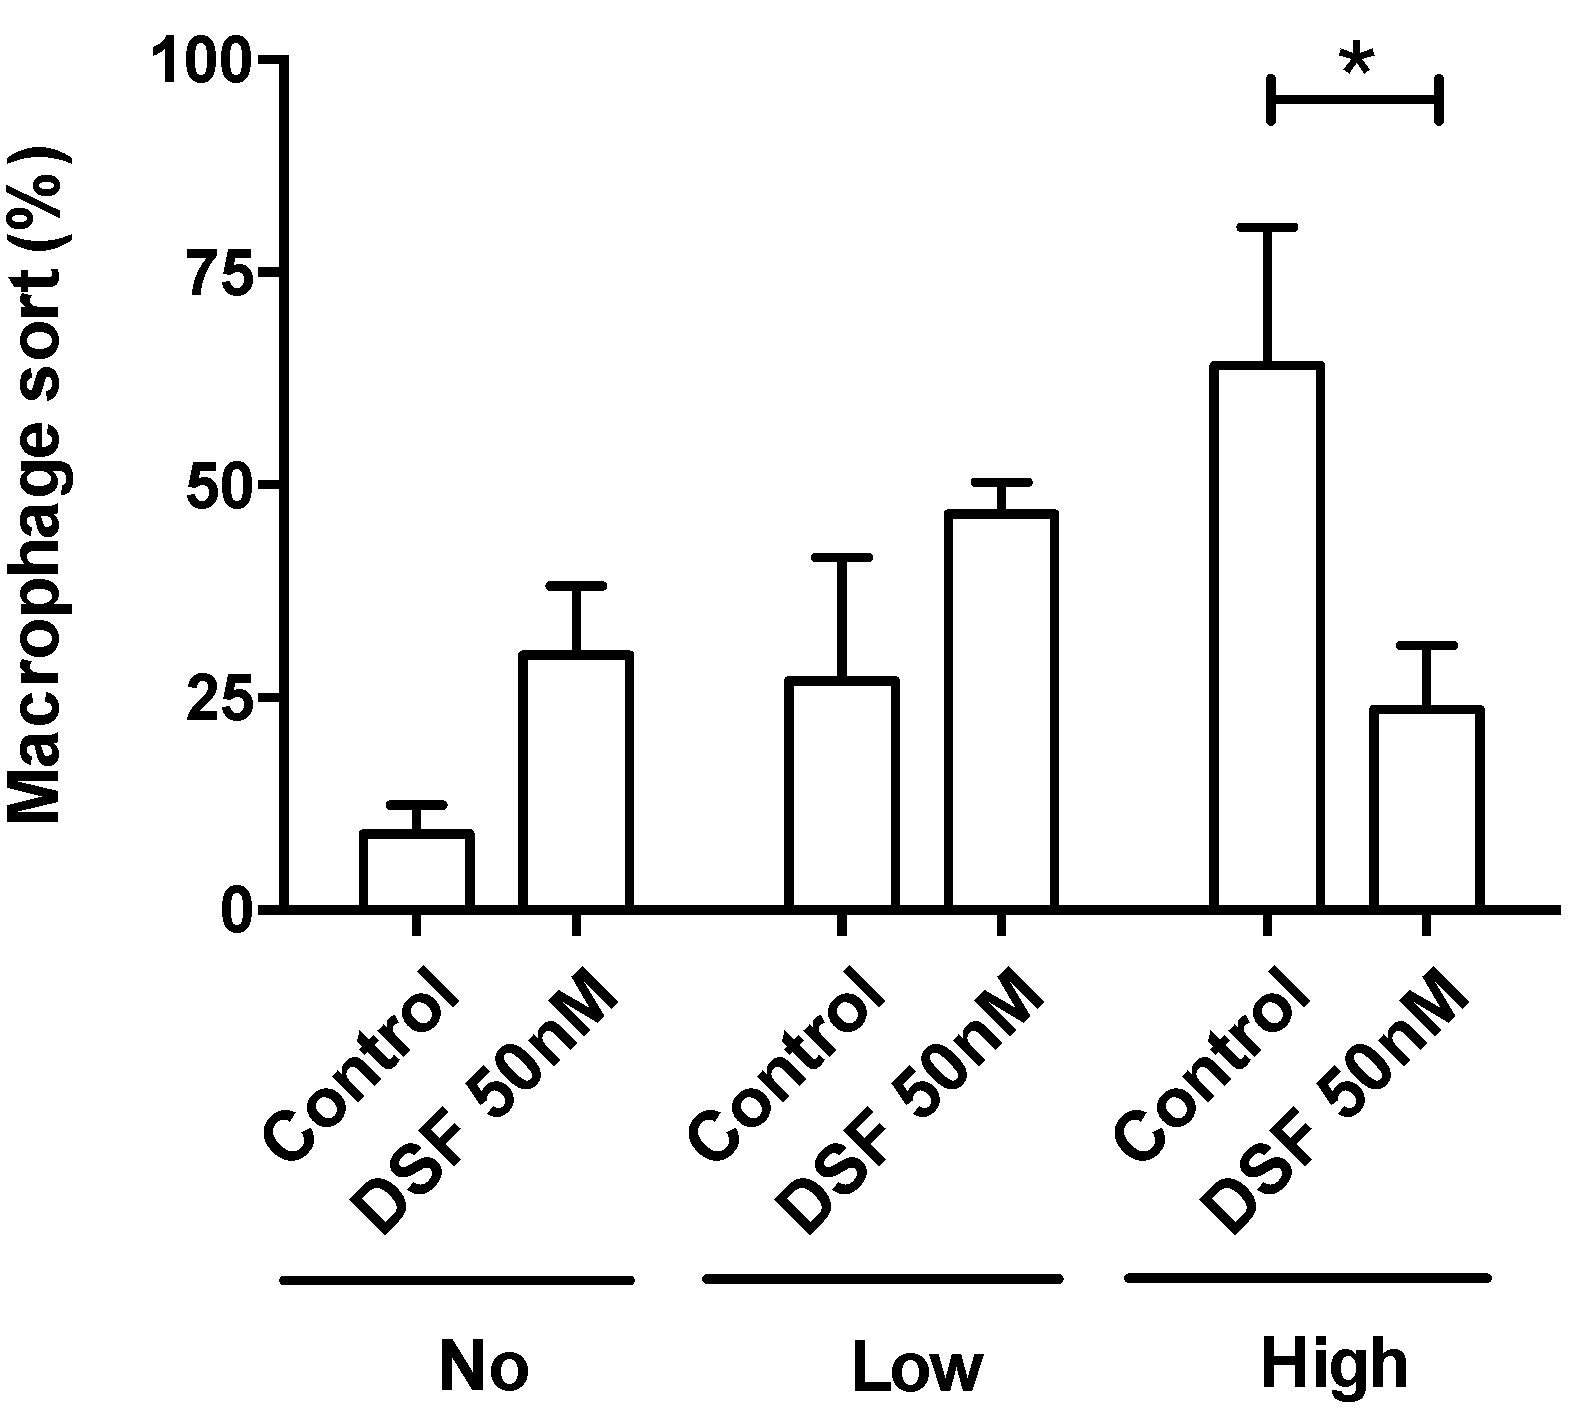
Figure 6.
Representative kinetics of hMDMD phagocytosis, Euclidian distance, and migration speed of hMDMD derived from #20231 conventional dendritic cells (cDC), and #20315-GBM with a classical CD14neg. immature dendritic cells. hMDMD were enriched by 4 weeks of cell culture , then treated with DSF 50 nmol.L-1 or DMSO as vehicle control (0.01% v/v final concentration) at 37°C and 5% CO2 for 24 h and recorded by video microscopy using the Juli™ Br instrument. Before starting video recording, hMDMD were incubated with Dynabeads® M-450 Epoxy at a cell to bead ratio of 1:20. Kinetics of phagocytosis (A, B), migration speed (C, D) Euclidian distance (E, F) and of monitored dendritic cells from #20315 and #20231 were assessed by our software and algorithm. Kinetics of phagocytosis (A, B) was based on the algorithm presented in 3.1.1 and Figure 1. Euclidian distance was depicted by the straight migrated distance (μm) which macrophages moved from the start to the end point based on the multiple-object tracking method described in 3.1.2 and Figure 2c. Migration speed was characterized by mean velocities (μm/min). Each symbol in C, D, E, and F represents an individual cell of untreated or DSF-treated hMDMD from #20231 and #20135 hMDMD.
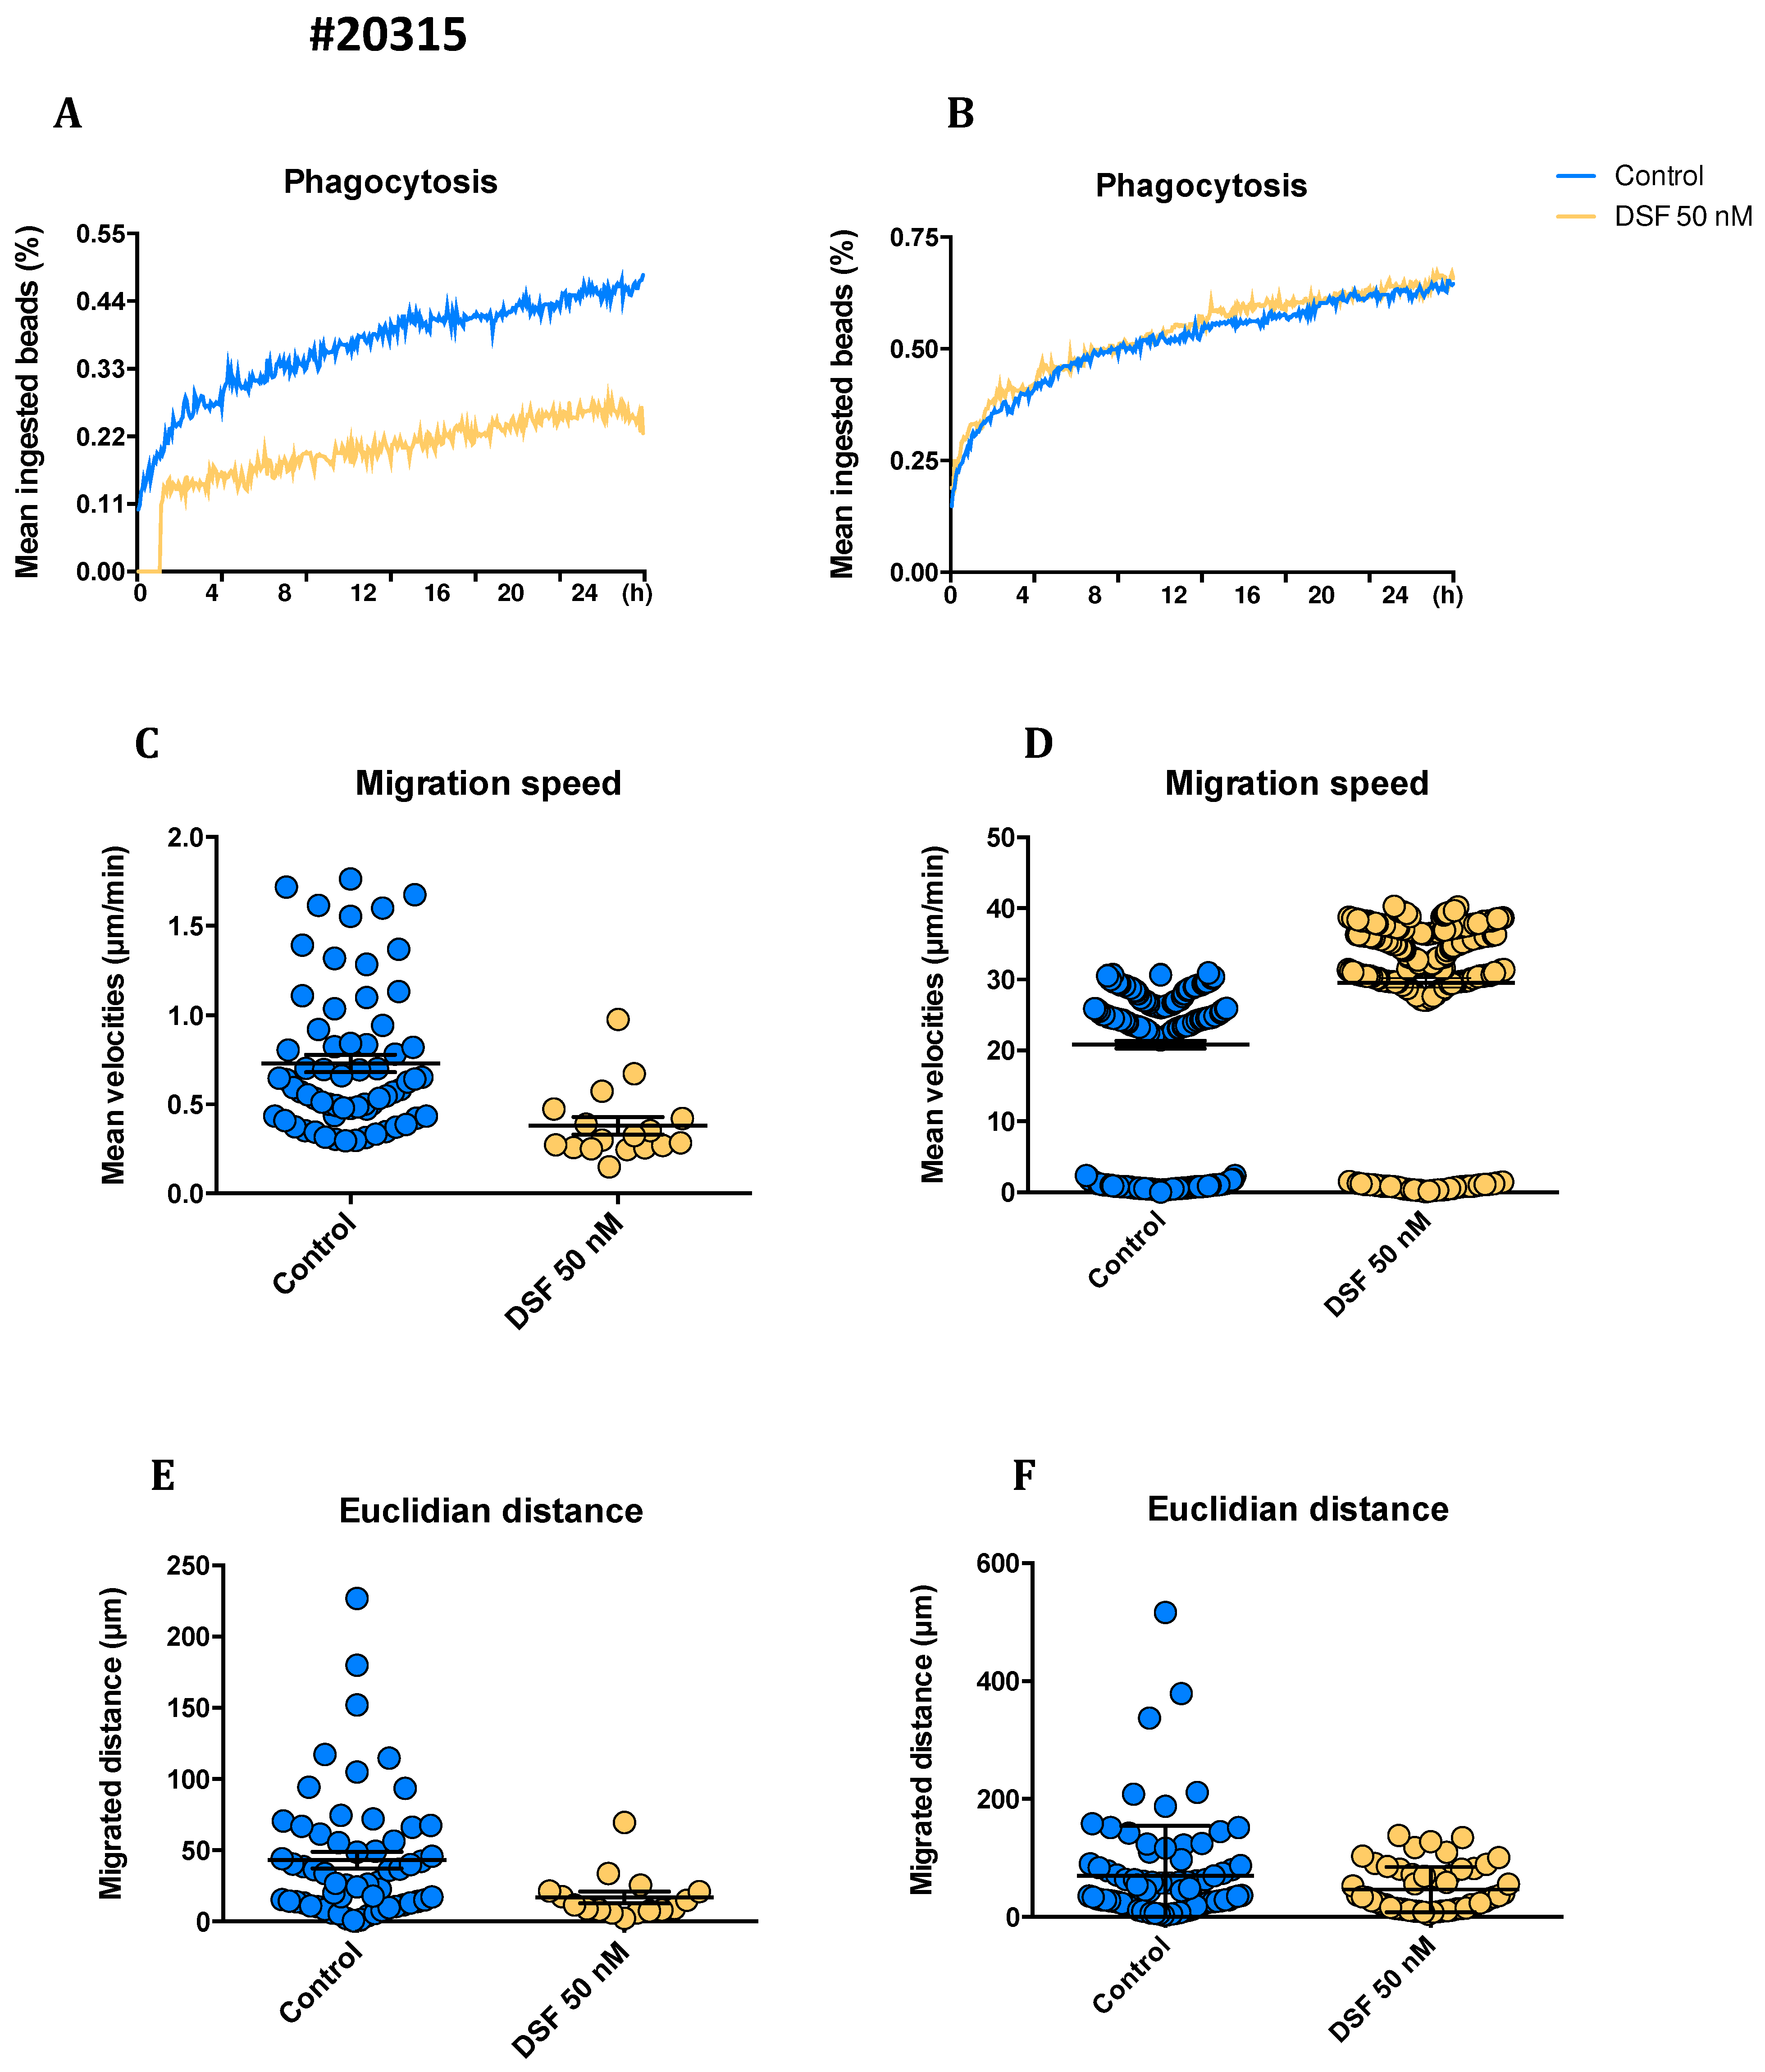
Figure 7.
Representative morphology of live hMDMD culturesdbefore and after DSF treatment. In-vitro cultured hMDMD from patient GBM patients #20315 after 30 days and 24h of incubation with DMSO as vehicle control (0.01% v/v final concentration) (left), and morphological changes observed after DSF 50 nmol.L-1 treatment or for 24 h (right). The DSF-treated macrophages displayed vaculated (red arrow) and dead-like round (blue arrow) morphology as compared with the un-treated macrophages. Images were phase-contrast images at 20× objective, Nikon Eclipse Ts2 microscope. Scale bar: 50 μm.
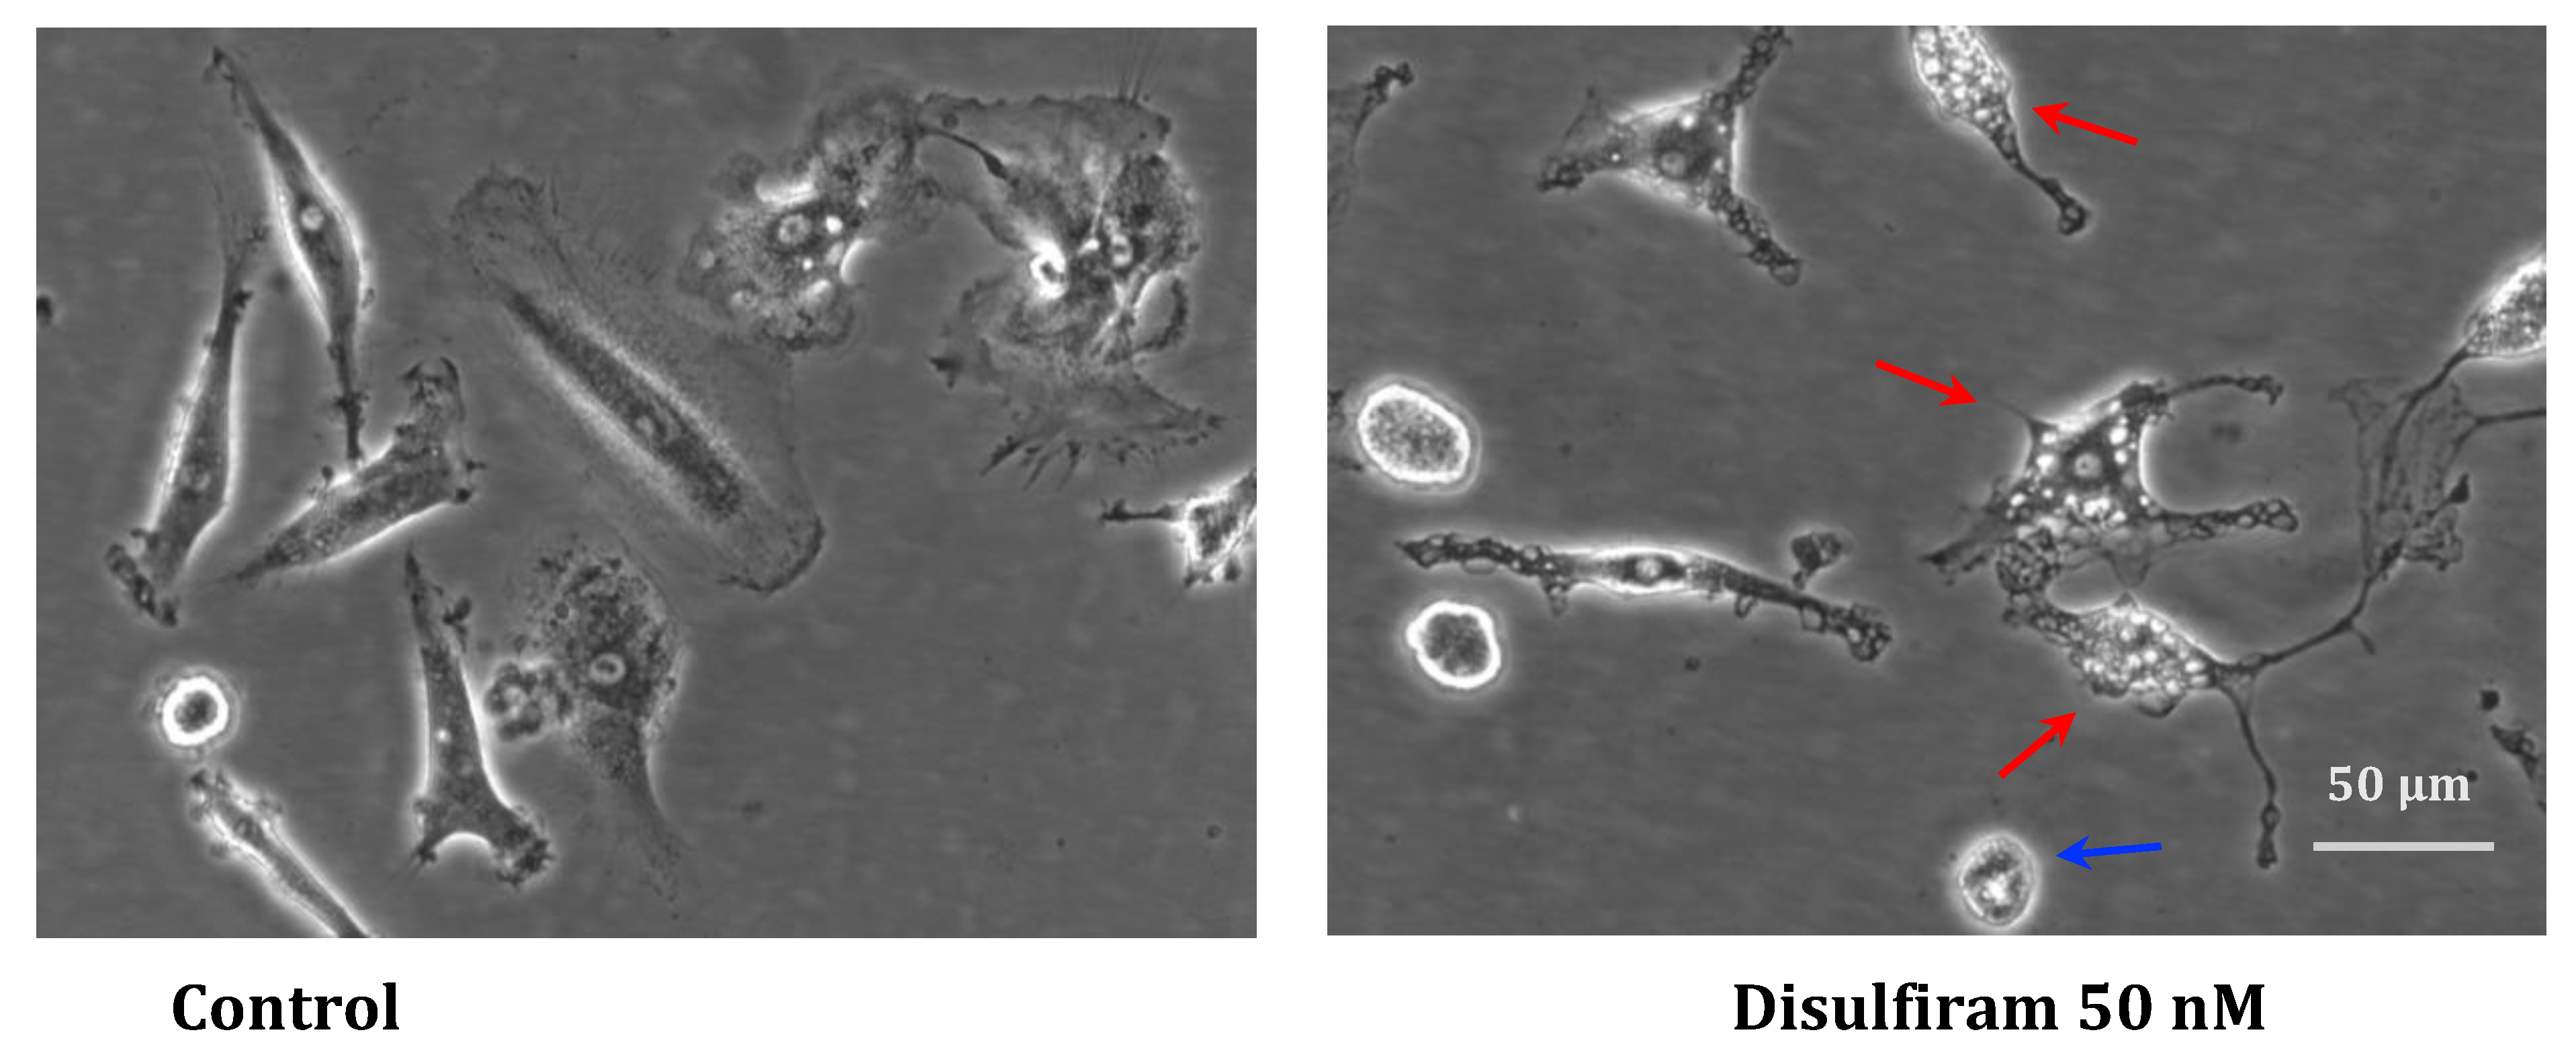
Figure 8.
DSF induces cell death by mitochondrial oxidative stress in macrophages but not in dendritic cells. hMDMDs were cultured for 3-4 weeks, then treated with DSF 50 nmol.L-1 or DMSO as vehicle control (0.01% v/v final concentration) for 24 h at 37°C and 5% CO2. Cells were measured and quantified by flow cytometry for mitochondrial mass of macrophages detected by Mitotracker staining (A), mitochondrial ROS of macrophages detected by Mitosox staining (B), and ratio of cell death (necrosis) assessed by PI staining (C). Accordingly, 3 macrophage cultures with an M2a phenotype responded with increased mitochondrial ROS and cell death. whereas the mitochondrial ROS and viability of dendritic cells (iDC and cDC) were not significantly affected by DSF. CFS: chronic fatigue syndrome; COVID-19: coronavirus disease; HC: healthy control; MDD: major depressive disorder; MND: motor neuron disease; VAC: vaccine.
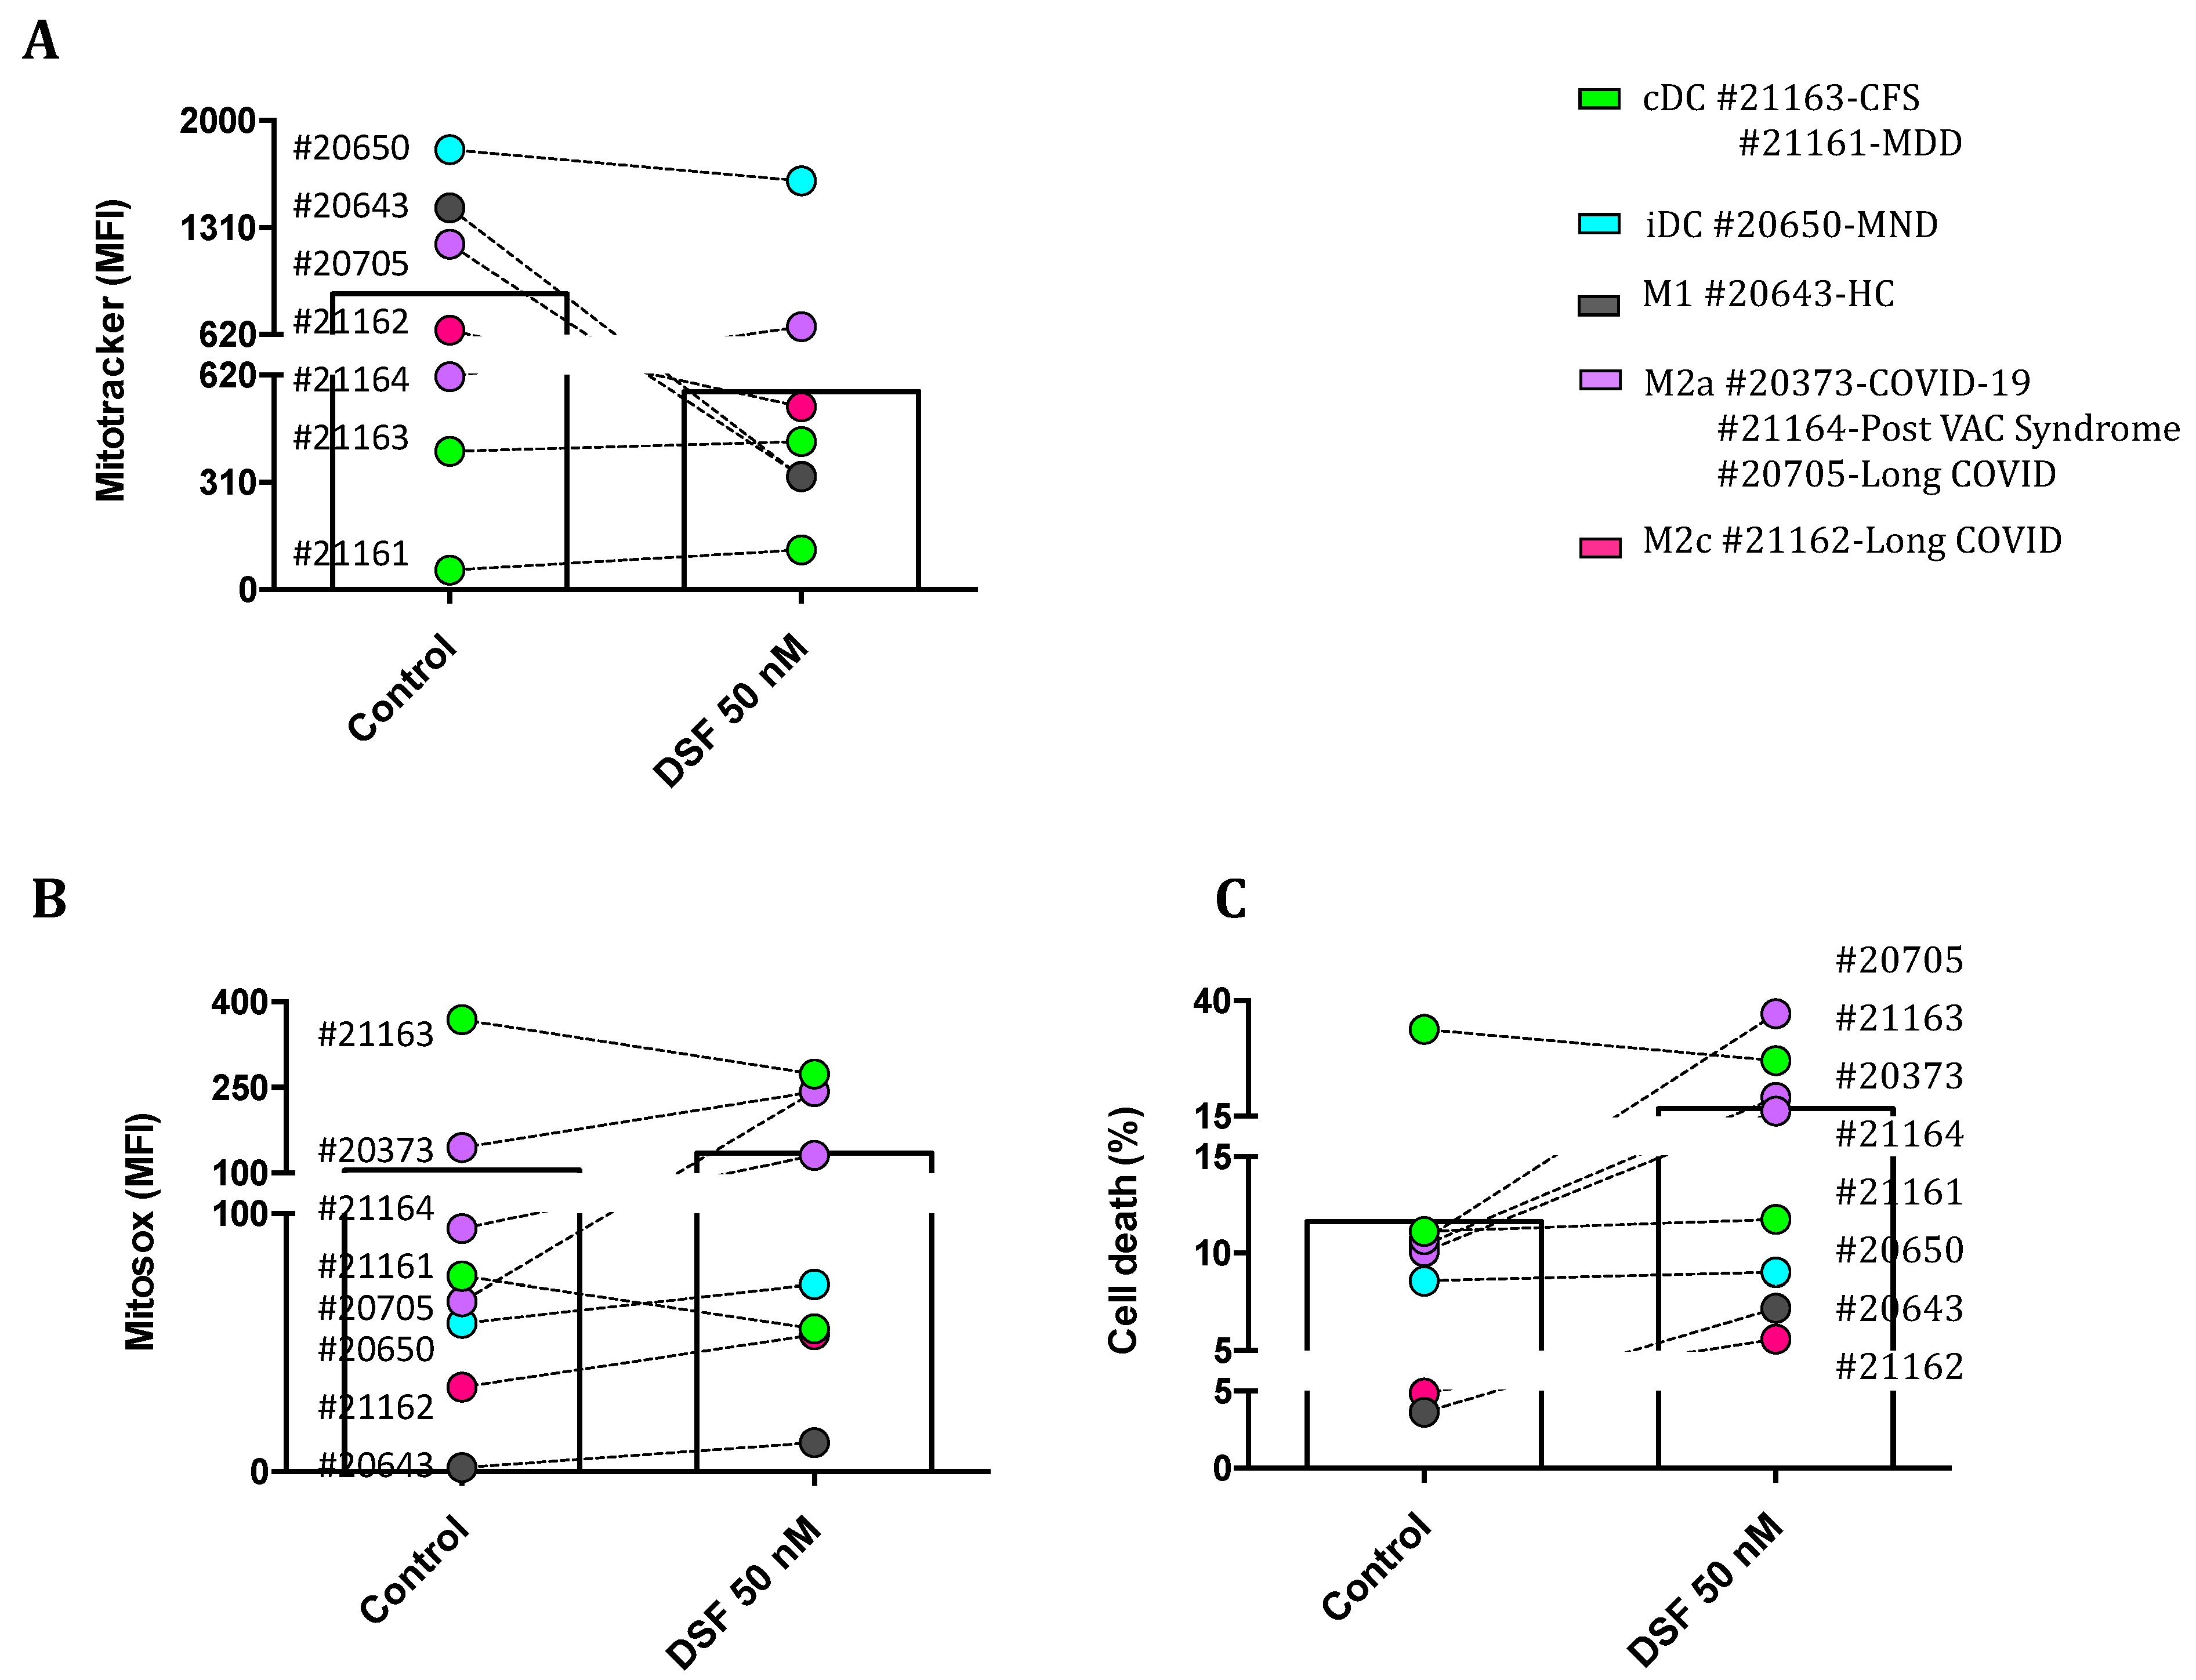
Figure 9.
Glycolytic metabolism of cultured macrophages activated in vivo does not guide a specific macrophage phenotype. hMDMDs were cultured for 3-4 weeks at 37°C and 5% CO2. Supernatant of each group was collected for the assessment of glucose consumption (left x-axis with y-axis) and lactate production (right x-axis with y-axis) by cultured macrophages. Cultured macrophages activated in vivo with M1 and iDC phenotypes did not show a higher level of glucose consumption and lactate production as compated to M2 macrophages and cDC. CFS: chronic fatigue syndrome; COVID-19: coronavirus disease; GBM: glioblastoma; HC: healthy control; MDD: major depressive disorder; MND: motor neuron disease; VAC: vaccine.
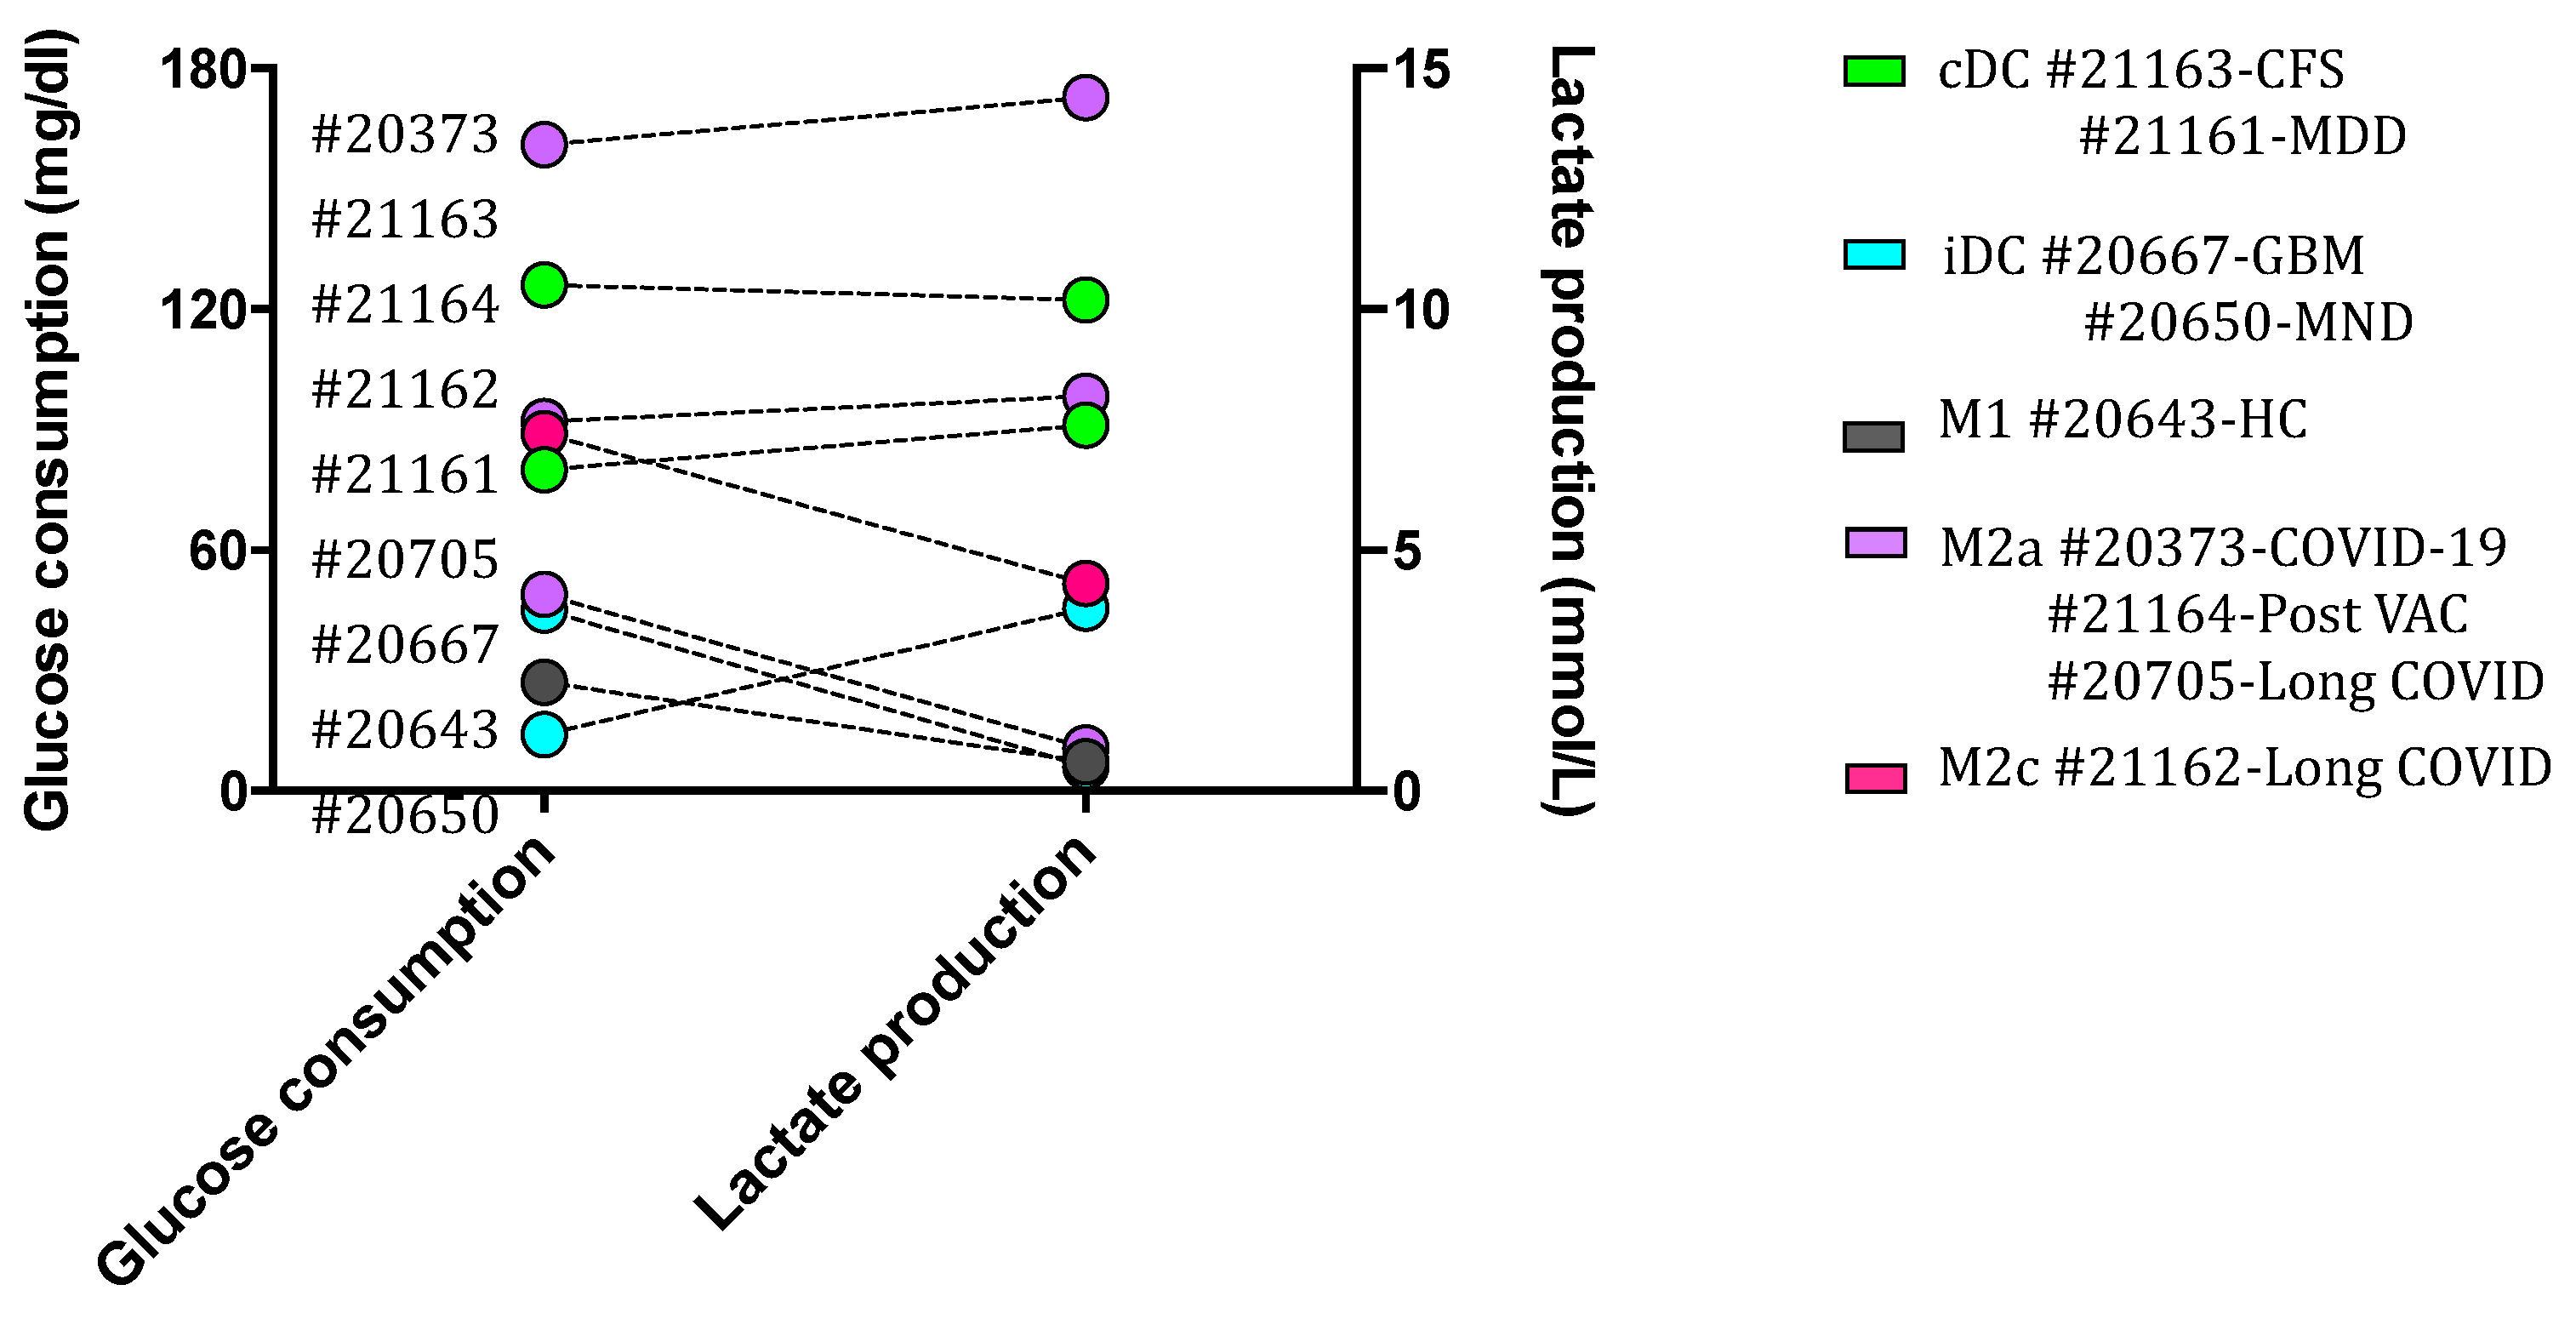
Figure 10.
DSF potentially enhances glycolytic metabolism of cultured macrophages activated in vivo. hMDMDs were cultured for 3-4 weeks and treated with DSF 50 nmol.L-1 or DMSO as vehicle control (0.01% v/v final concentration) for 24 h at 37°C and 5% CO2. Supernatant of each group was collected for the assessment of glucose consumption and lactate production by cultured macrophages. DSF influenced spontaneous glucose consumption only in two cell cultures from long COVID patients (#20705) in (A) and another one (#21162) with increased lactate production in (B). Residual cultures did not show a remarkable effect by DSF treatment. Open circles signify macrophages with low lactate metablism; red-filled circles signify macrophages with high lactate metablism.
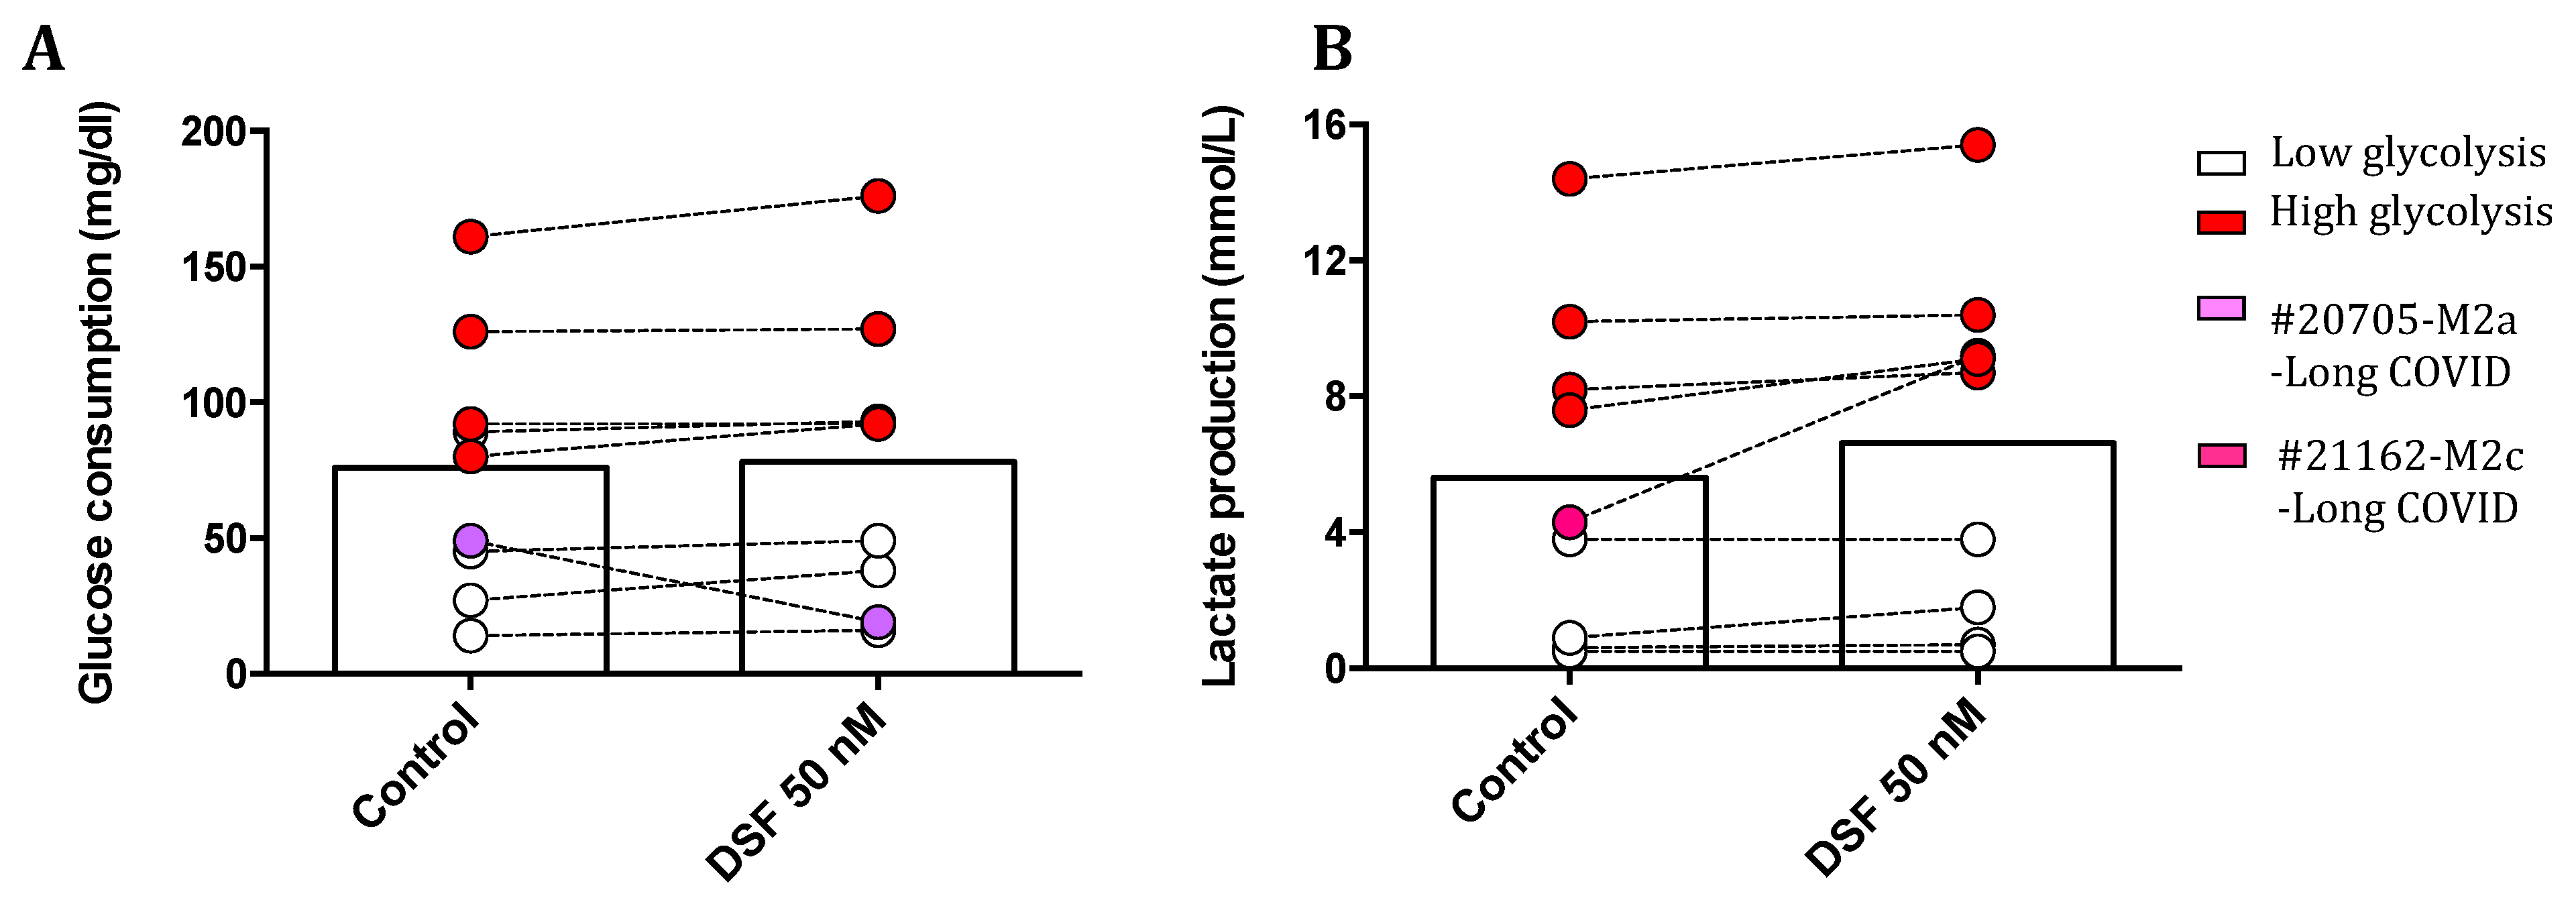
Figure 11.
Modulation of M1 and M2 marker profiled by DSF. Macrophages and dendritic cells were cultured for 3-4 weeks and treated with DSF 50 nmol.L-1 or DMSO as vehicle control (0.01% v/v final concentration) for 24 h at 37°C and 5% CO2. The mean fluorescence intensity (MFI) of leukocyte common antigen CD45 (A), monocyte-macrophage lineage marker CD14 (B), M1 marker CD38 (C), M2 marker CD163 (D), and MHC class II cell surface receptor HLA-DR (E) was examined using flow cytometry. The expression of CD45 and CD14 was significantly decreased by DSF. Data are visualized as mean from n≥8 macrophage/dendritic cell cultures. GBM: glioblastoma.
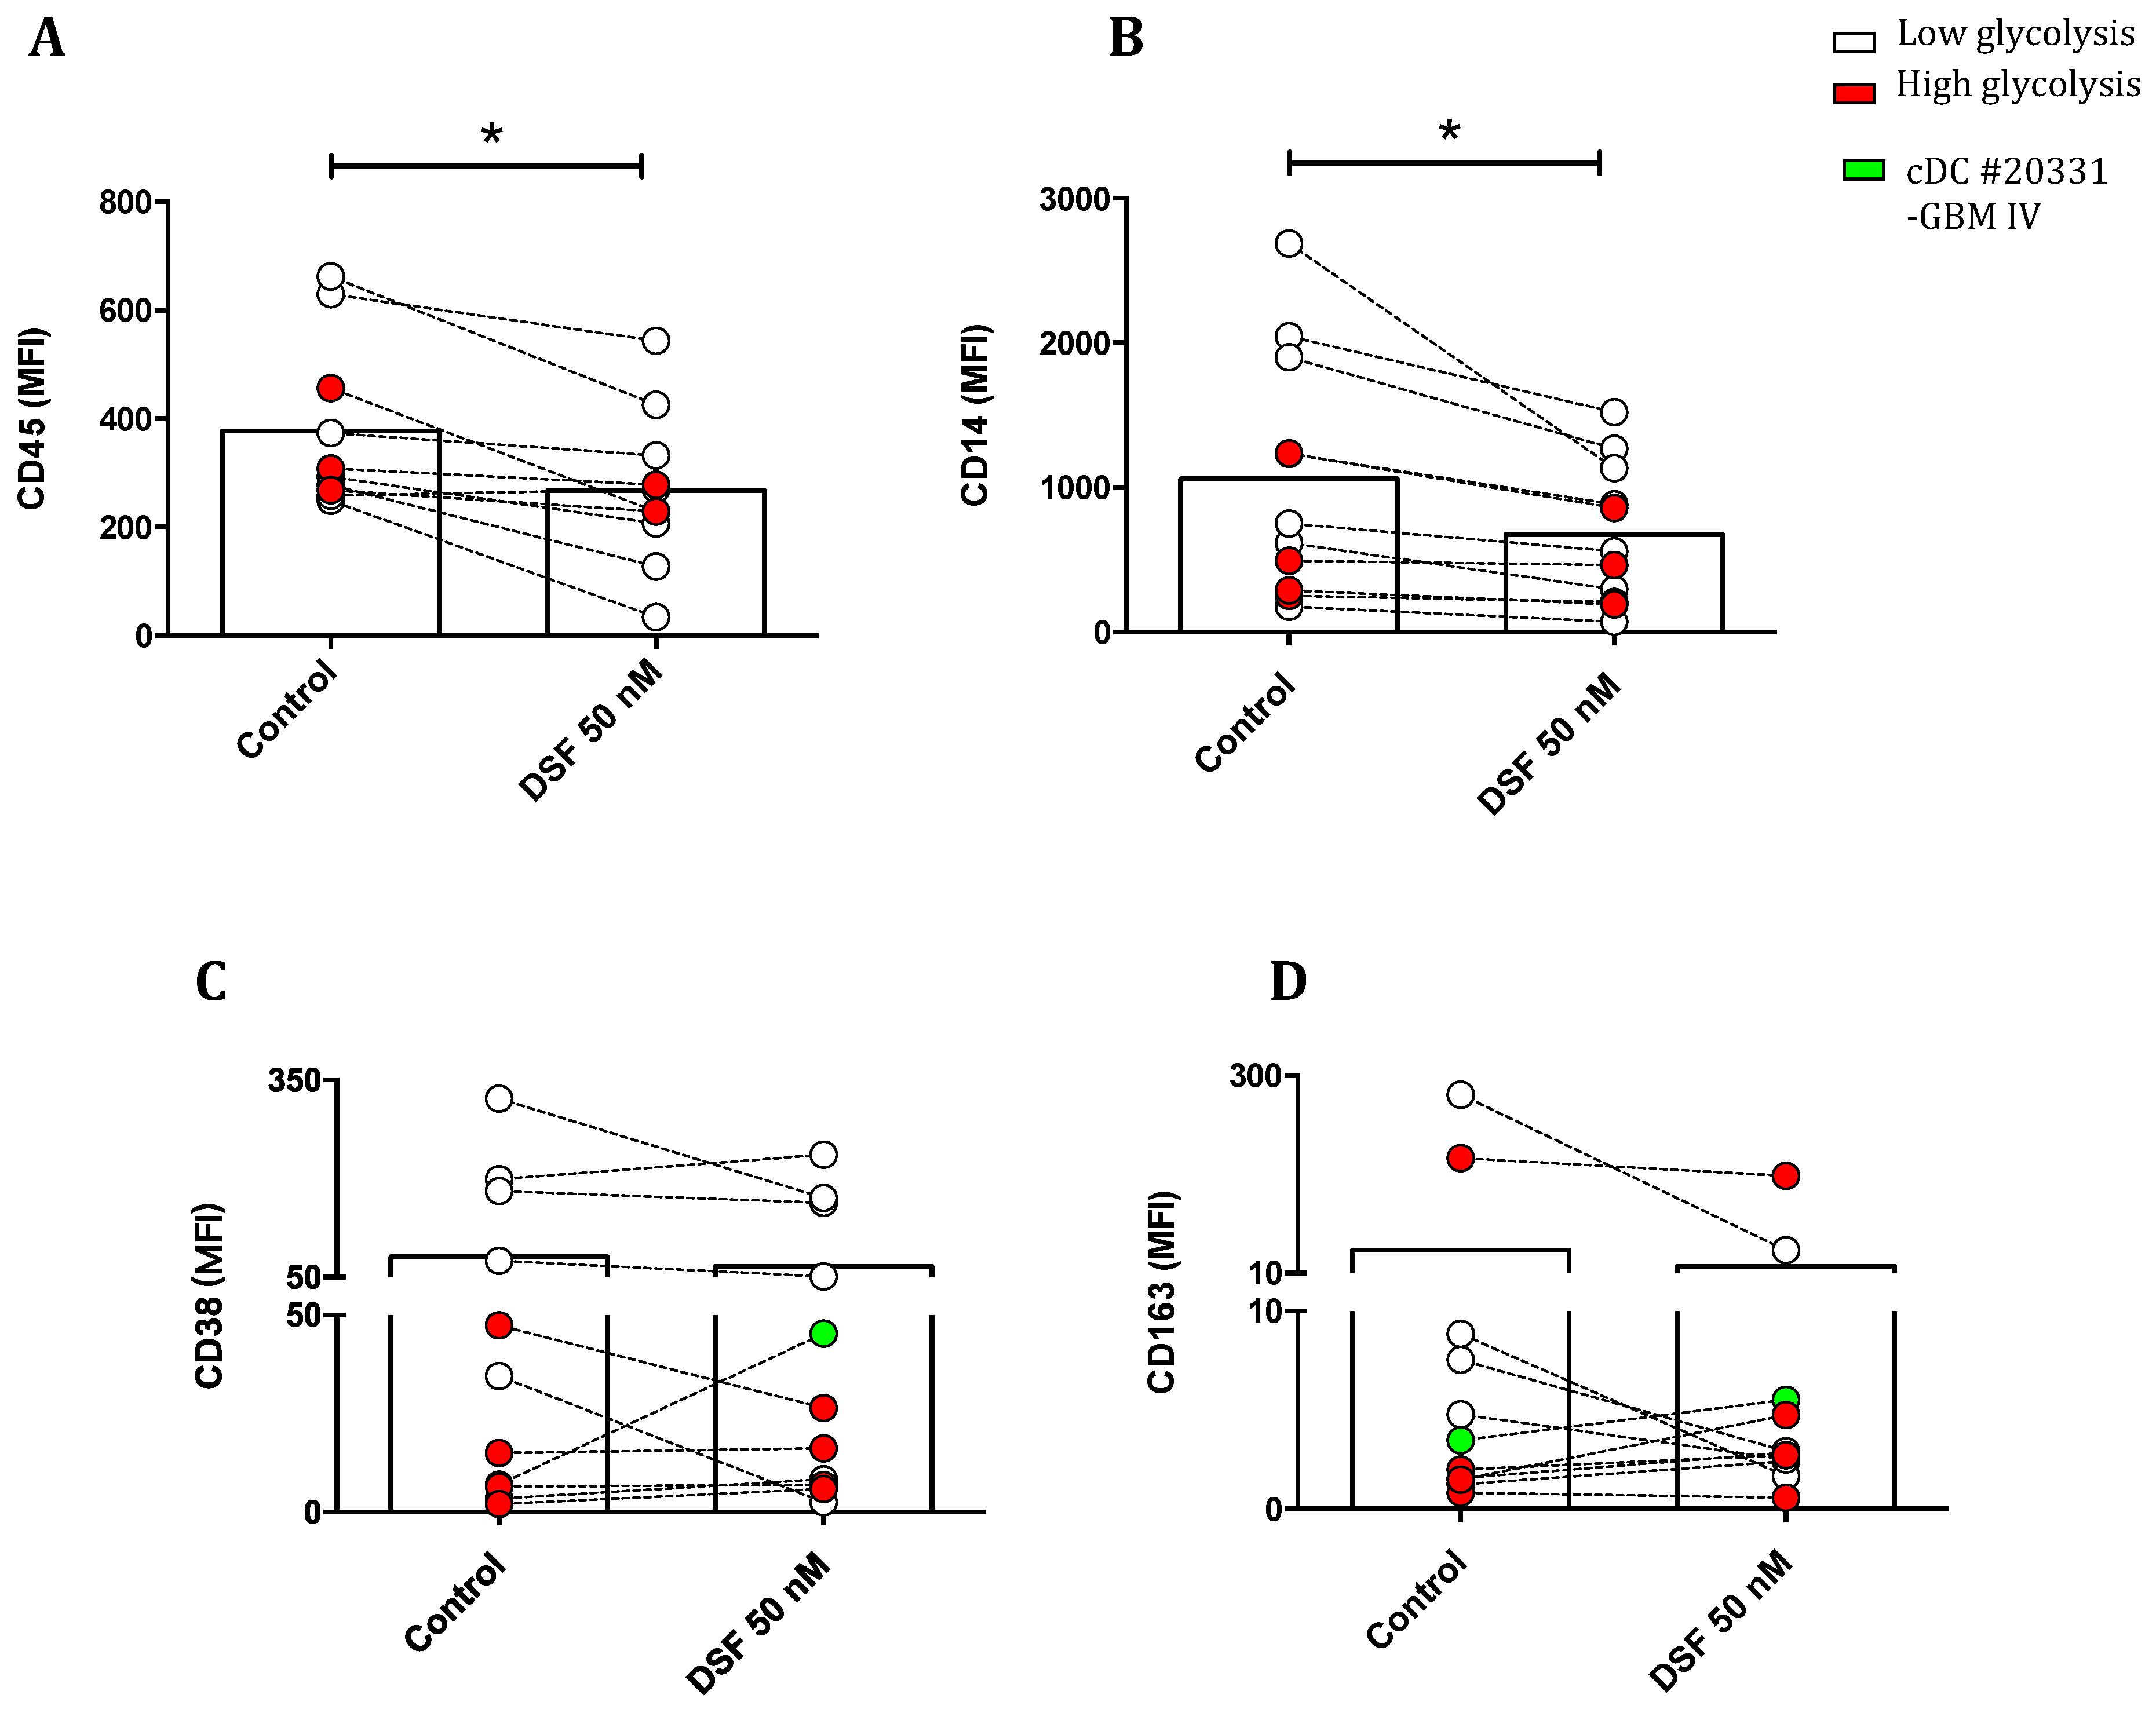
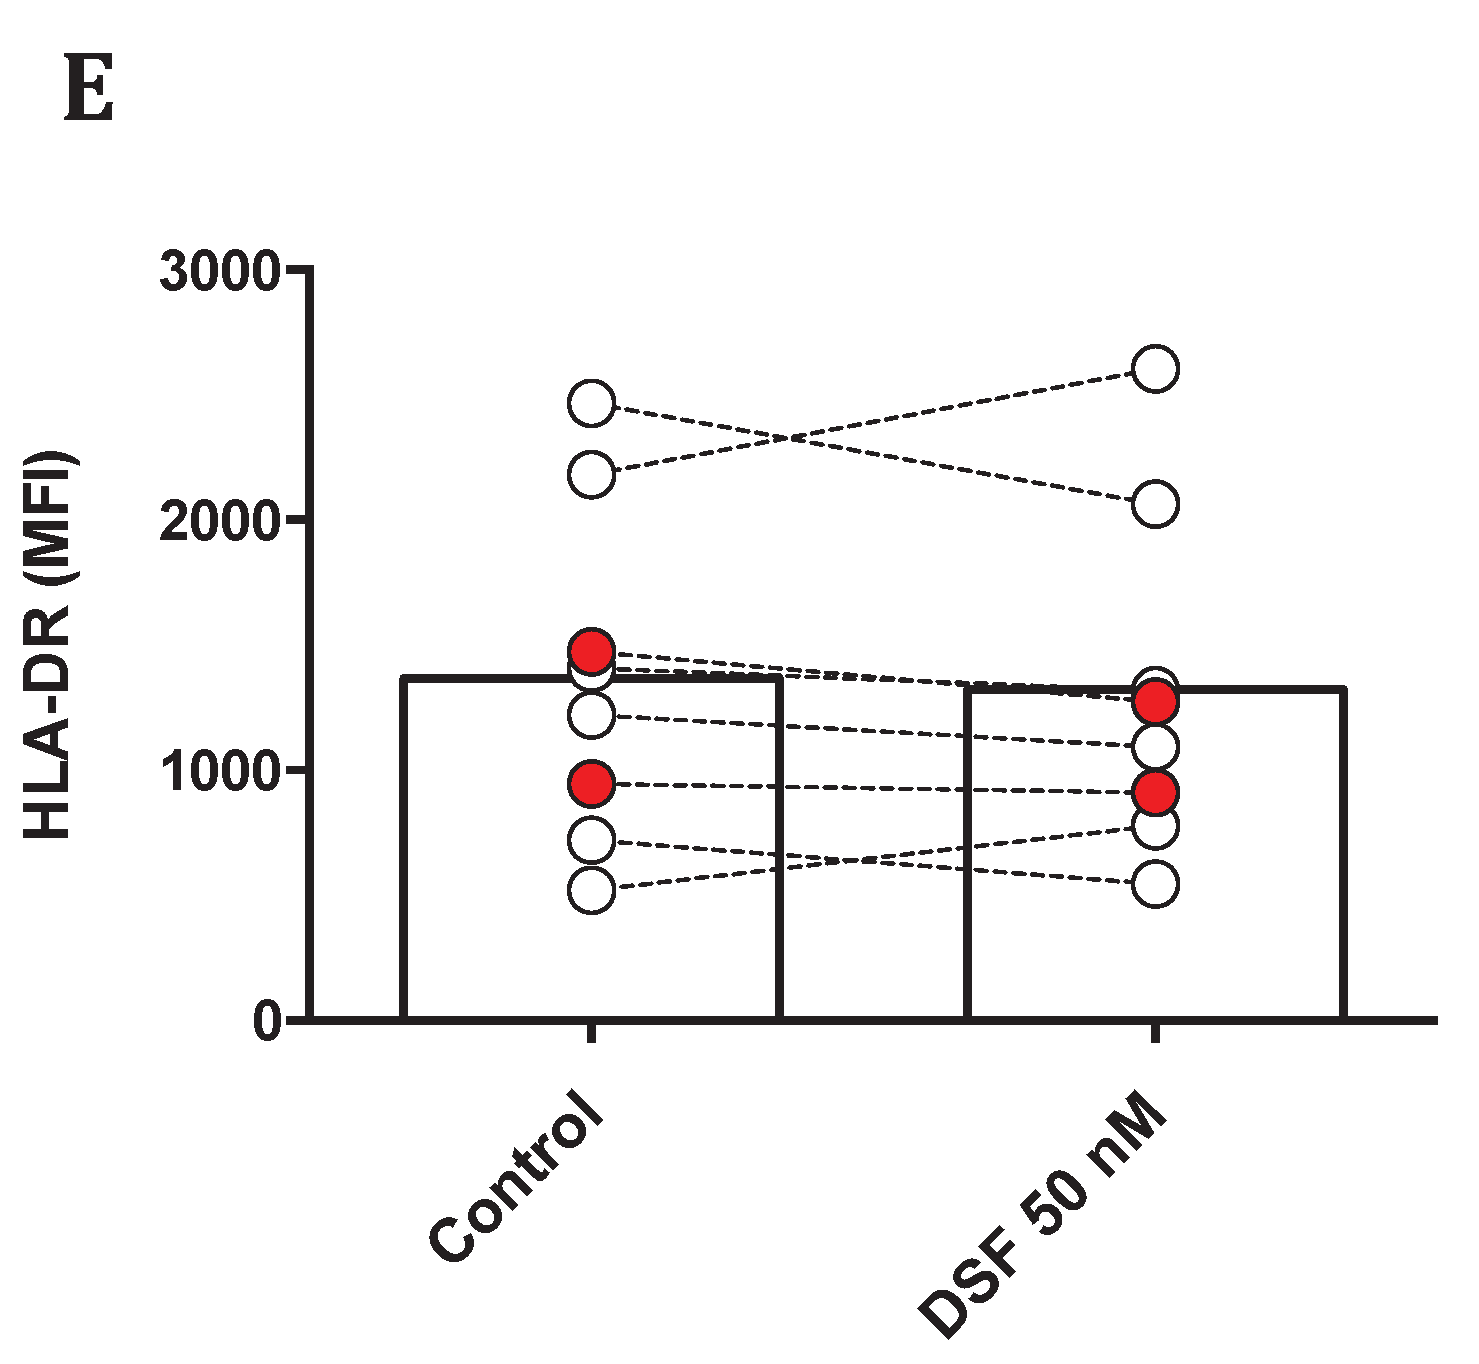

Table 1.
Overview of donors for cultured macrophages in the study.
| PatNo. | Diagnosis | Age | Gender | Phenotype | Exosome |
| 20231 | Xanthogranuloma | 43 | M | cDC (80%), 20% M1) | 21% |
| 20315 | Glioblastoma °IV | 73 | M | iDC | 21% |
| 20331 | Glioblastoma °IV | 66 | F | cDC | 16% |
| 20365 | Pancreatic cancer | 55 | M | M2a | 26% |
| 20373 | COVID-19 infection after stem cell transplantation | 18 | M | M2a | 10% |
| 20643 | Healthy donor | 33 | M | M1 | 5% |
| 20650 | Motor neuron disease | 58 | M | M1+iDC | 1% |
| 20667 | Glioblastoma °IV | 40 | M | M2b+iDC | 2% |
| 20705 | Long-COVID | 20 | F | M2a | 3% |
| 20725 | Borreliosis after DSF treatment | 48 | M | M2a | 2% |
| 21161 | Major depressive disorder | 30 | F | cDC | 10% |
| 21162 | Long-COVID | 32 | M | cDC+M2c | 4% |
| 21163 | Chronic fatigue syndrome | 44 | M | cDC | 17% |
| 21164 | Post VAC syndrome | 43 | F | M2a | 22% |
| 21428 | Prostate cancer | 63 | M | DC-10 | 7% |
M=Male; F=Female; VAC=Vaccine.
Disclaimer/Publisher’s Note: The statements, opinions and data contained in all publications are solely those of the individual author(s) and contributor(s) and not of MDPI and/or the editor(s). MDPI and/or the editor(s) disclaim responsibility for any injury to people or property resulting from any ideas, methods, instructions or products referred to in the content. |
© 2024 by the authors. Licensee MDPI, Basel, Switzerland. This article is an open access article distributed under the terms and conditions of the Creative Commons Attribution (CC BY) license (http://creativecommons.org/licenses/by/4.0/).
Copyright: This open access article is published under a Creative Commons CC BY 4.0 license, which permit the free download, distribution, and reuse, provided that the author and preprint are cited in any reuse.


