1. Introduction
Multiple Sclerosis (MS) is an autoimmune, chronic, inflammatory and demyelinating disease of the Central Nervous System (CNS) [
1].
It is characterized by an erroneous response of the immune system that targets and damages the myelin sheath, a protective layer encompassing nerve fibers in the CNS, leading to demyelination and axonal degeneration. The resultant damage disrupts the transmission of nerve impulses, giving rise to neurological symptoms including muscle weakness, balance and coordination impairments, fatigue, visual impairment, cognitive deficits, and sensory disturbances [
2].
MS is one of the most prevalent neurological conditions worldwide and, in numerous countries, ranks as the foremost cause of non-traumatic neurological disability among young adults (20-40 years), affecting females approximately twice as frequently as males. Globally, it is estimated that MS afflicts 2.8 million individuals, but the prevalence varies across regions, with a prevalence of 111-300 cases per 100,000 people in European and the American region, and a lower prevalence of 5 per 100,000 people in the African and Western Pacific region[
3]. This figure has increased since 2013, when the estimated number of affected individuals stood at approximately 2.3 million. While several factors may have contributed to this rise, such as improved diagnostic methodologies and extended life expectancy among MS patients, the possibility of a substantial elevation in the risk of developing MS cannot be dismissed [
4].
MS is considered to be a multifactorial disorder influenced by both genetic and environmental factors. Extensive genomic investigations have identified more than 200 gene variants associated with a predisposition to MS [
5]. Among these variants, the major histocompatibility complex alleles, particularly the HLA-DRB1 allele, exhibit the most significant association with the disease, carrying the highest risk. Nonetheless, genetic factors alone account for only approximately 30% of the explained risk of suffering MS, with environmental factors assuming considerable prominence. These environmental factors include low levels of vitamin D, obesity, smoking, and infections, notably those involving the Epstein-Barr virus [
6].
Regarding the immune system's involvement, it is postulated that the initiation of MS pathology originates from the activation of T cells that exhibit reactivity against the central nervous system (CNS) within the peripheral immune system. The current hypothesis suggests that soluble CNS antigens present in the cerebrospinal fluid can activate T cells within the cervical lymph nodes. Notably, an important feature shared with other autoimmune diseases is the expansion of epitopes in MS, whereby the immune response directed against one epitope extends to other epitopes and thereby intensifying the autoimmune pathogenic response [
6,
7].
Once infiltrated within the CNS, autoreactive cells undergo reactivation mediated by microglia, dendritic cells, and other resident CNS cells. This reactivation process is essential for the progression of pathology within the CNS [
8]. Notably, a distinctive characteristic of MS is that patients often experience partial or complete recovery following the initial manifestation of symptoms. This phenomenon can be attributed to diverse anti-inflammatory physiological mechanisms, including the apoptosis of inflammatory cells and the production of anti-inflammatory cytokines by the CNS. It is believed that these cytokines act on lymphocytes and antigen-presenting cells (APCs) to suppress inflammation, while microglia fulfill a role in eliminating cellular debris and dead cells. Moreover, although most lesions exhibit signs of remyelination subsequent to the destruction of myelin and axons, oligodendrocytes only partially remyelinate the damaged axons, thus failing to fully restore the original myelin thickness [
6].
The diverse forms of MS share numerous pathological characteristics such as inflammation, axonal degeneration, microglial activation, mitochondrial impairment, accumulation of reactive oxygen species (ROS), and glutamate excitotoxicity [
9].
Axonal degeneration and its subsequent loss occur through various mechanisms, including anterograde and retrograde injury, and trans-synaptic degeneration. Axonal impairment arises in intact axons because of metabolic breakdown produced by compensatory mechanisms which aim to preserve nerve impulse conduction following demyelination. These metabolic breakdowns result in secondary neurodegeneration and axonal loss [
9].
Microglial activation arises as a consequence of demyelination and oligodendrocyte renewal subsequent to oxidative lesion development. The precise role of microglia in neurodegeneration remains a subject of extensive debate. Following demyelination, microglia assume crucial functions in the phagocytic elimination of myelin debris [
10]. Activation of microglia leads to increased production of ROS and nitric oxide, producing a potentially toxic environment for axons. Oxidative damage is amplified by the accumulation of iron, which is released by oligodendrocytes and sequestered by microglia, typically at the periphery of lesions and within deep gray matter structures [
9,
10].
Under the consideration that myelin debris, released during the immune assault, is situated within an oxidative environment, it is logical to think that this debris is prone to oxidation. Moreover, this oxidized debris can then be engulfed by microglia through phagocytosis, triggering proinflammatory response.
This study aims to appraise the viability of BV-2 cells and transdifferentiated microglia from circulating monocytes or induced microglia-like cells (iMG) as an in vitro models for scrutinizing MS, taking into consideration the oxidative milieu of the immune lesion and the presence of oxidized myelin debris. Therefore, the objectives are investigation of the phagocytic response, though examination of their capacity of microglial cells to detect and respond to damaged myelin; to quantify the toxic effects of myelin debris exposure on cell viability and the study the expression of proinflammatory cytokines so as to explore the interplay between microglial cells and oxidized myelin and the spectrum of inflammatory mediators released during this process.
3. Discussion
In this study, we aimed to elucidate the effects of oxidized myelin on cellular processes in microglial models, using both the BV-2 cell line and transdifferentiated monocytes to induced microglia (iMG). Our findings provide insights into the oxidative status of myelin and its impact on cellular pathways related to oxidative stress, phagocytosis, and inflammatory responses.
3.1. Oxidative Modification of Myelin
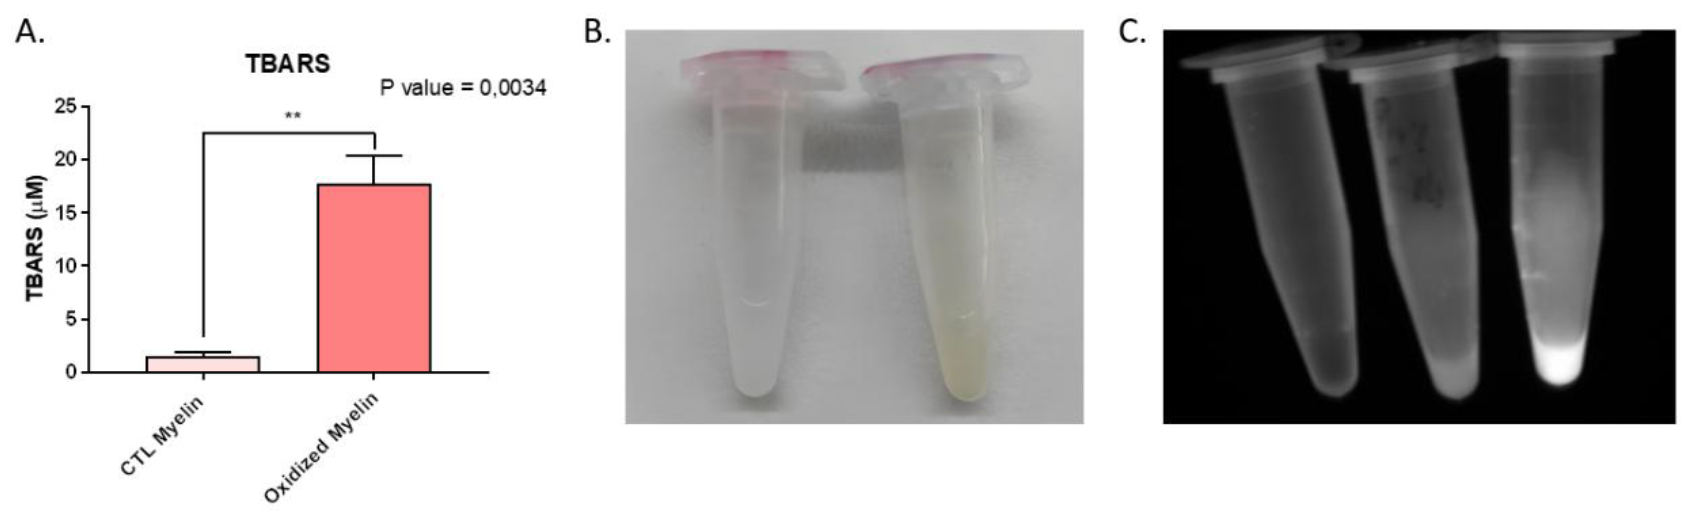
The successful oxidation of myelin, as confirmed by TBARS assay, distinct coloration, and increased autofluorescence, underscores its utility in mimicking the lesional environment in multiple sclerosis (MS). The significant increase in malondialdehyde (MDA) content in oxidized myelin aligns with previous studies indicating lipid peroxidation as a hallmark of oxidative stress in neurodegenerative conditions. The observed autofluorescence, likely due to compounds such as lipofuscin, further corroborates the oxidative modifications. These findings establish oxidized myelin exposure to reproduce lesional environments in demyelinating and neurodegenerative diseases, including MS [
11,
12,
13,
14].
3.2. Cellular Viability and Inflammatory Profile
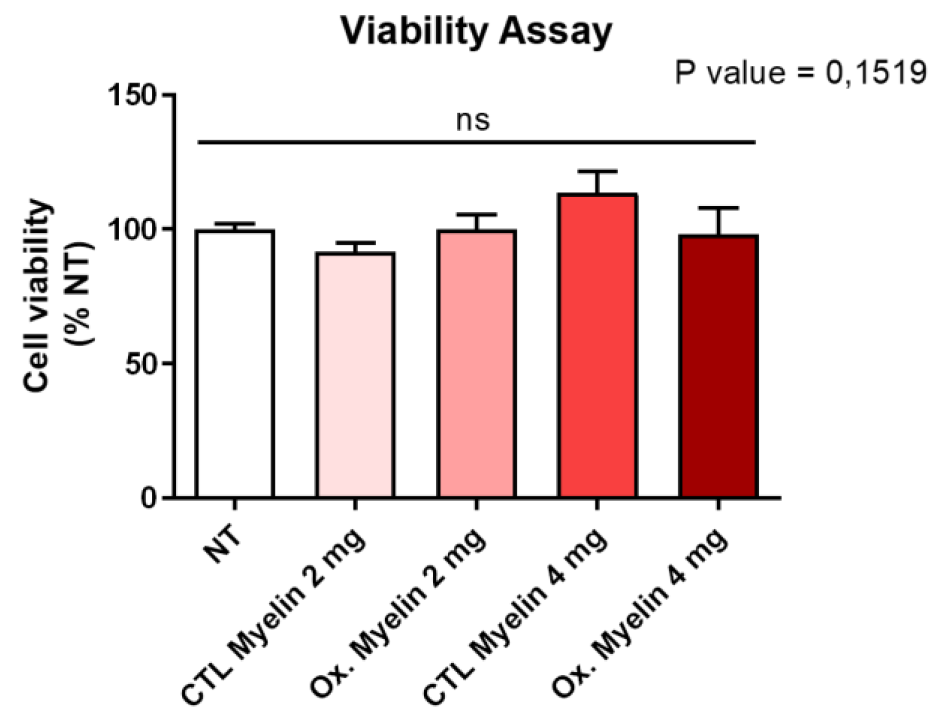
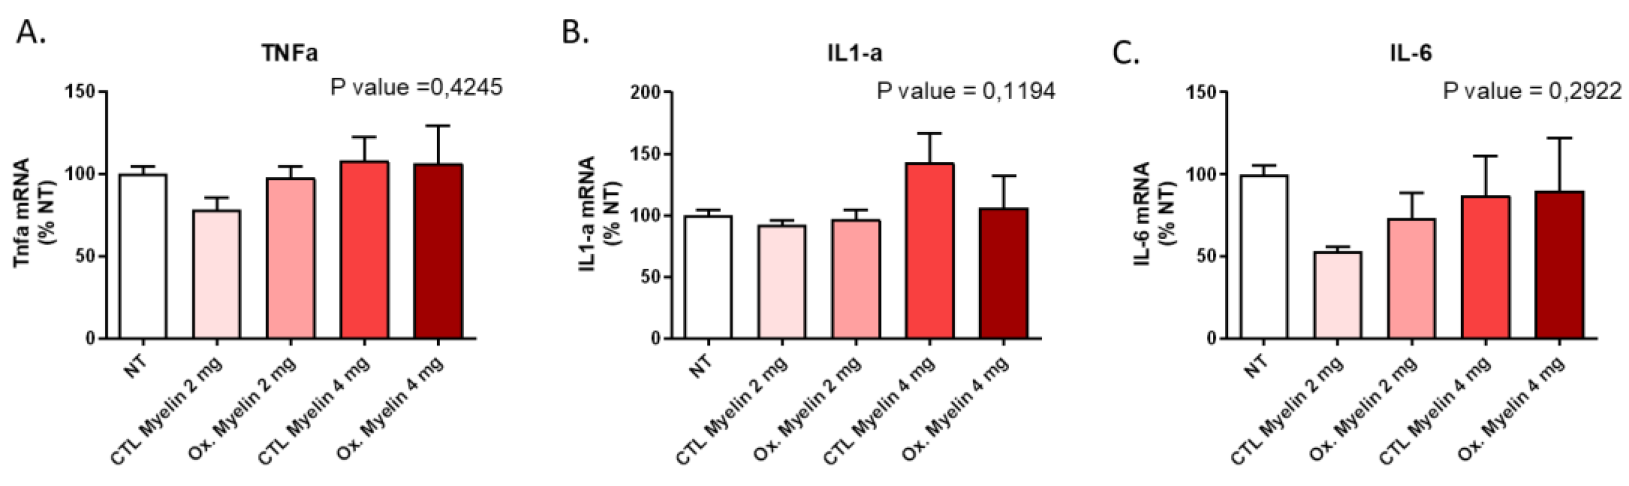
Our results demonstrate that neither the dose nor the oxidative status of myelin significantly altered BV-2 cell viability after 24 hours. This suggests that microglial survival is not compromised under these conditions, enabling us to investigate downstream effects without confounding factors related to cell death. Furthermore, the lack of significant changes in pro-inflammatory cytokine expression (TNF-α, IL-1α, and IL-6) indicates that myelin exposure alone does not elicit a pro-inflammatory response in BV-2 cells. These findings contrast with the pro-inflammatory milieu observed in MS lesions [
15], suggesting that additional factors, such as other immune cells or extracellular signals, may be required to induce such responses.
3.3. Oxidized Myelin and Cellular Pathways
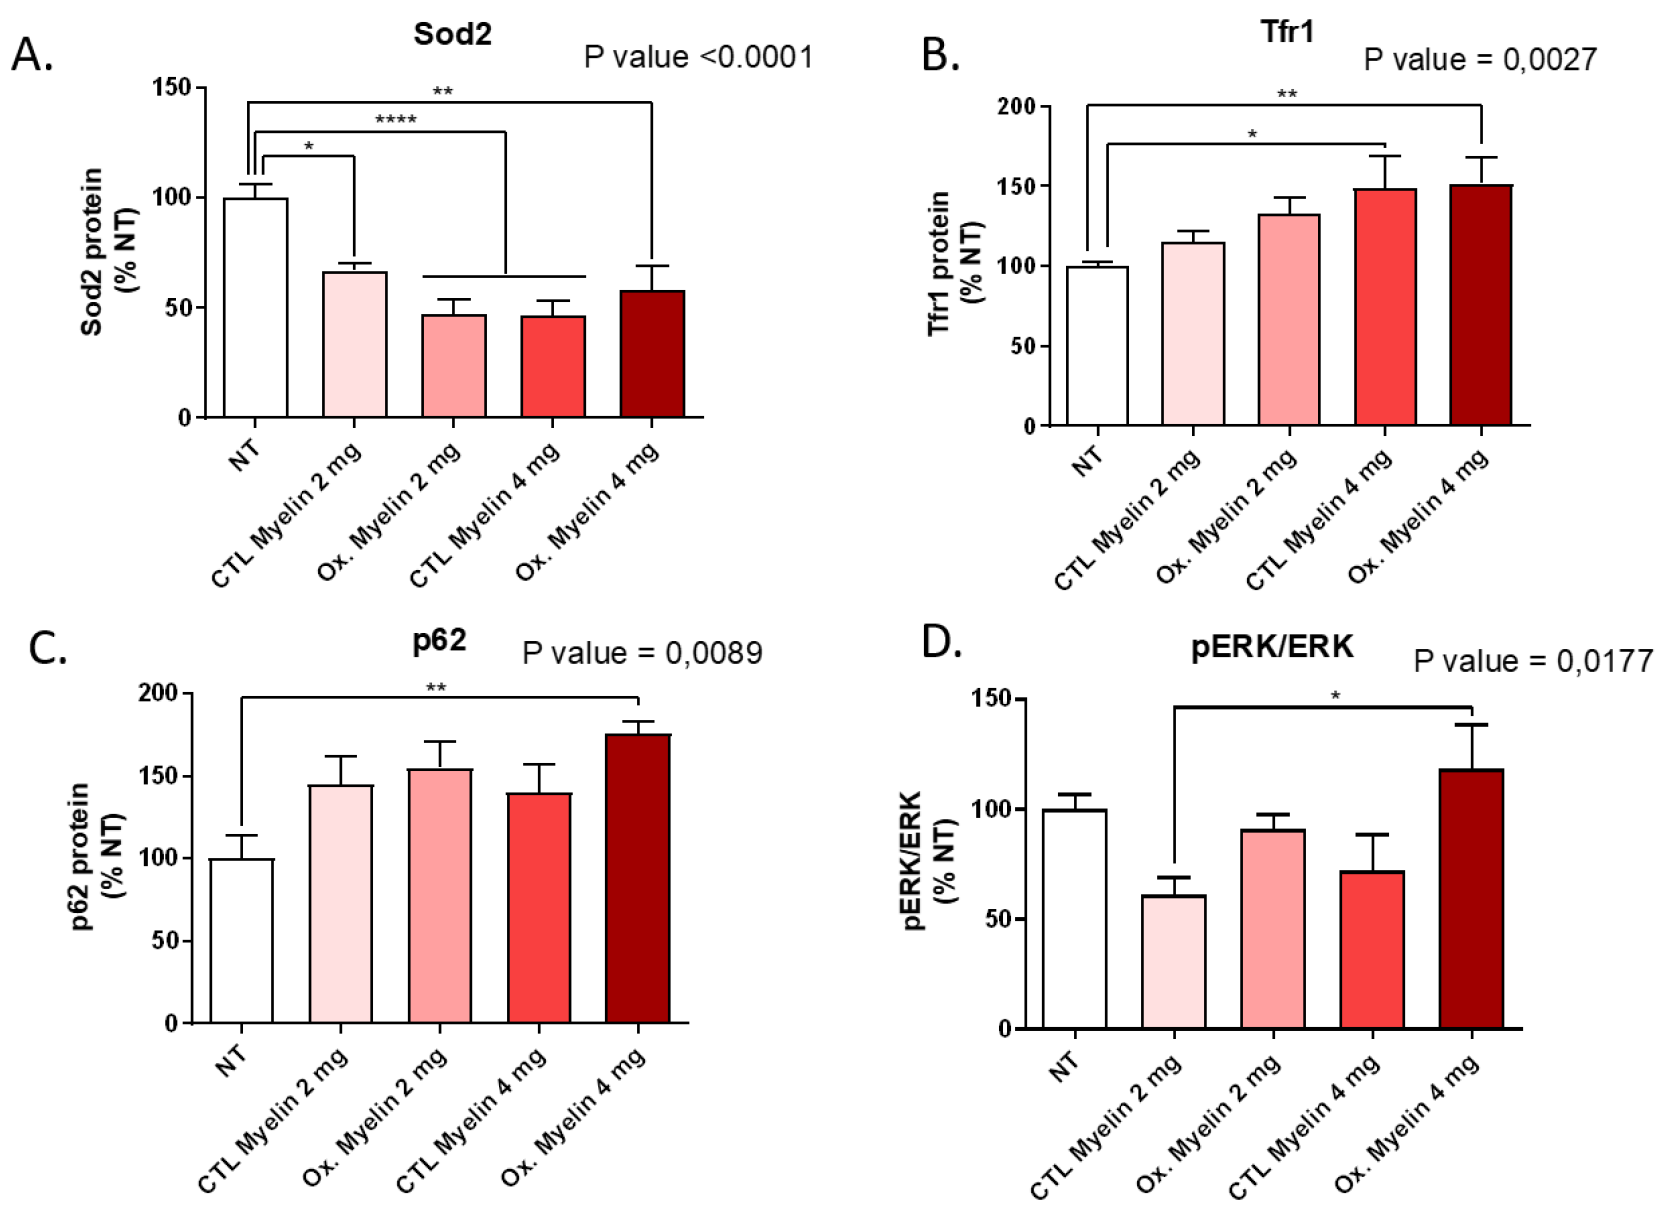
Western blot analyses revealed notable alterations in oxidative stress markers, autophagy-related proteins, and iron metabolism regulators upon myelin exposure. Reduced levels of Sod2 in treated groups suggest a potential impairment in mitochondrial antioxidant defenses, which may be exacerbated in the presence of oxidized myelin. The upregulation of Tfr1 in treated groups highlights the role of iron metabolism in microglial responses, consistent with the known association between iron dysregulation and MS pathology. Increased levels of p62 further implicate autophagy in the processing of myelin debris, particularly oxidized myelin. These findings indicate that oxidized myelin influences key cellular pathways related to oxidative stress [
16], iron homeostasis -and potentially ferroptosis [
17], and autophagy [
18], which may contribute to microglial dysfunction in MS.
3.4. Enhanced Phagocytosis of Oxidized Myelin
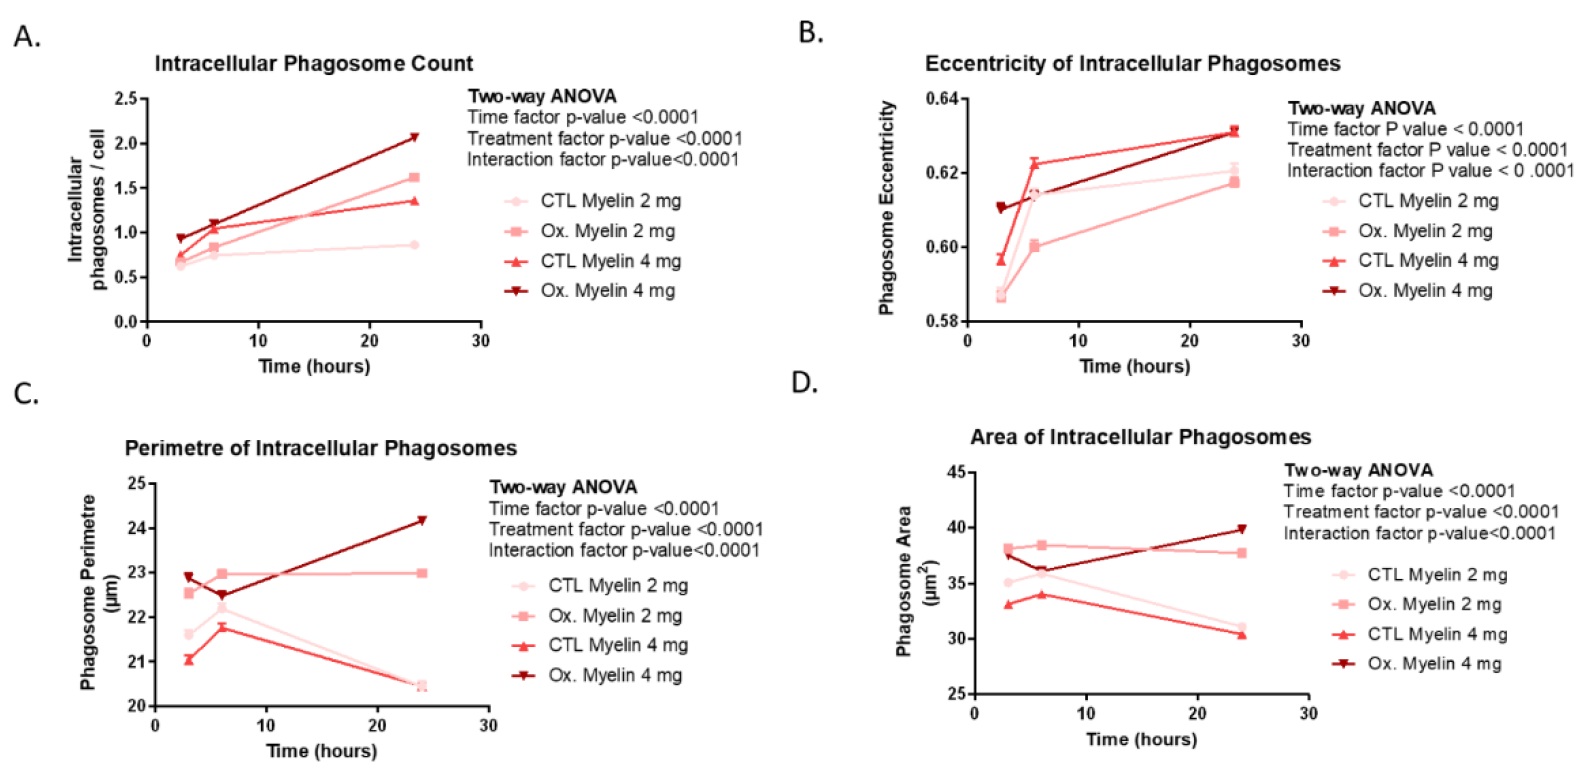
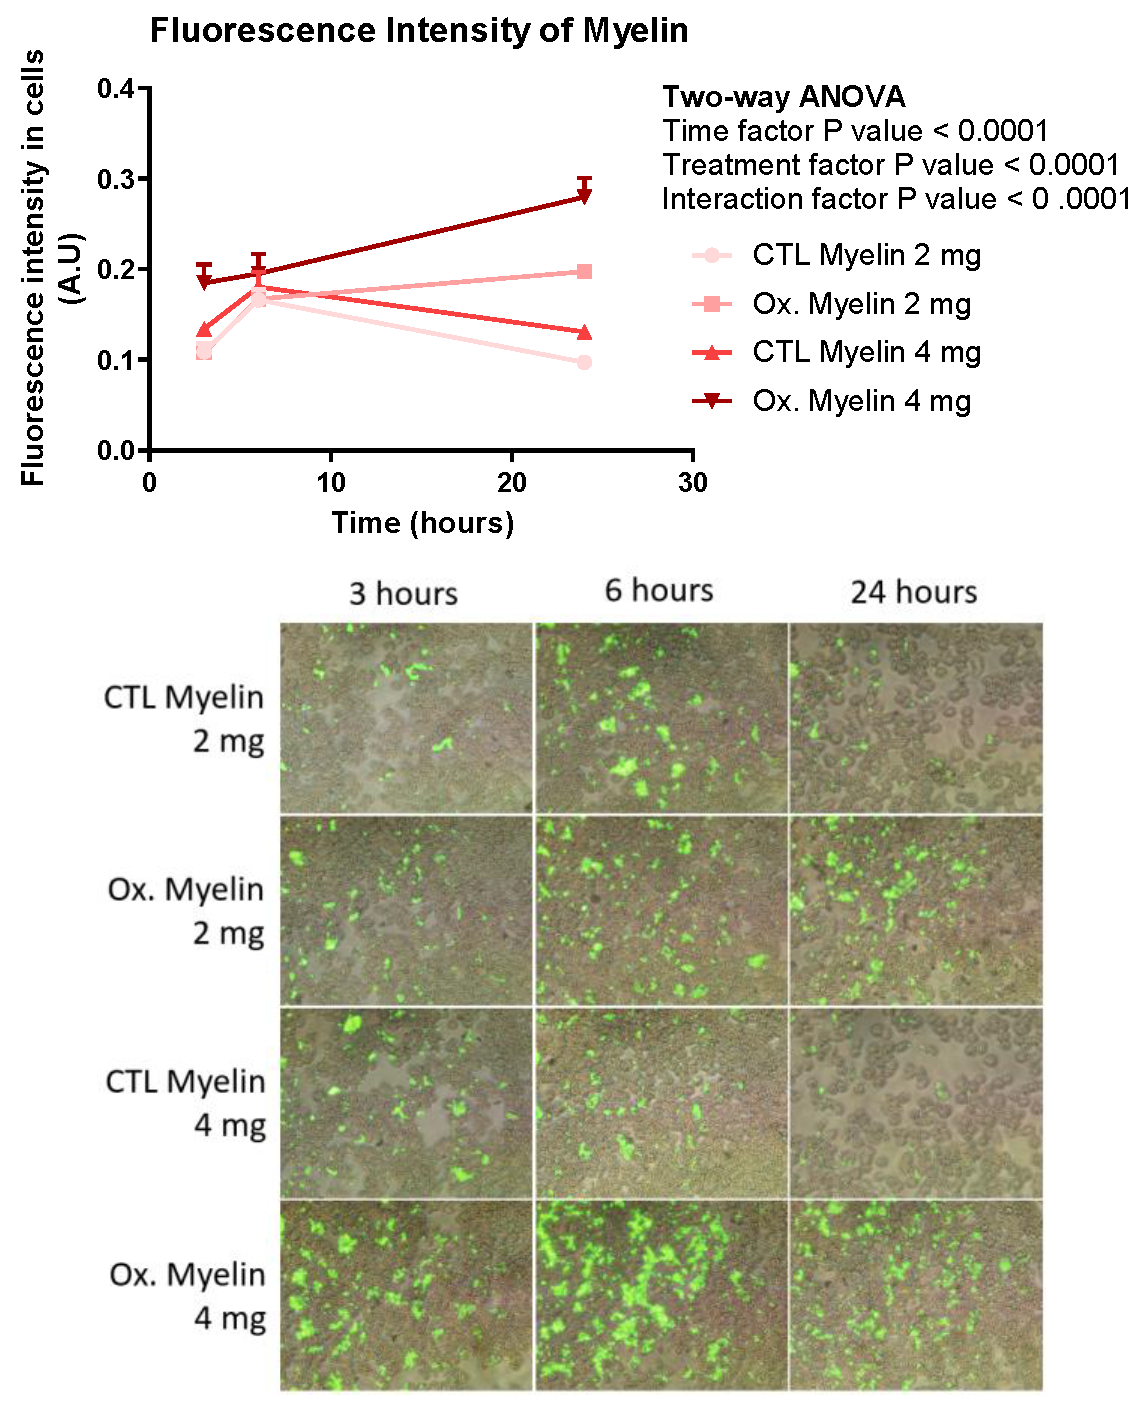
Our phagocytosis assays revealed significant differences in the processing of oxidized versus control myelin over time. BV-2 cells exhibited a greater number of intracellular phagosomes, as well as increased fluorescence intensity, perimeter, and area of phagosomes, particularly in response to oxidized myelin. These findings suggest that oxidized myelin is more readily internalized and processed by microglia. Interestingly, the changes in phagosomal eccentricity indicate structural alterations, which may reflect differences in the dynamics of phagosome maturation and cargo degradation. The increased fluorescence intensity in oxidized myelin-treated groups further supports its prolonged retention and metabolic activity within microglial cells.
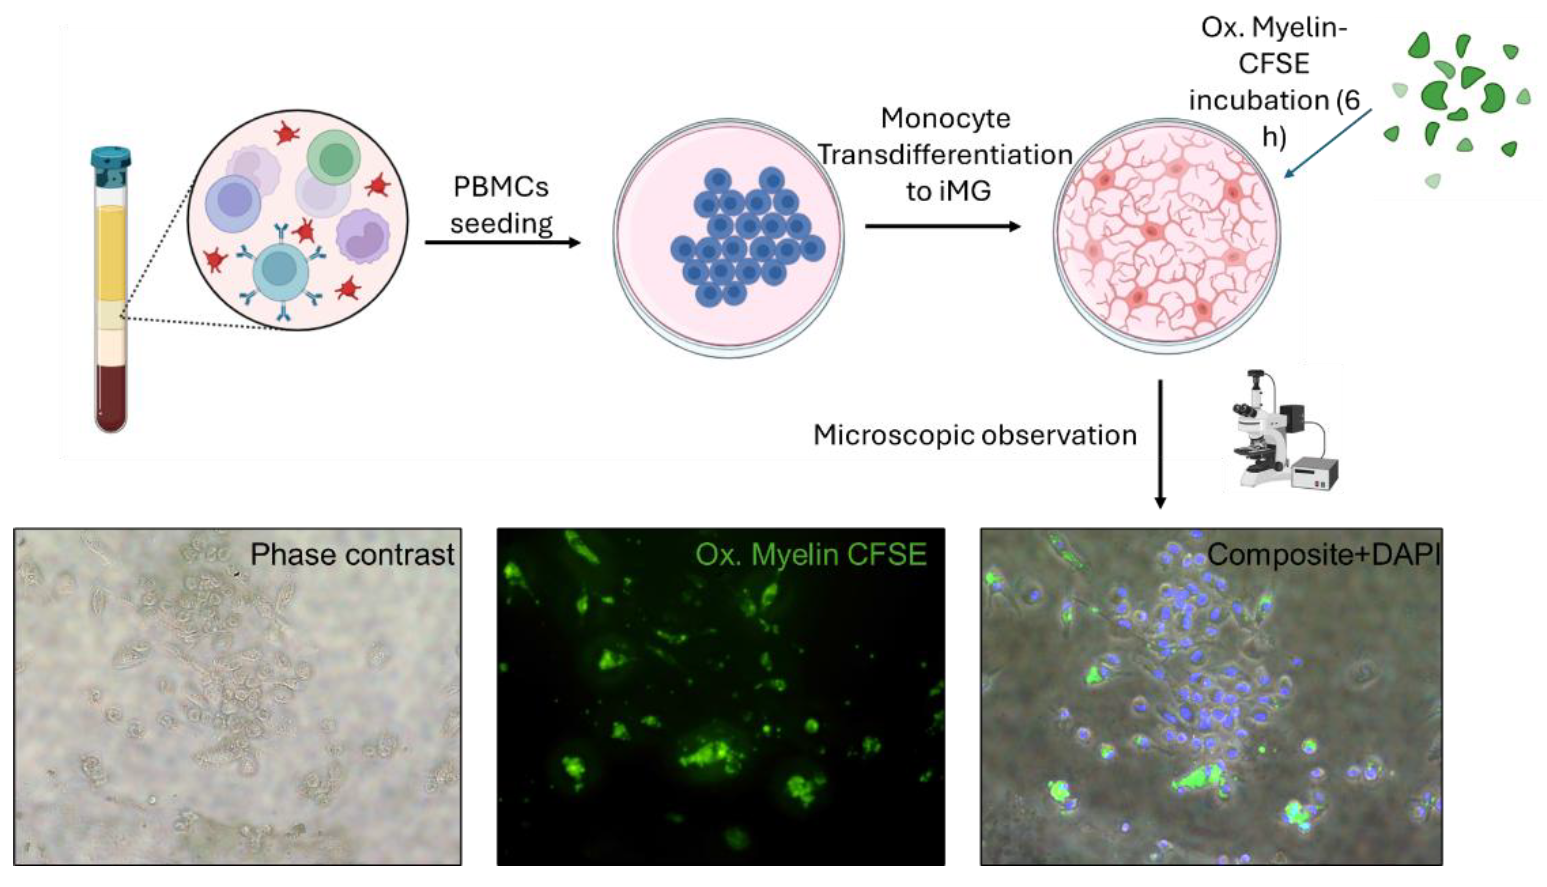
3.5. Insights from the iMG Model
The use of transdifferentiated monocytes (iMG) provided additional validation of our findings in a model more representative of human microglia. The higher number and diffuse distribution of intracellular myelin granules in iMG cells, compared to BV-2 cells, suggest enhanced phagocytic capabilities in the iMG model. These observations align with the physiological role of microglia in clearing myelin debris and underscore the importance of using primary cell-based models to obtain an individualized response to myelin processing. Previous studies using this model showed that these cells recapitulate fundamental alterations in ALS, including a shift towards a proinflammatory profile and protein aggregation associated to the severity of each patient [
19]. In our case, we add the (oxidized) myelin treatment for the first time and we postulate this model as a source of information on microglial activity that might be also associated with disease progression of MS patients.
3.6. Implications and Future Directions
The distinct cellular responses to oxidized myelin observed in this study have several implications for understanding MS pathology. The enhanced phagocytosis and altered oxidative stress markers suggest that oxidized myelin may contribute to microglial activation and dysfunction, potentially exacerbating neuroinflammation and neurodegeneration. Additionally, the lack of a robust pro-inflammatory response in BV-2 cells highlights the need to investigate the interplay between microglia and other cell types in the MS environment. Future studies could explore the impact of oxidized myelin on other microglial functions, such as cytokine secretion, synaptic pruning, and neurotrophic support.
In conclusion, our study provides a comprehensive analysis of the effects of oxidized myelin on microglial models, revealing key alterations in oxidative stress, autophagy, and phagocytosis. These findings contribute to our understanding of microglial responses to myelin debris in MS and pave the way for future investigations into individualized response to oxidized myelin exposure mimicking the lesional environment in MS.
4. Materials and Methods
4.1. Extraction and Oxidation of Myelin Debris
The myelin debris was extracted according to the protocol described in [
20], with some modifications. Tris·Cl Buffer solution was prepared by adding 20 mL of 1 M Tris·Cl and 20 mL of 100 mM Na2EDTA to 800 mL of distilled deionized water (ddH2O). The pH was then adjusted to 7.45, and the total volume was brought up to 1 L. This was utilized to prepare two sucrose solutions: one with a concentration of 0.32 M and the other with a concentration of 0.83 M.
The next step was euthanizing six mice, extracting their brains, and submerging them in 30 mL of the 0.32 M sucrose solution. Using a sterile hand-held rotary homogenizer, the brains were thoroughly homogenized. The homogenized brain solution was brought to a final volume of 90 mL by adding the 0.32 M sucrose solution. Ultracentrifuge tubes were loaded with 20 μL mL of the 0.83 M sucrose solution, onto which the homogenized brain solution was gently layered to create a density gradient. These tubes were then subjected to a centrifugation process, set at 100,000 x g for 45 minutes at a constant temperature of 4 ºC, employing minimal acceleration and deceleration. As a result, the myelin formed a visibly distinct whitish interface, which was collected and transferred to a 50 mL tube. The volume was adjusted to 35 mL using Tris·Cl Buffer to ensure thorough and effective mixing. The suspension was homogenized once again. The centrifugation process was repeated, this time utilizing the maximum acceleration and deceleration settings, to effectively precipitate the myelin debris. The supernatant was discarded, leaving behind a pellet of myelin debris. This pellet was then resuspended in 10-15 mL of Tris·Cl solution. To further enhance the purification, the myelin was subjected to another round of centrifugation under the exact same conditions, resulting in a pellet that was subsequently resuspended in 5-6 mL of sterile HBSS, ensuring optimal purity.
The myelin debris suspension was divided among several pre-weighed 1.5 mL microcentrifuge tubes. These tubes were then subjected to centrifugation at 22,000 xg for 10 minutes at 4 ºC. After the completion of centrifugation, the supernatant was removed, and the myelin pellet was weighed. To create a control sample consisting of non-oxidized myelin debris, the pellet from half of the tubes was diluted to a concentration of 100 mg/mL using HBSS solution. On the other hand, to generate oxidized myelin debris we modified and existing protocol [
21], the remaining tubes were resuspended using 50 μL of CuH (800 μM), CuSO
4·6H
2O, and 20 mM H
2O
2. Following an incubation period of 16 hours at 37 ºC, the tubes were subjected to another round of centrifugation at 22,000 x g for 10 minutes at 4 ºC. The resulting pellet was then resuspended using HBSS solution to achieve a final concentration of 100 mg/mL.
4.2. Labeling of Myelin Debris
The fluorescent dye carboxyfluorescein succinimidyl ester (CFSE) was used to label the myelin debris [
20]. This dye has a non-cytotoxic nature, allowing for the monitoring of myelin debris internalization by the BV-2 cells following treatment. Furthermore, CFSE exhibits a narrow fluorescent spectrum, facilitating its simultaneous use with other fluorescence assays. For labelling, a 50 µM CFSE solution was prepared immediately before use, using HBSS to dilute the stock solution.
The myelin debris, previously obtained at a concentration of 100 mg/mL (oxidized and non-oxidized), was transferred to a pre-weighed 1.5 mL microcentrifuge tube. The tube was then centrifuged for 10 minutes at 4°C and 14,800 x g. After discarding the supernatant, the resulting pellet containing the myelin debris was resuspended using 200 μL of CFSE solution for every 100 μL of pellet. The mixture was incubated for 30 minutes at room temperature, protected from light exposure. Following this incubation period, the tube was once again centrifuged under the same conditions, and the supernatant was discarded once again. To cleanse the labelled debris, the pellet was resuspended in 600-800 μL of a wash buffer (100 mM glycine in HBSS). This centrifugation and washing process was repeated twice more. Finally, the weight of the myelin debris pellet was determined, and it was resuspended at a concentration of 100 mg/mL using sterile HBSS.
4.3. Cell Cultures and Administration of Treaments
For this study BV-2 cell line was used. BV-2 cells are an immortalized cell line derived from microglial cells obtained from C57/BL6 mice. This cell line, commercially obtained from AcceGen Biotech (Cat ABC-TC212S), exhibits a remarkable capacity for proliferation and metabolic activity, surpassing that of other microglia. Additionally, like other microglia, this cell line can be activated to release pro-inflammatory cytokines when exposed to inflammatory factors or oxidative stress. Consequently, the BV-2 cell line serves as an outstanding alternative model system for investigating primary microglia and studying neurodegenerative diseases in vitro [
22].
Induced Microglia-Like Cells (iMGs) were obtained as previously described [
23,
24]. Briefly, PBMCs were extracted using Ficoll density gradient (10771, Merck) from one subject without clinical symptoms. Isolated PBMCs were seeded onto a pre-coated 12-well plate with 2% Geltrex (1 M PBMCs per well) in RPMI-1640 10% FBS media for 1 day. The following day, medium was replaced by differentiation medium containing RMPI-1640, 0.1 μg/ml IL-34, 0.01 μg/ml GM-CSF, for 14 days, changing the media every 2-3 days.
The BV-2 cell line was cultured in culture dishes with DMEM High Glucose medium supplemented with L-glutamine, pyruvate, 10% fetal bovine serum, and antibiotic-antimycotic. Passages were performed every 2-3 days when confluence reached 70-80%. The incubator maintained a temperature of 37 ºC and a CO2 concentration of 5%. For the treatments, 250,000 cells were seeded per well (in 1 mL of medium) in four 12-well plates with twelve wells each, using the same medium. The cells were allowed sto grow for 2-3 days until reaching a confluence of 70-80%. Before applying the treatment, the medium was changed to DMEM High Glucose supplemented with L-glutamine, pyruvate, and antibiotic-antimycotic (without fetal bovine serum). If the myelin debris had been stored at -80 ºC, it was resuspended 4-5 times using a 0.5 x 16 mm needle and vigorously agitated before adding it to the cells.
Three replicates with 2 or 4 mg/ml of myelin debris (whether oxidized or non-oxidized) were employed. These plates were used for viability assays, protein quantification, and the study of proinflammatory cytokines. The labelled myelin debris was applied at different time points for each row of wells (3, 6, and 24 hours).
4.4. Viability Assay
The viability study was conducted using PrestoBlue reagent (P50200, Thermo Fisher Scientific). PrestoBlue is a viability indicator that leverages the reducing capacity of living cells metabolism to convert the non-fluorescent dye resazurin (with a blue colour) into the fluorescent molecule resorufin (with a pink color). To prepare the PrestoBlue solution, 1 mL of the reagent was diluted in 12 mL of DMEM High Glucose medium supplemented with L-glutamine, pyruvate, and antibiotic-antimycotic. The medium in the plate was replaced with this solution, and then it was incubated for one hour in an incubator. After incubation, the fluorescence was measured using a fluorescence-based microplate reader. Nine readings were taken for each well, and the average of these readings was calculated for further statistical analysis. The obtained averages were normalized using the average fluorescence of the untreated wells and thus expressed as % NT (normalized to control). For statistical analysis, a one-way ANOVA was performed using GraphPad Prism 8.0.2 software. This entire process was repeated four times to ensure robustness and reliability of the results, and a p-value < 0.05 were considered significant.
4.5. Protein Expression
Firstly, the cells were harvested from the culture plate using a lysis buffer composed of RIPA supplemented with protease inhibitors (78429, Thermo Fisher Scientific), 1mM Na3VO4, and 1mM NaF to inhibit phosphatases.
The cells were initially washed with PBS, followed by the addition of 100 μL of the lysis buffer. Using a cell scraper, the adherent cells were gently detached and collected in 1.5 mL tubes placed on ice and sonicated. After extraction, the protein content in each sample was quantified using the Bradford protein assay following manufacturer’s instructions (#5000006, Bio-Rad). 15 μg of protein were loaded into SurePAGE™ precast gels (Bis-Tris, 10x8, 4-12%, 15 wells, Genscript) and Tris-MOPS-SDS running buffer was employed for electrophoretic separation.
Following electrophoresis, the proteins were transferred onto PVDF membranes employing an eBlot™ Protein Transfer System (Genscript). Membranes were blocked with IBlock (T2015, Thermo Fisher Scientific) and incubated overnight with the primary antibodies (
Table 1) in TBS-T buffer, followed by 3 washing steps with TBS-T, an incubation with secondary antibodies: -anti-Rabbit IgG (31460, Invitrogen, at dilution 1:40,000) or anti-Mouse IgG (NA931, MERCK, at dilution 1:40,000). After 4 washes with TBS-T, membranes were revealed using Immobilon ECL Ultra Western HRP Substrate (WBULS0100, Merck). Images were captured using the ChemiDoc XRS+ System (Bio-Rad), and subsequently stained with Coomassie membrane stain. Band intensities were quantified using the ImageLab software, and the values were normalized based on the protein expression obtained from the membrane stain. The normalized values were expressed as % NT (normalized to control), using the average of the NT values as the reference set at 100%. Statistical analyses were performed using one-way ANOVA in the GraphPad Prism 8.0.2 software. The entire process was repeated four times to ensure the robustness and reliability of the results.
4.6. Study of Proinflammatory Cytokines
After treating the cells, two washes were performed using HBSS, followed by the addition of 500 μL of TRIReagent (TR 118, MRC) and collected in 2 ml tubes. 100 μL of chloroform was then added. After agitation, the mixture was left to settle at room temperature for five minutes and then centrifuged at 13,000 x g at 4°C for 15 min. RNA is separated in the upper (aqueous) phase. The upper phase was carefully collected and transferred to 1.5 mL tubes, to which 250 μL of isopropanol were added. After vortexing, the mixture was left to rest for 10 minutes at room temperature and then centrifuged at 13,000 xg for ten minutes at 4 °C. The purpose of isopropanol is to precipitate the RNA, and therefore, the supernatant was discarded. Next, 500 μL of 75 % ethanol (in RNAse-free water) was added to the pellet, followed by vortexing and centrifugation for five minutes at 13,000 xg at 4 °C. The ethanol was carefully removed, and after allowing it to evaporate for a 5 min at RT, the RNA was resuspended in 20 μL of RNAse-free water. Once the RNA was isolated, a Nanodrop device was used to quantify the RNA content in each sample The samples were then diluted to a concentration of 100 nμg/μL in a final volume of 10 μL using RNAse-free water.
The expression of proinflammatory cytokines (TNF-α, IL-1a, and IL-6) and actin as a reference gene was studied. Reverse transcription PCR (RT-PCR) was performed in order to obtain cDNA (N8080234, Thermo Fisher Scientific). This cDNA was then used in a quantitative PCR (qPCR) using SYBR Green. The SYBR Green dye binds to the double-stranded DNA, increasing its fluorescence emission and allowing for quantification. Each sample was analyzed (with duplicates) on a 96-well plate. The results obtained from the qPCR were analyzed using qPCR Analysis system (CFX96, Bio-Rad). The cycle threshold (Ct) values were obtained, which represent the number of amplification cycles required for the fluorescence signal to reach a detectable threshold. The relative expression of the target genes (TNF-α, IL-1a, and IL-6) was calculated using the 2-ΔCt formula, where ΔCt is the difference between the Ct values of the target gene and the reference gene, actin. This expression was presented as %NT, with 100 % representing the average of the NT values. Statistical analysis was performed using one-way ANOVA with GraphPad Prism 8.0.2 software. This entire process was repeated a total of three times.
4.7. CFSE Assay
The cells were treated during the indicated schemes and then fixed by adding 1 mL of 4 % paraformaldehyde in PBS to each well and incubating at room temperature for 30 minutes. Since CFSE allows simultaneous staining with other dyes, a staining with DAPI is performed. The cells are washed 1-3 times with PBS and then covered with a sufficient amount of DAPI staining solution (R37606, Thermo Fisher Scientific). After incubating for 5 minutes, protected from light, the cells are washed again with PBS.
Next, the cells are visualized using a fluorescence microscope. Considering the excitation/emission wavelengths of 358/461 nm for DAPI and 492/517 nm for CFSE, images are taken at ten distinct positions within each well, capturing three images for each position: DAPI fluorescence, CFSE fluorescence, and a phase-contrast image. The NT wells from the other procedures are also observed to ensure there is no fluorescence in them. The obtained images are analyzed using the Cell Profiler software. A pipeline is created, utilizing the nuclei detected by DAPI fluorescence to locate the cells. Phagosomes are also identified, and the RelateObjects module is used to identify intracellular phagosomes. Modules are developed to count these intracellular phagosomes, measure their area, perimeter, and eccentricity, and analyze the fluorescence intensity of CFSE-labeled myelin. This provides results on a per-cell basis.
For the myelin intensity analysis, ten values corresponding to the average intensity of each CFSE image are obtained for each condition and time point. The ten replicates (per condition and time) are statistically analyzed using a two-way ANOVA. Regarding perimeter and area measurements, the values are initially in pixels. To convert them to nanometers (nm), an image with a known scale in nm, captured under the same microscope and objective conditions, is used. This conversion is applied to both perimeter and area values. Given the large amount of data for area, perimeter, eccentricity, and intracellular phagosome counts, GraphPad software is employed to obtain sample size, mean, and standard deviation for each condition and time point. Statistical analysis is performed using a two-way ANOVA with Prism 8.0.2.
4.8. TBARS Assay
To evaluate the success of the myelin debris oxidation, a thiobarbituric acid reactive substances assay (TBARS assay) was conducted. This assay is based on the principle that peroxidation processes generate various byproducts, including malondialdehyde (MDA) as a secondary product. MDA reacts with thiobarbituric acid (TBA) to form MDA-TBA2, a conjugate that exhibits absorption in the visible spectrum at 532 nm. This results in a distinctive rosy coloration, serving as a reliable indicator of the oxidation levels present in the sample.
The TBARS assay was performed following the specific protocol outlined in [
22]., First, the reagents were prepared. A 3.5 M sodium acetate buffer was prepared by diluting 200 mL of glacial acetic acid in 350 mL of ddH2O. Separately, 50 mL of a 6.5 M NaOH solution was prepared, and 46 mL of this solution was slowly added to the acetic acid while continuously mixing it. The pH was adjusted to 4, and the solution was brought to a total volume of 500 mL with ddH
2O.
The other reagents prepared were: 4 mL of an 8.1 % sodium dodecyl sulfate (SDS) solution in ddH2O, 20 mL of a 5 M NaOH solution, and 100 mL of a 0.8% aqueous solution of TBA. To ensure smooth dissolution of the TBA in the last solution, 600 μL of the 5 M NaOH solution was gradually added in 100 μL increments until the TBA was completely dissolved. The pH was then adjusted to be below 4. To prepare the MDA standards, 9.2 μL of tetramethoxypropane malonaldehyde bis was added to 100 mL of ddH2O, resulting in a final concentration of 550 μM. From this solution, standards at concentrations of 200, 100, 80, 40, 20, 10, 5, and 2.5 μM were prepared.
For the TBARS assay, 25 μL of the standard solutions were added to 2 mL tubes. For the samples, 12.5 μL of oxidized and control myelin debris, as well as 12.5 μL of ddH2O, were added to 2 mL tubes. To each tube, 50 μL of the 8.1% SDS solution, 375 μL of the 3.5 M sodium acetate buffer, and 375 μL of the 0.8% TBA solution were added. The tubes were vortexed and incubated for 1 hour at 95 °C. Afterward, the tubes were cooled for 30 minutes on ice and centrifuged at 4,000 xg for 10 minutes at 4 °C. 150 μL of the supernatant from each sample/standard was transferred to separate wells in a 96-well plate (three wells per sample). An spectrophotometer was utilized to measure the absorbance at 532 nm. A standard curve was created using the absorbance values of the standards, and its equation was used to extrapolate the MDA concentration of the myelin debris samples.
The concentrations of MDA obtained from the three replicates of both control and oxidized myelin debris were subjected to statistical analysis using an unpaired Student's t-test conducted with GraphPad Prism 8.0.2. This analysis allowed for the comparison and assessment of the significance between the groups.