
Submitted:
08 February 2023
Posted:
09 February 2023
You are already at the latest version
Abstract
Microglia are the resident immune cells of the central nervous system. Upon stimulus presentation microglia polarize from a resting to an activated state. Microglial translocator protein 18 kDa (TSPO) is considered as a marker of inflammation. Here, we characterized the role of TSPO by investigating the impact of TSPO deficiency on human microglia. We used TSPO knockout (TSPO-/-) variants of the human C20 microglia cell line. We found a significant reduction in the TSPO-associated protein VDAC1 in TSPO-/- compared to control cells. Moreover, we assessed the impact of TSPO deficiency on calcium levels and the mitochondrial membrane potential. Cytosolic and mitochondrial calcium concentrations were increased in TSPO-/- cell lines, whereas the mitochondrial membrane potential tended to be lower. Assessment of the mitochondrial DNA copy number via RT-PCR revealed a decreased amount of mtDNA in the TSPO-/- cells when compared to controls. Moreover, metabolic profiles of C20 cells were strongly dependent on the glycolytic pathway. However, TSPO depletion did not affect the cellular metabolic profile. Measurement of the mRNA expression levels of the pro-inflammatory mediators revealed an attenuated response to proinflammatory stimuli in TSPO-depleted cells, implying a role of the TSPO protein in the process of microglial polarization.
Keywords:
translocator protein 18 kDa
; mitochondria
; inflammation
; CRISPR/Cas9
; respirometry
1. Introduction
Microglia are tissue-resident macrophages of the central nervous system (CNS). As resident immune cells within the brain, microglia fulfil a wide range of tasks, ranging from the detection of pathogens, mediation of pro-inflammatory reactions, antigen presentation to conveying neuroprotective properties and promotion of neuronal regeneration [1]. Upon detection of potentially dangerous stimuli or inflammatory signals, microglia undergo functional and morphological changes into an activated state, being either pro- or anti-inflammatory, which is dependent on the received stimuli [2]. The pro-inflammatory or M1 microglial state is also referred to as the classically activated phenotype and is mainly triggered by lipopolysaccharides (LPS), reactive oxygen species (ROS) or inflammatory factors such as interferon-γ (INFγ) or tumor necrosis factor alpha (TNFα) [3]. However, it can also be induced by hypoxia or the detection of cellular debris, due to injury to the surrounding tissue [4]. M1 microglia can initiate adaptive immune responses by presenting antigens using MHCII receptors, the release of pro-inflammatory cytokines such as TNFα, interleukins 1β (IL1β), -12A (IL12A), -6 (IL6) and -8 (IL8) as well as the upregulation of proteins related to the production of nitric oxide (NO) such as the inducible nitric oxide synthase (iNOS, NOS2). It also regulates the expression of mitochondrial proteins, such as the translocator protein 18 kDa (TSPO) as well as mitochondrial (and therefore energetic) function [5,6]. M1 microglia undergo a so-called “metabolic switch” when activated, thereby changing the main cellular energy production from oxidative phosphorylation to glycolysis by upregulation of transporters that facilitate glucose uptake, like GLUT1. This is paralleled by a change in mitochondrial parameters like oxygen consumption rate or morphological constitution [7].
The translocator protein 18 kDa (TSPO) is a highly conserved multifunctional protein residing in the outer mitochondrial membrane (OMM) [8]. It is expressed to varying degrees in multiple tissues, with the highest levels of expression found in steroidogenic tissues and relatively low expression in the central nervous system. In the brain, TSPO can be detected predominantly in microglia and reactive astrocytes [9], where its expression is upregulated in the context of inflammation, neurodegeneration, and malignant neoplasia [10,11]. Although the role of TSPO in de novo steroidogenesis was questioned in view of various genetic TSPO deletion models [12,13,14,15], our recent studies support a role of TSPO expression as well as of TSPO ligands in the regulation of pregnenolone synthesis in mouse BV-2 and human C20 microglia cells [16,17,18]. Beside its suggested role in cholesterol transport and steroid synthesis [15,19,20], TSPO has been shown to be involved in the regulation of various cellular and mitochondrial functions. The multifunctional properties of TSPO also affect mitochondrial bioenergetics (oxidative phosphorylation, OxPhos) and metabolism [17,21], beta-oxidation of fatty acids [22], the production of ROS [23], and Ca2+ homeostasis [17,24]. Moreover, TSPO is also involved in regulating cellular downstream processes such as proliferation, survival, and apoptosis [10,25].
In the present study, we used the via CRISPR/Cas9 newly generated TSPO-/- and control lines of the established human microglia C20 cells. We investigated the effect of TSPO-deficiency on mtDNA copy number, cytosolic and mitochondrial Ca2+ levels, and the mitochondrial membrane potential. Since current hypotheses argue for a structural and functional interaction of TSPO with the voltage-dependent anion channel (VDAC1) [26], we also assessed the VDAC1 expression in TSPO-/- and control cells. Moreover, we investigated the metabolic profile of TSPO-deficient and control C20 cells by evaluating their dependence on the oxidative phosphorylation or glycolysis under basal or an activated condition achieved by treating the cells with a cytokine cocktail of TNFα, IL1β, and INFγ [27]. The activated state of the treated microglia cells was verified by analyzing the mRNA expression profile of pro-inflammatory cytokinesThe introduction should briefly place the study in a broad context and highlight why it is important.
2. Materials and Methods
2.1. Cell Lines and Culture Conditions
Human microglia C20 cells [28] were grown in Dulbecco’s Modified Eagle’s Medium/Nutrient Mixture F-12 Ham (Sigma Aldrich, Taufkirchen, Germany), supplemented with 10% fetal calf serum (FCS), 2 mM L-glutamine, 10,000 U/mL penicillin-streptomycin at 37 °C, humidified air and 5% CO2 and medium was changed three times a week.
2.2. CRISPR/Cas9-Mediated TSPO Knockout
To inactivate the TSPO gene in C20 cells, the CRISPR-Cas9 system was adapted from [29]. Targeting sequences were designed using the Web-based tool CRISPOR (http://crispor.tefor.net/). Two independent target sequences for the human TSPO gene were used: #116: 5`- TCCCGCTTTGTCCACGGCGAGGG-3`, and #126: 5`- TCCACGGCGAGGGTCTCCGCTGG-3`. The DNA sequences were synthesized (Metabion, Planegg-Martinsried, Germany) and separately cloned into the vector pSpCas9(BB)-2A-GFP. PX458 (a gift from Feng Zhang, Addgene plasmid # 48138, Addgene, Cambridge, USA) drives the expression of the Streptococcus pyogenes Cas9, GFP, and the chimeric guide RNA in mammalian cells. C20 cells were transfected with the recombinant plasmids using jetOptimus (Polyplus, New York, USA). 24 hours after transfection, single GFP-positive cells were sorted by flow cytometry to allow single-colony formation. After 7 days, single clones were collected, and the successful knockout was confirmed by Western blot using anti rabbit TSPO antibody and sequencing of genomic DNA. All experiments were performed in two independent isogenic TSPO-deficient clones and two isogenic control cell lines.
2.3. Western Blotting
Whole cell protein samples were sonicated and boiled in RIPA buffer and total protein was quantified using a micro-BCA colorimetric assay (Pierce, Thermo Fischer Scientific, Dreieich, Germany). Protein samples were separated by SDS-polyacrylamide gel electrophoresis on 15% gels and subsequently transferred onto nitrocellulose membrane (Amersham™ Protran 0.45 NC, GE Healthcare Life Sciences, USA). TSPO and VDAC1 proteins were detected using the rabbit-anti-TSPO (ab109497), and mouse-anti-VDAC1 (ab186321) antibodies, both from Abcam, Cambridge, UK, respectively. Beta 1 tubulin antibody (clone E7, Developmental Studies Hybridoma Bank, Iowa, USA) was used as a loading control. VDAC1 band densities were quantified using ImageJ [30] and normalized to beta 1 tubulin.
2.4. RNA Isolation, Reverse Transcription and Quantitative Real-Time RT-PCR of Inflammatory Markers
Total RNA was extracted using RNA Plus Kit (Macherey-Nagel, Düren, Germany) according to the manufacturer’s instructions. First strand cDNA synthesis from 1 μg of total RNA was performed with QuantiTect Reverse Transcription Kit (Qiagen, Hilden, Germany). Quantitative RT-PCR experiments were performed with Rotor-Gene-Q machine (Qiagen, Hilden, Germany) using the 1x Takyon SYBR Master Mix (Eurogentec, Köln, Germany), and specific intron-spanning primers, listed in Table 1. Measurements were performed in triplicate and results were analyzed with a Rotor-Gene-Q software version 2.3 (Qiagen, Hilden, Germany) applying the ΔΔCt method for relative quantification.
mtDNA copy number
For the quantification of the mtDNA copy number, primers for the mitochondrial gene mt-TL1 and the nuclear gene B2M are used. Primer sequences are listed in Table 1. The mtDNA copy number was assessed from three biological replicates for each cell line. Each biological replicate was measured in triplicates in two separate runs. Analysis was performed using Rotor-Gene-Q software version 2.3 (Qiagen, Hilden, Germany), by relating the ΔΔCt of genomic and mitochondrial genes of each sample to the overall efficiency of the primers E multiplicated by two to account for the diploid nDNA copies per cell.
2×E-𝝙𝝙Ct
2.5. ATP Content
ATP concentration was measured using CellTiter-Glo Reagent (Promega, Walldorf, Germany) according to the manufacturer’s instructions. Briefly, 1 x 10⁵ cells were collected and stored at -20 oC if necessary. The cell pellets were resuspended in 500 µL PBS and heated at 100 oC for 2 min in order to remove ATPases. Subsequently, absorption was measured at the VarioScan (Thermo Fischer Scientific, Dreieich, Germany) with an integration time of 1 s. The relative light unit (RLU) generated by the SkanIT Software (Thermo Fischer Scientific, Dreieich, Germany) can be calculated to the actual ATP concentrations with the help of the ATP standard curve. ATP values were normalized to the total protein content using micro BCA assay.
2.6. Mitochondrial Membrane Potential
2.5 × 10⁴ C20 wildtype or TSPO knockout cells were seeded on sterile glass coverslips (diameter 25 mm), placed in 6-well plates, and grown overnight in Dulbecco’s Modified Eagle’s Medium/Nutrient Mixture F-12 Ham at 37 °C, humidified air and 5% CO2. Cells were loaded with 200 nM JC-1/Pluronic (Life Technologies, Darmstadt, Germany) in Opti-MEM (Life Technologies, Darmstadt, Germany) for 30 min at 37 °C, humidified air and 5% CO2. For imaging, coverslips were washed with assay buffer (140 mM NaCl, 5 mM KCl, 1.8 mM CaCl2, 1 mM MgSO4, 10 mM glucose, and 10 mM HEPES) and mounted in a chamber on the inverted microscope (ZEISS Observer Z.1, Jena, Germany). A Lambda DG4 high-speed wavelength switcher (Sutter instruments, Novato, USA) allowed the excitation of JC-1 480/36 nm. The emitted light was filtered at 537/42 nm and 620/60 nm for green or red fluorescence, respectively, and finally detected by a CCD camera (AxioCam MRm, ZEISS, Jena, Germany). Mitochondrial membrane potential was analyzed as ratio of red versus green fluorescence intensity in regions of interest, drawn over selected cells in the visual field using ImageJ [30].The macro used for background subtraction and analysis will be provided on request.
2.7. Cytosolic Ca2+ and Mitochondrial Ca2+ Levels
2.5 × 10⁴ C20 wildtype or TSPO knockout cells were grown on sterile glass coverslips (diameter 25 mm) overnight and loaded with 2 µM Fura-2/AM and 2 µM Rhod2/AM (Life Technologies, Darmstadt, Germany) in opti-MEM for 30 min at 37 °C and 5% CO2. The experiments were performed using a ZEISS live cell imaging setup (ZEISS, Jena, Germany). Fura-2/AM-loaded cells (2 µM, 30 min at 37 °C) were illuminated with light of 340 or 380 nm (BP 340/30 HE, BP 387/15 HE) using a fast wavelength switching and excitation device (Lambda DG-4, Sutter Instrument, Novato, CA, USA). Fluorescence was detected at 510 nm (BP 510/90 HE and FT 409) using an AxioCam MRm LCD camera (ZEISS, Jena, Germany). Fluorescence in Rhod2/AM loaded cells was excited at 545/25 nm and images of the emitted fluorescence were collected using 605/70 nm emission filter using ZEN 2012 software (ZEISS, Jena, Germany) which was used to control the hardware and acquire data. Cells were selected as ROIs in the visual field using FIJI/ImageJ [30] as described for the procedure used to assess the MMP. The macro used for background subtraction and analysis will be provided on request.
2.8. Pharmacology/Pro-Inflammatory Stimulation
To induce microglial activation TSPO-/- and control C20 cell lines were treated with a mixture of human Tumor necrosis factor α (TNFα), Interleukin 1β (IL1β) and Interferon-γ (INFγ). All cytokines were diluted in PBS + 1% bovine serum albumin (BSA) at a concentration of 10 μg/ml (TNFα and IL1β) or 20 μg/ml (INFγ) and stored in aliquots at -80 °C to avoid multiple thaw/freeze cycles. For treatment, the cytokines were thawed and diluted in normal media to an end concentration of 1ng/ml each. The cells were then treated with the cytokine mixture for 16h. After treatment cells were harvested, pelleted and frozen at -20 °C until further usage.
2.9. Metabolic Profile
To study the cells’ metabolism in basal state and after pro-inflammatory stimulation oxidative phosphorylation or glycolysis were blocked with either Antimycin A or 2-Deoxy-D-glucose respectively and the cell survival was measured via a Resazurin assay. Antimycin A was used at concentrations of 10 μM, 7.5 μM, 5 μM, 2.5 μM and 1 μM, while 2-Deoxy-D-glucose was used at concentrations of 300 mM, 100 mM, 50 mM, 25 mM, 5 mM in triplicates each. For each cell line, cells were seeded onto a 96-well plate with roughly 5.000 cells per well. Cells were grouped into three subcategories: basal (1), stimulated for 16 hours (2) and stimulated for 40 hours (3). Stimulation was performed with 1 ng/ml of the cytokine cocktail containing TNFα, IL1-β and INFγ. After 16 hours of incubation with the cocktail (2) or basal media (1), media was removed and replaced by media containing the inhibitor in the concentrations described above. For subgroup (3) the cytokine cocktail was added additionally at 1 ng/ml each. After 20 hours of incubation with inhibitors +/- cytokines, 10% resazurin were added to each well and left to incubate for four hours at 37°C. The fluorescent signal was then measured at 590 nM at the VarioScan (Thermo Fischer Scientific, Darmstadt, Germany).
2.10. Statistical Analysis
Data were expressed as mean ± standard error of the mean. Statistical analysis was performed with GraphPad Prism 9 (GraphPad Software, Boston, USA). Statistical significance was assessed using independent samples t-test, Mann-Whitney U test, or ANOVA, combined with post hoc tests for multiple comparisons. Results were regarded statistically significant for p < 0.05.
3. Results
In order to deeply characterize the impact of TSPO expression on mitochondrial function and cellular physiology in human microglia cells, we used the established human C20 microglia cell line [28]. We generated several isogenic TSPO-deficient clones from one parental cell line by means of CRISPR/Cas9-mediated gene knock-out using two distinct guide sequences. A different batch of C20-derived cell lines was already used in earlier studies to investigate the impact of TSPO-expression on various cellular functions [17].
3.1. Mitochondrial DNA Copy Number
Mitochondria possess their own DNA (mtDNA, 16.5 kb), which codes for 13 mitochondrial proteins, 22 tRNA and 2 rRNA molecules. Cells contain up to thousands of circular mtDNA molecules, and the amount of mtDNA per cell, i.e., the mtDNA copy number, corresponds to the number of mitochondria (mitochondrial mass) per cell. We found that TSPO-/- cells contained significantly less mtDNA compared to their controls (mtDNA copy number in TSPO-/- 822.1 ± 80.37, control 1232 ± 53.78, p = 0.0003; Welch’s corrected t-test) (Figure 1).
3.2. VDAC1 Expression
According to current hypotheses TSPO is a highly interacting protein, which may function as a molecular hub to orchestrate and regulate the function and expression of proteins associated in a multimeric complex. VDAC1-expression in TSPO-deficient C20 cells is reduced to 54% of control (p = 0.0204; unpaired t-test) (Figure 2), supporting the idea of a functional and structural interaction of both proteins. In the context of altered VDAC1-expression, TSPO-deficiency directly or indirectly affects important physiological parameters of mitochondrial function.
3.3. Intracellular Ca2+ Levels
Assessment of cytosolic as well as mitochondrial Ca2+ levels using the fluorescent Ca2+-sensitive dyes Fura-2/AM and Rhod-2/AM, respectively, revealed a significantly increased Fura-2 ratio (cytosolic Ca2+: 0.539 ± 0.002 vs. 0.558 ± 0.002; p < 0.0001, n = 3 experiments) and Rhod-2 intensities (mitochondrial Ca2+: 99.42 ± 1.75 vs. 140.4 ± 1.46; p < 0.0001, n = 3 experiments, Mann Whitney U test) in TSPO-deficient C20 cells compared to their controls (Figure 3). These data indicate increased cytosolic and mitochondrial Ca2+ levels in TSPO-/- cells, possibly affecting numerous Ca2+-sensitive processes (also compare [17]).
3.4. Size of C20 Microglia Cells
Analysis of the size of the C20 microglia cells by assessing the fluorescent area after loading the cells with Fura-2 revealed a significantly smaller cell size of TSPO-/- cells (Figure 4).
3.5. Mitochondrial Membrane Potential
The mitochondrial membrane potential (MMP) as an integrative measure of bioenergetic capacity is established by the translocation of protons across the inner mitochondrial membrane (IMM) associated with the transport of electrons along the respiratory chain complexes, which results in a significant proton motive force. On the other hand, this proton gradient is diminished by the backflow of protons into the matrix when driving the ATP synthase generating ATP from ADP and phosphate. We found no difference in the MMP, indicated as the ratio of the fluorescence of JC-1 aggregates (indicating a negative MMP resulting in red fluorescence) over JC-1 monomers (less negative MMP, green fluorescence) between TSPO-deficient cells and controls (Figure 5).
3.6. Metabolic Profile
Within a living cell, ATP is generated via two main pathways, i.e., glycolysis and oxidative phosphorylation system (OxPhos). The overall ATP content in the C20 TSPO-/- and control cells was assessed using a luciferase-based bioluminescence assay. Interestingly, we did not detect a significant difference in overall ATP content in TSPO-/- vs. control C20 cells (Figure 6).
To investigate the effects of TSPO-deficiency on the two ATP-generating pathways glycolysis and OxPhos, we isolated the metabolic pathways by treating the cells for 24 h either with antimycin A (0 – 10 µM) as an inhibitor of complex III to block oxidative phosphorylation, or by 2-deoxy-D-glucose (0 – 300 mM) as an inhibitor of glycolysis (by inhibiting the glucose-6-phosphate isomerase). The viability of TSPO-deficient and control cells was assessed by performing Resazurin cell viability assays. We found that antimycin A (up to 10 µM) had no effect on the viability of TSPO-/- or control C20 cells, whereas 2-deoxy-D-glucose reduced the viability of C20 cells in a dose-dependent manner, demonstrating their stronger dependency on glycolysis for energy production. However, the viability of the C20 cells was not different in TSPO-deficient or control cells (Figure 7).
It is known that polarization of peripheral immune cells and microglia to an M1 phenotype is often accompanied by a shift in the cells from oxidative phosphorylation to aerobic glycolysis for energy production [4,7].
To investigate if and how the metabolic profile of TSPO-deficient and control C20 microglia cells is affected by cytokine treatment-induced polarization we used a cocktail of TNFα, IL-1β and INFγ (each 1 ng/ml) [27] and challenged the cells for 16 h (see supplementary Figure S1 and supplementary Tables S1 and S2) and 40 h (Figure 8 and supplementary Tables S1 and S2). Similarly to the baseline condition, antimycin A had no effect on C20 viability in cytokine-activated microglia. The dose-dependent reduction of viability by 2-deoxy-D-glucose treatment was evident after 16 h (see supplementary Figure S1 and supplementary Tables S1 and S2) and 40 h (Figure 8 and supplementary Tables S1 and S2) of cytokine treatment. Interestingly, 300 mM 2-deoxy-D-glucose revealed significantly different viability of TSPO-/- and control cells after a 40 h cytokine-challenge.
To characterize the impact of cytokine treatment on C20 microglia and to verify the transition to the activated state we analyzed the mRNA expression levels of TNFα, IL1β, IL6, IL8, IL12A, and NOS2 at basal and cytokine-treated (16 h) conditions.
Under unstimulated/basal conditions, we found that TSPO-deficient C20 cells showed lower expression of IL1β, IL6, and IL8 mRNA, whereas the expression of TNFα, IL8, and NOS2 was not significantly different from C20 controls (Figure 9). These data demonstrate that TSPO-deficiency alters the expression profile of pro-inflammatory cytokines in human C20 microglia cells.
Challenging the C20 cells with a cytokine mixture stimulated the mRNA expression of all cytokine species investigated in both control and TSPO-deficient C20 microglia cells (Figure 10). Looking at the expression profile within the groups, IL8, IL6, IL1β, and TNFα were the most responsive cytokine genes.
Comparison of the effect of cytokine-treatment on cytokine mRNA expression in TSPO-/- and control C20 cells revealed a differential expression of TNFα, IL6 and IL12A (Figure 11). TSPO-deficient microglia showed an increased expression of TNFα mRNA, but a lower expression of IL6 and IL12A mRNA.
Expression levels of IL1β, IL8, and NOS2 were not significantly different between TSPO-/- and control C20 cells (Figure 11).
4. Discussion
The functional role of the highly conserved mitochondrial protein TSPO differs between species as well as between cell types. The use of specific knock-out models allows to further investigate the physiological function of this long-known but still enigmatic protein.
In the present study we aimed to shed further light on the question of the cellular functions of TSPO by investigating the impact of TSPO-deficiency on human microglia.
TSPO and VDAC are supposed to take part in a still insufficiently defined structural and functional protein complex [26]. As the major pore in the outer mitochondrial membrane VDAC is involved in regulation of the diffusion of respiratory chain substrates such as ADP and ATP, NAD+ and NADH, cations such as Ca2+ and Mg2+, and metabolites such as glucose, pyruvate, glutamate, succinate, and citrate [26]. Intriguingly, we observed that TSPO-deficiency affects also VDAC1 expression in human C20 cells. Therefore, altered VDAC1 expression may be involved in regulating vital physiological parameters of mitochondrial function. Ongoing studies with VDAC1-deficient or overexpressing cells will clarify how the functional changes observed in TSPO-deficient cells relate to reduced expression of VDAC1. In this context, protein stability assays using cycloheximide will help to analyze the stability of VDAC1 in TSPO-deficient cells [29]. Mutual dependence of TSPO and VDAC expression has also been demonstrated in glioblastoma cancer cells, in which a decline in VDAC expression led to a reduced expression of TSPO [30].
In the present study, we detected significantly higher Ca2+ levels both in the cytosol and mitochondria of TSPO-deficient C20 cells compared to controls. An increased cytosolic Ca2+ level in TSPO-/- cells has already been reported by our group [17]. Elevated Ca2+ levels may be a consequence of altered Ca2+ flux/diffusion or active transport processes, probably affected by altered expression and/or function of the VDAC in the outer mitochondrial membrane, the mitochondrial calcium uniporter (MCU) in the inner mitochondrial membrane, Ca2+-exchangers and transporters (ATPases) in the ER (SERCA) or plasma membrane [24]. Ca2+ is a major second messenger within a cell and regulates a variety of processes and cascades affecting ion homeostasis and the OxPhos [31,32].
Our data did not show an effect of TSPO expression on the mitochondrial membrane potential, indicating that the integrated activity of the electron transport chain, the translocation of protons and the parallel reflux of protons via the ATP-synthase, which determine the MMP, are not affected. However, it has already been shown that the impact of TSPO-expression on the MMP is variable and dependent on the species, cell type, and preparation [16,17,33].
The mitochondrial genome exists as multiple copies per cell, with a varying range depending on cellular function with increased copy numbers in cells which have a higher demand for ATP, like muscle cells or neurons [34]. In the present study, we found a significant reduction of mtDNA copy number in TSPO-deficient cells. An increased elimination of mitochondria due to increased autophagy as a consequence of ubiquitination and degradation of mitochondrial proteins facilitated by the reduced expression of VDAC in TSPO-/- cells may contribute to these findings [24]. Moreover, a reduced mtDNA has already been shown to negatively affect respiratory capacity, induced by lowered expression levels of proteins involved in the OxPhos [35]. This reduction of oxidative capacity is in line with our earlier studies on TSPO-deficient human C20 cells, in which we observed reduced basal and maximal oxygen consumption rates when compared to controls [17,36].
The total amount of ATP seemed to be lower, although not significantly reduced, in our TSPO-deficient human C20 cells. However, using primary microglia cells isolated from TSPO knockout mice, Yao and coworkers detected a significantly lower ATP level in TSPO-deficient cells, indicating that the reduction of OxPhos in primary mouse TSPO-KO cells led to reduced ATP levels without sufficient compensation through an increased glycolytic energy production [6].
Regarding the metabolic profile of C20 cells, we found a stronger dependence on glycolytic activity than on OxPhos, since 2-deoxy-D-glucose dose-dependently reduced the viability (cell survival) of both TSPO-deficient and control cells, whereas antimycin A did not affect the viability of either group up to a concentration of 10 µM. The highest concentration of 2-deoxy-D-glucose (300 mM) differentially lowered the viability in TSPO-deficient and control cells, indicating that under these conditions, TSPO affected the glycolytic pathway [22,37].
As such, a switch in the metabolic and energy-producing pathways from oxidative phosphorylation to glycolysis in microglia or other macrophages may be associated with polarization of the cells towards the M1 pro-inflammatory state [7,36].
To investigate the dependence of pro-inflammatory microglial activation on TSPO expression and function we analyzed the mRNA expression levels of the inflammatory mediators TNFα, IL1β, IL6, IL8, IL12A, and NOS2 at basal/unstimulated conditions, and after challenging the cells with a cytokine mixture consisting of TNFα, IL1β, and INFγ [27]. Under basal as well as activated conditions, we found decreased expression levels of IL1β, IL6, IL8, IL12A, and NOS2 mRNA in the TSPO-deficient cell lines. Interestingly, TNFα mRNA expression levels were increased in the TSPO-/- cells at basal conditions and showed even higher levels in cytokine-treated TSPO-deficient cells.
The reduced mRNA expression of pro-inflammatory mediators in C20 TSPO-/- is in line with recent studies reporting similar observations in primary mouse microglia and mouse BV-2 cells, where TSPO depletion led to decreased mRNA expression levels of IL1β, IL6, and iNOS [6]. The authors also described that TSPO-deficient primary microglial cells do not polarize toward an M2 phenotype, suggesting that the involvement of TSPO in microglial activation is not limited to promoting only pro-inflammatory phenotypes.
The observed increased TNFα mRNA expression could be explained as a compensatory mechanism in C20 TSPO-/- cells, as TNFα is known to be a downstream modulator of IL1, IL6, and IL8 expression via the NFκB pathway [38], a pathway that is suggested to be itself negatively regulated by TSPO [39]. In addition, the response to stimuli and the function and action of TSPO vary between cell types and species, as evident, for example, in the different response to stimulation with LPS. Activation of cells did not induce increased TSPO expression in human microglia but did so in rodent microglia [40].
The attenuated response to pro-inflammatory activation may also be related to the alteration in Ca2+ homeostasis of the TSPO-/- C20 cell line. A study in mouse microglia reported that changes in activation status were associated with an increase in intracellular Ca2+ concentration [41]. The authors also suggested a reduced capacity for Ca2+-mediated signal transduction as a side effect of the increase in free cytosolic Ca2+, which could affect gene transcription, ion channels, and elements of the cytoskeleton. In this context, it would be of interest to study the Ca2+ balance of TSPO-depleted C20 microglia and their controls after their activation.
5. Conclusions
Overall, our results show that, in addition to TSPO-dependent modulation of mitochondrial activity and bioenergetic functions, TSPO is also involved in polarizing human C20 microglia toward a proinflammatory phenotype upon activation. The TSPO-deficient cells show an attenuated response to activating stimuli in terms of mRNA expression of IL1β, IL6, IL8, IL12A, and NOS2. The increased mRNA expression of TNFα under basal and activated conditions in knockout cells might constitute a compensatory mechanism for counteracting decreased levels of other inflammatory mediators.
Supplementary Materials
The following supporting information can be downloaded at the website of this paper posted on Preprints.org, Figure S1: Effect of Antimycin A and 2-deoxy-D-glucose on viability of cytokine-stimulated TSPO-deficient and control C20 microglia cells; Table S1: Effect of Antimycin A on viability of cytokine-stimulated TSPO-deficient (KO) and control C20 microglia cells; Table S2: Effect of 2-Deoxy-D-glucose on viability of cytokine-stimulated TSPO-deficient (KO) and control C20 microglia cells; Table S3: Cytokine mRNA expression in TSPO-deficient human C20 microglia cells and control cells after treatment with cytokine cocktail (16 h) and related to unstimulated conditions of control or TSPO-KO cells.
Author Contributions
Conceptualization, S.B., T.W. and C.H.W.; methodology, S.B., T.W., T.J., V.M.M.; analysis, S.B. and T.W.; resources, S.B. and V.M.M.; writing—original draft preparation, T.W. and C.H.W.; writing—review and editing, S.B., C.N., V.M.M. R.R. and C.H.W.; supervision, S.B. and C.H.W.; funding acquisition, S.B., R.R. and C.H.W. All authors have read and agreed to the published version of the manuscript.
Funding
The work has been supported by the Deutsche Forschungsgemeinschaft (DFG, German Research Foundation) project number 422182557 to CHW and SB within the framework of the FOR2858.
Acknowledgments
The authors would like to thank Richard Warth for providing access to the Seahorse device.
Conflicts of Interest
The authors declare no conflict of interest.
References
- Prinz, M.; Priller, J., Microglia and brain macrophages in the molecular age: from origin to neuropsychiatric disease. Nat Rev Neurosci 2014, 15, (5), 300-12. [CrossRef]
- Sarma, S. D.; Chatterjee, K.; Dinda, H.; Chatterjee, D.; Sarma, J. D., Cytomorphological and Cytochemical Identification of Microglia. International Scholarly Research Notices 2013, 2013, 1-10. [CrossRef]
- Jang, E.; Kim, J. H.; Lee, S.; Kim, J. H.; Seo, J. W.; Jin, M.; Lee, M. G.; Jang, I. S.; Lee, W. H.; Suk, K., Phenotypic polarization of activated astrocytes: the critical role of lipocalin-2 in the classical inflammatory activation of astrocytes. J Immunol 2013, 191, (10), 5204-19. [CrossRef]
- Orihuela, R.; McPherson, C. A.; Harry, G. J., Microglial M1/M2 polarization and metabolic states. Br J Pharmacol 2016, 173, (4), 649-65. [CrossRef]
- Gordon, S.; Taylor, P. R., Monocyte and macrophage heterogeneity. Nat Rev Immunol 2005, 5, (12), 953-64. [CrossRef]
- Yao, R.; Pan, R.; Shang, C.; Li, X.; Cheng, J.; Xu, J.; Li, Y., Translocator Protein 18 kDa (TSPO) Deficiency Inhibits Microglial Activation and Impairs Mitochondrial Function. Front Pharmacol 2020, 11, 986. [CrossRef]
- Nair, S.; Sobotka, K. S.; Joshi, P.; Gressens, P.; Fleiss, B.; Thornton, C.; Mallard, C.; Hagberg, H., Lipopolysaccharide-induced alteration of mitochondrial morphology induces a metabolic shift in microglia modulating the inflammatory response in vitro and in vivo. Glia 2019, 67, (6), 1047-1061. [CrossRef]
- Papadopoulos, V.; Baraldi, M.; Guilarte, T. R.; Knudsen, T. B.; Lacapere, J. J.; Lindemann, P.; Norenberg, M. D.; Nutt, D.; Weizman, A.; Zhang, M. R.; Gavish, M., Translocator protein (18kDa): new nomenclature for the peripheral-type benzodiazepine receptor based on its structure and molecular function. Trends Pharmacol Sci 2006, 27, (8), 402-9. [CrossRef]
- Cosenza-Nashat, M.; Zhao, M. L.; Suh, H. S.; Morgan, J.; Natividad, R.; Morgello, S.; Lee, S. C., Expression of the translocator protein of 18 kDa by microglia, macrophages and astrocytes based on immunohistochemical localization in abnormal human brain. Neuropathol Appl Neurobiol 2009, 35, (3), 306-28. [CrossRef]
- Rupprecht, R.; Papadopoulos, V.; Rammes, G.; Baghai, T. C.; Fan, J.; Akula, N.; Groyer, G.; Adams, D.; Schumacher, M., Translocator protein (18 kDa) (TSPO) as a therapeutic target for neurological and psychiatric disorders. Nat Rev Drug Discov 2010, 9, (12), 971. [CrossRef]
- Rupprecht, R.; Wetzel, C. H.; Dorostkar, M.; Herms, J.; Albert, N. L.; Schwarzbach, J.; Schumacher, M.; Neumann, I. D., Translocator protein (18kDa) TSPO: a new diagnostic or therapeutic target for stress-related disorders? Mol Psychiatry 2022, 27, (7), 2918-2926. [CrossRef]
- Banati, R. B.; Middleton, R. J.; Chan, R.; Hatty, C. R.; Kam, W. W.; Quin, C.; Graeber, M. B.; Parmar, A.; Zahra, D.; Callaghan, P.; Fok, S.; Howell, N. R.; Gregoire, M.; Szabo, A.; Pham, T.; Davis, E.; Liu, G. J., Positron emission tomography and functional characterization of a complete PBR/TSPO knockout. Nat Commun 2014, 5, 5452. [CrossRef]
- Morohaku, K.; Pelton, S. H.; Daugherty, D. J.; Butler, W. R.; Deng, W.; Selvaraj, V., Translocator protein/peripheral benzodiazepine receptor is not required for steroid hormone biosynthesis. Endocrinology 2014, 155, (1), 89-97. [CrossRef]
- Tu, L. N.; Morohaku, K.; Manna, P. R.; Pelton, S. H.; Butler, W. R.; Stocco, D. M.; Selvaraj, V., Peripheral benzodiazepine receptor/translocator protein global knock-out mice are viable with no effects on steroid hormone biosynthesis. J Biol Chem 2014, 289, (40), 27444-54. [CrossRef]
- Papadopoulos, V.; Fan, J.; Zirkin, B., Translocator protein (18 kDa): an update on its function in steroidogenesis. J Neuroendocrinol 2018, 30, (2). [CrossRef]
- Bader, S.; Wolf, L.; Milenkovic, V. M.; Gruber, M.; Nothdurfter, C.; Rupprecht, R.; Wetzel, C. H., Differential effects of TSPO ligands on mitochondrial function in mouse microglia cells. Psychoneuroendocrinology 2019, 106, 65-76. [CrossRef]
- Milenkovic, V. M.; Slim, D.; Bader, S.; Koch, V.; Heinl, E. S.; Alvarez-Carbonell, D.; Nothdurfter, C.; Rupprecht, R.; Wetzel, C. H., CRISPR-Cas9 Mediated TSPO Gene Knockout alters Respiration and Cellular Metabolism in Human Primary Microglia Cells. Int J Mol Sci 2019, 20, (13), 3359. [CrossRef]
- Germelli, L.; Da Pozzo, E.; Giacomelli, C.; Tremolanti, C.; Marchetti, L.; Wetzel, C. H.; Barresi, E.; Taliani, S.; Da Settimo, F.; Martini, C.; Costa, B., De novo neurosteroidogenesis in human microglia: Involvement of the 18 kDa translocator protein. Int J Mol Sci 2021, 22, (6), 3115. [CrossRef]
- Wolf, L.; Bauer, A.; Melchner, D.; Hallof-Buestrich, H.; Stoertebecker, P.; Haen, E.; Kreutz, M.; Sarubin, N.; Milenkovic, V. M.; Wetzel, C. H.; Rupprecht, R.; Nothdurfter, C., Enhancing neurosteroid synthesis--relationship to the pharmacology of translocator protein (18 kDa) (TSPO) ligands and benzodiazepines. Pharmacopsychiatry 2015, 48, (2), 72. [CrossRef]
- Owen, D. R.; Fan, J.; Campioli, E.; Venugopal, S.; Midzak, A.; Daly, E.; Harlay, A.; Issop, L.; Libri, V.; Kalogiannopoulou, D.; Oliver, E.; Gallego-Colon, E.; Colasanti, A.; Huson, L.; Rabiner, E. A.; Suppiah, P.; Essagian, C.; Matthews, P. M.; Papadopoulos, V., TSPO mutations in rats and a human polymorphism impair the rate of steroid synthesis. Biochem J 2017, 474, (23), 3985. [CrossRef]
- Liu, G. J.; Middleton, R. J.; Kam, W. W.; Chin, D. Y.; Hatty, C. R.; Chan, R. H.; Banati, R. B., Functional gains in energy and cell metabolism after TSPO gene insertion. Cell Cycle 2017, 16, (5), 436-447. [CrossRef]
- Tu, L. N.; Zhao, A. H.; Hussein, M.; Stocco, D. M.; Selvaraj, V., Translocator Protein (TSPO) Affects Mitochondrial Fatty Acid Oxidation in Steroidogenic Cells. Endocrinology 2016, 157, (3), 1110-21. [CrossRef]
- Gatliff, J.; East, D.; Crosby, J.; Abeti, R.; Harvey, R.; Craigen, W.; Parker, P.; Campanella, M., TSPO interacts with VDAC1 and triggers a ROS-mediated inhibition of mitochondrial quality control. Autophagy 2014, 10, (12), 2279. [CrossRef]
- Gatliff, J.; East, D. A.; Singh, A.; Alvarez, M. S.; Frison, M.; Matic, I.; Ferraina, C.; Sampson, N.; Turkheimer, F.; Campanella, M., A role for TSPO in mitochondrial Ca(2+) homeostasis and redox stress signaling. Cell Death Dis 2017, 8, (6), e2896. [CrossRef]
- Papadopoulos, V.; Lecanu, L., Translocator protein (18 kDa) TSPO: an emerging therapeutic target in neurotrauma. Exp Neurol 2009, 219, (1), 53-7. [CrossRef]
- Shoshan-Barmatz, V.; Pittala, S.; Mizrachi, D., VDAC1 and the TSPO: Expression, interactions, and associated functions in health and disease states. Int J Mol Sci 2019, 20, (13), 3348. [CrossRef]
- Davis, R. L.; Buck, D. J.; McCracken, K.; Cox, G. W.; Das, S., Interleukin-1β-induced inflammatory signaling in C20 human microglial cells. Neuroimmunology and Neuroinflammation 2018, 2018. [CrossRef]
- Garcia-Mesa, Y.; Jay, T. R.; Checkley, M. A.; Luttge, B.; Dobrowolski, C.; Valadkhan, S.; Landreth, G. E.; Karn, J.; Alvarez-Carbonell, D., Immortalization of primary microglia: a new platform to study HIV regulation in the central nervous system. J Neurovirol 2017, 23, (1), 47-66. [CrossRef]
- Ran, F. A.; Hsu, P. D.; Wright, J.; Agarwala, V.; Scott, D. A.; Zhang, F., Genome engineering using the CRISPR-Cas9 system. Nat Protoc 2013, 8, (11), 2281-2308. [CrossRef]
- Schneider, C. A.; Rasband, W. S.; Eliceiri, K. W., NIH Image to ImageJ: 25 years of image analysis. Nat Methods 2012, 9, (7), 671-5. [CrossRef]
Figure 1.
mtDNA copy number in TSPO-/- and control C20 cell lines. Data are presented as single values of six RT PCR ± SEM (n = 3). The mtDNA copy number is significantly decreased in the TSPO-KO compared to the control cells (p = 0.0003; Welch’s corrected t-test).
Figure 1.
mtDNA copy number in TSPO-/- and control C20 cell lines. Data are presented as single values of six RT PCR ± SEM (n = 3). The mtDNA copy number is significantly decreased in the TSPO-KO compared to the control cells (p = 0.0003; Welch’s corrected t-test).
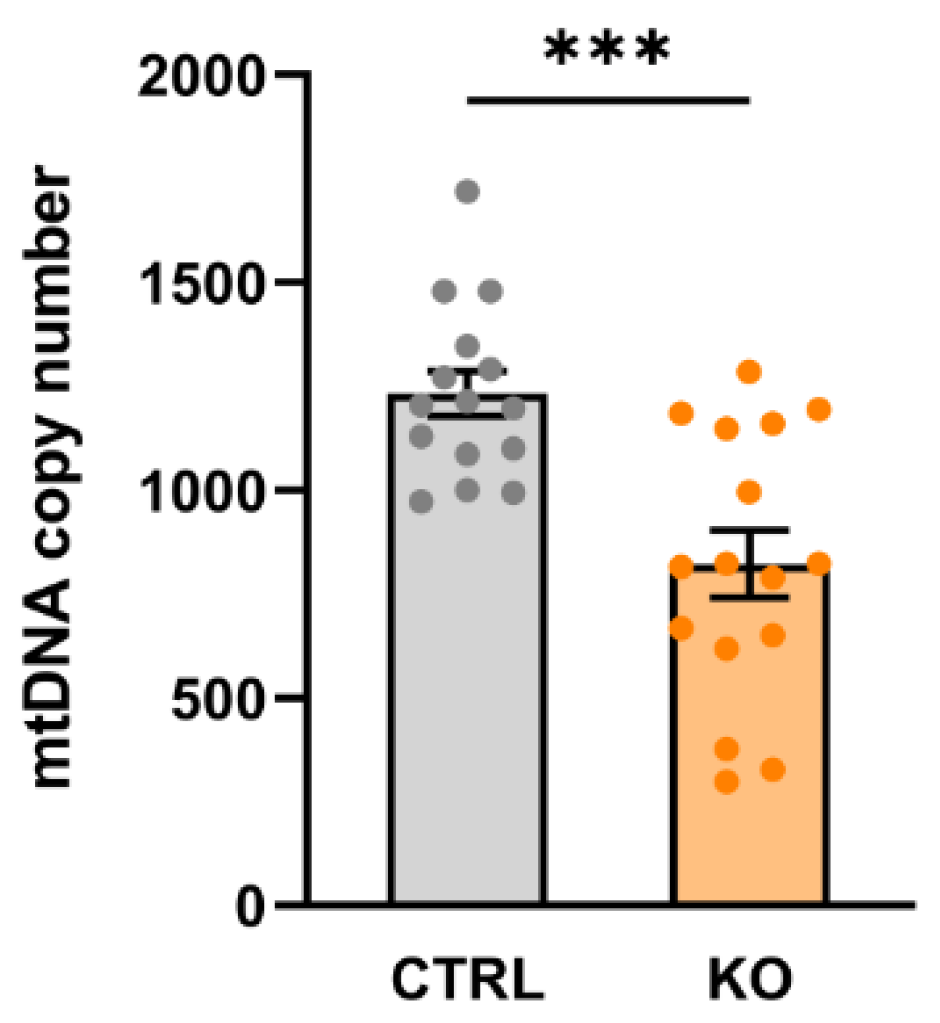
Figure 2.
VDAC1 expression in C20 human microglia TSPO-/- and control cell lines. (A) Western blot depicting the housekeeper gene β-tubulin at 55kDa, VDAC1 at 34 kDa and TSPO at 18 kDa. The TSPO-/- cell lines show no visible band at 18 kDa. (B) Relative expression of VDAC1 normalized to β-tubulin expression in control and TSPO-/- cell lines. The relative expression of VDAC1 is significantly reduced in the KO cell lines (mean ± SEM, n = 3).
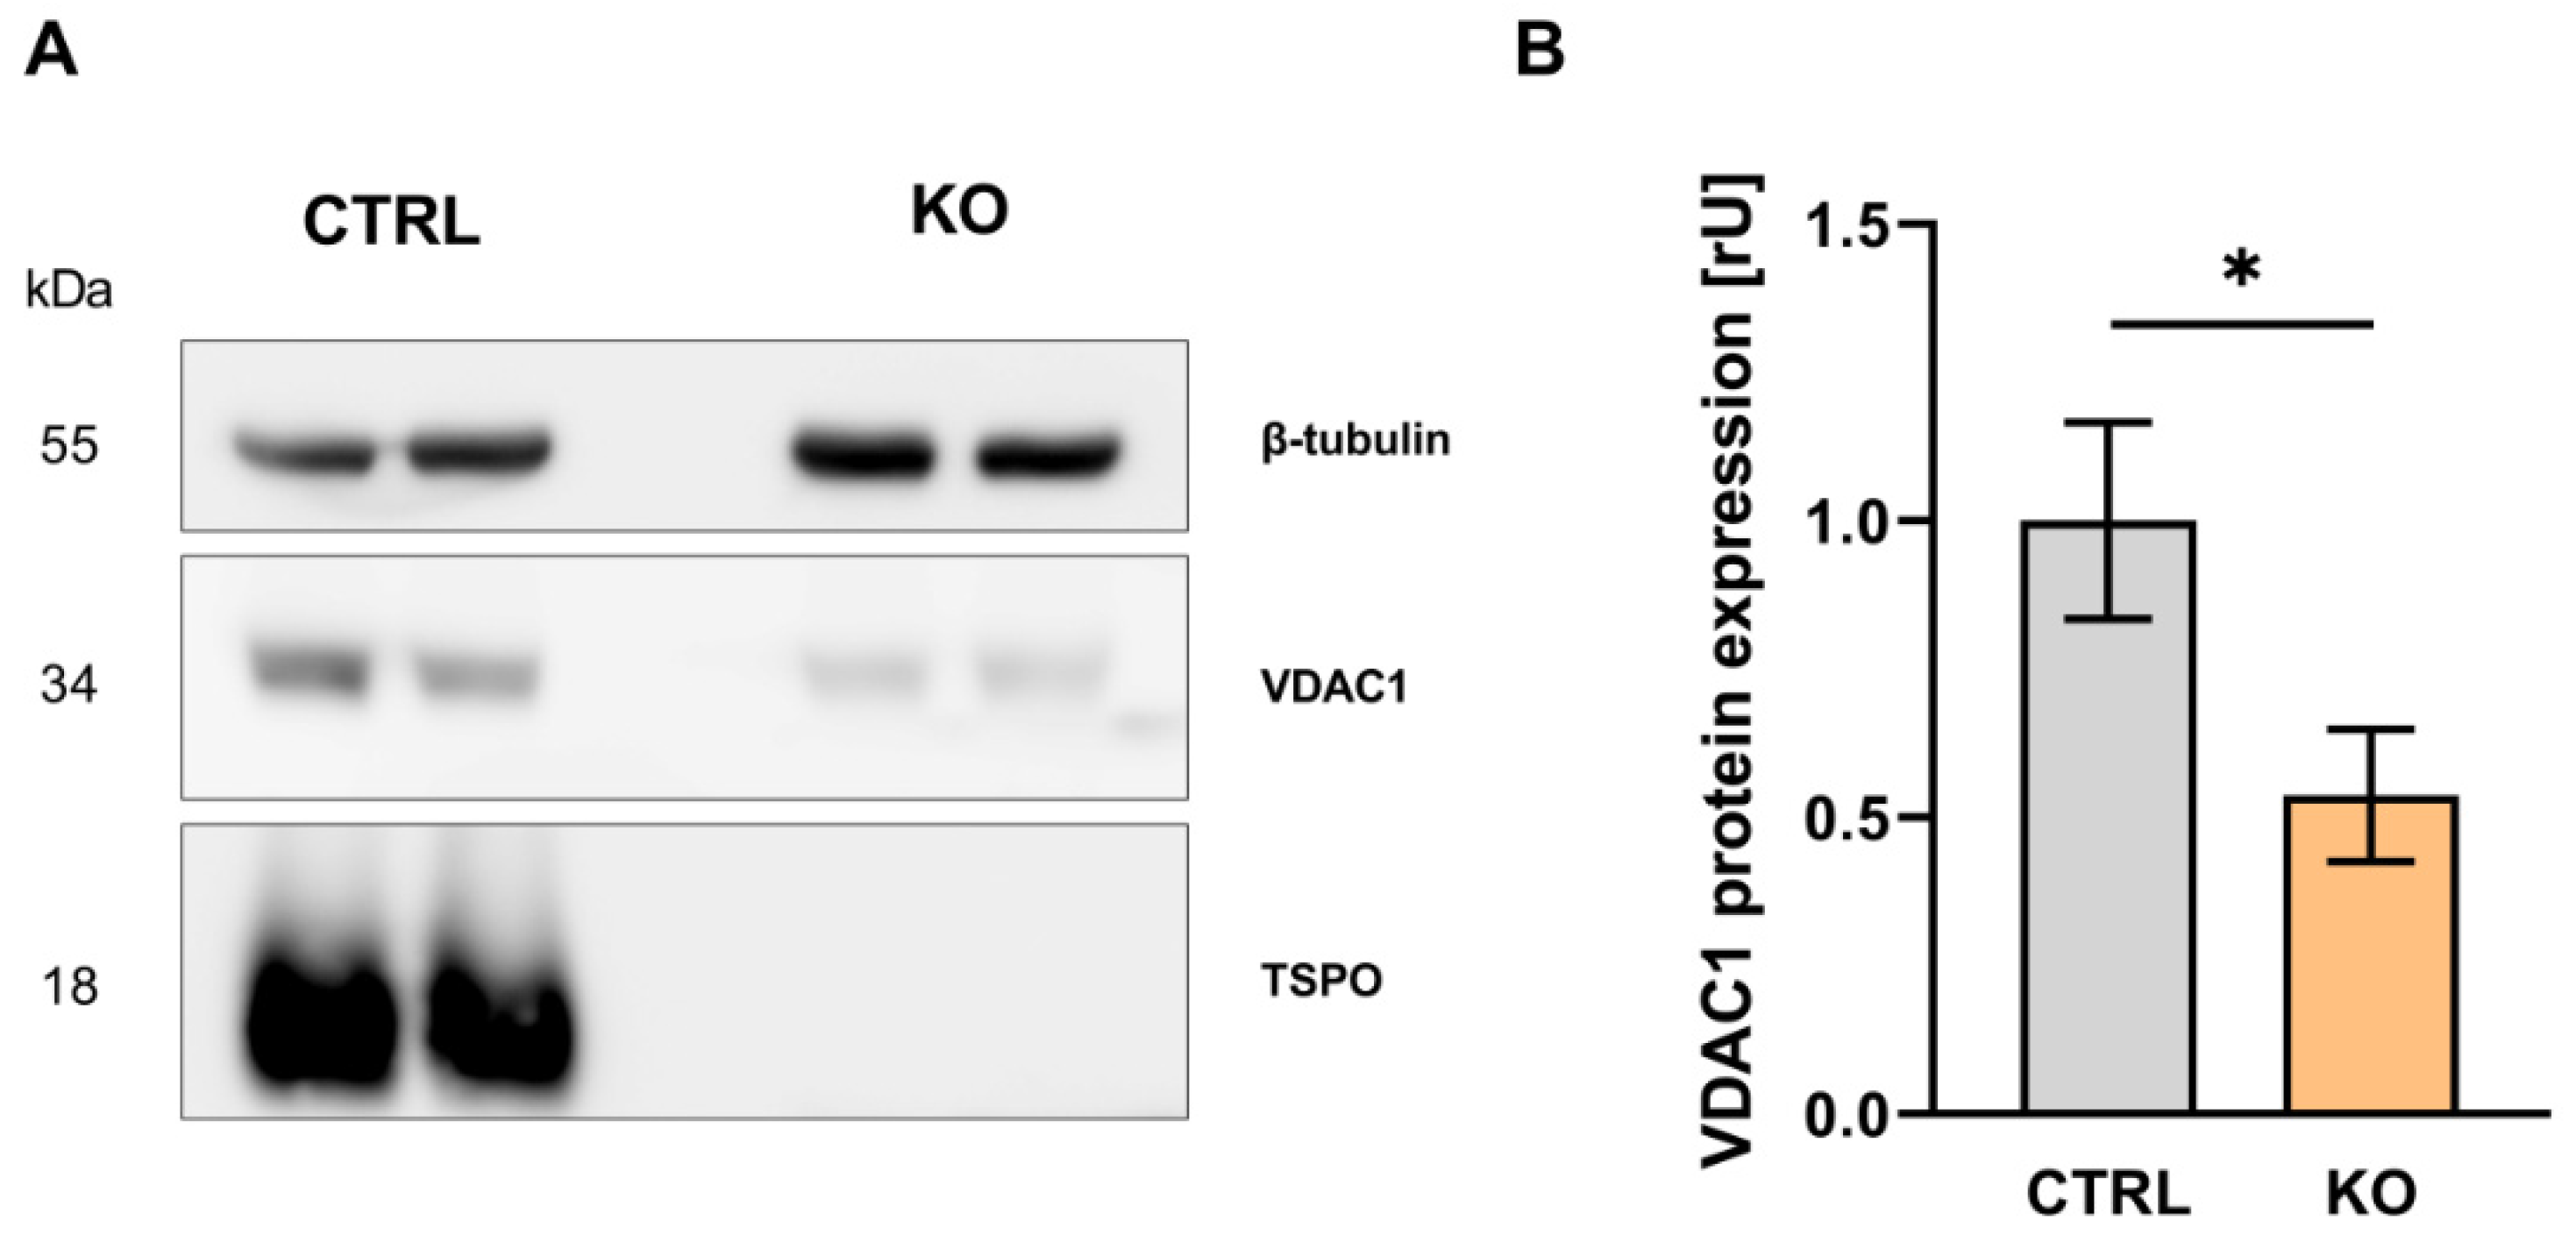
Figure 3.
Cytosolic and mitochondrial Ca2+ levels in control and TSPO-deficient human C20 microglia cells. Impact of TSPO-deficiency on cytosolic (A) and mitochondrial Ca2+ levels (B). Fura-2 ratio (A) and Rhod-2 fluorescence intensity (B) were significantly increased in TSPO-/- cells compared to their controls. Shown are single values and the mean of n = 3 experiments. (C) Exemplary image indicating Fura-2/AM and Rhod-2/AM loaded cells. Scale bar: 20 µm.
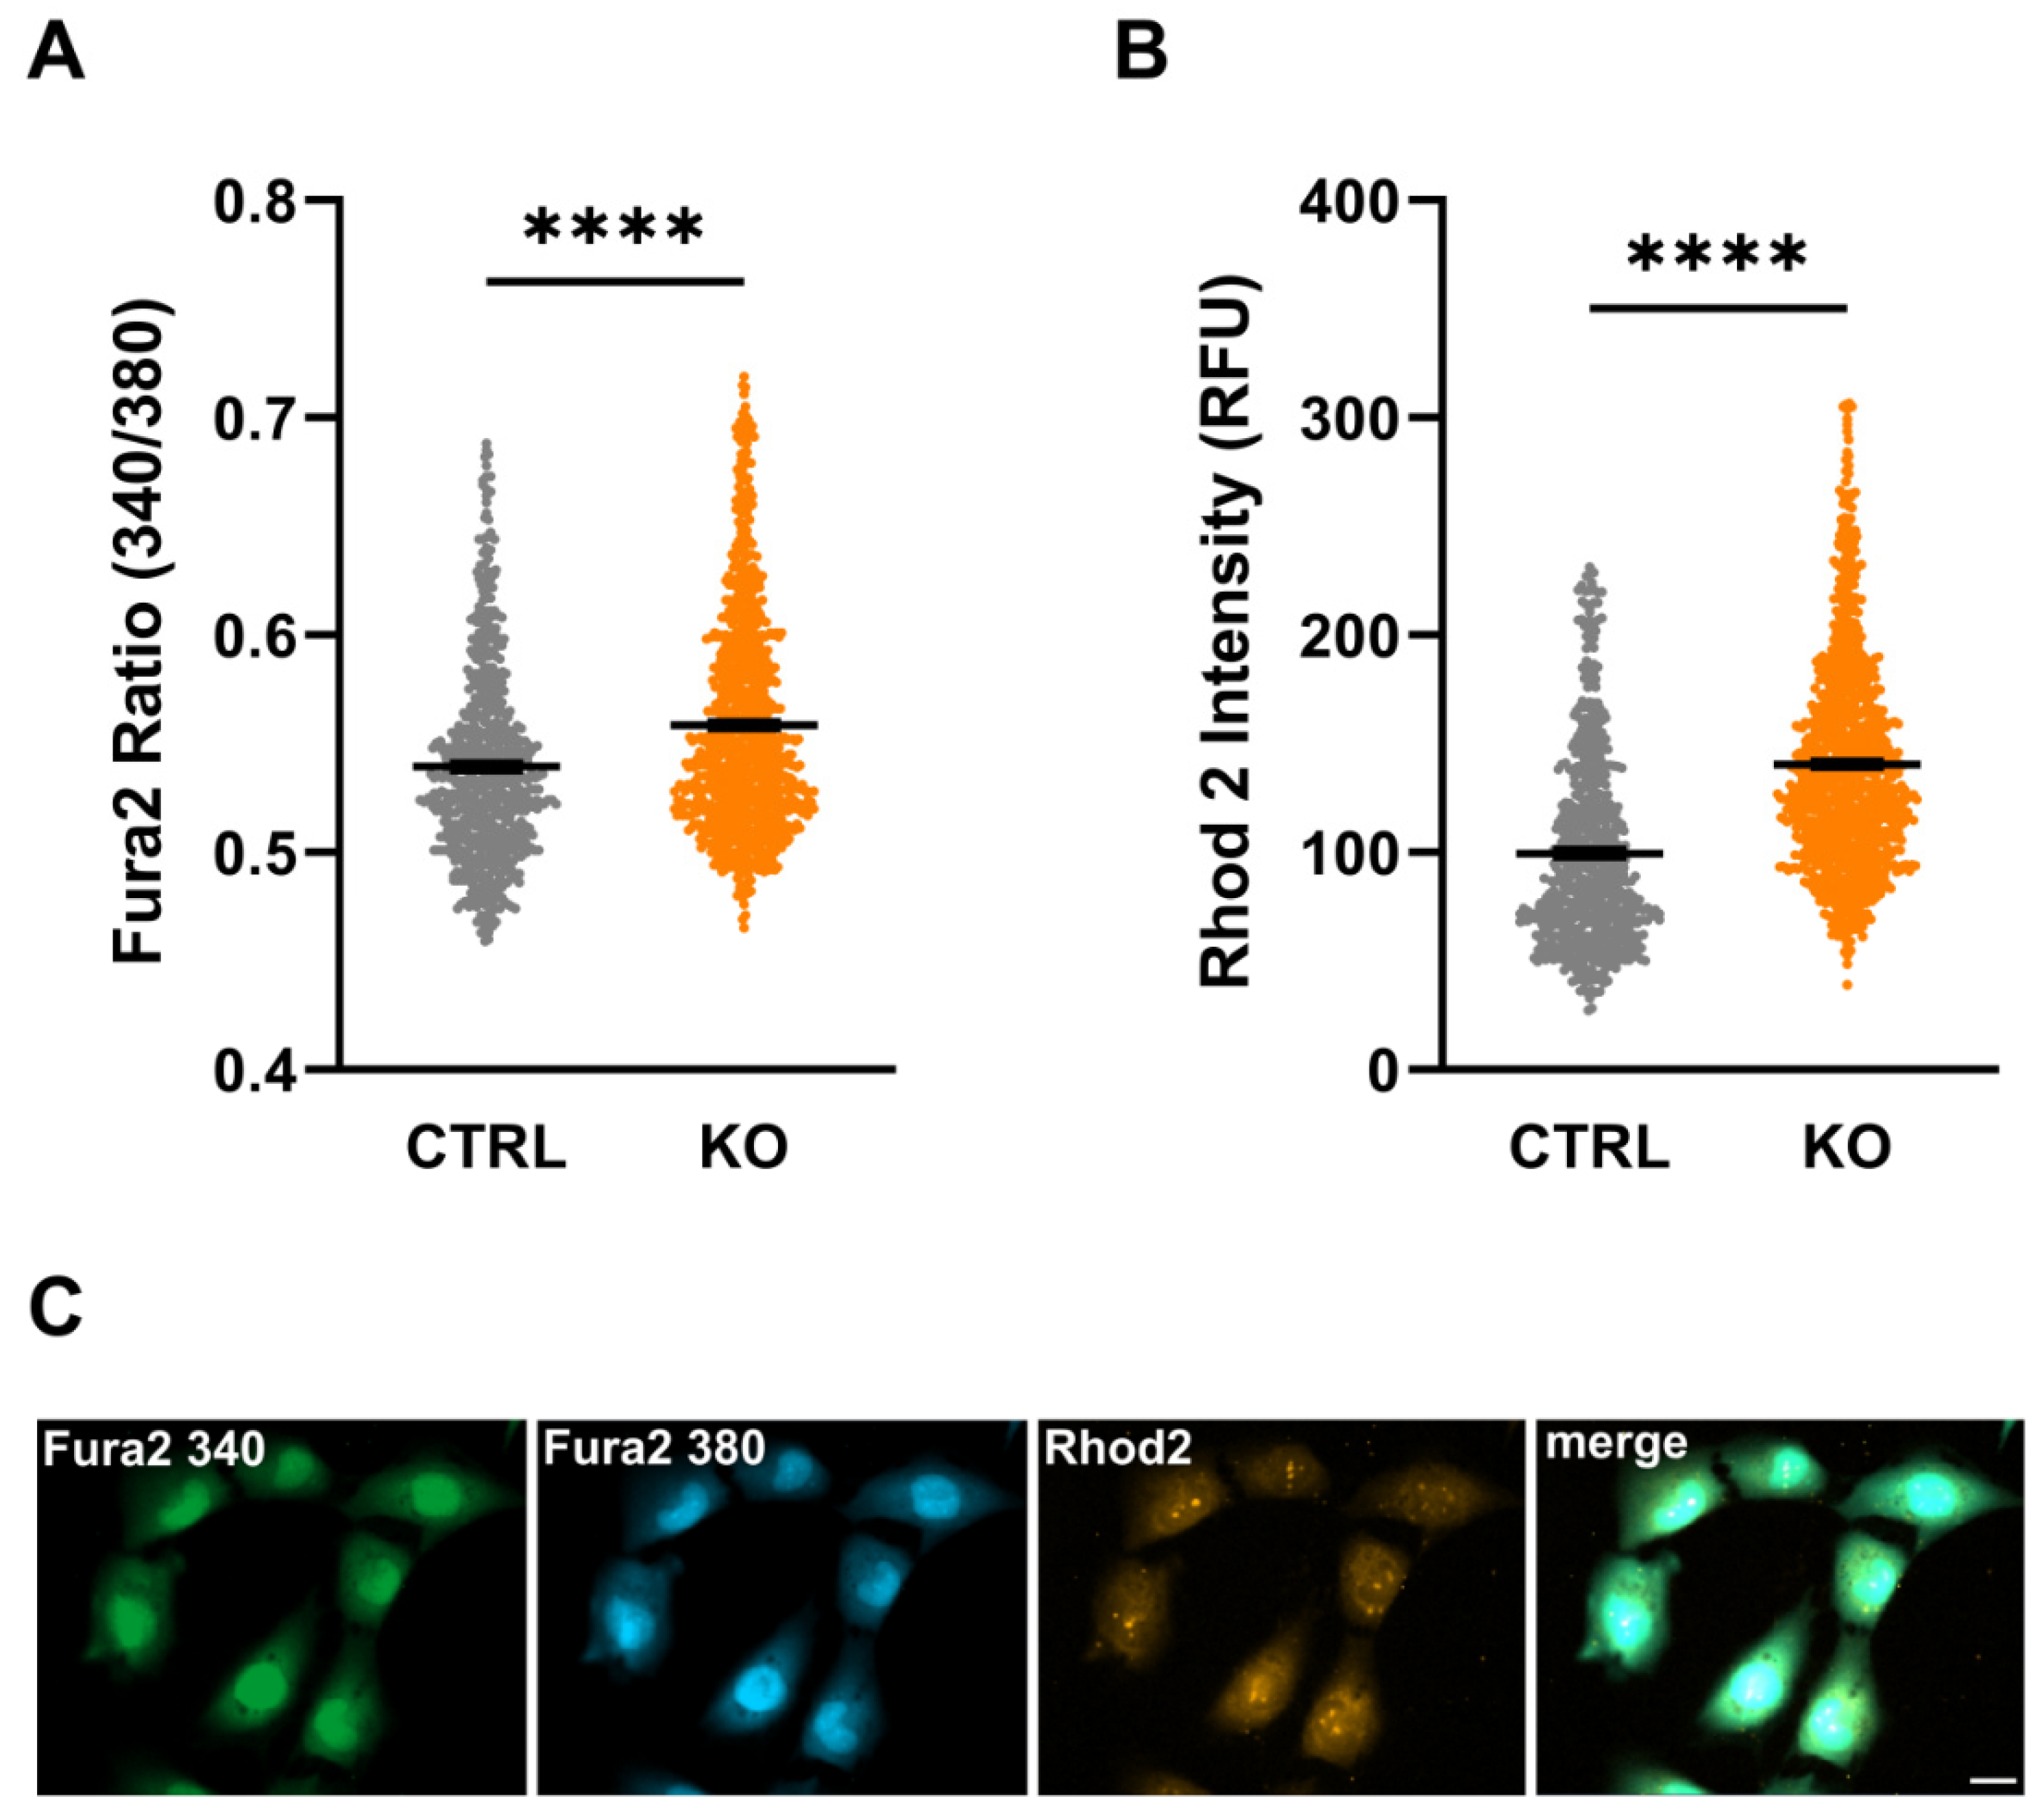
Figure 4.
Size of C20 microglia cells. Area of C20 microglia cells assessed by counting the number of pixels visualized after loading the cells with Fura-2 (A) (CTRL 1498 ± 21.86 vs KO 1213 ± 15.97; p < 0.0001; n=3; Mann-Whitney U test). Exemplary image indicating Fura-2 loaded cells (ratio image) and the analyzed regions of interest is shown in (B). Scale bar: 20 µm.
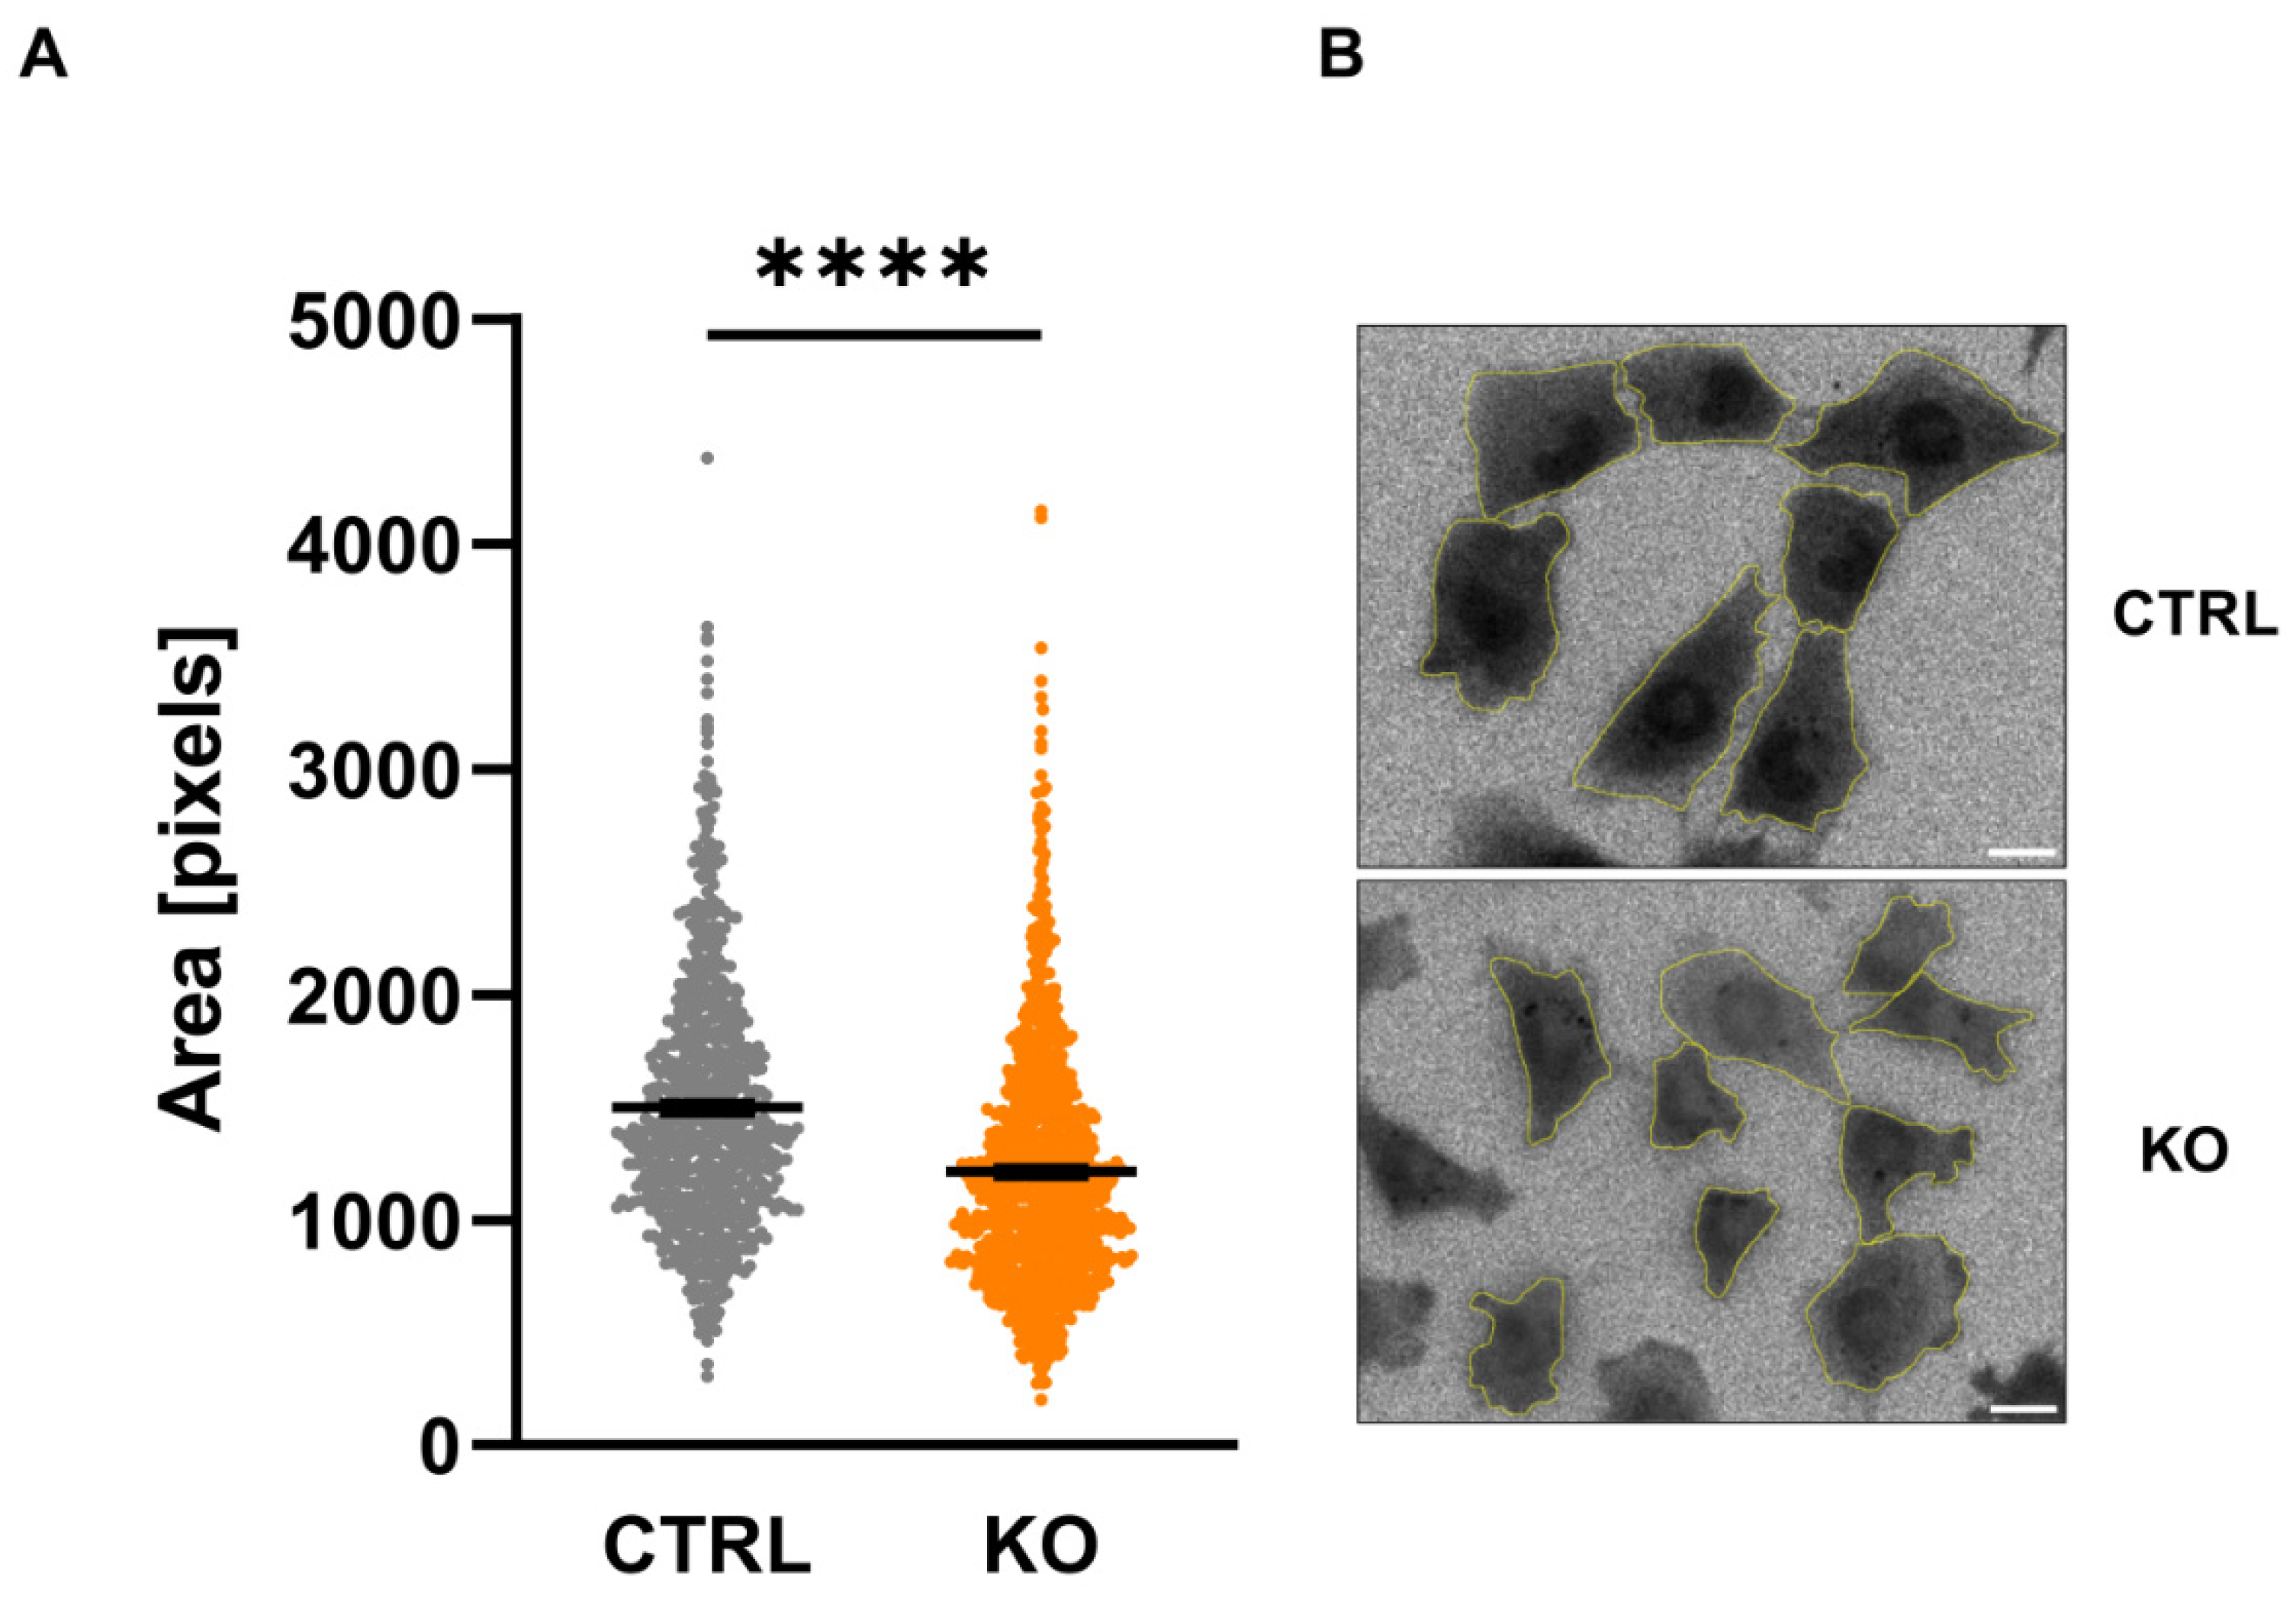
Figure 5.
Mitochondrial membrane potential (MMP). The cationic dye JC-1 is attracted by the negative membrane potential of the mitochondria and forms red fluorescing aggregates in highly energized (strongly hyperpolarized MMP) mitochondria. JC-1 aggregates dissociate into green fluorescing monomers upon reduction (depolarization) of the MMP. Thus, the ratio can be used to estimate the polarity of the MMP. Shown are single values and the mean of n = 3 experiments (CTRL 1.43 ± 0.032 vs KO 1.33 ± 0.022; n=3; Mann-Whitney U test) (B) Exemplary image indicating JC-1 loaded mitochondria. Scale bar: 20 µm.
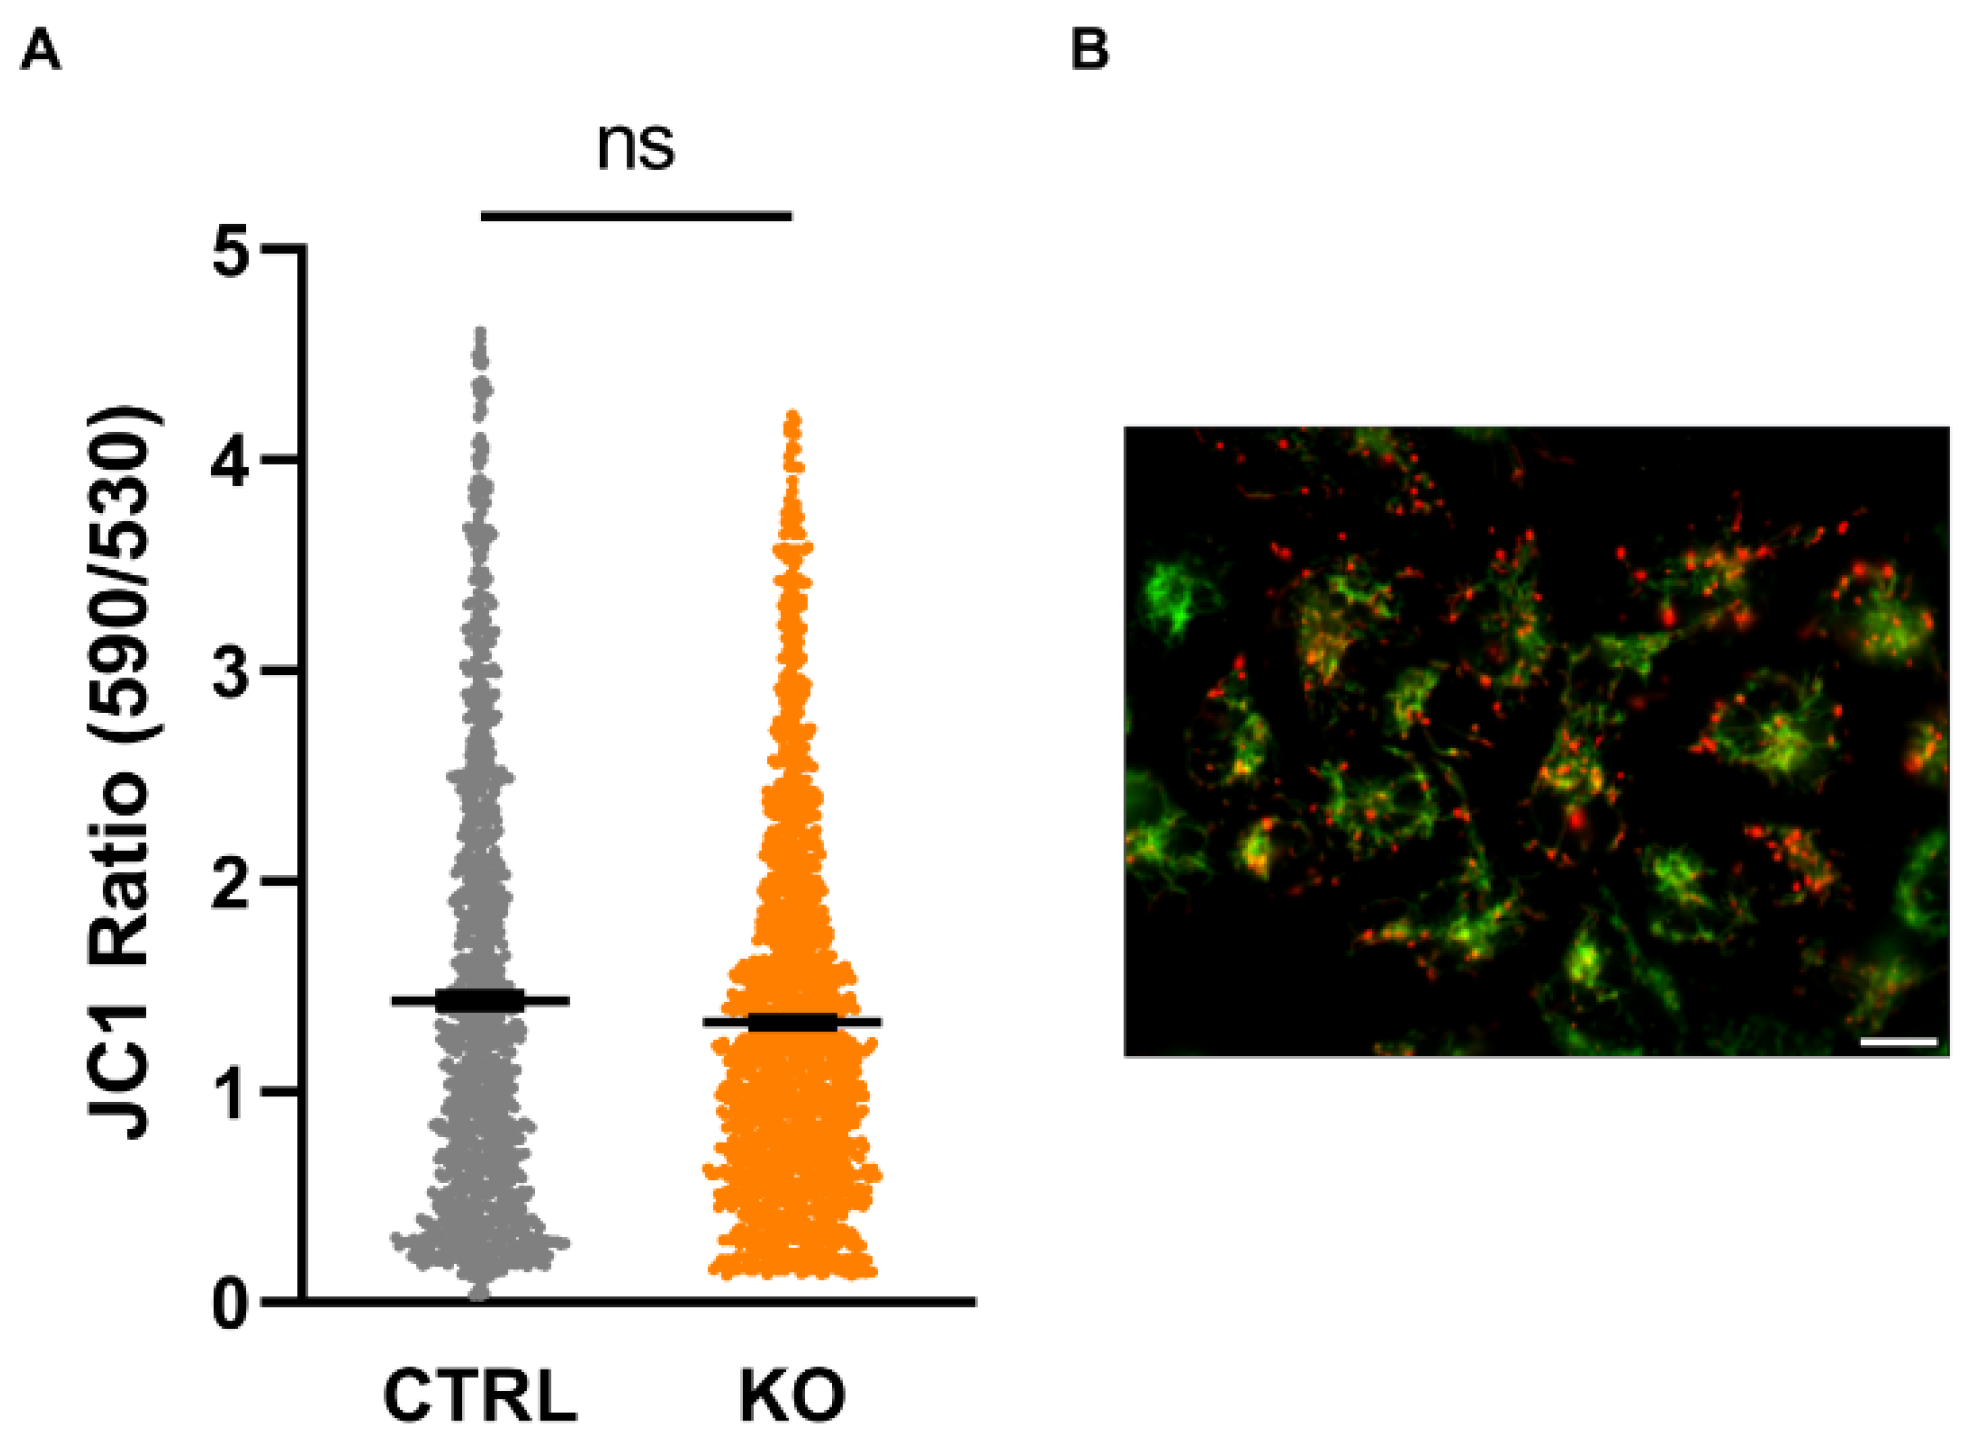
Figure 6.
ATP content in human C20 microglia cells. Impact of TSPO-deficiency on ATP content. Data are presented as single values as well as mean ± SEM (n = 3) (CTRL 6.246 ± 0.368 vs KO 6.025 ± 0.389; p=0.4848, Mann-Whitney U test).
Figure 6.
ATP content in human C20 microglia cells. Impact of TSPO-deficiency on ATP content. Data are presented as single values as well as mean ± SEM (n = 3) (CTRL 6.246 ± 0.368 vs KO 6.025 ± 0.389; p=0.4848, Mann-Whitney U test).
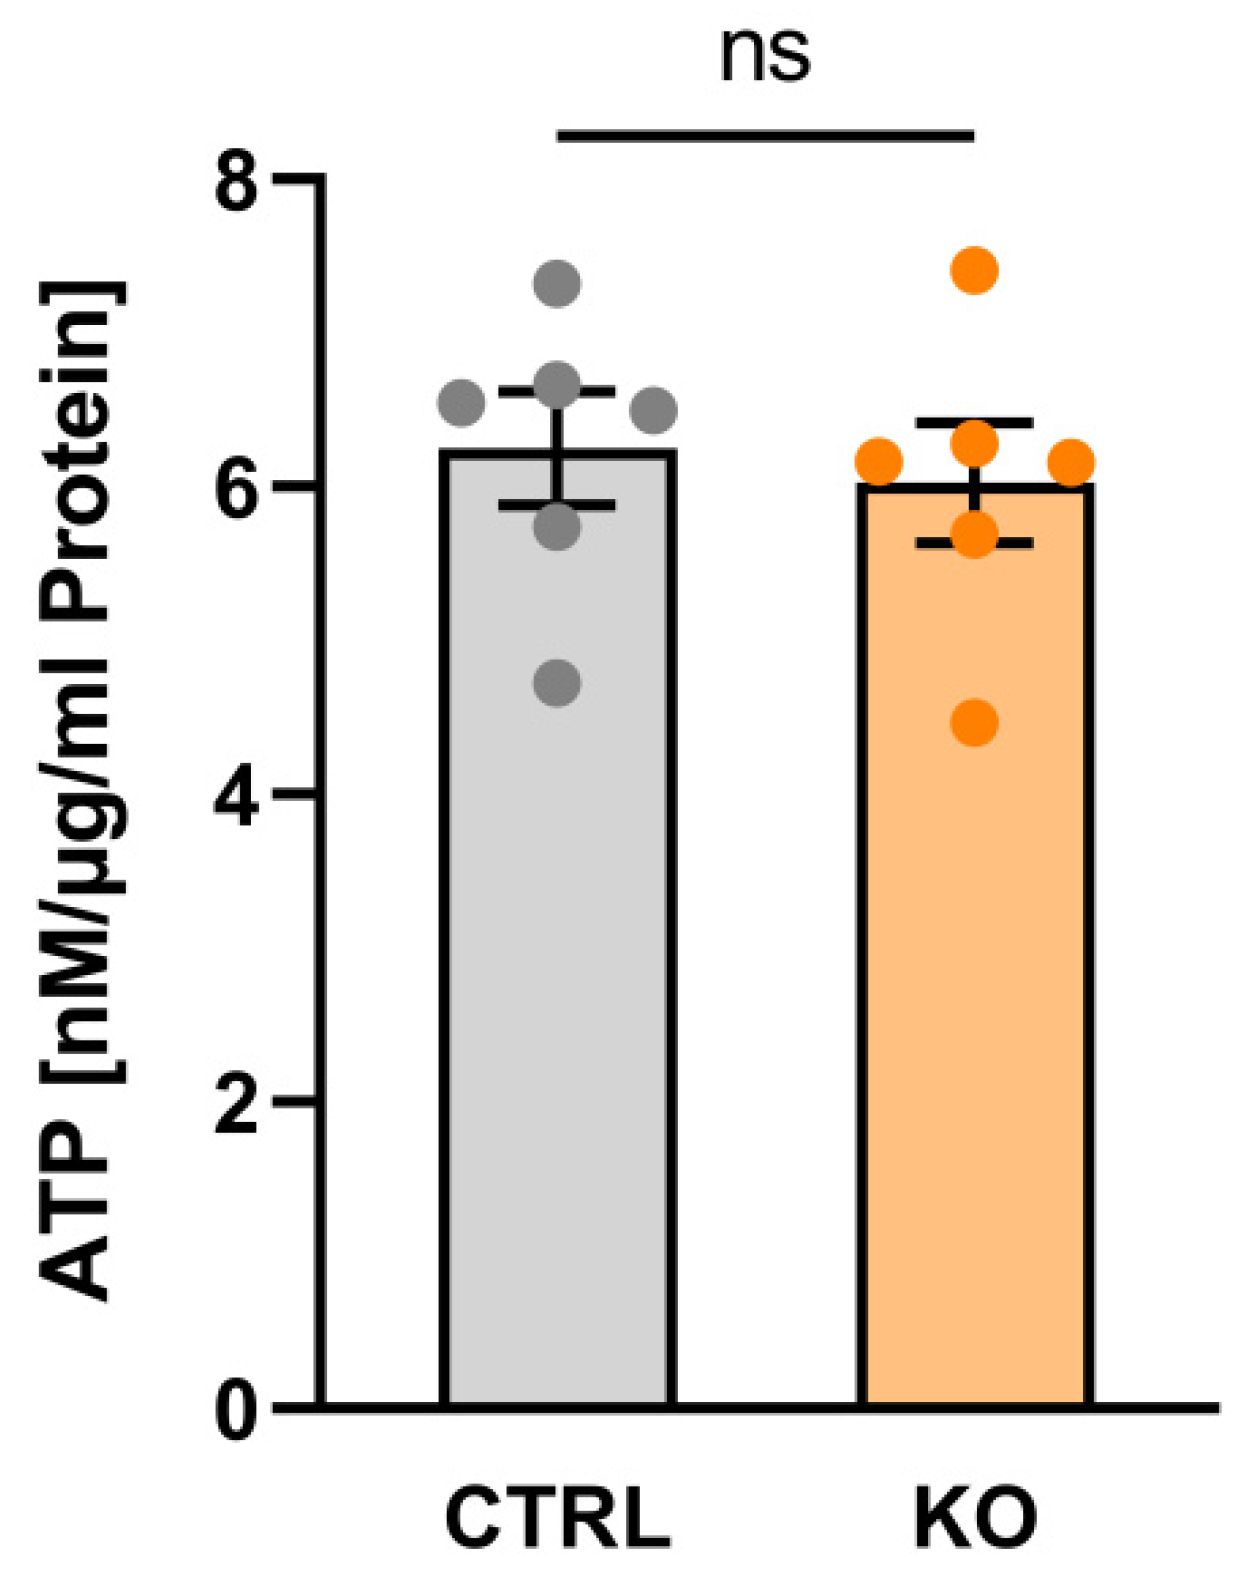
Figure 7.
Effect of antimycin A and 2-deoxy-D-glucose on the viability of TSPO-deficient and control C20 microglia cells. (A) Effect of antimycin A (1 – 10 µM) or (B) 2-deoxy-D-glucose (5 – 300 mM) on cell viability was tested using the Resazurin assay with TSPO-deficient and control C20 cells. Values represent survival normalized to conditions without antimycin A or 2-deoxy-D-glucose. n = 6, two-way ANOVA, Tukey’s multiple comparisons test (Data and p values see supplementary Table S1 and S2).
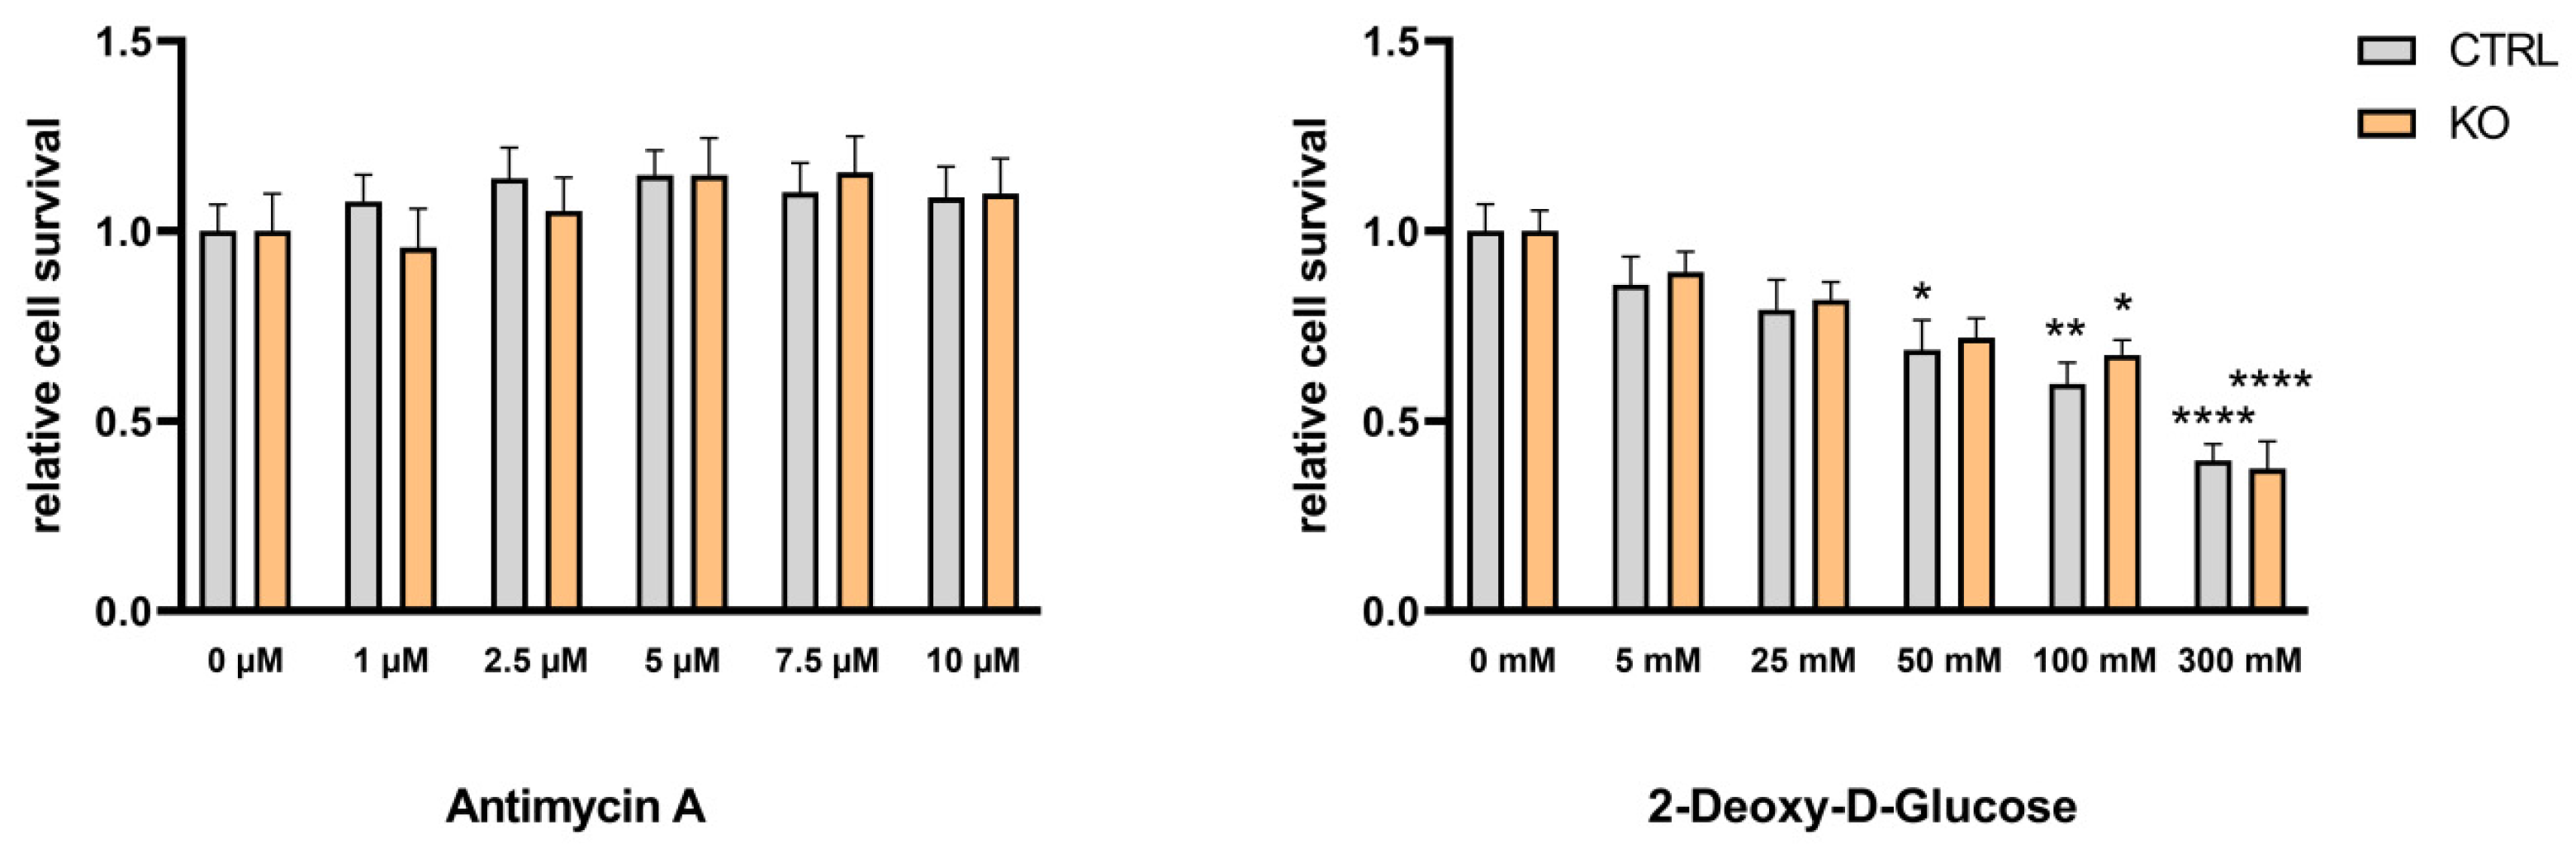
Figure 8.
Effect of antimycin A and 2-deoxy-D-glucose on viability of cytokine-stimulated TSPO-deficient and control C20 microglia cells. (A) Effect of antimycin A (1 – 10 µM) or (B) 2-deoxy-D-glucose (5 – 300 mM) on cell viability was tested using the Resazurin assay with TSPO-deficient and control C20 cells. Cells were treated with cytokine cocktail TNFα, IL-1β and INFγ (each 1 ng/ml) for 40 h. Values represent survival normalized to conditions without antimycin A or 2-deoxy-D-glucose. Treating the cells with 300 mM 2-deoxy-D-glucose revealed a significantly different viability of TSPO-/- and control cells (p = 0.0026, t = 3,991, df = 10, unpaired t-test). Means and p values see supplementary Tables S1 and S2.
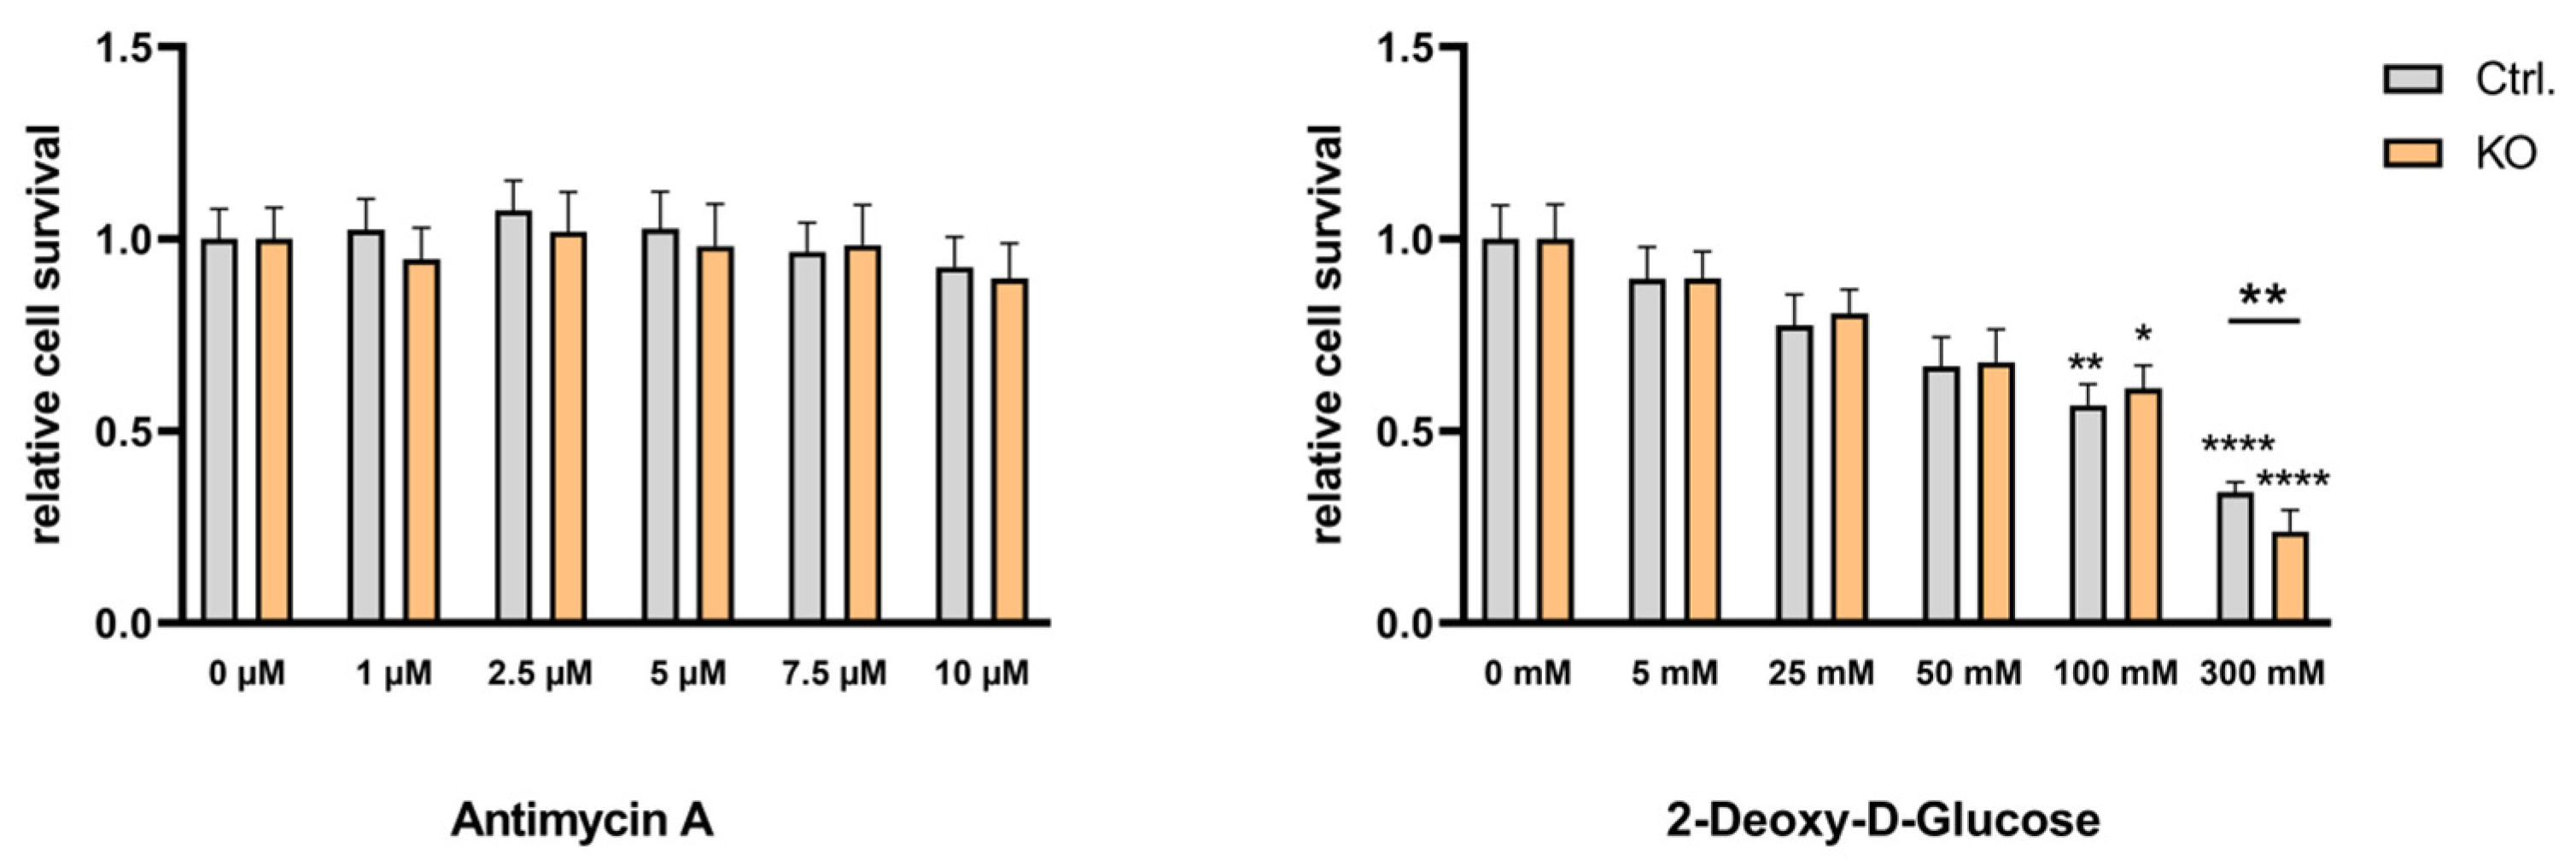
Figure 9.
Cytokine mRNA expression in TSPO-deficient human C20 microglia cells compared to control cells (basal/unstimulated conditions). (A) TNFα: 1.642 ± 0.358, p=0.1330 (B) IL6: 0.744 ± 0.025, p=0.0002; (C) IL1β: 0.409 ± 0.053, p<0.0001; (D) IL12A: 1.062 ± 0.094, p=0.5404; (C) IL8: 0.634 ± 0.119, p=0.283, (F) NOS2: 0.655 ± 0.130, p=0.0571. N = 6, Welch’s corrected t-test.
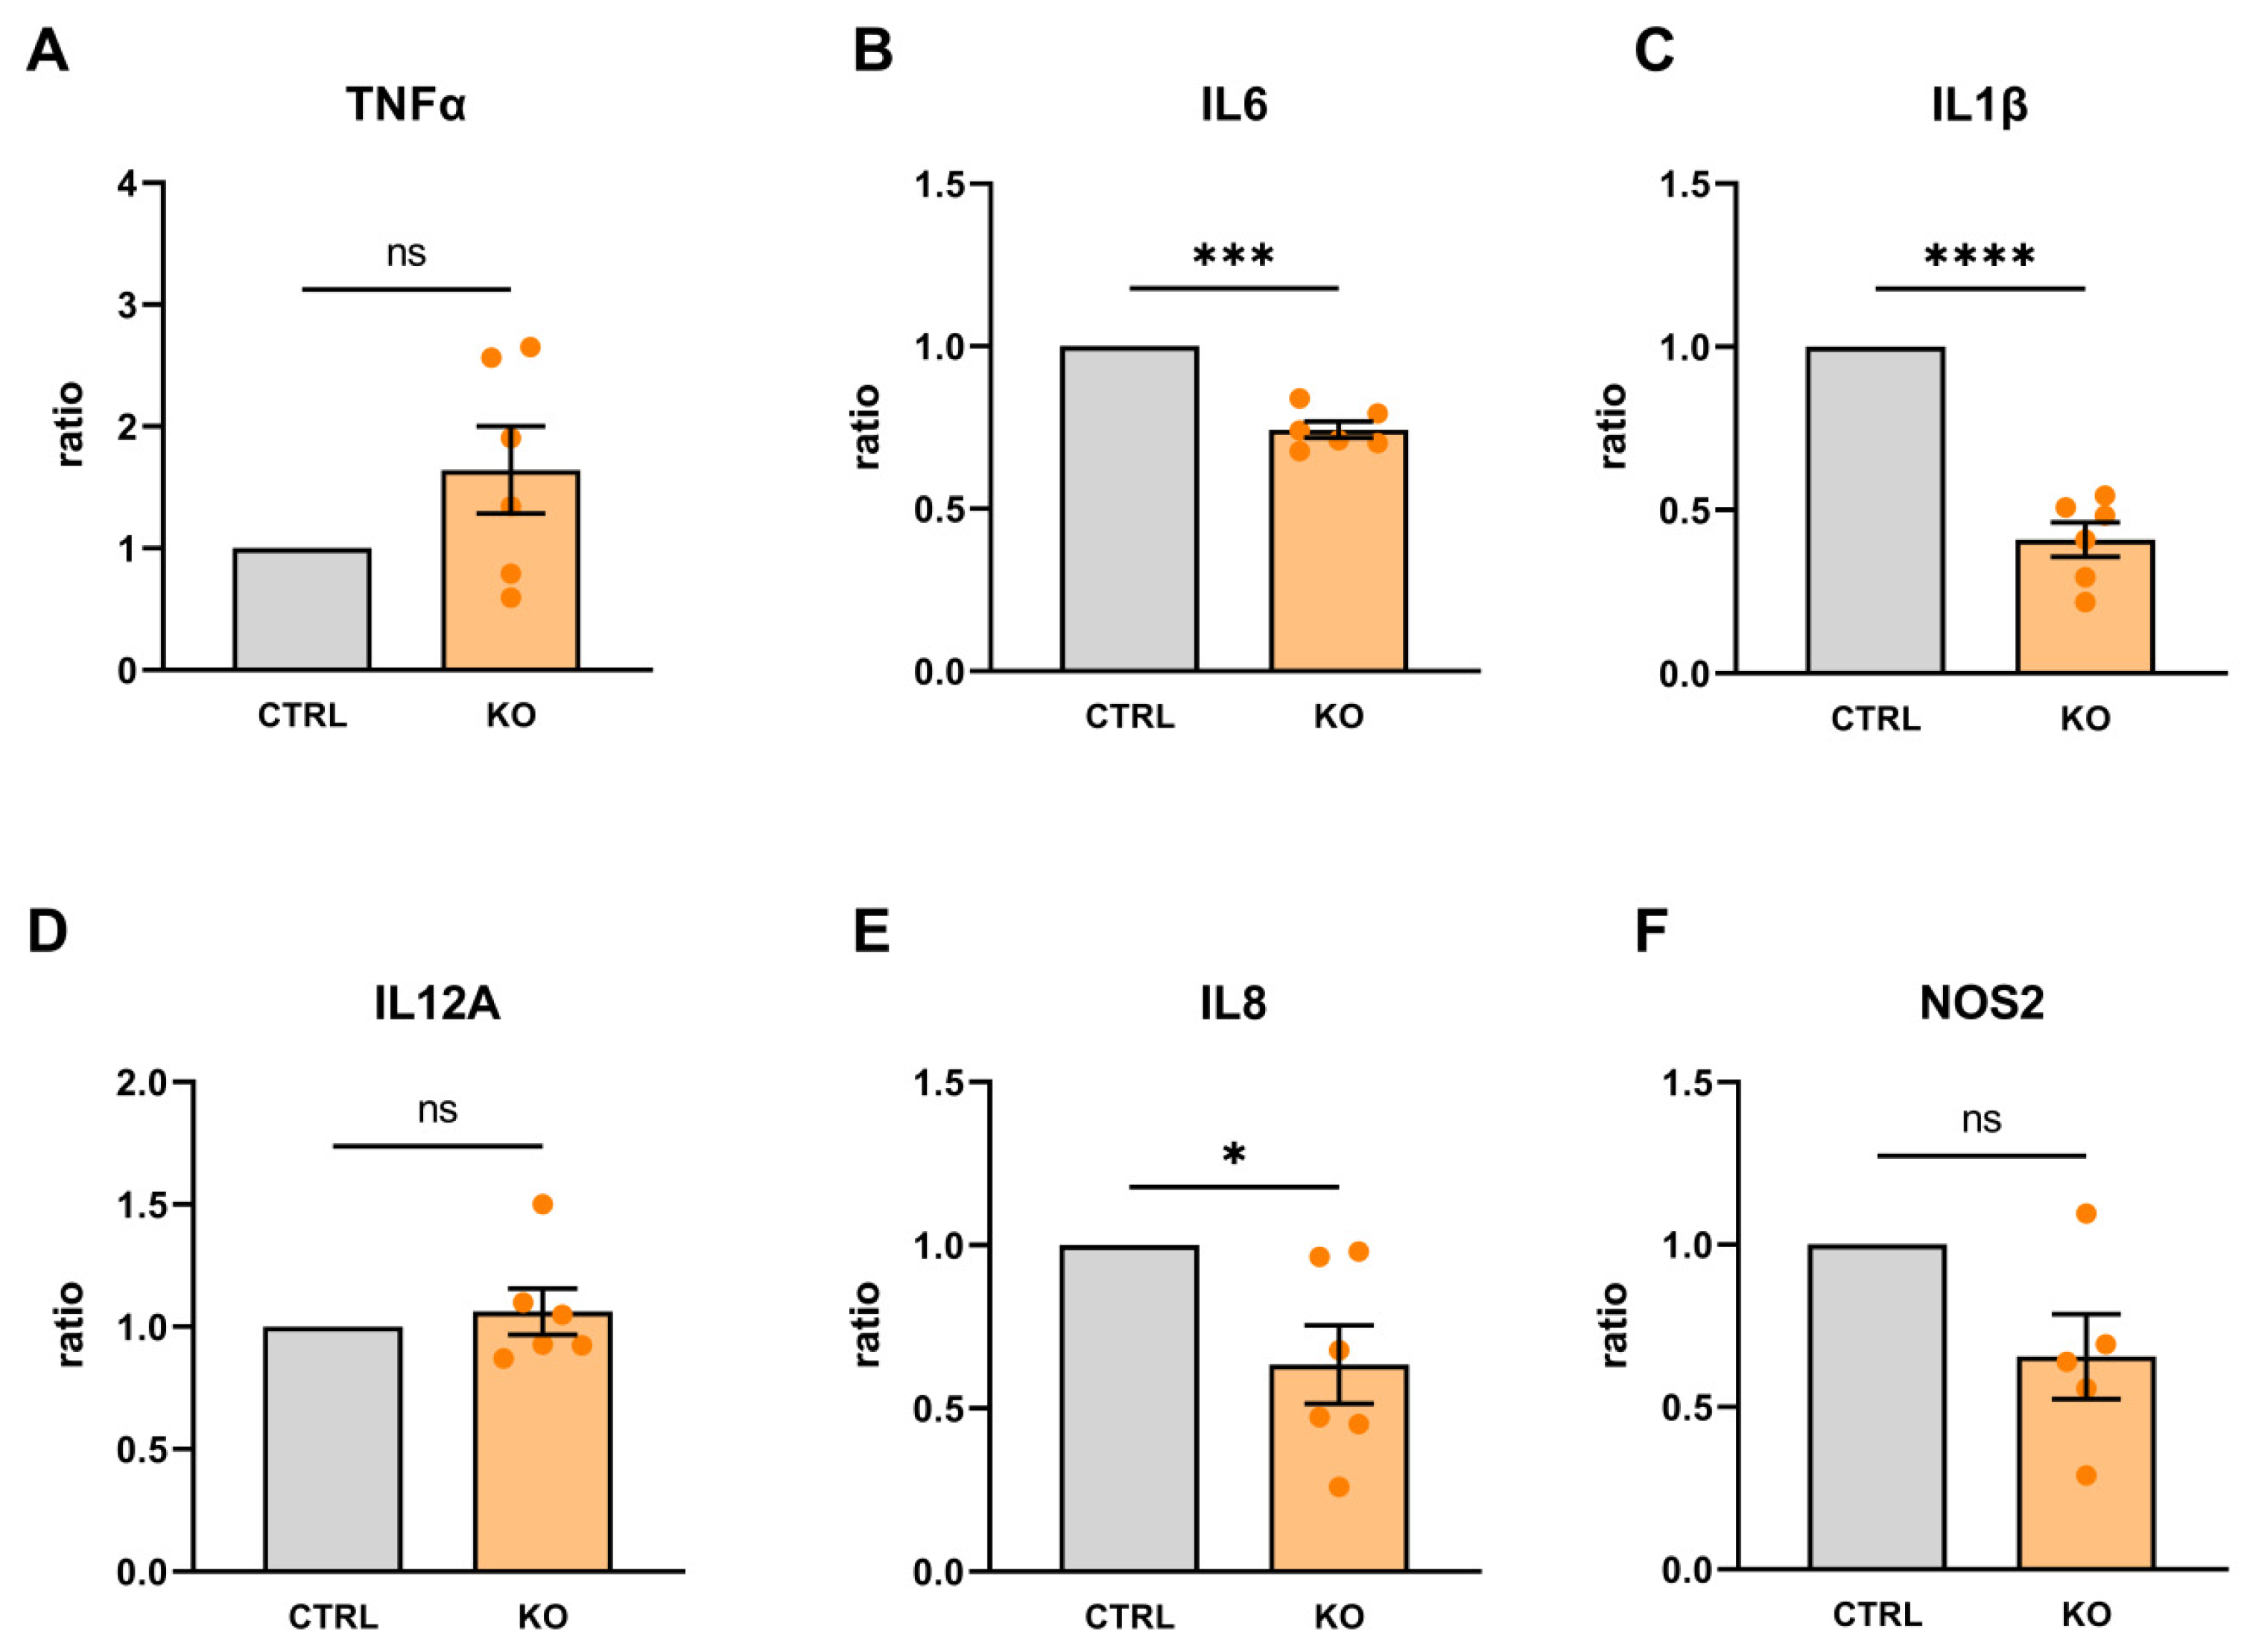
Figure 10.
Cytokine mRNA expression in TSPO-deficient human C20 microglia cells and control cells after treatment with cytokine cocktail (16 h) and related to unstimulated conditions of control (A) or TSPO-/- cells (B), respectively. N = 6, Welch’s corrected t-test; Data and p values see supplementary Table S3.
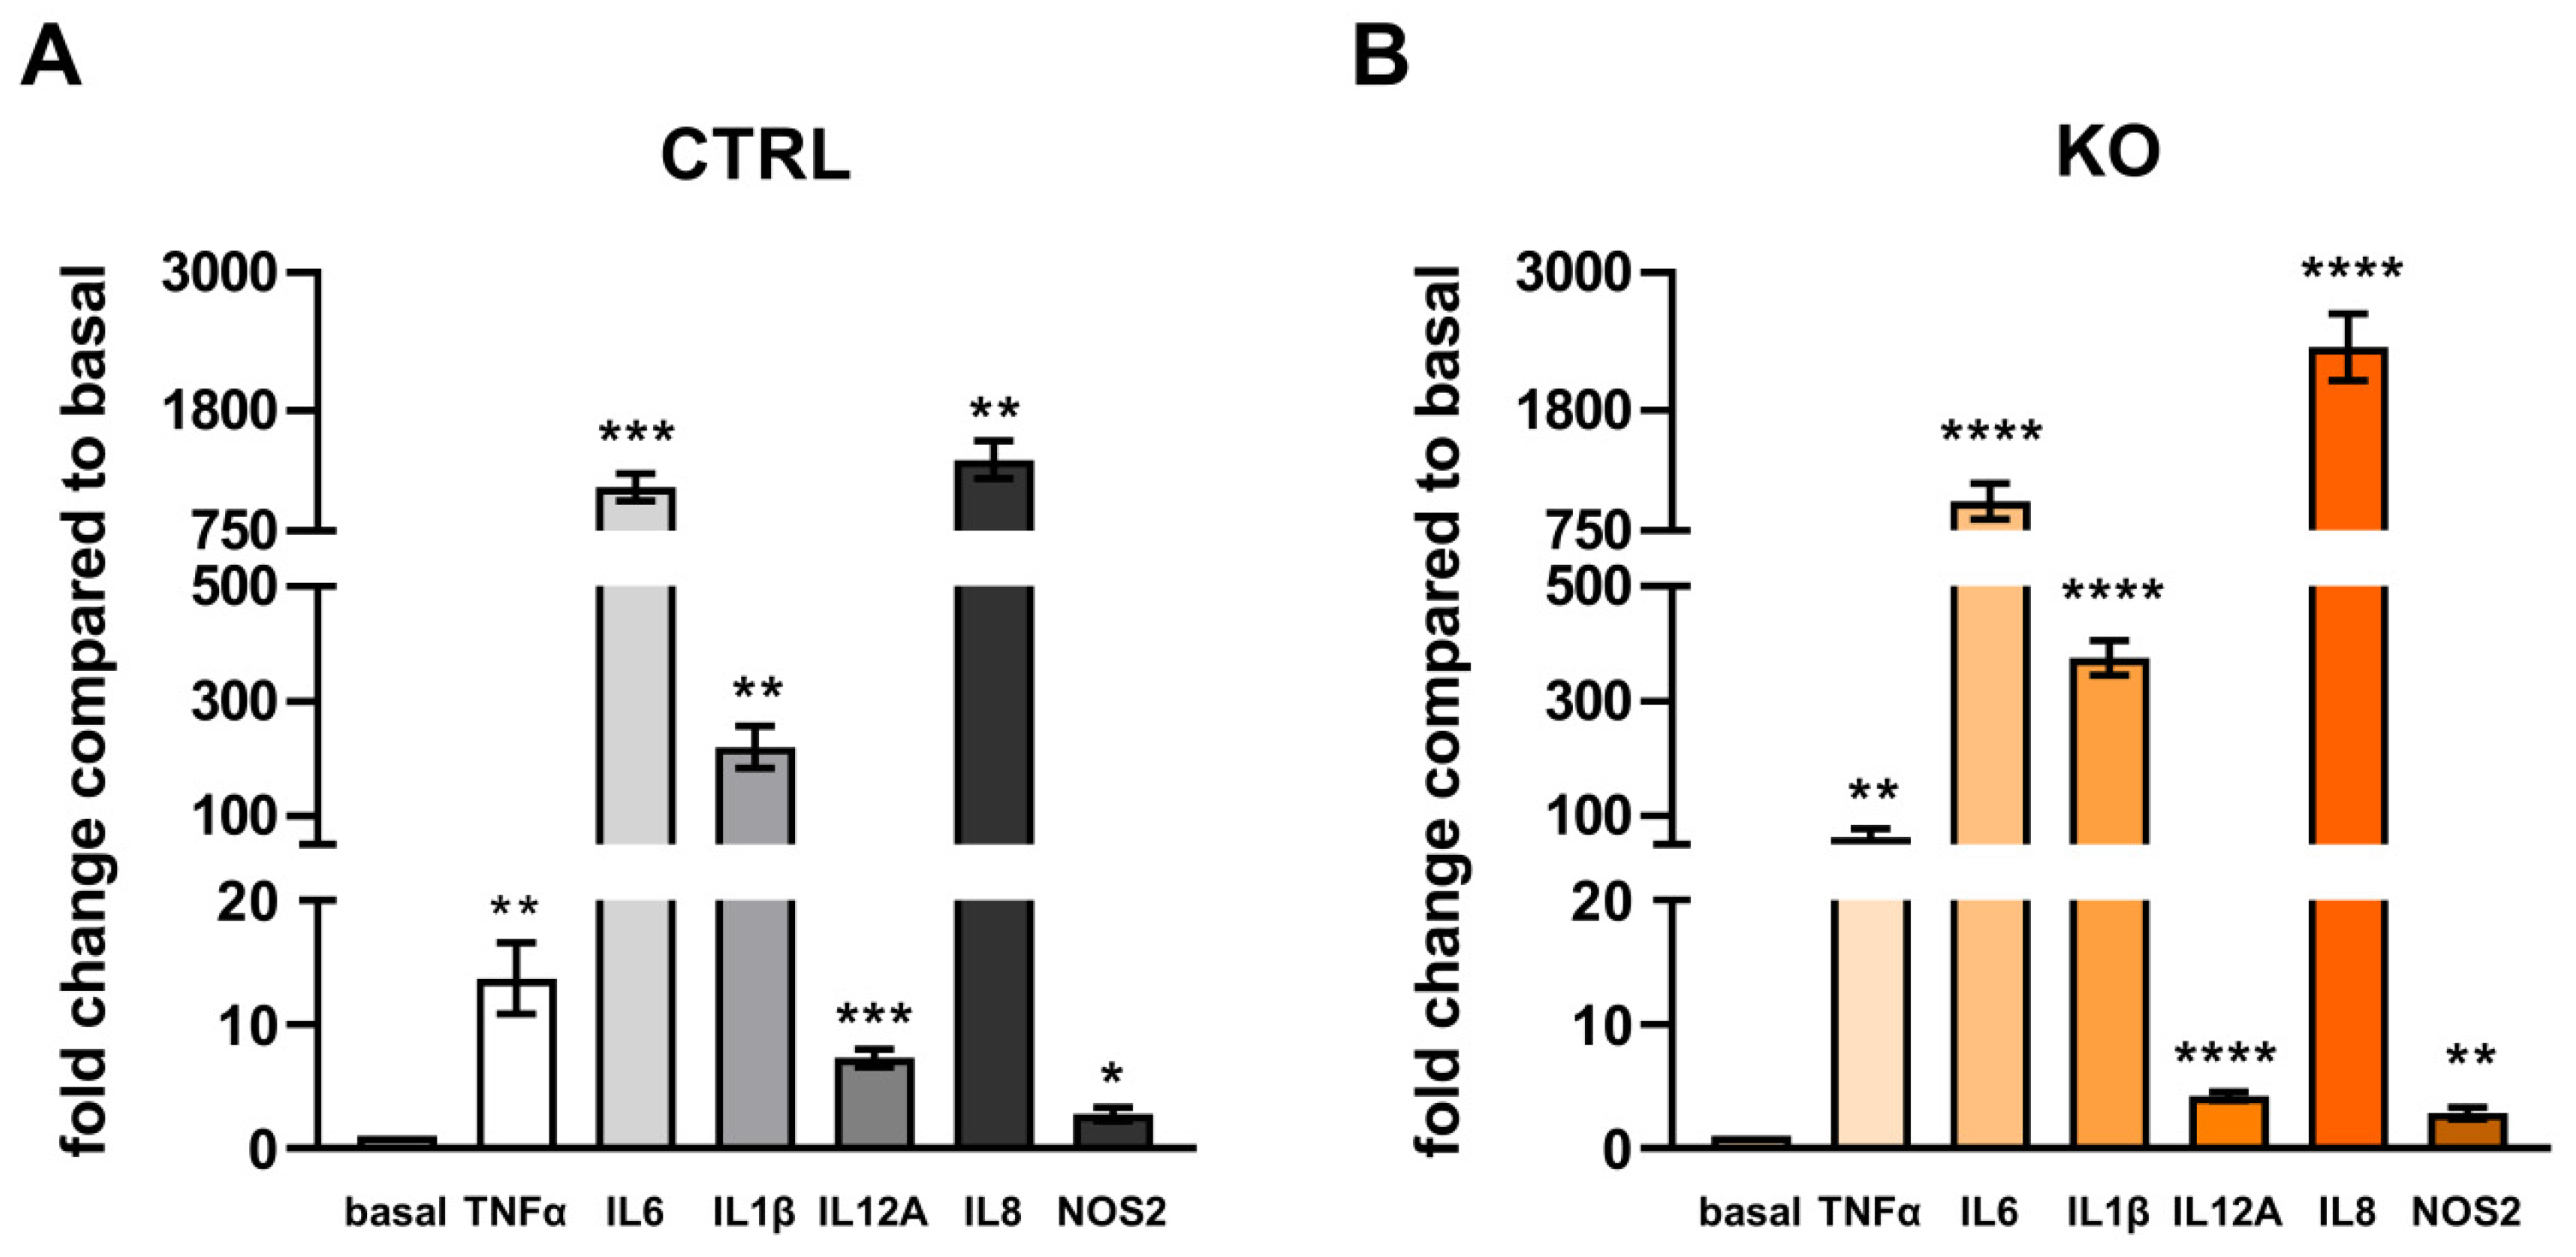
Figure 11.
Cytokine mRNA expression in TSPO-deficient human C20 microglia cells and control cells after treatment with the cytokine cocktail and related to the unstimulated control conditions of the C20 control (grey). (A) TNFα: 13.71 ± 2.845 vs 81.66 ± 20.32, p=0.02; (B) IL6: 1129 ± 119.4 vs. 662.7 ± 72.15, p=0.0098; (C) IL1β: 219.5 ± 36.70 vs 172.5 ± 6.305, p=0.2599 (D) IL12A: 7.301 ± 0.720 vs. 4.482 ± 0.521, p=0.0112; (C) IL8: 1368 ± 164.3 vs 1378 ± 280.3, p=0.9782, (F) NOS2: 3.047 ± 0.595 vs 2.668 ± 0.589, p=0.663. N = 6, Welch’s corrected t-test.
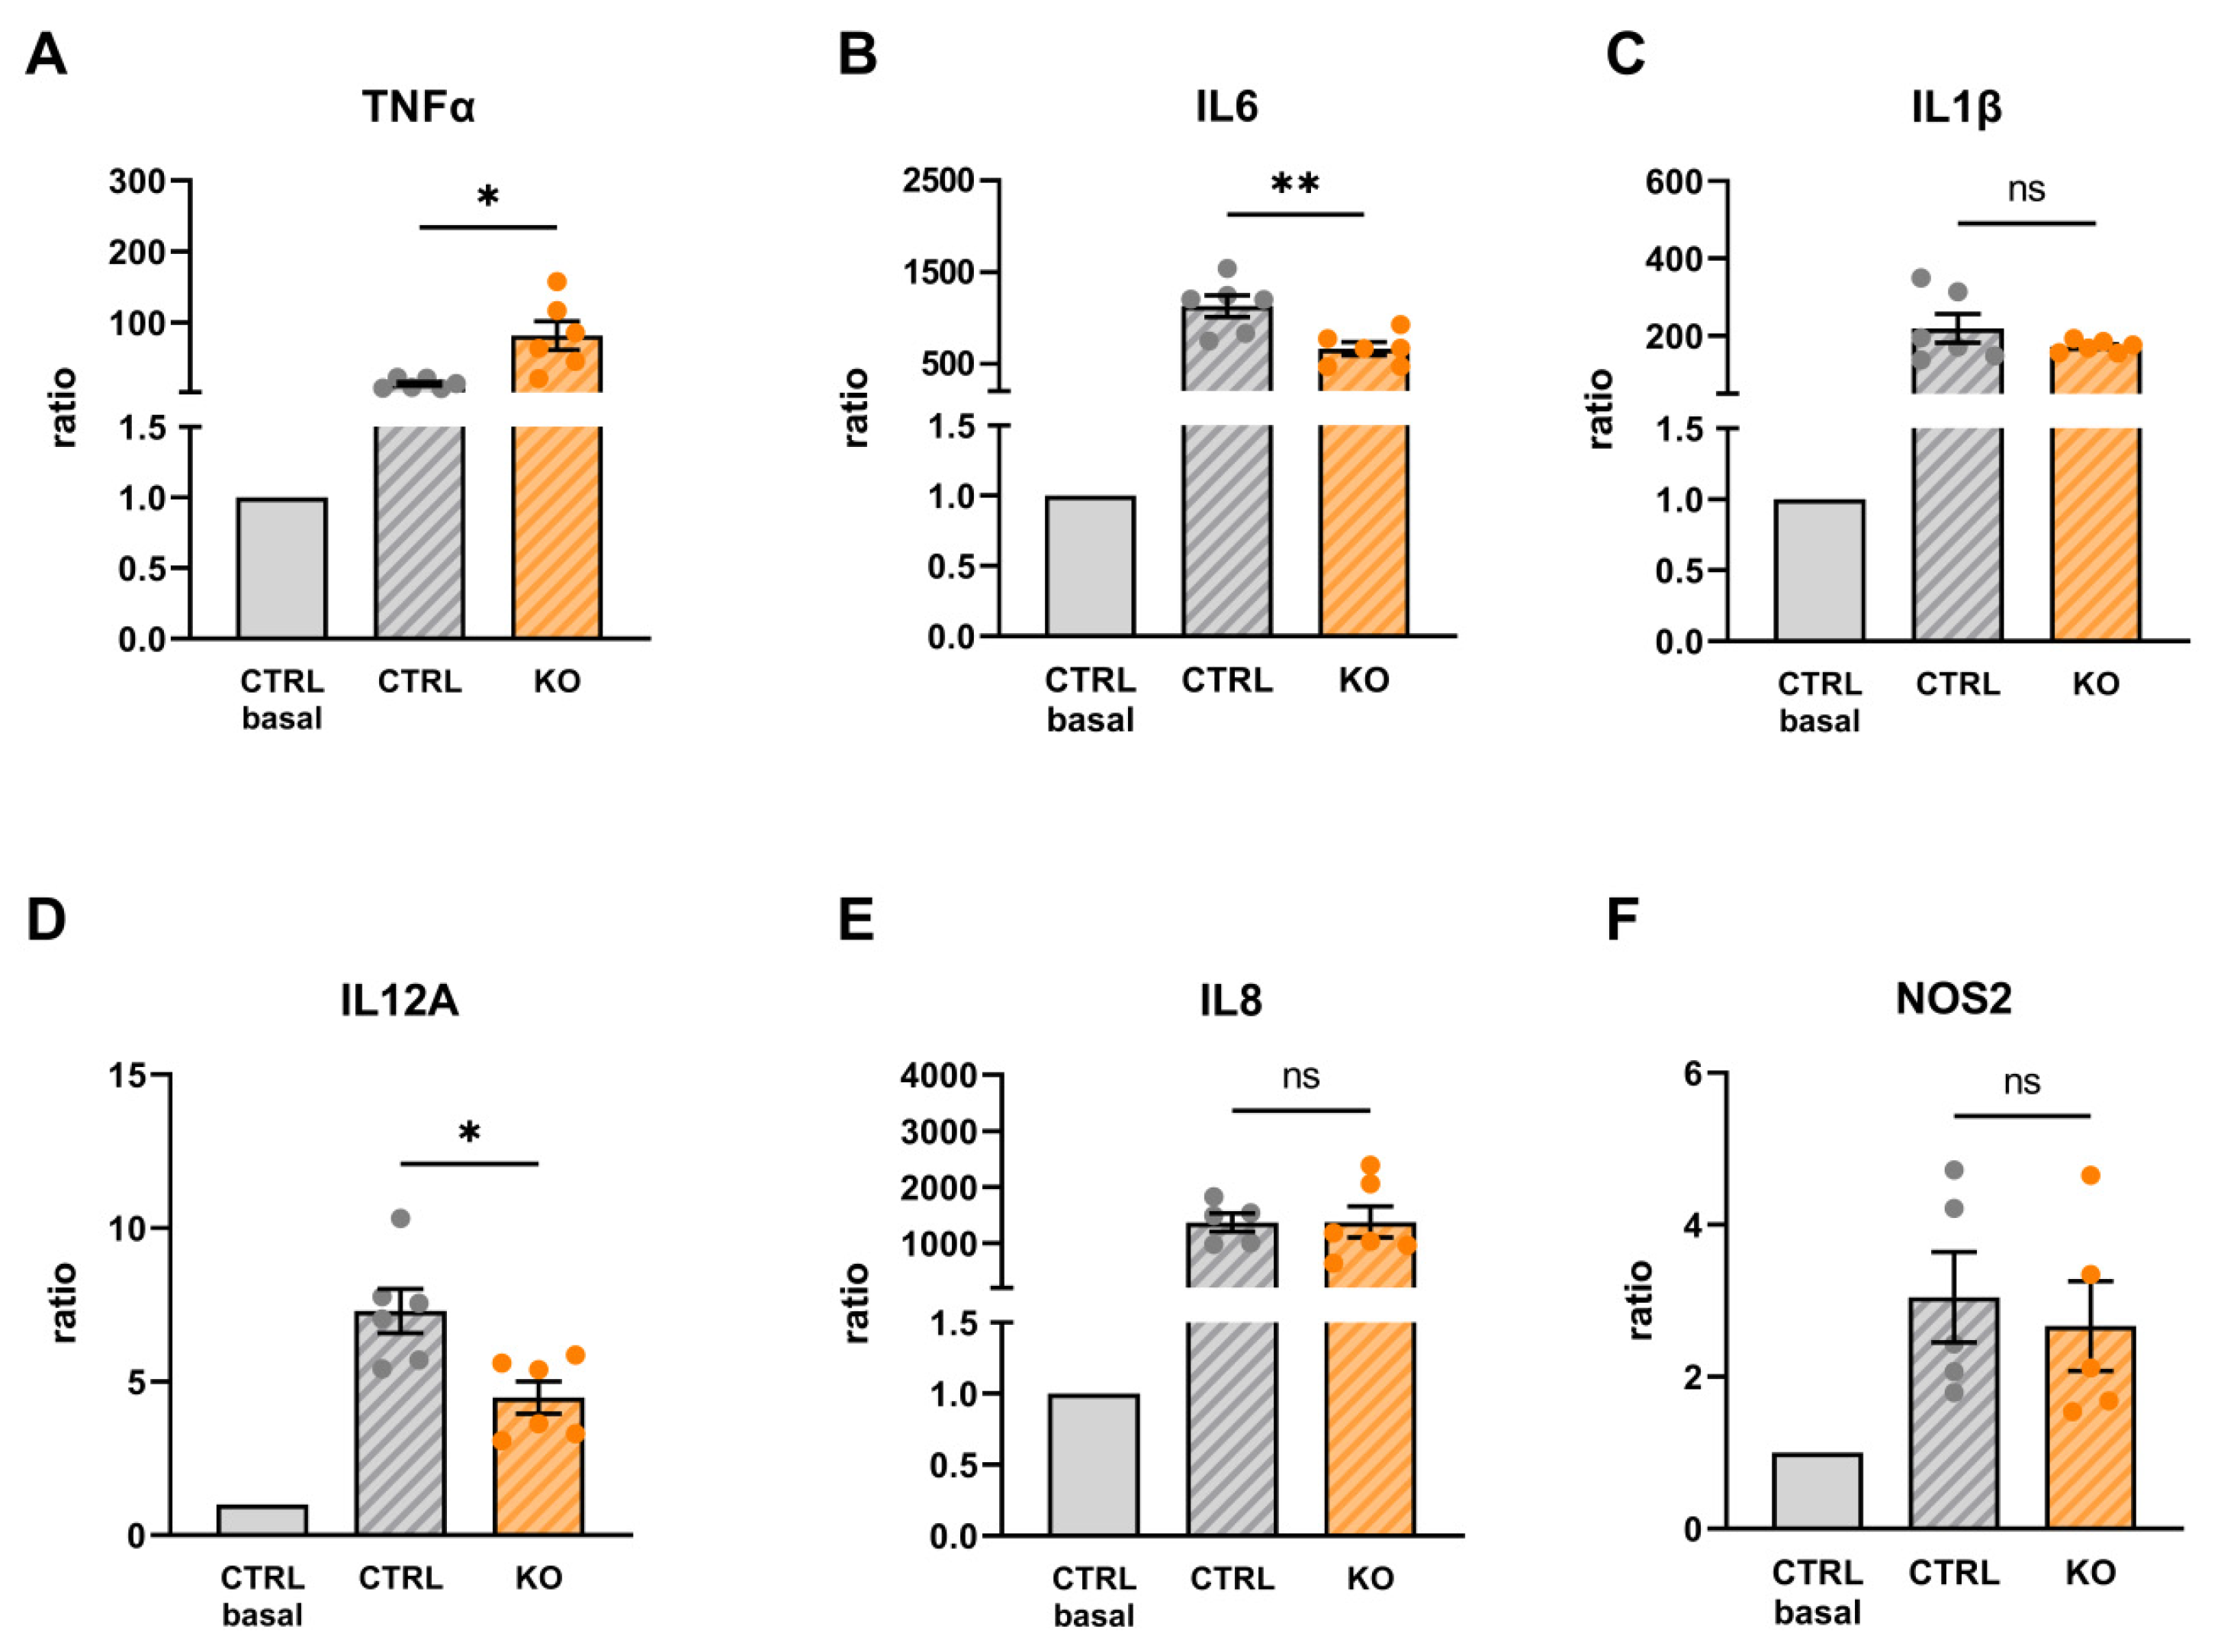

Table 1.
Primer sets used for PCR, sequencing and QRT-PCR.
| Primer name | Forward primer (5´-3´) | Reverse primer (5´-3´) |
|---|---|---|
| TSPO-ex1 | GAGGTGGCTTTGAGGAGTGA | GCAGGGTTGTCCAAGTTTTC |
| TSPO-ex2 | CTGGAAATGCGTTCACTCAG | GCCTGGAGAAGACCCTCTGT |
| TSPO-ex3 | GAAGCACTGCCAATGTGCTA | GCTTCGTGTGGGTTTTCCTA |
| TSPO-ex4 | AGTTGGGCAGTGGGACAG | GCAGATCCTGCAGAGACGA |
| TNFA | CCCCAGGGACCTCTCTCTAA | CAGCTTGAGGGTTTGCTACA |
| IL1B | CTGTCCTGCGTGTTGAAAGA | TGAAGACAAATCGCTTTTCCA |
| TSPO | TCTTTGGTGCCCGACAAAT | GGTACCAGGCCACGGTAGT |
| IL6 | CTCAGCCCTGAGAAAGGAGA | AGGTTGTTTTCTGCCAGTGC |
| IL12A | CATGCTGGCAGTTATTGATGA | TCAAGGGAGGATTTTTGTGG |
| NOS2 | GTATCCTGGAGCGAGTGGTG | GACCCAGTAGCTGCCACTCT |
| CXCL8 | TGCGCCAACACAGAAATTAT | TGAATTCTCAGCCCTCTTCAA |
| HPRT1 | TTGCTTTCCTTGGTCAGGCA | ATCCAACACTTCGTGGGGTC |
| Mt-TL1 | CACCCAAGAACAGGGTTTGT | TGGCCATGGGTATGTTGTTA |
| B2M | TGCTGTCTCCATGTTTGATGTATCT | TCTCTGCTCCCCACCTCTAAGT |
Disclaimer/Publisher’s Note: The statements, opinions and data contained in all publications are solely those of the individual author(s) and contributor(s) and not of MDPI and/or the editor(s). MDPI and/or the editor(s) disclaim responsibility for any injury to people or property resulting from any ideas, methods, instructions or products referred to in the content. |
© 2023 by the authors. Licensee MDPI, Basel, Switzerland. This article is an open access article distributed under the terms and conditions of the Creative Commons Attribution (CC BY) license (http://creativecommons.org/licenses/by/4.0/).
Copyright: This open access article is published under a Creative Commons CC BY 4.0 license, which permit the free download, distribution, and reuse, provided that the author and preprint are cited in any reuse.


