
Submitted:
03 May 2024
Posted:
07 May 2024
You are already at the latest version
Abstract
Brain pathological changes impair cognition early in disease etiology. There is an urgent need for understanding aging-linked mechanisms of early memory loss to develop therapeutic strategies and prevent the development of cognitive impairment. Tusc2, also named Fus1, is a mitochondrial-resident protein regulating Ca2+ fluxes to and from mitochondria impacting overall health. We reported that Tusc2-/- female mice develop chronic inflammation and age prematurely, causing age- and gender-dependent spatial memory deficits at 5 m.o. Therefore, we investigated Tusc2-dependent mechanisms of memory impairment in mice, comparing changes in resident and brain-infiltrating immune cells. Interestingly, Tusc2-/- female mice demonstrated proinflammatory increase in astrocytes, IFN-γ expression in CD4+T cells and Granzyme-B in CD8+T cells. We also found fewer FOXP3+ T-regulatory cells and Ly49G+ NK and Ly49G+ NKT cells in female Tusc2-/- brain, suggesting a weakened anti-inflammatory response. Moreover, Tusc2-/- hippocampi exhibited Tusc2- and sex-specific protein changes associated with brain plasticity, including mTOR activation, and Calbindin and CamKII dysregulation affecting intracellular Ca2+ dynamics. Overall, data suggest that dysregulation of Ca2+-dependent processes and proinflammatory brain microenvironment heighten in Tusc2-/- mice could underlie cognitive impairment. Thus, strategies to modulate the brain’s Tusc2-, Ca2+, and mitochondria-dependent pathways should be explored to improve cognitive health.
Keywords:
aging
; neuroinflammation
; cognitive impairment
; Tusc2
; Fus1
; mitochondria
; calcium
; brain immune populations
; sex-dependent changes
Abstract Brain pathological changes impair cognition early in disease etiology. There is an urgent need for understanding aging-linked mechanisms of early memory loss to develop therapeutic strategies and prevent the development of cognitive impairment. Tusc2, also named Fus1, is a mitochondrial-resident protein regulating Ca2+ fluxes to and from mitochondria impacting overall health. We reported that Tusc2-/- female mice develop chronic inflammation and age prematurely, causing age- and gender-dependent spatial memory deficits at 5 m.o. Therefore, we investigated Tusc2-dependent mechanisms of memory impairment in mice, comparing changes in resident and brain-infiltrating immune cells. Interestingly, Tusc2-/- female mice demonstrated proinflammatory increase in astrocytes, IFN-γ expression in CD4+T cells and Granzyme-B in CD8+T cells. We also found fewer FOXP3+ T-regulatory cells and Ly49G+ NK and Ly49G+ NKT cells in female Tusc2-/- brain, suggesting a weakened anti-inflammatory response. Moreover, Tusc2-/- hippocampi exhibited Tusc2- and sex-specific protein changes associated with brain plasticity, including mTOR activation, and Calbindin and CamKII dysregulation affecting intracellular Ca2+ dynamics. Overall, data suggest that dysregulation of Ca2+-dependent processes and proinflammatory brain microenvironment heighten in Tusc2-/- mice could underlie cognitive impairment. Thus, strategies to modulate the brain’s Tusc2-, Ca2+, and mitochondria-dependent pathways should be explored to improve cognitive health.
1. Introduction
Alzheimer’s disease (AD) is a complex, multifactorial disease affecting many individuals worldwide. The major risk factor for AD development is aging [1]. According to 2023 data from the World Health Organization (WHO), more than 55 million people have dementia worldwide, and every year, nearly 10 million new cases are added. Women are disproportionately affected by dementia [2]. Women are reported to have a higher incidence of MCI (Mild Cognitive Impairment) and AD than men [3]. Longer life expectancy, as well as the protective role of hormone estradiol diminished with age are the factors that are suspected to play a role in higher disease incidences in females than males [4,5,6]. However, the precise mechanisms of aging-linked AD and female susceptibility to AD are still not established but urgently needed.
The first clinical stage of AD, MCI, is characterized by a decline in cognitive function that mostly does not interfere with activities of daily living. Notably, only 30% of people with MCI progress to an irreversible stage of the disease characterized by severe memory loss and loss of independency [7]. Thus, understanding the mechanisms of MCI that drive the disease to an irreversible stage and developing early diagnostic tools and approaches to treat the primary cause of AD early, before amyloid plaque formation, is the task of the utmost importance.
Tusc2 (alternative name is Fus1) is an evolutionarily conserved, mitochondrial, nuclear-encoded protein expressed in every cell. We identified its function in mitochondria as a regulator of mitochondrial Ca2+ fluxes and, thus, energy and overall mitochondrial health. [8,9] Tusc2 proper function is especially critical in cells with high energy demands, such as immune and neural cells [10] [8]. We established that loss of Tusc2 in mice results in chronic inflammation [11], dysregulation of immune responses [8,9,12], and defects in NK cell maturation ([13]). In later studies, we characterized these mice as a model of premature aging, early olfactory and spatial memory impairments, and progressive age-dependent hearing impairment linked to mitochondrial deficiency. The majority of these signs are consistent with aging-linked MCI symptoms in humans and are the hallmarks of many neurodegenerative diseases [14]. Importantly, we established that a 50% reduction in Tusc2 activity is sufficient to induce disease [13]. Our published and preliminary data linked a decrease of Tusc2 in immune cells with inflammation [8].
Taken together, we hypothesize that Tusc2 KO mice could be a faithful model for characterizing early mechanisms and processes involved in the development of MCI and progression from MCI to dementia [15].
In this study, we address the Tusc2-dependent brain immune changes that may underly cognitive impairment, focusing on the early stages of the disease in 4 m.o males and females. Currently, the roles of brain residents and brain-infiltrating immune cells in memory loss are an area of active research. Immune cells such as T cells, B cells, NK cells, and monocytes can infiltrate the brain in response to signals of inflammation or tissue damage [16]. Infiltrating immune cells can contribute to the neuroinflammatory response initiated by resident microglia and astrocytes and release proinflammatory cytokines, modulating or amplifying the inflammatory cascade in the brain [17]. Thus, the brain’s immune cells may play protective and pathological roles in developing the disease.
Most importantly, we characterize Tusc2- age- and gender-dependent immune changes in the brain that may provide knowledge on the cause of early memory impairment in these mice. Finally, we characterize important, AD-specific molecular changes in the hippocampus, a part of the brain involved in short-term memory consolidation and storage. These studies will be instrumental in understanding the immune mechanisms of memory impairment and their differences between males and females.
2. Results
2.1. Loss of Tusc2 Caused Deficits in Hippocampal-Dependent Short-Term Spatial Memory
To compare the effects of Tusc2 loss in male and female mice on cognitive functions, 4 m.o KO mice of both genders were subjected to a battery of behavioral tests (Figure 1A). Tusc2 KO males showed significant short-term spatial memory deficit in Y-maze tests based on lower percentage of correct alternation as compared to their WT male counterparts (F (1, 52) =12.74, p=0.0055) (Figure 1B). 4 m.o Tusc2 KO females did not show significant difference in Y-maze test performance as compared to 4 m.o WT mice (P=0.3866). The total number of entries during testing was also recorded, and no significant difference was found across groups (Figure 1C). Recognition memory was evaluated using the Novel Object Recognition (NOR) test (Figure 1D). We found no Tusc2- or sex-dependent differences in the performance of this test. Finally, we used the open field test to evaluate the locomotor function and anxiety-like behavior; however, the time spent in the peripheral and central zone showed no significant difference between Tusc2 KO and WT mice of both sexes (Figure 1E,F), suggesting no anxiety or locomotor function deficiency in Tusc2 KO mice of both genders.
Thus, we demonstrated in this study that 4 m.o Tusc2 KO but not WT males have spatial memory deficits. In our early study, we demonstrated what 5 m.o. Tusc2 KO but not WT females have significant memory deficits [18]. Since inflammation, particularly chronic inflammation, is a critical pathology linked to memory impairment [19], we set out to investigate neuroinflammation in the Tusc2 KO mice of both sexes via analysis of brain immune cells.
2.2. Tusc2- and Sex-Dependent Changes in Brain Immune Populations
To investigate the impact of sex and Tusc2 deficiency on brain health and the central nervous system (CNS), we evaluated key immune populations associated with neurological function and CNS defense mechanisms [20,21,22,23,24,25,26,27,28,29,30,31,32,33,34,35,36,37,38,39,40,41,42,43,44,45,46] (Figure S1). We analyzed the brain resident cells, including microglia and astrocytes, which function as the primary immune effector cells of the CNS and reside mainly in the brain parenchyma [47,48]. We also analyzed the populations of innate and adaptive immune cells that presumably come from the periphery in response to proinflammatory changes in the brain [49] (Figure S2). Flow data is expressed as the overall percent or proportion of cells (%) and Mean Fluorescence Intensity (MFI) of cytokine expression. The percentage indicates the population’s proportion, while MFI shows the relative number of molecules produced or expressed by a cell [50]. It is worth noting that although both parameters are determined using the same detection channel, they characterize different parameters.
2.2.1. Tusc2 Deficiency Causes Astrogliosis and Increased Proinflammatory Immune Subtypes
Microglia support brain immune homeostasis, acting as critical immune effector cells in the CNS [51]. At the same time, astrocytes participate in neurotransmitter uptake and recycling, inflammation, synaptic activity, and BBB maintenance [48]. Thus, we evaluated the proportion of microglia (CD11b+/CD45+/TMEM119+/F4/80+), activated microglia based on expression levels of CD45+ in total microglial population in the brains of Tusc2 WT and KO male and female mice (Figure 2A) observing significant difference in activated microglial populations only between WT genders (p=0.0356) (Figure 2B). However, upon analyzing the proportions of activated (CD45bright/CD11b+) and resting microglia (CD45dim/CD11b+) [52,53] (Figure 2C), we found that the percentage of the activated subpopulation in female Tusc2 KO mice was significantly higher as compared to the female WT (p<0.0001) and male Tusc2 KO mice (p=0.0006) (Figure 2D). No significant changes were observed in the percentage of resting microglia between the groups (Figure 2E). These results demonstrates that even when the proportion of microglia is equal between the WT and Tusc2 KO males and females, female Tusc2 KO brain microenvironment contains some factors that causes microglial activation. Moreover, analyzing the proportion of astrocytes (CD11b+/CD45+/ACSA2+) (Figure 2F), we revealed a ~ 2-fold increase in the percentage of astrocytes in females Tusc2 KO (p=0.0002) vs. WT (Figure 2G).
The proportion of cytotoxic CD8 T, CD4 T helper, Treg, NK, and NKT cells was also evaluated. The number of activated CD4 T cells (CD4+/CD25+) in Tusc2 KO (Figure 3A) shows that males were similar to their WT counterparts. In contrast, in Tusc2 KO females, there was a significant decrease in the number of CD4+/CD25+ T cells between groups (p<0.0001) and between the WT genders (p=0.0227) (Figure 3B).
Th1 cells are proinflammatory T cells that have been observed in the brains of Parkinson’s disease patients and experimental animal models of EAE [54,55]. To identify the T helper cell subset (Th1), we analyzed IFN-γ expression in CD4+CD3+ T cells (Figure 3C). The overall Th1 cell population size was not significantly different between the groups (Figure 3D). However, MFI revealed a significant increase in the expression levels of IFN-γ in Th1 cells from female Tusc2 KO brain (p=0.0068) (Figure 3E). No significant difference was seen in KO males.
CD8+ T cells are commonly considered as proinflammatory, although some early evidence reported their immune-suppressive function [56]. By gating the CD8+ T cells population (CD8+/CD25+) (Figure 4A), we showed that brain of Tusc2 KO, both males and females, have significantly decreased (p=0.0006 and p<0.0001, respectively) compared to their WT counterparts (Figure 4B). We also analyzed the effector subtypes of CD8+ T cells (CD3+/CD8+/CD28+/Granzyme B+) (Figure 4C). Interestingly, we observed a significant decrease in the number of this population in both male (p<0.0001) and female Tusc2 KO mice (p=0.0003) as compared to their WT counterparts and between the Tusc2 KO genders (p=0.0032) (Figure 4D–F). However, we detected a trend toward increased expression (MFI) of the granzyme B in CD3+/CD8+ T cells in Tusc2 KO females (Figure 4G). These findings suggest that the Tusc2 deficiency causes chronic proinflammatory processes in the brain through the action of both resident and infiltrating immune cells, which may consequently lead to MCI and neurodegeneration.
2.2.2. Tusc2 Deficiency Impairs Anti-Inflammatory Immune Populations.
Guided by the proinflammatory changes we identified in the brain of Tusc2 KO mice, we assessed immune inhibitory profiles, the other branch of the inflammation process. Treg cells dampen the inflammatory responses of effector T cells under normal physiological conditions. The populations of Treg cells (FoxP3+/CD3+/CD4+) were evaluated in male and female WT and Tusc2 KO mice (Figure 5A). Flow cytometry analysis revealed that the proportion of Tregs was significantly decreased in male (p=0.0001) and female (p<0.0001) Tusc2 KO mice as compared to their WT counterparts and between the Tusc2 KO genders (p<0.0001) (Figure 5B). Furthermore, MFI analysis also revealed a decreased expression of FoxP3 in Treg subpopulation of the Tusc2 KO males (p=0.0089), and females (p=0.0089) (Figure 5C) suggesting suppression of anti-inflammatory mechanisms in the Tusc2 KO brain.
We also analyzed NK and NKT cell subsets. NK cells can regulate the adaptive immune responses and directly kill infected cells through the release of perforin and granzymes [57]. NKT cells also play diverse and essential roles in rapid response to infection, regulating immune responses, and linking innate and adaptive immunity [58].
Flow analysis revealed a significant decrease in NK cell population (CD11b+/CD3-/CD49+/Ly49G+) in female Tusc2 KO brain (p<0.0001), while no difference was found between male Tusc2 KO and WT (Figure 6A,B); also, significant differences were observed between the Tusc2 KO (p<0.0001) and WT genders (p=0.0004). Analysis of NKT cells (CD11b+/CD3+/CD49+/Ly49G+) revealed a significant decrease in the overall proportion of these cells in Tusc2 KO brain in both males (p=0.0118) and females (p<0.0001) (Figure 6C,D).
Lastly, we evaluated the population of B cells involved in recognizing and eliminating pathogens, formation of immunological memory, and mounting effective immune responses [59]. We detected a significant decrease in the number of activated B cells (CD19+/CD25+) in both male (p=0.0343) and female Tusc2 KO mice (p<0.0001), as compared to their WT counterparts (Figure 6E,F).
Overall, our results suggest that Tusc2 deficiency disrupts immune populations in the brain, which could cause neuroinflammation.
2.3. Tusc2 Is Essential for the Homeostasis of Some Important CNS Proteins Regulating Intracellular Ca2+ Dynamics and Synaptic Plasticity.
In the next step, we analyzed the expression of the key proteins involved in synaptic plasticity, energy metabolism, cytoskeleton structure, calcium signaling, and other brain functions that, when dysregulated, could lead to cognitive impairment. (Figure 7A). Glial fibrillary acidic protein (GFAP) plays a critical role in the CNS glial cells, helping to maintain cell structure and support nearby neurons and BBB integrity [60]. The Western Blot (WB) analysis revealed that GFAP protein was significantly decreased in the hippocampi of both male and female Tusc2 KO mice (p=0.0038) (Figure 7B). Calcium/calmodulin protein kinase II (CaMKII) involved in synaptic plasticity, calcium signaling, dendritic spine morphogenesis [61,62,63], etc. was significantly upregulated in both male and female Tusc2 KO vs. WT mice (p=0.0079) (Figure 7C). Another calcium-binding protein critical for neuronal health, Calbindin, [64] was also found to be significantly upregulated in male Tusc2 KO hippocampi, while we did not see differences in Calbindin between female Tusc2 KO and WT mice at this age (Figure 7D).
Chronic activation of the mTOR pathway in the brain is linked to protein aggregation, impaired autophagy, oxidative stress, neuroinflammation, and excitotoxicity. We used pS6/totalS6 protein ratio as an indicator of mTOR pathway activation and found it was significantly increased in female Tusc2 KO hippocampi compared to WT females (p=0.0330). Male Tusc2 KO mice show a trend in upregulation in pS6/S6 that did not yet reach statistical significance at this young age (p=0.0925) (Figure 7E). Our results suggest that Tusc2 plays a critical role in cognitive function by mediating key pathways involved in learning and memory formation, neuronal cellular structure, synaptic plasticity, proteostasis, and calcium related processes. Moreover, the deficiency of Tusc2 promotes activation of the mTOR pathway, a critical pathology found in AD patients’ brains [65,66].
2.4. Human Tusc2 RNA Levels Progressively and Significantly Decrease with Age across Various Brain and Immune Tissues.
In order to investigate the potential association between the Tusc2 KO model of premature aging and the aging process in humans. We analyzed the publicly available genotype-tissue expression (GTEx) database (https://gtexportal.org/) to examine changes in tissue-specific TUSC2 expression in distinct brain regions and whole blood using six different age groups. Notably, our linear regression analysis revealed a significant and progressive reduction in TUSC2 expression levels in immune and brain tissues with increasing age (whole blood: p < 0.00001; Frontal cortex: p = 0.0003; Hippocampus: p = 0.0002; Brain amygdala: p = 0.0003) (Figure 8A). These results from the negative correlation between the expression of the Tusc2 levels and age (Figure 8B) suggest that the changes related to the increase in the generation of inflammatory populations, as well as the decrease in spatial cognitive ability, could be closely related to the loss of Tusc 2 expression during aging in humans, which might be fundamental in cognitive degeneration developing in early stages.
3. Discussion
Impaired cognitive function is the main symptom of MCI and AD. Earlier, we showed that 5 m.o female Tusc2 KO mice have significant cognitive deficits when compared with WT females [67]. Here, we explored memory deficit in 4 m.o old Tusc2 KO mice of both sexes using the Y-maze test that measures short-term spatial working memory [68,69,70]. 4 m.o old Tusc2 KO mice also have short-term memory deficit; however, males showed statistically significant difference while female mice showed only a trend. This observation led us to conclude that young male Tusc2 KO mice age earlier than female Tusc2 KO mice, although both genders age earlier than WT mice. This conclusion is consistent with human studies that show that men biologically age earlier than women [71].
Chronic inflammation and neuroinflammation play a paramount role in the development and progression from MCI to the final stages of dementia [72]. Both innate and adaptive arms of immune response are involved in this process. Characterizing early changes in brain innate and adaptive immune subsets that happen during early memory impairment (Mild Cognitive Impairment or MCI stage) is essential. Several studies have noted the importance of the brain’s innate and adaptive immunity functions [73]. We specifically aimed to include minor immune subsets as less characterized subsets in human dementia. Neuroinflammation may initially start with the activation of CNS resident immune cells, microglia, and astrocytes [72]. Microglia are the brain resident macrophages involved in phagocytic clearance of cell debris and protein or other deposits in the brain [47,74], and, thus, play a role in all diseases of the CNS [75,76,77,78]. We did not observe Tusc2-dependent differences in the size or activation status of the microglial population. Since we analyzed microglia from young brains, we believe that pathological changes in microglia of Tusc2 KO mice could happen at a later age.
Furthermore, examining the proportions of both activated and resting microglia by evaluating the proportions of activated (CD45bright/CD11b+) and resting microglia (CD45dim/CD11b+) [52,53], our findings indicate that the percentage of the activated subpopulation in female mice from the Tusc2 KO group was significantly higher compared to both the WT group and the Tusc2 KO males. These results suggest the possibility of a sex-specific effect of Tusc2 KO on microglia activation despite maintaining equal proportions of microglia between the wild-type and Tusc2 KO groups. However, an analysis of additional subtypes of microglia related to neurodegeneration will be helpful in understanding if it plays a role in Tusc2-related memory impairment.
Astrocytes are the most abundant cell type of the CNS, outnumbering neurons in the human brain [79]. They play a key role in metabolic homeostasis, antioxidant defense, energy storage, mitochondria biogenesis, tissue repair, and synapse modulation by transferring mitochondria to neurons and supplying the building blocks of neurotransmitters [79]. Thus, mitochondrial and Ca2+ dysregulation caused by Tusc2 loss in astrocytes could be detrimental to astrocyte functions and, thus, brain cognitive health. Astrocytes are crucial regulators of innate and adaptive immune responses in the injured CNS [58,80]. Interestingly, female Tusc2 KO mice have a remarkable increase in astrocyte population compared to female WT mice, suggesting pathological proliferation (activation) of astrocytes in female Tusc2 brain caused by a proinflammatory state of astroglia. When the brain is injured or diseased, astrocytes respond by proliferating and increasing in size [81]. This is called astrogliosis, and it is a common event in AD patients’ brains [34]. Our early studies showed that Tucs2-deficient T cells, peritoneal macrophages, and epithelial and fibroblast cells display chronic proinflammatory signatures [8,9,11,12,82,83]. Thus, astrogliosis in Tusc2 KO brain is consistent with the proinflammatory phenotype of Tusc2-deficient cells. What was intriguing is that only the female brain showed astrogliosis at the age of 4 months, while male WT and Tusc2 KO astrocyte populations were indistinguishable, suggesting that sex plays a significant role in the Tusc2-dependent immune responses of the brain.
The central nervous and peripheral immune systems are co-evolved; thus, crosstalk between immune pathways and neuronal circuits influences neurological diseases and behavioral responses [84]. Mechanisms responsible for the vicious, inflammatory loop in the brain that turns into chronic disease are not well understood. One possible mechanism is based on persistent inflammation coming from the periphery that can permanently change cognitive and behavioral states and lead to neurodegenerative disorders [85]. Some molecules associated with adaptive immune responses, such as interleukin 4 (IL-4), interferon-γ (IFN-γ), and interleukin 17 (IL-17), have been associated with neurological behaviors and AD [86,87,88,89].
We observed multiple Tusc2- and gender-dependent changes in adaptive immune populations isolated from the brain. Thus, we found a dramatic decrease in Treg lymphocytes in male and female Tusc2 KO mice. Under normal physiological conditions, Treg cells have been shown to dampen the inflammatory responses of effector T cells, thus suggesting a neuroprotective role of these cells [90]. Moreover, ex vivo expansion of Treg cells with amplified immunomodulatory function suppressed neuroinflammation and alleviated AD pathology in vivo, thus directly implicating these cells in protection from neurodegeneration [91]. Our finding of severe reduction in Treglymphocyte number suggests a neuroprotective cellular mechanism deficiency in Tusc2 KO mice.
The IFN-γ expression is controversial in the brain, with its activation of specific immune cells being neuroprotective or neurogenerative [92]. It has been found that IFN- priming of microglia can induce proliferation and activation of these brain resident macrophages, which can contribute to mechanisms that contribute to cognitive impairment and T cell infiltration early on in the neurodegenerative process [93]. We found a significant increase in IFN-γ-expressing Th1 cells in female Tusc2 KO vs. female WT mice. IFN-γ -expressing Th1 cells has been associated with memory function and hippocampal neurogenesis [94,95]. Conversely, Th1 cells have also been associated with the development of Parkinson’s disease in both experimental animal models and humans [96]. Thus, we suggest that increased expression of IFN-γ in Th1 cells in the female Tusc2 KO brain, similar to the one seen in patients with neurodegenerative diseases, is involved in the development of cognitive impairment.
Furthermore, we found a significant Tusc2-specific decrease in both males and females CD8+/CD25+ and CD8+/CD28+ T cells. However, like with IFN-γ expression in CD4+ T cells, female Tusc2 KO exhibits a trend to increased granzyme B expression in CD8+/CD28+ T cells. A recent study suggests that the infiltrated activated CD8 lymphocytes can trigger the proinflammatory response, directly contributing to neurodegeneration [97].
The exact role of NK cells in neurodegenerative disease is controversial, with these cells capable of ameliorating disease or exacerbating pathology [98,99,100]. In our study, we found that inhibitory mechanisms mediated by NK cells are disrupted in the Tusc2 KO females based on the significantly decreased expression of Ly49G. This receptor contributes directly to the education and self-tolerance of the NK cells [101]. Studies in mice and humans reported that NK cells from AD patients are more reactive, observing an increase in the production of IFN-γ and TNF-α, which is associated with a significant cognitive impairment. On the contrary, the depletion of these reactive populations led to improved cognitive function via reducing inflammation [102,103].
In addition, this decrease in Ly49G expression was observed in the CD11b+/CD3+/CD49+/Ly49G+ NKT cell population. NKT cells are still being studied, and their role in specific organs, such as the brain, is not yet well understood. However, studies that have examined the role of other inhibitory receptors of the Ly49 family in NKT cells suggest that these receptors are crucial in upregulating mechanisms like the production of IL-10 while reducing the production of IFN-γ in these cells [104]. These findings suggest that the decreased populations of NK and NKT cells in the brain of Tusc2 KO models may be crucial in regulating inflammation in the brain through Ly49G expression, which may be vital in preventing the development of a proinflammatory environment in the brain. Therefore, the malfunctioning of Ly49G could be a significant factor in the development of neuroinflammation.
Our study also provided information on the significant differences in brain immune populations between males and females, which is critical for understanding the role of gender in immune responses and the development of pathologies of the brain. In WT mice, we found significant sex-dependent differences between males and females in the sizes of microglial (TMEM 119+/F4-80+) populations, CD4+/CD25+ T cell, CD8+/CD28+/GrzB+ T cells, and Ly49G+ NK cells, thus confirming profound sex-dependent differences in immune responses. In addition, we observed statistically significant differences between male and female Tusc2 KO mice in the CD8+/CD28+ T, CD3+/CD4+/Foxp3+ Treg cells, and Ly49G+NK cells. These findings suggest an intricate and complex dependence of the brain immune cell populations and responses to the constantly changing brain microenvironment on sex and other complex factors. Thus, all studies performed on mice and humans should be sex-conscious.
Our further analysis of Tusc2-dependent changes in critical neurodegeneration-linked proteins from hippocampal tissues showed a moderate but significant decrease in GFAP in both male and female TUSC2 KO brains. GFAP is thought to help maintain astrocyte structural integrity and mechanical strength and aid cell movement and shape change [105]. Multiple CNS disorders are associated with improper GFAP expression, both and up- and down-regulated [106]. In fact, several possible mechanisms could explain the relationship between GFAP protein levels and Tusc2 loss. First, GFAP protein levels are known to be linked to changes in Ca2+ through calcium-dependent binding, calcium/calmodulin-dependent phosphorylation, and calcium-dependent proteolysis [107]. As Tusc2 regulates Ca2+ homeostasis, its loss could result in GFAP dysregulation [9,82,83]. Second, multiple studies suggest that GFAP levels could be upregulated or downregulated depending on the context of the inflammatory environment [108]. Hence, TNF-α could increase astrocyte differentiation and proliferation while decreasing GFAP expression at both the messenger and protein levels due to the inhibition of STAT3 function [109,110]. Based on our results, we hypothesize that the absence of Tusc2 in the brain could lead to an increased Th1 response through IFN-γ and TNF-α and a decrease in anti-inflammatory subpopulations, which could result in an increase in the number of astrocytes with a decreased expression of GFAP. These disruptions could lead to a subsequent slowdown in the movement of astrocytes, which is critical for the functioning of neurons, synapses, and microglia in the Tusc2 KO brain. However, further experiments are required to establish a clear cause-and-effect relationship between the loss of Tusc2, decreased GFAP expression, and astrocyte movement.
Calcium signaling in neurons connects membrane excitability with the biological function of the cell. The “calcium hypothesis” states that deregulation of calcium signaling is one of the early–stage and key processes in the pathogenesis of neurodegenerative diseases [111]. We showed in several studies that Tusc2 is involved in the regulation of Ca2+ fluxes to/from mitochondria [9,11,82,83]. Here, we checked for changes in proteins intimately involved in Ca2+ signaling: CaMKII (Calcium–calmodulin (CaM)-dependent protein kinase II) and Calbindin. CaMKII was significantly upregulated in both Tusc2 KO females and males. Calbindin showed significant upregulation only in Tusc2 males at this early age. Further research should focus on identifying the entire network of Tusc2-dependent Ca2+-associated proteins to understand the scope of Tusc2 involvement in early events linked to neurodegeneration.
mTOR pathway is implicated in many aging-related diseases and contributes to many age-related diseases, including neurodegeneration [112]. The phosphorylation of S6 ribosomal protein (pS6) is downstream of mTOR activation and is a reliable marker of mTOR activity [113]. Based on an increased pS6 index (pS6/total S6), the mTOR pathway is significantly activated in the hippocampi of Tusc2 KO females and showed a trend to activation in Tusc2 males.
Thus, Tusc2 loss-caused disbalance of proinflammatory and anti-inflammatory immune subsets and dyshomeostasis of Ca2+-dependent pathways critical for synaptic plasticity and memory formation creates an unfavorable environment that may initiate aging-related neurodegeneration.
3.1. Conclusion
Our study demonstrated that ubiquitous knock-out in Tusc2, a protein with a pivotal role in Ca2+ homeostasis, overall mitochondrial activities, and inflammation, is critically and mechanistically involved in early dysregulated events in the brain, resulting in cognitive and neuroimmune pathologies. Our data also show progressively decreased expression of Tusc2 in human tissues with aging, suggesting that our model could, possibly, recreate early events in the human brain leading to neurodegeneration. Further delving into these early processes will lead us to a better understanding of the course of development of neurodegenerative diseases and possibly lead to Tusc2 or Tusc2-dependent processes being a therapeutic target for treating MCI/AD.
4. Materials and Methods
4.1. MICE
We conducted our study using male and female WT and KO mice from a 129/sv background generated as described previously [114]. Animals were housed in an AAALAC International accredited facility and in accordance with established guidelines and protocols approved by the Meharry’s Institutional Animal Care and Use Committee. To maintain an optimal living environment, we housed 3-4 animals per cage in standard mice cages with corn cob bedding. The vivarium was environmentally controlled with a temperature of 21±1°C, 30-70% humidity, and a 12-hour light-dark cycle. The mice had access to food and water Ad libitum. All animal protocols complied with the National Institutes of Health Guide for Care and Use of Laboratory Animals and were approved by the Institutional Animal Care and Use Committee of Meharry Medical College (Animal protocol approval #16-07-582 dated 23 August 2022).
4.2. Behavioral Testing
The sequence of behavioral testing was Novel object recognition (to measure object recognition memory), open field activity (to measure exploratory activity), and Y maze (to measure short-term spatial memory). The time between each test was 24-48hrs. The following evaluation criteria were set to obtain accurate NOR, OFT, and Y-maze results: Test videos were recorded on test day. Following testing, the videos were evaluated by two independent investigators who were blind to experimental conditions, i.e., genotype and sex. Findings from the two investigators were compared; if the findings of both were comparable, the average of the two results was taken. The light conditions were in accordance with AAALAC international standards, with light levels of 325 lux approximately 1 m (3.3ft) above the floor.
4.3. Novel Object Recognition Test
This procedure was adapted from two research studies [115,116]. The NOR test involves three sessions: habituation, training, and testing. The testing apparatus was a classic open-field plastic container (i.e., white PVC plastic, 49 cm x 34 cm with walls 49 cm high). The container was covered from the outside with white matte, non-reflective, heavy-duty paper to avoid reflections. During the habituation session, a mouse is placed in the arena without any objects and allowed to explore freely for 20 minutes. Afterward, the mouse is returned to its home cage. In the next session (Training), the mouse is allowed to explore 2 identical objects. Finally, during the testing session, one of the training objects is replaced with a novel object. Because mice have an innate preference for novelty, if the mouse recognizes a familiar object, it will spend less time with the object and more of its time on the novel object [117]. The two objects used were a clear plastic bottle that was suitable for the size of the mouse, and the other object consisted of multiple colored Lego blocks that were connected together. The Lego structure was also suitable for mouse size to encourage exploration. All results are recorded for further analysis. The following calculation was done to determine the recognition object index (ROI)%: [(percentage of exploration of the non-displaced familiar object during the training) – (percentage of exploration of the non-displaced familiar object during the test)]/percentage of exploration of the non-displaced familiar object during the training. The recognition object index (ROI) measures the ability of an animal to recognize the same object at different time points. When the mouse remembers the familiar object (presented to the animal earlier), the exploration time of the object decreases. This task relies on different brain structures, mainly the hippocampus and perirhinal cortex.
4.4. Open Field/Locomotor Activity Test
The Open Field test used specific measurements and zoning adopted from Sakamoto T. et al. 2019 [118]. The testing apparatus was a classic open-field plastic container (i.e., white PVC plastic, 49cm x 34cm, with walls 49cm high). A 40% central zone was defined as the center area of the arena, while the peripheral area was defined as 60%. Each mouse was placed in the center of the arena, and their performance was recorded using a mounted camera recorder (Sony Digital HD Handycam). Their movement was recorded for 30 minutes after a prior acclimation phase of 30 minutes. Movement within the peripheral zone was counted if the mouse’s body was 75% or more in the zone. Completing the open field test, we measured time spent in the peripheral and central zones. The peripheral and central movements were defined as follows: peripheral= 4-paw movement in the peripheral outlined zone, with all four paws within the zone, excluding rearing behavior. Central movement = 4-paw movement in the central defined zone, with all four paws within the zone, excluding rearing behavior.
4.5. Y-Maze Test
This method was adapted from Maurice, T., 1996; Deacon & Raulins, 2006 [68,69]. The process involves placing mice individually into one arm of the maze and allowing them to explore it freely for 8 minutes. The Y-maze apparatus was made out of acrylic plastic with gray color. The floor was 8 cm in width, each arm was 36 cm in length, and the walls were 15.5 cm in height. The arms of the maze were interconnected at an angle of 120. The number of entries into each arm is recorded, with the criteria that the mouse’s whole body (excluding its tail) must enter an arm to count as an entry. The mouse must make a correct combination of entries to be counted as a correct alteration [ABC, ACB, BCA, BAC, CAB, CBA]. We calculate the percentage of correct alterations using the following calculation:
4.5. Western Blot Analysis
Hippocampal tissue was excised, flash-frozen, and stored in liquid nitrogen until processing. The tissue was homogenized and lysed in RIPA buffer, and the protein concentrations were determined using BCA protein assay (Bio-Rad, Hercules, CA, United States). An equal concentration of proteins was loaded on SDS-PAGE pre-cast gels (Bio-Rad, Hercules, CA, United States) and separated via electrophoresis. Proteins were transferred to nitrocellulose membrane using Turbo Blot system (Bio-Rad, Inc) and stained with Ponceau stain for protein load visualization. Membranes were blocked with 5% BSA for 1hr at room temperature, followed by incubation with primary antibodies in 5% BSA overnight at 4 °C. The membranes were washed in 1xTBST and incubated for 2h with the corresponding secondary antibodies. Blots were then visualized using the ECL chemiluminescence substrate and imaged with the GE Amersham™ Imager 600 (GE Amersham™ imager 600, MA, United States). Band intensities were quantified using ImageJ software (NIH, United States) and normalized to Ponceau-stained proteins/lane bands.
The following primary antibodies were used: ThermoFisher Scientific: Anti-mouse GFAP monoclonal (1:500, Clone GA5, Cat. #14-9892-82), Anti-mouse Calbindin monoclonal (1:1000, Cat. # 702411); Cell Signaling, Inc: Anti-mouse S6 ribosomal protein (1:1000, Clone 54D2, Cat. # 2211S), Anti-mouse Phospho-S6 ribosomal protein monoclonal (1:500, Clone Ser235/236 Cat. # 2371S); Santa-Cruz Biotechnology: Anti-mouse CaMKII monoclonal (1:1000, Clone A-1, Cat. # SC-13141). Secondary antibodies: Goat Anti-rabbit IgG (1:6000, Cat. # 1706515) or Goat Anti-mouse IgG (1:6000, Cat. # 1706516).
4.6. Isolation of Brain Immune Cells.
Mice were deeply anesthetized with isoflurane, followed by sacrifice via cervical dislocation. Whole brains were excised and placed in individual Petri dishes on ice containing HBSS/5%FBS for processing. The whole brains were thoroughly chopped, followed by adding 5ml of mild-enzymatic digestion solution according to the manufacturer protocol (Cat. # 07473, Stem Cell Technologies, Canada) and digestion for 20 minutes in a shaking cell culture incubator. Cold HBSS/5%FBS was added to the digestion solution to stop the enzymatic reaction. The digested tissue was homogenized with a Pasteur pipette and filtered through a 70µm cell strainer. Cells were washed with cold HBSS/5%FBS and centrifuged for 5 minutes at 1500 rpm. The supernatant was removed and replaced with 5ml of 30% Percoll, followed by centrifugation at 2300 rpm for 30 minutes at 18℃. After centrifugation, cells were washed three times and counted using Trypan blue stain with an automated cell counter Countess (ThermoFisher Scientific).
4.7. Cell Staining and Flow Cytometry Analysis
To analyze the resident and infiltrating brain immune cells, we designed the staining antibody cocktails specific for the following types of cells: microglia, astrocytes, cytotoxic CD8 T cells, CD4 T helper (Th1), regulatory T cells (Treg), Natural killer (NK) and Natural killer T cells (NKT). For surface staining we used: Anti-mouse Tmem119-PE (1:50, Cat. # 12-6119-82), Anti-mouse ACSA-2-APC (1:00, Cat. # 130-116-142), Anti-mouse CD45-PE/Cyanine (1:400, Cat. # 103114), Anti-mouse CD11b-BV650 (1:400, Cat. # 101239), Anti-mouse F4/80-AF594 (1:50, Cat. # 123140), Anti-mouse CD8-BV605 (1:400, Cat. # 100743), Anti-mouse CD4-APC (1:100, Cat. # 100412), Anti-mouse CD25-FITC (1:300, Cat. # 102006), Anti-mouse CD19-BV650 (1:400, Cat. # 115541), Anti-mouse CD3-BV421 (1:400, Cat. # 100227), Anti-mouse CD3-BV711 (1:400, Cat. # 100241), Anti-mouse Ly-49G2- FITC (1:100, Cat. # 11-5781-82), Anti-mouse CD25-APC/Cyanine7 (1:50, Cat. # 102026), Anti-mouse CD28-PE (1:50, Cat. # 102106), Anti-mouse CD49b-PE (1:400, Cat. # 12-5971-82). For the intracellular staining we used: anti-mouse IFN-γ-FITC (1:50, Cat. # 505806), anti-mouse TNF-α- PerCP/Cyanine5.5 (1:50, Cat. # 506322), anti-mouse IFN-γ-BV650 (1:50, Cat. # 505831), anti-mouse Granzyme B-FITC (1:50, Cat. # 11-8898-82), anti-mouse FOXP3- PE (1:100, Cat. # 126404). All antibodies were purchased from Biolegend®, ThermoFisher Scientific, or Miltenyi Biotec. Single-color control staining and compensation beads were used as controls for gating and compensation. Live cells were gated based on positivity for Zombie Aqua viability stain (1:600, Biolegend®, cat. # 423101), followed by gating for specific cells of interest. All the experiments were performed using the Cytex Amnis CellStream benchtop flow cytometer (Cytek® Biosciences) and analyzed using the FlowJo software v.10.9 (Treestar Inc).
4.8. Statistical Analysis
All the values were expressed as mean ± standard error of the mean (SEM). Statistical analysis was performed using GraphPad Prism v10.0.3. In order to observe the normality and homogeneity distribution, Data were subjected to the D’Agostino normality Test and subsequently to student t-tests (unpaired, two-tailed) to assess the statistical significance of differences between the two groups. Multiple groups were compared using two-way ANOVA, followed by Tukey’s multiple comparison test or Bonferroni’s multiple comparison test for significance of difference, where appropriate. A significant level was set at the top ≤ 0.05 for all statistical analyses.
Supplementary Materials
The following supporting information can be downloaded at the website of this paper posted on Preprints.org.
Author Contributions
TF wrote the manuscript, collected the data, analyzed the data, and developed the experimental design. JT helped in collecting data. SGO helped collect data, analyze data, and helped in the writing of the manuscript. MM helped collect data and editing manuscript. HR helped collect and analyze data. TK helped collect data and editing the manuscript. OK helped collect data and optimize the experimental protocol. AkS developed the experimental design, collected data, and provided funding. AI developed experimental design, collected data, and helped in the writing of the manuscript. AS developed experimental design, helped with the writing of the manuscript, and provided funding. All authors contributed to the article and approved the submitted version.
Funding
This work was supported by funds to AS from the following National Institutes of Health (NIH) grants: U54 CA163069, U54 MD007593, SCI CA182843, and AI U54MD007586. TF is supported by the NIH RISE training grant 5R25GM059994-22. This work was partly accomplished through the Meharry Medical College Core Facilities, supported by NIH Grants MD007586, CA163069, and S10RR025497.
Institutional Review Board Statement
All animal experimental procedures were conducted in accordance with IACUC guidelines and were approved by Meharry Medical College.
Informed Consent Statement
Not applicable.
Data Availability Statement
The authors will be pleased to provide access to the raw data that supports the conclusions of this article without any hesitation.
Acknowledgments
The authors thank Evdokiya Reshetnikova for technical assistance with FACS analysis. Figure 1A and Figure 8 were created under the agreement numbers JQ26ELIDH5 and RQ26ELHZRF, respectively, in Biorender. We would like to thank the animal care facility team at Meharry Medical College. Behavioral studies undertaken in the Vanderbilt Mouse Neurobehavior Core were supported by the EKS NICHD of the National Institutes of Health under Award P50HD103537.
Conflicts of Interest
The authors declare that the research was conducted in the absence of any commercial or financial relationships that could be construed as a potential conflict of interest.
References
- Yankner BA, Lu T, Loerch P. The aging brain. Annu Rev Pathol Mech Dis. 2008;3:41-66.
- Vina J, Lloret A. Why women have more Alzheimer's disease than men: gender and mitochondrial toxicity of amyloid-β peptide. Journal of Alzheimer's disease. 2010;20(s2):S527-S33.
- Au B, Dale-McGrath S, Tierney MC. Sex differences in the prevalence and incidence of mild cognitive impairment: a meta-analysis. Ageing research reviews. 2017;35:176-99. [CrossRef]
- Podcasy JL, Epperson CN. Considering sex and gender in Alzheimer disease and other dementias. Dialogues in clinical neuroscience. 2016;18(4):437-46. [CrossRef]
- Shanmugan S, Epperson CN. Estrogen and the prefrontal cortex: towards a new understanding of estrogen's effects on executive functions in the menopause transition. Human brain mapping. 2014;35(3):847-65.
- Bailey M, Wang AC, Hao J, Janssen WG, Hara Y, Dumitriu D, et al. Interactive effects of age and estrogen on cortical neurons: implications for cognitive aging. Neuroscience. 2011;191:148-58. [CrossRef]
- Ward A, Tardiff S, Dye C, Arrighi HM. Rate of conversion from prodromal Alzheimer's disease to Alzheimer's dementia: a systematic review of the literature. Dement Geriatr Cogn Dis Extra. 2013;3(1):320-32.
- Uzhachenko R, Issaeva N, Boyd K, Ivanov SV, Carbone DP, Ivanova AV. Tumour suppressor Fus1 provides a molecular link between inflammatory response and mitochondrial homeostasis. J Pathol. 2012;227(4):456-69. [CrossRef]
- Uzhachenko R, Ivanov SV, Yarbrough WG, Shanker A, Medzhitov R, Ivanova AV. Fus1/Tusc2 is a novel regulator of mitochondrial calcium handling, Ca2+-coupled mitochondrial processes, and Ca2+-dependent NFAT and NF-kappaB pathways in CD4+ T cells. Antioxid Redox Signal. 2014;20(10):1533-47.
- Tan WJT, Song L, Graham M, Schettino A, Navaratnam D, Yarbrough WG, et al. Novel Role of the Mitochondrial Protein Fus1 in Protection from Premature Hearing Loss via Regulation of Oxidative Stress and Nutrient and Energy Sensing Pathways in the Inner Ear. Antioxid Redox Signal. 2017;27(8):489-509.
- Uzhachenko R, Boyd K, Olivares-Villagomez D, Zhu Y, Goodwin JS, Rana T, et al. Mitochondrial protein Fus1/Tusc2 in premature aging and age-related pathologies: critical roles of calcium and energy homeostasis. Aging. 2017;9(3):627-49.
- Hood MI, Uzhachenko R, Boyd K, Skaar EP, Ivanova AV. Loss of mitochondrial protein Fus1 augments host resistance to Acinetobacter baumannii infection. Infect Immun. 2013;81(12):4461-9. [CrossRef]
- Ivanova A, Ivanov S, Pascal V, Lumsden J, Ward J, Morris N, et al. Autoimmunity, spontaneous tumourigenesis, and IL-15 insufficiency in mice with a targeted disruption of the tumour suppressor gene Fus1. The Journal of Pathology. 2007;211(5):591-601.
- Wilson DM, 3rd, Cookson MR, Van Den Bosch L, Zetterberg H, Holtzman DM, Dewachter I. Hallmarks of neurodegenerative diseases. Cell. 2023;186(4):693-714.
- Supnet C, Bezprozvanny I. Neuronal calcium signaling, mitochondrial dysfunction, and Alzheimer's disease. Journal of Alzheimer's disease. 2010;20(s2):S487-S98.
- Passaro AP, Lebos AL, Yao Y, Stice SL. Immune Response in Neurological Pathology: Emerging Role of Central and Peripheral Immune Crosstalk. Front Immunol. 2021;12:676621. [CrossRef]
- Kolliker-Frers R, Udovin L, Otero-Losada M, Kobiec T, Herrera MI, Palacios J, et al. Neuroinflammation: An Integrating Overview of Reactive-Neuroimmune Cell Interactions in Health and Disease. Mediators Inflamm. 2021;2021:9999146. [CrossRef]
- Coronas-Samano G, Baker KL, Tan WJ, Ivanova AV, Verhagen JV. Fus1 KO Mouse As a Model of Oxidative Stress-Mediated Sporadic Alzheimer's Disease: Circadian Disruption and Long-Term Spatial and Olfactory Memory Impairments. Front Aging Neurosci. 2016;8:268.
- Newcombe EA, Camats-Perna J, Silva ML, Valmas N, Huat TJ, Medeiros R. Inflammation: the link between comorbidities, genetics, and Alzheimer’s disease. Journal of neuroinflammation. 2018;15(1):1-26. [CrossRef]
- Chen H-R, Chen C-W, Kuo Y-M, Chen B, Kuan IS, Huang H, et al. Monocytes promote acute neuroinflammation and become pathological microglia in neonatal hypoxic-ischemic brain injury. Theranostics. 2022;12(2):512. [CrossRef]
- Sharma K, Schmitt S, Bergner CG, Tyanova S, Kannaiyan N, Manrique-Hoyos N, et al. Cell type–and brain region–resolved mouse brain proteome. Nature neuroscience. 2015;18(12):1819-31.
- Podd BS, Thoits J, Whitley N, Cheng H-Y, Kudla KL, Taniguchi H, et al. T cells in cryptopatch aggregates share TCR γ variable region junctional sequences with γδ T cells in the small intestinal epithelium of mice. The Journal of Immunology. 2006;176(11):6532-42. [CrossRef]
- Gern BH, Adams KN, Plumlee CR, Stoltzfus CR, Shehata L, Moguche AO, et al. TGFβ restricts expansion, survival, and function of T cells within the tuberculous granuloma. Cell host & microbe. 2021;29(4):594-606. e6. [CrossRef]
- Willingham S, Ho P, Hotson A, Hill C, Piccione E, Hsieh J, et al. A2AR antagonism with CPI-444 induces antitumor responses and augments efficacy to anti-PD-(L) 1 and anti-CTLA-4 in preclinical models. Cancer Immunol. Res. 2018; 6: 1136–1149. doi: 10.1158/2326-6066. A preclinical study of CPI-444, an inhibitor of adenosine pathway that places it as an attractive immunotherapy target Article CAS. [CrossRef]
- Salei N, Rambichler S, Salvermoser J, Papaioannou NE, Schuchert R, Pakalniškytė D, et al. The kidney contains ontogenetically distinct dendritic cell and macrophage subtypes throughout development that differ in their inflammatory properties. Journal of the American Society of Nephrology. 2020;31(2):257-78. [CrossRef]
- Jia B. Commentary: Gut microbiome–mediated bile acid metabolism regulates liver cancer via NKT cells. Frontiers in immunology. 2019;10:440898. [CrossRef]
- Leclerc M, Voilin E, Gros G, Corgnac S, de Montpréville V, Validire P, et al. Regulation of antitumour CD8 T-cell immunity and checkpoint blockade immunotherapy by Neuropilin-1. Nature Communications. 2019;10(1):3345. [CrossRef]
- Komuczki J, Tuzlak S, Friebel E, Hartwig T, Spath S, Rosenstiel P, et al. Fate-mapping of GM-CSF expression identifies a discrete subset of inflammation-driving T helper cells regulated by cytokines IL-23 and IL-1β. Immunity. 2019;50(5):1289-304. e6. [CrossRef]
- Kao C, Daniels MA, Jameson SC. Loss of CD8 and TCR binding to Class I MHC ligands following T cell activation. International immunology. 2005;17(12):1607-17. [CrossRef]
- Liu F, Weng D, Chen Y, Song L, Li C, Dong L, et al. Depletion of CD4+ CD25+ Foxp3+ regulatory T cells with anti-CD25 antibody may exacerbate the 1, 3-β-glucan-induced lung inflammatory response in mice. Archives of toxicology. 2011;85:1383-94.
- Perlot T, Penninger JM. Development and function of murine B cells lacking RANK. The Journal of Immunology. 2012;188(3):1201-5. [CrossRef]
- Schädlich IS, Vienhues JH, Jander A, Piepke M, Magnus T, Lambertsen KL, et al. Interleukin-1 mediates ischemic brain injury via induction of IL-17A in γδ T cells and CXCL1 in astrocytes. NeuroMolecular Medicine. 2022;24(4):437-51. [CrossRef]
- Glaubitz J, Wilden A, Frost F, Ameling S, Homuth G, Mazloum H, et al. Activated regulatory T-cells promote duodenal bacterial translocation into necrotic areas in severe acute pancreatitis. Gut. 2023;72(7):1355-69. [CrossRef]
- Altendorfer B, Unger MS, Poupardin R, Hoog A, Asslaber D, Gratz IK, et al. Transcriptomic profiling identifies CD8+ T cells in the brain of aged and alzheimer’s disease transgenic mice as tissue-resident memory T cells. The Journal of Immunology. 2022;209(7):1272-85. [CrossRef]
- Steinbach K, Vincenti I, Kreutzfeldt M, Page N, Muschaweckh A, Wagner I, et al. Brain-resident memory T cells represent an autonomous cytotoxic barrier to viral infection. Journal of Experimental Medicine. 2016;213(8):1571-87. [CrossRef]
- Smolders J, Heutinck KM, Fransen NL, Remmerswaal EB, Hombrink P, Ten Berge IJ, et al. Tissue-resident memory T cells populate the human brain. Nature communications. 2018;9(1):4593. [CrossRef]
- Young KG, MacLean S, Dudani R, Krishnan L, Sad S. CD8+ T cells primed in the periphery provide time-bound immune-surveillance to the central nervous system. The Journal of Immunology. 2011;187(3):1192-200. [CrossRef]
- Santos-Zas I, Lemarié J, Zlatanova I, Cachanado M, Seghezzi J-C, Benamer H, et al. Cytotoxic CD8+ T cells promote granzyme B-dependent adverse post-ischemic cardiac remodeling. Nature communications. 2021;12(1):1483.
- Krämer TJ, Hack N, Brühl TJ, Menzel L, Hummel R, Griemert E-V, et al. Depletion of regulatory T cells increases T cell brain infiltration, reactive astrogliosis, and interferon-γ gene expression in acute experimental traumatic brain injury. Journal of neuroinflammation. 2019;16:1-14.
- Pasciuto E, Burton OT, Roca CP, Lagou V, Rajan WD, Theys T, et al. Microglia require CD4 T cells to complete the fetal-to-adult transition. Cell. 2020;182(3):625-40. e24. [CrossRef]
- Fritzsching B, Haas J, König F, Kunz P, Fritzsching E, Pöschl J, et al. Intracerebral human regulatory T cells: analysis of CD4+ CD25+ FOXP3+ T cells in brain lesions and cerebrospinal fluid of multiple sclerosis patients. PloS one. 2011;6(3):e17988. [CrossRef]
- Ma C, Li S, Hu Y, Ma Y, Wu Y, Wu C, et al. AIM2 controls microglial inflammation to prevent experimental autoimmune encephalomyelitis. Journal of Experimental Medicine. 2021;218(5). [CrossRef]
- Grubman A, Chew G, Ouyang JF, Sun G, Choo XY, McLean C, et al. A single-cell atlas of entorhinal cortex from individuals with Alzheimer’s disease reveals cell-type-specific gene expression regulation. Nature neuroscience. 2019;22(12):2087-97. [CrossRef]
- Clancy-Thompson E, Chen GZ, LaMarche NM, Ali LR, Jeong HJ, Crowley SJ, et al. Transnuclear mice reveal Peyer's patch iNKT cells that regulate B-cell class switching to IgG1. The EMBO Journal. 2019;38(14):e101260.
- Klezovich-Bénard M, Corre J-P, Jusforgues-Saklani H, Fiole D, Burjek N, Tournier J-N, et al. Mechanisms of NK cell-macrophage Bacillus anthracis crosstalk: a balance between stimulation by spores and differential disruption by toxins. PLoS pathogens. 2012;8(1):e1002481. [CrossRef]
- Li Z-Y, Song Z-H, Meng C-Y, Yang D-D, Yang Y, Peng J-P. IFN-γ modulates Ly-49 receptors on NK cells in IFN-γ-induced pregnancy failure. Scientific reports. 2015;5(1):18159.
- Hemonnot A-L, Hua J, Ulmann L, Hirbec H. Microglia in Alzheimer disease: well-known targets and new opportunities. Frontiers in aging neuroscience. 2019;11:233. [CrossRef]
- González-Reyes RE, Nava-Mesa MO, Vargas-Sánchez K, Ariza-Salamanca D, Mora-Muñoz L. Involvement of astrocytes in Alzheimer’s disease from a neuroinflammatory and oxidative stress perspective. Frontiers in molecular neuroscience. 2017;10:427. [CrossRef]
- Ferretti M, Merlini M, Späni C, Gericke C, Schweizer N, Enzmann G, et al. T-cell brain infiltration and immature antigen-presenting cells in transgenic models of Alzheimer’s disease-like cerebral amyloidosis. Brain, behavior, and immunity. 2016;54:211-25. [CrossRef]
- Lugli A, Iezzi G, Hostettler I, Muraro M, Mele V, Tornillo L, et al. Prognostic impact of the expression of putative cancer stem cell markers CD133, CD166, CD44s, EpCAM, and ALDH1 in colorectal cancer. British journal of cancer. 2010;103(3):382-90. [CrossRef]
- Bernier L-P, York EM, Kamyabi A, Choi HB, Weilinger NL, MacVicar BA. Microglial metabolic flexibility supports immune surveillance of the brain parenchyma. Nature communications. 2020;11(1):1559. [CrossRef]
- Calvo B, Rubio F, Fernández M, Tranque P. Dissociation of neonatal and adult mice brain for simultaneous analysis of microglia, astrocytes and infiltrating lymphocytes by flow cytometry. IBRO reports. 2020;8:36-47. [CrossRef]
- Srakočić S, Josić P, Trifunović S, Gajović S, Grčević D, Glasnović A. Proposed practical protocol for flow cytometry analysis of microglia from the healthy adult mouse brain: Systematic review and isolation methods’ evaluation. Frontiers in Cellular Neuroscience. 2022;16:1017976. [CrossRef]
- Brochard V, Combadière B, Prigent A, Laouar Y, Perrin A, Beray-Berthat V, et al. Infiltration of CD4+ lymphocytes into the brain contributes to neurodegeneration in a mouse model of Parkinson disease. The Journal of clinical investigation. 2008;119(1). [CrossRef]
- Williams GP, Schonhoff AM, Jurkuvenaite A, Gallups NJ, Standaert DG, Harms AS. CD4 T cells mediate brain inflammation and neurodegeneration in a mouse model of Parkinson's disease. Brain. 2021;144(7):2047-59.
- Hu D, Xia W, Weiner HL. CD8+ T cells in neurodegeneration: friend or foe? Molecular Neurodegeneration. 2022;17(1):1-4.
- Jadidi-Niaragh F, Shegarfi H, Naddafi F, Mirshafiey A. The role of natural killer cells in Alzheimer’s disease. Scandinavian journal of immunology. 2012;76(5):451-6. [CrossRef]
- Van Kaer L, Parekh VV, Wu L. Invariant natural killer T cells: bridging innate and adaptive immunity. Cell and tissue research. 2011;343(1):43-55.
- Feng W, Zhang Y, Ding S, Chen S, Wang T, Wang Z, et al. B lymphocytes ameliorate Alzheimer’s disease-like neuropathology via interleukin-35. Brain, Behavior, and Immunity. 2023;108:16-31. [CrossRef]
- Yang Z, Wang KK. Glial fibrillary acidic protein: from intermediate filament assembly and gliosis to neurobiomarker. Trends in neurosciences. 2015;38(6):364-74. [CrossRef]
- Lisman J, Schulman H, Cline H. The molecular basis of CaMKII function in synaptic and behavioural memory. Nature Reviews Neuroscience. 2002;3(3):175-90. [CrossRef]
- Junho CVC, Caio-Silva W, Trentin-Sonoda M, Carneiro-Ramos MS. An overview of the role of calcium/calmodulin-dependent protein kinase in cardiorenal syndrome. Frontiers in physiology. 2020:735. [CrossRef]
- Lee S-JR, Escobedo-Lozoya Y, Szatmari EM, Yasuda R. Activation of CaMKII in single dendritic spines during long-term potentiation. Nature. 2009;458(7236):299-304. [CrossRef]
- Fairless R, Williams SK, Diem R. Calcium-Binding Proteins as Determinants of Central Nervous System Neuronal Vulnerability to Disease. Int J Mol Sci. 2019;20(9). [CrossRef]
- Kubo A, Misonou H, Matsuyama M, Nomori A, Wada-Kakuda S, Takashima A, et al. Distribution of endogenous normal tau in the mouse brain. Journal of Comparative Neurology. 2019;527(5):985-98. [CrossRef]
- Yates SC, Zafar A, Hubbard P, Nagy S, Durant S, Bicknell R, et al. Dysfunction of the mTOR pathway is a risk factor for Alzheimer’s disease. Acta neuropathologica communications. 2013;1(1):1-15. [CrossRef]
- Coronas-Samano G, Baker KL, Tan WJ, Ivanova AV, Verhagen JV. Fus1 KO mouse as a model of oxidative stress-mediated sporadic Alzheimer's disease: circadian disruption and long-term spatial and olfactory memory impairments. Frontiers in Aging Neuroscience. 2016;8:268.
- Maurice T, Lockhart BP, Privat A. Amnesia induced in mice by centrally administered β-amyloid peptides involves cholinergic dysfunction. Brain research. 1996;706(2):181-93. [CrossRef]
- Deacon RM, Rawlins JNP. T-maze alternation in the rodent. Nature protocols. 2006;1(1):7-12. [CrossRef]
- Prieur EA, Jadavji NM. Assessing spatial working memory using the spontaneous alternation Y-maze test in aged male mice. Bio-protocol. 2019;9(3):e3162-e. [CrossRef]
- Kankaanpaa A, Tolvanen A, Saikkonen P, Heikkinen A, Laakkonen EK, Kaprio J, et al. Do Epigenetic Clocks Provide Explanations for Sex Differences in Life Span? A Cross-Sectional Twin Study. J Gerontol A Biol Sci Med Sci. 2022;77(9):1898-906. [CrossRef]
- Ahmad MA, Kareem O, Khushtar M, Akbar M, Haque MR, Iqubal A, et al. Neuroinflammation: A Potential Risk for Dementia. Int J Mol Sci. 2022;23(2). [CrossRef]
- Chen X, Holtzman DM. Emerging roles of innate and adaptive immunity in Alzheimer’s disease. Immunity. 2022;55(12):2236-54. [CrossRef]
- Neumann H, Kotter MR, Franklin RJ. Debris clearance by microglia: an essential link between degeneration and regeneration. Brain. 2009;132(Pt 2):288-95. [CrossRef]
- Li Q, Barres BA. Microglia and macrophages in brain homeostasis and disease. Nature Reviews Immunology. 2018;18(4):225-42. [CrossRef]
- Gao C, Jiang J, Tan Y, Chen S. Microglia in neurodegenerative diseases: mechanism and potential therapeutic targets. Signal transduction and targeted therapy. 2023;8(1):359. [CrossRef]
- Gao M-L, Zhang X, Han F, Xu J, Yu S-J, Jin K, et al. Functional microglia derived from human pluripotent stem cells empower retinal organs. Science China Life Sciences. 2022;65(6):1057-71. [CrossRef]
- Jansen IE, Savage JE, Watanabe K, Bryois J, Williams DM, Steinberg S, et al. Genome-wide meta-analysis identifies new loci and functional pathways influencing Alzheimer’s disease risk. Nature genetics. 2019;51(3):404-13. [CrossRef]
- Kim Y, Park J, Choi YK. The Role of Astrocytes in the Central Nervous System Focused on BK Channel and Heme Oxygenase Metabolites: A Review. Antioxidants (Basel). 2019;8(5). [CrossRef]
- Colombo E, Farina C. Astrocytes: Key Regulators of Neuroinflammation. Trends Immunol. 2016;37(9):608-20. [CrossRef]
- Mira RG, Lira M, Cerpa W. Traumatic Brain Injury: Mechanisms of Glial Response. Front Physiol. 2021;12:740939. [CrossRef]
- Uzhachenko R, Shanker A, Yarbrough WG, Ivanova AV. Mitochondria, calcium, and tumor suppressor Fus1: At the crossroad of cancer, inflammation, and autoimmunity. Oncotarget. 2015;6(25):20754-72. [CrossRef]
- Uzhachenko R, Shimamoto A, Chirwa SS, Ivanov SV, Ivanova AV, Shanker A. Mitochondrial Fus1/Tusc2 and cellular Ca2(+) homeostasis: tumor suppressor, anti-inflammatory and anti-aging implications. Cancer Gene Ther. 2022.
- Matejuk A, Vandenbark AA, Offner H. Cross-Talk of the CNS With Immune Cells and Functions in Health and Disease. Front Neurol. 2021;12:672455. [CrossRef]
- Sankowski R, Mader S, Valdes-Ferrer SI. Systemic inflammation and the brain: novel roles of genetic, molecular, and environmental cues as drivers of neurodegeneration. Front Cell Neurosci. 2015;9:28. [CrossRef]
- Radpour M, Khoshkroodian B, Asgari T, Pourbadie HG, Sayyah M. Interleukin 4 Reduces Brain Hyperexcitability after Traumatic Injury by Downregulating TNF-alpha, Upregulating IL-10/TGF-beta, and Potential Directing Macrophage/Microglia to the M2 Anti-inflammatory Phenotype. Inflammation. 2023;46(5):1810-31.
- Chen X, Zhang J, Song Y, Yang P, Yang Y, Huang Z, et al. Deficiency of anti-inflammatory cytokine IL-4 leads to neural hyperexcitability and aggravates cerebral ischemia-reperfusion injury. Acta Pharm Sin B. 2020;10(9):1634-45. [CrossRef]
- Song L, Chen J, Lo CZ, Guo Q, Consortium ZIB, Feng J, et al. Impaired type I interferon signaling activity implicated in the peripheral blood transcriptome of preclinical Alzheimer's disease. EBioMedicine. 2022;82:104175.
- Vellecco V, Saviano A, Raucci F, Casillo GM, Mansour AA, Panza E, et al. Interleukin-17 (IL-17) triggers systemic inflammation, peripheral vascular dysfunction, and related prothrombotic state in a mouse model of Alzheimer's disease. Pharmacol Res. 2023;187:106595.
- DeMaio A, Mehrotra S, Sambamurti K, Husain S. The role of the adaptive immune system and T cell dysfunction in neurodegenerative diseases. Journal of Neuroinflammation. 2022;19(1):251. [CrossRef]
- Faridar A, Vasquez M, Thome AD, Yin Z, Xuan H, Wang JH, et al. Ex vivo expanded human regulatory T cells modify neuroinflammation in a preclinical model of Alzheimer's disease. Acta Neuropathol Commun. 2022;10(1):144. [CrossRef]
- Kann O, Almouhanna F, Chausse B. Interferon γ: a master cytokine in microglia-mediated neural network dysfunction and neurodegeneration. Trends in Neurosciences. 2022;45(12):913-27. [CrossRef]
- Ta T-T, Dikmen HO, Schilling S, Chausse B, Lewen A, Hollnagel J-O, et al. Priming of microglia with IFN-γ slows neuronal gamma oscillations in situ. Proceedings of the National Academy of Sciences. 2019;116(10):4637-42. [CrossRef]
- Baruch K, Deczkowska A, David E, Castellano JM, Miller O, Kertser A, et al. Aging-induced type I interferon response at the choroid plexus negatively affects brain function. Science. 2014;346(6205):89-93. [CrossRef]
- Browne TC, McQuillan K, McManus RM, O’Reilly J-A, Mills KH, Lynch MA. IFN-γ production by amyloid β–specific Th1 cells promotes microglial activation and increases plaque burden in a mouse model of Alzheimer’s disease. The Journal of Immunology. 2013;190(5):2241-51.
- DeMaio A, Mehrotra S, Sambamurti K, Husain S. The role of the adaptive immune system and T cell dysfunction in neurodegenerative diseases. J Neuroinflammation. 2022;19(1):251. [CrossRef]
- Jorfi M, Park J, Hall CK, Lin C-CJ, Chen M, von Maydell D, et al. Infiltrating CD8+ T cells exacerbate Alzheimer’s disease pathology in a 3D human neuroimmune axis model. Nature neuroscience. 2023;26(9):1489-504. [CrossRef]
- Solana C, Tarazona R, Solana R. Immunosenescence of natural killer cells, inflammation, and Alzheimer’s disease. International Journal of Alzheimer’s Disease. 2018;2018.
- Maghazachi AA. On the role of natural killer cells in neurodegenerative diseases. Toxins. 2013;5(2):363-75. [CrossRef]
- Qi C, Liu Q. Natural killer cells in aging and age-related diseases. Neurobiology of Disease. 2023;183:106156. [CrossRef]
- Lee H-N, Manangeeswaran M, Lewkowicz AP, Engel K, Chowdhury M, Garige M, et al. NK cells require immune checkpoint receptor LILRB4/gp49B to control neurotropic Zika virus infections in mice. JCI insight. 2022;7(3).
- Solerte S, Cravello L, Ferrari E, Fioravanti M. Overproduction of IFN-γ and TNF-α from natural killer (NK) cells is associated with abnormal NK reactivity and cognitive derangement in Alzheimer's disease. Annals of the New York Academy of Sciences. 2000;917(1):331-40.
- Zhang Y, Fung ITH, Sankar P, Chen X, Robison LS, Ye L, et al. Depletion of NK cells improves cognitive function in the Alzheimer disease mouse model. The Journal of Immunology. 2020;205(2):502-10. [CrossRef]
- Watte C, Nakamura T, Lau C, Ortaldo J, Stein-Streilein J. Ly49 C/I-dependent NKT cell-derived IL-10 is required for corneal graft survival and peripheral tolerance. Journal of Leucocyte Biology. 2008;83(4):928-35. [CrossRef]
- Yang Z, Wang KK. Glial fibrillary acidic protein: from intermediate filament assembly and gliosis to neurobiomarker. Trends Neurosci. 2015;38(6):364-74. [CrossRef]
- Johnston-Wilson NL, Sims CD, Hofmann JP, Anderson L, Shore AD, Torrey EF, et al. Disease-specific alterations in frontal cortex brain proteins in schizophrenia, bipolar disorder, and major depressive disorder. The Stanley Neuropathology Consortium. Mol Psychiatry. 2000;5(2):142-9. [CrossRef]
- Kommers T, Vinade L, Pereira C, Goncalves CA, Wofchuk S, Rodnight R. Regulation of the phosphorylation of glial fibrillary acidic protein (GFAP) by glutamate and calcium ions in slices of immature rat spinal cord: comparison with immature hippocampus. Neurosci Lett. 1998;248(2):141-3. [CrossRef]
- Szpakowski P, Ksiazek-Winiarek D, Turniak-Kusy M, Pacan I, Glabinski A. Human Primary Astrocytes Differently Respond to Pro- and Anti-Inflammatory Stimuli. Biomedicines. 2022;10(8). [CrossRef]
- Selmaj K, Shafit-Zagardo B, Aquino DA, Farooq M, Raine CS, Norton WT, et al. Tumor necrosis factor-induced proliferation of astrocytes from mature brain is associated with down-regulation of glial fibrillary acidic protein mRNA. J Neurochem. 1991;57(3):823-30. [CrossRef]
- Birck C, Ginolhac A, Pavlou MAS, Michelucci A, Heuschling P, Grandbarbe L. NF-kappaB and TNF Affect the Astrocytic Differentiation from Neural Stem Cells. Cells. 2021;10(4).
- Alzheimer's Association Calcium Hypothesis W. Calcium Hypothesis of Alzheimer's disease and brain aging: A framework for integrating new evidence into a comprehensive theory of pathogenesis. Alzheimers Dement. 2017;13(2):178-82 e17.
- Chrienova Z, Nepovimova E, Kuca K. The role of mTOR in age-related diseases. Journal of Enzyme Inhibition and Medicinal Chemistry. 2021;36(1):1678-92.
- Smith W, Rybczynski R. Prothoracicotropic hormone. Insect endocrinology. 2012:1-62.
- Ivanova A, Ivanov S, Pascal V, Lumsden J, Ward J, Morris N, et al. Autoimmunity, spontaneous tumourigenesis, and IL-15 insufficiency in mice with a targeted disruption of the tumour suppressor gene Fus1. The Journal of Pathology: A Journal of the Pathological Society of Great Britain and Ireland. 2007;211(5):591-601.
- Canas PM, Duarte JM, Rodrigues RJ, Köfalvi A, Cunha RA. Modification upon aging of the density of presynaptic modulation systems in the hippocampus. Neurobiology of aging. 2009;30(11):1877-84. [CrossRef]
- Leger M, Quiedeville A, Bouet V, Haelewyn B, Boulouard M, Schumann-Bard P, et al. Object recognition test in mice. Nature protocols. 2013;8(12):2531-7. [CrossRef]
- Lueptow LM. Novel object recognition test for the investigation of learning and memory in mice. JoVE (Journal of Visualized Experiments). 2017(126):e55718.
- Sakamoto T, Sugimoto S, Uekita T. Effects of intraperitoneal and intracerebroventricular injections of oxytocin on social and emotional behaviors in pubertal male mice. Physiology & behavior. 2019;212:112701. [CrossRef]
Figure 1.
Tusc2 deficiency causes impairment in short-term spatial memory. (A) A graphic representation of the cognitive evaluation in the Tusc2 KO model where the recognition memory, anxiety-like behavior, and short-term memory were evaluated. (B) Y-maze test. Correct alternations (%) within an 8-min period is shown; Tusc2 KO males have a significant decrease in % correct alternations (F (1, 52) =12.74, p=0.0055), as compared to WT males. Female WT and KO showed no significant difference in the Y-maze test. Interaction df=1, F (DFn, DFd) = F (1, 52) = 1.596, P value= p=0.2122. Sex df=1, F (DFn, DFd) = F (1, 52) = 0.006853, P value= p=0.9343. Gene df=1, F (DFn, DFd) = F (1, 52) = 12.74, P value= p=0.0008. (C) The total number of entries within the 8 minutes was recorded, showing no significant difference was seen in performance between groups. (D) Novel object recognition (NOR) tests. NOR: ROI index during a 3-min period. Tusc2 male and female KO and WT mice performed consistently in the NOR task; no significant difference was seen across groups. Interaction df=1, F (DFn, DFd) = F (1, 34) = 0.05171, P value= p=0.8215. Sex df=1, F (DFn, DFd) = F (1, 34) = 0.05562, P value= p=0.8150. Gene df=1, F (DFn, DFd) = F (1, 34) = 1.173, P value= p=0.2863. (E) Open-field (OF) test. 30 minutes of active movement in a peripheral zone: Interaction df=1, F (DFn, DFd) = F (1, 36) = 2.760, P value= p=0.1053. Sex df=1, F (DFn, DFd) = F (1, 36) = 1.226, P value= p=0.2755. Gene df=1, F (DFn, DFd) = F (1, 36) = 0.03526, P value= p=0.8521. (F) Open-field (OF) test. 30 minutes of active movement in a central zone: Interaction df=1, F (DFn, DFd) = F (1, 26) = 0.64, P value= p=0.8022. Sex df=1, F (DFn, DFd) = F (1, 26) = 0.3293, P value= p=0.5710. Gene df=1, F (DFn, DFd) = F (1, 26) = 1.844, P value= p=0.1861. All data underwent Tukey’s Multiple Comparisons test followed by two-way ANOVA. * p≤0.05. n= 7-16 mice per group.
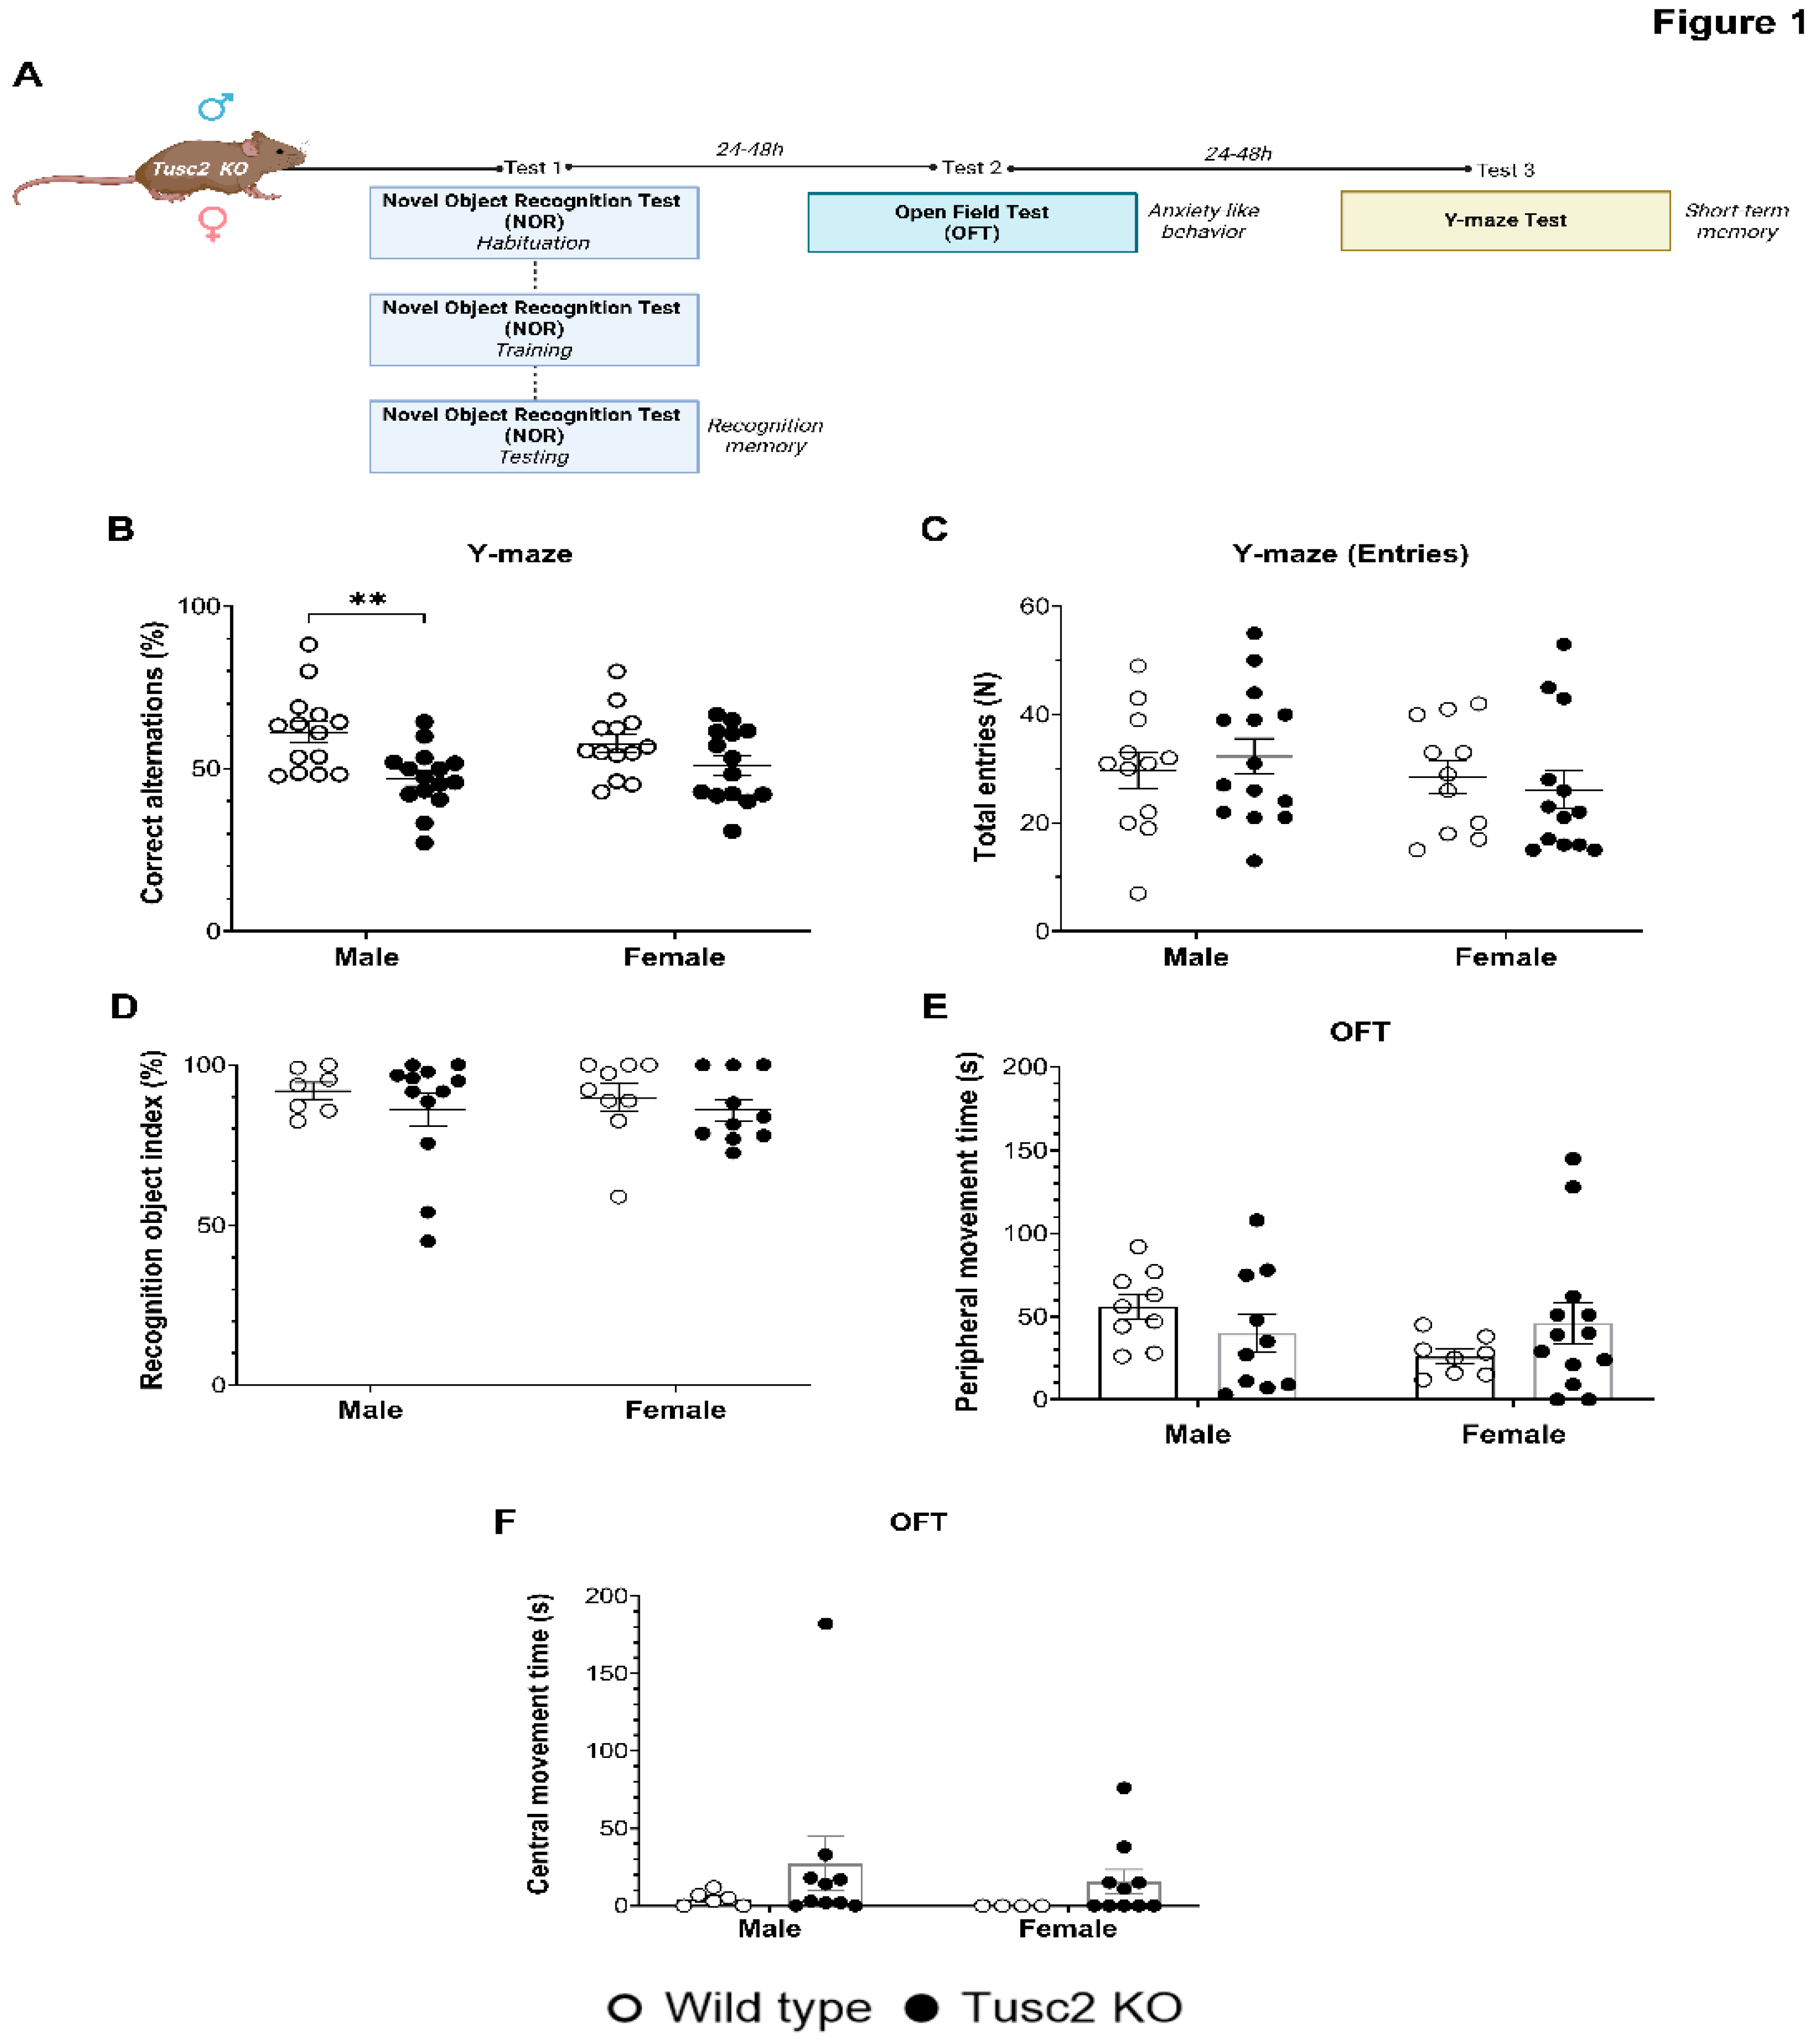
Figure 2.
The loss of Tusc2 causes increases in resident brain immune cells. (A) Representative contour dot plot graph comparing the differences of Microglia population (TMEM-119+/F4/80+) between the Wild type (black) and the Tusc2 KO (red) models in males and females. (B) shows the percentage of microglial cells within the CNS. Tusc2 WT and KO male proportions are comparable, with no significant difference (p=0.0356). Tusc2 WT and KO female proportions are comparable, with no significant difference. (C) Representative contour dot plot graph showing the differences of activated and resting population (CD45bright/CD11b+ and CD45dim/CD11b+ respectively) between the Wild type (black) and the Tusc2 KO (red) model in males and females. (D) shows the differences in the percentages of activated between the WT and KO groups (p=0.0006) (E) and resting microglial cells with no significant changes. (F) A representative contour dot plot graph comparing the differences in the Astrocytes population (ACSA2+) between the Wild type (black) and the Tusc2 KO (red) models in males and females. Tusc2 male WT and KO percent astrocytes are comparable. (G) Tusc2 KO female mice exhibited a significant increase in the percentage of astrocytes in the CNS (p=0.0002) compared to their WT counterparts. Two-way ANOVA followed by Bonferroni’s multiple comparisons test. * p≤0.05, ** p≤0.01. n= 10 mice per group. For bar graphs, the significant black asterisk denotes comparisons between the WT and KO models, while the red asterisk represents the comparison between genders. “Percentage of population” indicates the proportion over all events in the population gating shown at the graphic top.
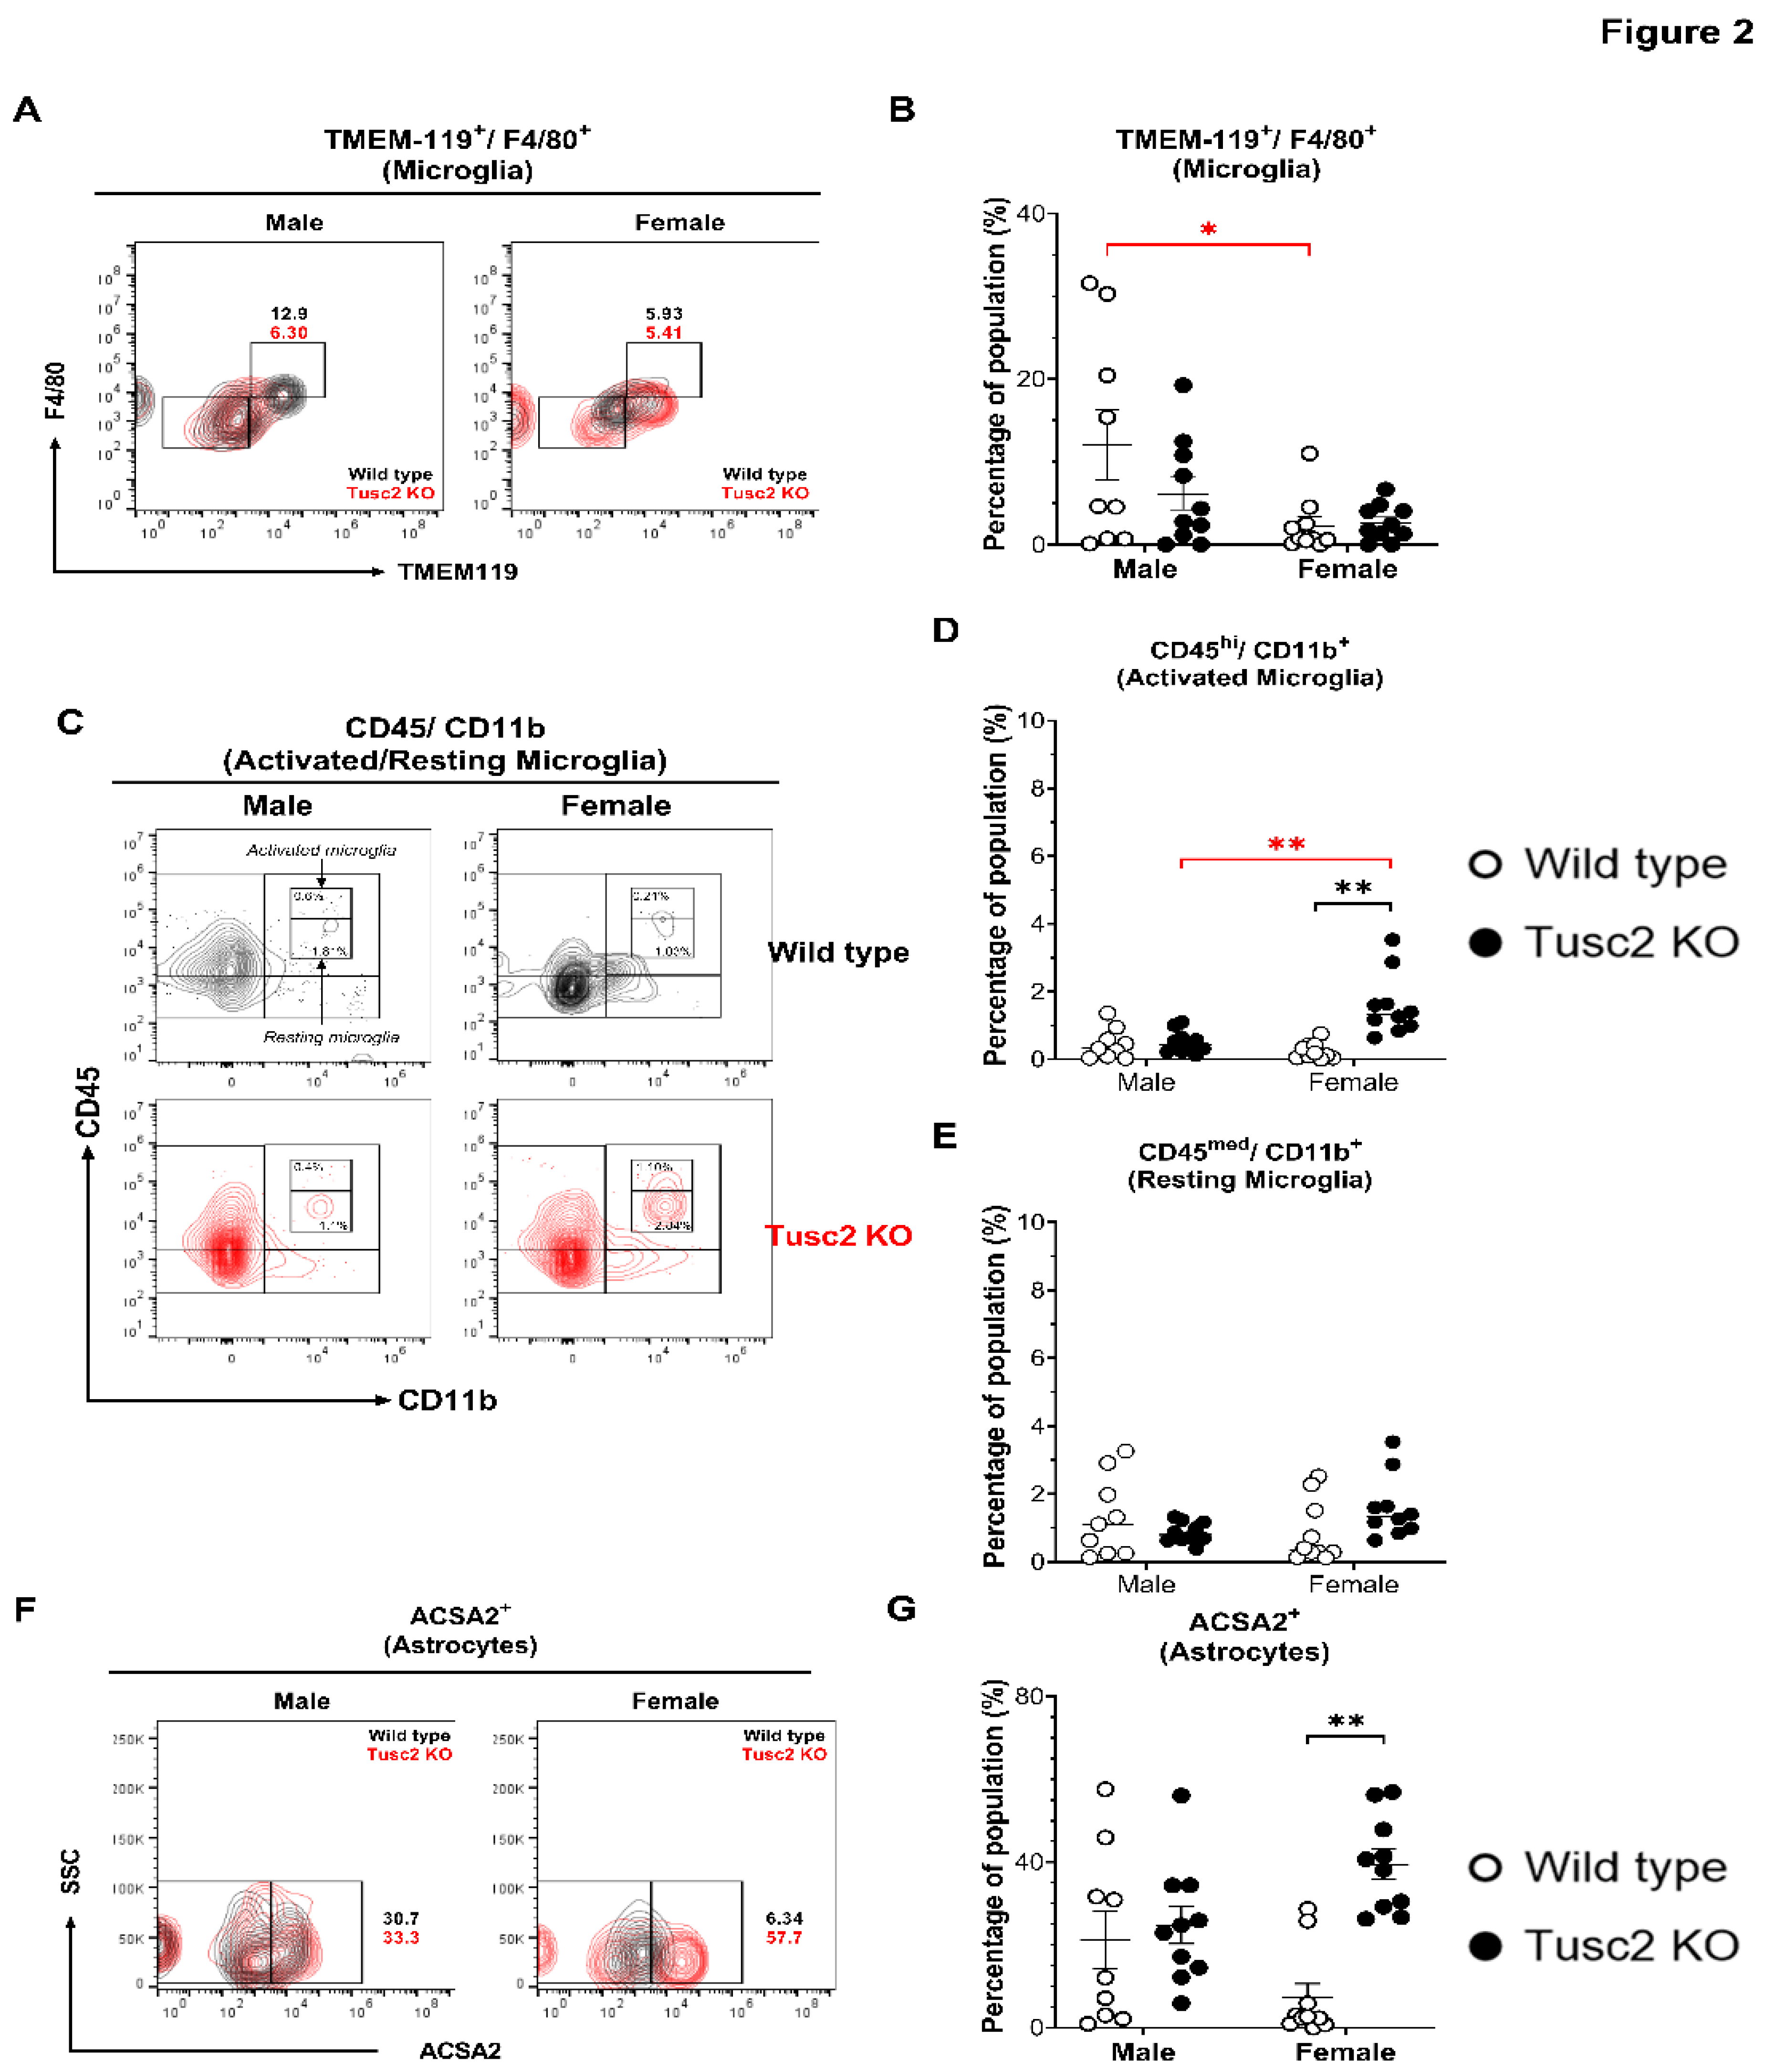
Figure 3.
Tusc2 deficiency causes alterations in CD4 T and CD4 T subset Th1 cells in the brain. (A) Representative contour dot plot graph comparing the differences of T lymphocyte population (CD4+/CD25+) between the Wild type (black) and the Tusc2 KO (red) models in males and females. (B) CD4 T cell proportions in the CNS showed to be significantly decreased in KO females (p=<0.0001); no significant difference was observed in males. (C) Representative histogram showing the difference in IFN-γ expression between CD4+/CD25+ T lymphocytes (Th1 response) of Wild type (black) and Tusc2 KO (red) male and female models. (D) CD4 T cell subset Th1 cells were evaluated. (E) MFI values of IFN-γ cytokine-producing CD4 T cells were significantly decreased in Tusc2 KO female mice (p=0.0068); male KO mice showed no significant difference (p=0.2136) in proportion as compared to their WT counterparts. Two-way ANOVA followed by Bonferroni’s multiple comparisons test. * p≤0.05, ** p≤0.01. n= 10 mice per group. For bar graphs, the significant black asterisk denotes comparisons between the WT and KO models, while the red asterisk represents the comparison between genders. “Percentage of population” indicates the proportion over all events in the population gating shown at the graphic top.
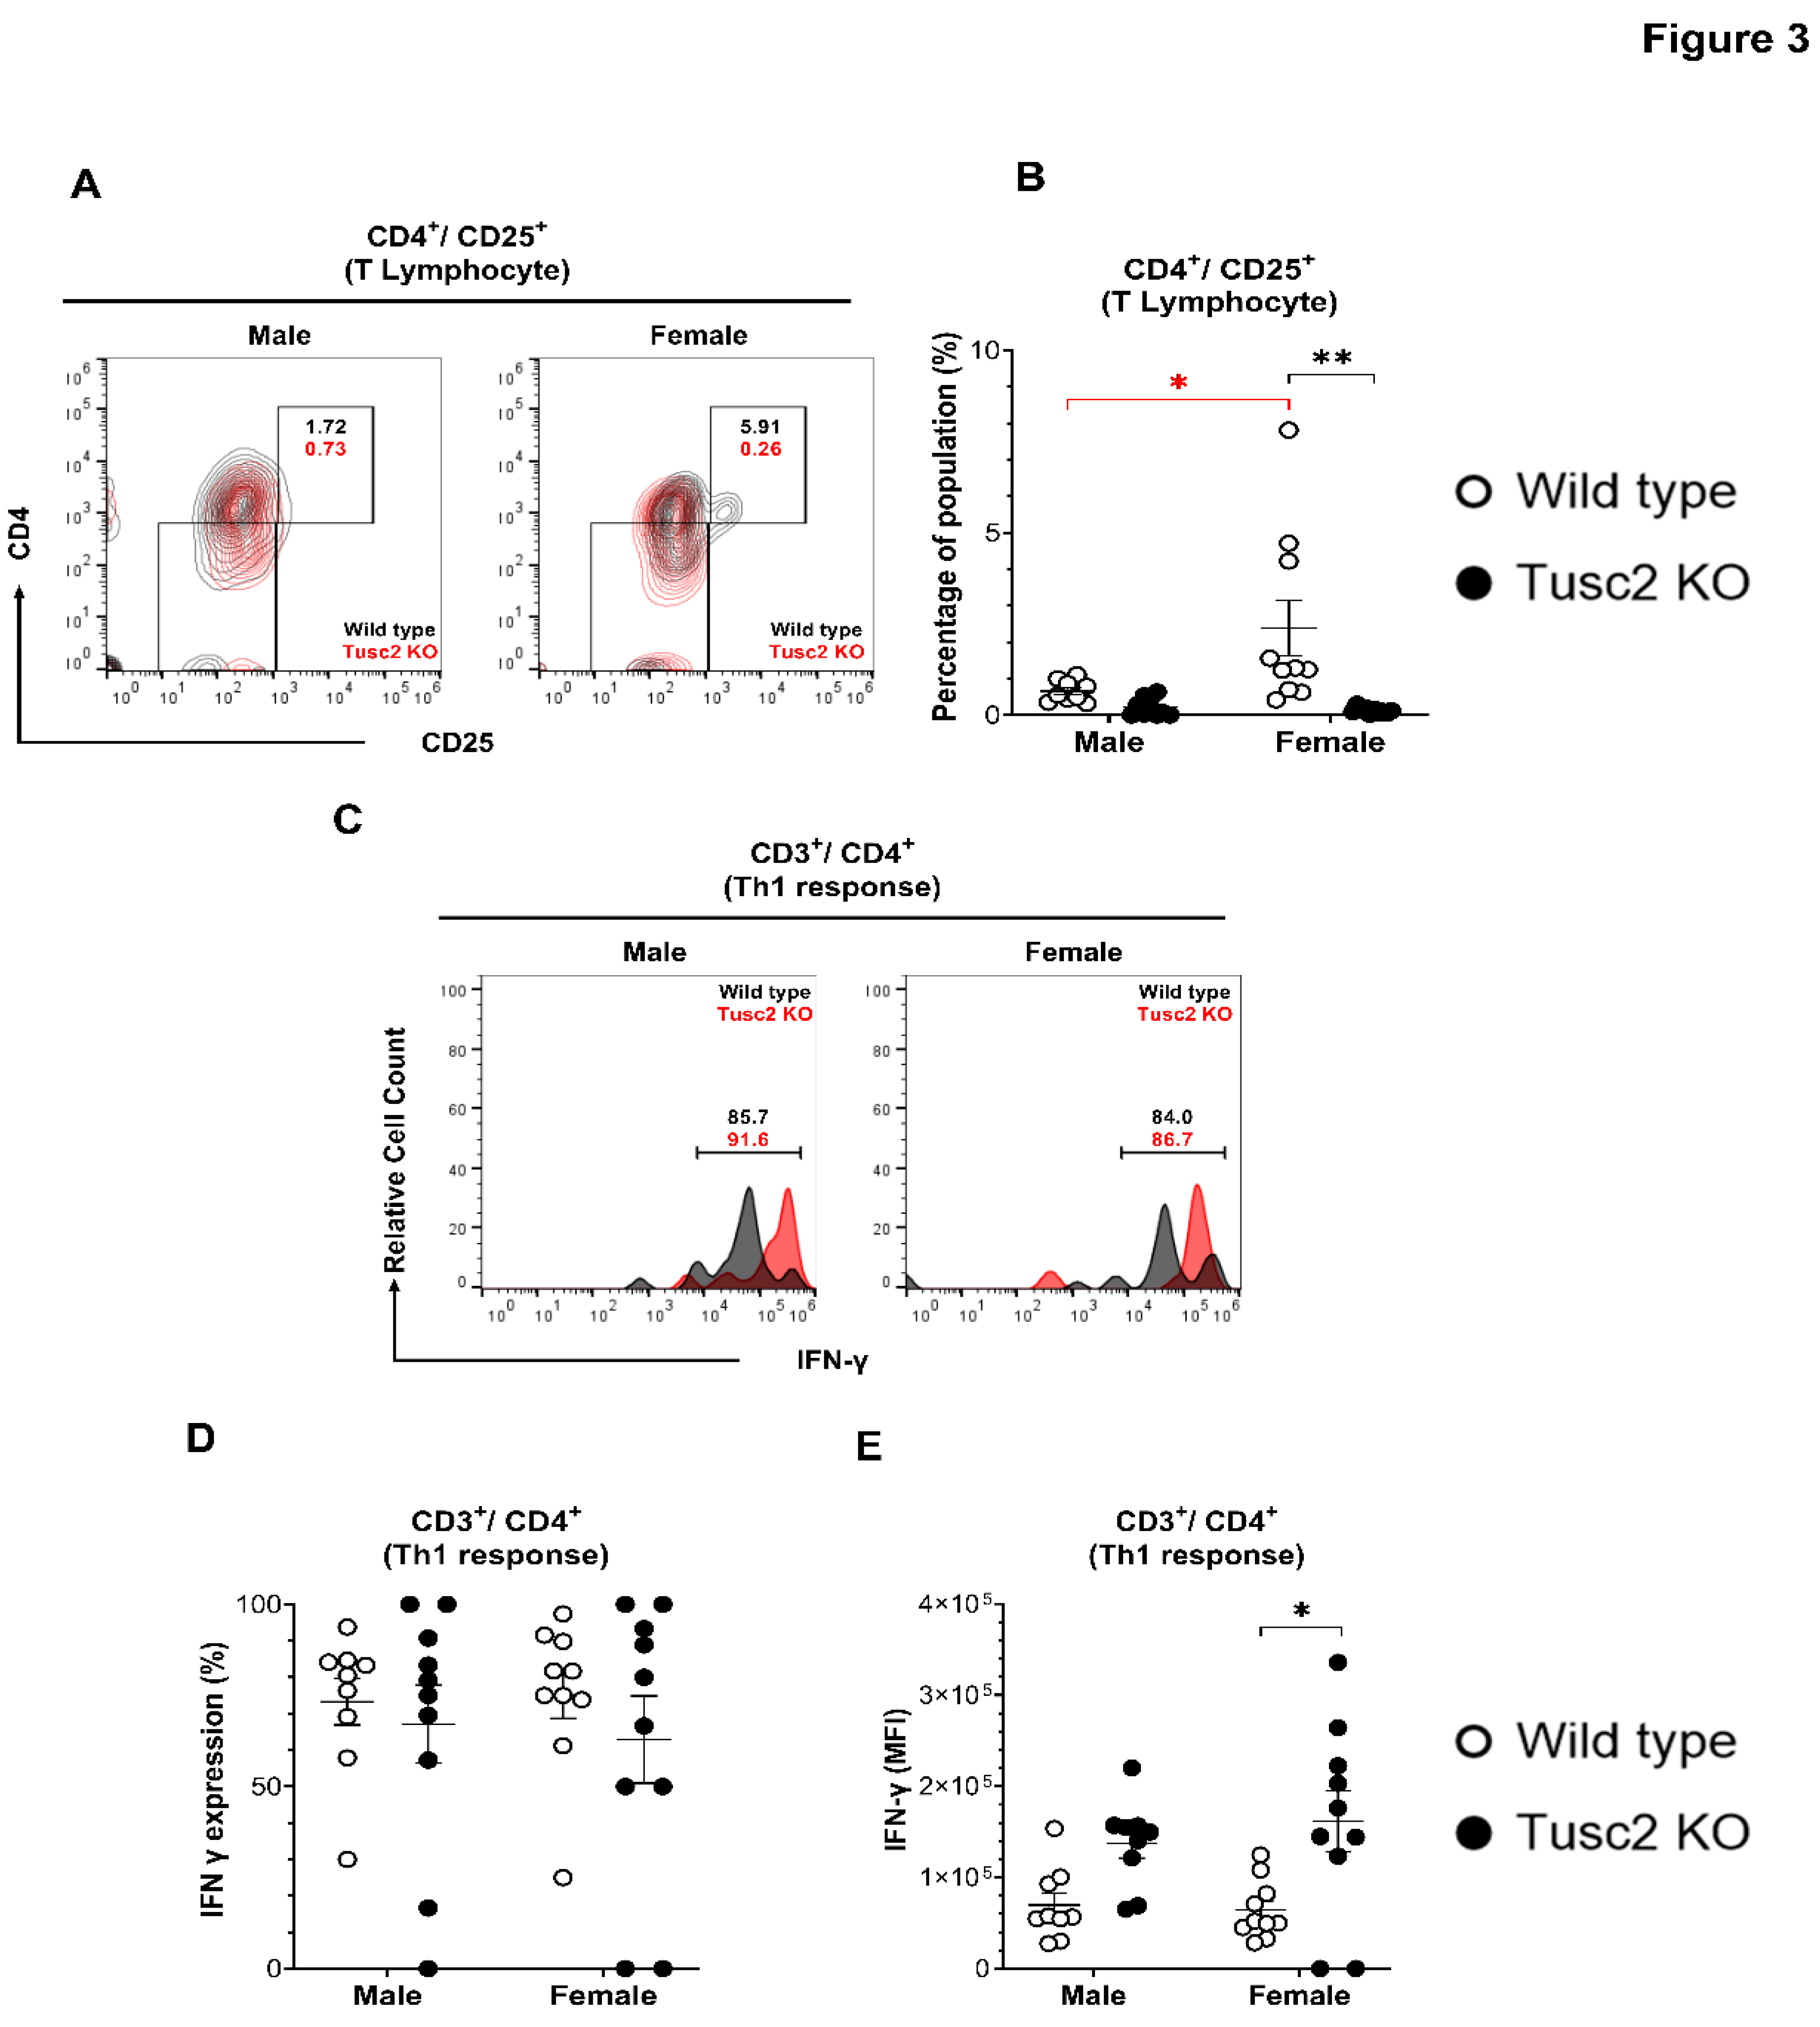
Figure 4.
Loss of Tus2 affects the expression of CD8 T cells in the CNS. (A) Representative contour dot plot graph comparing the differences of cytotoxic T lymphocytes population (CD8+/CD25+) between the Wild type (black) and the Tusc2 KO (red) models in males and females. (B) CD8 T cells were evaluated; Tusc2 was significantly decreased in KO males (p=0.0006) and KO females (p=<0.0001). (C) Representative contour dot plot graph comparing the differences of T effector cytotoxic lymphocytes population (CD8+/CD28+) between the Wild type (black) and the Tusc2 KO (red) model in males and females. (D) The proportion of CD28+ cytotoxic CD8 T cells was evaluated and was found to be significantly decreased in female Tusc2-KO mice. (E) Representative histogram showing the difference in granzyme B expression between CD8+/CD28+ effector cytotoxic T lymphocytes of Wild type (black) and Tusc2 KO (red) male and female models. (F) Granzyme expressing CD8 T positive cells were shown to be significantly decreased in Tusc2 KO males (p=<0.0001) and KO females (p=0.0003). (G) MFI of granzyme expressing CD8 T cells did not show a statistical difference in expression. Two-way ANOVA followed by Bonferroni’s multiple comparisons test. * p≤0.05, ** p≤0.01. n= 10 mice per group. For bar graphs, the significant black asterisk denotes comparisons between the WT and KO models, while the red asterisk represents the comparison between genders. “Percentage of population” indicates the proportion over all events in the population gating shown at the graphic top.
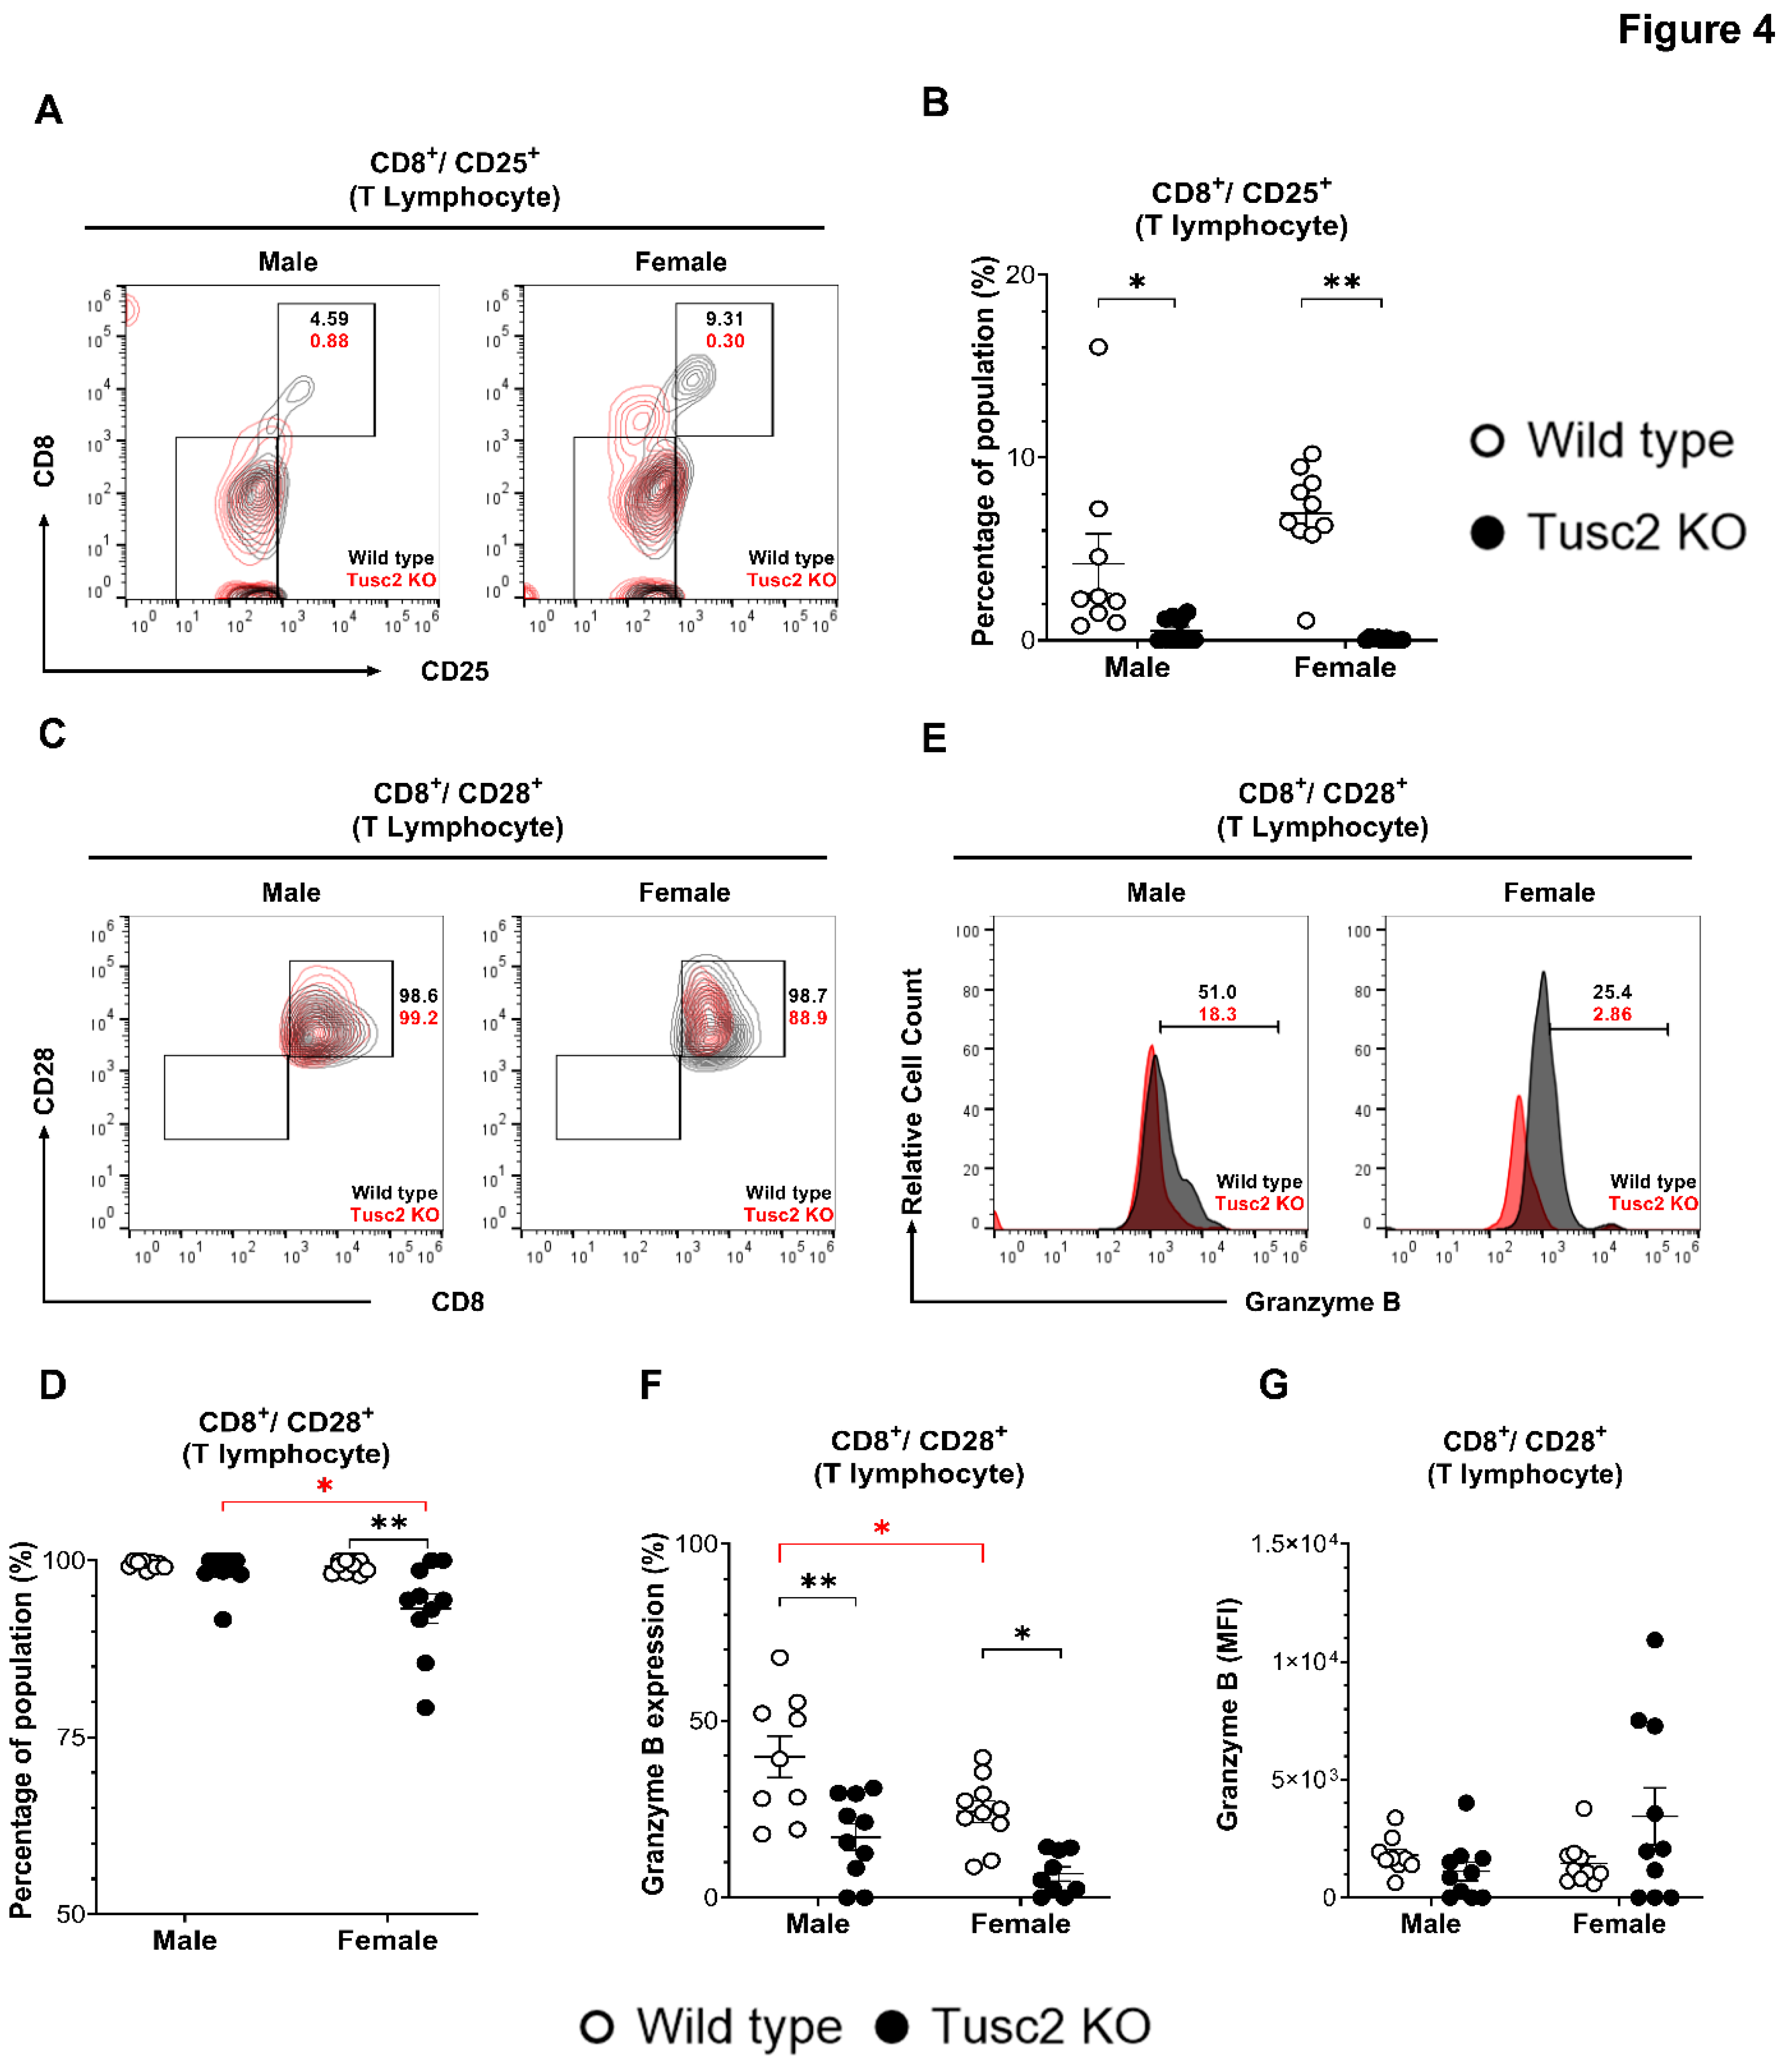
Figure 5.
Lack of Tusc2 disrupts the inhibitory mechanisms of immune cells responsible for regulating inflammation. (A). Representative contour dot plot graph showing the difference in FOXP-3 expression between CD3+/CD4+/CD25+ T lymphocytes (Treg response) of Wild type (black) and Tusc2 KO (red) male and female models. (B-C) Flow analysis revealed a decrease in the overall proportion and MFI value of Treg cells for KO males (p=0.0001) and KO females (p=<0.0001). Two-way ANOVA followed by Bonferroni’s multiple comparisons test. * p≤0.05, ** p≤0.01. n= 10 mice per group. For bar graphs, the significant black asterisk denotes comparisons between the WT and KO models, while the red asterisk represents the comparison between genders.
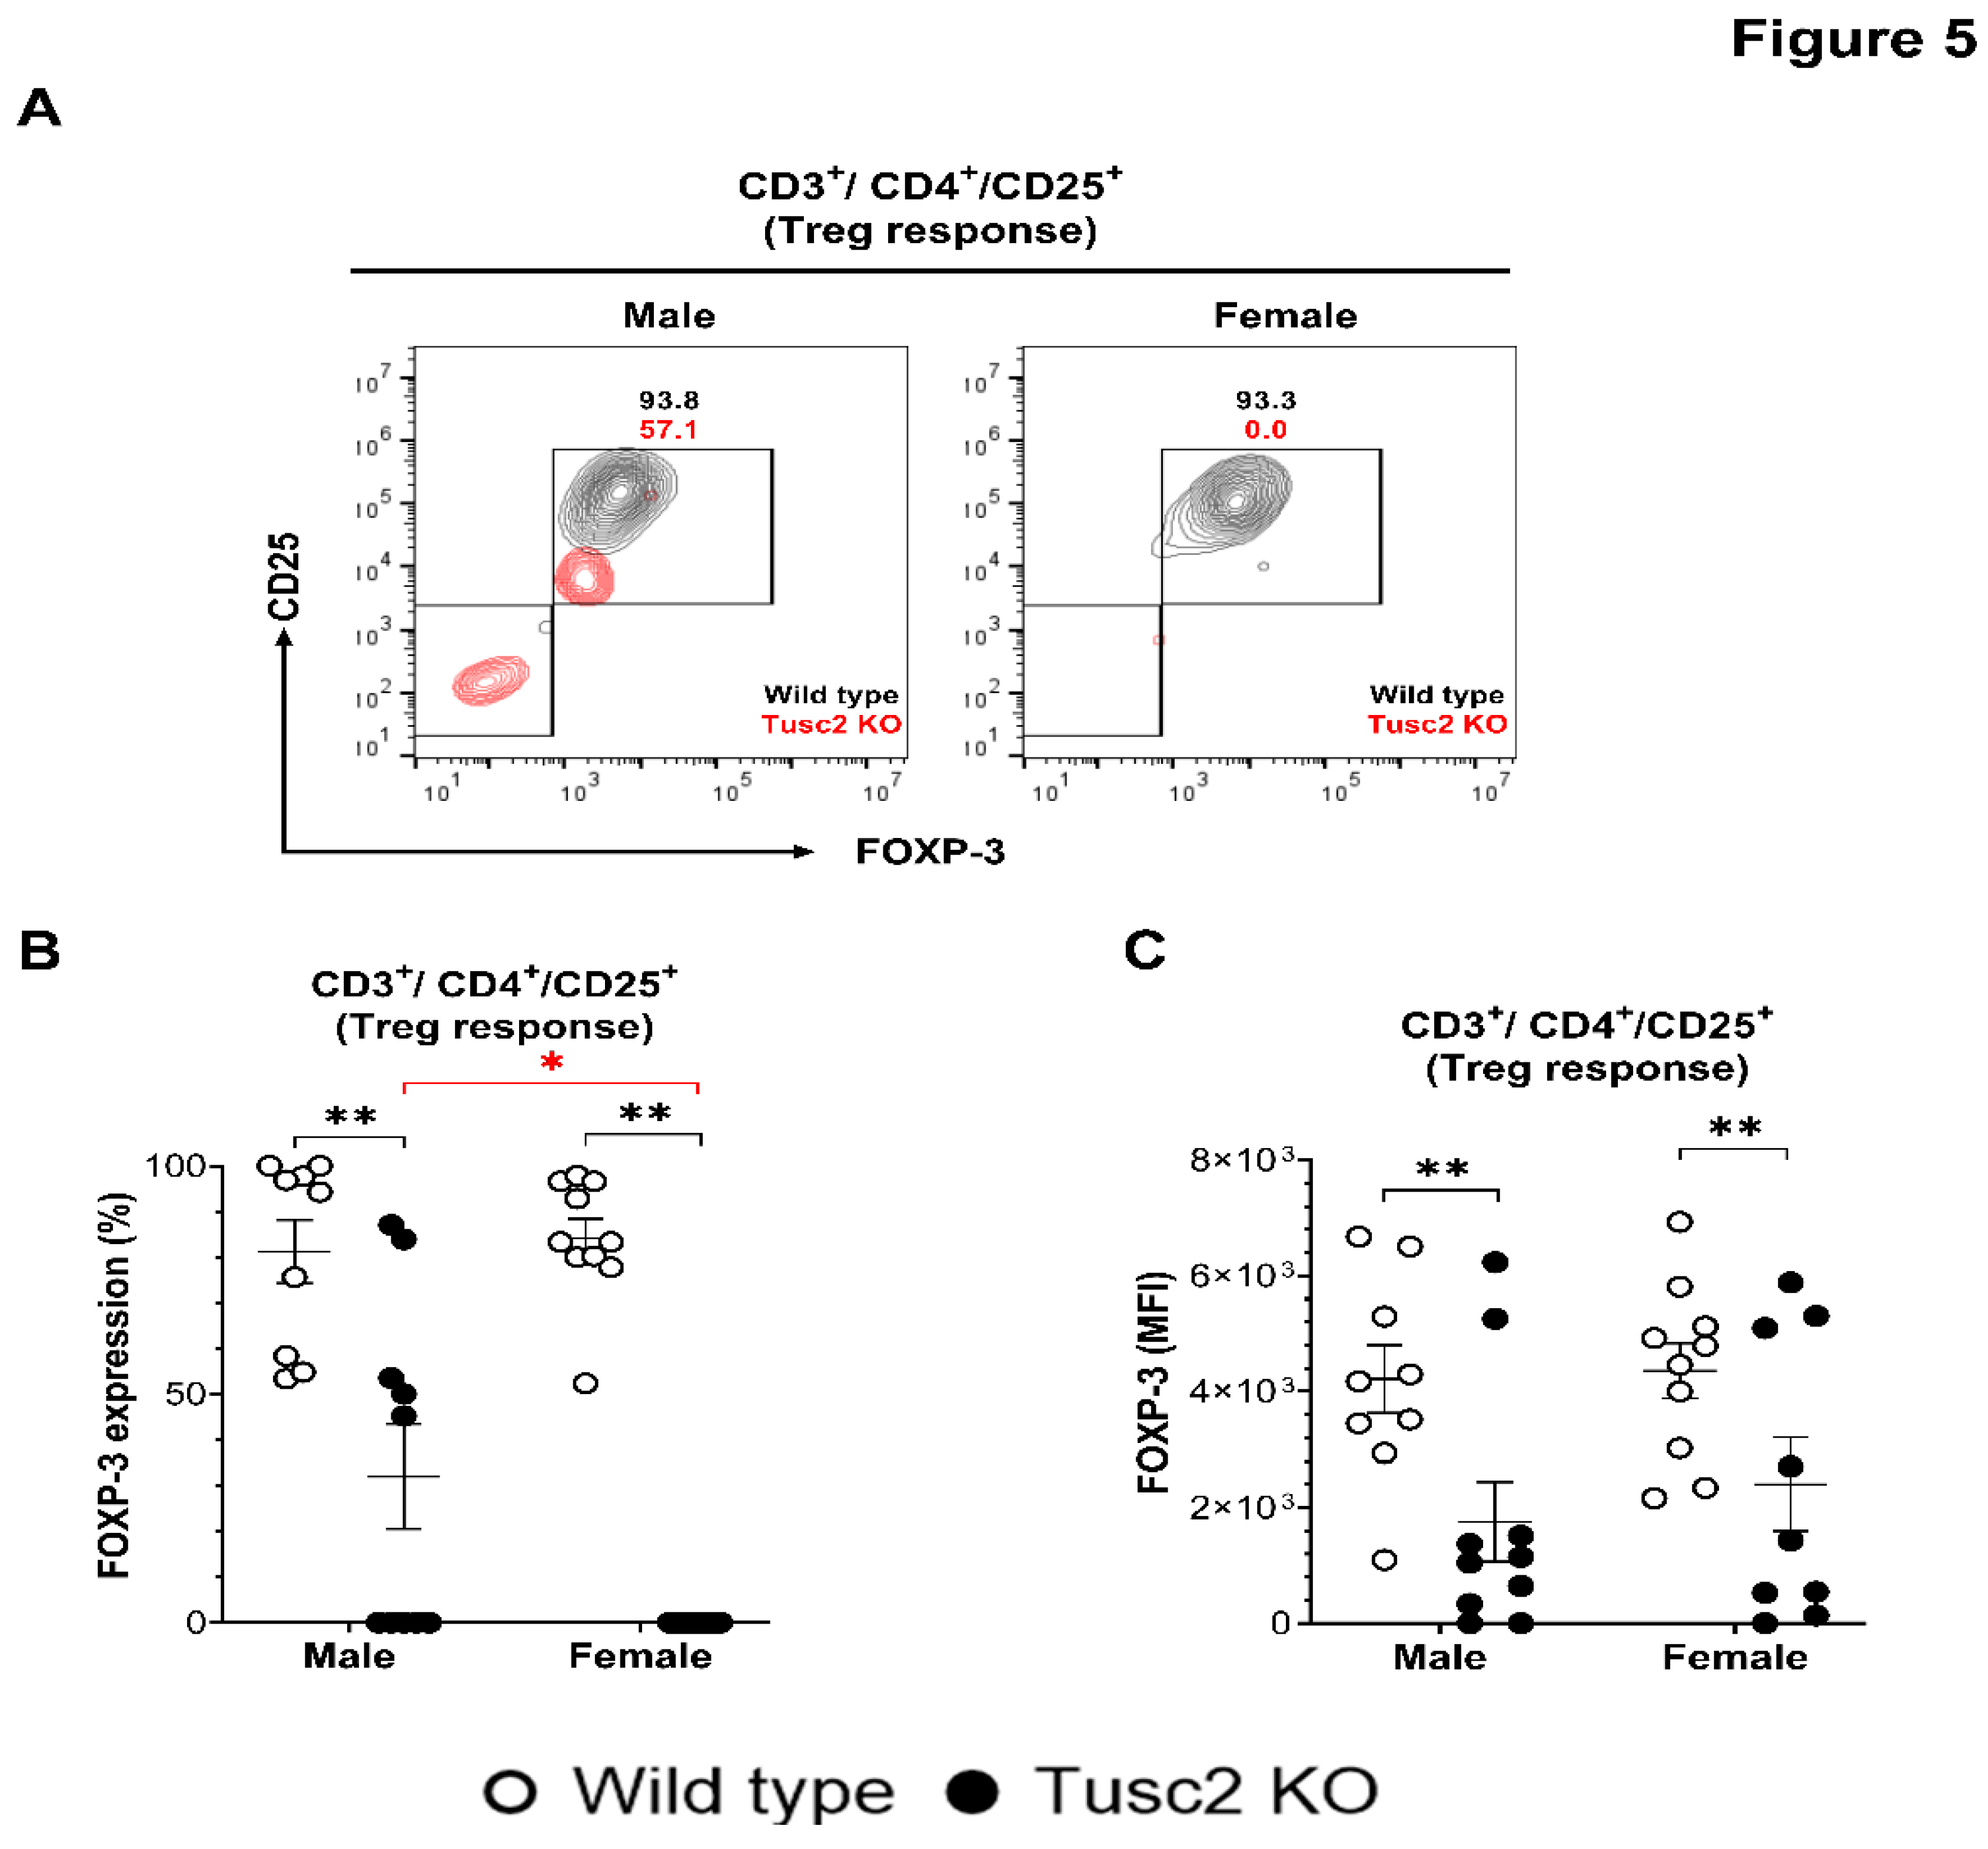
Figure 6.
Tusc2-KO disrupts NK and NKT cells in the CNS. (A) Representative contour dot plot graph comparing the differences of Ly49G+ NK cell population (CD11b+/CD3-/CD49+) between the Wild type (black) and the Tusc2 KO (red) model in males and females. (B) Tusc2 female KO mice showed a decrease in the proportion of NK cells (p=<0.0001) compared to their WT counterparts; KO males did not show a significant difference compared to WT males. (C) Representative contour dot plot graph comparing the differences of Ly49G+ NKT cell population (CD11b+/CD3+/CD49+) between the Wild type (black) and the Tusc2 KO (red) model in males and females. (D) NKT cell expression was significantly decreased in Tusc2 KO males (p=0.0118) and in Tusc2 KO females (p=<0.0001). (E) Representative contour dot plot graph comparing the differences of B lymphocyte population (CD19+/CD25+) between the Wild type (black) and the Tusc2 KO (red) model in males and females. (F) The proportion of B cells was also evaluated. Tusc2 KO males had a significant decrease in B cells (p=0.0343), and Tusc2 KO females showed a decrease in B cell proportions as well (p=<0.0001). Two-way ANOVA followed by Bonferroni’s multiple comparisons test. * p≤0.05, ** p≤0.01. n= 10 mice per group. For bar graphs, the significant black asterisk denotes comparisons between the WT and KO models, while the red asterisk represents the comparison between genders. “Percentage of population” indicates the proportion over all events in the population gating shown at the graphic top.
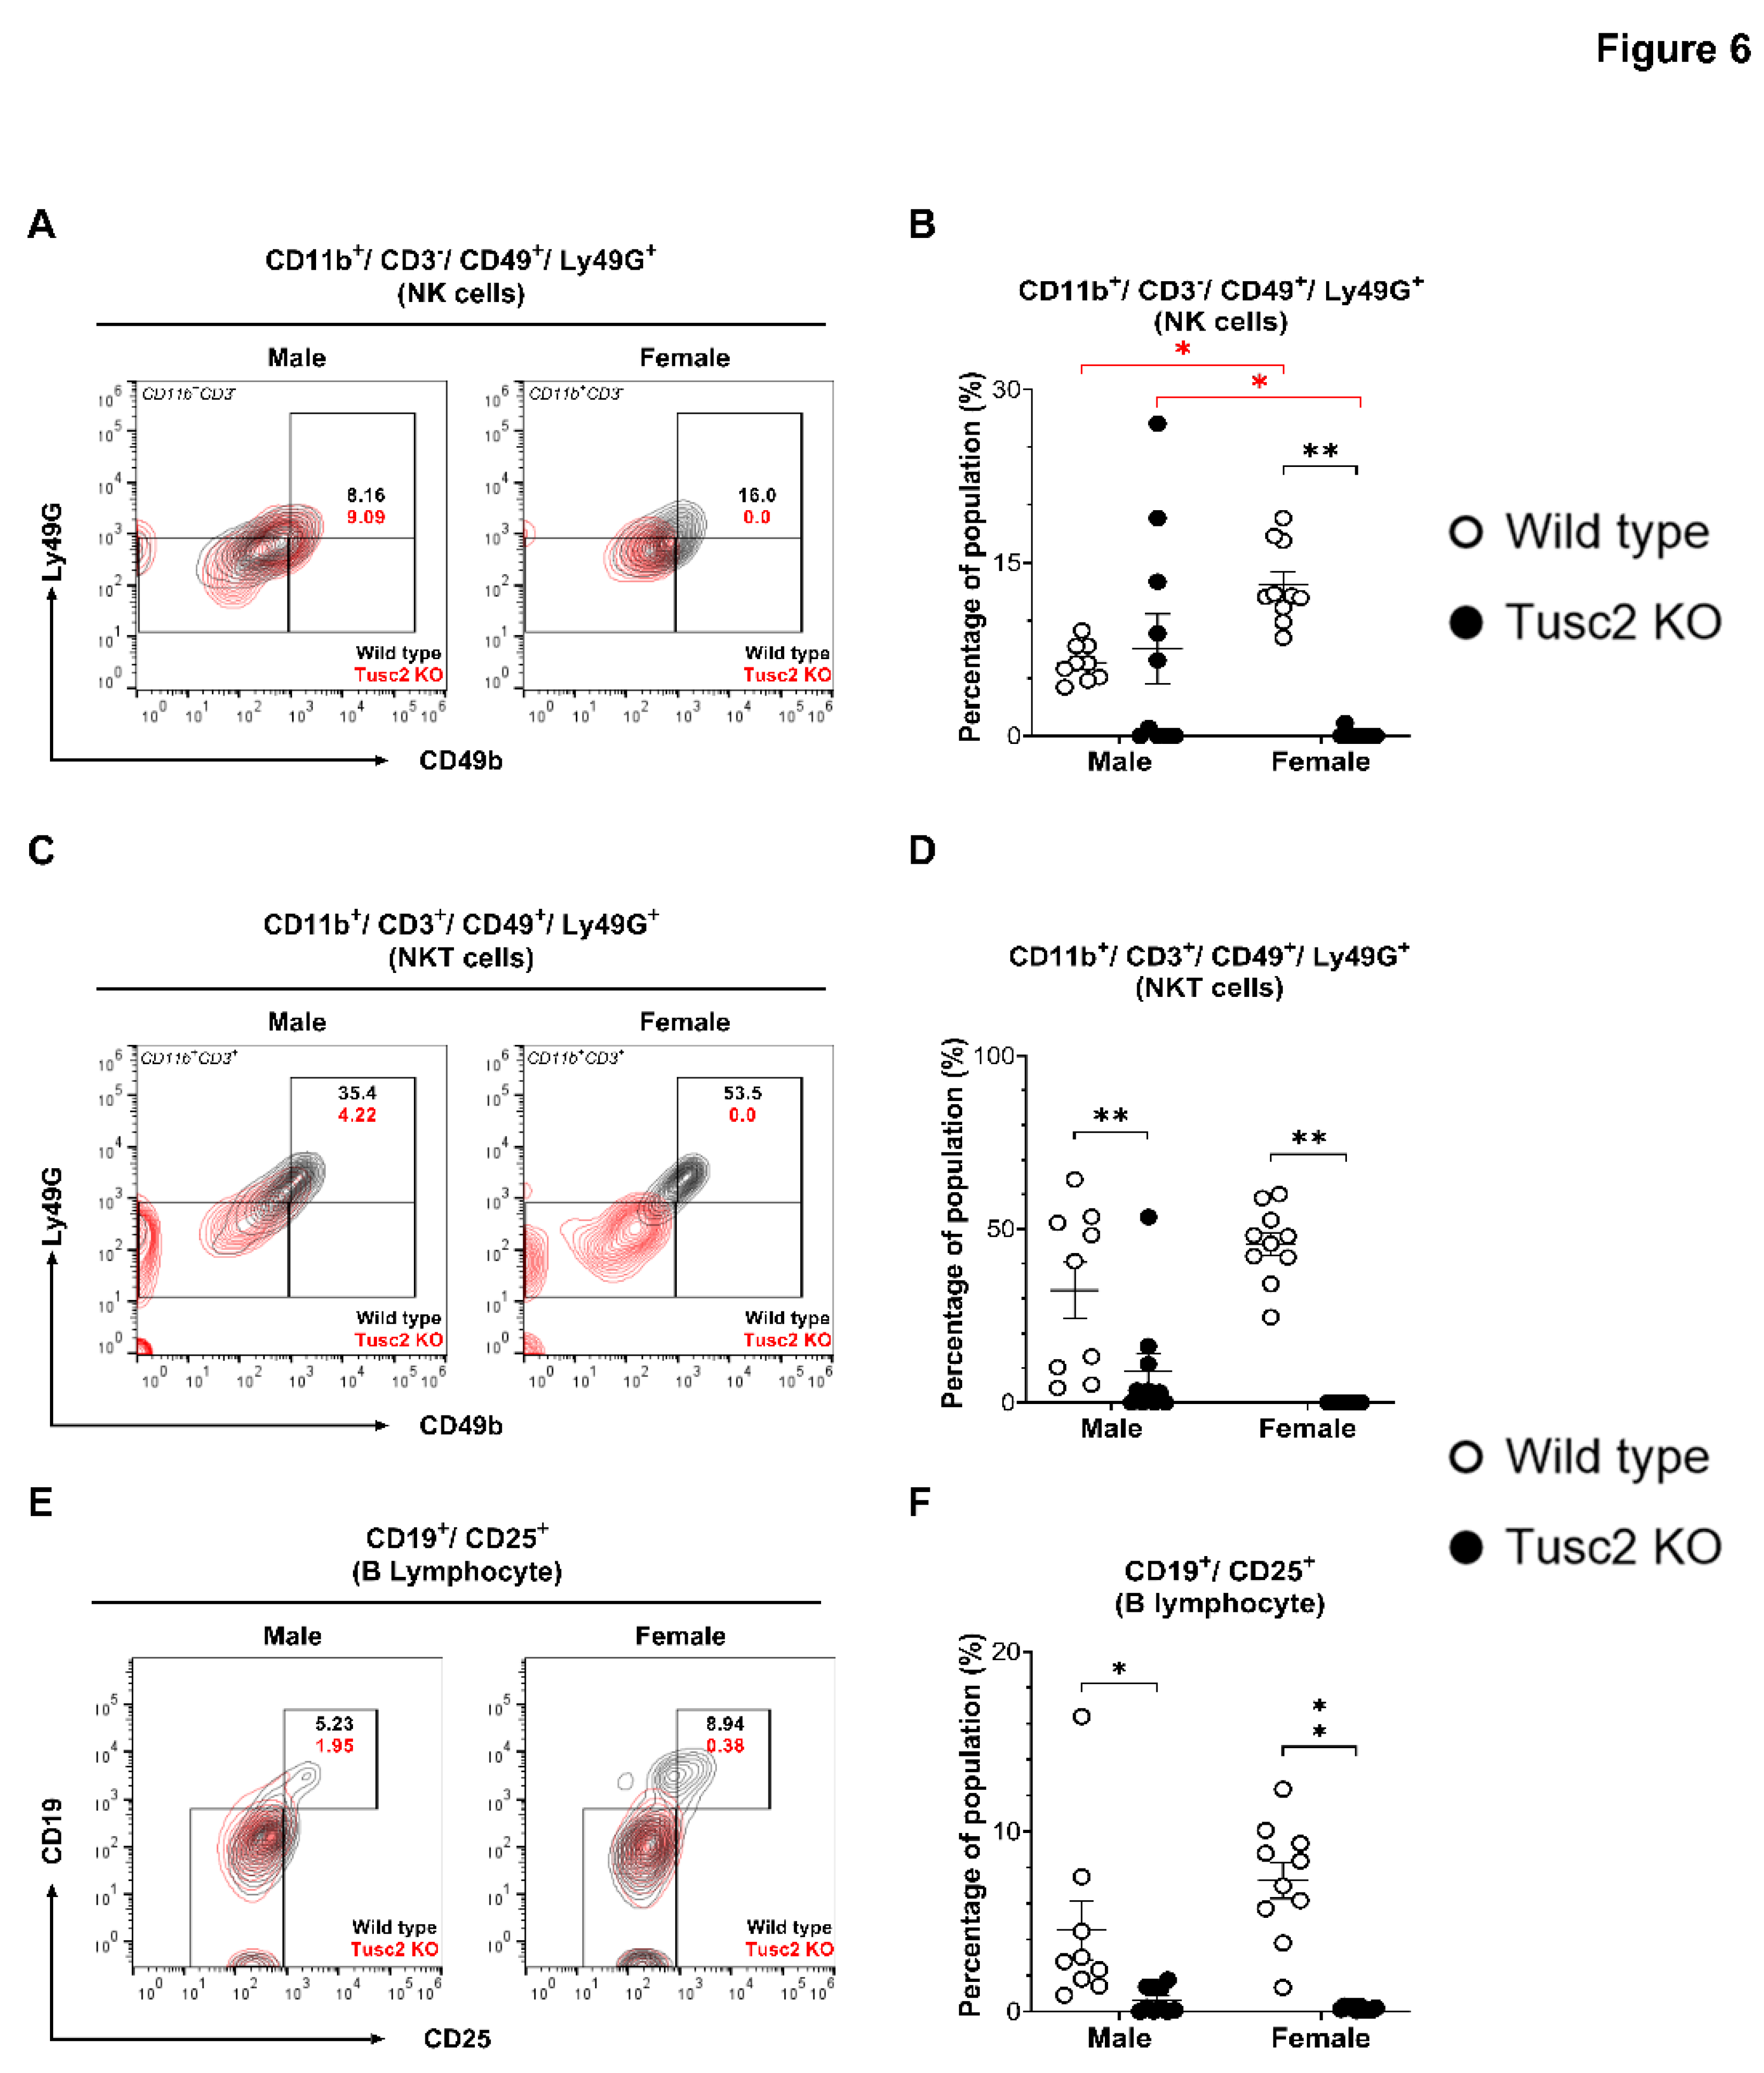
Figure 7.
Western blot analysis of key age-related proteins in the hippocampi of Tusc2 mice. (A) Western blotting graphic showing the evaluation of the proteins involved in brain integrity, synaptic transmission, and CNS homeostasis. (B) Shows the relative expression of GFAP in WT and KO female and male Tusc2 mice; KO males showed a significant decrease in GFAP (p= 0.0378, n=4), and females showed a significant decrease as well (p= 0.0038, n=4). (C) CaMKII levels in Tusc2 KO males and females mice were significantly increased (p= 0.0336, n=7) and (p= 0.0079, n=4), respectively. (D) Levels of Calbindin were measured. Tusc2 KO males showed a significant increase in expression (p=0.0055, n=7), while females showed no significant difference (p=0.1721, n=4). (E) Phosphorylated S6 was significantly increased in female KO mice (p= 0.0330, n=4), and a trend of increase was seen in males (p=0.0925). All data were expressed as the mean ± SEM. Two-tailed unpaired t-test. * p≤0.05, ** p≤0.01. n= 4-7 mice per group.
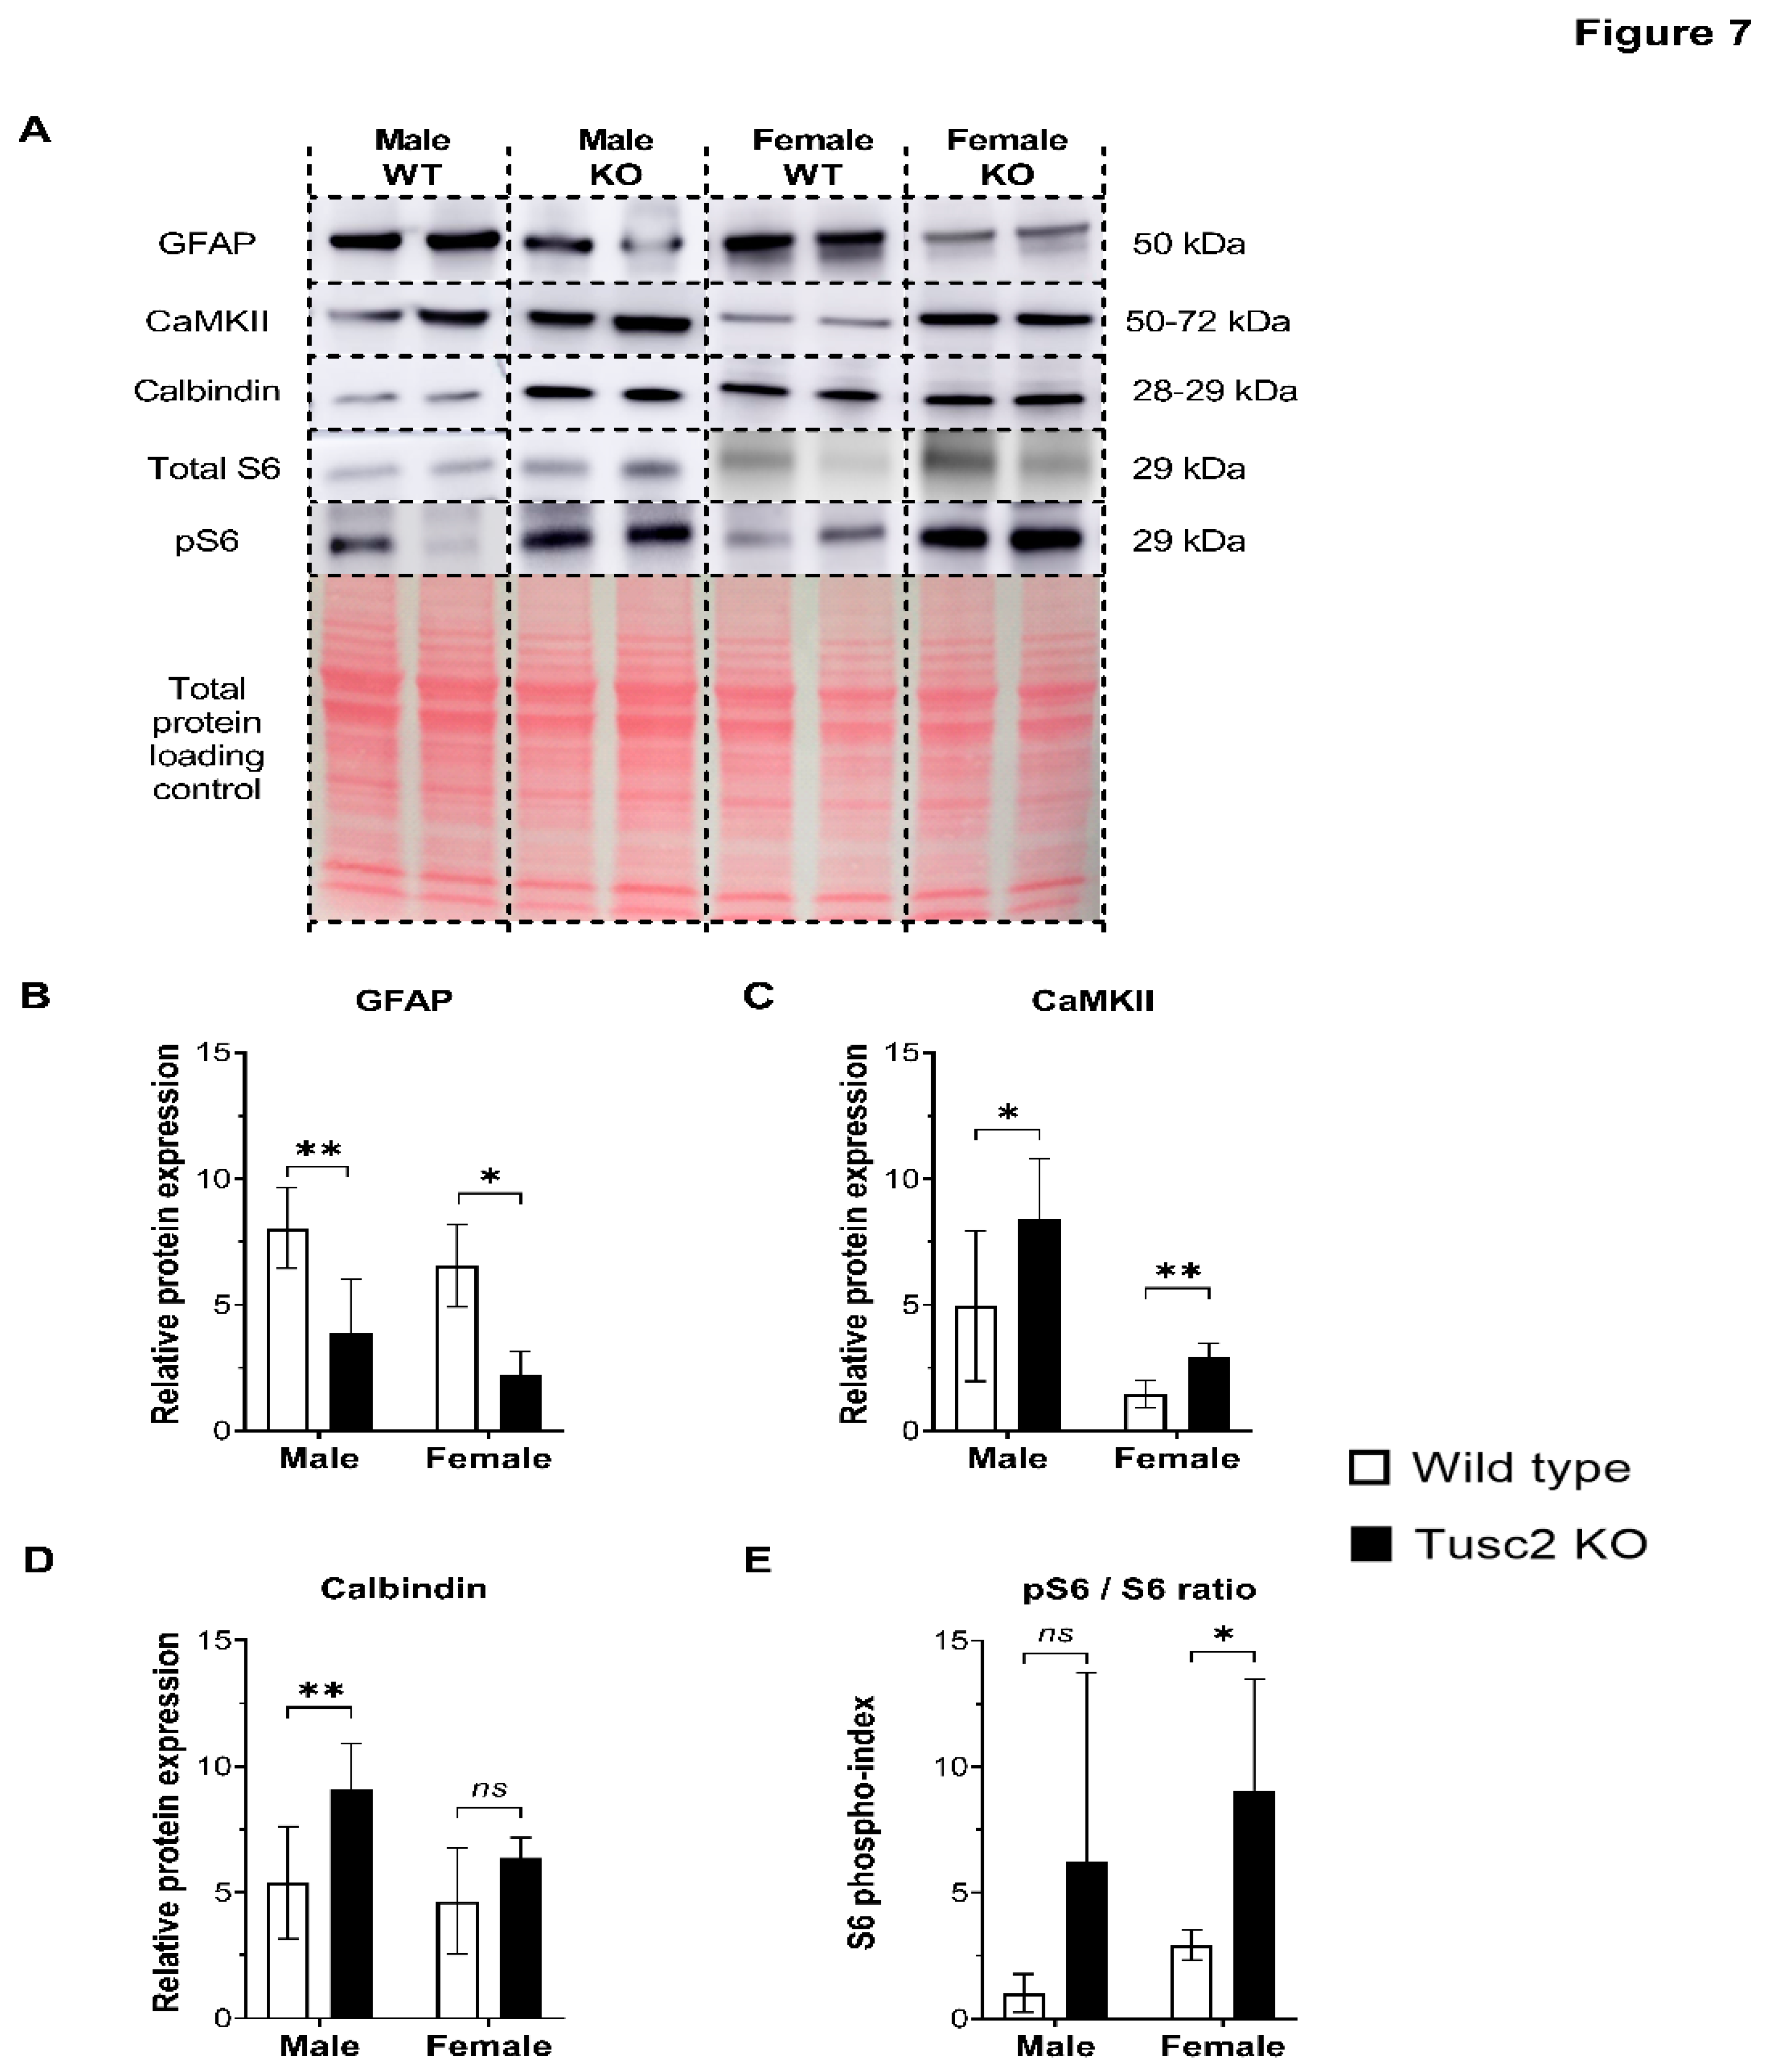
Figure 8.
Human Tusc2 RNA levels decrease with age in the brain and immune tissues. (A) Mixed-effects linear regression model showing the downregulation in mRNA expression (TPM) (Blue dots) and predictive expression values (Red squares) in human patient samples ranging from 10 to 70 years of age, as obtained from the Genotype-Tissue Expression (GTEx). All data is represented as the mean ± SD. n= 408 (68 samples per group) (B) A representative graphical displays the negative correlation observed between age and Tusc 2 gene expression in humans, where an increase in age leads to a concurrent decrease in Tusc 2 gene expression levels.
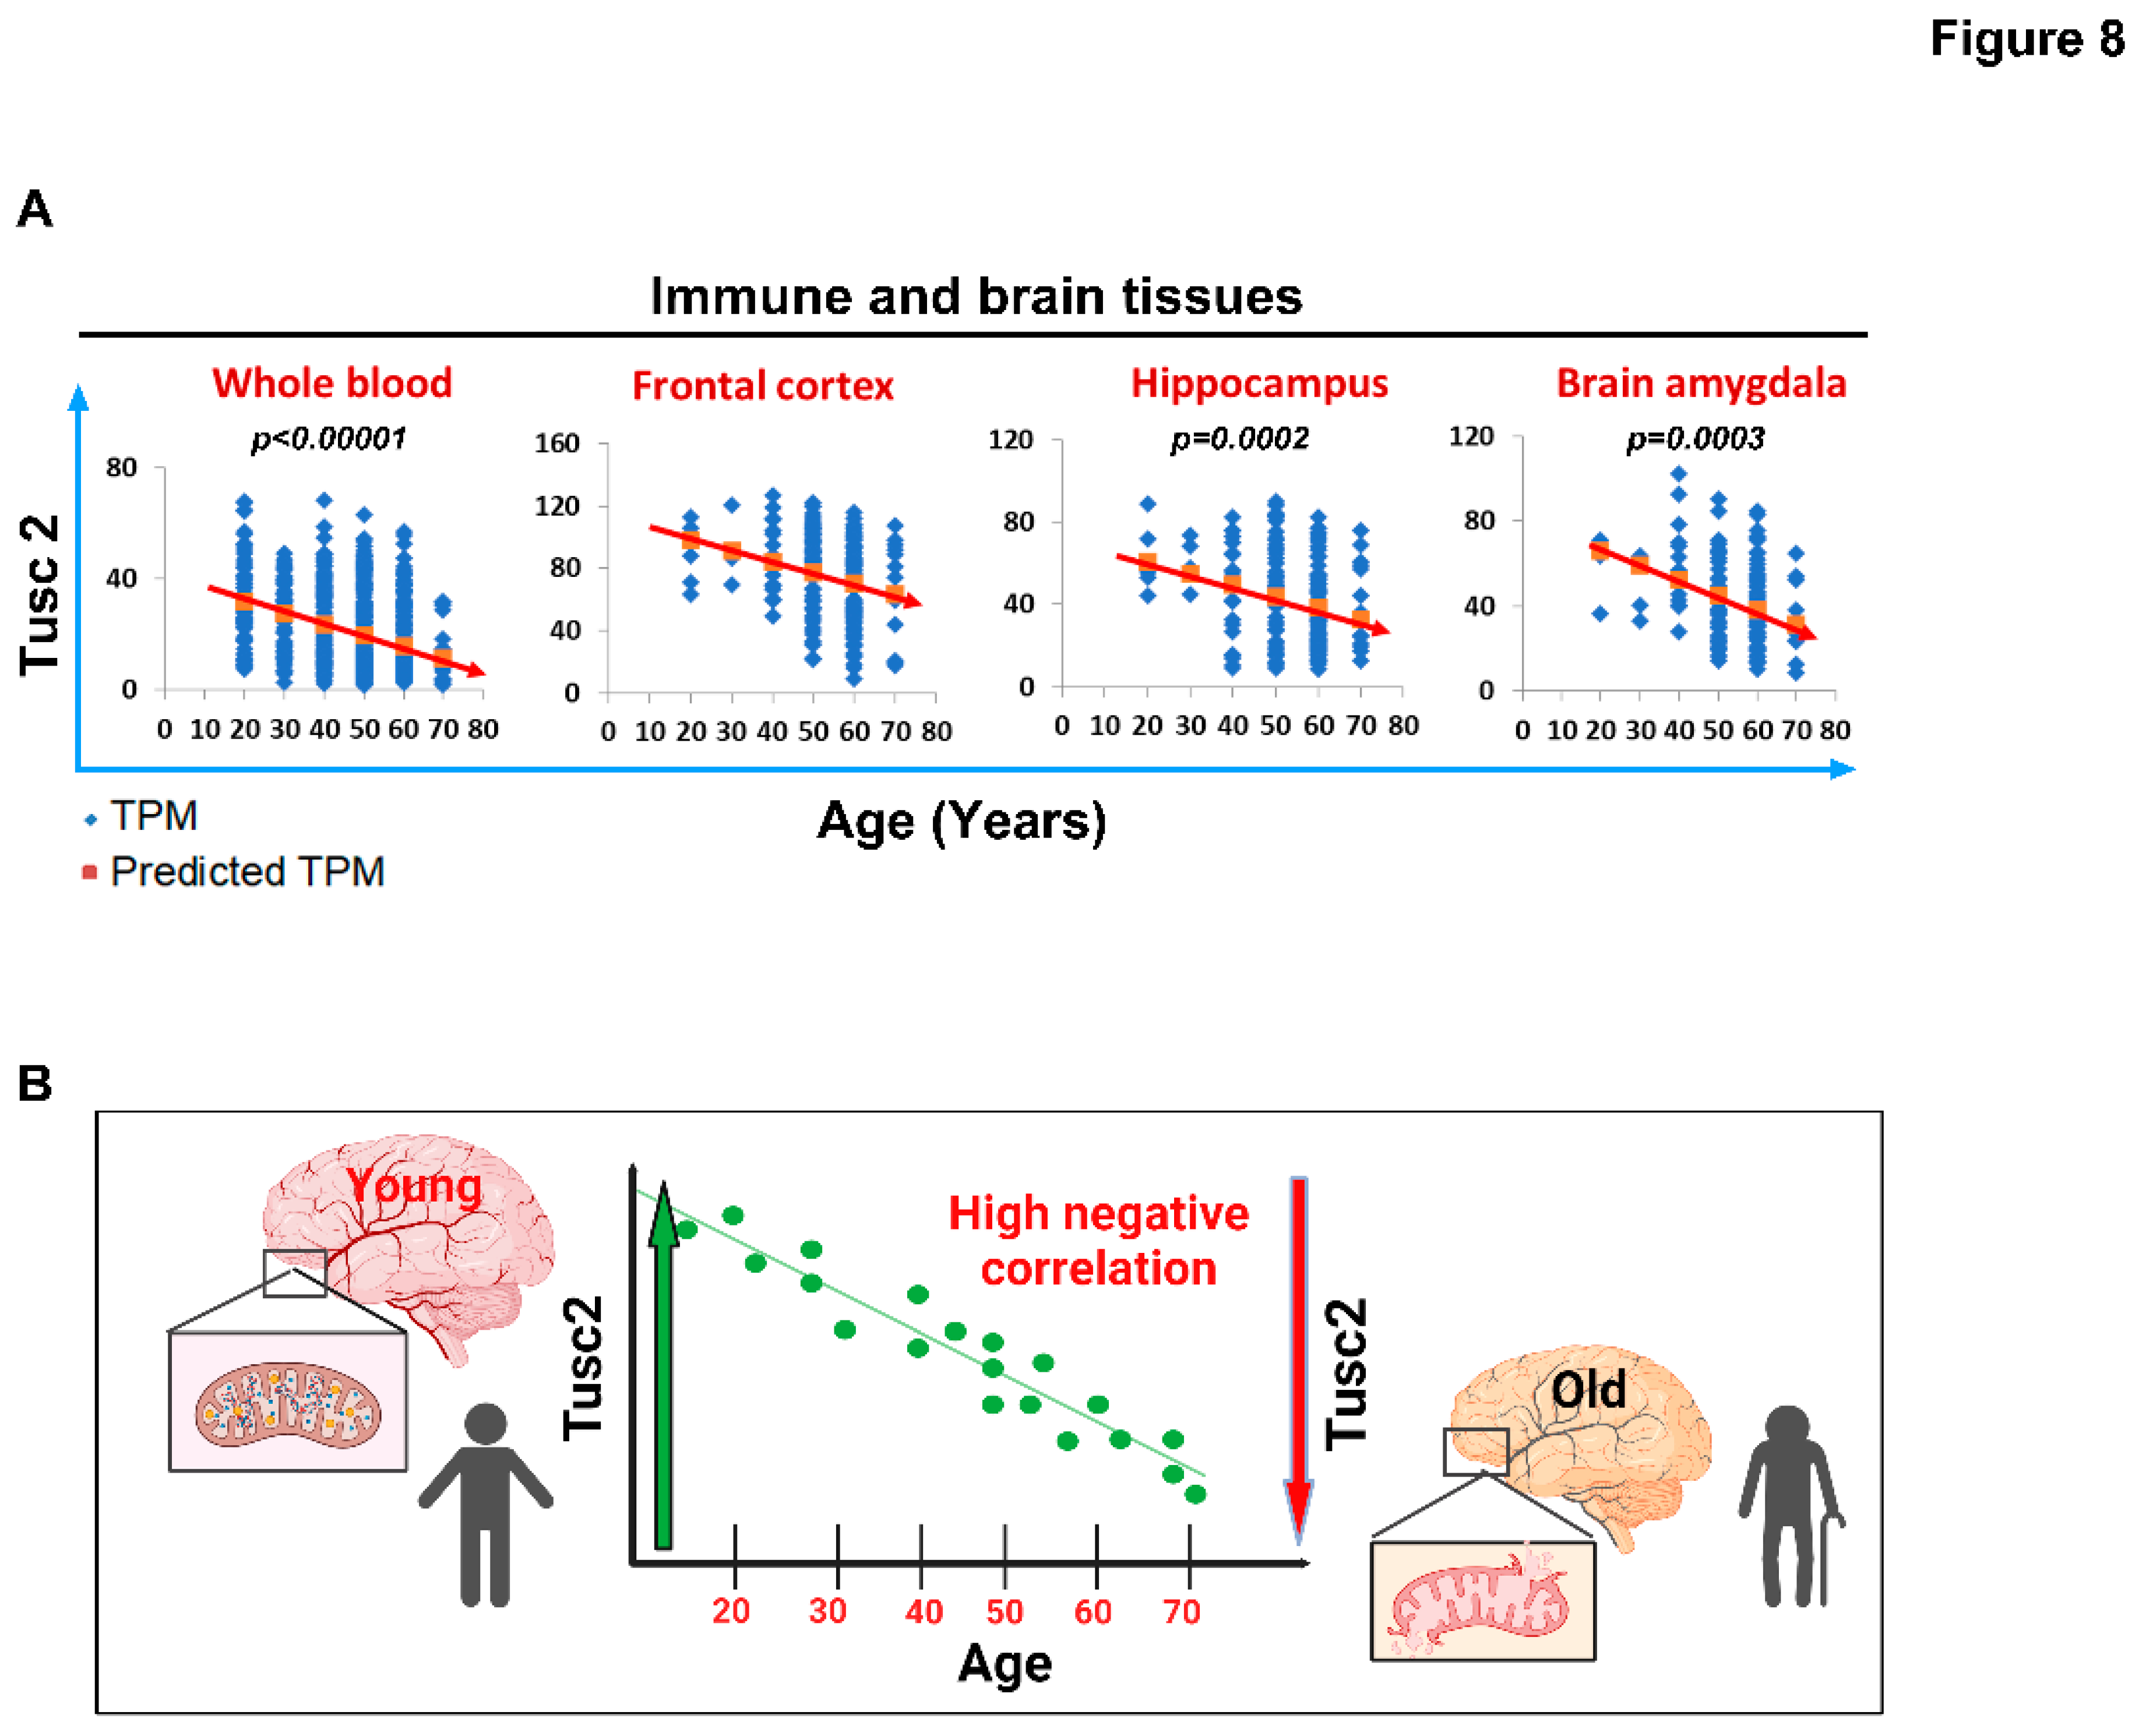
Disclaimer/Publisher’s Note: The statements, opinions and data contained in all publications are solely those of the individual author(s) and contributor(s) and not of MDPI and/or the editor(s). MDPI and/or the editor(s) disclaim responsibility for any injury to people or property resulting from any ideas, methods, instructions or products referred to in the content. |
© 2024 by the authors. Licensee MDPI, Basel, Switzerland. This article is an open access article distributed under the terms and conditions of the Creative Commons Attribution (CC BY) license (http://creativecommons.org/licenses/by/4.0/).
Copyright: This open access article is published under a Creative Commons CC BY 4.0 license, which permit the free download, distribution, and reuse, provided that the author and preprint are cited in any reuse.


