
Submitted:
22 July 2024
Posted:
22 July 2024
You are already at the latest version
Abstract
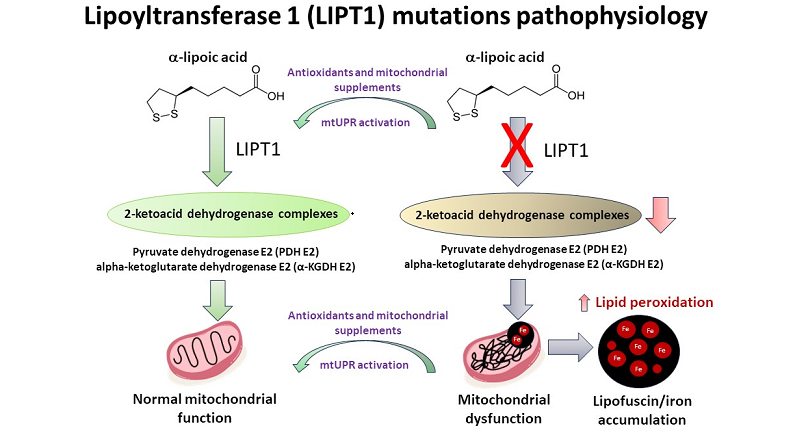
Mutations in the lipoyltransferase 1 (LIPT1) gene are rare inborn errors of metabolism leading to a fatal condition characterized by lipoylation defects of the 2-ketoacid dehydrogenase complexes causing early-onset seizures, psychomotor retardation, abnormal muscle tone, severe lactic aci-dosis and increased urine lactate, ketoglutarate, and 2-oxoacids levels. In this article, we characterized the disease pathophysiology using fibroblasts and induced neurons derived from a patient bearing a compound heterozygous mutation in LIPT1. Western blot analysis revealed reduced expression of LIPT1 and absent expression of lipoylated pyruvate dehydrogenase E2 (PDH E2) and alpha-ketoglutarate dehydrogenase E2 (α-KGDH E2) subunits. Accordingly, activities of PDH and α-KGDH were markedly reduced, associated with cell bioenergetics failure, iron accumulation and lipid peroxidation. In addition, using a pharmacological screening, we identified a cocktail of antioxidants and mitochondrial boosting agents consisting of pantothenate, nicotinamide, vitamin E, thiamine, biotin, and alpha-lipoic acid, which is capable of rescuing LIPT1 patho-physiology, increasing LIPT1 expression and lipoylation of mitochondrial proteins, improving cell bioenergetics, and eliminating iron overload and lipid peroxidation. Furthermore, our data suggest that the beneficial effect of the treatment is mainly mediated by SIRT3 activation. In conclusion, we have identified a promising therapeutic approach for correcting LIPT1 mutations.
Keywords:
LIPT1
; SIRT3
; fibroblasts
; lipoylation
; bioenergetics
; 2-ketoacid dehydrogenase
1. Introduction
In the 1950s, Jukes et al. and Reed et al. discovered α-lipoic acid (α-LA), an essential cofactor for mitochondrial function [1,2]. α-LA or 6,8-dithiooctanoic acid, is covalently bound to the ∊-amino group of lysine residues and functions as a cofactor for the activity of essential mitochondrial enzymes [3], including pyruvate dehydrogenase (PDH), alpha-ketoglutarate dehydrogenase (α-KGDH), 2-oxoadipate dehydrogenase (OADH), branched chain ketoacid dehydrogenase (BCKDH), and the glycine cleavage system (GCS) [2,4,5]. A certain number of proteins are necessary to the biosynthesis of lipoic acid, and mutations in several genes are known to cause human mitochondrial diseases [4].
α-LA possesses a disulfide bond that provides a source of reductive potential required for the catalysis by mitochondrial dehydrogenases and participates in the stabilization and redox-dependent regulation of these multienzyme complexes [6]. These functions make lipoic acid essential for cell growth, oxidation of energy sources, glycine degradation, and regulation of mitochondrial redox balance [7]. α-LA metabolism has been thoroughly studied in prokaryotes [8] and yeast [9], but is less well-understood in superior organisms. In mammals, the α-LA biosynthetic pathway is carried out by the octanoyltransferase LIPT2 and the lipoic acid synthase LIAS. In addition, LIPT1 allows the lipoylation of several enzymes [7]. LIPT2 transfers octanoate from the acyl carrier protein (ACP) to the glycine cleavage system H protein (GCSH). Then, LIAS inserts sulfur atoms into the octanoyl group on GCSH, while LIPT1 transfers the lipoyl group from the GCSH to E2 dehydrogenases protein subunits. Deficiencies in either of these enzymes, as well as disruptions in mitochondrial fatty-acid synthesis type II (FASII), ACP or iron-sulfur cluster biogenesis, result in diminished lipoylation of PDH or α-KGDH, leading to impaired mitochondrial function [4].
One key difference in α-LA metabolism between Escherichia coli and Homo sapiens is the versatility of the bacterial enzyme LplA, a lipoyl-protein ligase enzyme, which is able to conjugate not only endogenous α-LA but also exogenous α-LA to an adenylate intermediate (lipoyl-AMP) followed by ligation to the lipoyl domain of E2 subunits and GCSH. Also, LplA could use both α-LA and octanoate to modify E2 subunits [10]. In contrast, human LIPT1 is only able to use endogenous α-LA, although a report identified a mammalian lipoic acid-activating enzyme, known as a medium-chain acyl-CoA synthetase (ACSM2A), that could activate exogenous lipoic acid with GTP [11]; however, there has been no substantial evidence to support that this enzyme functions in α-LA metabolism in vivo.
Pathologies related with α-LA are considered inborn errors of metabolism (IEMs) which are genetic disorders resulting from an enzyme defect in biochemical and metabolic pathways [12]. LIPT1 mutations cause mitochondrial diseases including the Leigh syndrome variants [13]. Mutations in α-LA metabolism are characterized by lactic acidosis, epilepsy, developmental delay, Leigh-like encephalopathy, and early death [14,15]. In contrast to LIAS or LIPT2 mutations, glycine cleavage is normal in most mutant LIPT1 patients and there are normal glycine serum levels [15]. This lack of glycine elevation suggests sparing of the GCS, consistent with the fact that this enzymatic complex does not depend on LIPT1 for lipoylation.
Currently, there is no treatment for LIPT1 deficiency in humans. In yeast, the depletion of LIPT1 ortholog lip3 showed a growth defect that could be rescued by α-LA supplementation, while human fibroblasts showed only a moderate increase in PDH activity but not in α-KGDH [16]. Genetic therapy has been proposed as inserting the bacterial ligase, LplA, into the mitochondria or the nuclear genome [14]. In fact, the E. coli lipoate ligase is known to modify human lipoylated enzymes [17]. However, there is still a long way to go until gene therapy is a reality for patient treatment.
2. Materials and Methods
2.1. Reagents
Anti-mitochondrially encoded Cytocrome C Oxidase Subunit II (mt-CO2) (ab79393), anti-voltage dependent anion channel (VDAC) (ab14734), anti-ATP-synthase F1 subunit 1 alpha (ATP5F1A) (ab14748), anti-NADH:Ubiquinone Oxidorreductase Subunit A9 (NDUFA9) (ab14713), anti-Activating Transcription Factor 5 (ATF5) (ab184923), anti-Lon peptidase 1 (Lonp1) (ab103809), anti-sirtuin 1 (SIRT1) (ab110304), anti-nuclear respiratory factor 2 (Nrf2) (ab62352), anti-peroxisome proliferator-activated receptor γ coactivator 1α (PGC1α) (ab191838), anti-manganese superoxide dismutase (MnSOD) (ab68155), anti-pyruvate dehydrogenase subunit E2 (PDH E2) (ab110332), anti-Cytochrome C Oxidase Subunit IV (Cox-IV) (ab14744), anti-acetyl lysine (ab190479), Goat anti-Rabbit IgG H&L (HRP) (ab6721), Rabbit anti-Mouse IgG H&L (HRP) (ab6728), Rabbit anti-Goat IgG H&L (HRP) (ab6741) and Native lysis Buffer (ab156035) were purchased from Abcam (Cambridge, UK).
Anti-nuclear respiratory factor 1 (Nrf1) (NBP1-778220) was purchased from Novus Biologicals (Móstoles, Madrid, Spain). Anti-actin (MBS448085) and anti-mitochondrially encoded NADH:ubiquinone oxidoreductase core subunit 6 (mt-ND6) (MBS8518686) were purchased from MyBioSource (San Diego, CA, USA). Anti-Ubiquinol Cytochrome C Core Protein 1 (UQCRC1) (459140), anti-Lipoyltransferase 1 (LIPT1) (PA5-57064), anti-heat shock protein 60 (hsp60) (MA3-012), anti-heat shock protein 70 (hsp70) (MA3-028), anti-sirtuin 3 (SIRT3) (PA5-13222), anti-translocase of the outer mitochondrial membrane 20 (TOMM20) (H00009804-M01), EX-527 (J64753.MA) and nicotinamide (A15970.30) were purchased from ThermoFisher Scientific (Waltham, MA, USA). Anti PGC-1α (4C1.3) and anti-Lipoic Acid (LA) (437695) were purchased from Merck Millipore (Burlington, Massachusetts, USA).
Anti-ketoglutarate dehydrogenase subunit E2 (KGDH E2) (26865S), anti-Activating Transcription Factor 4 (ATF4) (11815S) and anti-mitochondrial transcription factor A (TFAM) (7495S) were purchased from Cell Signaling (Danvers, MA, USA). Anti-phosphorylated-PGC1α (P-PGC1α) (AF6650) was purchased from R&D Systems (Minneapolis, MN, USA). Anti-Forkhead Box O3 (FOXO3A) (sc-48348), anti-LA (sc-101354), anti-Tau (sc-21796), D-galactose (sc-202564), Deferiprone (sc-211220), rotenone (sc-203342) paraformaldehyde (PFA) (sc-253236B), oligomycin (sc-203342), antimycin A (sc-202467A), Carbonyl cyanide 4-(trifluoromethoxy)phenylhydrazone (FCCP) (sc-203578), CPI-613 (sc-482709), thiamine (sc-205859), biotin (sc-20476) and HEPES (sc-29097) were purchased from Santa Cruz Biotechnology (Dallas, TX, USA).
Prussian Blue (03899), Sudan Black (199664), glutaraldehyde 25% Aqueous Solution (G5882), Luperox® DI, tert-butyl peroxide, (168521), α-LA (62320), α- Tocopherol/Vitamin E (T3251), DMSO (17093) and donkey serum (D9663) were purchased from Sigma-Aldrich (Saint Louis, MO, USA). Sodium pantothenate (17228) was purchased from Cayman Chemical (Ann Harbor, MI, USA). MitotrackerTM Red CMXRos (M46752), Bovine Serum Albumine (BSA) (BP9702-100), Hoescht (10150888) and 4′,6-diamidino-2-phenylindole (DAPI) were purchased from InvitrogenTM/Molecular Probes (Eugene, OR, USA). PBS (102309) was purchased from Intron Biotechnology (Seongnam, South Korea). 3-TYP (HY-108331) and SIRT7 inhibitor 97491 (HY-135899) were purchased from MedChemExpress (Sollentuna, Sweden).
2.2. Ethical Statements
Approval of the ethical committee of the Hospital Universitario Virgen Macarena y Virgen del Rocío in Sevilla (Spain) was obtained, according to the principles of the Declaration of Helsinki as well as the International Conferences on Harmonization and Good Clinical Practice Guidelines.
2.3. Fibroblasts Culture
Cultured fibroblasts were derived from a skin biopsy of one 7-year-old boy patient with the following compound heterozygous mutation in LIPT1 gene: c.212C>T (p.Ser71Phe) and c.292C>T (p.Arg98Trp) previously reported as pathogenic variants [13]. Control fibroblasts were human skin primary fibroblasts from two healthy volunteer donors. These control cells were sex and age-matched. Samples from the patient and controls were obtained according to the Helsinki Declarations of 1964, as revised in 2001. Fibroblasts derived from the patient and controls were cultured at 37°C and 5% CO2 in DMEM (Dulbecco’s Modified Eagle Medium) containing 4.5 g glucose/L, L-glutamine, and pyruvate supplemented with 1% antibiotic Pen-Strep solution (Sigma-Aldrich, Saint Louis, MO, USA) and 10-20% Fetal Bovine Serum (FBS) (GibcoTM, Waltham, MA, USA). All the experiments were performed with fibroblasts on a passage number lower than 8.
2.4. Drug Screening
Drug screening was performed in restrictive culture medium with galactose as the main carbon source. Our aim was to deprive cells from glycolysis as energy source (due to the use of galactose) and hence have them rely exclusively on the oxidative phosphorylation (OXPHOS) for ATP production [18,19]. In this cell culture conditions, mutant LIPT1 fibroblasts were unable to survive.
Galactose medium was prepared with DMEM without glucose and glutamine (InvitrogenTM/Molecular Probes, Eugene, OR, USA) supplemented with 10 mM D-galactose, 10 mM HEPES, 1% antibiotic Pen-Strep solution and 10% FBS. Cells were seeded in 24-well plates in DMEM glucose containing 1 g glucose/L. After 24 h cells were treated for 72 h with several compounds. Next, medium was removed, and cells were washed twice with PBS prior to the addition of the galactose medium. Then, the treatments were re-applied in the same concentration and images were taken in 24 h intervals for 72 h. Cell counting and representative images were obtained immediately (T0) and 72 h after the shift to galactose medium, using the BioTek™ Cytation™ 1 Cell Imaging Multi-Mode Reader (Biotek, Winooski, VT, USA). The proliferation ratio was obtained by dividing the number of cells at T72 by the number of cells at T0. Proliferation ratio values above 1 were considered as cell proliferation, while values below 1 were considered as cell death, and a value of 1 indicated cell survival. Compounds considered positive allowed the survival of mutant cells in galactose medium. Cell viability was confirmed by trypan blue dye exclusion.
The same screening was repeated using 3-TYP, a SIRT3 specific inhibitor. To ensure the specific inhibition of this SIRT3, the concentration selected was 50 nM, as this compound exhibits an IC50 (half-maximal inhibitory concentration) of 16 nM for SIRT3. The IC50 for SIRT1 and SIRT2 are 88 nM and 92 nM, respectively, requiring a higher concentration of 3-TYP to inhibit these sirtuins. The procedure is similar, cells are seeded in glucose medium and treated for 3 days. Then, glucose medium is replaced with galactose medium and when the treatment is renewed, we added 3-TYP for the last 72 h. The images were taken and analyzed as previous described.
2.5. Quantitative Real-Time PCR (qPCR)
The expression levels of LIPT1 gene were assessed by qPCR in untreated and treated mutant fibroblasts as well as in control cells, using mRNA extracts. Total RNA extraction was carried out using the RNeasy Mini Kit (74104, Qiagen, Venlo, The Netherlands). cDNA synthesis from 1 µg of RNA was performed by the iScript cDNA KIT (170-8891, BioRad, Hercules, CA, USA). Consequently, qPCR was conducted following standard procedures and the SYBR Green Protocol. LIPT1 primers: 5’-CTG AAT CTC GCT CTG TTG CC-3’ (FW) and 5’-TGG GAC CTG GCA GTT ACA AA-3’ (RV). Actin was used as a housekeeping control gene and the primers utilized were: 5′-AGAGCTACGAGCTGCCTGAC-3′ (FW) and 3′-AGCACTGTGTTGGCGTACAG-5′ (RV). Primer design was facilitated using the online tool Primer3 (https://primer3.ut.ee/).
2.6. Immunoblotting
Western blotting assay was performed using standard methods. After transferring the proteins to nitrocellulose membranes (1620115, Bio-Rad, Hercules, CA, USA), these were blocked in BSA 5% in TTBS (blocking solution) for 1 h and then incubated with primary antibodies, which were diluted in a proper dilution (1:500-1:1000) in the blocking solution overnight at 4ºC. Then, membranes were washed twice with TTBS and incubated with the corresponding secondary antibody coupled to horseradish peroxidase (1:2500 dilution in BSA 5%) for 1 h. Protein loading was checked for every membrane using Ponceau staining and actin protein levels. ChemiDoc™ MP Imaging System (BioRad, Hercules, CA, USA) was used to reveal protein signals. The results obtained were normalized to the mean expression levels of control cells and the actin protein.
If possible, when the molecular weight of new proteins of interest did not interfere, membranes were re-probed with different antibodies. In the case of proteins with a different molecular weight, membranes were cut and detected with different antibodies. Results were normalized to protein actin and were analyzed by ImageLab™ version 6.1. software (BioRad, Hercules, CA, USA).
2.7. Prussian Blue staining
Iron accumulation was determined by Perl’s Prussian Blue (PPB) staining in control and patient-derived fibroblasts and induced neurons [20] . Images were taken by light and fluorescence Axio Vert A1 microscope (Zeiss, Oberkochen, Germany) with a 20x objective and analyzed by Fiji-ImageJ version 2.9.0. software. Moreover, iron content was measured in cell culture extracts by inductively coupled plasma mass spectrometry (ICP-MS) [21]. ICP-MS was performed with an Agilent 7800 spectrometer (Agilent Technologies, Santa Clara, CA, USA). Cell extracts were obtained by acid digestion with HNO3.
2.8. Sudan Black staining
Lipofuscin accumulation was assessed by Sudan Black staining in control and patient-derived fibroblasts as previously described [22,23]. Images were taken by light and fluorescence Axio Vert A1 microscope (Zeiss, Oberkochen, Germany) with a 20x objective and analyzed by Fiji-ImageJ version 2.9.0. software.
2.9. TEM Analysis
The cells were seeded on 8-well Permanox chamber slides (Nunc, ThermoFisher Scientific, Waltham, MA, USA). They were washed three times with phosphate buffer (PB) 0.1 M and were subsequently fixed in tempered 3.5% glutaraldehyde in 0.1 M PB for 5 min at 37°C. Cells were postfixed in 2% OsO4 for 1 h at room temperature, rinsed, dehydrated and embedded in Durcupan resin (44611, Sigma-Aldrich (Saint Louis, MO, USA)). Later, ultra-thin (70 nm) sections of the cells were cut with a diamond knife and examined by a transmission electron microscope (FEI Tecnai G2 Spirit BioTwin) with Xarosa (20 Megapixel resolution) digital camera using Radius image acquisition software version 2.1. (EMSIS GmbH, Münster, Germany).
2.10. PDH and KGDH Activities
PDH and KGDH activities were assessed according to the protocols stablished by PDH Enzyme Activity Dipstick Assay Kit (ab109882) and α-ketoglutarate dehydrogenase Activity Assay Kit (ab185440). Signal intensity was acquired using the ChemidocTM MP Imaging System and analyzed using ImageLabTM version 6.1. software.
2.11. Immunofluorescence Microscopy
Cells were seeded on 1 mm width glass coverslips (631-1331, Menzel-Gläser, ThermoFisher Scientific, Waltham, MA, USA) for 72 h in DMEM Glucose medium with/without the addition of CocT. Then, they were washed twice with PBS 1X and fixed in 4% PFA for 10 min at room temperature. Cells were incubated in blocking buffer (BSA 1% in PBS) for 30 min and permeabilized with 0.1% saponin in blocking buffer for 15 min. In the meantime, primary antibodies were diluted 1:100 in antibody buffer (BSA 0.5% and saponin 0.1% in PBS) and then incubated overnight at 4°C. Following primary antibodies incubation, cells were washed twice with PBS 1X, and secondary antibodies were similarly diluted 1:400 in antibody buffer. Their incubation time on cells was reduced to 2 h at room temperature. Subsequently, after two washes with PBS 1X, they were incubated for 5 min with 1 µg/mL of DAPI (diluted in PBS) and washed again with PBS 1X. Finally, coverslips were mounted on microscope slides using 10 µL of Mowiol.
Samples were analyzed using an upright fluorescence microscope (Leica mDMRE, Leica Microsystems GmbH, Wetzlar, Germany). Images were taken using a DeltaVision system (Applied Precision; Issaquah, WA, USA) with an Olympus IX-71 microscope using a 40x objective. They were analyzed using the softWoRx and Fiji-ImageJ version 2.9.0. software. The microscope settings were consistently maintained across each experiment.
2.12. Measurement of Membrane Potential
The measurement of mitochondrial membrane potential was conducted using MitotrackerTM Red CMXRos, a fluorescent dye sensitive to mitochondrial membrane potential. Untreated and treated cells were seeded on 1 mm glass coverslips in DMEM Glucose medium for three days. Subsequently, cells were stained with 100 nM MitotrackerTM Red CMXRos for 45 min at 37°C before fixation. Once cells were stained, we proceeded with two washes with PBS 1X, and they were fixed with 4% PFA for 10 min. Then, we incubated the cells with 1 µg/mL of DAPI for 10 min. Finally, after 5 washes with PBS 1X, we mounted the coverslips on microscope slides with 10 µL of Mowiol. Images were obtained using a DeltaVision system (Applied Precision; Issaqua, WA, USA) with an Olympus IX-71 fluorescent microscope with a 40x objective and they were analyzed using Fiji-ImageJ version 2.9.0. software. The mitochondrial membrane potential was calculated based on fluorescence intensity. The microscope settings were consistently maintained in each experiment.
2.13. Bioenergetics
Mitochondrial respiratory function of control and mutant fibroblasts was measured using a mitostress test assay with an XFe24 extracellular flux analyzer (Seahorse Bioscience, Billerica, MA, USA, 102340-100) according to the manufacturer’s instructions. Cells were seeded at a density of 1.5x10⁴ cells/well with 250 µL DMEM Glucose medium in XF24 cell culture plates and incubated for 24 h at 37°C, 5% CO2. Subsequently, growth medium was removed from the wells, leaving on them only 50 µL medium. Then, cells were washed twice with 500 µL of pre-warmed assay XF base medium (102353-100) supplemented with 10 mM D-glucose, 1 mM L-glutamine and 1 mM sodium pyruvate; pH 7.4) and eventually 450 µL of assay XF medium (final volume 500 µL) were added. Cells were incubated at 37°C without CO2 for 1 h to allow pre-equilibrating with the assay medium.
Mitochondrial functionality was evaluated by sequential injection of four compounds affecting bioenergetics. The final concentrations of the injected reagents were: 1 µM oligomycin, 2 µM FCCP, 1 and 2.5 µM rotenone/antimycin A. The best concentration of each inhibitor and uncoupler, as well as the optimal cells seeding density were determined in preliminary analyses. A minimum of five wells per treatment were used in any given experiment. The studied parameters were the following: 1) Basal respiration: Oxygen consumption used to meet cellular ATP demand resulting from mitochondrial proton leak. Shows energetic demand of the cell under baseline conditions. 2) ATP Production: The decrease in oxygen consumption rate upon injection of the ATP synthase inhibitor oligomycin represents the portion of basal respiration that was being used to drive ATP production. Shows ATP produced by the mitochondria that contributes to meeting the energetic needs of the cell. 3) Maximal respiration: The maximal oxygen consumption rate attained by adding the uncoupler FCCP. FCCP mimics a physiological “energy demand” by stimulating the mitochondrial respiratory chain to operate at maximum capacity to meet this metabolic challenge. Shows the maximum rate of respiration that the cell can achieve. 4) Spare respiratory capacity: This measurement indicates the capability of the cell to respond to an energetic demand as well as how closely the cell is to respire to its theoretical maximum.
2.14. Mitochondrial Complexes Activity
The activity of mitochondrial Complex I and complex IV were performed according to the manufacturer’s instructions of the Complex I (ab109720) and Complex IV (ab109876) Enzyme Activity Dipstick Assay Kit, starting from cellular pellets. Signal intensity was acquired using the ChemidocTM MP Imaging System and analyzed using ImageLabTM version 6.1. software.
2.15. SIRT3 Activity
Mitochondrial isolation was conducted using the Mitochondrial Isolation Kit for Cultured Cells (ab110170) (Abcam, Hercules, CA, USA). Then, SIRT3 activity was determined by the SIRT3 Activity Assay Kit (Fluorometric) (ab156067) in the mitochondrial fraction. Fluorescence was measured using a POLARstar Omega plate reader (BMG Labtech, Offenburg, Germany).
2.16. NAD+/NADH Levels
NAD+/NADH levels in cellular pellets were assessed by the NAD+/NADH Colorimetric Assay Kit (ab65348) protocol. The colour intensity was measured using a POLARstar Omega plate reader.
2.17. Immunoprecipitation
Immunoprecipitation assay was performed using PierceTM Protein A Magnetic Beads (88845, ThermoFisher Scientific, Waltham, MA, USA) and a 16-Tube SureBeadsTM Magnetic Rack (#1614916, BioRad, Hercules, CA, USA).
2.18. Cell Transfection with Human LIPT1 Plasmid
The FLAG-tagged human LIPT1 plasmid (BC007001) was purchased from Sino Biological Inc. (Eschborn, Germany). Anti-DYKDDDDK tag antibody (A00187) was purchased from GenScripts (Piscataway, NJ, USA). Plasmid transfection was performed following the manufacturer’s instructions. Lipofectamine® 2000 was purchased from ThermoFisher Scientific (Waltham, MA, USA).
2.19. Measurement of Cell Membrane and Mitochondrial Membrane Lipid Peroxidation
Lipid peroxidation was evaluated using 4,4-difluoro-5-(4-phenyl- 1,3-butadienyl)-4-bora-3a,4a-diaza-s-indacene-3-undecanoic acid (BODIPY® 581/591 C11) (ThermoFisher Scientific), a lipophilic fluorescent dye [24,25]. Cells were incubated with 5 μM BODIPY® 581/591 C11 for 30 min at 37°C. 500 μM Luperox® for 15 min were used as positive control of lipid peroxidation. Nuclei were stained with 1 μg/mL DAPI. Lipid peroxidation in fibroblasts was evaluated using light and fluorescence Axio Vert A1 microscope with a 20x objective. Images were analyzed with Fiji-ImageJ version 2.9.0. software.
Mitochondrial lipid peroxidation was evaluated using [3-(4-phenoxyphenylpyrenylphosphino) propyl] triphenylphosphonium iodide fluorescent probe (MitoPeDPP®) developed by Shioji K., et al. [26]. Fibroblasts were treated with 300 nM MitoPeDPP® and 100 nM MitoTracker™ Red CMXRos, an in vivo mitochondrial membrane potential-dependent probe. Nuclei were stained with 1 μg/mL DAPI. Positive control of peroxidation was induced using 500 μM Luperox® for 15 min. Images were taken in vivo at DeltaVision system with an Olympus IX-71 fluorescence microscope with 60x oil objective and analyzed by Fiji-ImageJ version 2.9.0. software.
2.20. Direct Reprogramming
Neurons were generated from mutant and control fibroblasts by direct neuronal reprogramming as previously described by Drouin-Ouellet et al. [27,28]. Controls and mutant LIPT1 patient-derived fibroblasts were plated on μ-Slide 4-Well Ibidi plates (Ibidi) and cultured in DMEM Glutamax medium (10566016, ThermoFisher Scientific, Waltham, MA, USA)) with 1% Pen-Strep solution and 10% FBS.
The day after, dermal fibroblasts were transduced with one-single lentiviral vector containing neural lineage-specific transcription factors (Achaete-Scute Family BHLH Transcription Factor 1 (ASCL1), and POU class 3 homeobox 2 (BRN2)) and two shRNA against the REST complex, which were generated as previously described with a non-regulated ubiquitous phosphoglycerate kinase (PGK) promoter [29]. The plasmid was a gift from Dr. Malin Parmar (Developmental and Regenerative Neurobiology, Lund University, Sweden). Transduction was performed at a multiplicity of infection (MOI) of 30. On the following day cell culture medium was switched to fresh DMEM Glucose medium and after 48h to early neuronal differentiation medium (NDiff227) (Y40002); Takara-Clontech, Kusatsu, Japan) supplemented with neural growth factors and small molecules at the following concentrations: LM-22A4 (2 μM), GDNF (2 ng/mL), NT3 (10 ng/mL), dibutyryl cyclic AMP (db-cAMP, 0.5 mM), CHIR99021 (2 μM), SB-431542 (10 μM), noggin (50 ng/mL), LDN-193189 (0.5 M) and valproic acid (VPA, 1 mM). Half of the neuronal differentiation medium was refreshed every 2-3 days. Eighteen days post-infection, the medium was replaced by late neuronal differentiation medium supplemented with only growth factors until the end of the cellular conversion. At day 21, cells were treated with CocT and the medium was changed every 2-3 days for 10 more days. Neuronal cells were identified by the expression of Tau protein. Nuclei were stained with DAPI. DAPI+/Tau+ cells were considered induced neurons (iNs). Conversion efficiency was calculated as the number of Tau+ cells over the total number of fibroblasts seeded for conversion. Neuronal purity was calculated as the number of Tau+ cells over the total cells in the plate after reprogramming.
2.21. Statistical Analysis
We used non-parametric statistics, where there were few events (n<30), that do not have any distributional assumption, given the low reliability of normality testing for small sample sizes used in this work. In these cases, non-parametric methods such as Mann-Whitney were utilized in comparisons between two groups, while multiple groups were compared using a Kruskal–Wallis test. When the number of events were greater (n>30), parametric methods were performed, specifically one-way ANOVA, comparing statistical differences between more than two groups. All results are expressed as mean±SD of 3 independent experiments and a p-value < 0.05 was considered as statistically significant. Statistical analyses were made with GraphPad Prism 9.4.1. (GraphPad Software, San Diego, CA USA).
4. Results.
4.1. LIPT1 Mutation Causes Deficiency Of Lipoylation Of Pdh And Kgdh E2 Subunits, Impaired 2-Ketoacid Dehydrogenase Enzymes Activities And Iron Accumulation In Mutant Fibroblasts
First, we examined the pathological alterations of LIPT1 mutation on patient-derived fibroblasts. Western blot assay was performed to verify the expression levels of affected proteins including the mutated protein LIPT1 itself, mitochondrial lipoylated proteins and the E2 subunits of multienzyme complexes PDH and KGDH (Figure 1A,B). Although LIPT1 and PDH E2 and KGDH E2 subunits expression levels were only mildly decreased, their lipoylation was almost absent in patient’s fibroblasts in comparison to control cells (Figure 1A,B).
Next, PDH activity was determined by a dipstick assay. As expected, no PDH activity was observed in mutant cells in comparison to control fibroblasts (Figure 1C,D). We also tested KGDH complex activity by a colorimetric assay. Results showed a significant reduction of KGDH activity in mutant cells (Figure 1E).
On the other hand, as previous reports have highlighted the connections of LIPT1 deficiency and iron-sulfur proteins biosynthesis, which are involved in the metabolism of iron in mitochondria [30] and LA metabolism [31], we assessed intracellular iron accumulation by Prussian Blue staining. Mutant LIPT1 cells showed marked iron accumulation compared to control cells (Figure 2A,B). Patient’s fibroblasts were treated for 24 h with Deferiprone, an iron-chelating drug, to confirm the specificity of the Prussian Blue staining. Furthermore, iron overload in mutant LIPT1 fibroblasts was confirmed by ICP-MS (Figure 2C). As iron can be accumulated in lipofuscin granules, the accumulation of this pigment was analyzed by Sudan Black staining. Patient’s fibroblasts showed a significant increase of Sudan Black staining in comparison to control cells, indicating lipofuscin accumulation (Figure 2D,E).
4.2. Pharmacological Screening in Galactose Medium
Next, as LIPT1 is an important enzyme involved in the correct functioning of mitochondria [32] and previous works have shown that mutant LIPT1 fibroblasts were unable to grow in low-FBS galactose medium [14], we performed a pharmacological screening testing several compounds. Indeed, cultured mutant fibroblasts in galactose medium lost their elongated shape, detached from the flask surface, and eventually died. This latter finding provide an excellent screening tool for the identification of pharmacological compounds capable of increasing cell viability and therefore, with potential therapeutic interest.
Control and mutant cells were cultured for 3 days on DMEM Glucose medium untreated and treated with different mitochondrial cofactors and active compounds to identify corrective supplements. Then, the medium was replaced by nutritional stress medium with galactose and treatments were refreshed. The tested compounds were: 1) Biotin, a coenzyme necessary for the decarboxylation of enzymes associated with gluconeogenesis and fatty acid oxidation [33]; 2) Sodium pantothenate, required for the biosynthesis of coenzyme A which is essential for KGDH and PDH complexes activity as well as fatty acid oxidation and many metabolic pathways [34]; 3) Nicotinamide, a NAD+ precursor that also acts as a cofactor of sirtuins protein family [35]; 4) Vitamin E, a membrane antioxidant and redox modulator [36]; 5) Thiamine, an essential cofactor for oxidative decarboxylation of multienzyme BCKDH complexes of the Krebs cycle [37]; and 6) α-LA, which, although cannot be used directly for the lipoylation of mitochondrial enzymes, acts as a potent antioxidant [38]. In addition, we tested the combination of all these compounds (CocT): 5 μM biotin , 10 μM nicotinamide , 10 μM α-LA, 10 μM vitamin E , 10 μM thiamine and 4 μM sodium pantothenate.
Control cells experienced no changes in growth rate in glucose medium and after the switch to galactose medium, as we expected. On the contrary, mutant cells did not survive in restrictive growth medium after 72 h. Then, we tried the supplementation with α-LA, but mutant fibroblasts were not able to grow in stress medium. Surprisingly, mutant LIPT1 cells treated with a cocktail containing the combination of all the compounds (CocT) survived in galactose medium (Figure 3).
To confirm the beneficial effect of the cocktail, all the compounds were tested individually. Results showed that individual supplementations did not recover the survival of mutant cells (Figure S2).
In addition, control cells were treated with 6,8-Bis (benzylthiol)-octanoic acid (CPI-613) at 100 μM, a PDH inhibitor, to partially mimic the effects of LIPT1 mutations (Figure S5). In glucose, almost no differences were seen in control versus treated cells. However, control cells treated with CPI-613 did not survive in galactose medium. Interestingly, the effect of the inhibitor was partially reverted by the addition of CocT.
4.3. The supplementation with CocT increases LIPT1 Transcript Levels And Corrects Mutant Fibroblasts Pathophysiology.
The pharmacological screening in galactose medium identified a positive cocktail based on the combination of different well-known antioxidants and mitochondrial cofactors. The increased survival ratio in mutant LIPT1 treated fibroblasts is likely due to a correction of metabolic alterations in mutant cells. For this reason, pathophysiological characterization assays were performed in untreated and treated control and mutant cells. In first instance, we analyzed the transcript levels of LIPT1 in both control and mutant fibroblasts, untreated and treated with CocT. We performed a qPCR assay and we observed that LIPT1 transcript levels are downregulated in patient’s cells in comparison to control cells. Interestingly, CocT supplementation induced a marked increase in LIPT1 transcript levels (Figure 4).
Then, we evaluated the effect of CocT treatment on the expression levels of affected proteins including the mutant protein LIPT1 itself, mitochondrial lipoylated proteins and the E2 subunits of multienzyme complexes PDH and KGDH. Surprisingly, CocT supplementation induced a significant increased in all of them (Figure 5A,B). Consequently, CocT treatment also restored PDH and KGDH activities in mutant LIPT1 cells (Figure 5C,D,E).
Next, we examined the effect of CocT supplementation on iron overload in mutant cells. Interestingly, iron accumulation, determined by Prussian Blue staining and mass spectrometry, was notably reduced in mutant cells after CocT treatment, (Figure 6A,C,D). In the same way, lipofuscin accumulation, addressed by Sudan Black staining, was significantly decreased by CocT supplementation (Figure 6B,E).
To confirm the present of lipofuscin in fibroblasts and the positive effect of CocT supplementation, an electron microscopy analysis was performed in control and mutant cells. We observed an accumulation of intracellular lipofuscin-like granules in mutant LIPT1 cells, which was significantly reduced after CocT supplementation (Figure 7A,B).
Then, an immunofluorescence assay was performed to confirm the effect of CocT on protein lipoylation in mutant LIPT1 cells (Figure 8). As expected, we observed a notably reduction of lipoic acid fluorescent intensity in mutant cells in comparison to control cells. (Figure 8A). Interestingly, the supplementation of CocT induced a significant increase of lipoic acid fluorescence intensity in mutant fibroblasts. Besides, as we used the Translocase of Outer Mitochondrial Membrane (TOMM20) as a mitochondrial marker, we confirmed the colocalization of protein lipoylation in mitochondria (Figure 8A,B,C).
To confirm the role of LIPT1 in iron metabolism and protein lipoylation, we next performed cDNA complementation assays, in which we introduced a FLAG-tagged human LIPT1 cDNA into control and mutant fibroblasts. Immunofluorescence analysis using an anti-lipoic and anti-FLAG antibody showed that mutant cells expressed low levels of protein lipoylation and no FLAG signal was detected. However, patient cells expressing recombinant LIPT1 (rLIPT1) had higher protein lipoylation and FLAG signals (Figure S7A, S7B and S7C). Both signals showed high colocalization with a Pearson's correlation coefficient > 0.90. We then measured iron overload by Prussian Blue staining (Figure S8). Expression of recombinant LIPT1 significantly eliminated iron accumulation in mutant cells (Figure S8A and S8B). Thus, these data demonstrate a direct link between the expression of LIPT1 and protein lipoylation and iron overload.
4.4. CocT Supplementation Increases Mitochondrial Proteins Expression Levels And Improves Mitochondrial Bioenergetics Of Mutant LIPT1 Cells
Due to the essential role of LIPT1 and protein lipoylation in mitochondrial function, we then examined the expression levels of mitochondrial proteins and mitochondrial bioenergetics in control and mutant cells with and without the supplementation of CocT. First, several subunits that take part in the mitochondrial electron transport chain (mtETC), codified by the nuclear DNA (nDNA) or mitochondrial DNA (mtDNA), were analyzed by Western blot (Figure 9A and 9B). Complex I subunit NDUFA9, complex III subunit UQCRC1 and complex IV subunits (Cox IV and mt-CO2) protein expression levels were markedly reduced in mutant cells LIPT1 cells. However, the protein expression levels of mt-ND6 (complex I), ATP5F1A (complex V), and VDAC, used as a mitochondrial mass marker, remain without significant changes in control and mutant LIPT1 cells. Interestingly, the expression levels of mitochondrial proteins that were downregulated in mutant fibroblasts were significantly restored by CocT supplementation.
Subsequently, to assess the bioenergetic profile of mutant fibroblasts and evaluate the effect of CocT on bioenergetic parameters, a Mitostress SeaHorse assay was performed (Figure 10). Mutant LIPT1 cells showed a marked reduction in all bioenergetic parameters (Basal Respiration, Maximal Respiration, ATP Production, and Spare Respiratory Capacity) compared to control cells. Curiously, CocT supplementation induced a significant improvement in mutant LIPT1 cells.
To corroborate mitochondrial function improvement, complex I and complex IV activities were measured by a dipstick assay (Figure 11A,B). Both complexes’ activities were reduced in mutant fibroblasts in comparison to control cells. Interestingly, CocT treatment restored both complex I and complex IV activities.
As mitochondrial dysfunction is associated with Reactive Oxygen Species (ROS) overproduction which induce cell membrane damage, lipid peroxidation of mitochondrial (Figure S9) and cell membranes (Figure S10) were examined. High levels of lipid peroxidation in mitochondrial and cell membranes were observed in mutant cells. As expected, peroxidation levels in cell and mitochondrial membranes were significantly reduced after CocT treatment.
4.5. Supplementation with CocT Activates The Mitochondrial Unfolded Protein Response (mtUPR) and Mitochondrial Biogenesis
Next, we evaluated whether the beneficial effect of CocT was mediated by the activation of mtUPR, a well-known mitochondrial compensatory pathway. Although, mtUPR was first described as a transcriptional response resulting in an increase in chaperones expression to protect cells from the accumulation of misfolded or unfolded proteins [40], two more axes were described [41]. We focused on two axes. The first one is known as transcriptional canonical axis of mtUPR, which induces the expression of mitochondrial chaperones and proteases. We observed a reduction in the expression levels of ATF4, ATF5, Hsp60, Hsp70 and Lonp1 in patient’s cells, which were notably upregulated after CocT supplementation (Figure 12A,B).
Subsequently, we studied the second axis, known as SIRT3 mtUPR, and we examined the expression levels of SIRT3, which activation promotes the expression of downstream antioxidant enzymes proteins such as SOD2 (MnSOD) or catalase through the deacetylation and activation of the transcription factor FOXO3A [42]. We observed that the expression levels of SIRT3, FOXO3A and MnSOD were downregulated in patient’s fibroblasts, and they were significantly increased after CocT treatment (Figure 13A,B).
In addition, we assessed the expression levels of proteins involved in mitochondrial biogenesis. The expression levels of all the analyzed proteins, SIRT1, PGC1a, NFR1, NFr2 and TFAM were downregulated, and CocT supplementation was able to partially restore protein expression levels (Figure 14A,B).
To explore the molecular mechanism involved in the beneficial effect of CocT supplementation, we assessed its effect on SIRT3 activity. Due to it is the predominant sirtuin within mitochondria, we decided to isolate the mitochondrial fraction from cell extracts using a cell fractioning protocol (Figure S11). SIRT3 activity was determined in the mitochondrial fraction and results showed that SIRT3 activity was partially reduced in mutant cells. After CocT supplementation, SIRT3 activity was significantly increased, even in control cells, so it seems that the treatment is activating it (Figure 15).
The purity of mitochondrial fraction was confirmed by using protein markers of nuclear (phosphorylated-Histone HA2X), cytoplasmatic (tubulin) and mitochondrial (VDAC) fractions (Figure S11).
For deacetylation reactions, sirtuins needs NAD+ as a cofactor to remove the acetyl group from their different substrates. Moreover, it is well-known that an imbalance between NADH and NAD+ can promote an impairment in cell metabolism and limits the usage of NAD+ by sirtuins [43]. For this reason, NADH, NAD+, and NAD total (NADt) levels, as well as NADH/NAD+ ratio were determined (Figure 16). NAD+ levels (Figure 16A), NADH levels (Figure 16B), NADt levels (Figure 16C), and NAD+/NADH ratio (Figure 16D) were markedly downregulated in mutant fibroblasts. After CocT supplementation, mutant fibroblasts significantly recovered NAD+, NADt, and NADH levels as well as NAD+/NADH ratio (Figure 16).
4.6. 3-TYP, a Specific SIRT3 Inhibitor, Blocks The Effect of CocT
Next, to confirm the effect of CocT on SIRT3 activation, we used 3-TYP, a selective inhibitor of SIRT3. Thus, we examined the effect of 3-TYP on the screening assay with galactose medium. As we expected, 3-TYP had no negative consequences on control fibroblasts, neither glucose nor galactose medium after 72 h. Nevertheless, mutant fibroblasts did not survive in the presence of 3-TYP after 72 h in galactose medium, even under CocT treatment (Figure 17), suggesting that SIRT3 inhibition avoids the positive effect of CocT supplementation.
4.7. Induced Neurons
Patient-derived fibroblasts as cellular models provided a useful information on the pathophysiology of this disease. However, the most affected cell types in most metabolic mitochondrial pathologies are those with high energy requirements, such as muscle cells and neurons [44,45]. Therefore, direct reprogramming of patient-derived fibroblasts into induced neurons (iNs) is an extremely valuable tool to understand the pathogenesis of these disorders. For this reason, control and mutant fibroblasts were direct reprogrammed to iNs (Figure S14). Reprogrammed cells presented a typical neuron-like morphology and positive immunoreactivity against Tau, a microtubule-associated protein primarily found in neuronal axons of vertebrates' brain. In contrast, unprogrammed cells did not show Tau staining.
Tau+ cells were used to calculate neuronal conversion efficiency (Tau+ cells over the total number of fibroblasts seeded for conversion), which was around 22% in control cells (20.3% ± 1.4%) and 20% (19.2% ± 2.2%) in mutant LIPT1 cells. Neuronal purity (Tau+ cells over the total cells in the plate after reprogramming) was around 95% (93.6% ± 3.2%) in control cells and up to 86% (85.1% ± 1.6%) in mutant LIPT1 cells (Figure S14).
Then, efficacy of CocT treatment was evaluated in control and mutant LIPT1 iNs. Overall, lipoylation of proteins was studied with an immunofluorescence assay. (Figure 18). Additionally, mitochondrial network was assessed by MitoTrackerTM Red CMXRos. In mutant LIPT1 iNs, lipoylation was almost totally absent. CocT supplementation partially reverted the lipoylation levels on mutant LIPT1 iNs as previously seen in fibroblasts.
To continue to study the physiopathology on the iNs, we evaluated intracellular iron accumulation (Figure 19). As we had seen in fibroblasts, mutant iNs accumulated iron significantly, and the supplementation of CocT reduced the iron overload to the levels of control iNs.
5. Discussion
In this article, we examined the pathophysiological alterations in cellular models derived from a mutant LIPT1 patient. To address the pathological consequences of the mutation, we evaluated mitochondrial proteins expression levels and mitochondrial function. Mutant cells showed reduced expression levels of LIPT1 enzyme and mitochondrial lipoylated proteins, associated with impaired mitochondrial function and iron accumulation as well as reduced mitochondrial membrane potential and increased oxidative stress and lipid peroxidation. Interestingly, the supplementation with α-LA, nicotinamide, sodium pantothenate, vitamin E, thiamine and biotin in a cocktail (CocT) during seven days was able to correct the main pathological alterations. This cocktail enabled mutant LIPT1 cells to survive in stress medium and significantly corrected protein lipoylation, TCA enzymes activity and consequently mitochondrial function.
α-LA is an essential cofactor for mitochondrial metabolism whose exogenous supplementation is not able to lipoylate mitochondrial proteins in humans [46]. Thus, α-LA must be synthesized de novo within mitochondria using intermediates from mitochondrial fatty-acid synthesis, S-adenosylmethionine and iron-sulfur clusters [47]. Therefore, any mutation affecting α-LA biosynthetic pathway is responsible for severe metabolic and mitochondrial alterations [13,48]. LIPT1 enzyme is involved in the protein lipoylation of essential mitochondrial enzymes such as 2-ketoacid dehydrogenase complexes (mainly PDH and KGDH). Consequently, mutant LIPT1 patient-derived fibroblasts showed a marked reduction in PDH and KGDH lipoylation (Figure 1A) as well as a pronounced decrease of PDH (Figure 1D) and KGDH (Figure 1E) activities. Both enzymes are essential for TCA cycle functioning and consequently for mitochondrial energy production.
Another pathological consequence of mitochondrial lipoylation deficiency in mutant cells was intracellular iron accumulation. It has been reported that mutations causing impairment of PDH E2 subunit, lead to PDH activity deficiency and cause a type of Leigh disease, in which neuroradiographic abnormalities indicating iron accumulation were observed, specifically in the globus pallidus [49,50,51]. The symptoms, signs, and MRI characteristics of PDH E2 deficiency can be similar to pantothenate kinase associated neurodegeneration (PKAN), a subtype of neurodegeneration with brain iron accumulation (NBIA) disorders. Interestingly, mutant LIPT1 fibroblasts showed intracellular iron accumulation (Figure 2A) in a similar extent of PKAN cellular models [52,53]. The clinical and neuroradiographic overlapping features of PKAN and PDH E2 deficiency as well as CoA synthase protein-associated neurodegeneration (CoPAN), and Mitochondrial Enoyl CoA Reductase protein-associated neurodegeneration (MePAN), suggest a common element in their pathogeneses [54].
Although, the mechanism underlying intracellular iron accumulation in LIPT1 mutations is unknown, it has been demonstrated that α-LA is implicated in iron metabolism [55] and mitochondrial iron-sulfur clusters biosynthesis [32]. Moreover, a Sudan Black staining assay was performed to see if iron overload leads to lipofuscin accumulation. Lipofuscin is an autofluorescent pigment that accumulates in cells through aging [56,57] and the accumulation of dysfunctional mitochondria might be responsible for lipofuscinogenesis [58,59]. Corroborating this hypothesis, mutant fibroblasts presented a significant increase in lipofuscin granules (Figure 2E, Figure 7).
Next, with the objective of identifying potential therapeutic approaches for this severe disease, we developed a cellular screening assay based on the capability of cells to survive in galactose medium. Mutant LIPT1 fibroblasts manifested a profound mitochondrial dysfunction and were unable to survive in restrictive galactose medium. Next, several compounds identified on previous studies were evaluated [60,61], including α-LA supplementation (Figure 3, Figure S1, Figure S2, Figure S3, Figure S4). Nevertheless, none of them individually improved cell survival under stress conditions. The lack of an independent salvage pathway in humans, such as an exogenous α-LA integration to lipoylation, abrogates the use of α-LA supplementation as a direct therapeutic option in α-LA biosynthesis and protein transfer related mutations [6]. However, α-LA is a pleiotropic molecule with several functions in the organism and has been used as a therapeutic agent for cardiovascular diseases, hypertension, and diabetes [62,63]. In addition, α-LA treatment has been reported to provide neuroprotection against Parkinson disease [64], aging [65], and memory loss [66] because it can penetrate the blood-brain barrier, although the associated mechanisms remain unclear. Furthermore, α-LA is considered a chelator and therefore can reduce iron in cells and tissues [67,68]. Recently, our group has demonstrated the beneficial effect of α-LA supplementation on cellular models of PKAN [39].
Given that individually the compounds had no positive effect, we then combined all of them in a cocktail (CocT) which contained 5 μM biotin, 10 μM nicotinamide, 10 μM α-LA, 10 μM vitamin E, 10 μM thiamine and 4 μM sodium pantothenate. Surprisingly, mutant fibroblasts survived in stress galactose medium after supplementation with CocT (Figure 3, Figure S1).
Our next step was to assess whether the survival of mutant cells in stress medium was associated with the correction of mitochondrial function and cell bioenergetics. To this purpose, we examined protein expression levels (Figure 5A), PDH and KGDH activity (Figure 5D,E), iron accumulation (Figure 6A,B), lipoylation levels (Figure 8), mtETC proteins expression levels (Figure 9) and mitochondrial bioenergetics (Figure 10), and lipid peroxidation (Figure S9, Figure S10) after the supplementation of CocT. All pathological alterations in mutant cells were significantly restored. The positive effect of CocT supplementation was also confirmed on iNs obtained by direct reprogramming. Our results showed that CocT treatment increased protein lipoylation levels (Figure 18) and reduced iron overload in mutant LIPT1 iNs (Figure 19).
Then, we addressed the mechanisms underlying the positive effect of CocT by exploring the activation of sirtuins and therefore their participation on the mtUPR and improving mitochondrial function.
Sirtuins (SIRTs), or NAD+-dependent histone deacetylases, are proteins whose deacetylase activity affects the acetylation status of many proteins in the mitochondrial proteome [69]. Moreover, they participate in the regulation of important metabolic pathways in prokaryotes and eukaryotes, such as cell survival, senescence, proliferation, apoptosis, DNA repair, cell metabolism, and caloric restriction [70]. In mammalian cells, there are seven homologs (SIRT1-7) that are distributed in nucleus (SIRT1, SIRT6 and SIRT7), cytoplasm (SIRT2) and mitochondria (SIRT3, SIRT4 and SIRT5). Reduced sirtuin activity could be a major factor in type 2 diabetes [71], insulin resistance [72], aging [73], cardiopathies [74], mitochondrial diseases [75], neurodegeneration [76], and even antimycobacterial defenses [77]. Although exogenous α-LA cannot be incorporated for protein lipoylation, there is evidence that α-LA supplementation promotes SIRTs activation. Thus, Chen W. et al. demonstrated that α-LA supplementation increased SIRT1 activation and NAD+/NADH ratio (41). They also observed that α-LA upregulated fatty acid β-oxidation and promoted lipid catabolism through the SIRT1/AMPK signaling pathway.
Sirtuins function is highly correlated with NAD+, the concentration of nicotinamide, and the activity of nicotinamide phosphoribosyltransferase (NAMPT), which participates in the NAD+ biosynthesis. Indeed, research has demonstrated that deficiencies in preserving NAD+ levels and the corresponding decrease in sirtuin activity could potentially contribute to the normal aging process [78]. While the use of NAD+ precursors, like nicotinamide, has been suggested as a possible complementary agent in numerous treatments, it is unclear if the decline in NAD+ could be the cause of the reduced activity of sirtuins [73] or whether, regardless of NAD+ concentration, sirtuin expression is reduced with age and disease [79]. The decrease in NAD+ may be attributed to impairments in NAMPT-mediated NAD+ biosynthesis and PARP-mediated NAD+ depletion, which are known pathological processes in aging and potentially in neurodegenerative and mitochondrial disorders [80].
In this study, we found that SIRT3 activity (Figure 15) and NAD+/NADH ratio (Figure 16) were impaired in mutant LIPT1 cells. Interestingly, after CocT treatment, both parameters were significantly increased. Previous studies of our group [61] and other authors [81,82] showed that SIRT3 activation, in combination with mitochondrial cofactors could boost antioxidant mechanisms, regulate mitochondrial protein quality control, and adapt the OXPHOS system to compensate the pathological consequences of mitochondrial mutations.
SIRT3 is one of the most important deacetylases in mitochondria, and it plays an important role in regulating mitochondrial function [83,84]. For instance, SIRT3's deacetylation of the PDH complex enables pyruvate to take part in the Krebs cycle and speeds up the absorption of glucose by triggering protein kinase B (Akt) [85,86]. Additionally, by deacetylating acetyl-CoA synthetase 2 (AceCS2) and long-chain acyl-CoA dehydrogenase (LCAD), SIRT3 guarantees the normalization of fatty acid β-oxidation. [87,88,89]. Furthermore, through the deacetylation of 3-hydroxy-3-methylglutaryl-CoA synthetase (HMGCS2), it contributes to the formation of ketone bodies [87,90]. Additionally, SIRT3's deacetylation of glutamate dehydrogenase (GDH) induces the utilization of amino acids [91]. Furthermore, ornithine carbamoyltransferase (OTC), a crucial urea cycle enzyme, is a substrate of SIRT3 [92]. Additionally, by deacetylating isocitrate dehydrogenase (IDH) and succinate dehydrogenase (SDH), SIRT3 contributes significantly to the normal progression of the tricarboxylic acid cycle (TCA) [93,94]. Moreover, the deacetylation of multiple complex I–V subunits within the mitochondrial electron transport chain (mtETC) suggests that this enzyme plays a crucial role in mitochondrial fuction [95,96,97]. By activating numerous antioxidant factors, such as FOXO3A, IDH2, and SOD2, SIRT3 also reduces or delays the damage caused by oxidative stress [98,99,100], thus improving mitochondrial dysfunction and recovering mitochondrial fitness [101].
In addition, sirtuins activation may induce mitochondrial biogenesis via promoting PGC-1α expression by SIRT3 and PGC-1α deacetylation by SIRT1 [102]. Recent studies have also shown that SIRT3 has a role in mitochondrial quality control, including refolding or degradation of misfolded/unfolded proteins, mitochondrial dynamics, mitophagy, and mitochondrial biogenesis [84].
Our results indicate that SIRT3 activation is essential for the beneficial effects of the CocT supplementation because its inhibition by 3-TYP, a specific SIRT3 inhibitor, blocked the favorable effect of the treatment. In the presence of this inhibitor, mutant cells were not able to survive in galactose medium even with the supplementation of CocT (Figure 17).
With this data, we propose that CocT may exert a multitarget function to correct the different pathological processes: first, nicotinamide supplementation may induce the recovery of NAD+/NADH ratio and promotes sirtuins activity; second, α-LA may activate sirtuins and induce the expression of antioxidant enzymes; and third the rest of compounds (biotin, vitamin E, thiamine and pantothenate) may be helpful for correcting the functioning of Krebs cycle enzymes, endogenous α-LA precursors and may increase antioxidant properties in cell membranes. In addition, CocT supplementation was also able to increase the expression levels of the mutant LIPT1 enzyme which, although dysfunctional may have some residual activity sufficient to improve the mutant phenotype.
6. Conclusions
In our work we have identified a cocktail of six commercial compounds able to restore the expression levels of the mutant enzyme, increase the lipoylation of essential mitochondrial proteins and improve markedly cell bioenergetics in mutant LIPT1 cells. In addition, the cocktail was able to eliminate iron accumulation and lipid peroxidation associated with a significant improvement in the main pathological alterations of mutant LIPT1 cells. Our data suggest that the positive effect of the cocktail is mediated by SIRTs activation, particularly SIRT3 activation, and the expression of antioxidant enzymes, through the induction of mtUPR, an essential protective mechanism in mitochondria. Therefore, the combination of sodium pantothenate, nicotinamide, vitamin E, thiamine, biotin and α-LA could be of help for correcting LIPT1 mutations. We have also shown that personalized screenings in cell models derived from patients can be helpful for evaluating the behavior of mutant cells under different therapeutic options and thus identify the most effective supplements and dose concentrations for their evaluation in controlled clinical trials.
Supplementary Materials
The following supporting information can be downloaded at: (Link:…………………), Figure S1: Representative images of pharmacological screening in galactose medium; Figure S2: Effect of the compounds of CocT tested individually; Figure S3: Quantification of proliferation ratio of Figure S2; Figure S4: Quantification of proliferation ratio in galactose medium with different combinations of individual compounds of CocT; Figure S5: Effect of CPI-613, a PDH complex inhibitor, in the survival of control cells; Figure S6 : Electron microscopy images of control and patient (LIPT1) fibroblasts; Figure S7: Transfection with human LIPT1 plasmid (cDNA) in control and mutant fibroblasts; Figure S8: Analysis of iron accumulation in control and mutant LIPT1 fibroblasts, both transfected with human LIPT1 plasmid (cDNA); Figure S9: : Analysis of mitochondrial membrane peroxidation in both untreated and treated control and mutant fibroblasts; Figure S10: Analysis of lipid peroxidation in both untreated and treated control and mutant fibroblasts; Figure S11: Purity of mitochondrial, cytoplasmic and nuclear fractions; Figure S12: Pharmacological screening in galactose medium with 3-TYP; Figure S13: Expression levels of LIPT1, Lipo-PDH, Lipo-KGDH, SIRT3 and (P)PGC-1α in control and mutant fibroblasts; Figure S14: iNs generated by direct reprogramming; Figure S : Expression levels of Lipo-PDH and Lipo-KGDH in control and mutant fibroblasts; Figure S15: Figure S15: Expression levels of lipoylated PDH and KGDH in control and mutant fibroblasts.
Author Contributions
Conceptualization and writing, D.G.-F, P.C.-H., A.R.-G. and J.A.S.-A.; Review, S.I.-M., M.C.d.O. and A.R.S.; Experimentation, D.G.-F, P.C.-H., A.R.-G, J.M.S.-R., R.P.-P., D.-R.-L., J.M.R.-D., M.Á.-C., and A.S.-C. Electron microscopy analysis, S.G.-G. and J.M.G.-V. All authors have read and agreed to the published version of the manuscript.
Funding
This project was supported by FIS PI19/00377 (2019) and FIS PI22/00142 (2022) grants; the Ministerio de Sanidad, Spain; and the Fondo Europeo de Desarrollo Regional (FEDER Unión Europea), Spanish Ministry of Education, Culture, and Sport. This activity was co-financed by the European Regional Development Fund (ERDF) and by the Regional Ministry of Economic Transformation, Industry, Knowledge, and Universities of the Junta de Andalucía, within the framework of the ERDF Andalusia operational program 2014–2020 Thematic objective “01-Reinforcement of research, technological development and innovation” through the reference research project CTS-5725, PY18-850 and UPO-FEDER 2018 (UPO-1380614).
Institutional Review Board Statement
Approval of the ethical committee of the Hospital Universitario Virgen Macarena y Virgen de Rocío de Sevilla (Spain), Mitocure Code 0543-N-16, dated 11-08-2016, was obtained, according to the principles of the Declaration of Helsinki as well as the International Conferences on Harmonization and Good Clinical Practice Guidelines.
Informed Consent Statement
Informed consent was obtained from all the participants in this work.
Data Availability Statement
Data and material are available under request.
Acknowledgments
We thank Pilar Burgos Domenech from IRNAS (Instituto de Recursos Naturales y Agrobiología de Sevilla) for her help with the ICP-MS assays. We acknowledge the support of “Ayudas B2 de Iniciación a la Investigación) from Pablo de Olavide’s University, mitochondrial patients and patient associations. .
Conflicts of Interest
We declare no conflict of interest.
Abbreviations
| 3-TYP | 3-(1H-1,2,3-triazol-4-yl) pyridine |
| α-LA | alpha-lipoic acid |
| α-KGDH | alpha-ketoglutarate dehydrogenase |
| ACP | acyl carrier protein |
| ACSM2A | acyl-CoA synthethase medium chain family member 2A |
| AMP | adenosin monophosphate |
| AMPK | protein kinase AMP-activated |
| ASCL1 | Achaete-Scute Family BHLH Transcription Factor 1 |
| ATF4 | activating transcription factor 4 |
| ATF5 | activating transcription factor 5 |
| ATP5F1A | ATP synthase F1 subunit 1 alpha |
| BCKDH | branched chain ketoacid dehydrogenase |
| BRN2 | POU class 3 homeobox 2 |
| BSA | bovine serum albumin |
| CLPP | caseinolytic mitochondrial matrix peptidase proteolytic subunit |
| CoA | coenzyme A |
| CoPAN | CoA synthase protein-associated neurodegeneration |
| Cox IV | cytochrome C oxidase subunit IV |
| CPI-613 | 6,8-bis (benzylthiol)-octanoic acid |
| DAPI | 4′,6-diamidino-2-phenylindole |
| DLDH | lipoamide dehydrogenase |
| DMEM | Dulbecco's modified eagle medium |
| DMSO | Dimethyl Sulfoxide |
| EEG | electroencephalography |
| FAO | fatty acids oxidation |
| FASII | fatty acid synthesis type II |
| FBS | fetal bovine serum |
| FCCP | Carbonyl cyanide 4-(trifluoromethoxy) phenylhydrazone |
| FOX03A | forkhead box O3 |
| GCS | glycine cleavage system |
| GCSH | glycine cleavage system H protein |
| H2AX | H2A histone family member X |
| HEPES | 4-(2-hydroxyethyl)-1-piperazine ethanesulfonic acid |
| HRP | horseradish peroxidase |
| Hsp60 | heat shock protein 60 |
| Hsp70 | heat shock protein 70 |
| IC50 | half-maximal inhibitory concentration |
| ICP-MS | inductively coupled plasma mass spectrometry |
| IEM | inborn error of metabolism |
| iNs | induced neurons |
| LIAS | lipoic acid synthase |
| lip3 | lipoate protein ligase 3 |
| LIPT1 | lipoyltransferase 1 |
| LIPT2 | lipoyltransferase 2 |
| Lonp1 | lon peptidase 1 |
| LpIA | lipoate-protein ligase A |
| MePAN | mitochondrial enoyl CoA reductase protein-associated neurodegeneration |
| MnSOD | manganese superoxide dismutase |
| MRI | magnetic resonance imaging |
| mt-CO2 | mitochondrially encoded cytochrome C oxidase subunit II |
| mtDNA | mitochondrial DNA |
| mtETC | mitochondrial electron transport chain |
| mtUPR | mitochondrial Unfolded Protein Response |
| NAD+ | nicotinamide adenine dinucleotide |
| NAMPT | nicotinamide phosphoribosyltransferase |
| NBIA | neurodegeneration with brain iron accumulation |
| nDNA | nuclear DNA |
| NDUFA9 | NADH:ubiquinone oxidorreductase subunit A9 |
| Nrf1 | nuclear respiratory factor 1 |
| Nrf2 | nuclear respiratory factor 2 |
| OADH | 2-oxoadipate dehydrogenase |
| OCR | oxygen comsumption rate |
| OXPHOS | oxidative phosphorylation |
| PDH | pyruvate dehydrogenase |
| PFA | paraformaldehyde |
| PGC-1α | peroxisome proliferator-activated receptor-γ coactivator 1-α |
| P-PGC-1α | phosphorylated peroxisome proliferator-activated receptor-γ coactivator 1α |
| PGK | phosphoglycerate kinase |
| UQCRC1 | ubiquinol-cytochrome C reductase core protein 1 |
| PKAN | pantothenate kinase associated neurodegeneration |
| ROS | reactive oxygen species |
| SIRT1 | sirtuin 1 |
| SIRT3 | sirtuin 3 |
| TCA | tricarboxylic acids cycle |
| TEM | transmission electron microscope |
| TOMM20 | translocase of the outer mitochondrial membrane 20 |
| TFAM | mitochondrial transcription factor A |
| UQCRC1 | ubiquinol-cytochrome C reductase core protein 1 |
| VDAC | voltage-dependent anion channel |
| WES | whole exome sequencing |
References
- Patterson, E.L.; et al. Crystallization of a Derivative of Protogen-B. Journal of the American Chemical Society 2002, 73, 5919–5920. [Google Scholar] [CrossRef]
- Reed, L.J.; et al. Crystalline alpha-lipoic acid; a catalytic agent associated with pyruvate dehydrogenase. Science 1951, 114, 93–94. [Google Scholar] [CrossRef] [PubMed]
- Goraca, A.; et al. Lipoic acid - biological activity and therapeutic potential. Pharmacol Rep 2011, 63, 849–858. [Google Scholar] [CrossRef] [PubMed]
- Mayr, J.A.; et al. Lipoic acid biosynthesis defects. J Inherit Metab Dis 2014, 37, 553–563. [Google Scholar] [CrossRef] [PubMed]
- Reed, L.J. A trail of research from lipoic acid to alpha-keto acid dehydrogenase complexes. J Biol Chem 2001, 276, 38329–38336. [Google Scholar] [CrossRef] [PubMed]
- Solmonson, A.; DeBerardinis, R.J. Lipoic acid metabolism and mitochondrial redox regulation. J Biol Chem 2018, 293, 7522–7530. [Google Scholar] [CrossRef] [PubMed]
- Rochette, L.; et al. Alpha-lipoic acid: Molecular mechanisms and therapeutic potential in diabetes. Can J Physiol Pharmacol 2015, 93, 1021–1027. [Google Scholar] [CrossRef] [PubMed]
- Cronan, J.E. Assembly of Lipoic Acid on Its Cognate Enzymes: An Extraordinary and Essential Biosynthetic Pathway. Microbiol Mol Biol Rev 2016, 80, 429–450. [Google Scholar] [CrossRef] [PubMed]
- Schonauer, M.S.; et al. Lipoic acid synthesis and attachment in yeast mitochondria. J Biol Chem 2009, 284, 23234–23242. [Google Scholar] [CrossRef]
- Morris, T.W.; Reed, K.E.; Cronan, J.E., Jr. Identification of the gene encoding lipoate-protein ligase A of Escherichia coli. Molecular cloning and characterization of the lplA gene and gene product. J Biol Chem 1994, 269, 16091–16100. [Google Scholar]
- Fujiwara, K.; et al. Purification, characterization, and cDNA cloning of lipoate-activating enzyme from bovine liver. J Biol Chem 2001, 276, 28819–28823. [Google Scholar] [CrossRef] [PubMed]
- DeBerardinis, R.J.; Thompson, C.B. Cellular metabolism and disease: What do metabolic outliers teach us? Cell 2012, 148, 1132–1144. [Google Scholar] [CrossRef]
- Stowe, R.C.; Sun, Q.; Elsea, S.H.; Scaglia, F. LIPT1 deficiency presenting as early infantile epileptic encephalopathy, Leigh disease, and secondary pyruvate dehydrogenase complex deficiency. Am J Med Genet A. 2018, 176. [Google Scholar] [CrossRef]
- Ni, M.; et al. Functional Assessment of Lipoyltransferase-1 Deficiency in Cells, Mice, and Humans. Cell Rep 2019, 27, 1376–1386 e6. [Google Scholar] [CrossRef]
- Tort, F.; Ferrer-Cortes, X.; Ribes, A. Differential diagnosis of lipoic acid synthesis defects. J Inherit Metab Dis 2016, 39. [Google Scholar] [CrossRef] [PubMed]
- Soreze, Y.; et al. Mutations in human lipoyltransferase gene LIPT1 cause a Leigh disease with secondary deficiency for pyruvate and alpha-ketoglutarate dehydrogenase. Orphanet J Rare Dis 2013, 8, 192. [Google Scholar] [CrossRef]
- Quinn, J. Lipoylation of acyltransferase components of 2-oxo acid dehydrogenase complexes. Methods Enzymol 1997, 279, 193–202. [Google Scholar]
- Kamalian, L.; et al. Acute Metabolic Switch Assay Using Glucose/Galactose Medium in HepaRG Cells to Detect Mitochondrial Toxicity. Curr Protoc Toxicol 2019, 80, e76. [Google Scholar] [CrossRef]
- Coelho, A.I.; Berry, G.T.; Rubio-Gozalbo, M.E. Galactose metabolism and health. Curr Opin Clin Nutr Metab Care 2015, 18, 422–427. [Google Scholar] [CrossRef]
- Ghio, A.J.; Roggli, V.L. Perls' Prussian Blue Stains of Lung Tissue, Bronchoalveolar Lavage, and Sputum. J Environ Pathol Toxicol Oncol 2021, 40, 1–15. [Google Scholar]
- Tarohda, T.; Ishida, Y.; Kawai, K.; Yamamoto, M.; Amano, R. Regional distributions of manganese, iron, copper, and zinc in the brains of 6-hydroxydopamine-induced parkinsonian rats. Anal Bioanal Chem 2005, 383, 224–234. [Google Scholar] [CrossRef]
- Georgakopoulou, E.A.; Tsimaratou, K.; Evangelou, K.; Fernandez Marcos, P.J.; Zoumpourlis, V.; Trougakos, I.P.; et al. Specific lipofuscin staining as a novel biomarker to detect replicative and stress-induced senescence. A method applicable in cryo-preserved and archival tissues. Aging (Albany NY) 2013, 5. [Google Scholar] [CrossRef]
- Evangelou, K.; Gorgoulis, V.G. Sudan Black B, The Specific Histochemical Stain for Lipofuscin: A Novel Method to Detect Senescent Cells. Methods Mol Biol 2017. [Google Scholar] [CrossRef]
- Alcocer-Gomez, E.; et al. Metformin and caloric restriction induce an AMPK-dependent restoration of mitochondrial dysfunction in fibroblasts from Fibromyalgia patients. Biochim Biophys Acta 2015, 1852, 1257–1267. [Google Scholar] [CrossRef]
- Pap, E.H.; et al. Ratio-fluorescence microscopy of lipid oxidation in living cells using C11-BODIPY(581/591). FEBS Lett 1999, 453, 278–282. [Google Scholar] [CrossRef]
- Nakamura, S.; et al. Ionomycin-induced calcium influx induces neurite degeneration in mouse neuroblastoma cells: Analysis of a time-lapse live cell imaging system. Free Radic Res 2016, 50, 1214–1225. [Google Scholar] [CrossRef]
- Legault, E.M.; Drouin-Ouellet, J. Generation of Induced Dopaminergic Neurons from Human Fetal Fibroblasts. Methods Mol Biol 2021, 2352, 97–115. [Google Scholar]
- Bruzelius, A.; et al. Reprogramming Human Adult Fibroblasts into GABAergic Interneurons. Cells 2021, 10. [Google Scholar] [CrossRef]
- Zufferey, R.; et al. Multiply attenuated lentiviral vector achieves efficient gene delivery in vivo. Nat Biotechnol 1997, 15, 871–875. [Google Scholar] [CrossRef]
- Le Gall, J.Y.; et al. [Human iron metabolism]. Bull Acad Natl Med 2005, 189, 1635–1647. [Google Scholar]
- Miller, J.R.; Busby, R.W.; Jordan, S.W.; Cheek, J.; Henshaw, T.F.; Ashley, G.W.; et al. Escherichia coli LipA is a lipoy synthase: In vitro biosynthesis of lipoylated pyruvate dehydrogenase complex from octanoyl-acyl carrier protein. Biochemistry 2000, 39. [Google Scholar] [CrossRef]
- Lill, R.; Freibert, S.A. Mechanisms of Mitochondrial Iron-Sulfur Protein Biogenesis. Annu Rev Biochem 2020, 89, 471–499. [Google Scholar] [CrossRef]
- Said, H.M. Biotin: Biochemical, physiological and clinical aspects. Subcell Biochem 2012, 56, 1–19. [Google Scholar]
- Pekala, J.; et al. L-carnitine--metabolic functions and meaning in humans life. Curr Drug Metab 2011, 12, 667–678. [Google Scholar] [CrossRef]
- Canto, C.; et al. The NAD(+) precursor nicotinamide riboside enhances oxidative metabolism and protects against high-fat diet-induced obesity. Cell Metab 2012, 15, 838–847. [Google Scholar] [CrossRef]
- Miyazawa, T.; et al. Vitamin E: Regulatory Redox Interactions. IUBMB Life 2019, 71, 430–441. [Google Scholar] [CrossRef]
- Depeint, F.; et al. Mitochondrial function and toxicity: Role of the B vitamin family on mitochondrial energy metabolism. Chem Biol Interact 2006, 163, 94–112. [Google Scholar] [CrossRef]
- Salehi, B.; et al. Insights on the Use of alpha-Lipoic Acid for Therapeutic Purposes. Biomolecules 2019, 9. [Google Scholar] [CrossRef]
- Talaveron-Rey, M.; et al. Alpha-lipoic acid supplementation corrects pathological alterations in cellular models of pantothenate kinase-associated neurodegeneration with residual PANK2 expression levels. Orphanet J Rare Dis 2023, 18, 80. [Google Scholar] [CrossRef]
- Martinus, R.D.; Garth, G.P.; Webster, T.L.; Cartwright, P.; Naylor, D.J.; Hoj, P.B.; Hoogenraad, N.J. Selective induction of mitochondrial chaperones in response to loss of the mitochondrial genome. Eur J Biochem 1996, 240. [Google Scholar] [CrossRef]
- Munch, C. The different axes of the mammalian mitochondrial unfolded protein response. BMC Bio. 2018, 16. [Google Scholar] [CrossRef]
- Cilleros-Holgado, P.; Gómez-Fernández, D.; Piñero-Pérez, R.; Reche-López, D.; Álvarez-Córdoba, M.; Munuera-Cabeza, M.; et al. mtUPR Modulation as a Therapeutic Target for Primary and Secondary Mitochondrial Diseases. International Journal of Molecular Sciences 2023. [Google Scholar] [CrossRef]
- Canto, C.; Menzies, K.J.; Auwerx, J. NAD(+) Metabolism and the Control of Energy Homeostasis: A Balancing Act between Mitochondria and the Nucleus. Cell Metab 2015, 22, 31–53. [Google Scholar] [CrossRef]
- Ismail, F.Y.; Mitoma, H.; Fatemi, A. Metabolic ataxias. Handb Clin Neurol 2018, 155, 117–127. [Google Scholar]
- Molnar, M.J.; Kovacs, G.G. Mitochondrial diseases. Handb Clin Neurol 2017, 145, 147–155. [Google Scholar]
- Feng, D.; Witkowski, A.; Smith, S. Down-regulation of Mitochondrial Acyl Carrier Protein in Mammalian Cells Compromises Protein Lipoylation and Respiratory Complex I and Results in Cell Death. J Biol Chem 2009, 284. [Google Scholar] [CrossRef]
- Cronan, J.E. Biotin and Lipoic Acid: Synthesis, Attachment, and Regulation. EcoSal Plus 2014, 6. [Google Scholar] [CrossRef]
- Lavatelli, A.; de Mendoza, D.; Mansilla, M.C. Defining Caenorhabditis elegans as a model system to investigate lipoic acid metabolism. J Biol Chem 2020, 295. [Google Scholar] [CrossRef]
- Head, R.A.; et al. Clinical and genetic spectrum of pyruvate dehydrogenase deficiency: Dihydrolipoamide acetyltransferase (E2) deficiency. Ann Neurol 2005, 58, 234–241. [Google Scholar] [CrossRef]
- Leoni, V.; et al. Metabolic consequences of mitochondrial coenzyme A deficiency in patients with PANK2 mutations. Mol Genet Metab 2012, 105, 463–471. [Google Scholar] [CrossRef]
- McWilliam, C.A.; et al. Pyruvate dehydrogenase E2 deficiency: A potentially treatable cause of episodic dystonia. Eur J Paediatr Neurol 2010, 14, 349–353. [Google Scholar] [CrossRef]
- Alvarez-Cordoba, M.; et al. Pantothenate Rescues Iron Accumulation in Pantothenate Kinase-Associated Neurodegeneration Depending on the Type of Mutation. Mol Neurobiol 2019, 56, 3638–3656. [Google Scholar] [CrossRef]
- Alvarez-Cordoba, M.; et al. Down regulation of the expression of mitochondrial phosphopantetheinyl-proteins in pantothenate kinase-associated neurodegeneration: Pathophysiological consequences and therapeutic perspectives. Orphanet J Rare Dis 2021, 16, 201. [Google Scholar] [CrossRef]
- Lambrechts, R.A.; et al. CoA-dependent activation of mitochondrial acyl carrier protein links four neurodegenerative diseases. EMBO Mol Med 2019, 11, e10488. [Google Scholar] [CrossRef]
- Tai, S.; et al. Alpha-Lipoic Acid Mediates Clearance of Iron Accumulation by Regulating Iron Metabolism in a Parkinson's Disease Model Induced by 6-OHDA. Front Neurosci 2020, 14, 612. [Google Scholar] [CrossRef]
- Gray, D.A.a.W.J. Lipofuscin and Aging: A Matter of Toxic Waste. Sci Aging Knowledge Environ 2005. [Google Scholar] [CrossRef]
- Moreno-García, A.; Kun, A.; Calero, O.; Medina, M.; Calero, M. An Overview of the Role of Lipofuscin in Age-Related Neurodegeneration. Front. Neurosci 2018, 12. [Google Scholar] [CrossRef]
- onig, J.; Ott, C.; Hugo, M.; Jung, T.; Bulteau, A.-L.; et al. Mitochondrial contribution to lipofuscin formation. Redox Biol 2017. [Google Scholar]
- Villalon-Garcia, I.; et al. Vicious cycle of lipid peroxidation and iron accumulation in neurodegeneration. Neural Regen Res 2023, 18, 1196–1202. [Google Scholar]
- Suarez-Rivero, J.M.; et al. UPR(mt) activation improves pathological alterations in cellular models of mitochondrial diseases. Orphanet J Rare Dis 2022, 17, 204. [Google Scholar] [CrossRef]
- Suarez-Rivero, J.M.; et al. Pterostilbene in Combination With Mitochondrial Cofactors Improve Mitochondrial Function in Cellular Models of Mitochondrial Diseases. Front Pharmacol 2022, 13, 862085. [Google Scholar] [CrossRef]
- Rochette, L.; et al. Direct and indirect antioxidant properties of alpha-lipoic acid and therapeutic potential. Mol Nutr Food Res 2013, 57, 114–125. [Google Scholar] [CrossRef]
- Park, S.; et al. Physiological effect and therapeutic application of alpha lipoic acid. Curr Med Chem 2014, 21, 3636–3645. [Google Scholar] [CrossRef]
- Zhou, B.; et al. Alpha Lipoamide Ameliorates Motor Deficits and Mitochondrial Dynamics in the Parkinson's Disease Model Induced by 6-Hydroxydopamine. Neurotox Res 2018, 33, 759–767. [Google Scholar] [CrossRef]
- Dziedziak, J.; Kasarello, K.; Cudnoch-Jedrzejewska, A. Dietary Antioxidants in Age-Related Macular Degeneration and Glaucoma. Antioxidants (Basel) 2021, 10. [Google Scholar] [CrossRef]
- Molz, P.; Schroder, N. Potential Therapeutic Effects of Lipoic Acid on Memory Deficits Related to Aging and Neurodegeneration. Front Pharmacol 2017, 8, 849. [Google Scholar] [CrossRef]
- Chen, P.; et al. Effects of alpha-lipoic acid on expression of iron transport and storage proteins in BV-2 microglia cells. Pharmacol Rep 2017, 69, 1–5. [Google Scholar] [CrossRef]
- Wang, Y.; et al. The Neuroprotection of Lysosomotropic Agents in Experimental Subarachnoid Hemorrhage Probably Involving the Apoptosis Pathway Triggering by Cathepsins via Chelating Intralysosomal Iron. Mol Neurobiol 2015, 52, 64–77. [Google Scholar] [CrossRef]
- Wu, Q.J.; et al. The sirtuin family in health and disease. Signal Transduct Target Ther 2022, 7, 402. [Google Scholar]
- Carafa, V.; et al. Sirtuin functions and modulation: From chemistry to the clinic. Clin Epigenetics 2016, 8, 61. [Google Scholar] [CrossRef]
- Rutanen, J.; et al. SIRT1 mRNA expression may be associated with energy expenditure and insulin sensitivity. Diabetes 2010, 59, 829–835. [Google Scholar] [CrossRef]
- de Kreutzenberg, S.V.; et al. Downregulation of the longevity-associated protein sirtuin 1 in insulin resistance and metabolic syndrome: Potential biochemical mechanisms. Diabetes 2010, 59, 1006–1015. [Google Scholar] [CrossRef]
- Imai, S.; Guarente, L. NAD+ and sirtuins in aging and disease. Trends Cell Biol 2014, 24, 464–471. [Google Scholar]
- Xin, T.; Lu, C. SirT3 activates AMPK-related mitochondrial biogenesis and ameliorates sepsis-induced myocardial injury. Aging (Albany NY) 2020, 12, 16224–16237. [Google Scholar] [CrossRef]
- Zhang, J.; et al. Mitochondrial Sirtuin 3: New emerging biological function and therapeutic target. Theranostics 2020, 10, 8315–8342. [Google Scholar] [CrossRef]
- Verdin, E. NAD(+) in aging, metabolism, and neurodegeneration. Science 2015, 350, 1208–1213. [Google Scholar] [CrossRef]
- Kim, T.S.; et al. SIRT3 promotes antimycobacterial defenses by coordinating mitochondrial and autophagic functions. Autophagy 2019, 15, 1356–1375. [Google Scholar] [CrossRef]
- Imai, S. Dissecting systemic control of metabolism and aging in the NAD World: The importance of SIRT1 and NAMPT-mediated NAD biosynthesis. FEBS Lett 2011, 585, 1657–1662. [Google Scholar] [CrossRef]
- Chen, C.; et al. SIRT1 and aging related signaling pathways. Mech Ageing Dev 2020, 187, 111215. [Google Scholar] [CrossRef]
- Katsyuba, E.; et al. NAD(+) homeostasis in health and disease. Nat Metab 2020, 2, 9–31. [Google Scholar] [CrossRef]
- van de Ven, R.A.H.; Santos, D.; Haigis, M.C. Mitochondrial Sirtuins and Molecular Mechanisms of Aging. Trends Mol Med 2017, 23, 320–331. [Google Scholar] [CrossRef]
- Silaghi, C.N.; Farcas, M.; Craciun, A.M. Sirtuin 3 (SIRT3) Pathways in Age-Related Cardiovascular and Neurodegenerative Diseases. Biomedicines 2021, 9. [Google Scholar] [CrossRef]
- Finley, L.W.; et al. Succinate dehydrogenase is a direct target of sirtuin 3 deacetylase activity. PLoS ONE 2011, 6, e23295. [Google Scholar] [CrossRef]
- Meng, H.; et al. SIRT3 Regulation of Mitochondrial Quality Control in Neurodegenerative Diseases. Front Aging Neurosci 2019, 11, 313. [Google Scholar] [CrossRef]
- Hiromasa, Y.; et al. Organization of the cores of the mammalian pyruvate dehydrogenase complex formed by E2 and E2 plus the E3-binding protein and their capacities to bind the E1 and E3 components. J Biol Chem 2004, 279, 6921–6933. [Google Scholar] [CrossRef]
- Wang, C.; et al. Protective effects of metformin against osteoarthritis through upregulation of SIRT3-mediated PINK1/Parkin-dependent mitophagy in primary chondrocytes. Biosci Trends 2019, 12, 605–612. [Google Scholar] [CrossRef]
- Hirschey, M.D.; et al. SIRT3 regulates mitochondrial fatty-acid oxidation by reversible enzyme deacetylation. Nature 2010, 464, 121–125. [Google Scholar] [CrossRef]
- Sakakibara, I.; et al. Fasting-induced hypothermia and reduced energy production in mice lacking acetyl-CoA synthetase 2. Cell Metab 2009, 9, 191–202. [Google Scholar] [CrossRef]
- Schwer, B.; et al. Reversible lysine acetylation controls the activity of the mitochondrial enzyme acetyl-CoA synthetase 2. Proc Natl Acad Sci U S A 2006, 103, 10224–10229. [Google Scholar] [CrossRef]
- Shimazu, T.; et al. SIRT3 deacetylates mitochondrial 3-hydroxy-3-methylglutaryl CoA synthase 2 and regulates ketone body production. Cell Metab 2010, 12, 654–661. [Google Scholar] [CrossRef]
- Lombard, D.B.; et al. Mammalian Sir2 homolog SIRT3 regulates global mitochondrial lysine acetylation. Mol Cell Biol 2007, 27, 8807–8814. [Google Scholar] [CrossRef]
- Hallows, W.C.; Lee, S.; Denu, J.M. Sirtuins deacetylate and activate mammalian acetyl-CoA synthetases. Proc Natl Acad Sci U S A 2006, 103, 10230–10235. [Google Scholar] [CrossRef]
- Cimen, H.; et al. Regulation of succinate dehydrogenase activity by SIRT3 in mammalian mitochondria. Biochemistry 2010, 49, 304–311. [Google Scholar] [CrossRef]
- Fritz, K.S.; et al. Ethanol metabolism modifies hepatic protein acylation in mice. PLoS ONE 2013, 8, e75868. [Google Scholar] [CrossRef]
- Ahn, B.H.; et al. A role for the mitochondrial deacetylase Sirt3 in regulating energy homeostasis. Proc Natl Acad Sci U S A 2008, 105, 14447–14452. [Google Scholar] [CrossRef]
- Cheng, A.; et al. Mitochondrial SIRT3 Mediates Adaptive Responses of Neurons to Exercise and Metabolic and Excitatory Challenges. Cell Metab 2016, 23, 128–142. [Google Scholar] [CrossRef]
- Mattson, M.P.; Gleichmann, M.; Cheng, A. Mitochondria in neuroplasticity and neurological disorders. Neuron 2008, 60, 748–766. [Google Scholar] [CrossRef]
- Cui, X.X.; et al. SIRT3 deacetylated and increased citrate synthase activity in PD model. Biochem Biophys Res Commun 2017, 484, 767–773. [Google Scholar] [CrossRef]
- Huang, W.; et al. SIRT3 Expression Decreases with Reactive Oxygen Species Generation in Rat Cortical Neurons during Early Brain Injury Induced by Experimental Subarachnoid Hemorrhage. Biomed Res Int 2016, 2016, 8263926. [Google Scholar] [CrossRef]
- Tseng, A.H.; Shieh, S.S.; Wang, D.L. SIRT3 deacetylates FOXO3 to protect mitochondria against oxidative damage. Free Radic Biol Med 2013, 63, 222–234. [Google Scholar] [CrossRef]
- Cilleros-Holgado, P.; et al. mtUPR Modulation as a Therapeutic Target for Primary and Secondary Mitochondrial Diseases. Int J Mol Sci 2023, 24. [Google Scholar] [CrossRef]
- Gerhart-Hines, Z.; et al. Metabolic control of muscle mitochondrial function and fatty acid oxidation through SIRT1/PGC-1alpha. EMBO J 2007, 26, 1913–1923. [Google Scholar] [CrossRef]
Figure 1.
Characterization of the physiopathology of mutant LIPT1 fibroblasts. A. Western blot analysis of the mutated protein LIPT1, E2 subunits of multienzyme complexes PDH and KGDH, and their lipoylated form. C1 and C2: control cells. Actin was used as a loading control B. Band densitometry of Western blot data referred to actin and normalized to the mean of controls. C. PDH Complex activity was measured by PDH Enzyme Activity Dipstick Assay Kit. D. Band intensity of PDH Complex activity was obtained by ImageLab software. E. KGDH activity was measured by α-Ketoglutarate Dehydrogenase Activity Assay Kit. Data represent the mean±SD of 3 independent experiments. ***p<0.001 and ****p<0.0001 between control and patient’s fibroblasts. a.u.: arbitrary units.
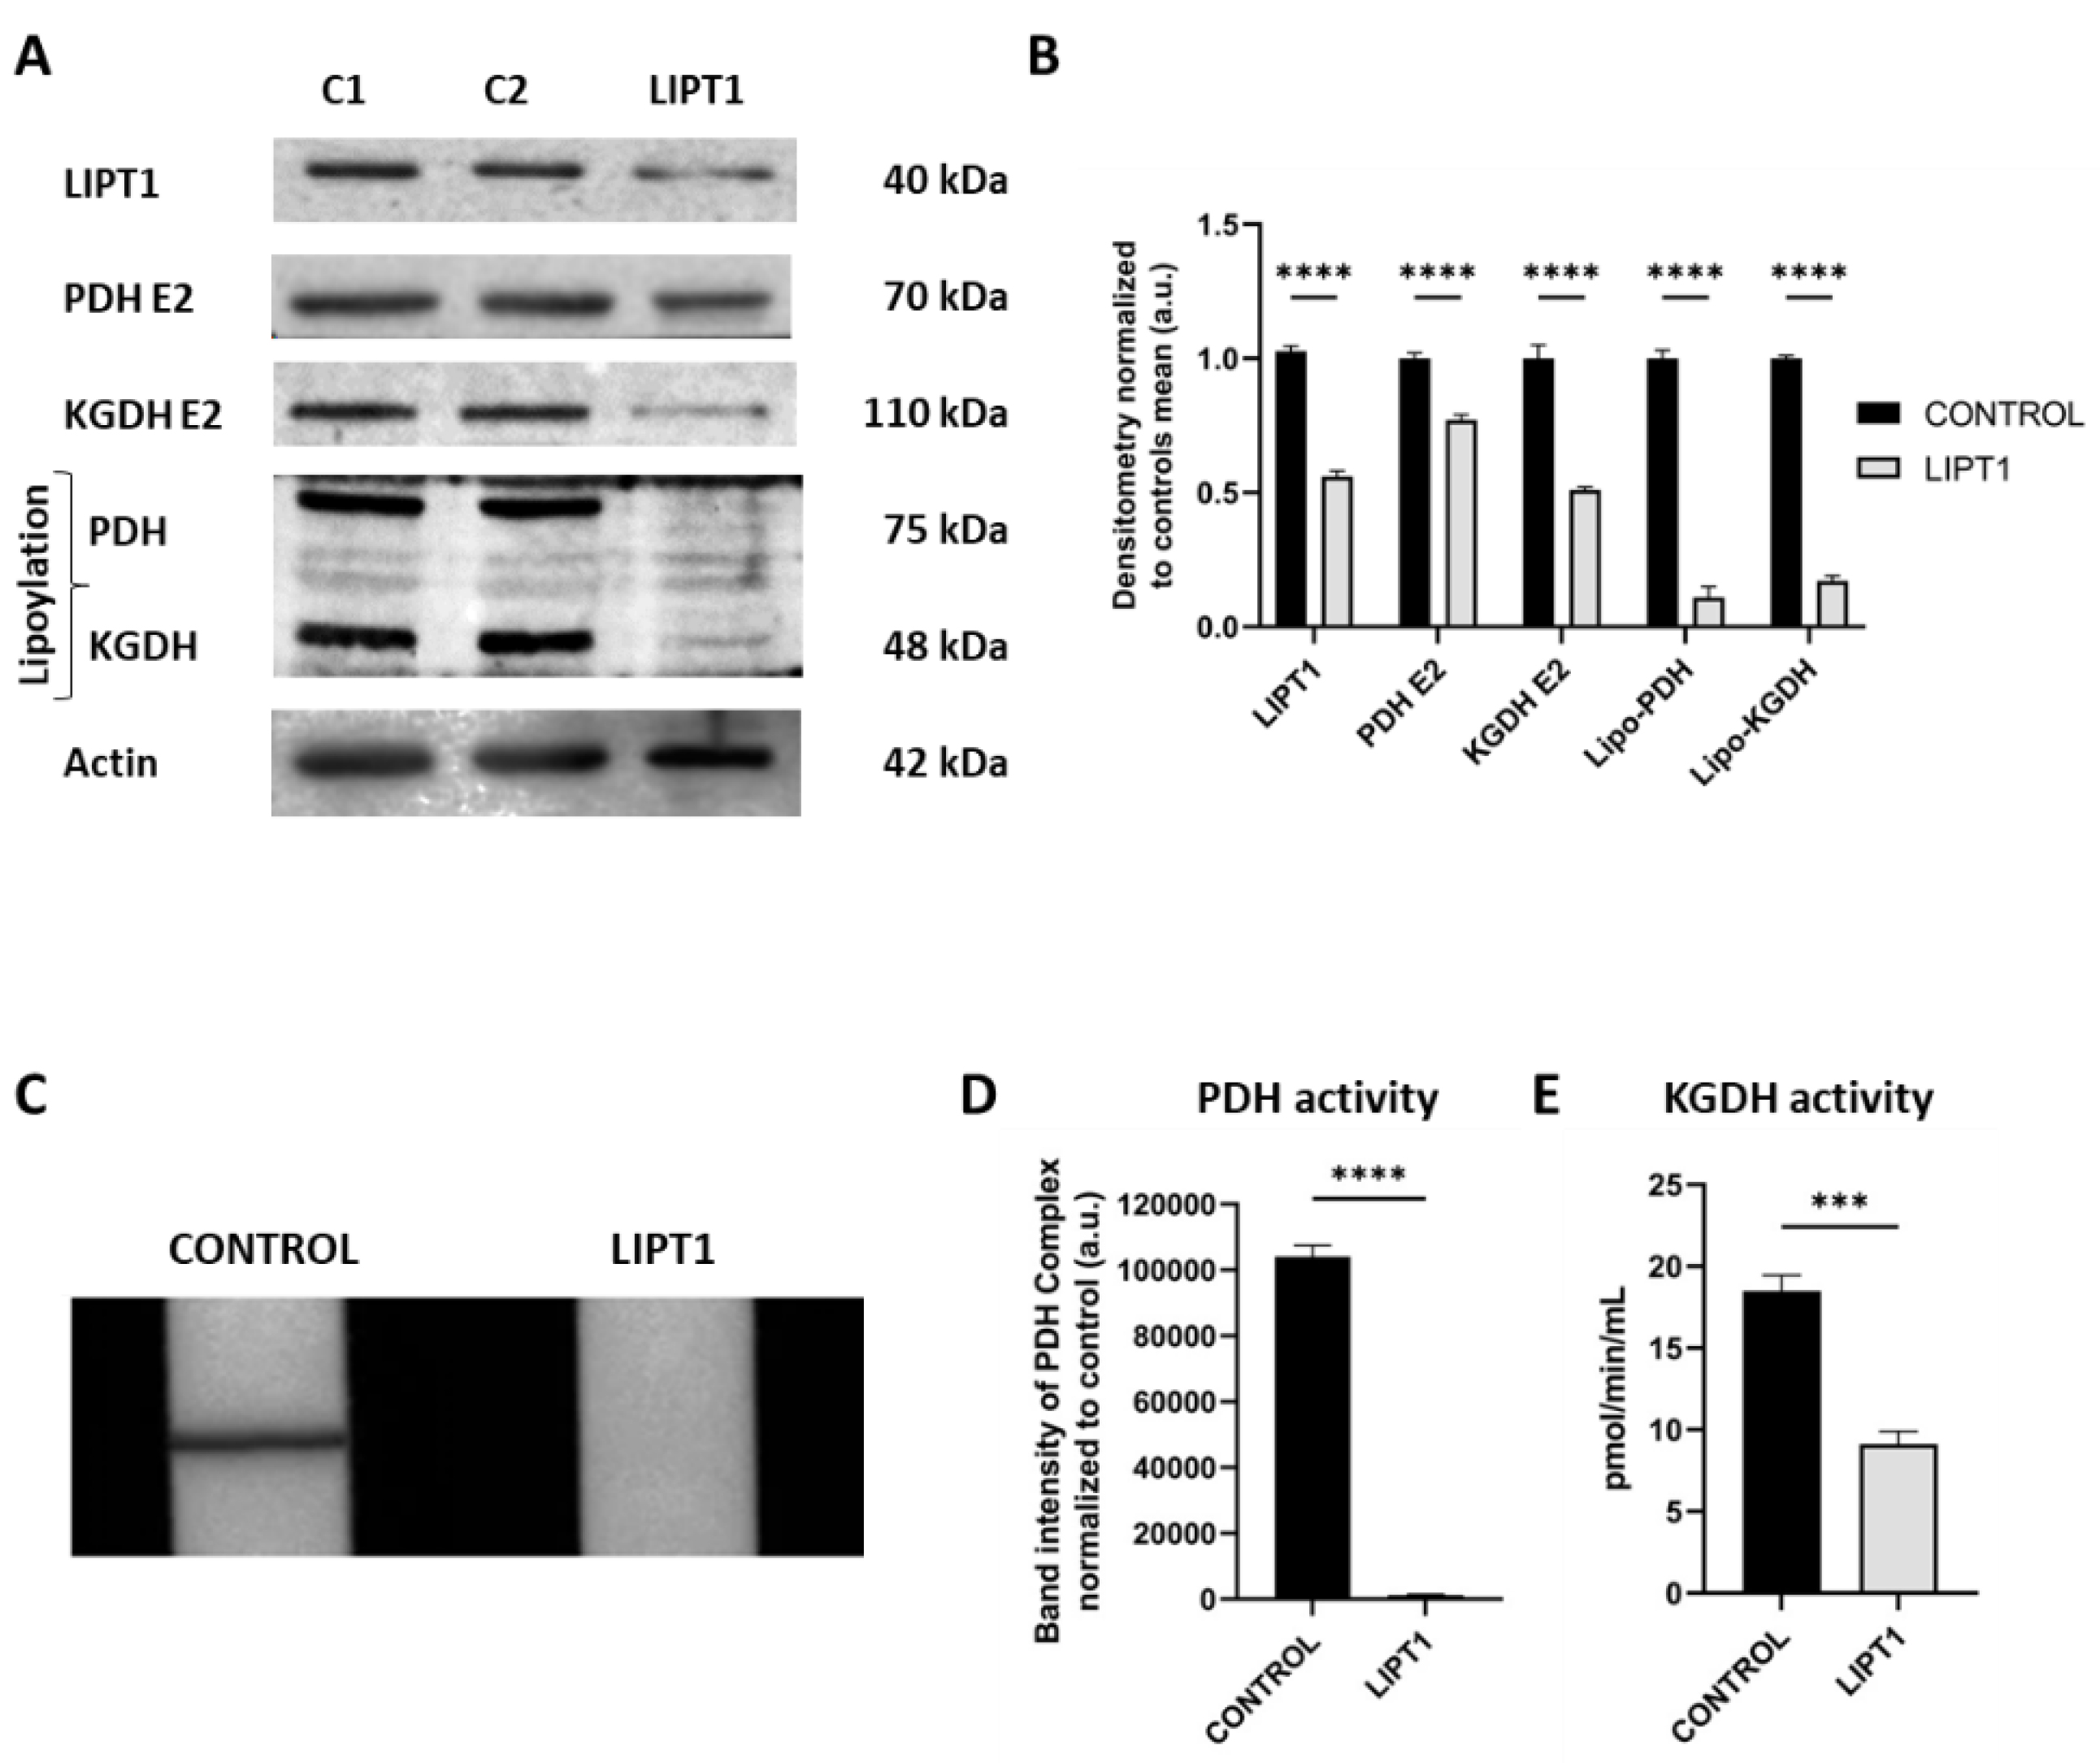
Figure 2.
Analysis of iron accumulation in mutant LIPT1 fibroblasts. A. Control and patient’s fibroblasts were stained with Prussian Blue staining. Images were acquired by Zeiss Axio Vert V1 microscope. Scale bar: 20 µm. Patient’s fibroblasts were treated with 100 mM Deferiprone (DEF) for 24 hours. B. Quantification of Prussian Blue staining. Images were analyzed by the Image J software (version 1.53t) (at least 30 images were analyzed per each condition and experiment). C. Quantification of iron content by ICP-MS. D. Lipofuscin accumulation was assessed by Sudan Black staining. Images were acquired by Zeiss Axio Vert V1 microscope. A PKAN cell line was used as a positive control of lipofuscin accumulation. Patient’s cells were treated with 100 μM Deferiprone (DEF) for 24 hours to assess that Sudan Black staining is depending on iron accumulation. Scale bar: 20 µm. E. Quantification of Sudan Black staining integrate density (at least 30 images were analyzed per each condition and experiment). Data represent the mean±SD of 3 independent experiments. ****p<0.0001 between control and patient’s fibroblasts. ####p<0.001 between mutant fibroblasts untreated and treated with deferiprone. a.u.: arbitrary units.
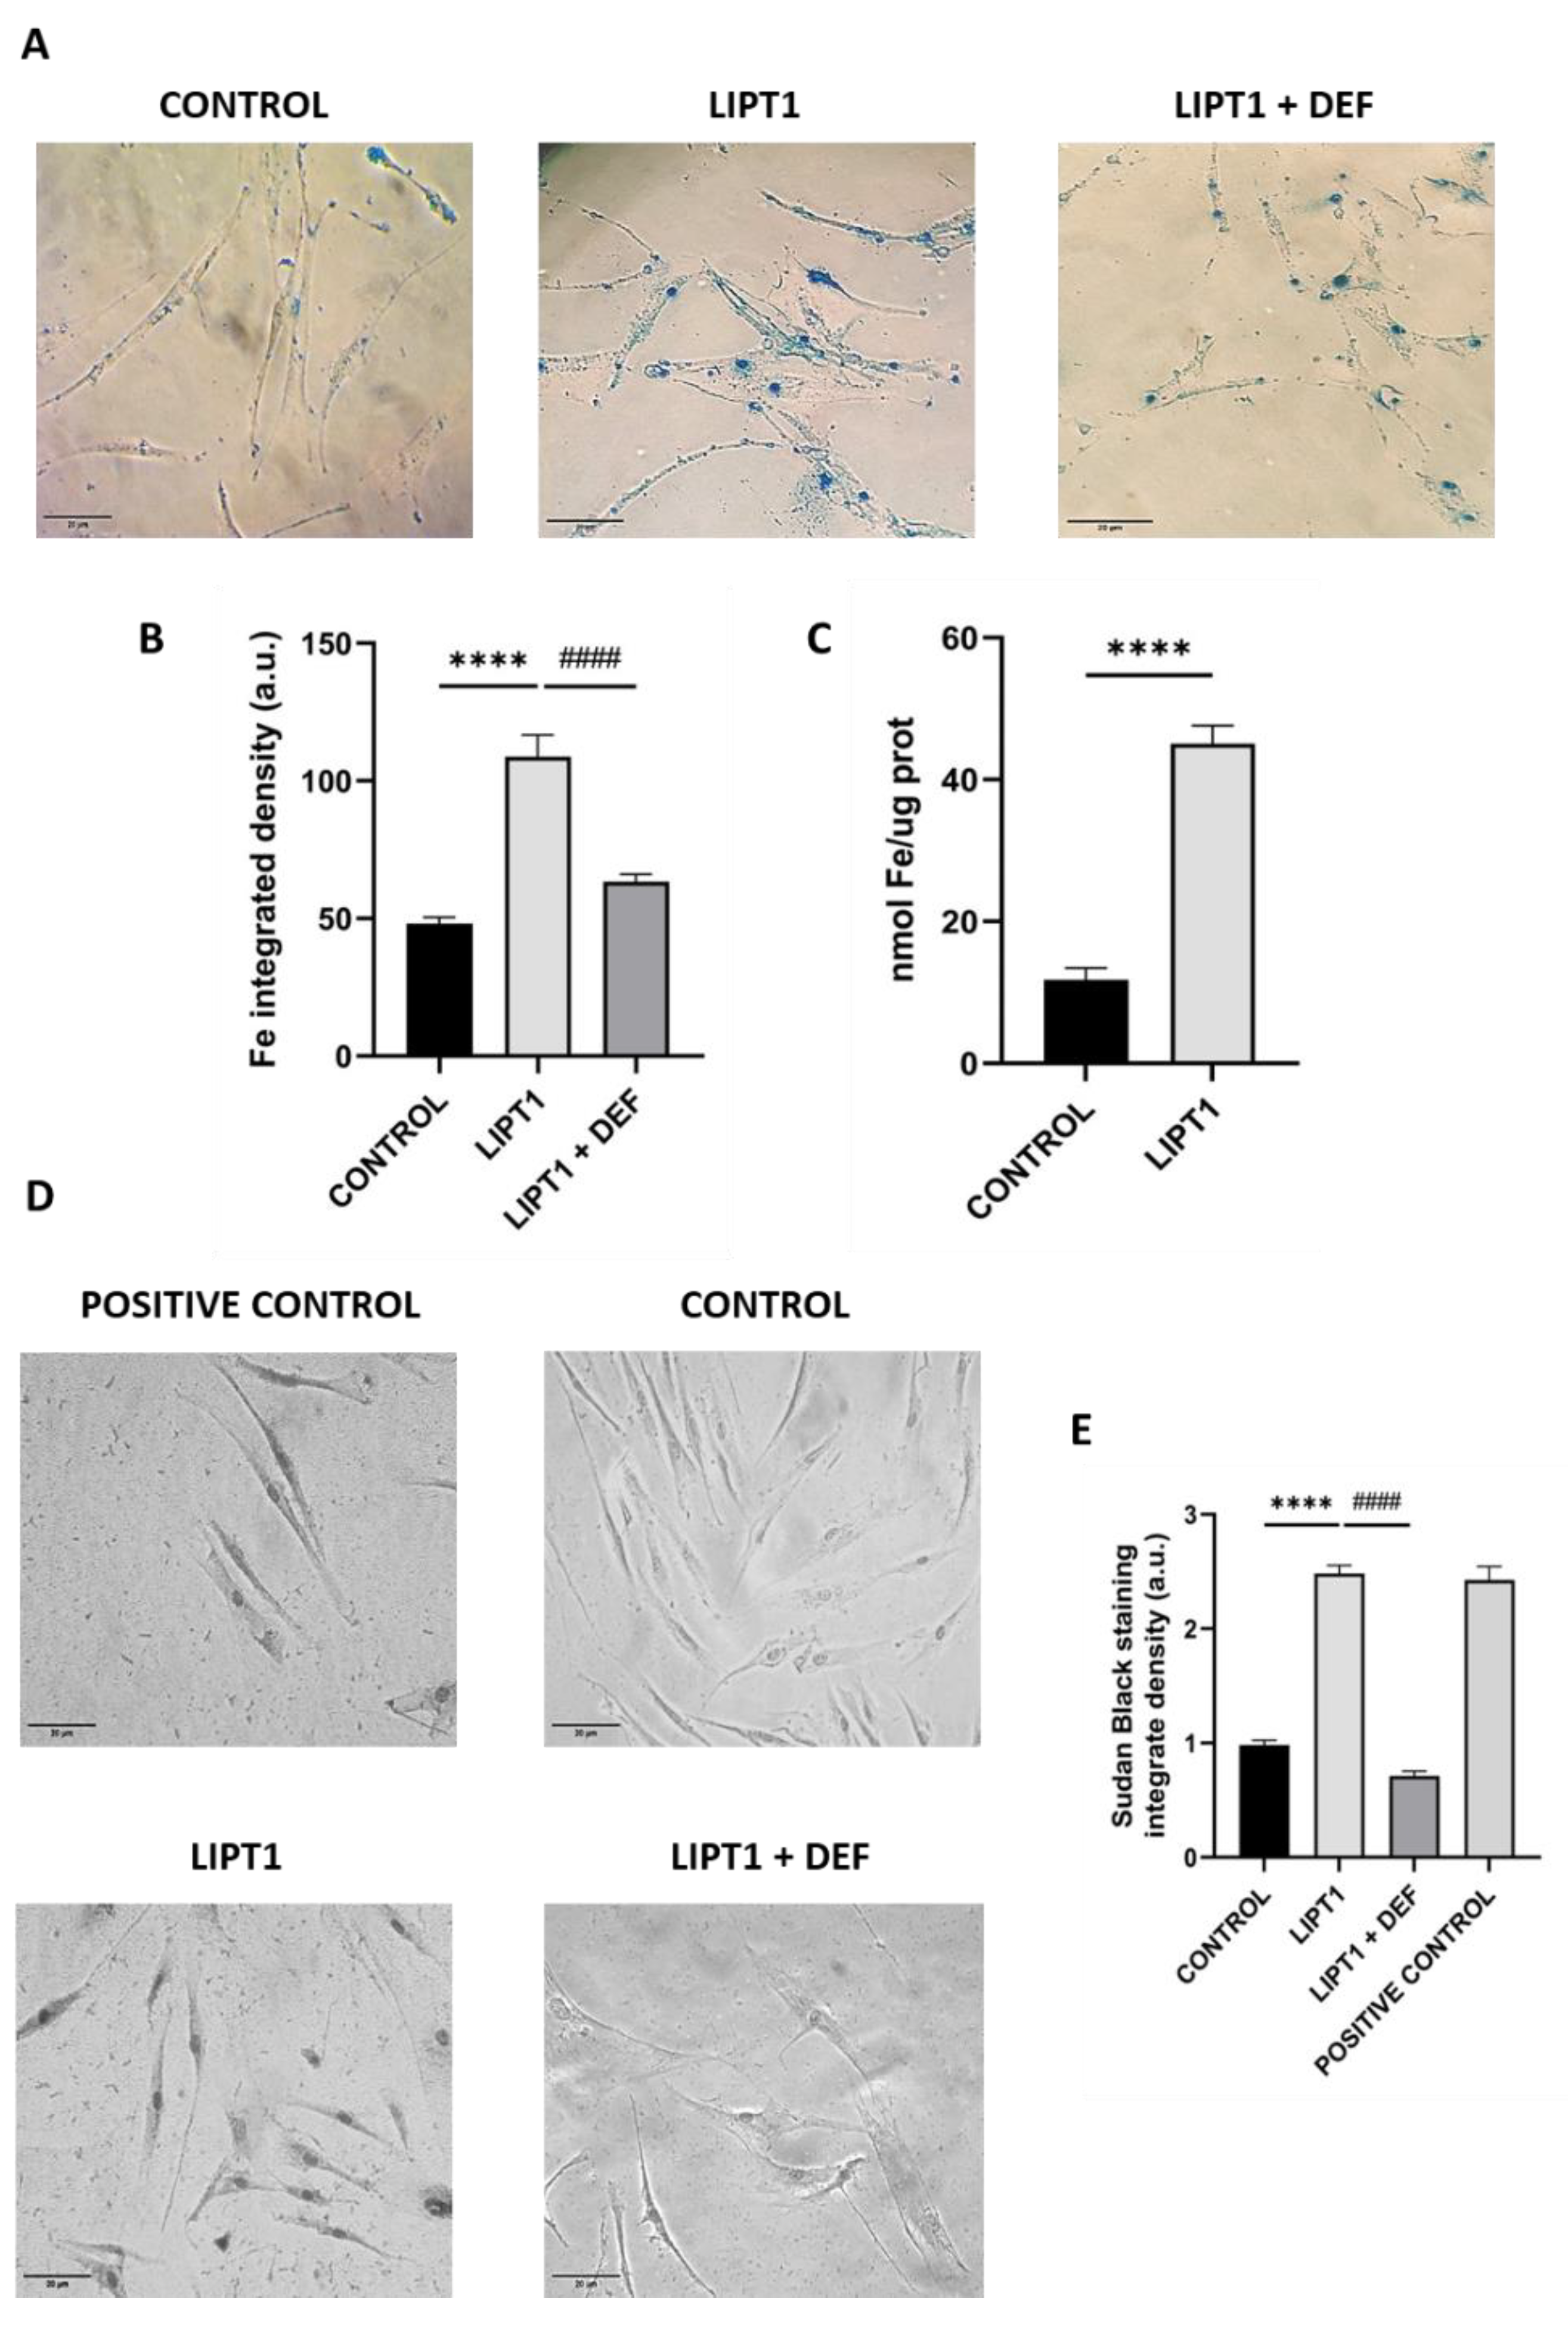
Figure 3.
Quantification of proliferation ratio of control and mutant cells in galactose medium. Cells were seeded in glucose medium and treated with CocT and α-LA for seven days. After 3-4 days, glucose medium was changed to galactose medium, the treatment was renewed, and images were taken the same day (T0) and 72h later (T72) by BioTek Cytation 1 Cell Imaging Multi- Mode Reader. Proliferation ratio was calculated as number of cells in T72 divided by number of cells in T0, in both control and mutant cells (values > 1: cell proliferation; values = 1: number of cells unchanged; values < 1: cell death). Representative images are included in Supplementary Materials (Figure S1). Data represent the mean±SD of 3 independent experiments. ****p<0.0001 between mutant fibroblasts in glucose medium and mutant fibroblasts in galactose medium. ####p<0.0001 between untreated and treated mutant LIPT1 cells in galactose medium. a.u.: arbitrary units. ns: not significant.
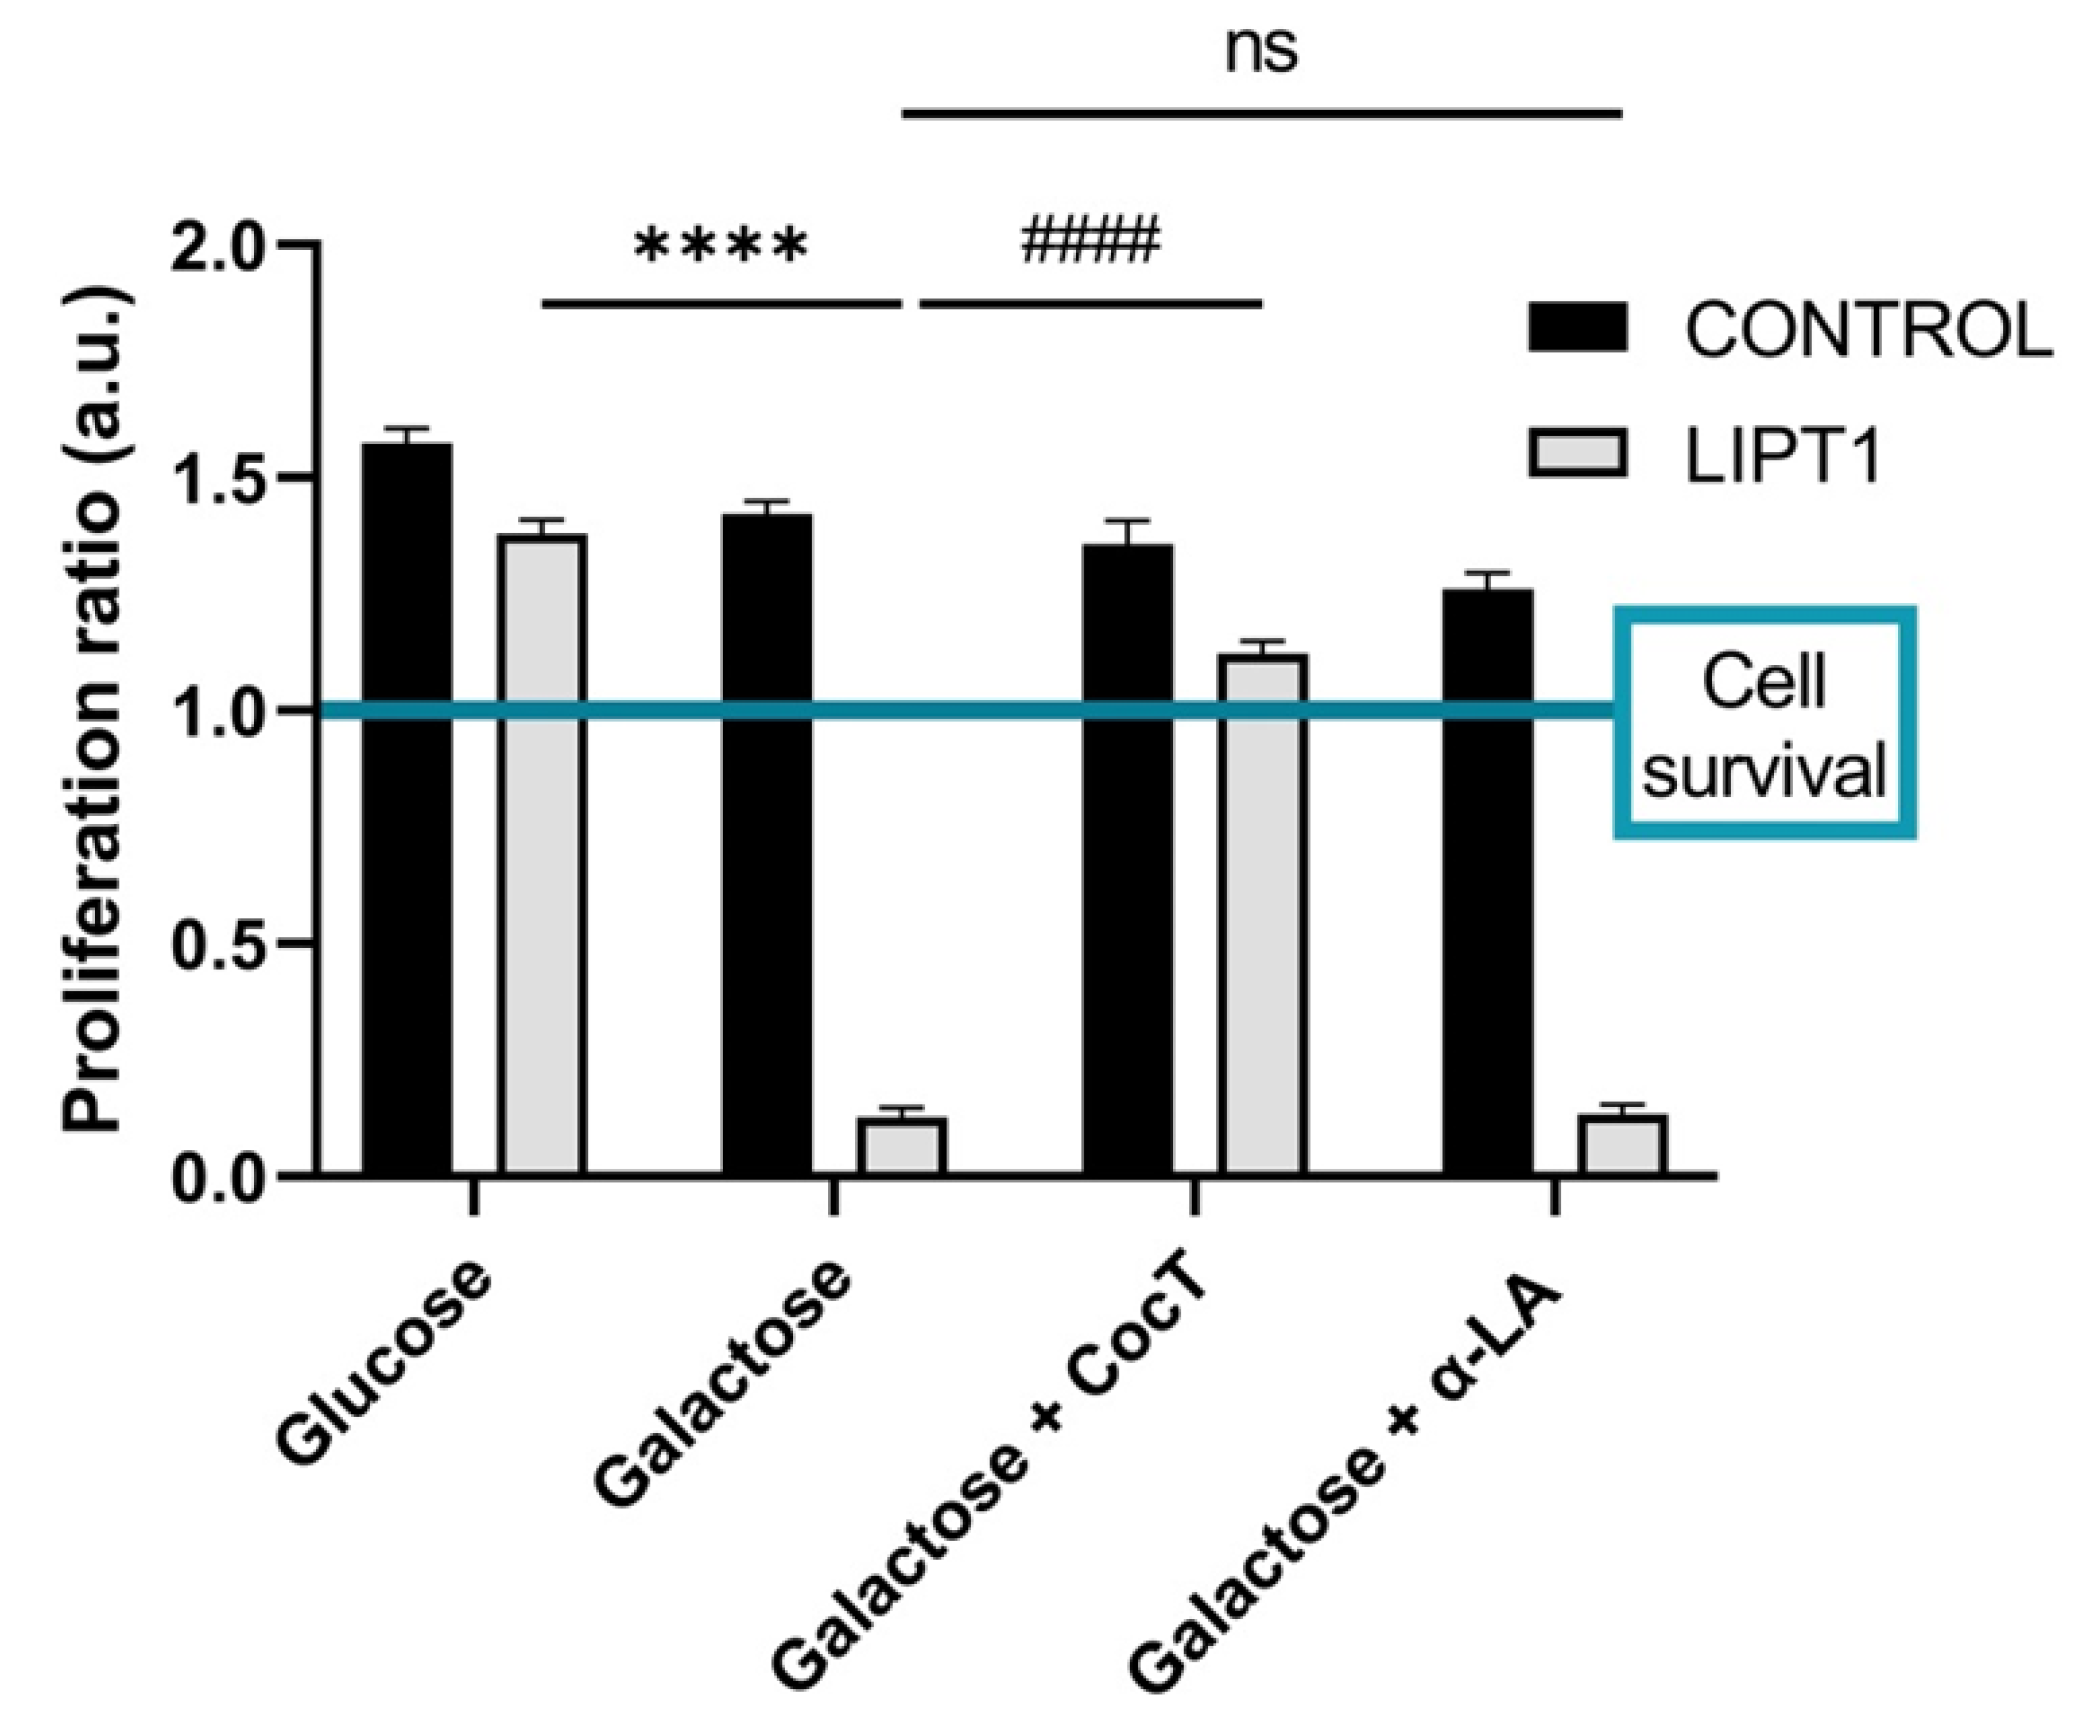
Figure 4.
LIPT1 transcript levels in mutant and control fibroblasts with and without treatment. Fibroblasts were treated with CocT for seven days. Data represent the mean±SD of 3 independent experiments. ****p<0.0001 between control and mutant LIPT1 fibroblasts. ####p<0.0001 between untreated and treated mutant fibroblasts. a.u.: arbitrary units.
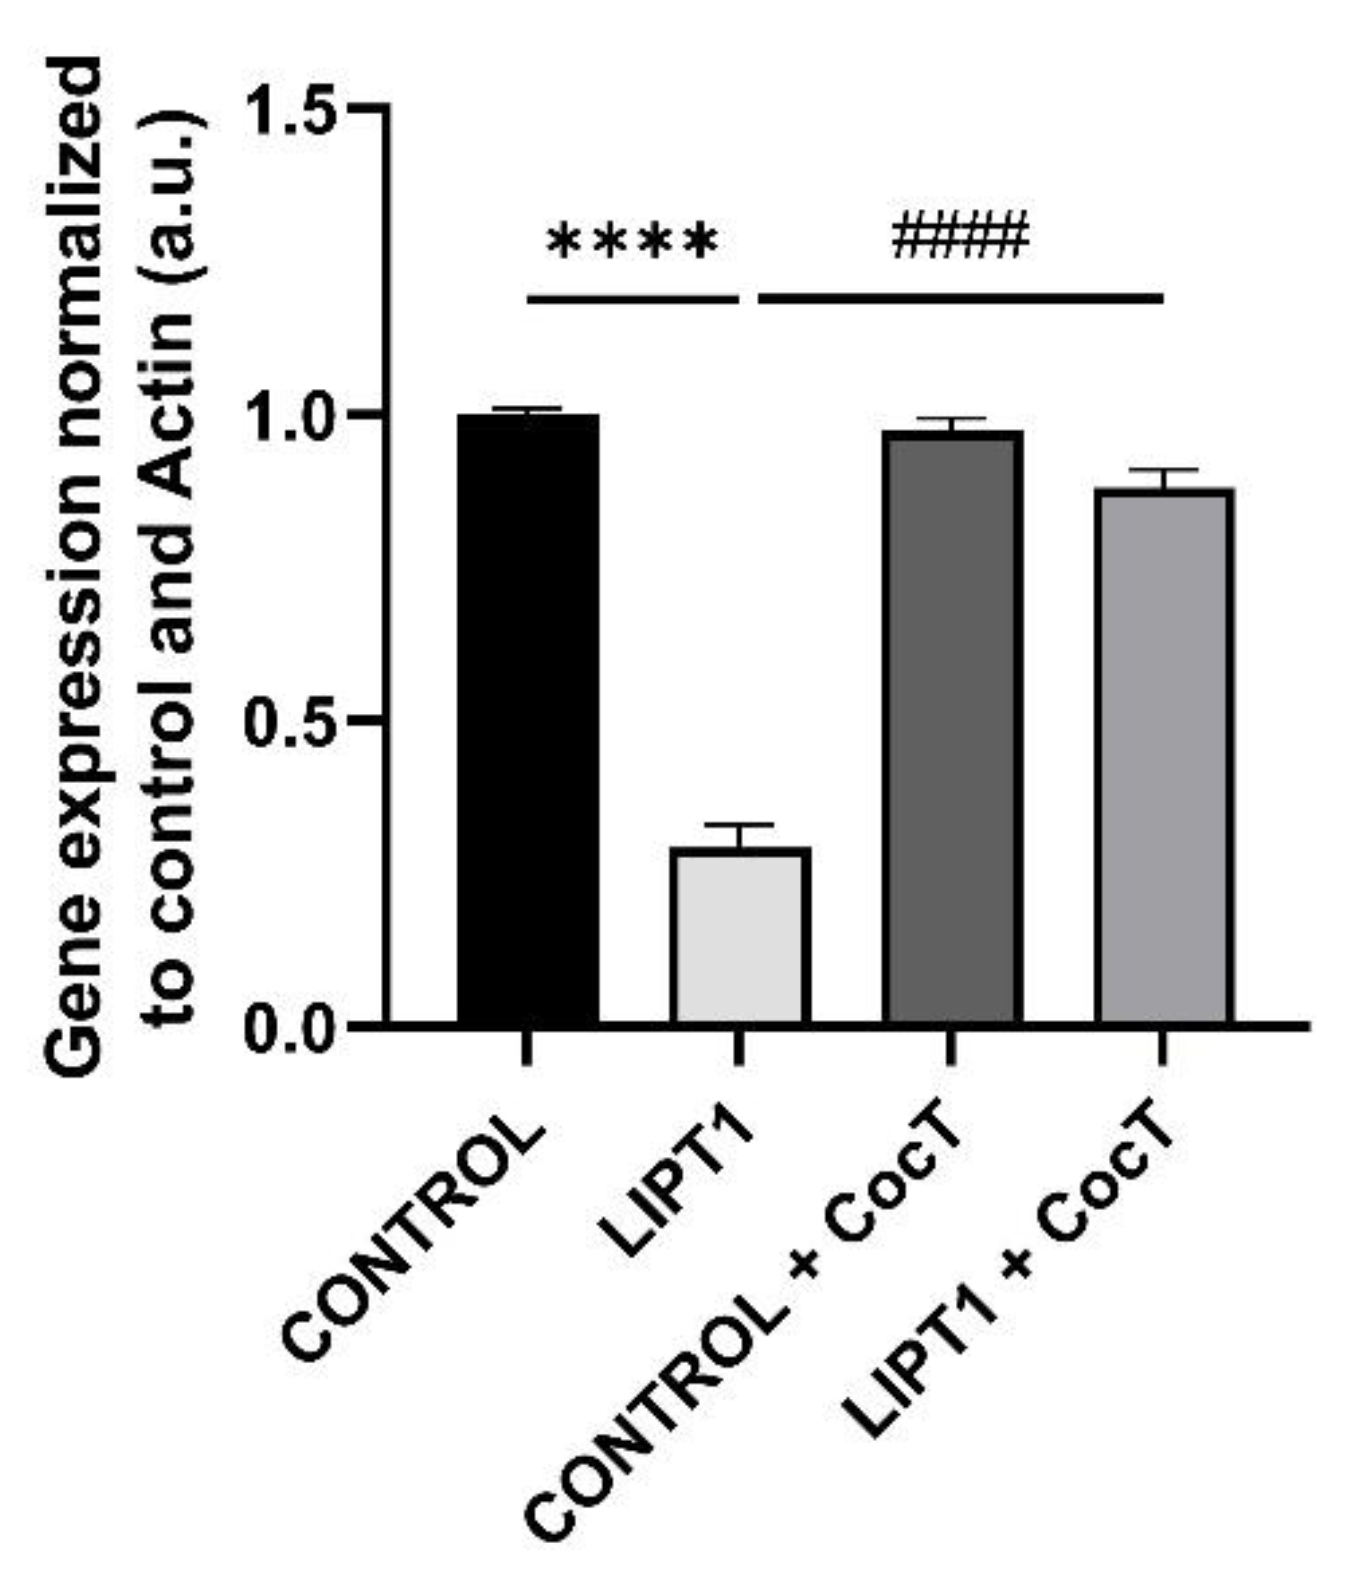
Figure 5.
Expression levels of LIPT1, PDH E2, KGDH E2 and their lipoylated forms in control and mutant fibroblasts before and after the supplementation with CocT. A. Western blot analysis of the mutated protein LIPT1, E2 subunits of complexes PDH and KGDH and their lipoylated forms. B. Band densitometry of Western blot data referred to actin and normalized to the mean of controls. C1 and C2: control cells, P: patient’s cells. C. PDH Complex activity was measured by PDH Enzyme Activity Dipstick Assay Kit. C: control cells. D. Band intensity of PDH Complex activity was obtained by ImageLab software. E. KGDH activity was measured by α-Ketoglutarate Dehydrogenase Activity Assay Kit. Data represent the mean±SD of 3 independent experiments. *p<0.05, **p<0.01, ***p<0.001 and ****p<0.0001 between control and mutant LIPT1 fibroblasts. ##p<0.01, ###p<0.001 and ####p<0.0001 between untreated and treated mutant LIPT1 fibroblasts. a.u.: arbitrary units.
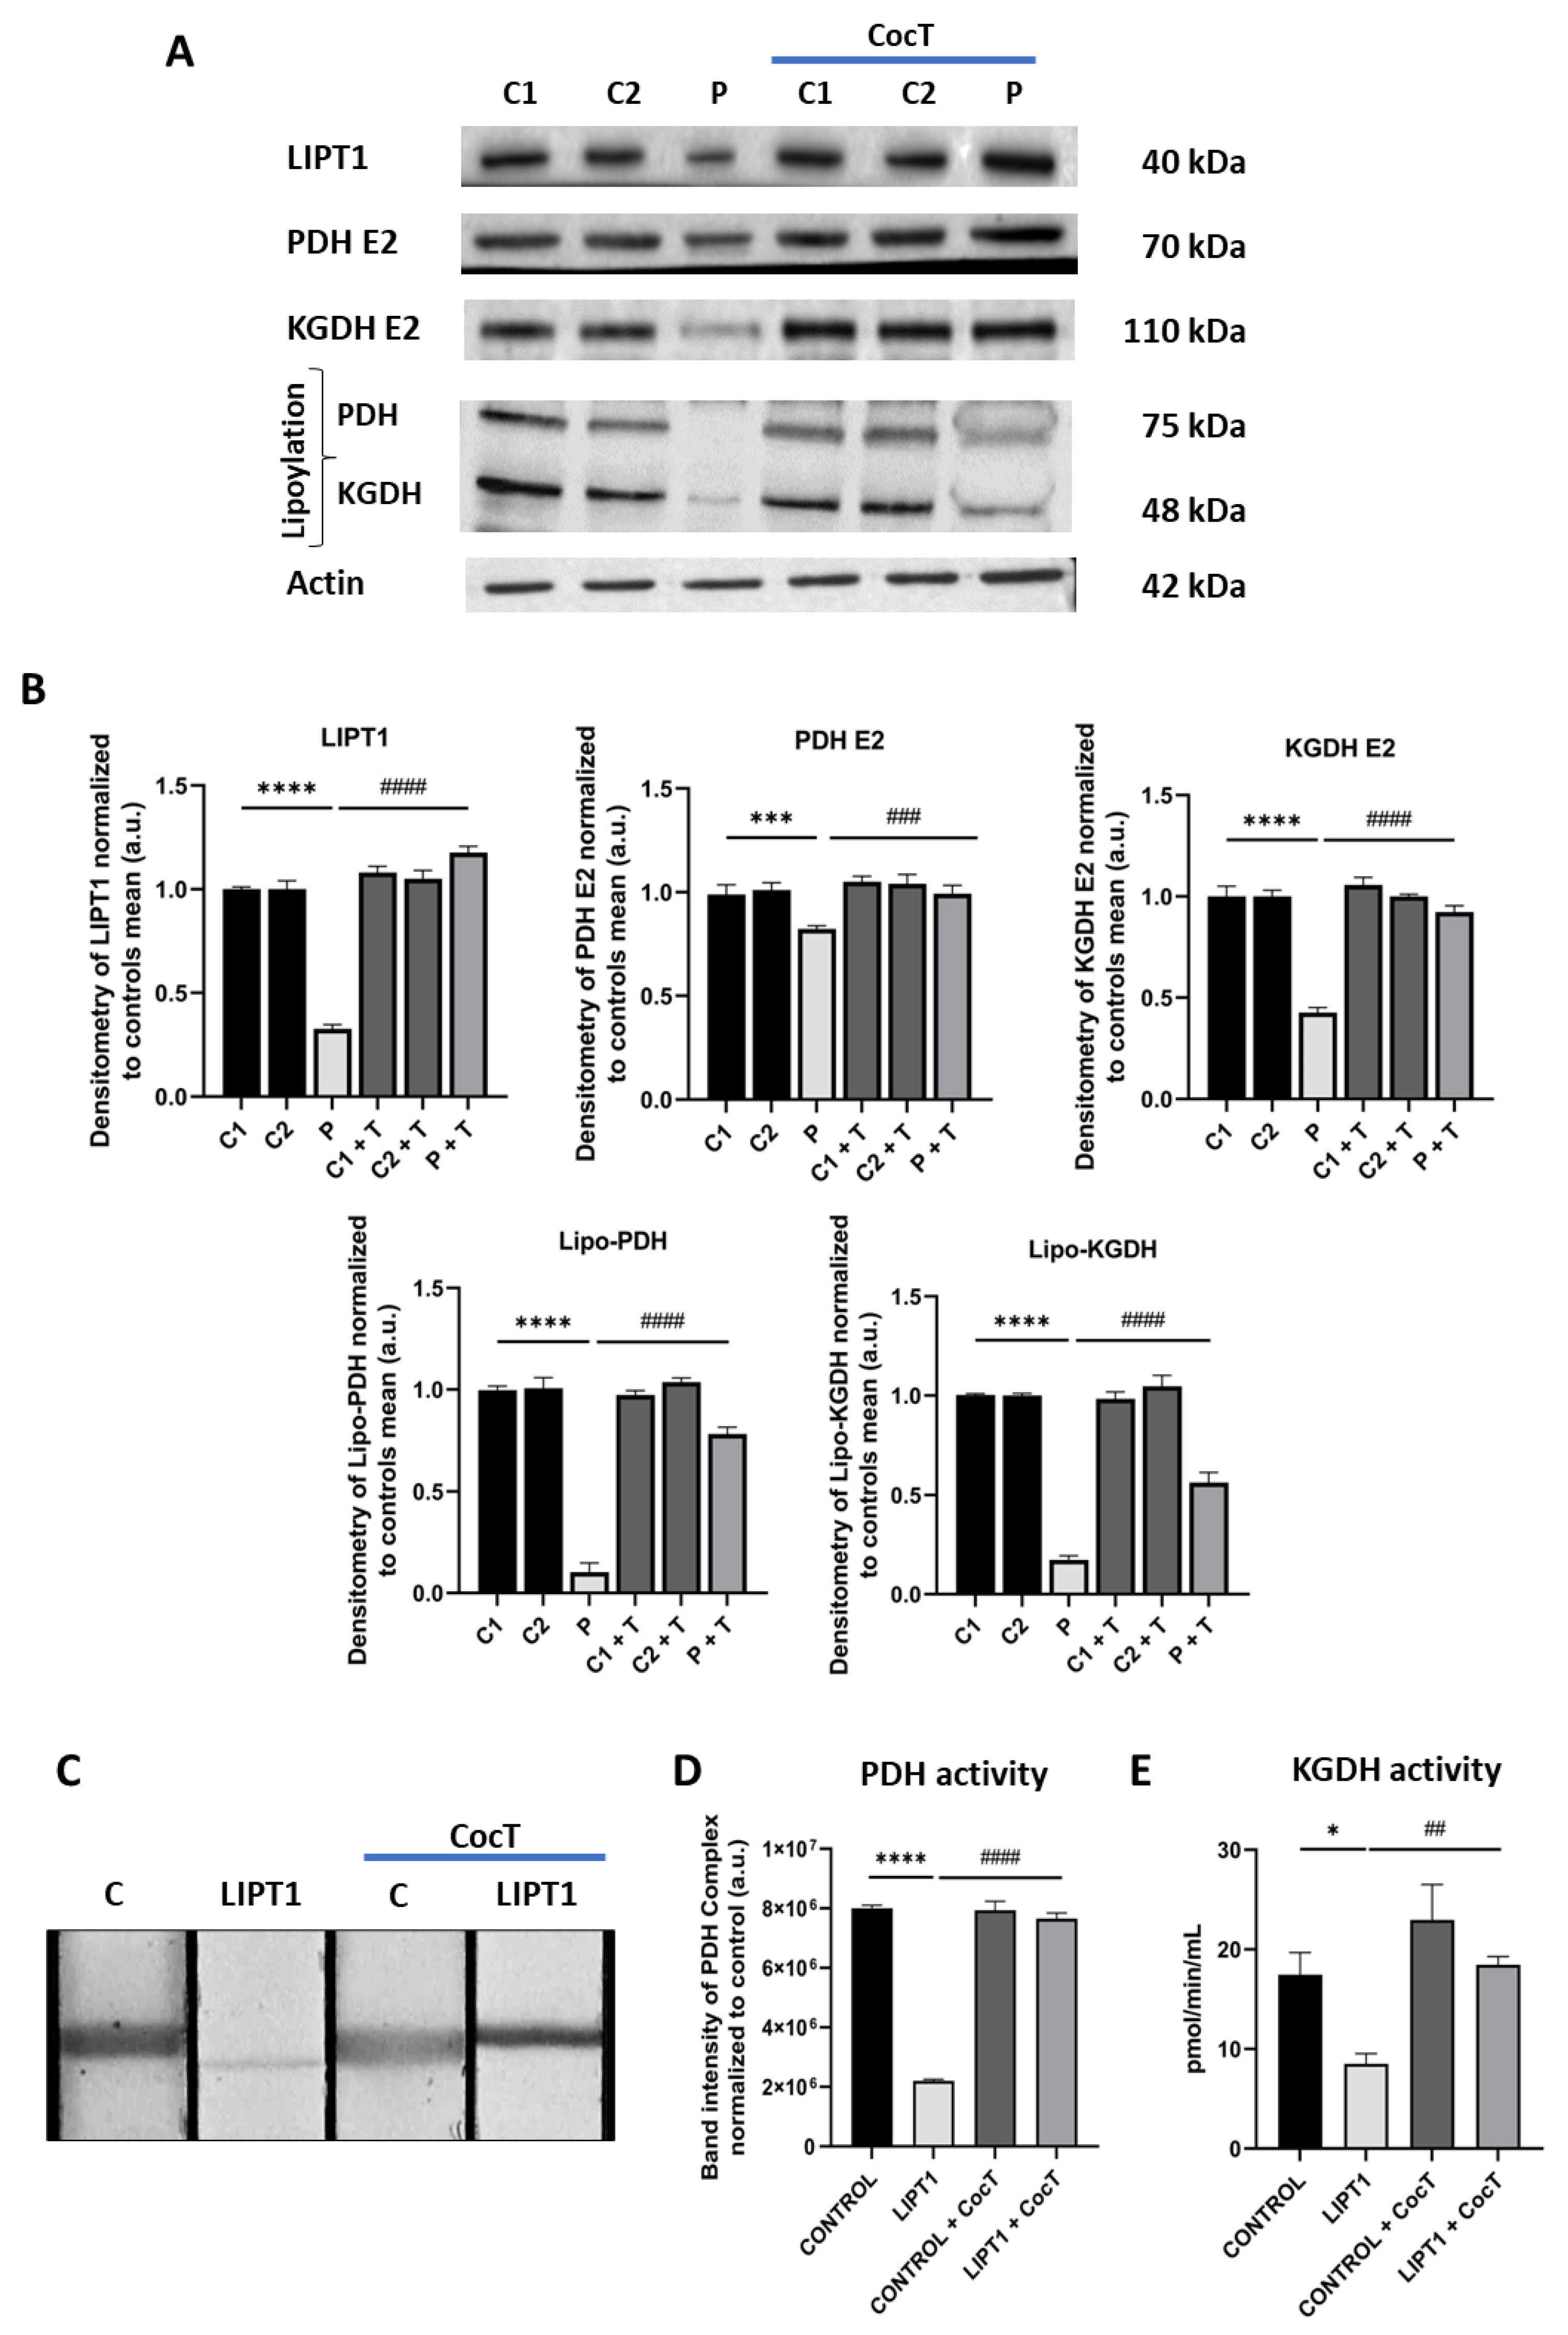
Figure 6.
Effect of CocT on iron accumulation in mutant LIPT1 fibroblasts. A. Control and patient’s fibroblasts were stained with Prussian Blue staining. B. Lipofuscin accumulation was assessed by Sudan Black staining. To confirm Prussian Blue staining specificity, patient’s fibroblasts were treated with 100 µM Deferiprone (DEF) for 24 hours. A PKAN (Pantothenate kinase associated neurodegeneration) cell line was used as a positive control of lipofuscin accumulation [39]. Representative images were acquired by Zeiss Axio Vert V1 microscope (at least 30 images were analyzed per each condition and experiment). Scale bar: 20 µm. C. Quantification of Prussian Blue Staining. Images were analyzed by Image J software (versión 1.53t) (at least 30 images were analyzed per each condition and experiment). D. Quantification of iron content by ICP-MS. E. Quantification of Sudan Black staining integrate density. Data represent the mean±SD of 3 independent experiments. ****p<0.0001 between control and mutant LIPT1 fibroblasts. ####p<0.0001 between untreated and treated mutant LIPT1 fibroblasts. aaaap<0.0001 between untreated and treated mutant LIPT1 fibroblasts with Deferiprone. a.u.: arbitrary units.
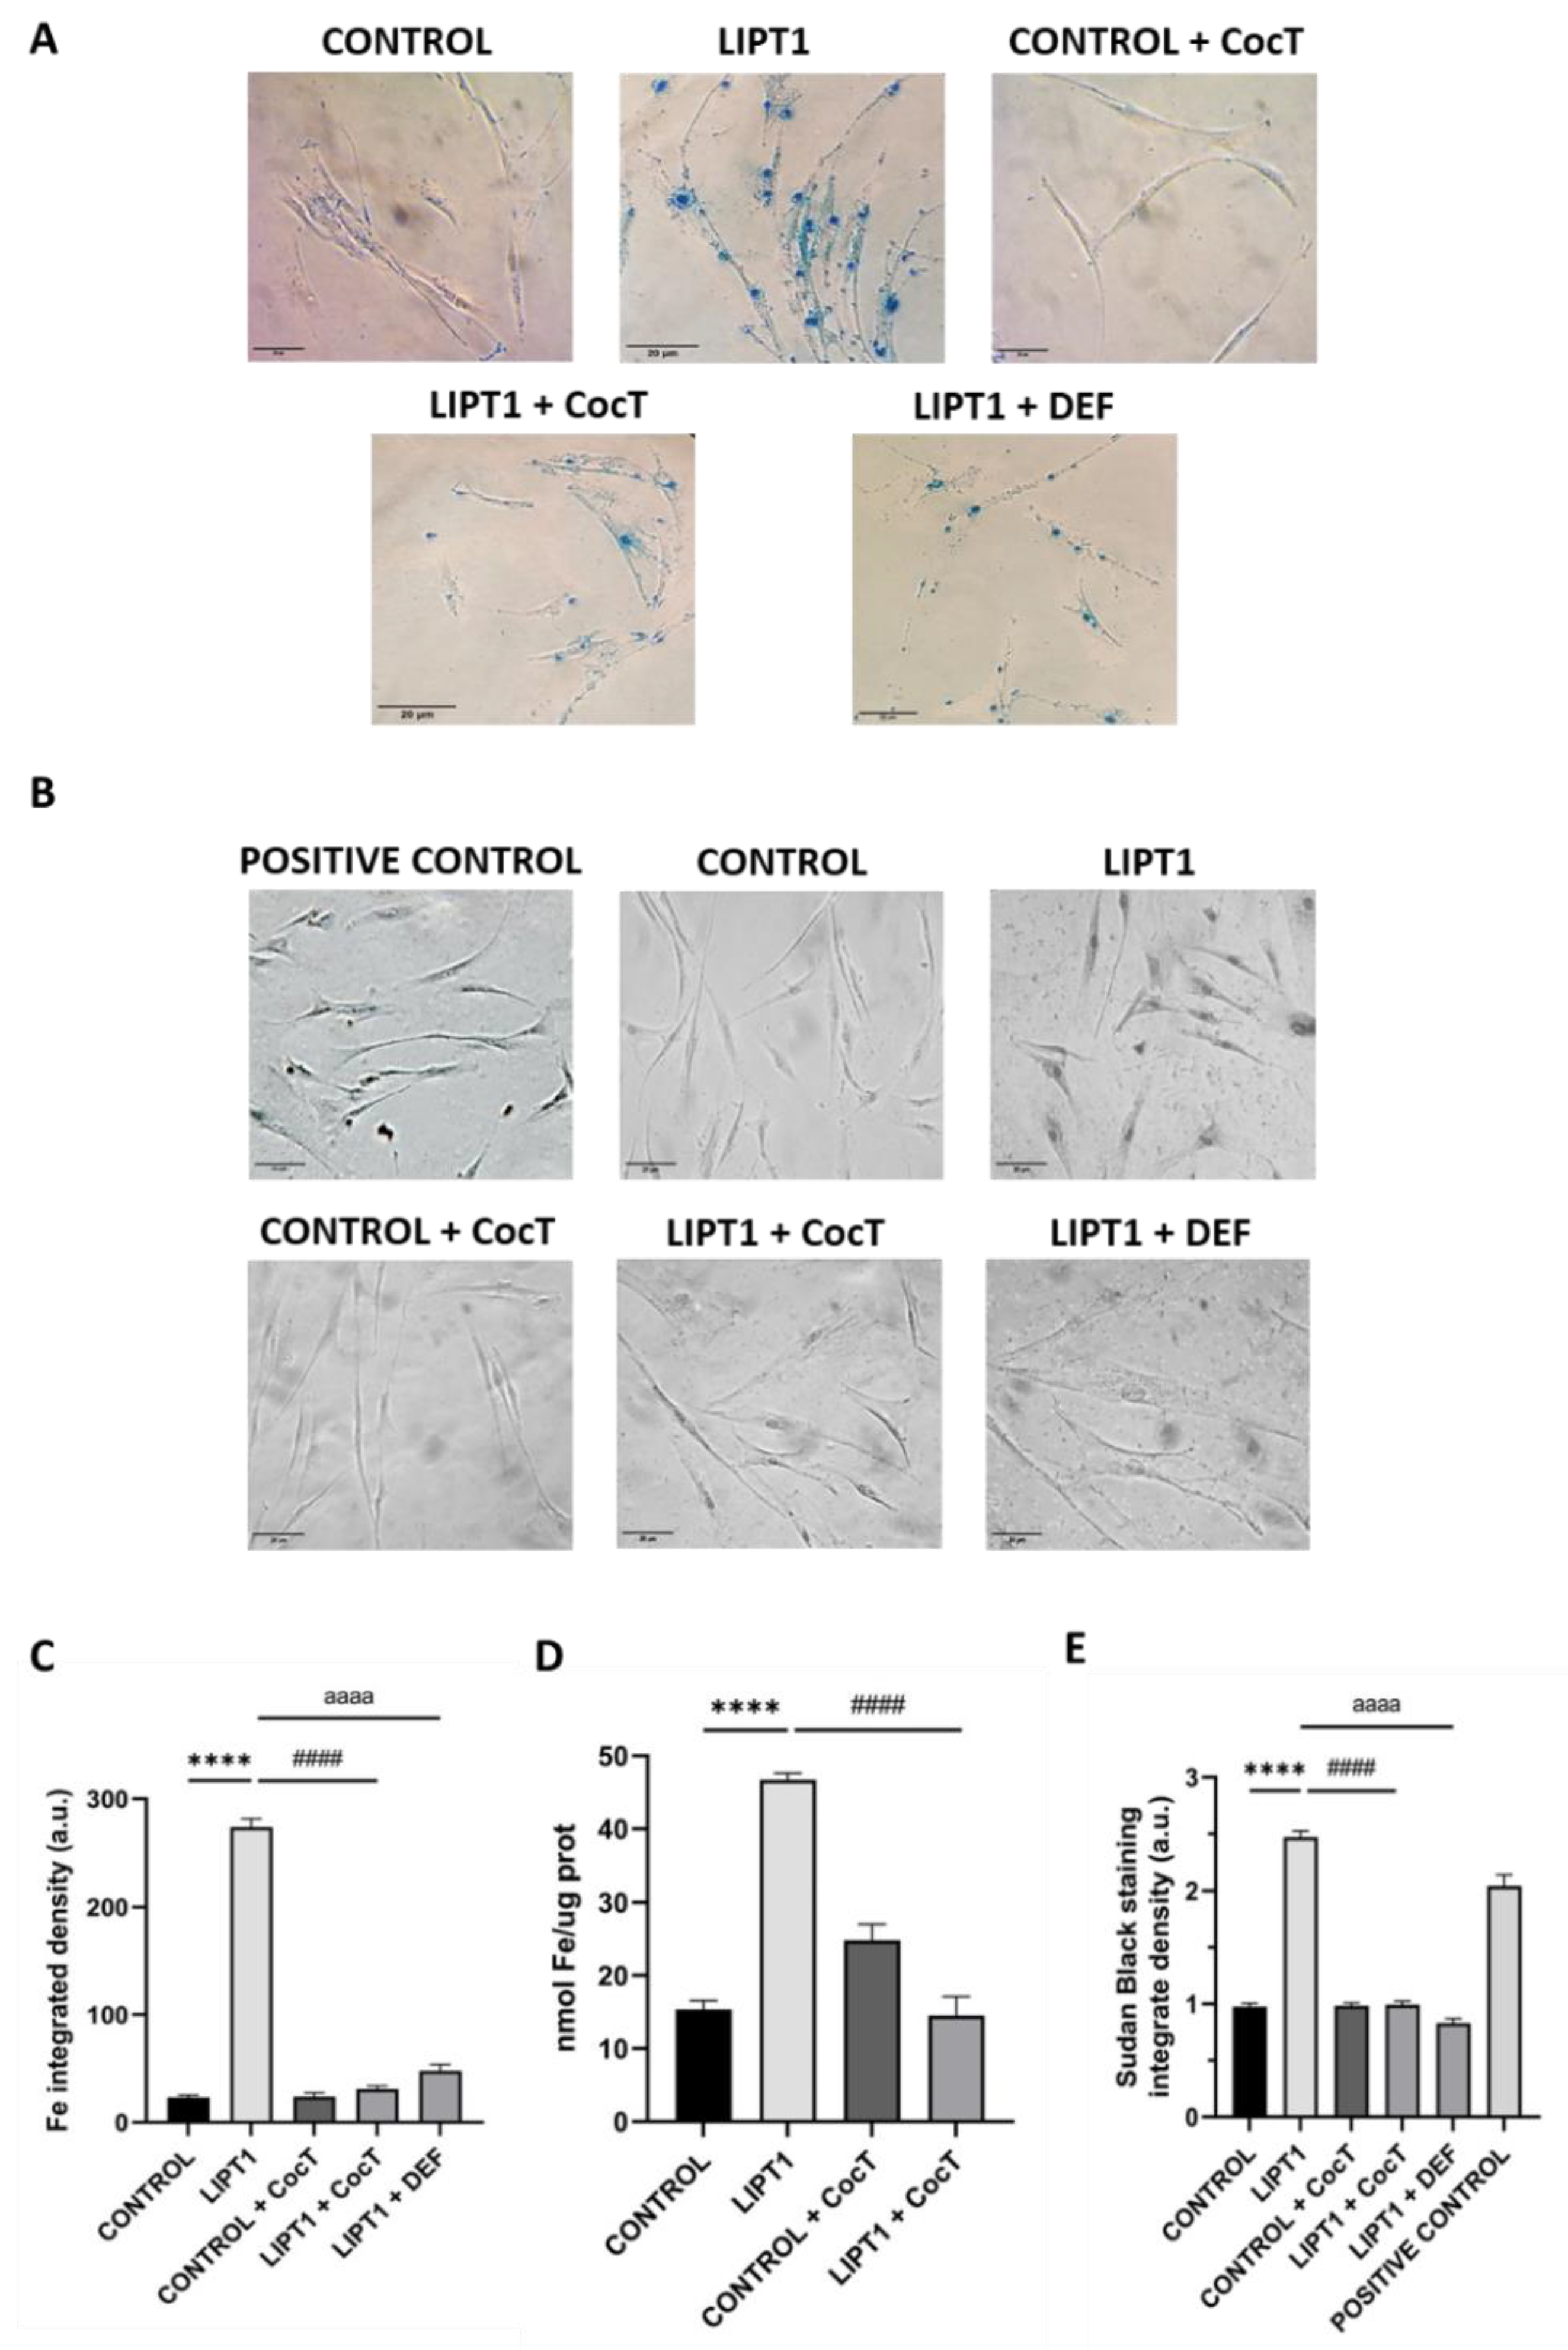
Figure 7.
Electron microscopy images of control and patient’s fibroblasts (LIPT1), both untreated and treated with CocT. A. Representative electron microscopy images. Scale bar: 2 µm. Red arrows: lipofuscin-like granules. B. Quantification of lipofuscin-like aggregates per cell (at least 30 images were analyzed per each condition and experiment). Data represent the mean±SD of 3 independent experiments. ****p<0.0001 between control and mutant LIPT1 fibroblasts. ####p<0.0001 between untreated and treated mutant LIPT1 fibroblasts. Magnified images are shown in Figure S6.
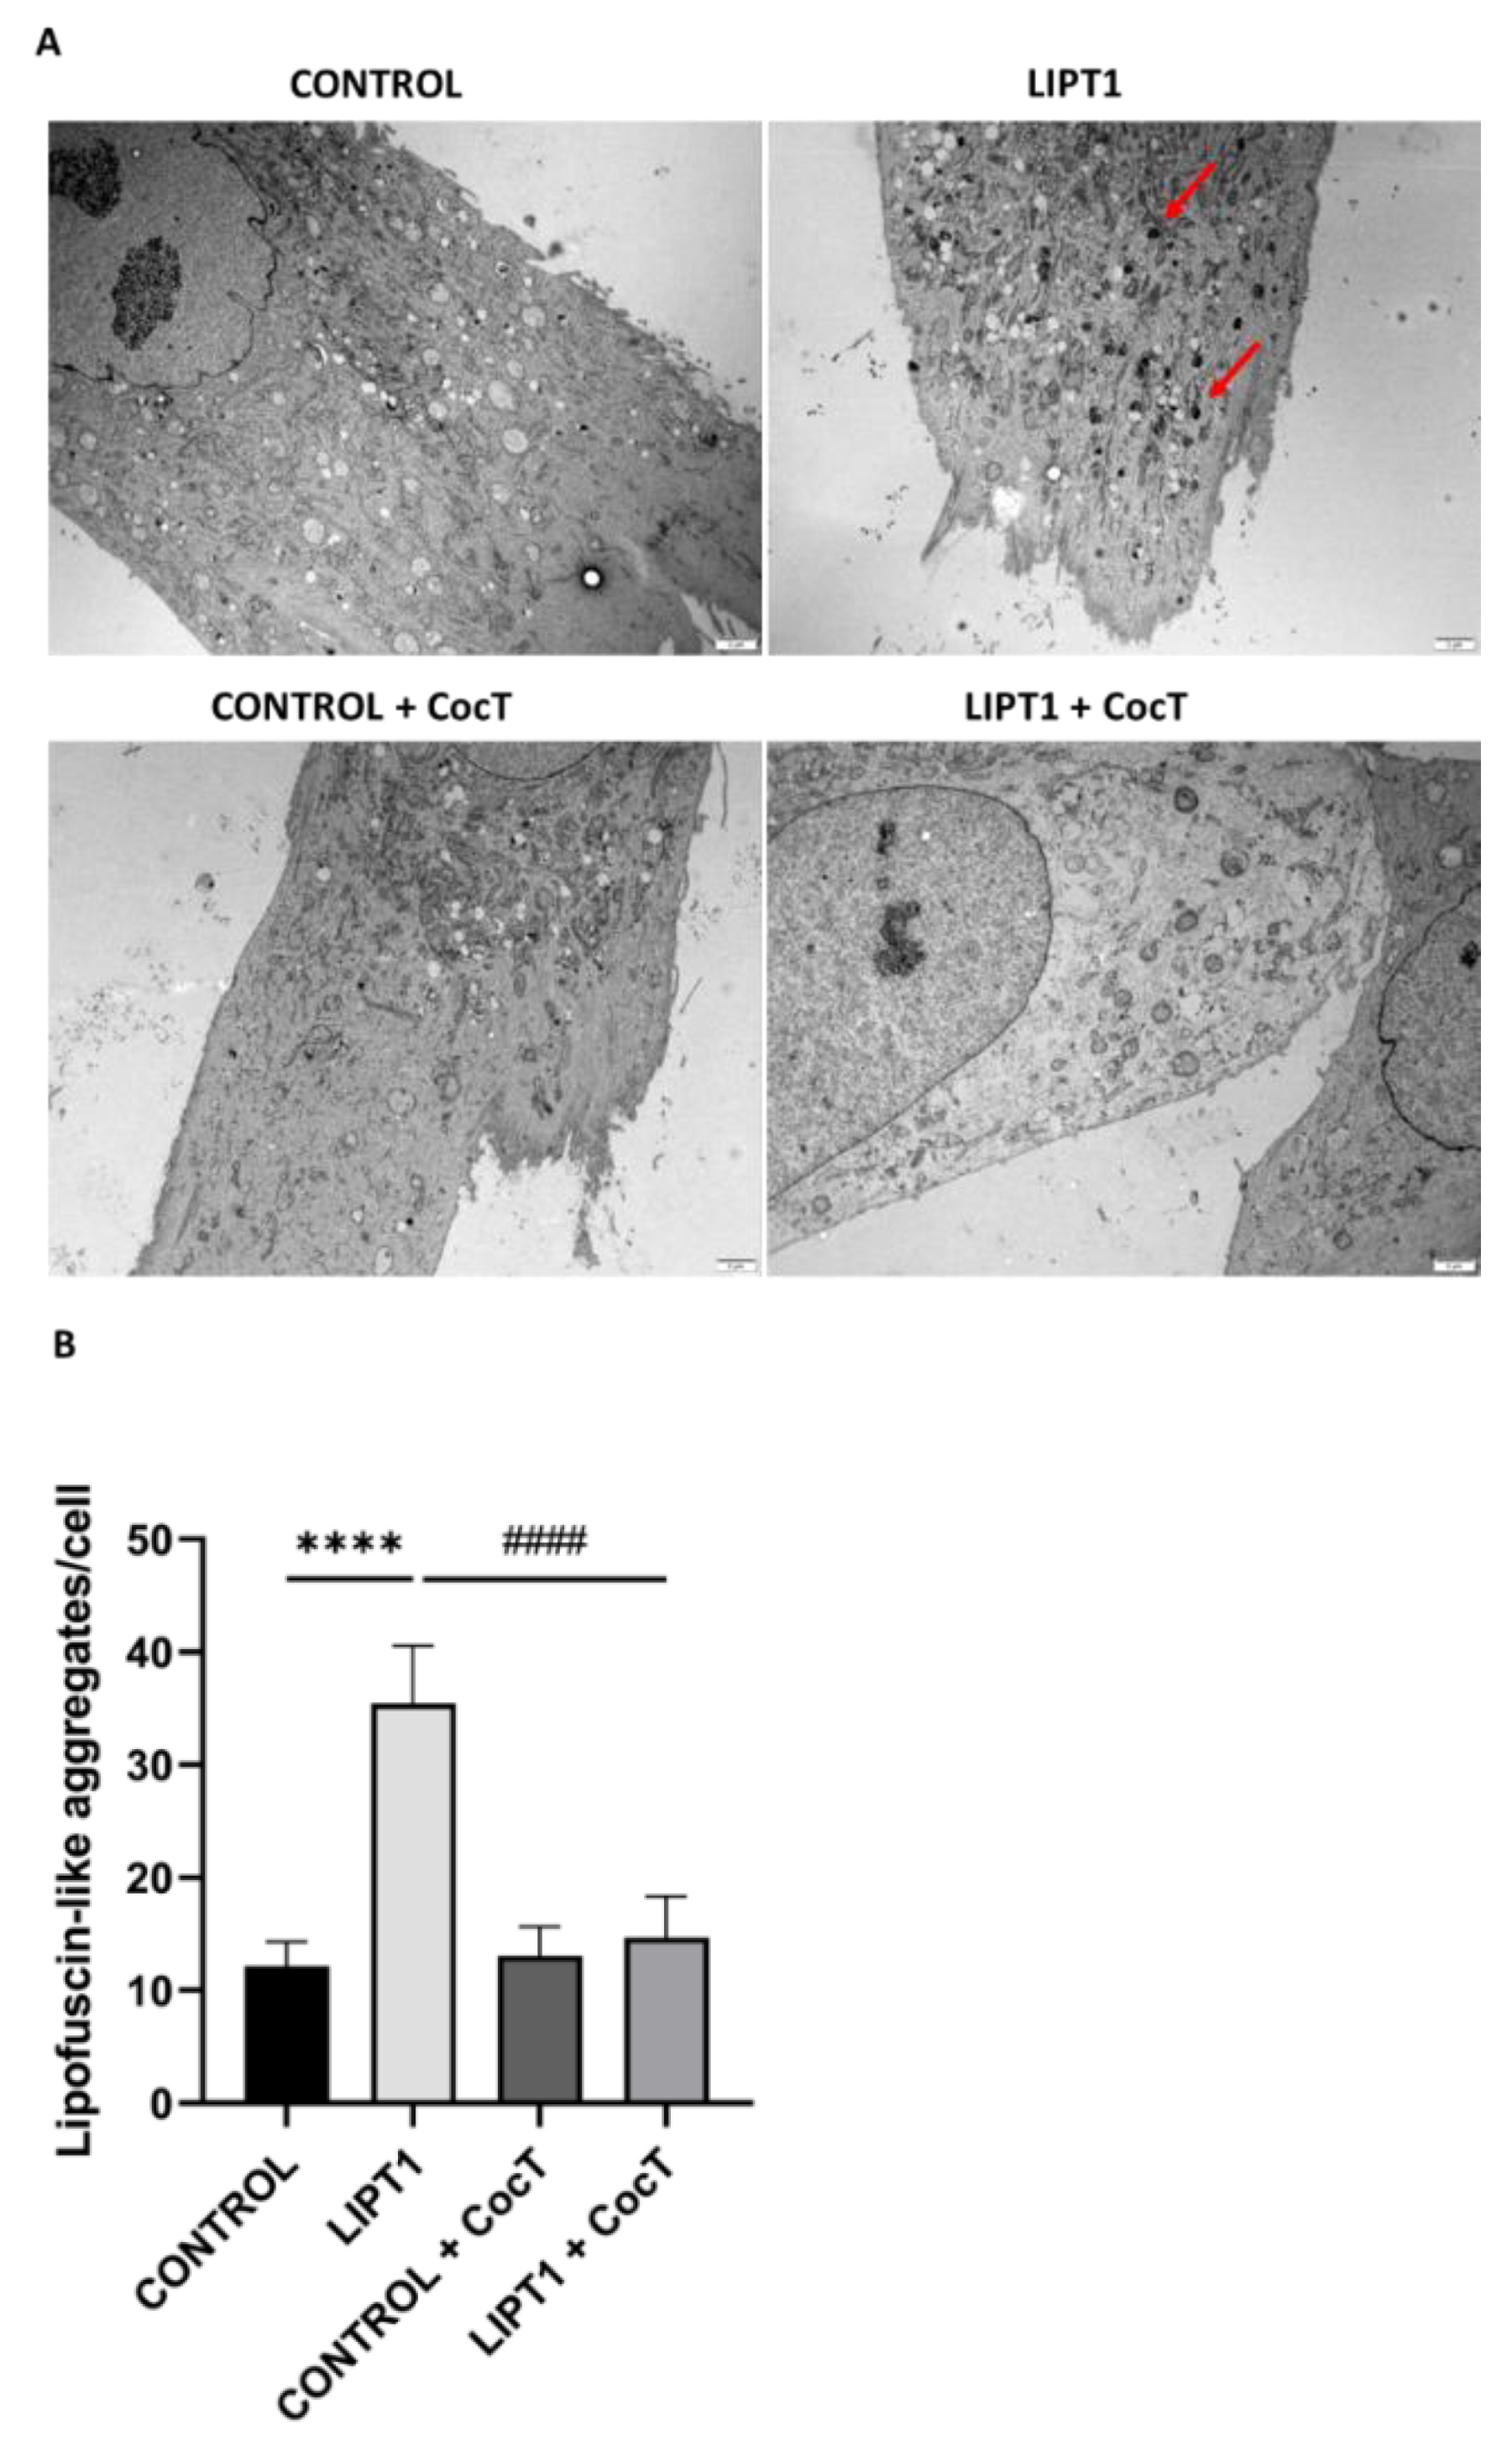
Figure 8.
Effect of CocT on protein lipoylation. Immunofluorescence assay was performed in both untreated and treated control and mutant fibroblasts. Cells were treated with CocT for seven days. A. Representative images were acquired from DeltaVision microscope. Treated and untreated cells were fixed and immunostained with anti-LA antibody. TOMM20 was used as mitochondrial marker and nuclei were visualized with DAPI staining. Scale bar: 15 µm. B. Quantification of fluorescence intensity of lipoic acid antibody. Images were analyzed by Image J software (version 1.53t) (at least 30 images were taken and analyzed from each condition and experiment). C. The colocalization between lipoic acid and TOMM20 signals was analyzed by Pearson correlation coefficient. Pearson correlation coefficient was calculated by DeltaVision system. Data represent mean±SD of 3 independent experiments. ****p<0.0001 between control and mutant LIPT1 fibroblasts. ####p<0.0001 between untreated and treated mutant LIPT1 fibroblasts. a.u.: arbitrary units.
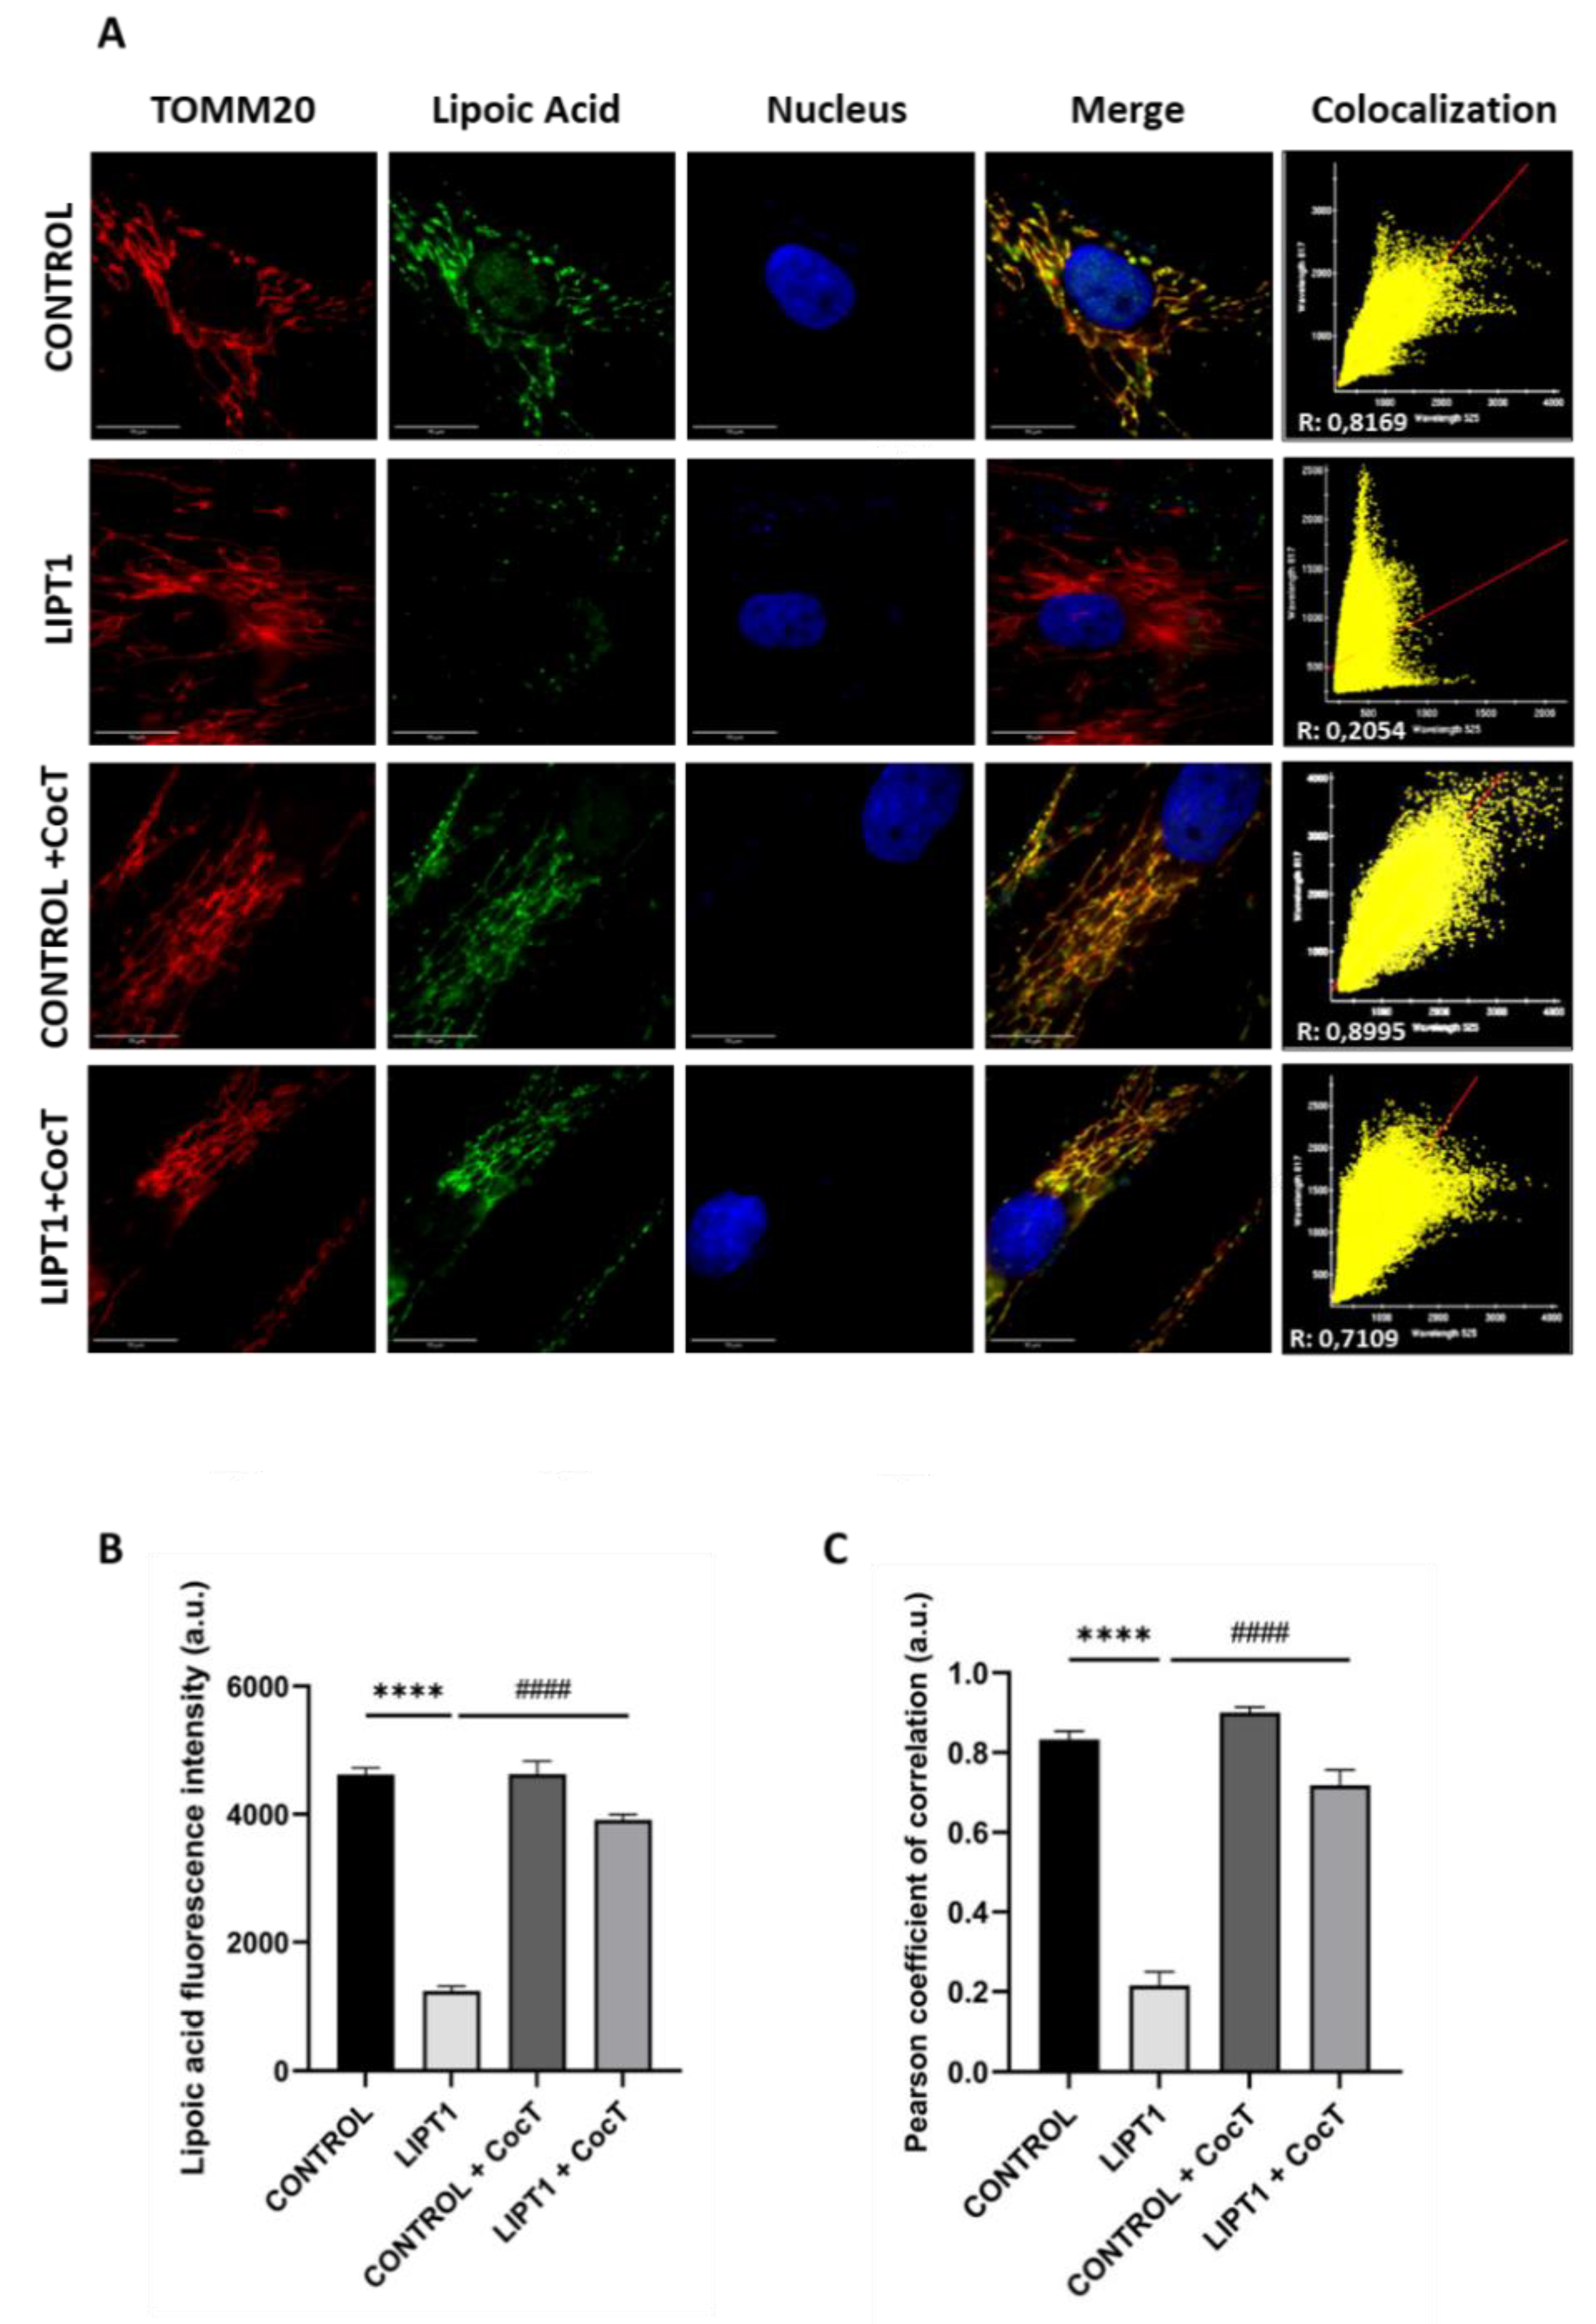
Figure 9.
Effect of CocT on the expression levels of subunits of the mtETC complexes in control and mutant cells, both untreated and treated with CocT. A. Western blot analysis of proteins of Complex I (NDUFA9 and mt-ND6), Complex III (UQCRC1), Complex IV (mt-CO2 and Cox IV) and Complex V (ATP5F1A). VDAC was used as a mitochondrial mass marker. B. Band densitometry of Western blot data referred to actin and normalized to the mean of controls. C1 and C2: control cells, P: patient’s cells. Data represent the mean±SD of 3 independent experiments. *p<0.05, **p<0.01 and ****p<0.0001 between control and mutant LIPT1 fibroblasts. #p<0.05, ###p<0.001 and ####p<0.0001 between untreated and treated mutant LIPT1 fibroblasts. a.u.: arbitrary units. ns: not significant.
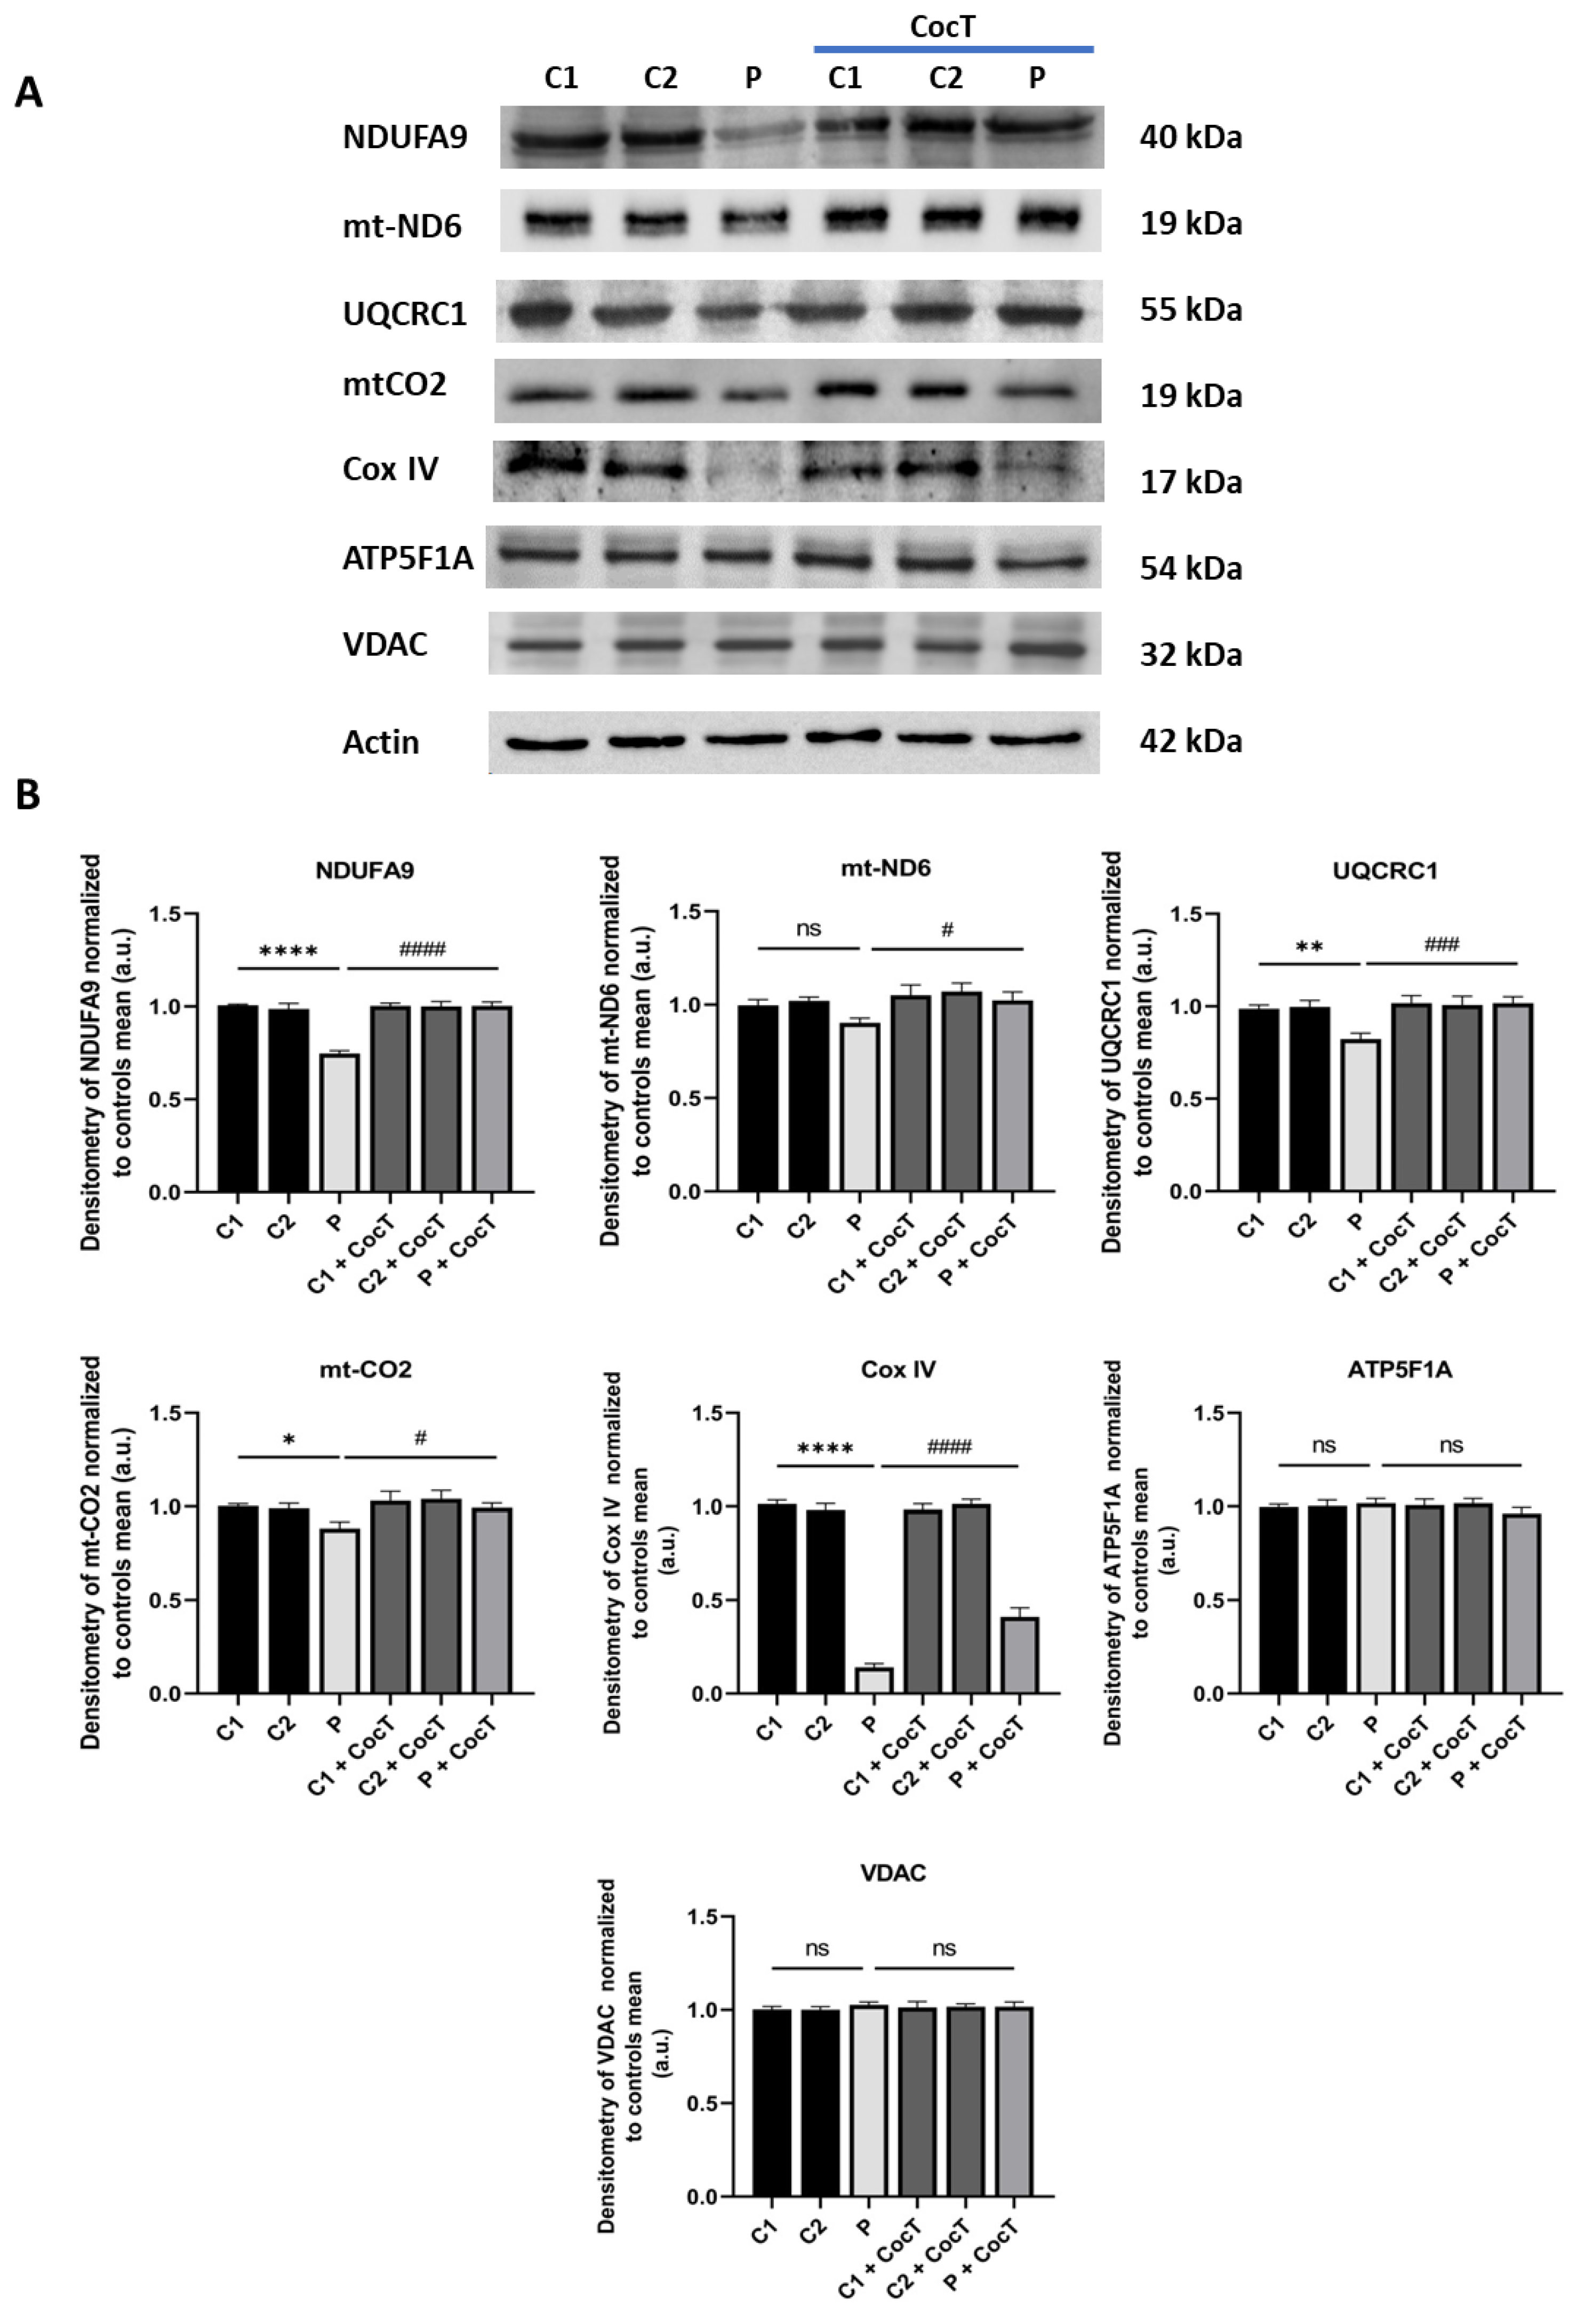
Figure 10.
Effect of CocT on Mitostress bioenergetic assay in both untreated and treated control and mutant fibroblasts. Mitochondrial respiration profile was measured using a Seahorse XFe24 analyzer. Fibroblasts were treated with CocT for seven days. Data represent the mean±SD of 3 independent experiments. **p<0.01, ***p<0.001 and ****p<0.0001 between control and mutant LIPT1 fibroblasts. ###p<0.001 and ####p<0.0001 between untreated and treated mutant LIPT1 fibroblasts. OCR: Oxygen Consumption Rate. ns: not significant.
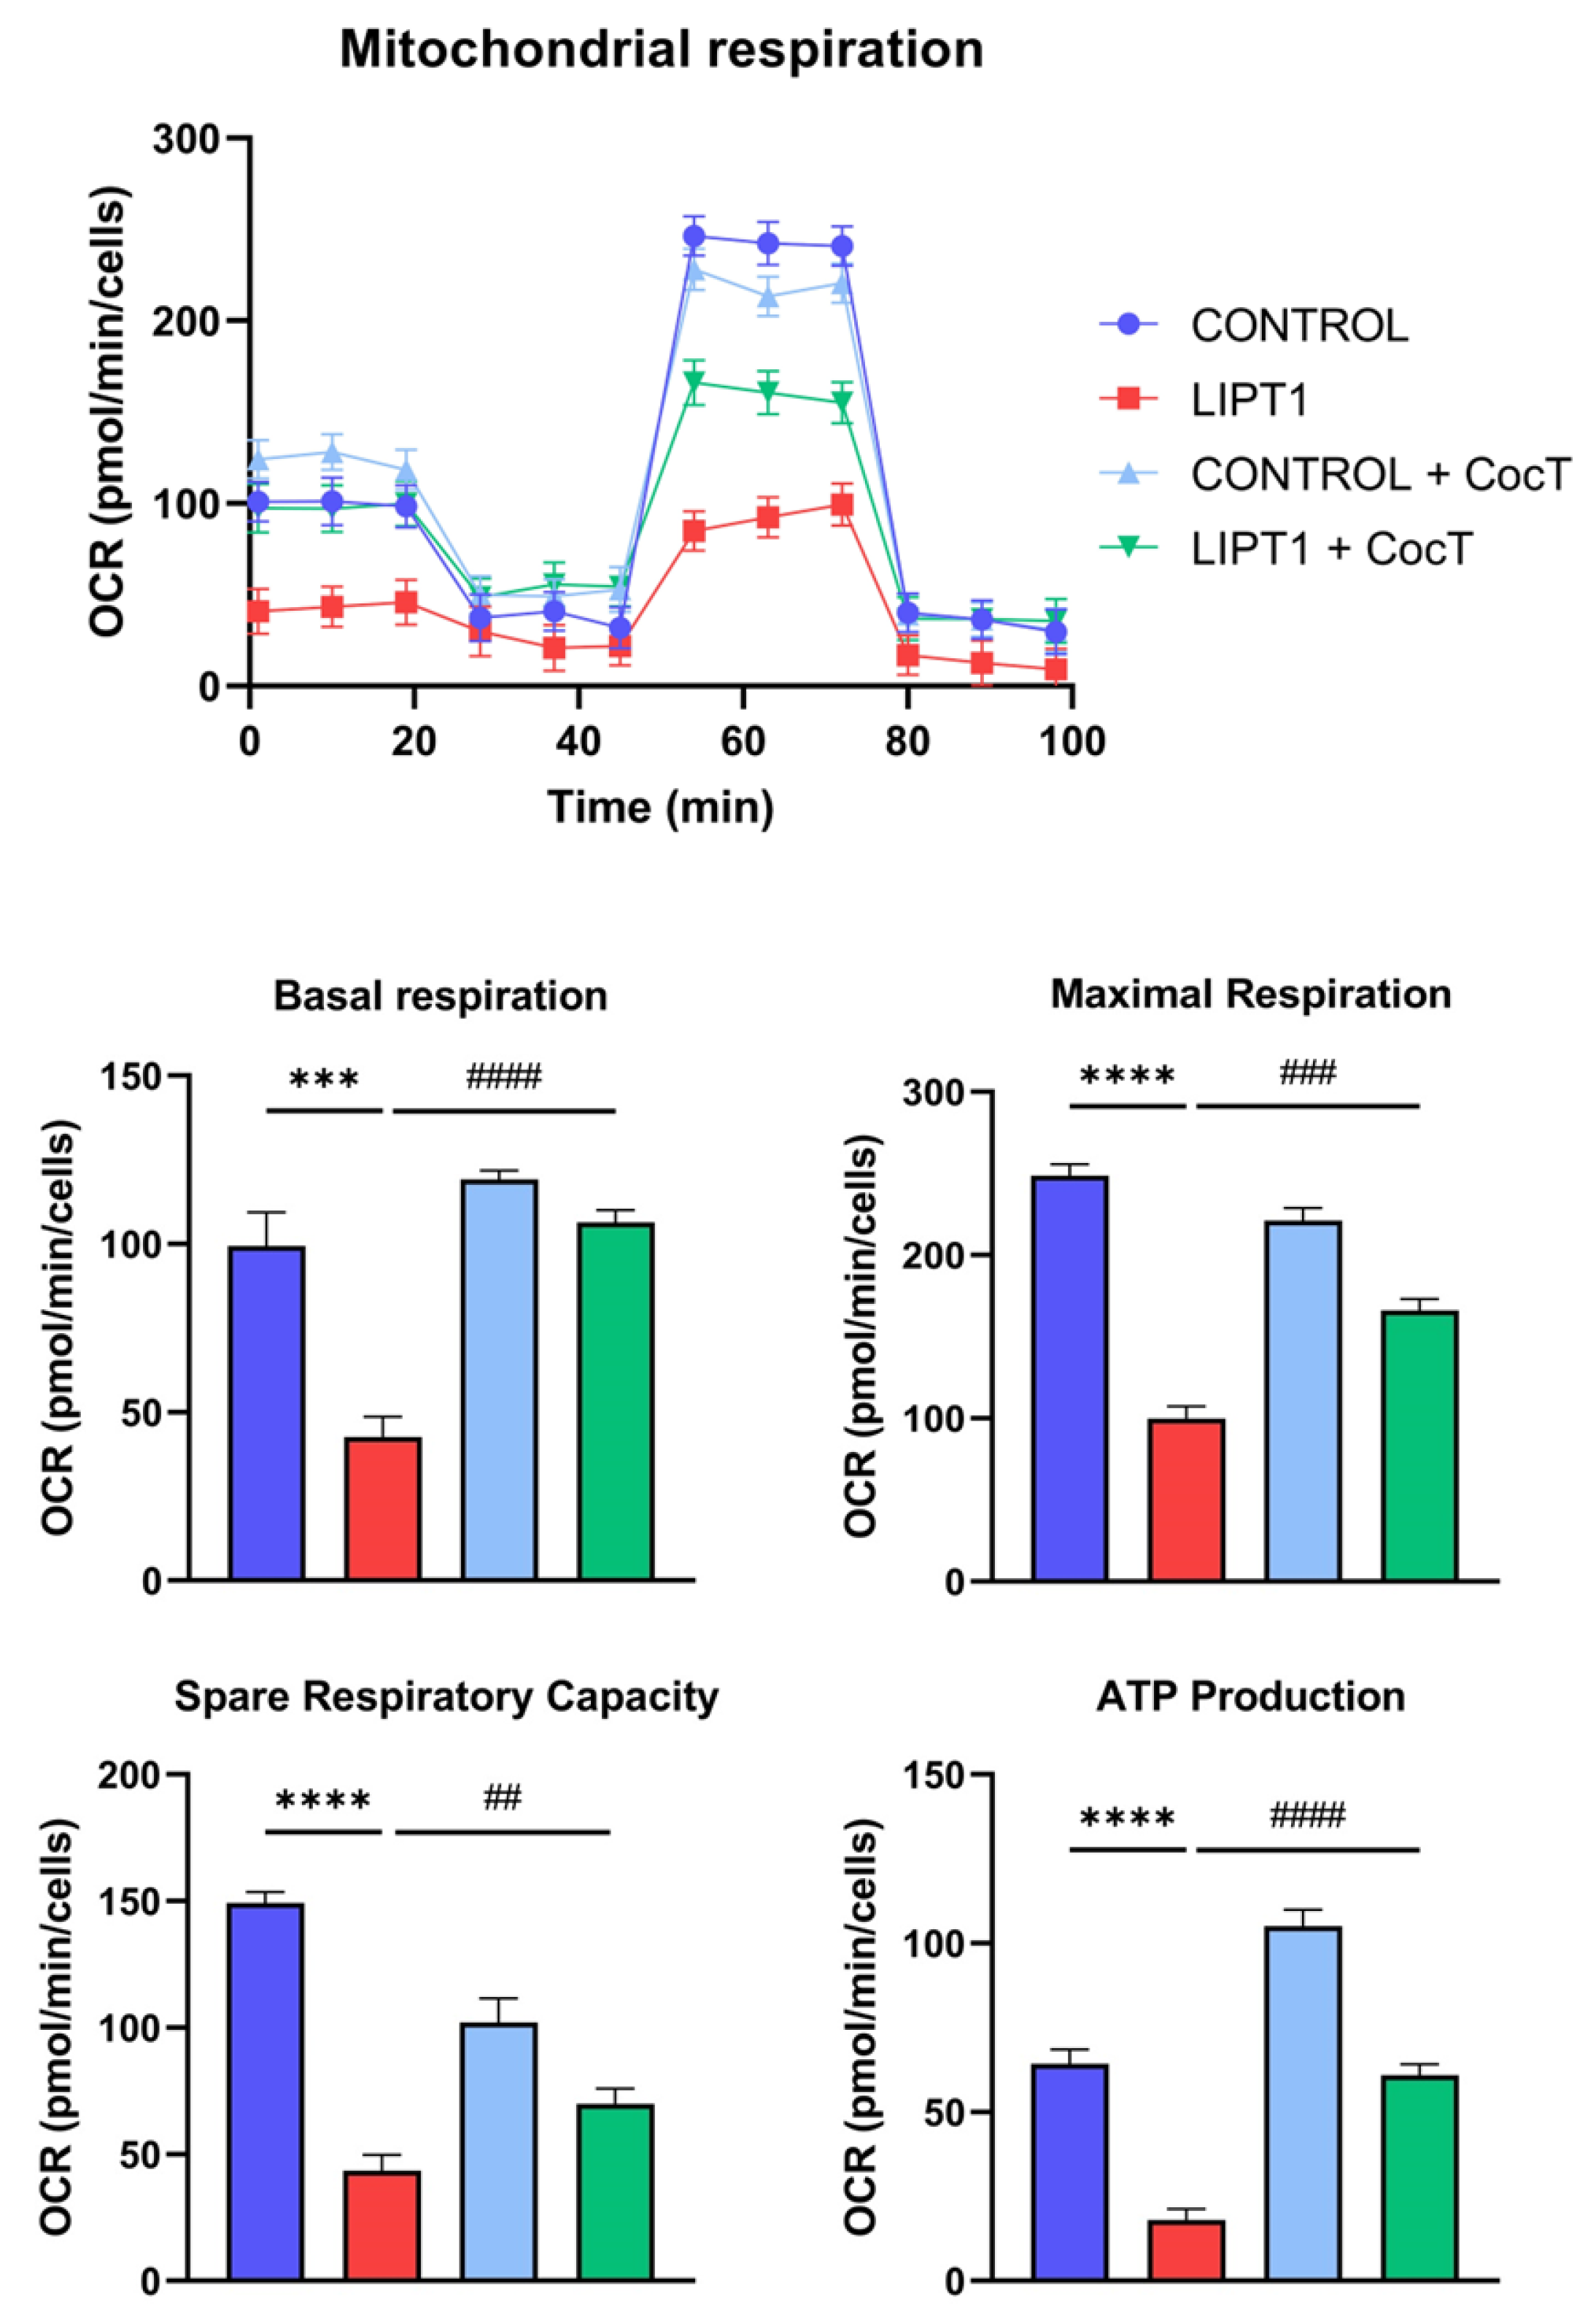
Figure 11.
Effect of CocT on Complex I and Complex IV activities in both untreated and treated control and mutant fibroblasts. Cells were treated with CocT for seven days. A. Complex I activity was measured using Complex I Enzyme Activity Dipstick Assay Kit. Complex IV activity was measured using Complex IV Enzyme Activity Dipstick Assay Kit. B. Band intensity was obtained using ImageLab software. Data represent the mean±SD of 3 independent experiments. ****p<0.0001 between control and mutant LIPT1 fibroblasts. ###p<0.001 and ####p<0.0001 between untreated and treated mutant LIPT1 fibroblasts. a.u.: arbitrary units.
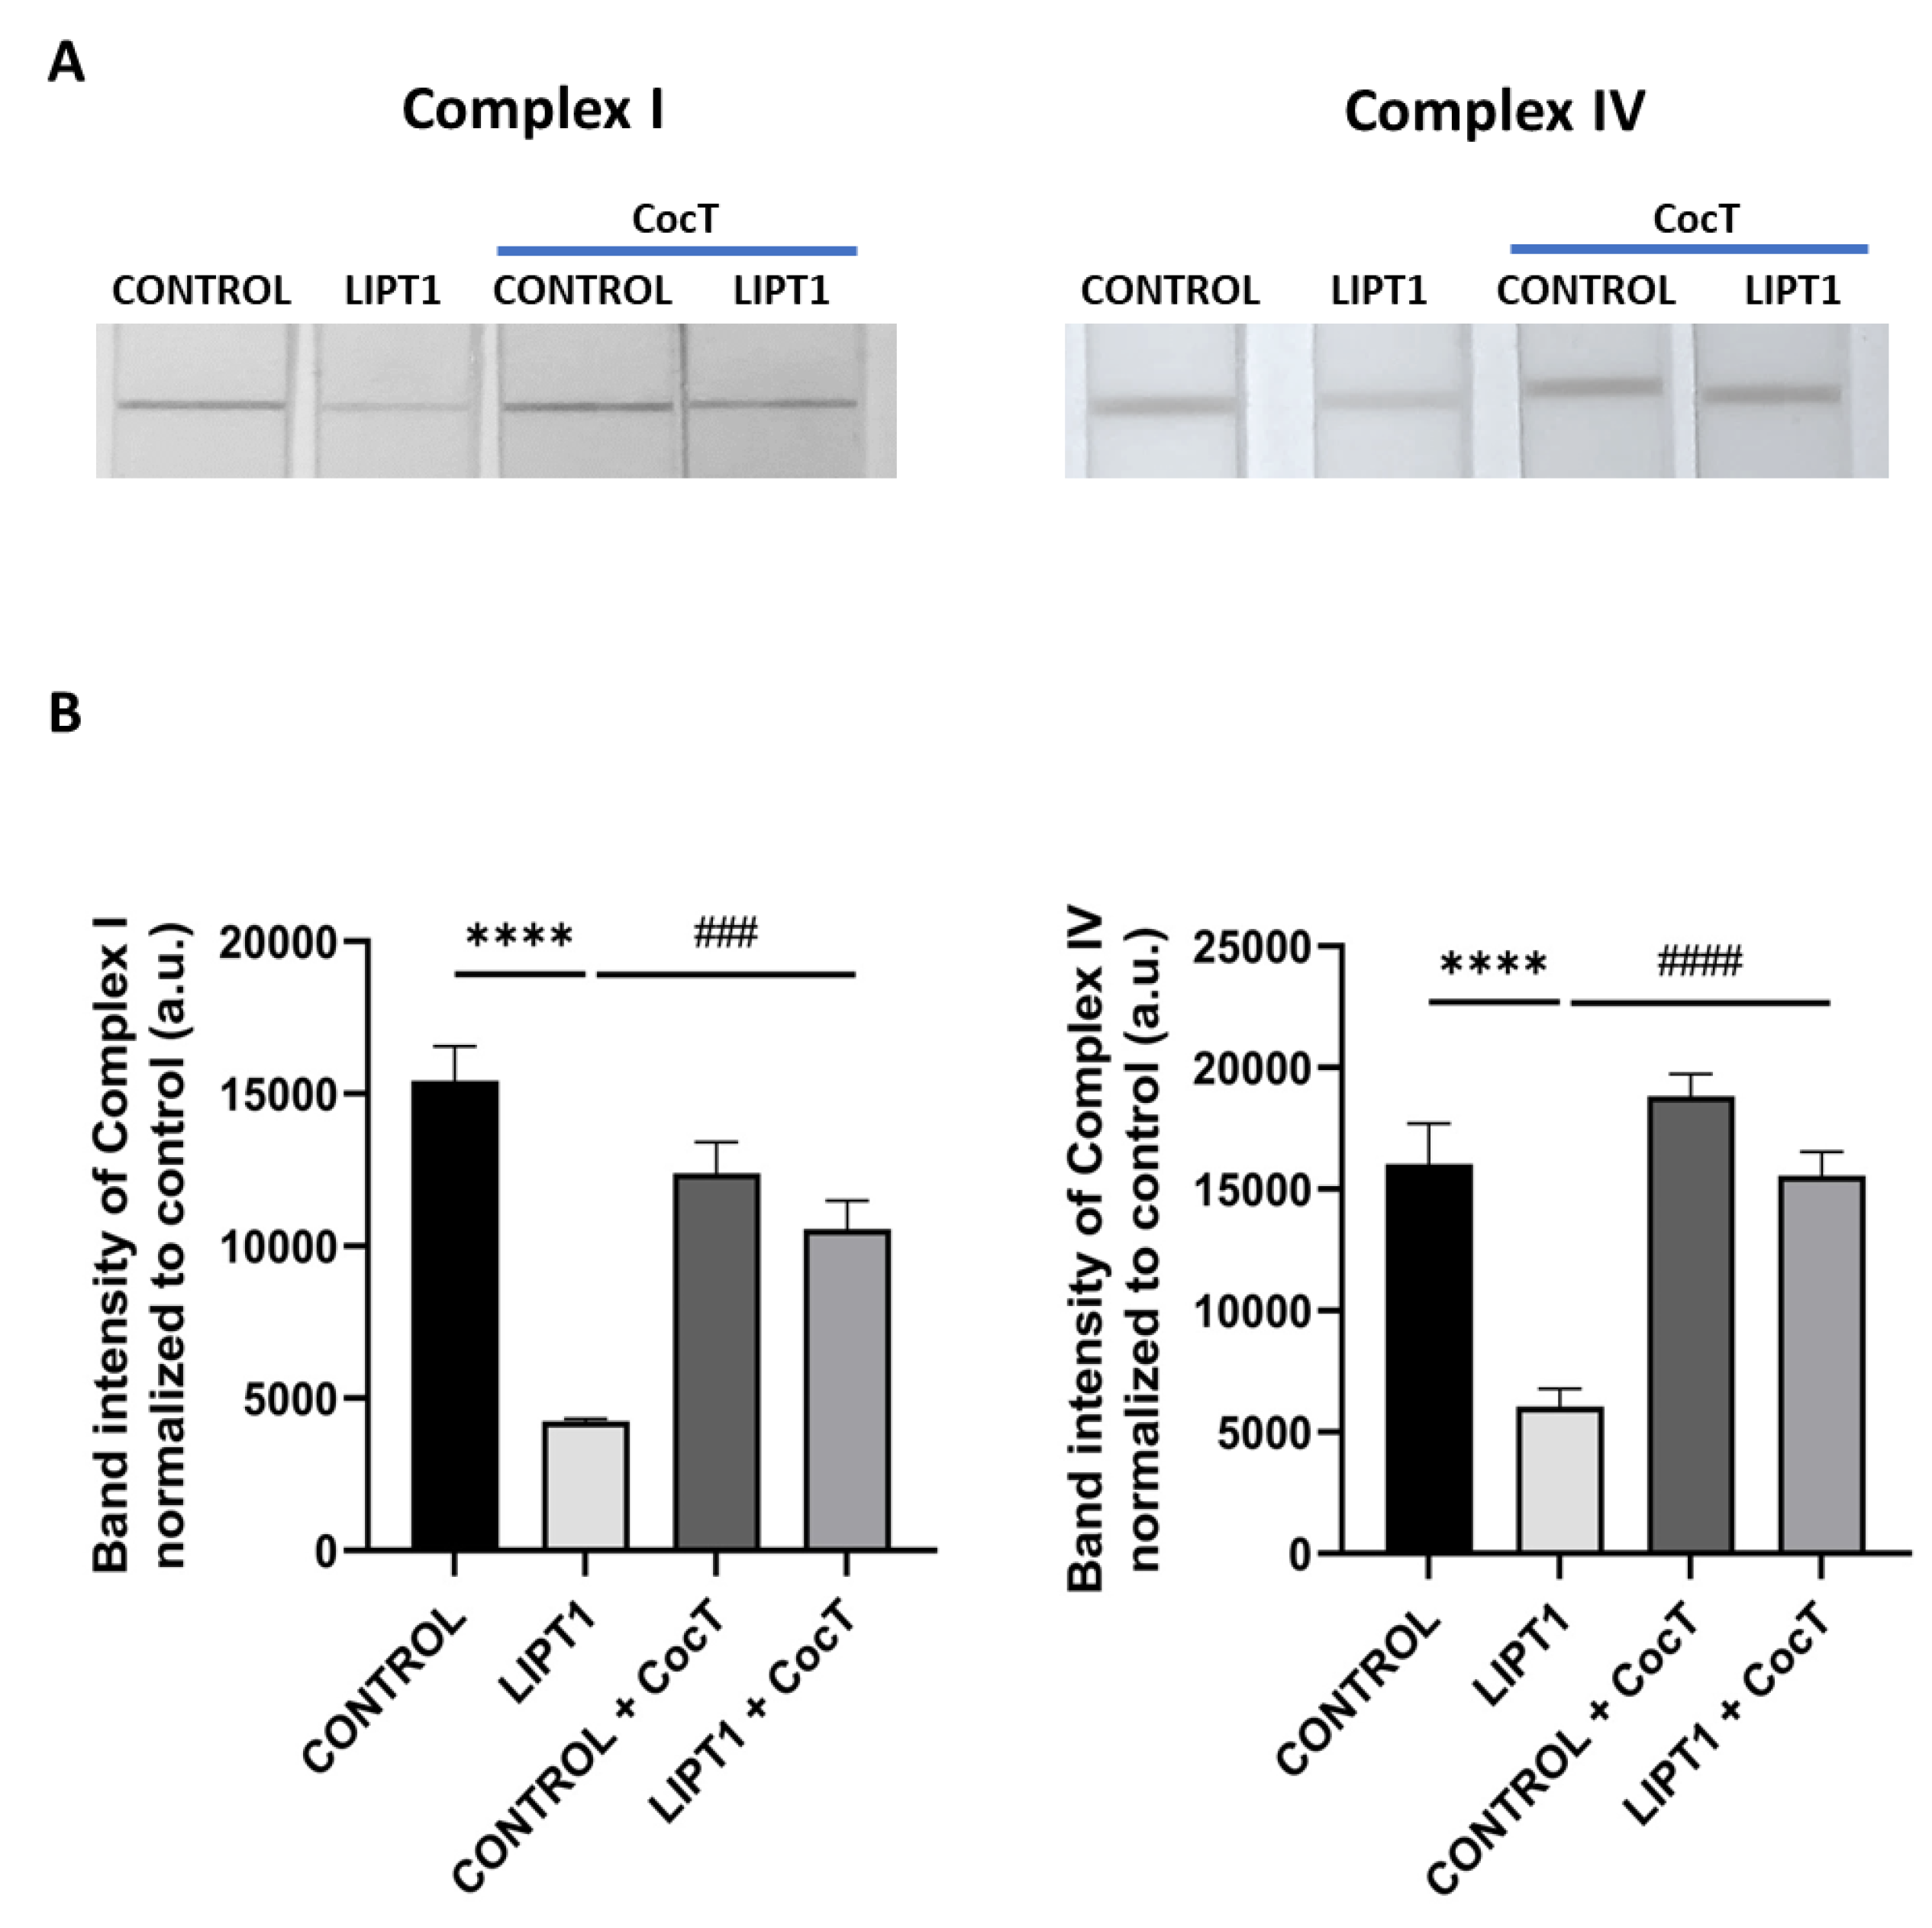
Figure 12.
Effect of CocT on the expression levels of proteins of the transcriptional canonical mtUPR axis in control and mutant cells, both untreated and treated with CocT. A. Western blot analysis. B. Band densitometry of Western blot data referred to actin and normalized to the mean of controls. C1 and C2: control cells, P: patient’s cells. Data represent the mean±SD of 3 independent experiments. **p<0.01 and ****p<0.0001 between control and mutant LIPT1 fibroblasts. ##p<0.01, ###p<0.001 and ####p<0.0001 between untreated and treated mutant LIPT1 fibroblasts. a.u.: arbitrary units.
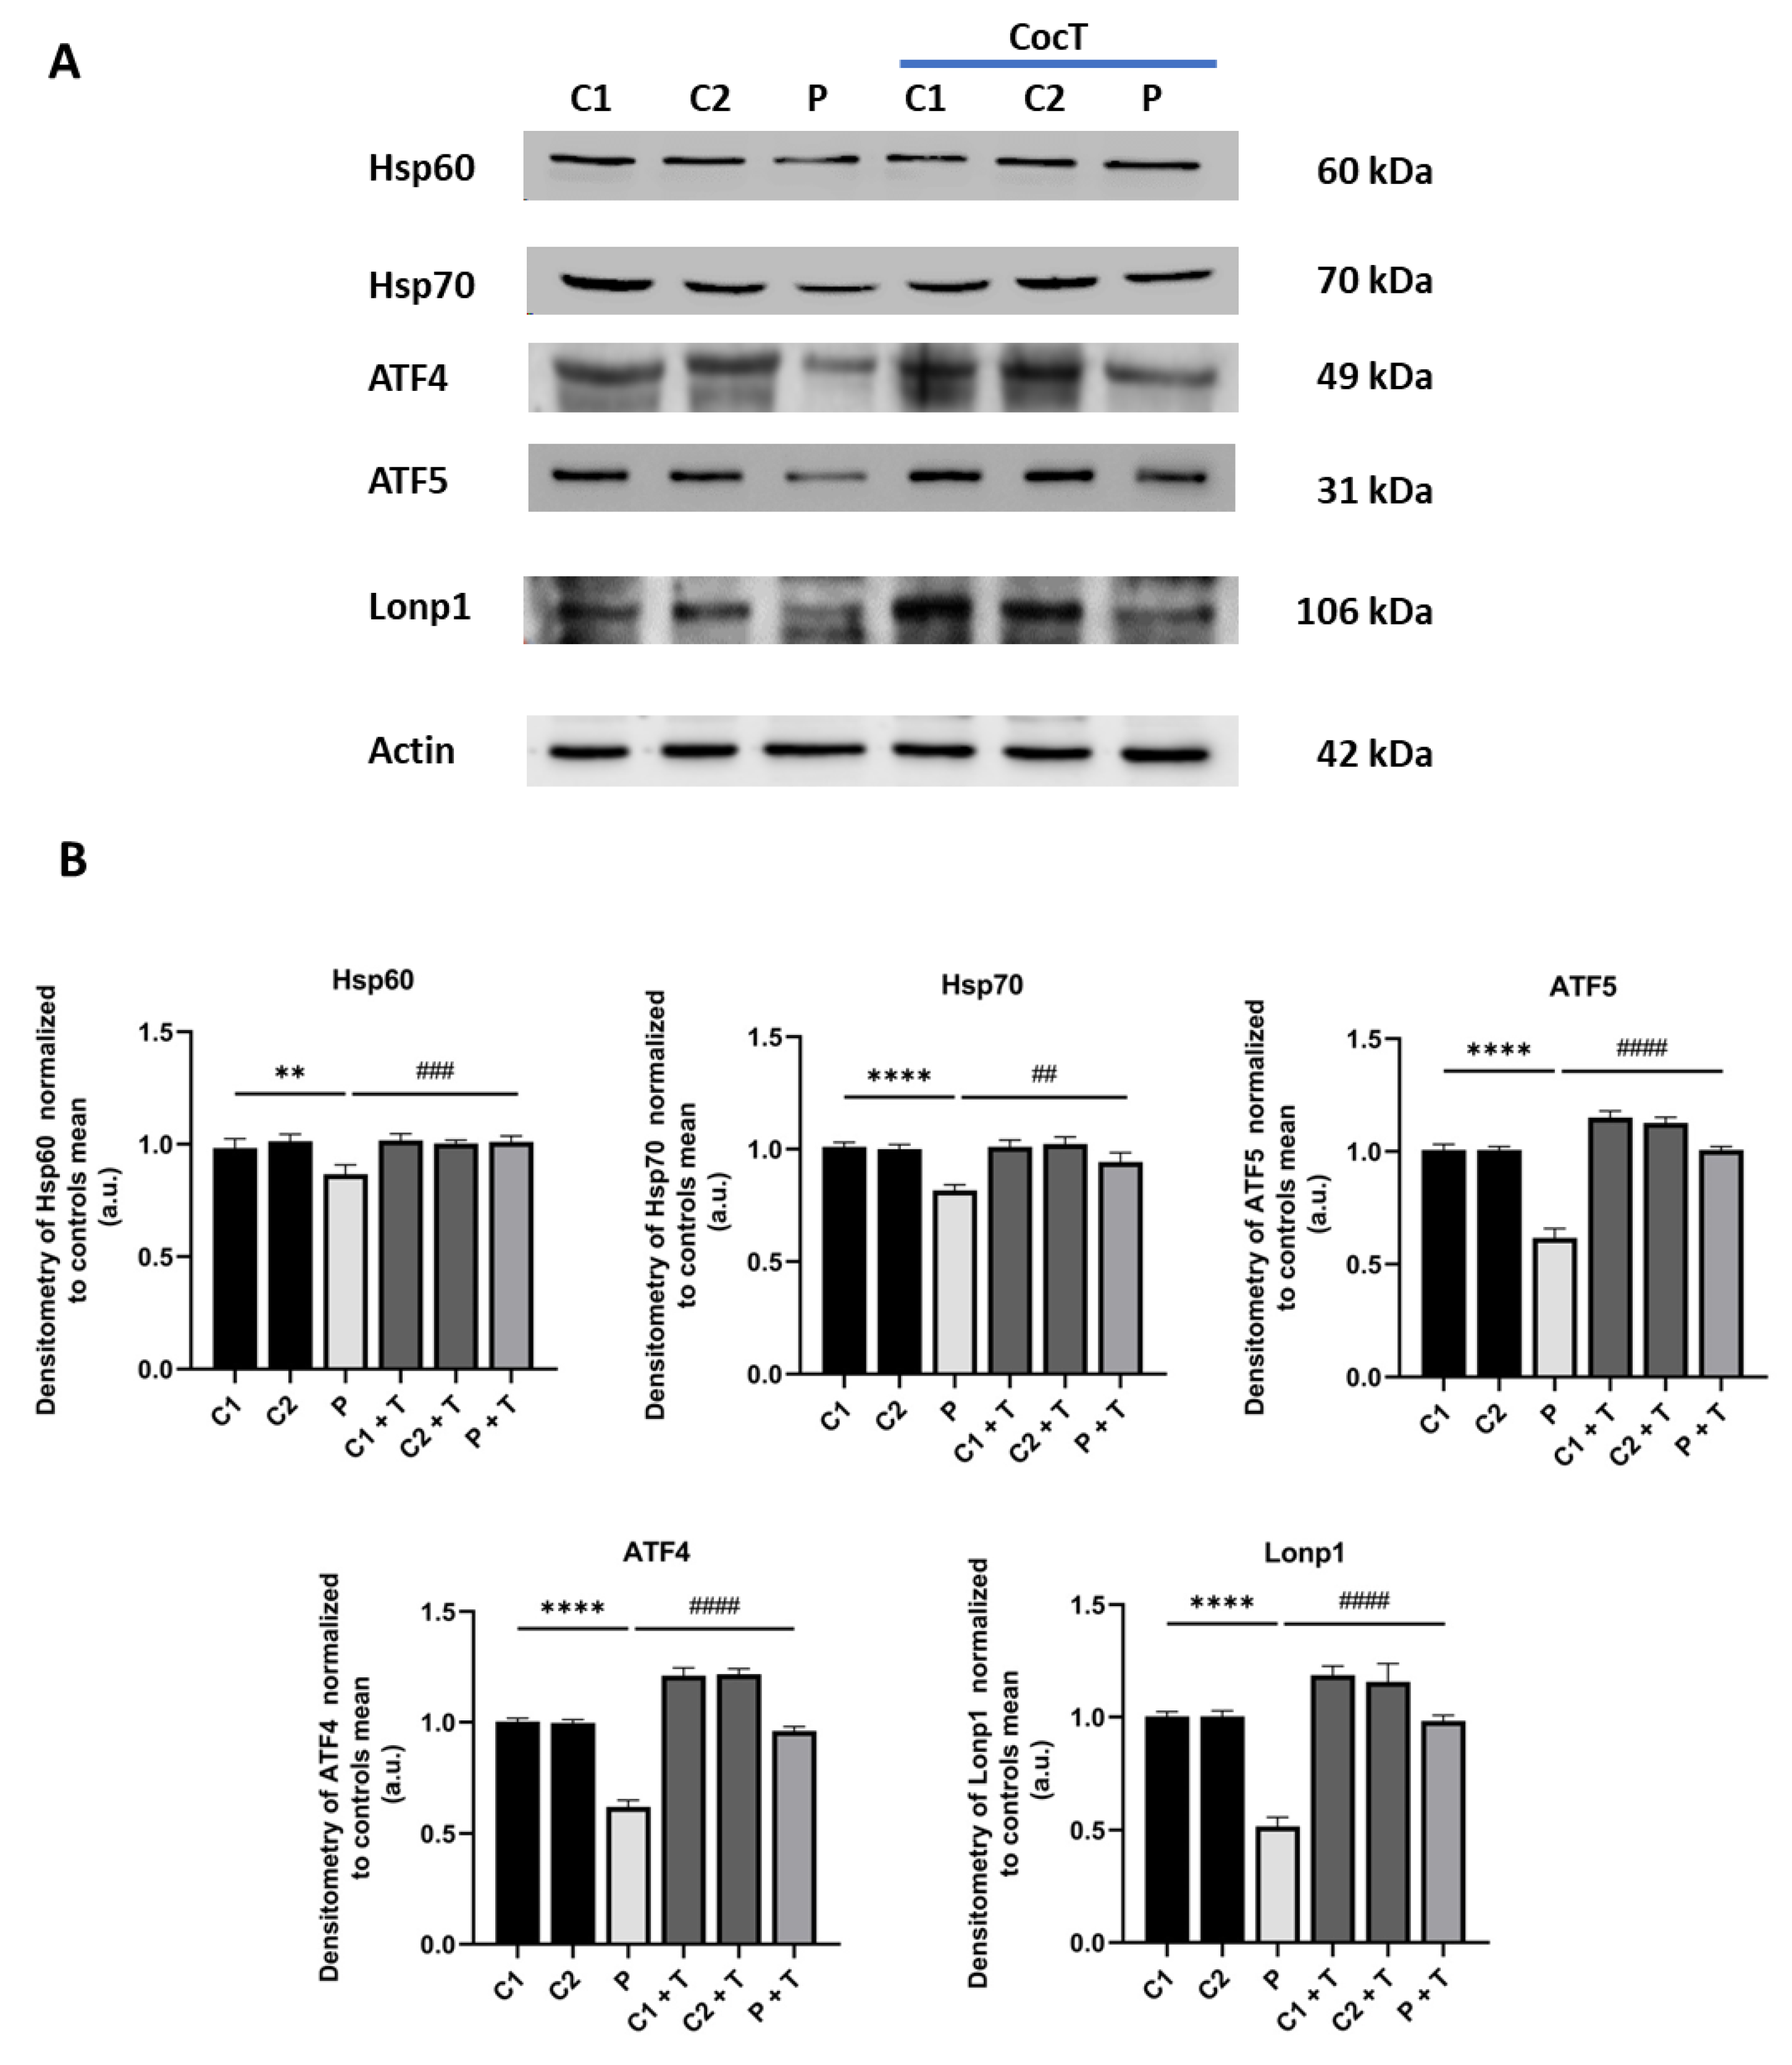
Figure 13.
Effect of CocT on the expression levels of proteins of the SIRT3 mtUPR axis in control and mutant cells, both treated and untreated with CocT. A. Western blot analysis. B. Band densitometry of Western blot data referred to actin and normalized to the mean of controls. C1 and C2: control cells, P: patient’s cells. Data represent the mean±SD of 3 independent experiments. ****p<0.0001 between control and mutant LIPT1 fibroblasts. ####p<0.0001 between untreated and treated mutant LIPT1 fibroblasts. a.u.: arbitrary units.
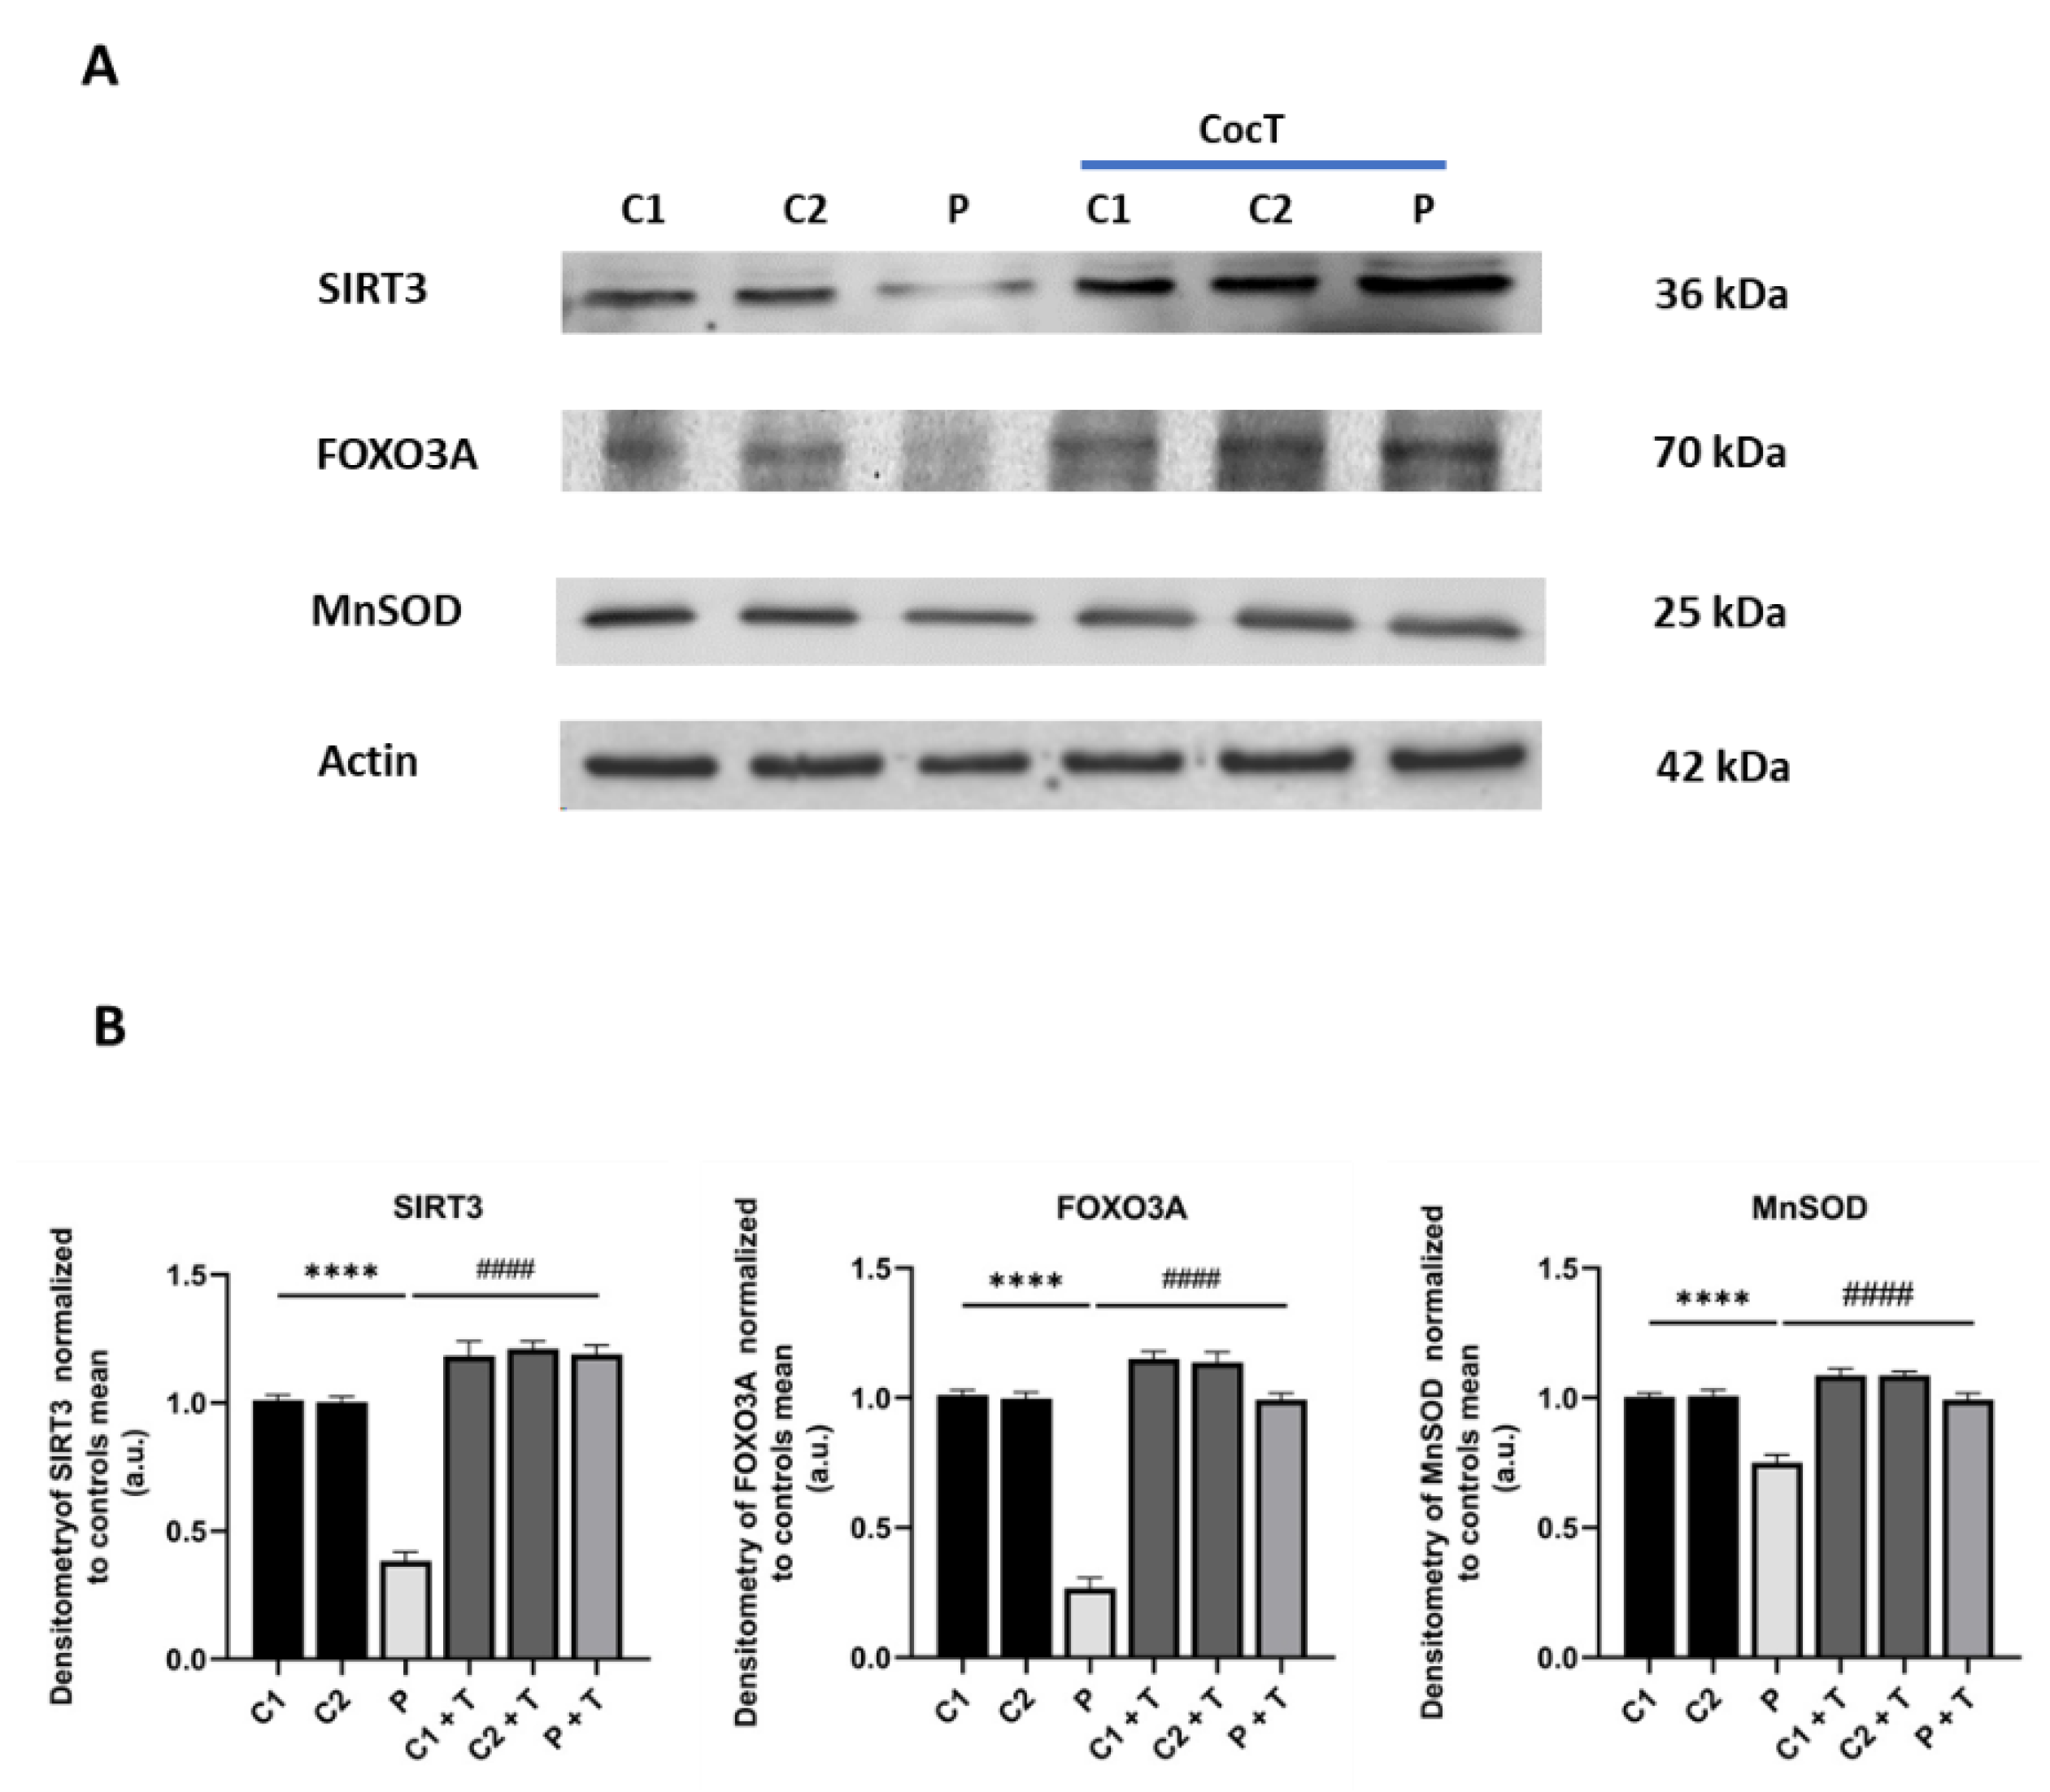
Figure 14.
Effect of CocT on the expression levels of mitochondrial biogenesis proteins in control and mutant cells, both untreated and treated with CocT. A. Western blot analysis. B. Band densitometry of Western blot data referred to actin and normalized to the mean of controls. C1 and C2: control cells, P: patient’s cells. Data represent the mean±SD of 3 independent experiments. ****p<0.0001 between control and mutant LIPT1 fibroblasts. #p<0.05, ###p<0.001 and ####p<0.0001 between untreated and treated mutant LIPT1 fibroblasts. a.u.: arbitrary units.
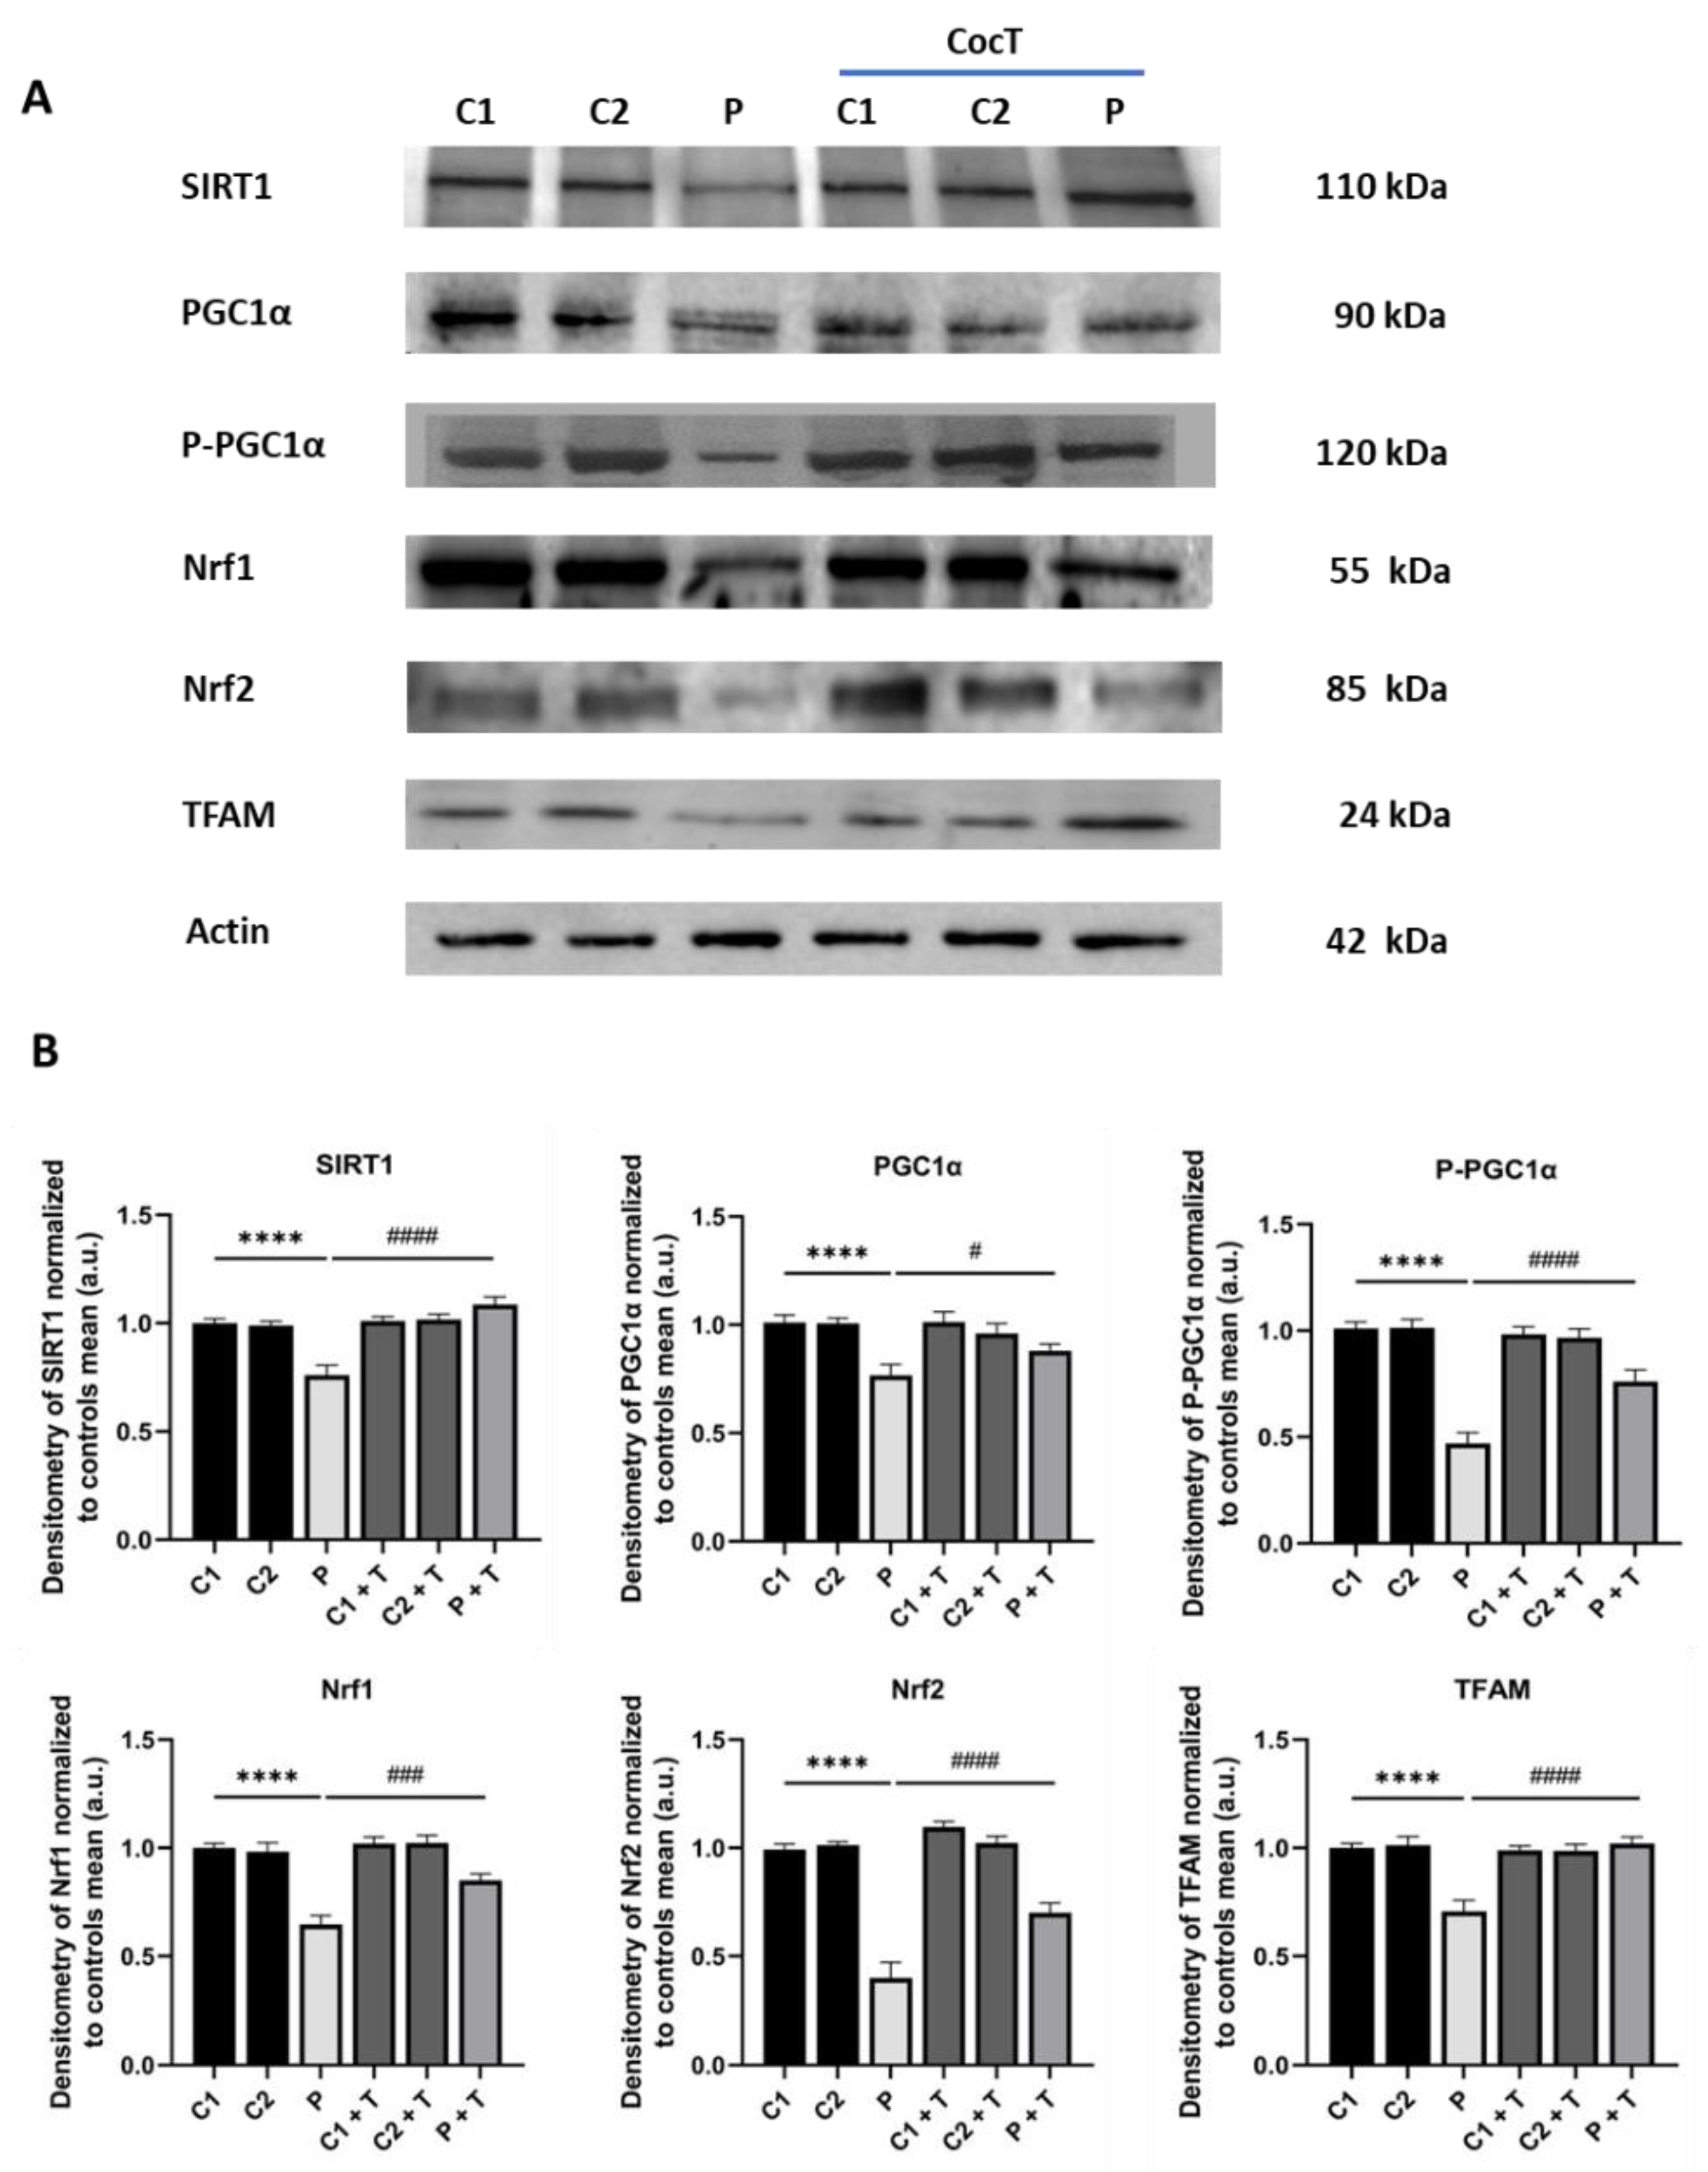
Figure 15.
Effect of CocT on SIRT3 activity in control and mutant LIPT1 fibroblasts. Mitochondrial SIRT3 activity was determined by SIRT3 Activity Assay Kit (Fluorometric) in mitochondrial fractions. Data represent the mean±SD of 3 independent experiments. *p<0.05 between control and mutant LIPT1 fibroblasts. ####p<0.0001 between untreated and treated mutant LIPT1 fibroblasts.
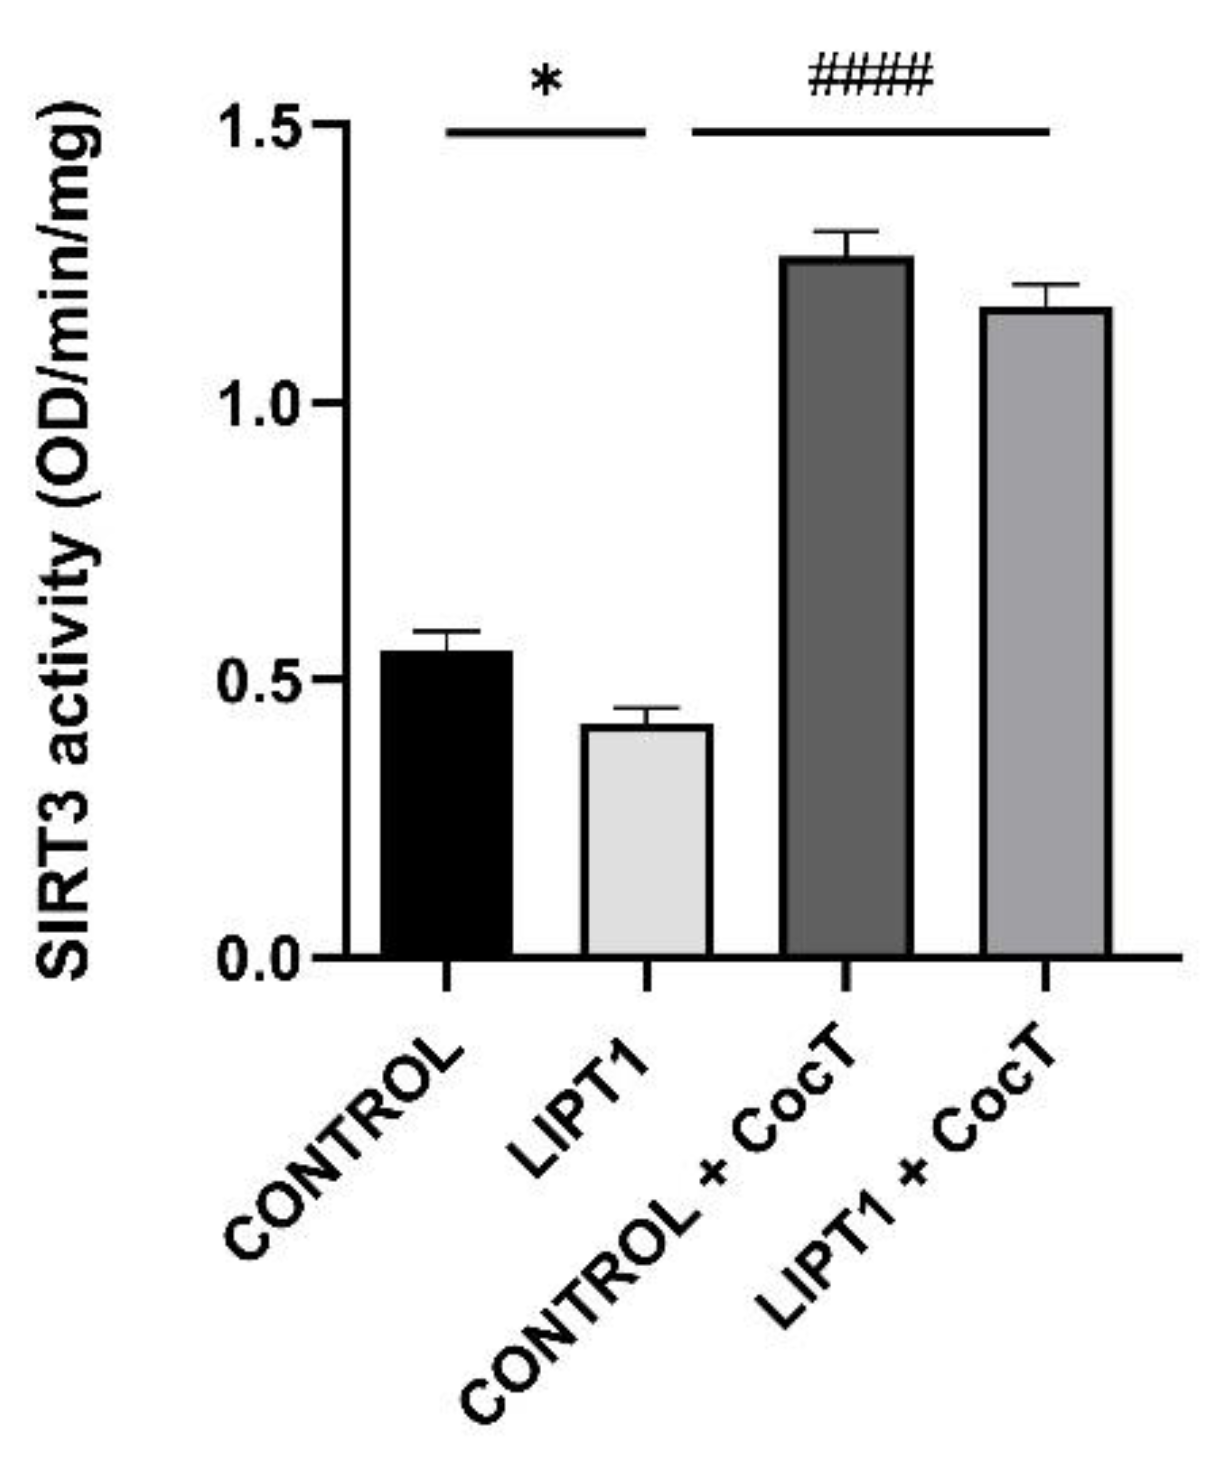
Figure 16.
Effect of CocT on cellular NAD+, NADH, NADt levels, and NAD+/NADH ratio in both untreated and treated control and patient’s cells. Cells were treated with CocT for seven days. The assay was performed using the NAD+/NADH Assay Kit (Colorimetric). A. NAD+ concentration (quantified by subtracting NADH from NADt). B. NADH concentration. C. NADt concentration (NAD+ and NADH total content). D. NAD+/NADH ratio. Data represent the mean±SD of 3 independent experiments. ***p<0.001 and ****p<0.0001 between control and mutant LIPT1 fibroblasts. ##p<0.01 and ####p<0.0001 between untreated and treated mutant LIPT1 fibroblasts. a.u.: arbitrary units.
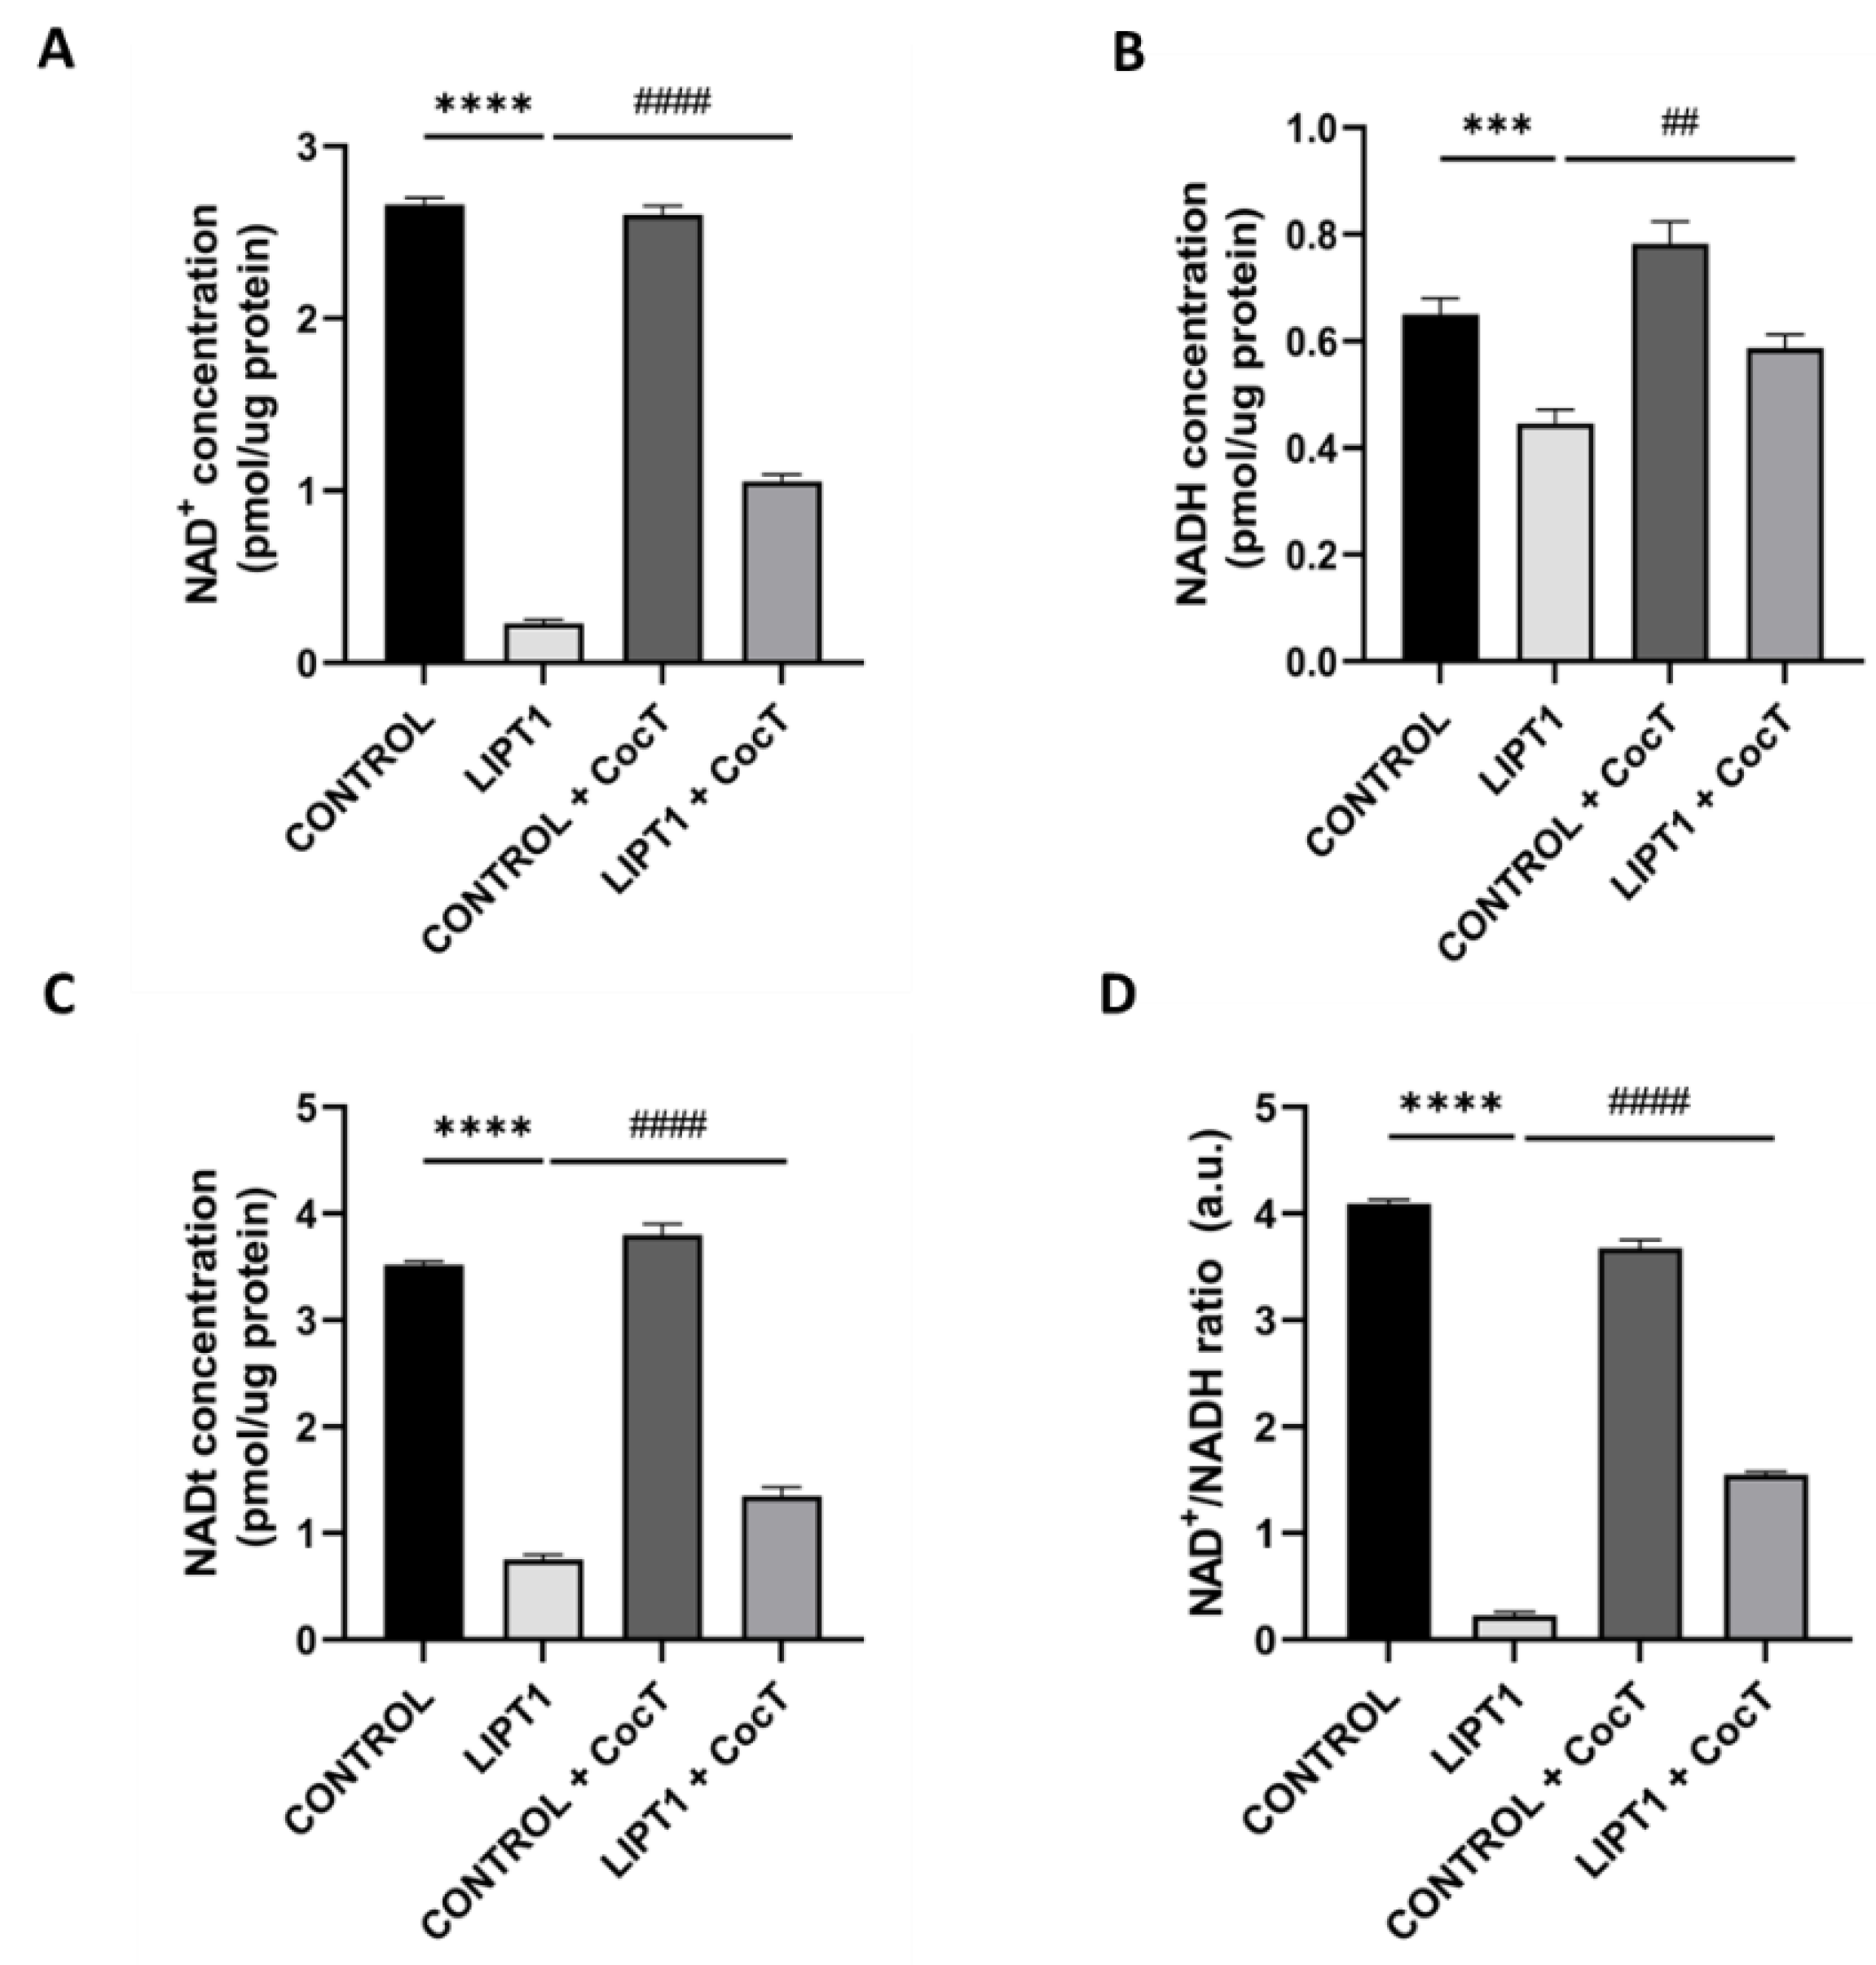
Figure 17.
Quantification of proliferation ratio of pharmacological screening in galactose medium with 3-TYP. Cells were seeded in glucose medium and treated with 3-TYP at 50 nM, CocT or both (3-TYP was added the last 72 hours of the treatment). After 3-4 days, glucose medium was changed to galactose medium, treatment was refreshed, and photos were taken the same day (T0) and 72h later (T72) by BioTek Cytation 1 Cell Imaging Multi- Mode Reader. Proliferation ratio was calculated as number of cells in T72 divided by number of cells in T0, in both control and mutant cells (values > 1: cell proliferation; values = 1: number of cells unchanged; values < 1: cell death). Data represent the mean ± SD of 3 independent experiments ****p<0.0001 between mutant LIPT1 fibroblasts in glucose medium and galactose medium. ####p<0.0001 between untreated and treated mutant LIPT1 fibroblasts in galactose medium. a.u.: arbitrary units.
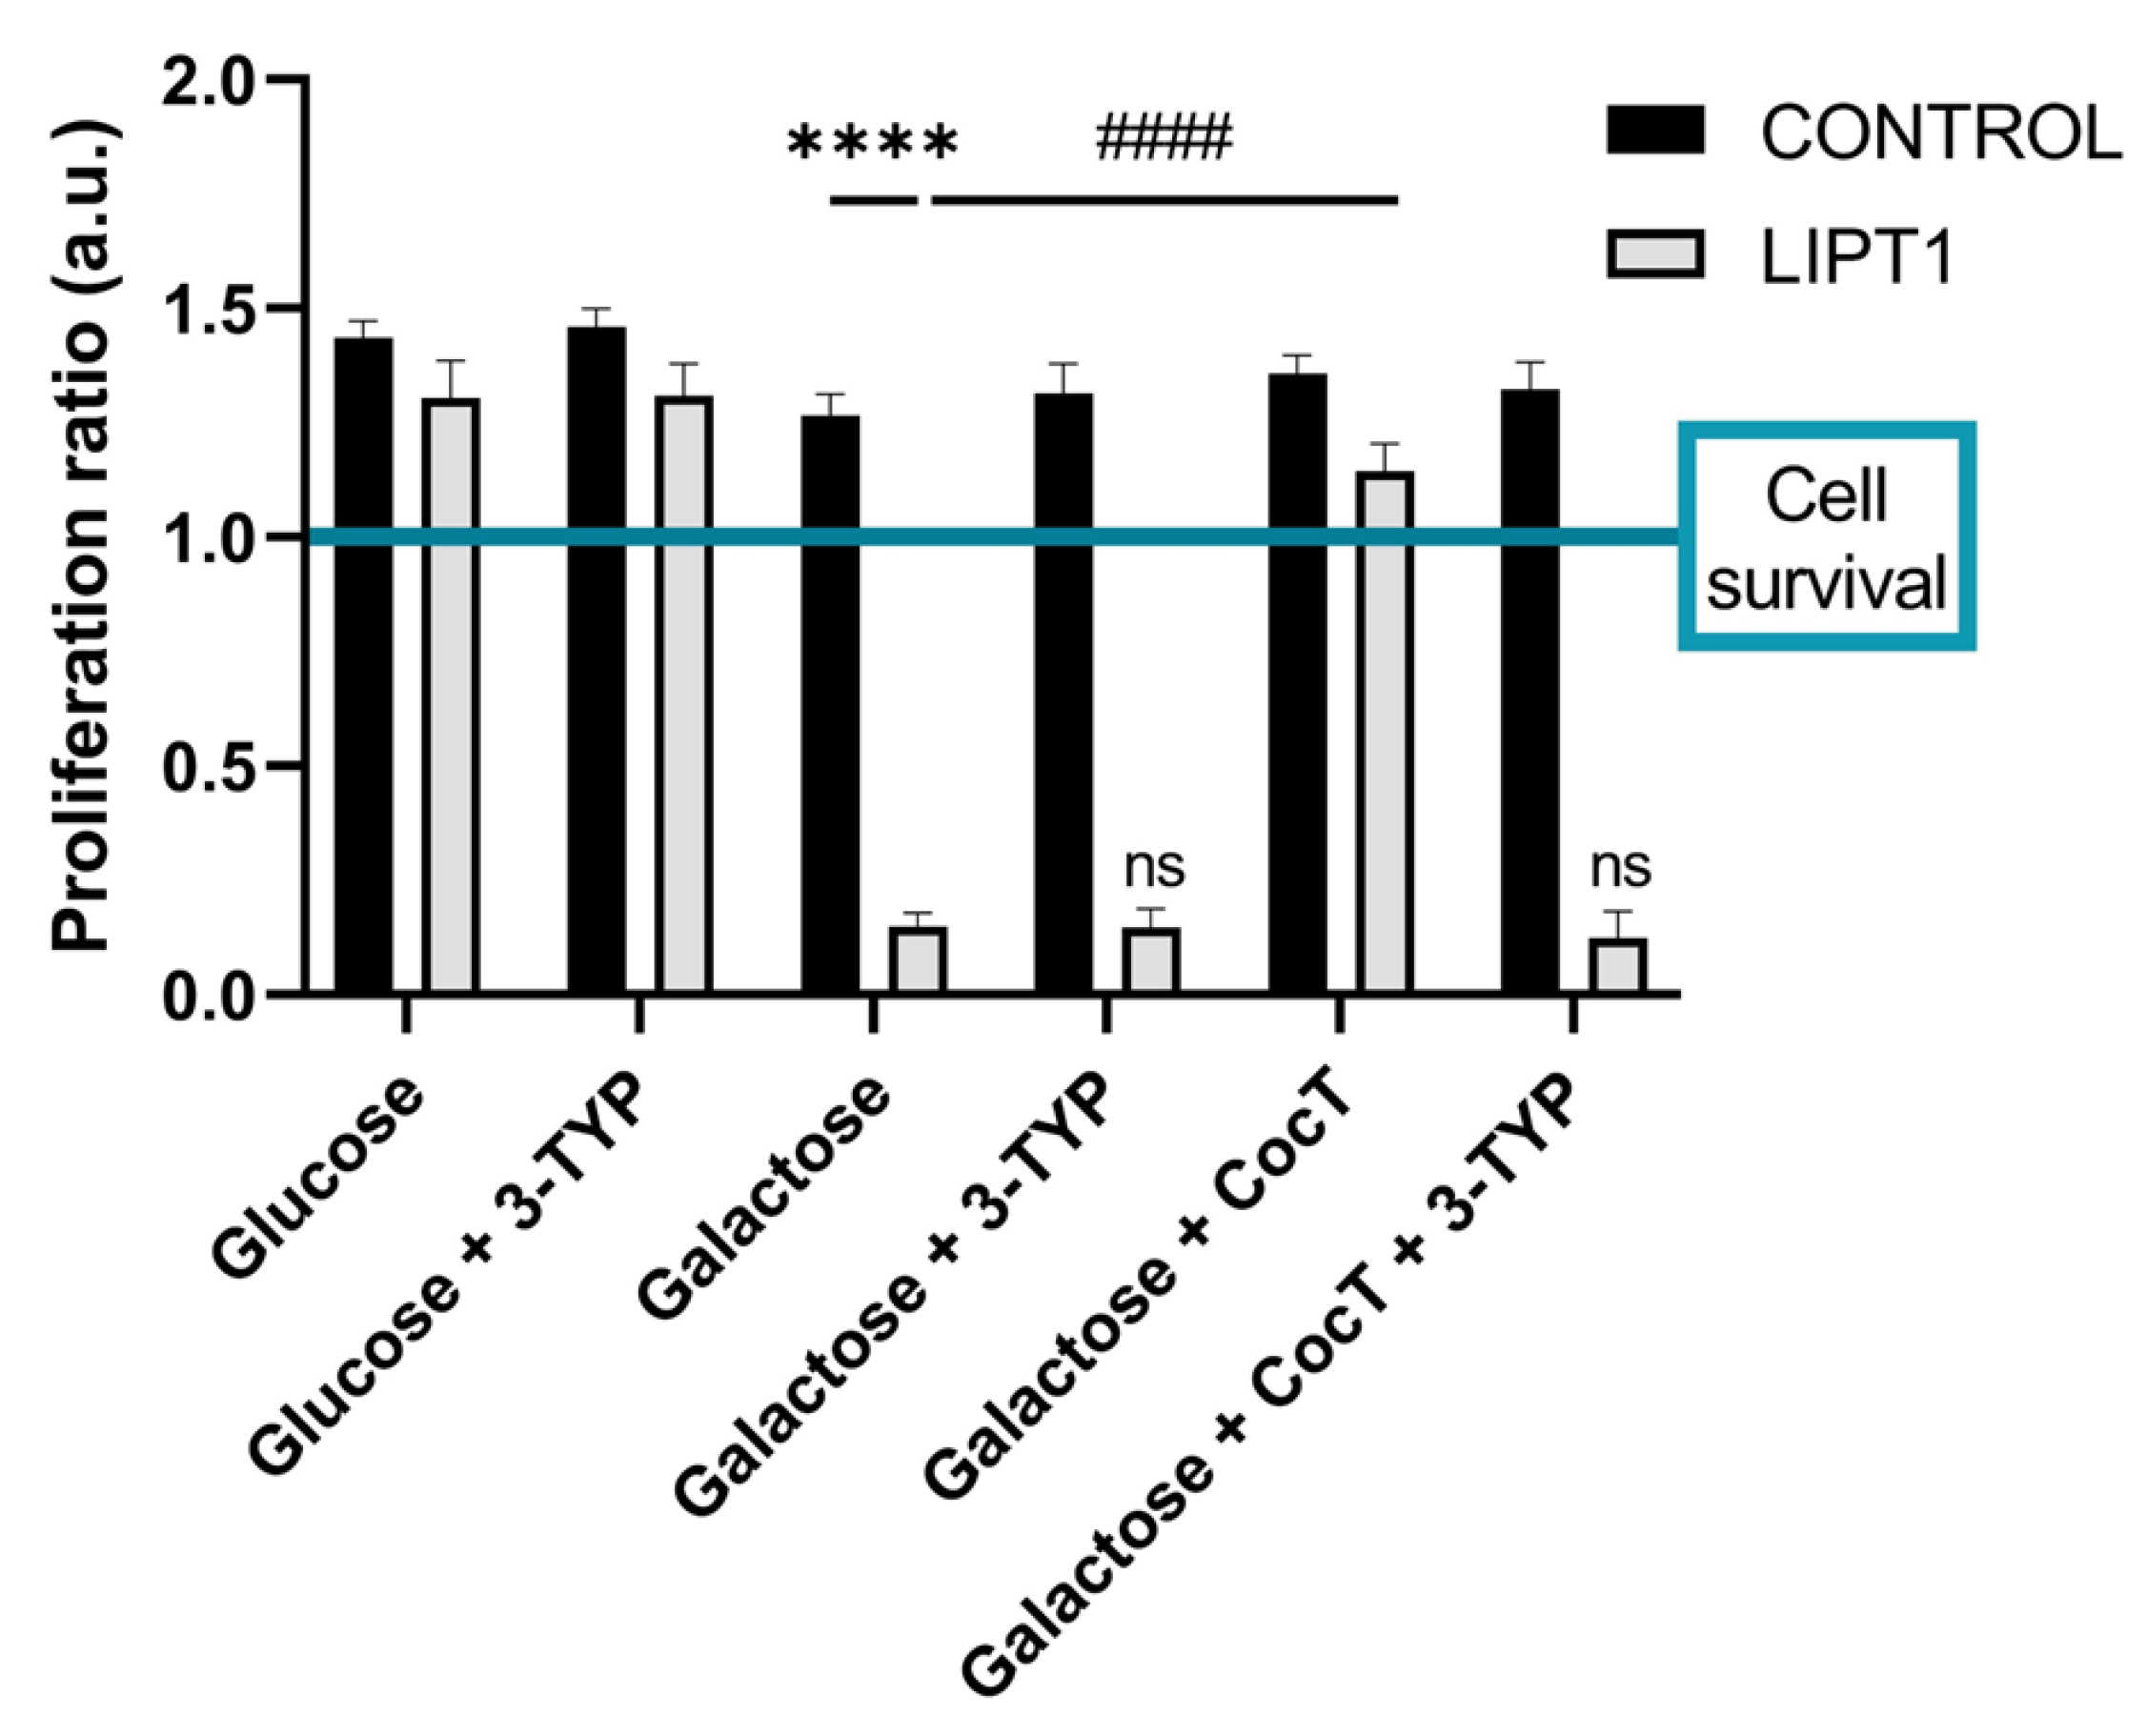
Figure 18.
Effect of CocT on lipoylation in iNs obtained from control and patient-derived fibroblasts by direct reprogramming. A. Representative images were acquired by Deltavision microscope. Mitochondrial network was assessed by MitoTrackerTM Red CMXRos staining. Tau was used as neuronal marker. Hoescht was used to stain nuclei. Scale bar: 15 μm. B. Quantification of fluorescence intensity of lipoic acid antibody. C. Quantification of fluorescence intensity of MitotrackerTM Red CMXRos. Images were analyzed by Image J software (version 1.53t) (at least 30 images were analyzed per each condition and experiment). ****p<0.0001 between control and mutant LIPT1 fibroblasts. ###p<0.001 and ####p<0.0001 between untreated and treated mutant LIPT1 fibroblasts. a.u.: arbitrary units.
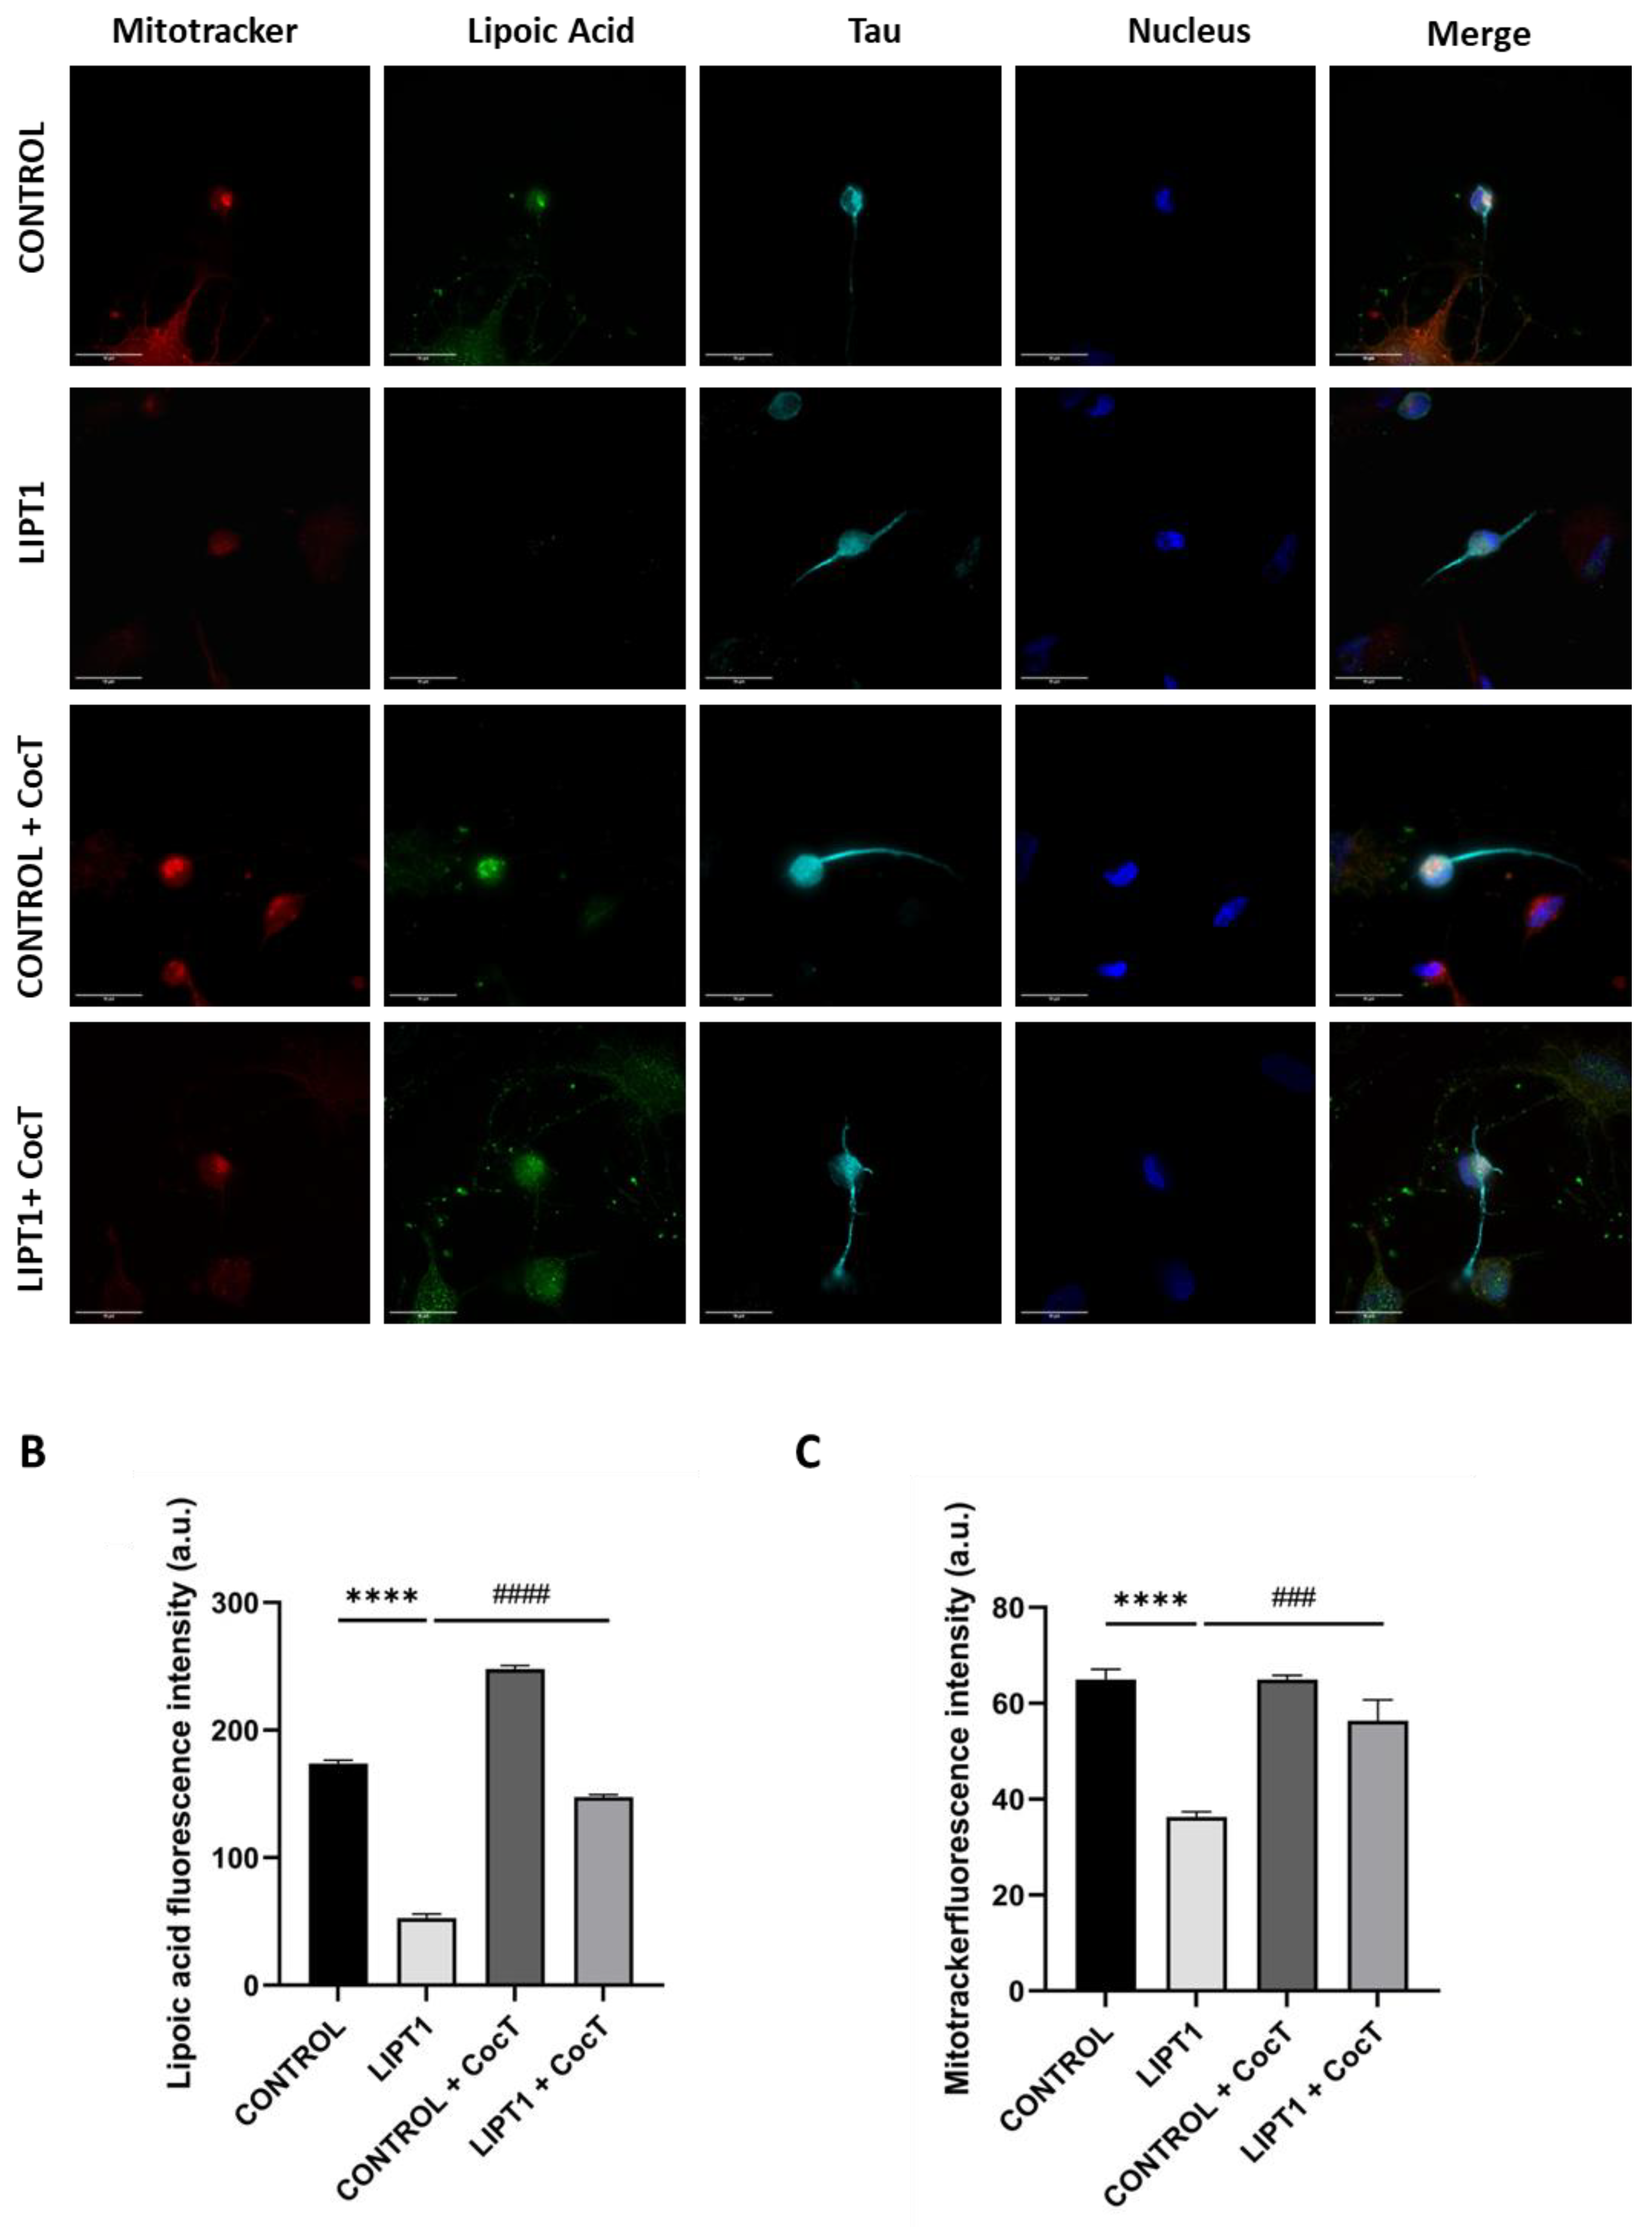
Figure 19.
Effect of CocT on iron accumulation in iNs obtained from control and patient-derived fibroblasts by direct reprogramming. A. Representative images were acquired by Zeiss Axio Vert V1 microscope. Tau was used as neuronal marker. Scale bar: 15 μm. B. Quantification of Prussian Blue staining images were obtained by Image J software (version 1.53t) (at least 30 images were analyzed per each experimental condition). ****p<0.0001 between control and mutant LIPT1 fibroblasts. ####p<0.0001 between untreated and treated mutant LIPT1 fibroblasts. a.u.: arbitrary units.
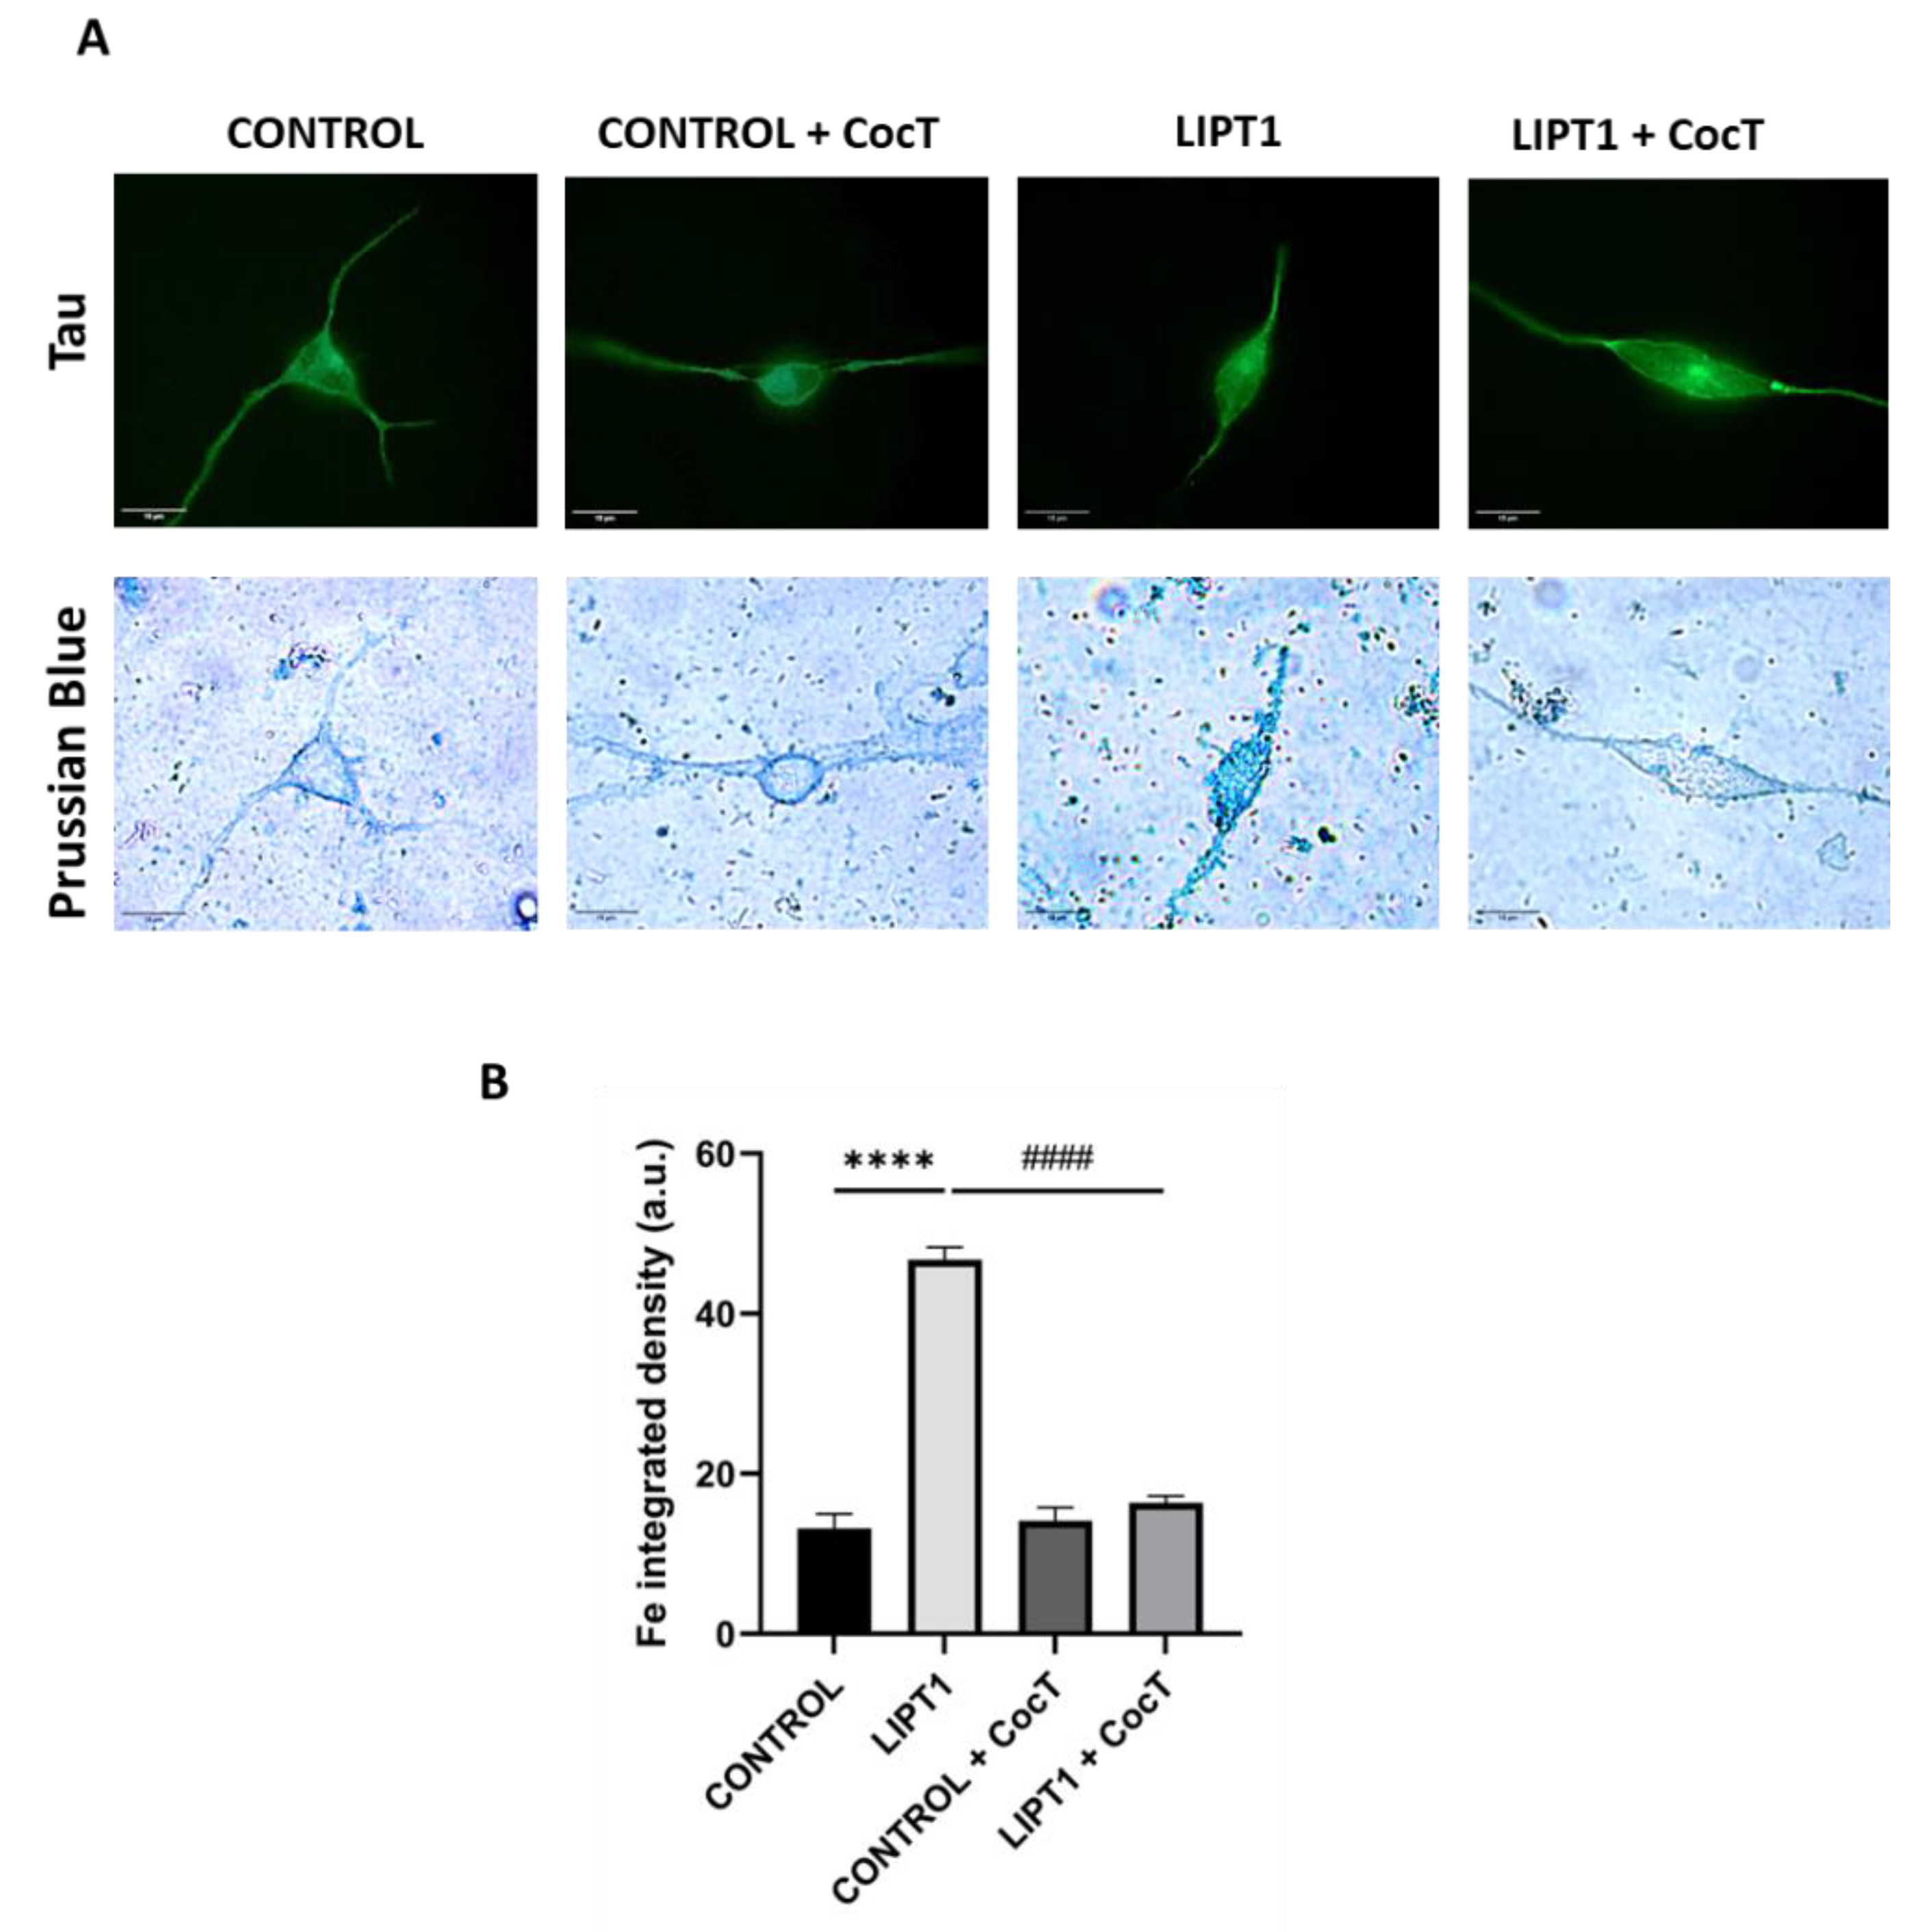
Disclaimer/Publisher’s Note: The statements, opinions and data contained in all publications are solely those of the individual author(s) and contributor(s) and not of MDPI and/or the editor(s). MDPI and/or the editor(s) disclaim responsibility for any injury to people or property resulting from any ideas, methods, instructions or products referred to in the content. |
© 2024 by the authors. Licensee MDPI, Basel, Switzerland. This article is an open access article distributed under the terms and conditions of the Creative Commons Attribution (CC BY) license (http://creativecommons.org/licenses/by/4.0/).
Copyright: This open access article is published under a Creative Commons CC BY 4.0 license, which permit the free download, distribution, and reuse, provided that the author and preprint are cited in any reuse.


