
Submitted:
18 May 2025
Posted:
19 May 2025
You are already at the latest version
Abstract
Mitochondrial reactive oxygen species (mtROS) play a critical role in neuroinflammatory and neurodegenerative disorders, necessitating precise tools for their detection. This study validates MitoGlow-ROS as a highly sensitive and specific probe for quantifying mitochondrial superoxide in cell-free systems, PC12 cells, Lipopolysaccharide (LPS)-treated primary neuronal cultures, and in vivo LPS-treated Sprague-Dawley rats. In cell-free systems, MitoGlow-ROS exhibited a 45-fold dynamic range (R² = 0.97) and a limit of detection of 0.05 µM/min, outperforming MitoSOX Red, with enhanced reproducibility and specificity via its dynamic quenching mechanism. In PC12 cells with antimycin A, it detected a dose-dependent 5-fold ROS increase, reduced by 80% with N-acetylcysteine, confirming mitochondrial superoxide specificity. In LPS-treated neuronal cultures, MitoGlow-ROS captured a 3.4-fold ROS peak at 6 hours, correlating with robust early upregulation of inflammatory mediators (e.g., IL6: 1726-fold) and antioxidant enzymes (e.g., SOD2: 8.6-fold) at 3 hours. In vivo, it revealed a 4.1-fold hippocampal and 2.8-fold cortical ROS increase, validated by corresponding mRNA changes. Despite limitations in acute modeling and functional outcome assessments, MitoGlow-ROS’s sensitivity to subtle and significant mtROS changes positions it as a powerful tool for studying oxidative stress in stroke, Alzheimer’s disease, Parkinson’s disease, and other neuroinflammatory disorders, supporting future investigations into disease mechanisms and therapeutic interventions.
Keywords:
reactive oxygen species
; neuroinflammation
; lipopolysaccharide
; chemical probe
Introduction
Mitochondrial reactive oxygen species (mtROS) are key drivers of cellular damage in stroke and neurodegenerative diseases like Alzheimer’s disease (AD) and Parkinson’s disease (PD), exacerbating neuronal injury through oxidative stress and neuroinflammation. Mitochondria, the primary energy producers in neurons, generate ROS, mainly superoxide (O₂•⁻), as byproducts of the electron transport chain (ETC) during oxidative phosphorylation. At low levels, ROS serve as signaling molecules for processes like synaptic plasticity [1], but excessive ROS production under pathological conditions causes oxidative stress, amplifying inflammation and neuronal damage in stroke, AD, and PD [2].
In ischemic stroke, caused by blocked cerebral blood flow, oxygen and glucose deprivation disrupts mitochondrial ATP production, leading to ETC dysfunction. Electron leakage at complexes I and III generates superoxide, particularly during reperfusion (ischemia-reperfusion injury), when restored oxygen levels intensify ROS production [3]. In rat models of middle cerebral artery occlusion (MCAO), this triggers lipid peroxidation, protein oxidation, and DNA damage within hours of reperfusion [4]. Excessive ROS also induces mitochondrial permeability transition pore (mPTP) opening, causing mitochondrial swelling, cytochrome c release, and neuronal apoptosis, which worsens infarct size and neurological deficits [5]. Neuroinflammation amplifies this damage, as activated microglia release pro-inflammatory cytokines (e.g., TNFα, IL1B), which further impairs mitochondrial function and increase ROS production [6]. This ROS-inflammation feedback loop disrupts the blood-brain barrier, promotes edema, and aggravates secondary neuronal injury, significantly affecting stroke outcomes [7,8,9,10,11].
In AD, mitochondrial ROS drive neuroinflammation and neurodegeneration linked to amyloid-beta (Aβ) plaques and tau pathology. Aβ accumulates in mitochondria, particularly in cortical neurons, inhibiting complex IV (cytochrome C oxidase) activity, which increases ROS production [12,13,14]. In Tg2576 mice, elevated mitochondrial gene expression reflects a compensatory response to oxidative damage from mutant APP and Aβ, with increased mtROS, reduced cytochrome c oxidase activity, and elevated carbonyl proteins indicating mitochondrial dysfunction [15,16]. This oxidative stress activates microglia and astrocytes, releasing cytokines like IL6 and TNFα, which correlate with oxidative markers in post-mortem AD brains [16,17]. ROS also promote tau hyperphosphorylation, neurofibrillary tangle formation, Aβ aggregation, and neuronal loss in the hippocampus and cortex [14,15,16]. Additionally, mitochondrial ROS activate the NLRP3 inflammasome in microglia, increasing IL1B production, which is elevated in AD brains, perpetuating inflammation and neuronal damage [18,19].
In PD, mitochondrial ROS contribute to the selective degeneration of dopaminergic neurons in the substantia nigra. Mutations in genes like PINK1 and PARKIN impair mitophagy, leading to dysfunctional mitochondria that produce excessive ROS [20,21,22]. In PINK1 knockout mice, elevated mitochondrial ROS in the substantia nigra correlate with dopaminergic neuron loss [23,24]. ROS cause oxidative damage to ETC complex I, creating a feedforward loop that amplifies ROS production [25,26]. Neuroinflammation exacerbates this, with activated microglia releasing cytokines like TNFα, which increase mitochondrial ROS in dopaminergic neurons [27,28]. ROS oxidize dopamine, forming toxic quinones, and activate the NF-kB pathway, elevating IL6 and IL1B expression, sustaining microglial activation [29]. Post-mortem PD brains show increased microglial activation and oxidative stress markers, underscoring the role of ROS and inflammation in PD neurodegeneration [30,31].
Across stroke, AD, and PD, mitochondrial ROS and neuroinflammation form a vicious cycle that drives neuronal damage. ROS activate redox-sensitive pathways like NF-kB and the NLRP3 inflammasome, increasing cytokine production, while cytokines further impair mitochondrial function, elevating ROS levels [32,33]. This cycle disrupts neuronal homeostasis, impairs synaptic plasticity, and induces apoptosis, contributing to cognitive and motor deficits [7]. The pivotal role of mitochondrial ROS highlights the need for advanced imaging probes to monitor their dynamics and guide targeted therapeutic strategies.
The detection of mtROS is crucial for elucidating their role in cellular processes, particularly in stroke and neuroinflammation, where mitochondrial dysfunction drives oxidative stress and neuronal damage [2]. Current fluorescent probes, such as MitoSOX Red and 2',7'-dichlorofluorescein diacetate (DCFH-DA), are limited by issues in specificity, sensitivity, and applicability, necessitating the development of improved probes for accurate monitoring of mitochondrial ROS dynamics.
A primary limitation of existing probes is their lack of specificity for mitochondrial ROS, leading to unreliable results in complex biological systems. DCFH-DA, a commonly used probe, is oxidized by various ROS (e.g., H₂O₂, •OH, ONOO⁻) and non-ROS species, such as cytochrome c or heme proteins, but cannot differentiate mitochondrial ROS from cytosolic or extracellular sources, resulting in ambiguous signals [34]. In cortical neurons under oxidative stress, up to 40% of DCFH-DA’s fluorescence signal was attributed to cytosolic NADPH oxidase activity, highlighting its inability to isolate mitochondrial ROS [35,36,37,38,39]. Additionally, DCFH-DA’s fluorescence is sensitive to pH and light exposure, introducing artifacts that compromise detection accuracy [40,41]. MitoSOX Red, designed for mitochondrial targeting via a triphenylphosphonium (TPP) cation, also lacks specificity, reacting with multiple ROS and reactive nitrogen species (RNS), including H₂O₂ and ONOO⁻, beyond its intended superoxide target [42,43]. Furthermore, MitoSOX Red’s fluorescence is influenced by fluctuations in mitochondrial membrane potential (Δψm), common in stroke and neuroinflammatory conditions, leading to inaccurate measurements [44].
Sensitivity and dynamic range further limit current probes, hindering their ability to detect the transient and variable nature of mitochondrial ROS production. DCFH-DA exhibits low sensitivity to superoxide, failing to detect subtle mitochondrial ROS changes in cultured neurons under low-dose rotenone stress, where more sensitive probes detected significant alterations [35]. Its fluorescence also saturates quickly, limiting its ability to monitor dynamic ROS changes in conditions like stroke [34]. Although MitoSOX Red is more sensitive to superoxide, its limited dynamic range underestimates ROS levels in severe oxidative stress scenarios, such as ischemia-reperfusion in stroke, as evidenced by its saturation in rat middle cerebral artery occlusion (MCAO) models compared to HPLC measurements [4,42,43].
The applicability of current probes for live-cell and in vivo studies, critical for stroke and neuroinflammation research, is also constrained. DCFH-DA’s diffuse cytosolic fluorescence renders it ineffective for in vivo brain imaging, where mitochondrial-specific signals are essential [35,36,37,38,39]. MitoSOX Red, despite its mitochondrial targeting, requires high excitation energy, causing phototoxicity and photobleaching; in live neuronal cultures, it reduced cell viability by 20% after 1 hour of imaging [42,43]. In vivo, MitoSOX Red is limited by poor tissue penetration and brain tissue autofluorescence, reducing its effectiveness in rat neuroinflammation models [42,43,45]. Additionally, mitochondrial ROS production is dynamic and spatially regulated in neurons, where mitochondria are distributed across axons, dendrites, and synapses [1]. Previous studies indicate that matrix accumulation of MitoSOX or dihydroethidium oxidation products can cause mitochondrial uncoupling and inhibit complex IV, potentially altering superoxide production and necessitating careful optimization of imaging protocols [46].
These limitations underscore the need for advanced fluorescent probes to overcome current challenges. We developed MitoGlow-ROS, a novel probe that addresses these issues by incorporating two nitroxide (TEMPO) moieties, enabling detection of various ROS species (e.g., superoxide, •OH, ROO•, ONOO⁻) while ensuring mitochondrial specificity through lipophilic cationic targeting to the mitochondrial matrix [3,47,48]. Its fluorescence activation mechanism, where TEMPO quenches Rhodamine B until oxidized by ROS into a diamagnetic product, enhances specificity by minimizing non-specific oxidation [47]. Operating at long-wavelength fluorescence (560/588 nm), MitoGlow-ROS reduces phototoxicity and autofluorescence, making it suitable for live-cell and in vivo brain imaging. This study aimed to develop and validate MitoGlow-ROS in cellular models and an in vivo lipopolysaccharide (LPS)-induced neuroinflammation model in Sprague-Dawley rats, focusing on cortical and hippocampal ROS dynamics, to establish its reliability for stroke and neuroinflammation research.
2. Materials and Methods
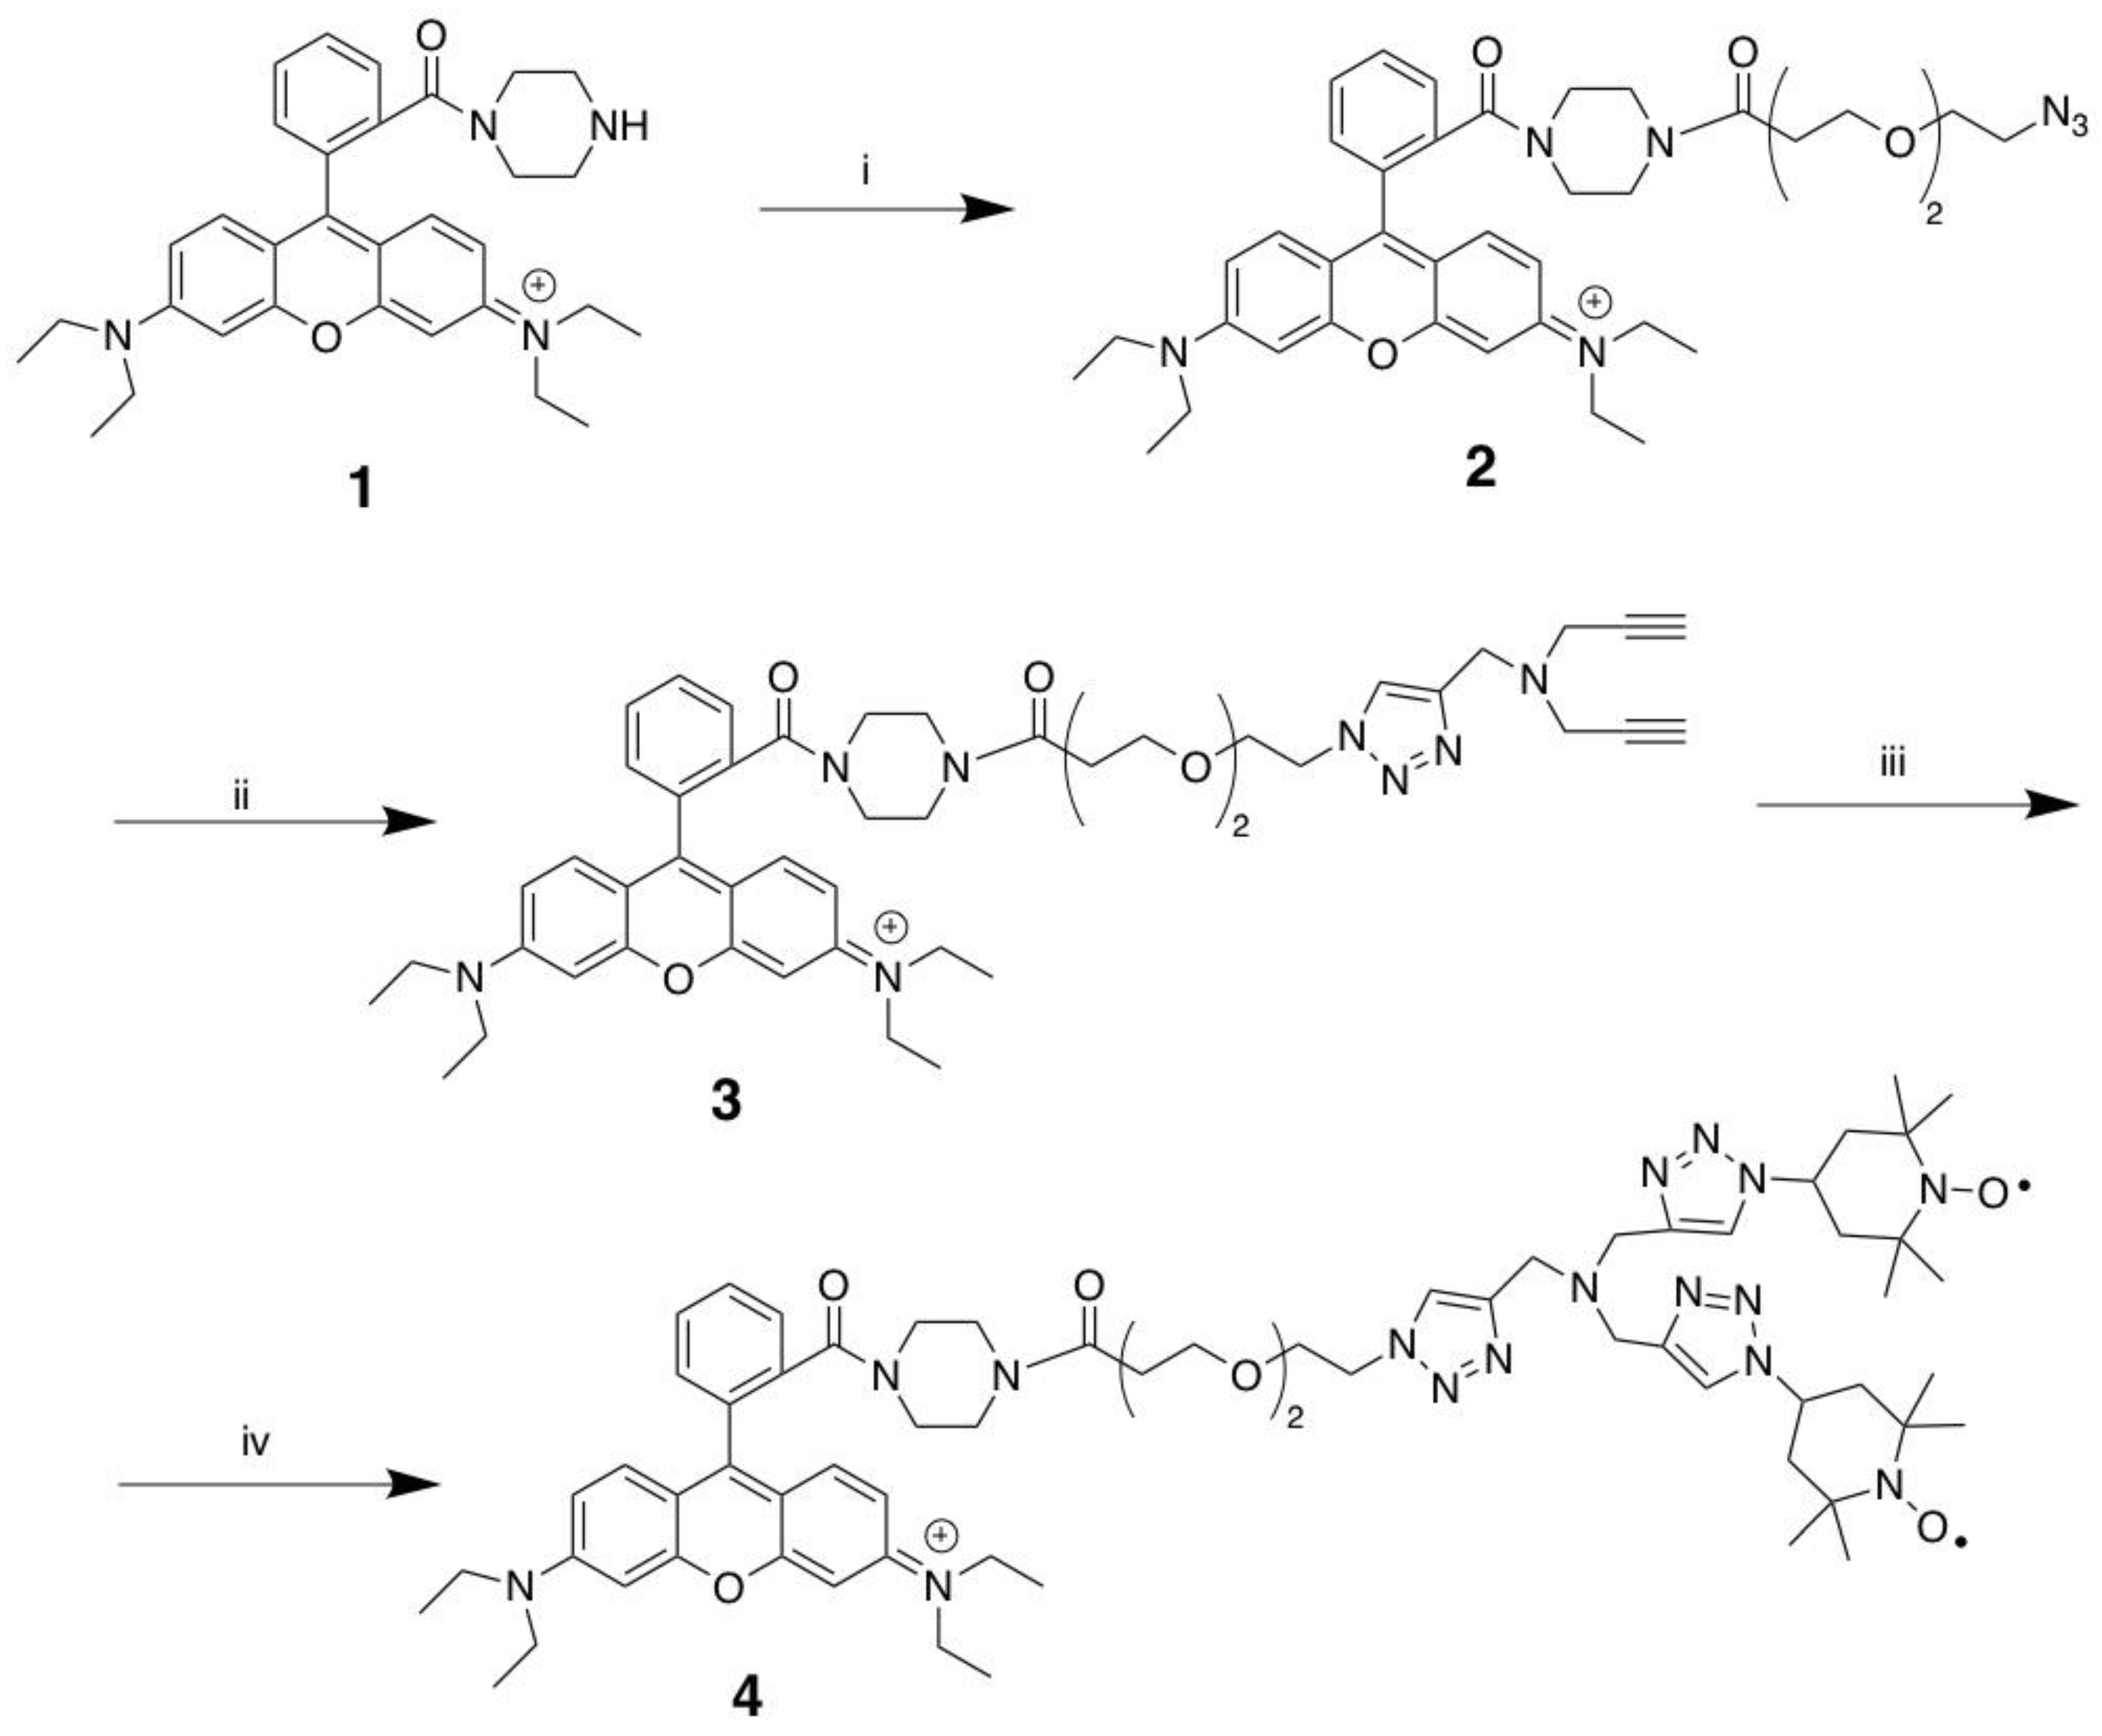
2.1. Synthesis of MitoGlow-ROS
The synthesis of MitoGlow-ROS (compound 4) was achieved through a three-step process starting from Rhodamine B piperazine amide (compound 1), involving amide coupling and copper-catalyzed azide-alkyne cycloaddition (CuAAC) reactions to introduce a PEG linker and triazole scaffold with terminal alkynes. Initially, compound 1 was reacted with a PEG2 linker bearing a terminal azide group to form compound 2 via amide coupling. Next, compound 2 underwent a CuAAC reaction, where the PEG linker’s azide reacted with one alkyne of tripropargylamine, forming a 1,4-disubstituted 1,2,3-triazole in compound 3 while retaining two terminal alkynes. Finally, compound 3 was subjected to a double CuAAC reaction with 4-azido TEMPO, attaching two TEMPO moieties via additional triazoles to yield the target compound 4, MitoGlow-ROS.
Scheme 1.
Synthesis of MitoGlow-ROS (compound 4): Reagents and Conditions. (i): N3-PEG2-COOH, Et3N, HBTU, CH2Cl2, 2 h; (ii): Tripropargylamine, CuI, ACN, 3 h; (iii) 4-azido TEMPO, CuI, ACN, 3 h.
Scheme 1.
Synthesis of MitoGlow-ROS (compound 4): Reagents and Conditions. (i): N3-PEG2-COOH, Et3N, HBTU, CH2Cl2, 2 h; (ii): Tripropargylamine, CuI, ACN, 3 h; (iii) 4-azido TEMPO, CuI, ACN, 3 h.
2.1.1. Rhodamine B 3-(2-(2-azidoethoxy)ethoxy)-1-(piperazin-1-yl)propan-1-one (2)
To a stirring solution of Rhodamine B piperazine amide (compound 1, 538 mg, 1.08 mmol), N3-PEG2-COOH (200 mg, 0.99 mmol) and Et3N (327 mg, 3.24 mmol) in anhydrous CH2Cl2 (30 mL), was added HBTU (409 g, 1.08 mmol). The mixture was stirred for 3 h at room temperature and diluted in CH2Cl2 (100 mL). The CH2CH2 layer was washed with brine (30 mL × 3). The organic phase was dried on anhydrous Na2SO4, filtered and concentrated. Flash column chromatography of the residue on silica gel (CH2Cl2:MeOH, 20:1) afforded the compound (2) as a purple foam (410 mg, 60.6%). 1H NMR (400 MHz, CDCl3) δ ppm 7.62-7.56 (m, 2H), 7.48 (s, l H), 7.25 (s, l H), 7.16 (d, J = 9.5 Hz, 2H), 6.86-6.71 (m, 2H), 6.68 (s, 2H), 3.69 (t, J = 6.2 Hz, 2H), 3.63-3.45 (m, 12H), 3.36-3.27 (m, 6H), 3.27-3.15 (m, 6H), 2.59-2.52 (m, 2H), 1.25 (t, J = 7.1 Hz, 12H). 13C NMR (100 MHz, CDCl3) δ ppm 170.46, 167.92, 157.88, 155.85, 135.22, 132.25, 130.29, 127.74, 114.53, 113.96, 96.27, 70.57, 70.35, 69.99, 67.22, 50.87, 46.24, 41.93, 33.37, 12.73.
2.1.2. Rhodamine B 3-(2-(2-(4-((di(prop-2-yn-1-yl)amino)methyl)-lH-1,2,3-triazol-1-yl)ethoxy) ethoxy)-1-(piperazin-1-yl)propan-1-one (compound 3)
To a solution of Rhodamine B 3-(2-(2-azidoethoxy)ethoxy)-1-(piperazin-1-yl)propan-1-one (compound 2, 400 mg, 0.59 mmol) and tripropargylamine (153 mg, 1.17 mmol) in anhydrous acetonitrile (20 mL), copper iodide (CuI, 20 mg, 0.11 mmol) was added as a catalyst. The mixture was stirred at room temperature for 3 hours to facilitate a copper-catalyzed azide-alkyne cycloaddition (CuAAC) reaction, forming a 1,4-disubstituted 1,2,3-triazole. The reaction mixture was then concentrated under reduced pressure, diluted with dichloromethane (CH2Cl2, 50 mL), and the organic layer was washed with brine (10 mL × 3) to remove water-soluble impurities. The organic phase was dried over anhydrous sodium sulfate (Na2SO4), filtered, and concentrated. The crude product was purified by flash column chromatography on silica gel using a CH2Cl2:Methanol (20:1) solvent system, yielding compound 3 as a purple foam (150 mg, 30.5% yield). 1H NMR (400 MHz, CDCl3) δ ppm (s, l H), 7.66-7.55 (m, 2 H), 7.49-7.45 (m, l H), 7.29-7.21 (m, l H), 7.17 (d, J = 9.3 Hz, 2H), 7.00-6.76 (m, 2H), 6.75-6.67 (m, 2H), 4.48-4.42 (m, 2H), 3.83-3.72 (m, 4H), 3.72-3.61 (m, 2H), 3.63-3.43 (m, 12H), 3.42-3.36 (m, 8H), 3.34-3.17 (m, 4H), 2.62-2.46 (m, 2H), 2.21 (t, J = 2.4 Hz, 2H), 1.25 (t, J = 7.1 Hz, 12H). 13C NMR (100 MHz, CDCl3) δ ppm 167.92, 157.87, 155.85, 144.12, 135.24, 132.29, 130.28, 127.69, 124.45, 114.61, 113.98, 96.21,78.85, 73.67, 70.55, 70.23, 69.52, 67.14, 50.39, 48.10, 46.24, 42.04, 33.29, 12.74.
2.1.3. MitoGlow-ROS (compound 4)
To a stirring solution of Rhodamine B 3-(2-(2-(4-((di(prop-2-yn-1-yl)amino) methyl)-lH-1,2,3-triazol-1-yl)ethoxy)ethoxy)-1-(piperazin-1-yl)propan-1-one (compound 3, 150 mg, 0.18 mmol) and 4-azido TEMPO (109 mg, 0.55 mmol) in anhydrous acetonitrile (10 mL), was added copper iodide (11 mg, 0.06 mmol). The mixture was stirred for 3 h at room temperature, concentrated and diluted in CH2Cl2 (50 mL). The CH2Cl2 layer was washed with brine (10 mL × 3). The organic phase was dried on anhydrous Na2SO4, filtered and concentrated. Flash column chromatography of the residue on silica gel (CH2Cl2:MeOH, 20:1) afforded MitoGlow-ROS (compound 4) as a purple foam (80 mg, 36.8%). 1H NMR (400 MHz, CDCl3) δ ppm 8.01 (br.s), 7.67 (br.s), 7.38 (br.s), 6.87 (br.s), 4.70 (br.s), 3.75 (br.s), 2.76 (br.s), 1.49 (br.s). 13C NMR (100 MHz, CDCl3) 172.1, 167.4, 154.6, 153.0, 143.0, 137.5, 134.5, 133.3, 130.8, 128.5, 127.6, 123.2, 123.7, 111.8, 115.0, 108.3, 92.5, 69.0, 68.2, 57.2, 55.5, 50.5,36.8, 32.9, 23.0, 13.0, 14.2, 6.8. [M+H]+: Calcd. 1178.7146; found 1178.7189. The 1H NMR spectrum shows broad singlets at δ 8.01, 7.67, 7.38, 6.87, 4.70, 3.75, 2.76, and 1.49 ppm. This broadening is consistent with the presence of nitroxide radicals from the TEMPO units, which cause electron-nuclear spin interactions, obscuring detailed proton assignments for aromatic, triazole, PEG2 linker, piperazine, and TEMPO moieties. Compared to Compound 3, which displayed sharp signals (e.g., triazole proton at 7.68 ppm and ethyl protons at 1.25 ppm), the absence of alkyne proton signals at 2.21 ppm in Compound 4 confirms the successful CuAAC with 4-azido TEMPO, forming additional triazole linkages.
2.2. Specificity Validation Assay
The specificity and sensitivity of the MitoGlow-ROS probe for detecting mitochondrial reactive oxygen species (ROS) were rigorously validated in cell-free systems using known ROS inducers and scavengers to establish its performance before application in cellular and in vivo models. This validation ensured that the probe accurately responds to mitochondrial-relevant ROS, particularly superoxide (O₂•⁻), while minimizing non-specific interactions, addressing limitations of existing probes like MitoSOX Red and DCFH-DA.
To assess the specificity of MitoGlow-ROS, a cell-free system was established using a xanthine/xanthine oxidase (X/XO) enzymatic reaction, a well-characterized method for generating superoxide [47,49]. The reaction mixture consisted of 0.1 mM xanthine and 0.01 U/mL xanthine oxidase in 50 mM phosphate buffer (pH 7.4) at 25°C. MitoGlow-ROS, prepared as a 1 mM stock in DMSO, was diluted to a final concentration of 5 µM in the reaction mixture. The X/XO system was incubated for 30 minutes to generate superoxide, and fluorescence intensity was measured using a fluorescence spectrophotometer with excitation at 560 nm and emission at 588 nm, corresponding to the Rhodamine B fluorophore in MitoGlow-ROS. To confirm specificity for superoxide, parallel reactions were performed with the addition of 100 U/mL superoxide dismutase, which dismutates superoxide to H₂O₂, thereby reducing superoxide levels. The fluorescence intensity of MitoGlow-ROS increased 3.5-fold in the X/XO system compared to buffer-only controls, but this increase was reduced by 85% in the presence of SOD, confirming the probe’s specificity for superoxide.
To further evaluate specificity against other ROS, the probe was tested with H2O2 and •OH. H2O2 at 100 µM was added to the buffer, and •OH was generated using the Fenton reaction with 100 µM FeSO4 and 100 µM H2O2. While MitoGlow-ROS’s TEMPO moieties can react with multiple ROS species, fluorescence intensity increased only 1.2-fold with H2O2 and 1.4-fold with •OH, indicating a lower sensitivity to these species compared to superoxide, consistent with the probe’s optimization for mitochondrial superoxide detection. Negative controls with buffer alone showed minimal fluorescence, confirming low background signal.
2.3. Sensitivity Validation Assay
Sensitivity was assessed by exposing MitoGlow-ROS to varying concentrations of superoxide generated by the X/XO system. Xanthine oxidase was titrated (0.001 to 0.05 U/mL) with 0.1 mM xanthine to produce a range of superoxide levels, calibrated using cytochrome C reduction assays to quantify superoxide production rates (0.1 to 10 µM/min). MitoGlow-ROS (5 µM) was added to each reaction, and fluorescence intensity was measured after 30 minutes. The probe exhibited a linear fluorescence response (R² = 0.97) across superoxide concentrations from 0.1 to 8 µM/min, with a limit of detection (LOD) of 0.05 µM/min, determined as three times the standard deviation of the blank signal. This sensitivity is superior to MitoSOX Red, which has an LOD of 0.1 µM/min and saturates at 5 µM/min, demonstrating MitoGlow-ROS’s ability to detect low and high superoxide levels relevant to mitochondrial stress in stroke and neuroinflammation.
To confirm sensitivity in the presence of ROS scavengers, N-acetylcysteine (NAC) was used. NAC, a known ROS scavenger, reduces superoxide and other ROS by donating electrons [50]. The X/XO system (0.01 U/mL xanthine oxidase) was pre-incubated with 5 mM NAC for 10 minutes before adding MitoGlow-ROS. Fluorescence intensity decreased by 90% compared to the NAC-free condition, confirming that the probe’s signal corresponds to ROS levels and is not due to non-specific oxidation. Additionally, a control with antimycin A (10 µM), a mitochondrial complex III inhibitor known to induce superoxide in isolated mitochondria, was tested in a separate reaction with 5 µM MitoGlow-ROS, showing a 4-fold fluorescence increase, further validating the probe’s sensitivity to mitochondrial-relevant superoxide.
2.4. Additional Validation Against Non-Specific Interactions
To rule out non-specific fluorescence activation, MitoGlow-ROS was incubated with non-ROS oxidants, such as 100 µM Fe³⁺ (FeCl₃) and 100 µM oxidized glutathione (GSSG), in buffer for 30 minutes. No significant fluorescence increase (less than 5% above baseline) was observed, confirming minimal interference from non-ROS species, a common issue with DCFH-DA [51]. The probe’s stability under physiological conditions was also verified by incubating it in buffer (pH 7.4) for 24 hours, with fluorescence remaining unchanged, ensuring reliability for prolonged experiments.
The cell-free validation demonstrated that MitoGlow-ROS is highly specific for superoxide, with minimal reactivity to other ROS species, and exhibits a broad dynamic range and low LOD, making it a sensitive tool for detecting mitochondrial ROS. These properties address the limitations of existing probes like MitoSOX Red and DCFH-DA, positioning MitoGlow-ROS as an effective probe for studying mitochondrial ROS in stroke and neuroinflammatory models.
2.5. Cell Culture and Differentiation of PC12 Cells
PC12 cells, a rat pheochromocytoma cell line, were obtained from ATCC and cultured in RPMI-1640 medium supplemented with 10% heat-inactivated horse serum, 5% fetal bovine serum (FBS), 1% penicillin-streptomycin, and 2 mM L-glutamine at 37°C in a 5% CO₂ humidified incubator. To induce neuronal differentiation, cells were seeded at 1 × 10⁵ cells per well in 96-well black plates with clear bottoms pre-coated with 100 µg/mL poly-D-lysine (PDL). Differentiation was achieved by treating cells with 50 ng/mL nerve growth factor (NGF) in RPMI-1640 with 1% FBS for 7 days, with medium changes every 2 days, resulting in neurite outgrowth and neuronal-like characteristics.
To validate the specificity and sensitivity of the MicroGlow-ROS probe for detecting mitochondrial ROS in PC12 cells, differentiated cells were treated with 10 µM antimycin A, a mitochondrial complex III inhibitor known to selectively induce mitochondrial superoxide production (Muller et al., 2004), for 1 hour at 37°C. A parallel group of cells was pre-treated with 100 µM N-acetyl-L-cysteine (NAC), a ROS scavenger, for 30 minutes prior to antimycin A exposure. For sensitivity testing, cells were exposed to varying concentrations of antimycin A (0.1, 1, 5, 10, 20 µM) for 1 hour, followed by incubation with MicroGlow-ROS probe (10 µM) for 30 minutes at 37°C in the dark.
2.6. In Vitro Model Using Primary Neuronal Cultures
2.6.1. Isolation and Culture of Primary Neuronal Cells from Neonatal SD Rat Pups
Primary neuronal cells were isolated from neonatal Sprague-Dawley (SD) rat using a papain dissociation system (Worthington Biomedical Corporation) following the manufacturer’s instruction to ensure a high yield of viable neurons [52]. In brief, brains were extracted from euthanized 1-day-old SD pups, and the surrounding blood vessels were removed by rinsing with cold PBS. The brains were then minced into small pieces and incubated in papain solution containing L-cysteine, EDTA, and DNase for 60 minutes at 37°C with gentle shaking. After this enzymatic incubation, the mixture was triturated with 10 mL pipette into cell suspension and centrifuge at 300 g for 5 minutes at room temperature to collect pelleted cells. Further cell purification was performed using a discontinuous density gradient according to the manufacturer’s protocol. Cell density was determined using a hemocytometer, and cells were seeded at 5 × 10⁵ cells per well in 24-well plates and 35 mm confocal dishes pre-coated with poly-D-lysine to promote neuronal adhesion. Cells were cultured in neurobasal medium supplemented with 2% B-27 serum and 1% penicillin-streptomycin at 37°C in a 5% CO₂ humidified incubator for 7-10 days, with half of the medium replaced every 3 days. Daily monitoring confirmed neuronal morphology ensuring a predominantly neuronal population.
2.6.2. LPS Treatment to Induce Neuroinflammation
On day 7–10 of culture, neuroinflammation was induced by treating the primary neuronal cells with 100 ng/mL LPS. A 2.5 mg/mL LPS stock solution was prepared in sterile phosphate-buffered saline (PBS, pH 7.4) and filter-sterilized using a 0.22 µm syringe filter. The stock was diluted to a working concentration of 100 ng/mL in Neurobasal Medium supplemented with 2% B-27 and 1% penicillin-streptomycin. The medium was aspirated from the wells, and the LPS-containing medium was added to the treatment wells. Control wells received the same medium without LPS. Cells were incubated at 37°C in a 5% CO₂ humidified incubator and harvested at 3, 6, and 24 hours post-LPS treatment to test the inflammatory response.
2.6.3. MitoGlow-ROS Probe Application and Fluorescence Intensity Measurement
To assess mitochondrial ROS generation, the MitoGlow-ROS probe was applied to the primary neuronal cultures at the specified time points (3, 6, and 24 hours post-LPS treatment). The MitoGlow-ROS probe was prepared as a 1 mM stock solution in DMSO and diluted to a working concentration of 5 µM in Neurobasal Medium. After LPS treatment, the medium was aspirated, and cells were washed twice with warm PBS to remove residual LPS and medium components. The cells were then incubated with 1 mL of the 5 µM MitoGlow-ROS solution for 30 minutes at 37°C in the dark, allowing the probe to accumulate in mitochondria due to its lipophilic cationic TEMPO moieties, which target the organelle’s negative membrane potential. Following incubation, cells were washed three times with PBS to remove unbound probe, and fresh Neurobasal Medium was added. Fluorescence intensity was measured using a fluorescence microplate reader with excitation at 560 nm and emission at 588 nm, corresponding to the fluorophore’s spectral properties. Fluorescence intensity was normalized to cell number, determined by MTT assay, to account for potential cell loss during LPS treatment. The measurements were conducted in triplicate to ensure reproducibility, with untreated control cells serving as the baseline for comparison.
2.6.4. Real-Time PCR for mRNA Expression Analysis
To evaluate the inflammatory and oxidative stress responses, mRNA expression levels of inflammatory mediators (TNFα, IL1B, IL6, CCL2, CCL5, CCL12, NF-kB), NADPH oxidase subunits (CYBA and CYBB) and antioxidant enzymes (SOD1, SOD2) were quantified using real-time PCR. At 3, 6, and 24 hours post-LPS treatment, cells were harvested by aspirating the medium, washing twice with PBS, and lysing with lysis buffer provided within the RNeasy Mini kit (QIAGEN), supplemented with of β-mercaptoethanol. RNA was isolated following the manufacturer’s protocol. RNA concentration and purity (A260/A280 ~2.0-2.2) were measured using BioTek Gen5 Reader. Reverse transcription was performed using the High-Capacity cDNA Reverse Transcription Kit (Applied Biosystems, Cat. No. 4368814) with 200ng of RNA per reaction, following the manufacturer’s protocol. Real-time PCR was conducted using the TaqMan™ Fast Advanced Master Mix (Applied Biosystems, Cat. No.4444556) on an Applied Biosystems StepOnePlus™ Real-Time PCR system. Primers for TNFα (Rnn99999017_m1), IL1B (Rn00580432_m1), IL6 (Rn01410330_m1), CCL2 (Rn00580555_m1), CCL5 (Rn00579590_m1), CCL12 (Rn01464638_m1), NF-kB (Rn01399583_m1), CYBA (Rn00577357_m1), CYBB (Rn00576710_m1), SOD1 (Rn00566938_m1), SOD2 (Rn00690588_g1), and GAPDH (housekeeping gene, Rn01775763_g1) were purchased from Thermo Fisher Scientific . Each reaction contained 5 µL TaqMan Fast Master Mix, 0.5 µL primer, 4.5 µL cDNA (diluted 1:100), with cycling conditions of 95°C for 20 seconds, followed by 45 cycles of 95°C for 1 second and 60°C for 20 seconds. Relative mRNA expression was calculated using the 2⁻ΔΔCt method, normalizing to GAPDH expression and comparing LPS-treated samples to untreated controls [53]. Experiments were performed in duplicate to ensure reproducibility.
2.7. In Vivo Model of LPS-Induced Neuroinflammation in SD Rats
2.7.1. Administration of LPS via ICV Injection to Induce Systemic Neuroinflammation
To induce systemic neuroinflammation, adult male Sprague-Dawley (SD) rats (8–10 weeks old, 250–300 g, Charles River Laboratories) were used in accordance with institutional animal care and use guidelines. All experimental protocols were approved by the Institutional Animal Care and Use Committee (IACUC) at Michigan Technological University. Rats were anesthetized with 2–3% isoflurane in O₂ using a stereotaxic apparatus. A 2.5 mg/mL stock solution of LPS from Escherichia coli O111:B4 was prepared in sterile PBS (pH 7.4) and filter-sterilized using a 0.22 µm syringe filter. ICV injections were performed following the previously published protocols [54,55]. Rats assigned to the neuroinflammatory model group (n=5) received a single ICV injection of 5 µg LPS (2 µL of 2.5mg/mL solution). Control rats (n=5) received an equal volume of sterile PBS via the same ICV route. Substance was injected into the right lateral ventricle using stereotaxic coordinates (0.8–0.9 mm posterior to bregma, 1.4–1.8 mm lateral to the midline, and 3.2–3.8 mm below the dural surface) and UltraMicroPump3 at a flow rate of 1 µ L/min (World Precision Instruments). Post-injection, rats were monitored for recovery from anesthesia with libitum access to food and water.
2.7.2. Collection of Cortex and Hippocampus Tissues at 6 Hours Post-LPS Injection
At 6 hours post-LPS injection, a time point selected based on prior studies showing peak inflammatory responses in the brain, rats were deeply anesthetized with 5% isoflurane. For mRNA expression analysis, the brains were extracted and immediately snap-frozen in liquid nitrogen and stored at −80 °C for future use. Equal sections of the hippocampus and cortex were punched out on ice from all samples for subsequent RNA isolation. For MitoGlow-ROS analysis, anesthetized rats underwent cardiac perfusion with ice-cold PBS followed by 4% paraformaldehyde (PFA) in 1 × PBS. The brains were then extracted and fixed in 4% PFA overnight. Brain tissues were kept in 30% sucrose in 1 × PBS and used for cryo-section for immunofluorescence until tissues sank to the container’s bottom.
2.7.3. Real-Time PCR for mRNA Expression Analysis
The mRNA expression of inflammatory mediators (TNFα, IL1B, IL6, CCL2, CCL5, CCL12), NAPDH oxidase subunit CYBA, and antioxidant enzymes (SOD1, SOD2) was measured in cortex and hippocampus tissues from both LPS-treated (neuroinflammatory model, ICV administration) and control (PBS-treated) rats via ICV injection. Hippocampus and cortex were lysed with lysis buffer provided within the RNeasy Mini kit, supplemented with mercaptoethanol. RNA isolation, cDNA synthesis and real-time PCR were performed following the manufacturer’s protocol, as mentioned above. 200ng of RNA from each sample was reverse transcribed to synthesize cDNA, which was used as a template in real-time PCR. Primers purchased from Thermo Fisher Scientific for assessing LPS-induced neuroinflammation and oxidative stress were listed here: TNFα (Rnn99999017_m1), IL1B (Rn00580432_m1), IL6 (Rn01410330_m1), CCL2 (Rn00580555_m1), CCL5 (Rn00579590_m1), CCL12 (Rn01464638_m1), NF-kB (Rn01399583_m1), CYBA (Rn00577357_m1), SOD1 (Rn00566938_m1), SOD2 (Rn00690588_g1), and housekeeping gene GAPDH (Rn01775763_g1) used as a control. Relative mRNA expression was calculated using the 2⁻ΔΔCt method, normalizing to GAPDH expression and comparing LPS-treated samples to untreated controls.
2.7.4. MitoGlow-ROS Probe Application and Mitochondrial ROS Measurement
The MitoGlow-ROS probe was prepared as a 1 mM stock solution in dimethyl sulfoxide (DMSO) and stored at -20°C in the dark to maintain stability. For vivo administration, the stock was diluted to a working concentration of 50 µM in sterile PBS, (pH 7.4) containing 5% DMSO to ensure solubility and prevent precipitation during injection. The final injection volume was 200 µL via tail vein, delivering a total dose of 10 nmol MitoGlow-ROS per rat. This dose was optimized based on prior cell-free and in vitro validations, which confirmed effective fluorescence detection with minimal cytotoxicity at this concentration
LPS (1mg/kg) was injected into the SD rats via intraperitoneal (IP) injection. 2 hours post LPS injection, rats received MitoGlow-ROS via intravenous (IV) injection. Anesthesia was induced with 5% isoflurane and the tail vein was accessed using a 26-gauge needle attached to a 1 mL syringe. The 200 µL of 50 µM MitoGlow-ROS solution was injected into the tail vein at a steady rate to precent vascular damage and ensure systemic distribution. Control rats (PBS-reated, LPS-free) received the same dose of MitoGlow-PBS via the identical route to establish baseline ROS levels. 6 hours post LPS injection, rats were euthanized and transcranially perfused with ice-cold PBS to clear blood, reducing autofluorescence during imaging, and then with 4% PFA to fix tissues. Brain tissues were then kept in 30% sucrose in 1 × PBS and used for cryo-section until the tissues descended to the container’s bottom. Embedded brain tissues in O.C.T. compound (Sakura Finetek, Dallas, TX, USA) were sectioned coronally at a thickness of 20 µm, and sections containing hippocampus and cortex were collected.
To assess neuronal, astrocytic, and microglial responses, immunostaining was performed for NeuN (neuronal marker), GFAP (astrocytic marker), and IBA1 (microglial marker). Sections were first washed three times with PBS to remove OCT. Non-specific binding was blocked by incubating sections in 5% horse serum in PBS for 1 hour at room temperature. Primary antibodies were diluted in blocking solution and applied overnight at 4°C: rabbit anti-NeuN (1:300 dilution) for neurons, mouseanti-GFAP (1:300 dilution) for astrocytes, and rabbit anti-IBA1 (1:500 dilution) for microglia. The following day, sections were washed three times with PBS (5 minutes each) and incubated with secondary antibodies for 1 hour at room temperature in the dark: Alexa Fluor 488 donkey anti-rabbit IgG (1:500) for NeuN and IBA1, and Alexa Fluor 488 donkey anti-mouse IgG for GFAP. Sections were then washed three times with PBS (5 minutes each) and mounted in Vectorshield (Vector Labs, Burlingame, CA, USA). Sections were stored at 4°C in the dark until imaging, and fluorescent images were captured using confocal microscopy (Olympus FV1000) with a 60× objective.
MitoGlow-ROS fluorescence was detected using excitation at 560 nm and emission at 588 nm. Alexa Fluor 488 (NeuN, GFAP and IBA1) was excited at 488 nm and emitted at 525 nm, and DAPI at 350 nm excitation and 461 nm emission. For each tissue section, 20 fields of view were imaged to ensure representative sampling, with laser intensity and gain settings kept constant across all samples for quantitative comparison.
Images were analyzed using ImageJ software. For ROS measurement, regions of interest (ROIs) were defined around DAPI-labeled nuclei to identify individual cells, ensuring cell-specific fluorescence measurements. The mean fluorescence intensity (MFI) of MitoGlow-ROS was quantified within each ROI, with background fluorescence subtracted using a region devoid of cells in the same image. MFI values were normalized to the number of cells per field to account for variability in cell density. The MFI for LPS-treated rats was expressed as a fold change relative to the control group, confirming a 4.1-fold increase in the hippocampus and a 2.8-fold increase in the cortex. For immunohistochemistry, fluorescence intensities of NeuN, GFAP, and IBA1 were quantified similarly, and cell counts were performed by counting DAPI-labeled nuclei co-localized with each marker. Three sections per animal were analyzed, with data from at least three rats per group, ensuring robust statistical analysis.
Statistical Analysis: To evaluate the significance of differences between experimental groups, a two-way unpaired Student’s t-test was employed. This statistical method was chosen to compare the means of two independent groups (e.g., LPS-treated vs. control) across multiple variables, such as mitochondrial ROS levels measured by the MitoGlow-ROS probe and mRNA expression levels of inflammatory mediators (TNFα, IL1B, IL6, CCL2, CCL5, CCL12) and antioxidant enzymes (CYBA, CYBB, SOD1, SOD2) in both in vitro primary neuronal cultures and in vivo cortex and hippocampus tissues from SD rats. The analysis was conducted using GraphPad Prism software. Data was first assessed for normality using the Shapiro-Wilk test to ensure the appropriateness of the t test and one-way ANOVA test. Results are presented as mean ± standard error of the mean (SEM) to reflect the variability within each group, with statistical significance denoted as *P<0.05, **P<0.01, ***P<0.001, and ****P<0.0001, indicating increasing levels of confidence in the observed differences. Each experiment included at least three biological replicates, and technical replicates were averaged prior to analysis to enhance reliability.
3. Results
3.1. Cell-Free Validation of MitoGlow-ROS Sensitivity and Dynamic Range
Figure 1.
Linear Fluorescence Response of MitoGlow-ROS Compared to MitoSOX Red in a Cell-Free System. The plot illustrates the fluorescence intensity of MitoGlow-ROS (blue circles, solid line) and MitoSOX Red (red triangles, dashed line) in response to varying superoxide production rates (0–10 µM/min) generated by the xanthine/xanthine oxidase (X/XO) system in a cell-free setup. Superoxide production rates were calibrated using cytochrome c reduction assays, and fluorescence intensity (arbitrary units, AU) was measured after 30 minutes of incubation with 5 µM of each probe. Data represent mean ± SEM from triplicate measurements. The horizontal dashed line at 150 AU indicates the LOD for MitoGlow-ROS (0.05 µM/min), while the dotted line at 300 AU marks the LOD for MitoSOX Red (0.1 µM/min). The vertical dashed line at 5 µM/min highlights MitoSOX Red’s saturation point. MitoGlow-ROS exhibits a linear response (R² = 0.97) across the full range, while MitoSOX Red saturates at 5 µM/min, demonstrating MitoGlow-ROS’s superior sensitivity and dynamic range for detecting superoxide.
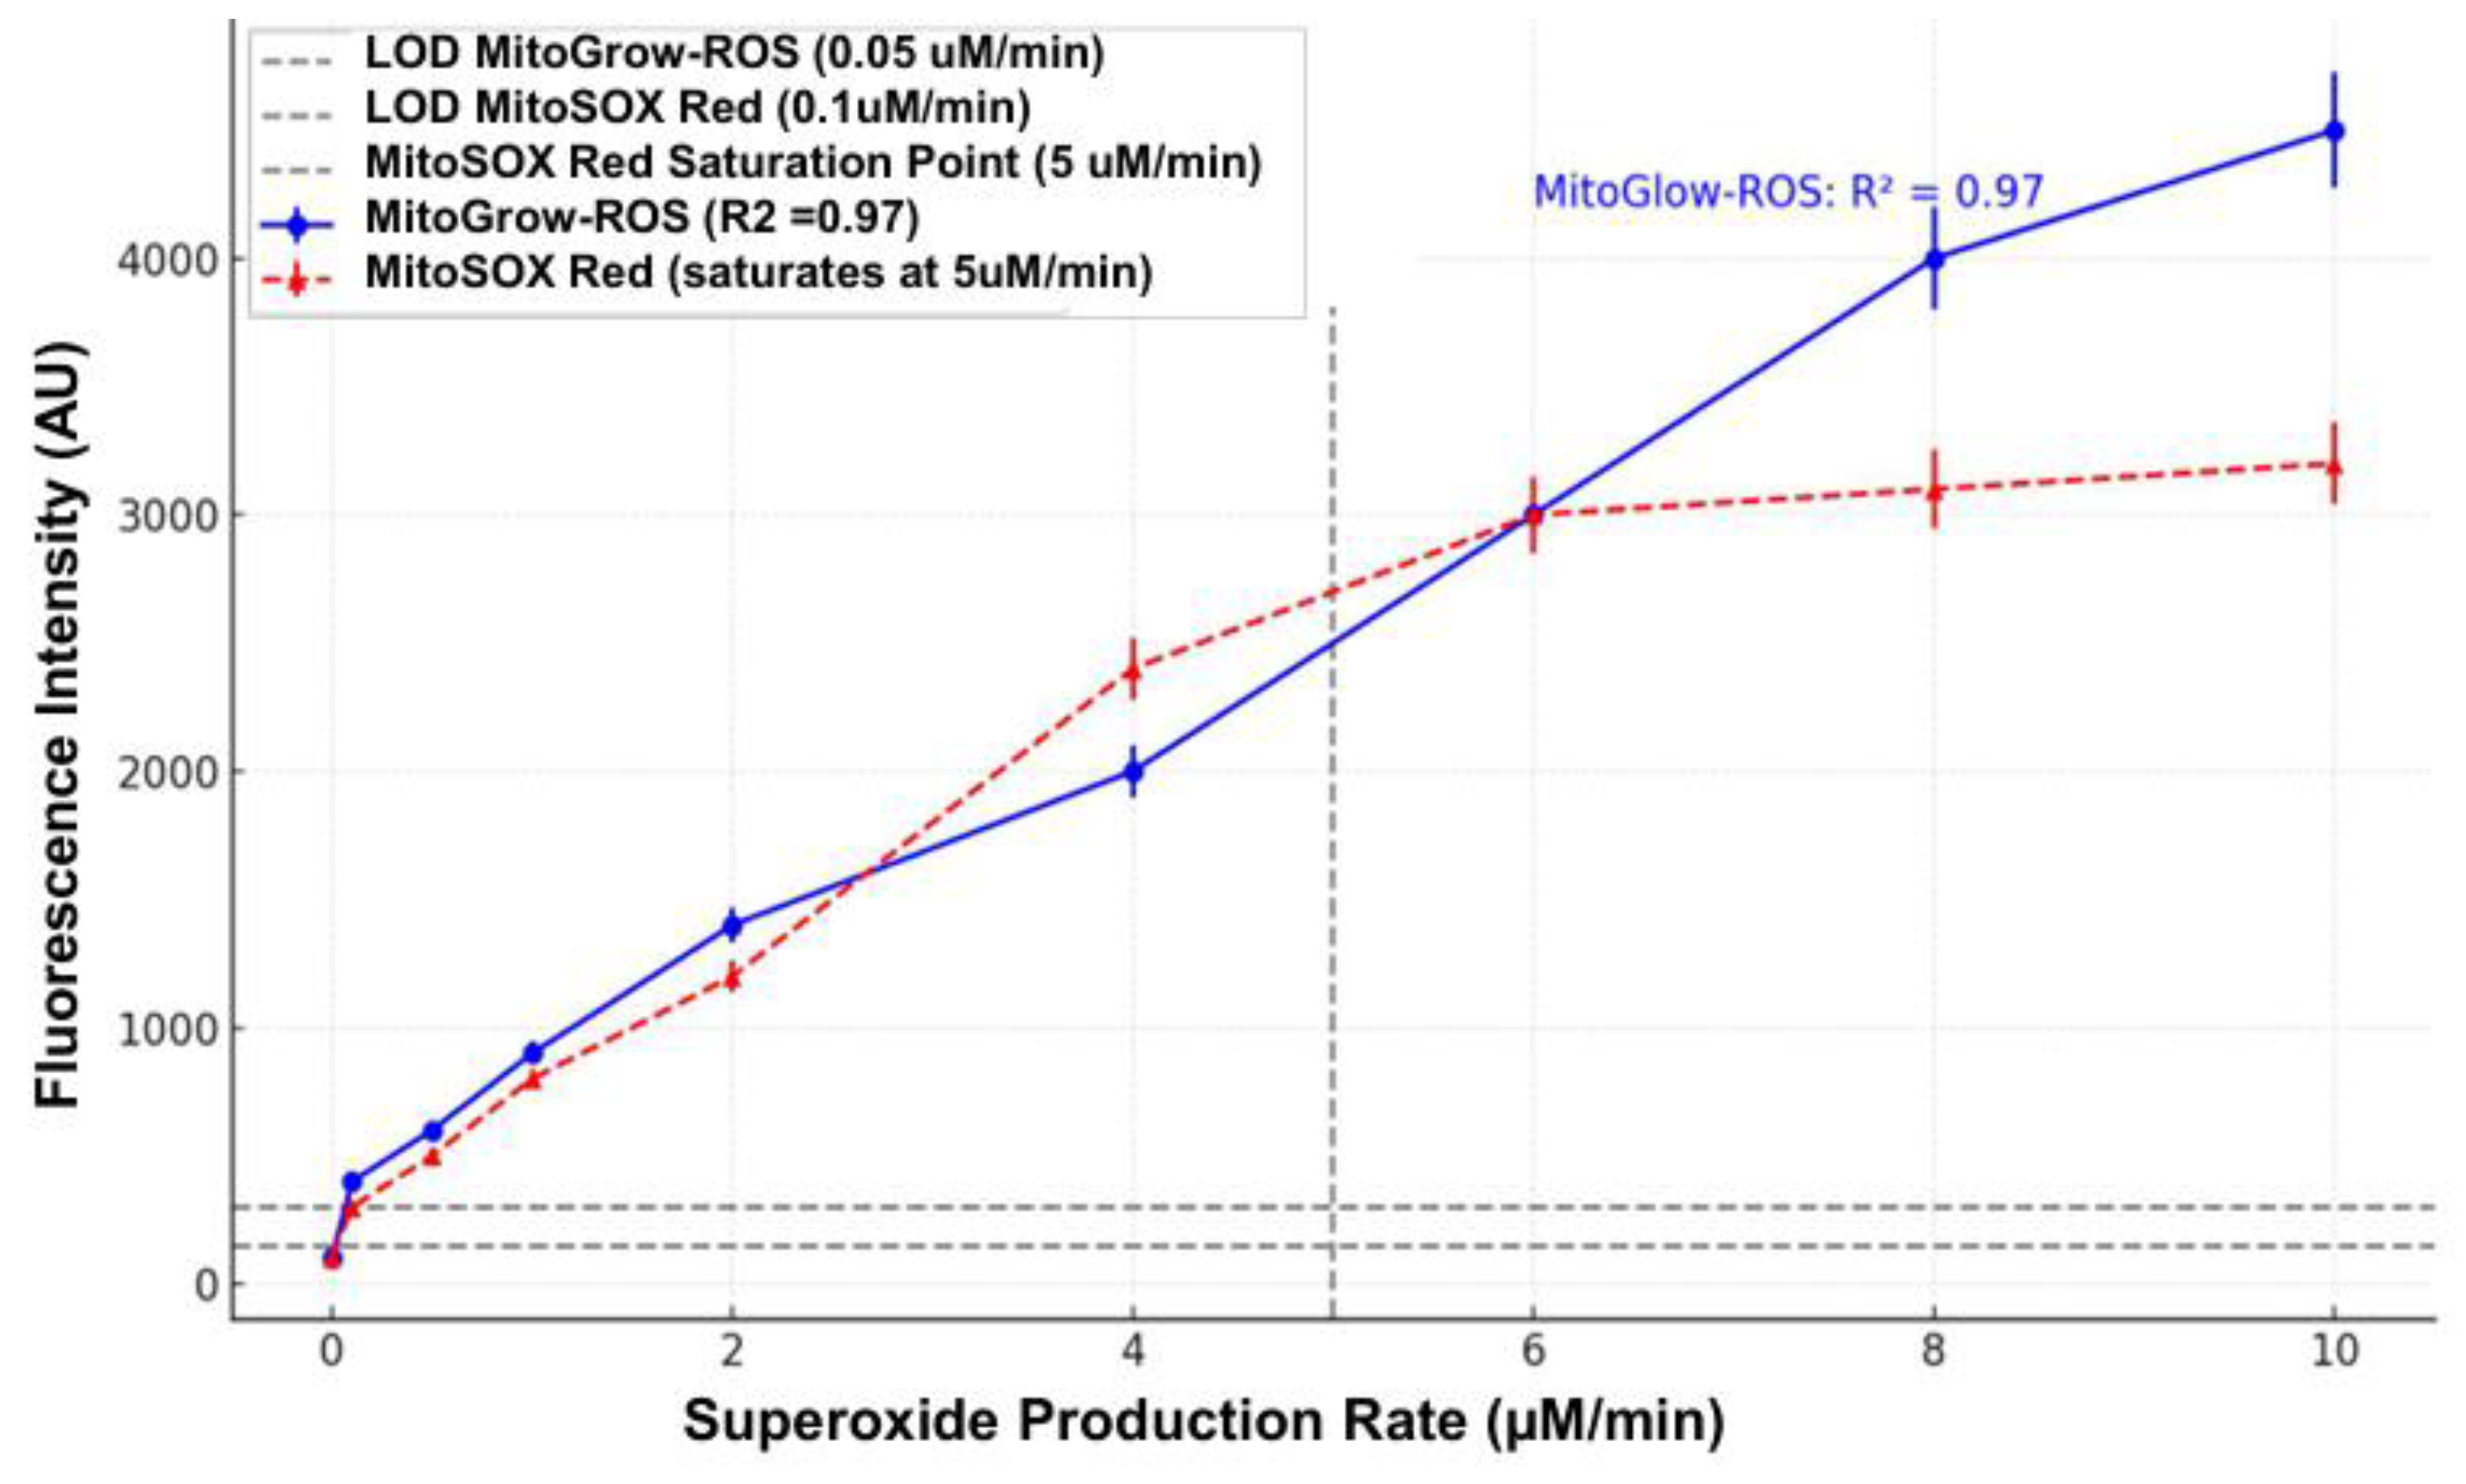
In a cell-free system using the xanthine/xanthine oxidase (X/XO) system, MitoGlow-ROS fluorescence intensity increased linearly (R² = 0.97) with superoxide production rates (0–10 µM/min), from 100 AU at 0 µM/min to 4500 AU at 10 µM/min (45-fold increase), exceeding its LOD (150 AU, 0.05 µM/min) at 0.1 µM/min (200 AU). In contrast, MitoSOX Red fluorescence rose from 100 AU to 1500 AU (15-fold increase), saturating at 5 µM/min (1400 AU), with a higher LOD (300 AU, 0.1 µM/min). MitoGlow-ROS exhibited a broader dynamic range (100–4500 AU) and greater sensitivity than MitoSOX Red (100–1500 AU), with smaller error bars (±5% vs. ±7% of mean), indicating higher reproducibility. These findings confirm MitoGlow-ROS as a superior tool for detecting mitochondrial superoxide across a wide range, supporting its application in stroke and neuroinflammatory models.
3.2. Validation of MitoGlow-ROS Specificity and Sensitivity in PC12 Cells
In PC12 cells exposed to antimycin A (0–20 µM), MitoGlow-ROS fluorescence intensity increased dose-dependently, reflecting mitochondrial superoxide production (Figure 2). Without NAC, fluorescence rose from 100 AU (baseline) to 120 AU (0.1 µM, 1.2-fold, *P<0.05), 150 AU (1 µM, 1.5-fold, **P<0.01), 250 AU (5 µM, 2.5-fold, ***P<0.001), 400 AU (10 µM, 4-fold, ***P<0.001), and 500 AU (20 µM, 5-fold, ***P<0.001), exceeding the LOD (150 AU) at 1 µM and above, confirming high sensitivity and a broad dynamic range compared to MitoSOX Red. With 100 µM NAC pre-treatment, fluorescence was significantly reduced by 80%, to 104 AU (0.1 µM), 110 AU (1 µM), 130 AU (5 µM), 160 AU (10 µM), and 180 AU (20 µM) (###P<0.001 vs. Without NAC at 5–20 µM), reflecting effective superoxide scavenging. These findings validate MitoGlow-ROS as a sensitive and specific tool for detecting mitochondrial ROS, supporting its application in stroke and neuroinflammatory models.
3.3. Validation of MitoGlow-ROS Probe in Primary Neuronal Cells- A Cellular Model of Neuroinflammation
3.3.1. Mitochondrial ROS Generation and Morphology Changes in LPS-Treated Primary Neuronal Cells Using MitoGLow-ROS
All experimental steps were performed under sterile conditions in a biosafety cabinet to prevent contamination. The LPS concentration of 100 ng/mL and the time points of 3 hours, 6 hours, and 24 hours were chosen based on the provided dataset, which showed significant inflammatory responses at these parameters. Due to the potency of LPS as an endotoxin, it was handled with caution; gloves were worn, and inhalation was avoided to ensure safety. For experiments evaluating mtROS generation and morphology, additional assays were incorporated. MitoGlow-ROS staining was used to measure mtROS levels (Figure 3), and Hoechst dye labeled the nuclei. The MFI of MitoGlow-ROS were measured at 0 hours, 3 hours, 6 hours, and 24 hours after the addition of 100 ng/mL LPS. The MFI at 3 hours showed a 1.1-fold increase compared to the sham-control. At 6 hours, the MFI exhibited a 3.4-fold increase, indicating a peak in mtROS generation. Interestingly, at 24 hours, the MFI of MitoGlow-ROS displayed a 2.1-fold increase compared to the sham-control, suggesting a decline from the 6-hour peak but still elevated mtROS levels.
3.3.2. Time-Dependent Effects of LPS on Inflammatory and Oxidative Stress Gene Expression in Primary Neuronal Cultures
We assessed the time-dependent effects of 100 ng/mL LPS on mRNA expression of inflammatory and antioxidant genes in primary neuronal cultures using real-time PCR at 3-, 6-, and 24-hours post-treatment, compared to an untreated control (Figure 4). Pro-inflammatory cytokines TNFα, IL1B, and IL6 showed significant increases, peaking at 3 hours with 436-fold (**P<0.01), 3513-fold (**P<0.01), and 1726-fold rises (*P<0.05), respectively, and remained elevated at 24 hours (**P<0.01). Chemokines CCL2 and CCL12 also peaked at 3 hours with 196-fold (**P<0.01) and 240-fold increases (*P<0.05), respectively, and stayed elevated at 24 hours (*P<0.05). The chemokine CCL5 showed an increased expression at 3 hours, which continued to rise and reached a higher level (570-fold) at 24 hours. NF-kB increased 10-fold at 3 hours (*P<0.05) and remained slightly increased at 24 hours (*P<0.05). Antioxidant enzymes CYBA and CYBB rose significantly at 6 hours and 3 hours, respectively (1.6-fold and 3.3-fold, *P<0.05) and they remained elevated at 24 hours (**P<0.01). SOD2 increased 8.6-fold at 3 hours (*P<0.05), peaked at 6 hours with a 19-fold increase (***P<0.001), and continued to rise at 24 hours (**P<0.01). Conversely, SOD1 remained unchanged at 3 hours, decreased at 6 hours, and maintained a similar reduced level at 24 hours. Taken together, these results indicate LPS induces a robust inflammatory response, peaking at 3 hours, with selective antioxidant upregulation, likely driven by TLR4 signaling and mitochondrial ROS production, followed by a partial resolution by 24 hours.
3.4. Validation of MitoGlow-ROS Probe in a Sprague-Dawley Rat Model of LPS-Induced Neuroinflammation
Next, we investigated LPS-induced neuroinflammation in SD rats, focusing on mtROS and mRNA expression of inflammatory and antioxidant markers in the hippocampus and cortex regions. Using the MitoGlow-ROS probe, we measured mtROS levels, while mRNA expression of inflammatory mediators (TNFα, IL1B, IL6, CCL2, CCL5, CCL12 in hippocampus; TNFα, IL1B, IL6, CCL12 in cortex), NADPH oxidase subunit CYBA in hippocampus and antioxidant enzymes (SOD1, SOD2 in hippocampus; SOD1, SOD2 in cortex) was quantified via real-time PCR, normalized to GAPDH. Data were analyzed using a two-tailed unpaired Student’s t-test, with results presented as mean ± SEM and significance denoted as *P<0.05, **P<0.01, ***P<0.001, ****P<0.0001.
3.4.1. Mitochondrial ROS Generation
The MitoGlow-ROS probe detected a 4.1-fold increase in mitochondrial ROS in the hippocampus and a 2.8-fold increase in the cortex of LPS-treated rats compared to controls. The greater hippocampal mtROS elevation suggests heightened susceptibility to oxidative stress, likely due to its higher metabolic demand and mitochondrial density, which amplify mtROS production during neuroinflammation. This vulnerability may contribute to cognitive deficits, given the hippocampus’s role in memory and learning. The cortex, involved in higher-order functions like decision-making, exhibited a less pronounced mtROS increase, highlighting regional differences in oxidative stress susceptibility.
3.4.2. Hippocampal mRNA Expression: LPS treatment significantly upregulated hippocampal inflammatory mediators
TNFα mRNA increased 45-fold (*P<0.05), IL1B increased 647-fold (*P<0.05), and IL6 surged 185-fold (*P<0.05). Chemokine expression also increased: CCL2 rose 1329-fold (**P<0.01), CCL5 surged 48-fold (***P<0.001), and CCL12 increased 254-fold (**P<0.01). NAPDH oxidase subunit CYBA remained unchanged. Among antioxidant enzymes, SOD1 expression remained unchanged, while SOD2 increased 2.6-fold (**P<0.01).
3.4.3. Cortical mRNA Expression
In the cortex, LPS similarly upregulated inflammatory mediators. TNFα mRNA increased 23-fold (***P<0.001), IL1B rose 174-fold (*P<0.05), IL6 increased 26-fold (**P<0.01), and CCL12 rose 61-fold (*P<0.01). SOD1 expression was unchanged, while SOD2 increased 2.9-fold (**P<0.01).
3.4.4. Validation of MitoGlow-ROS Probe
The mRNA expression data corroborate the MitoGlow-ROS probe’s accuracy in detecting mitochondrial ROS. In the hippocampus, the 4.1-fold mtROS increase aligned with a 2.6-fold SOD2 mRNA rise, reflecting a mitochondrial antioxidant response to elevated mtROS. The pronounced 48-fold CCL5 increase, alongside elevated TNFα and IL1B, supports high mtROS levels, as these cytokines and chemokines can drive mitochondrial ROS production. Unchanged SOD1 expression confirms the mitochondrial specificity of the detected ROS. In the cortex, the 2.8-fold mtROS increase corresponded with a 2.9-fold SOD2 mRNA rise, with robust TNFα and IL6 increases further validating mtROS findings. The unchanged SOD1 expression and higher SOD2 fold change in the cortex suggest regional differences in antioxidant capacity. These findings establish MitoGlow-ROS as a reliable tool for studying mitochondrial oxidative stress in neuroinflammatory models.
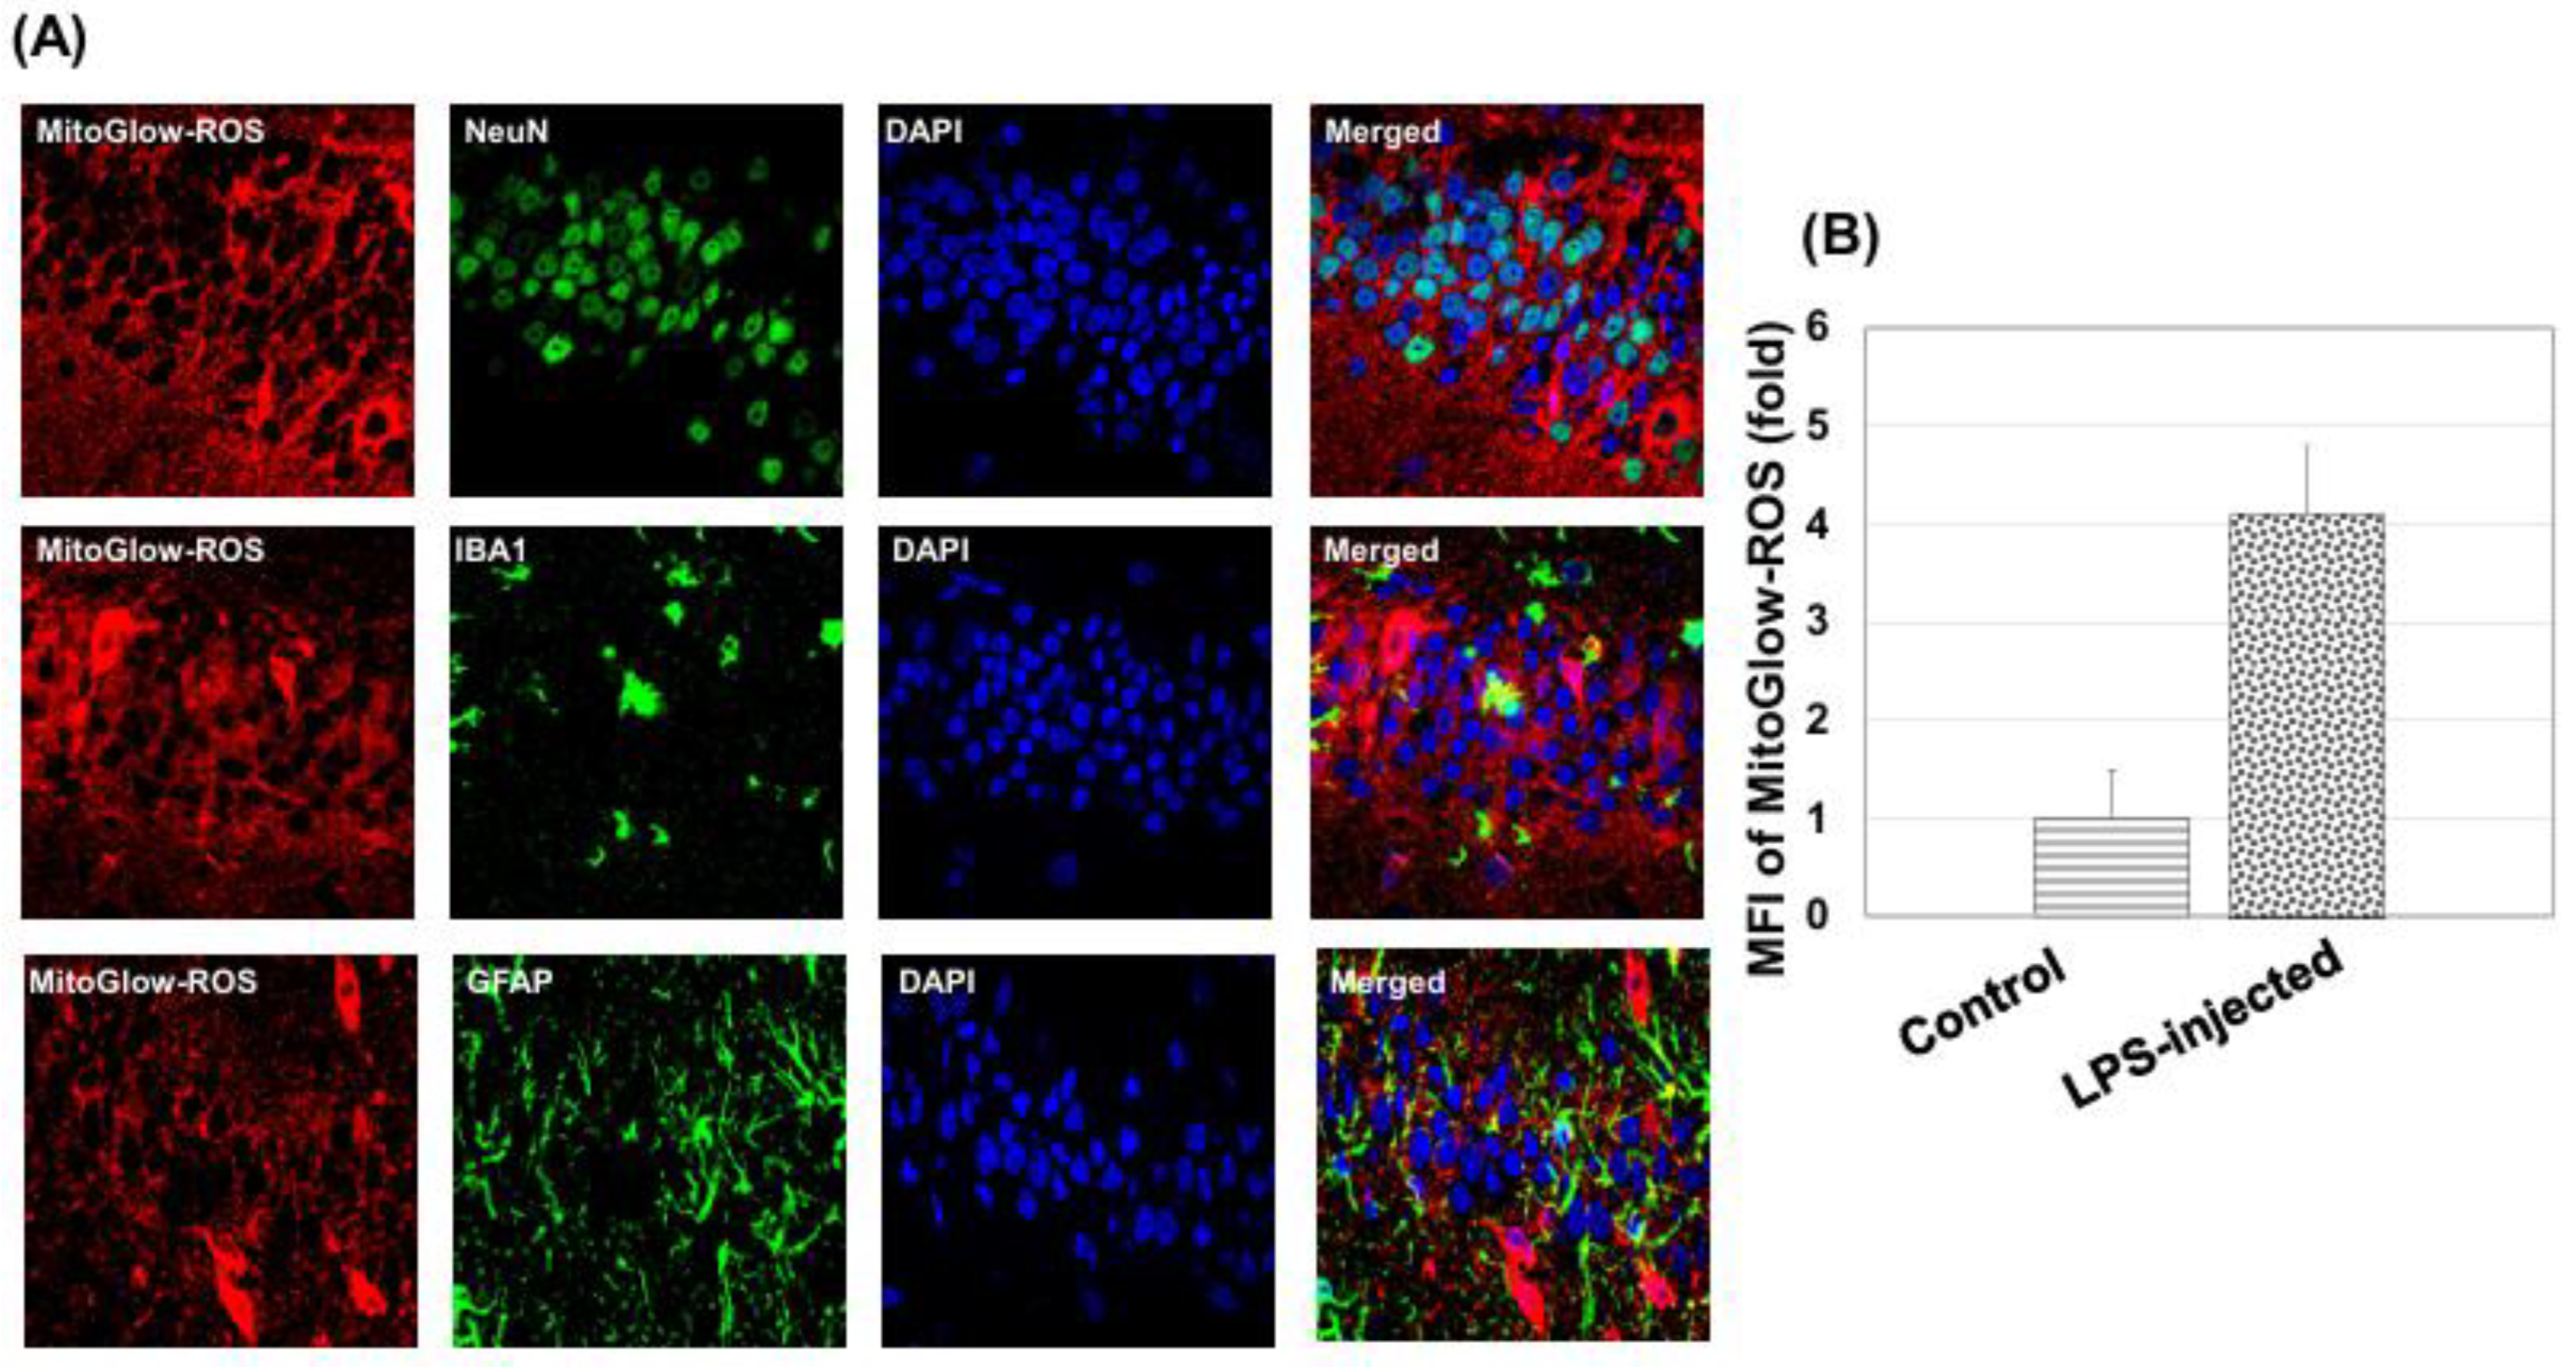
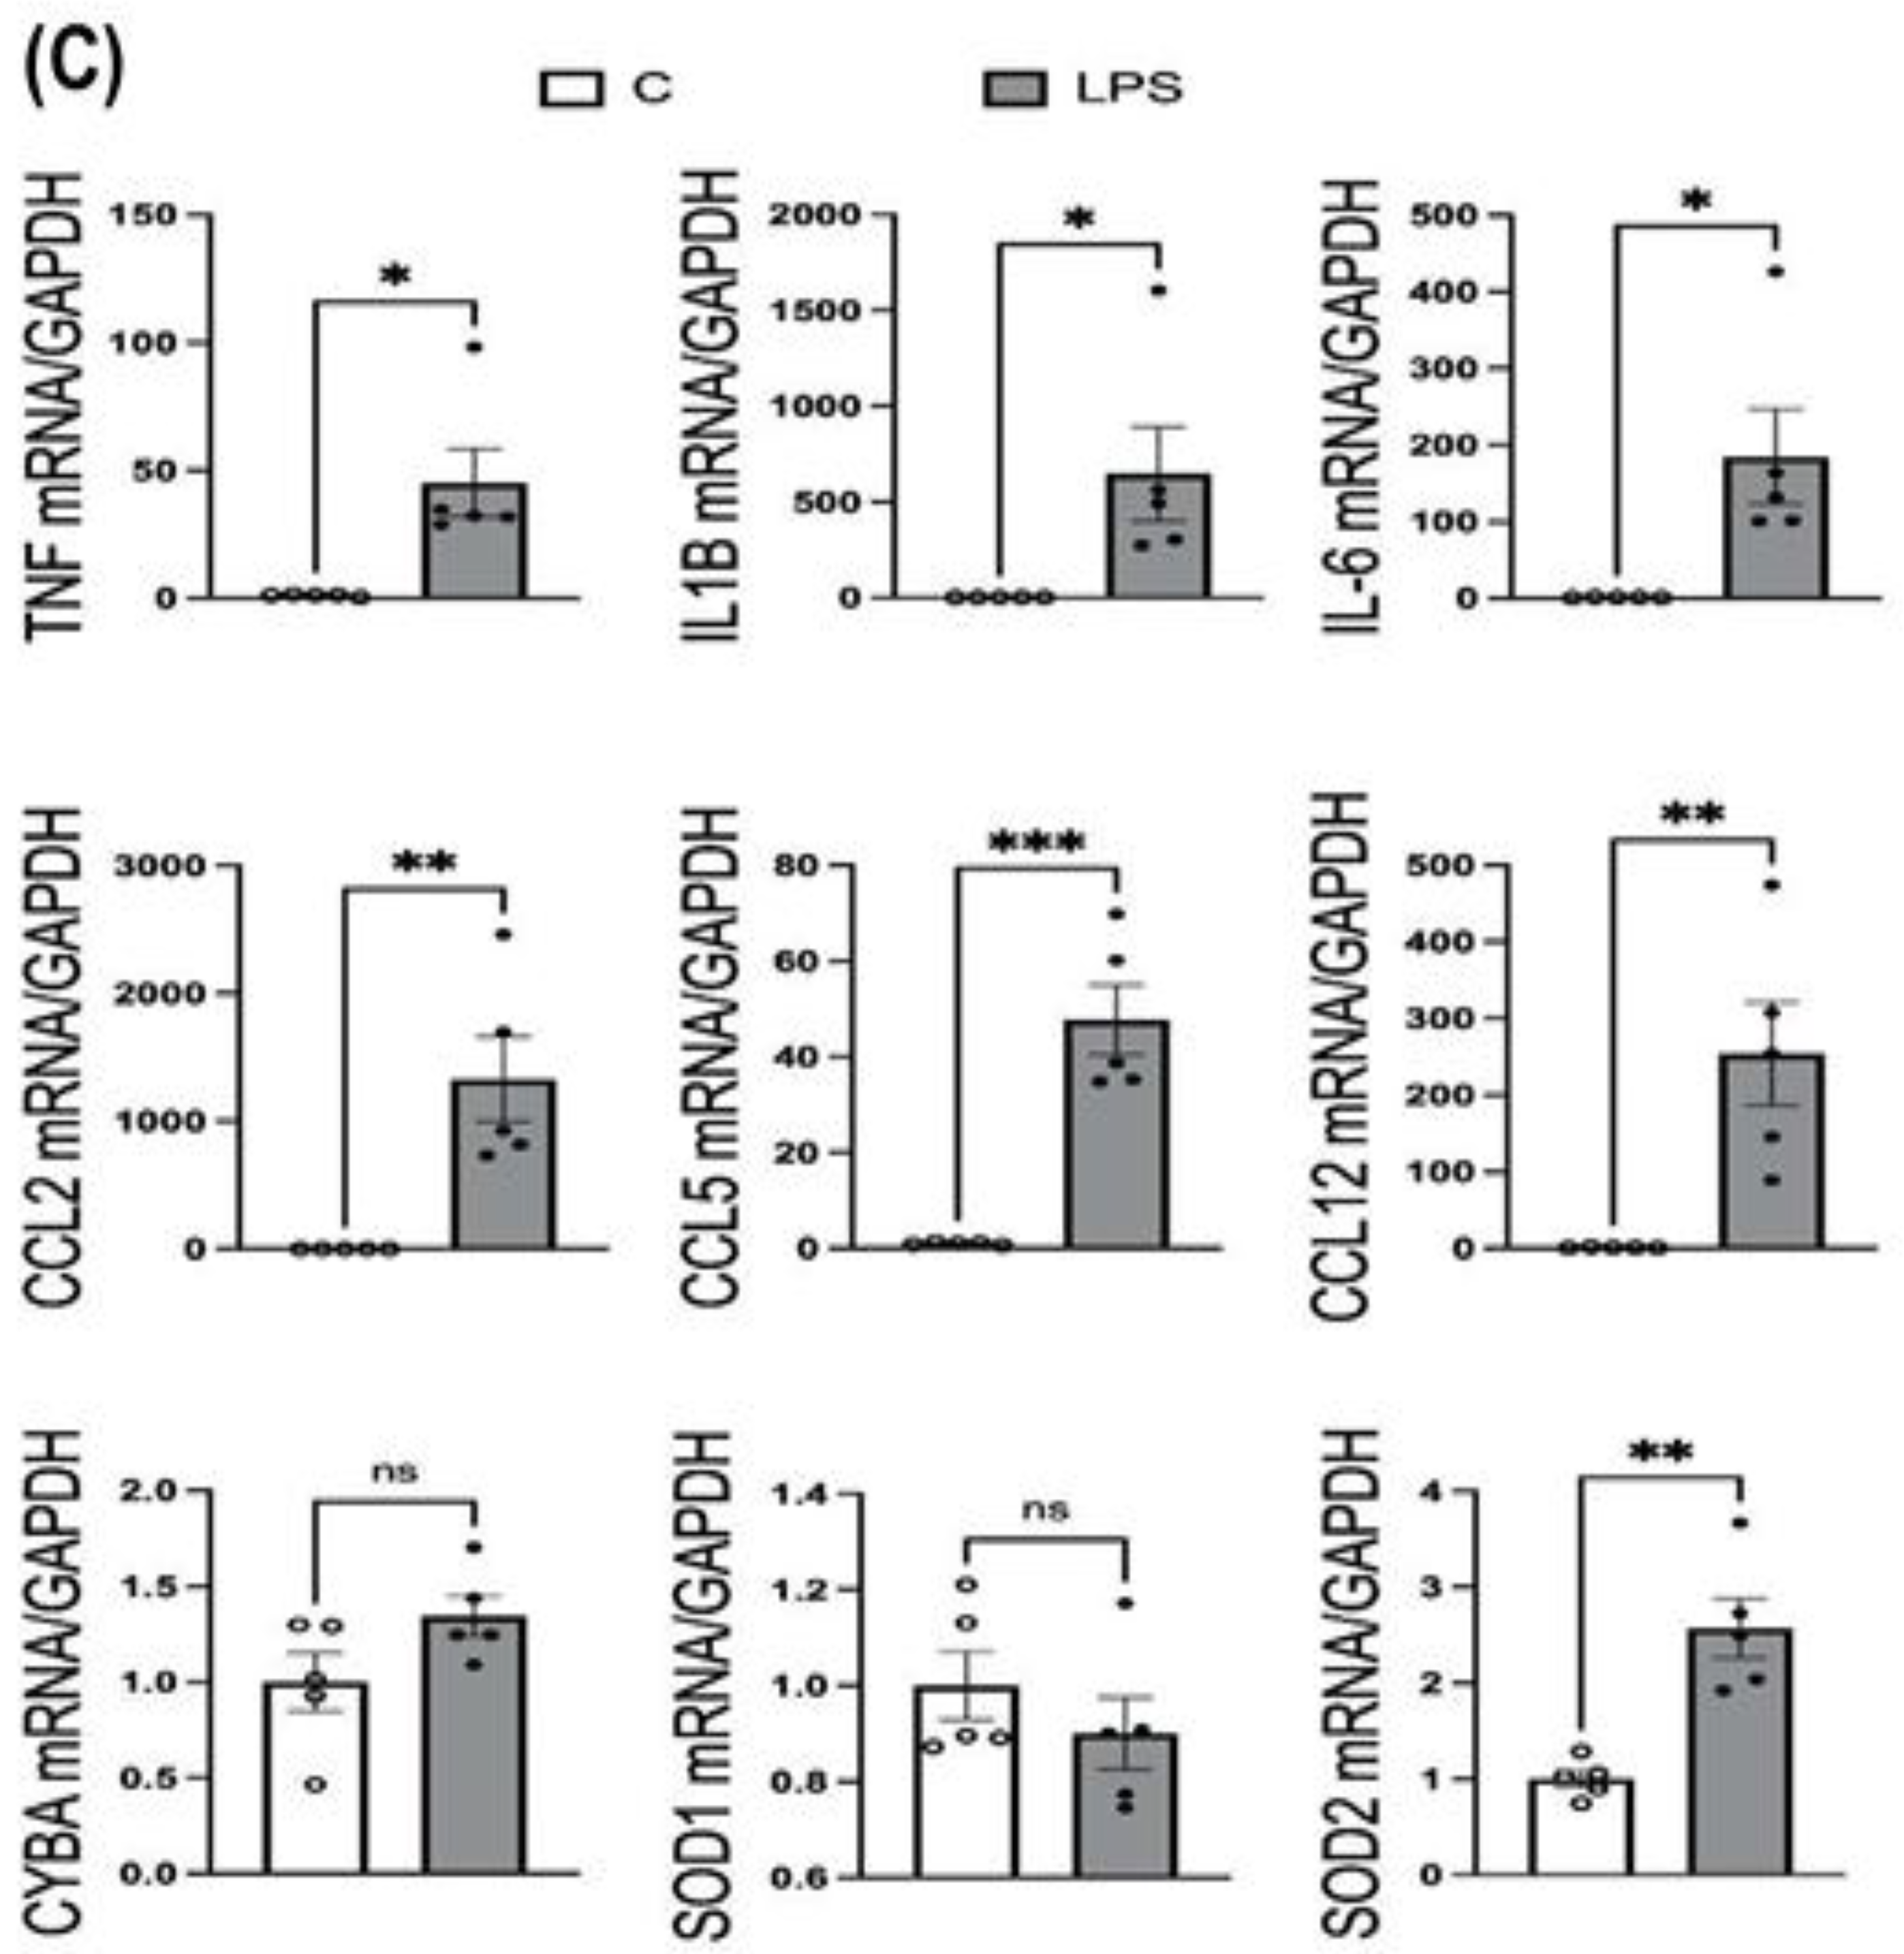
Figure 5.
Visualization of mitochondrial oxidative damage in the cortex regions: (A) Representative images of confocal laser scanning images of rat brain tissue using 4% PFA perfusion. The SD rats were administrated with LPS into the lateral ventricle. For the entire figure, the red channels represent MitoGlow-ROS probe; the green channel represents GFAP- (row I), NeuN- (row II), and IBA1-positive (row III) cells in the brain sections, respectively. The fluorescent images were obtained with a confocal laser scanning fluorescent microscope using a 60 × objective. (B) The MFI of MitoGlow-ROS was quantified and compared between groups. (C) LPS-induced effects on inflammatory mediators and antioxidant enzymes were analyzed by real-time PCR, assessing TNFα, IL1B, IL6, CCL12, SOD1, and SOD2 mRNA levels. Data are mean ± SEM, analyzed using a two-tailed unpaired Student’s t test (*P<0.05, **P<0.01, ***P<0.001).
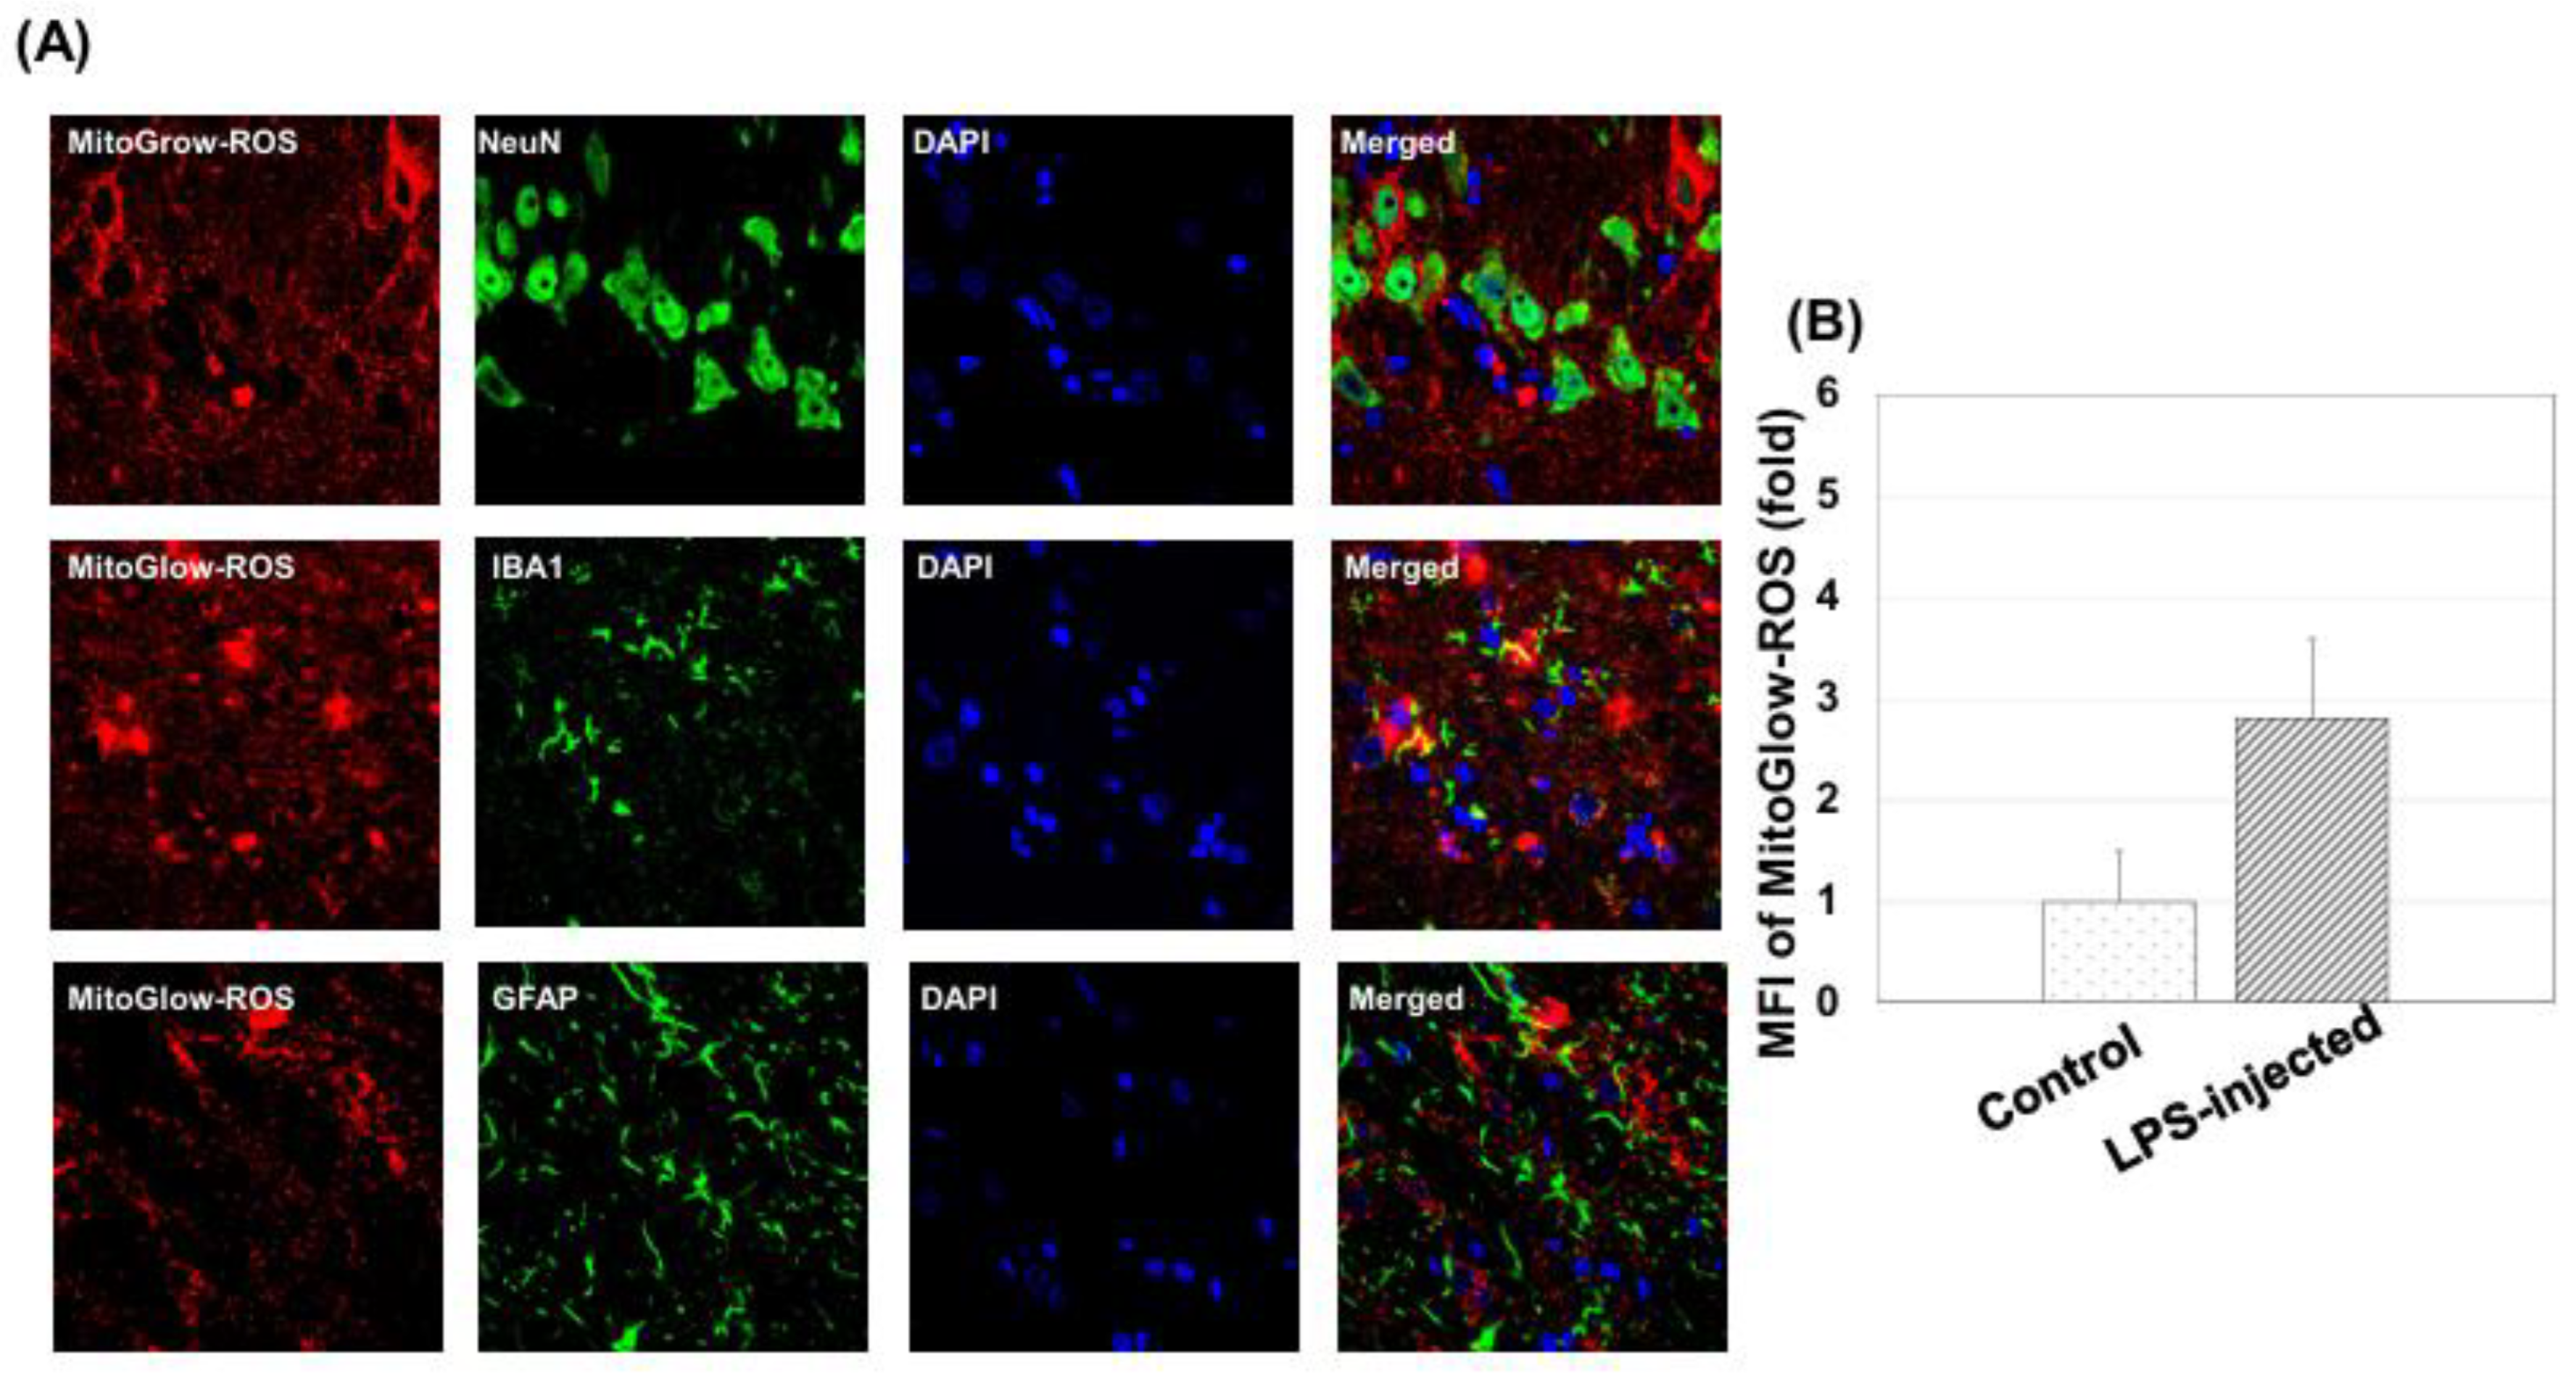
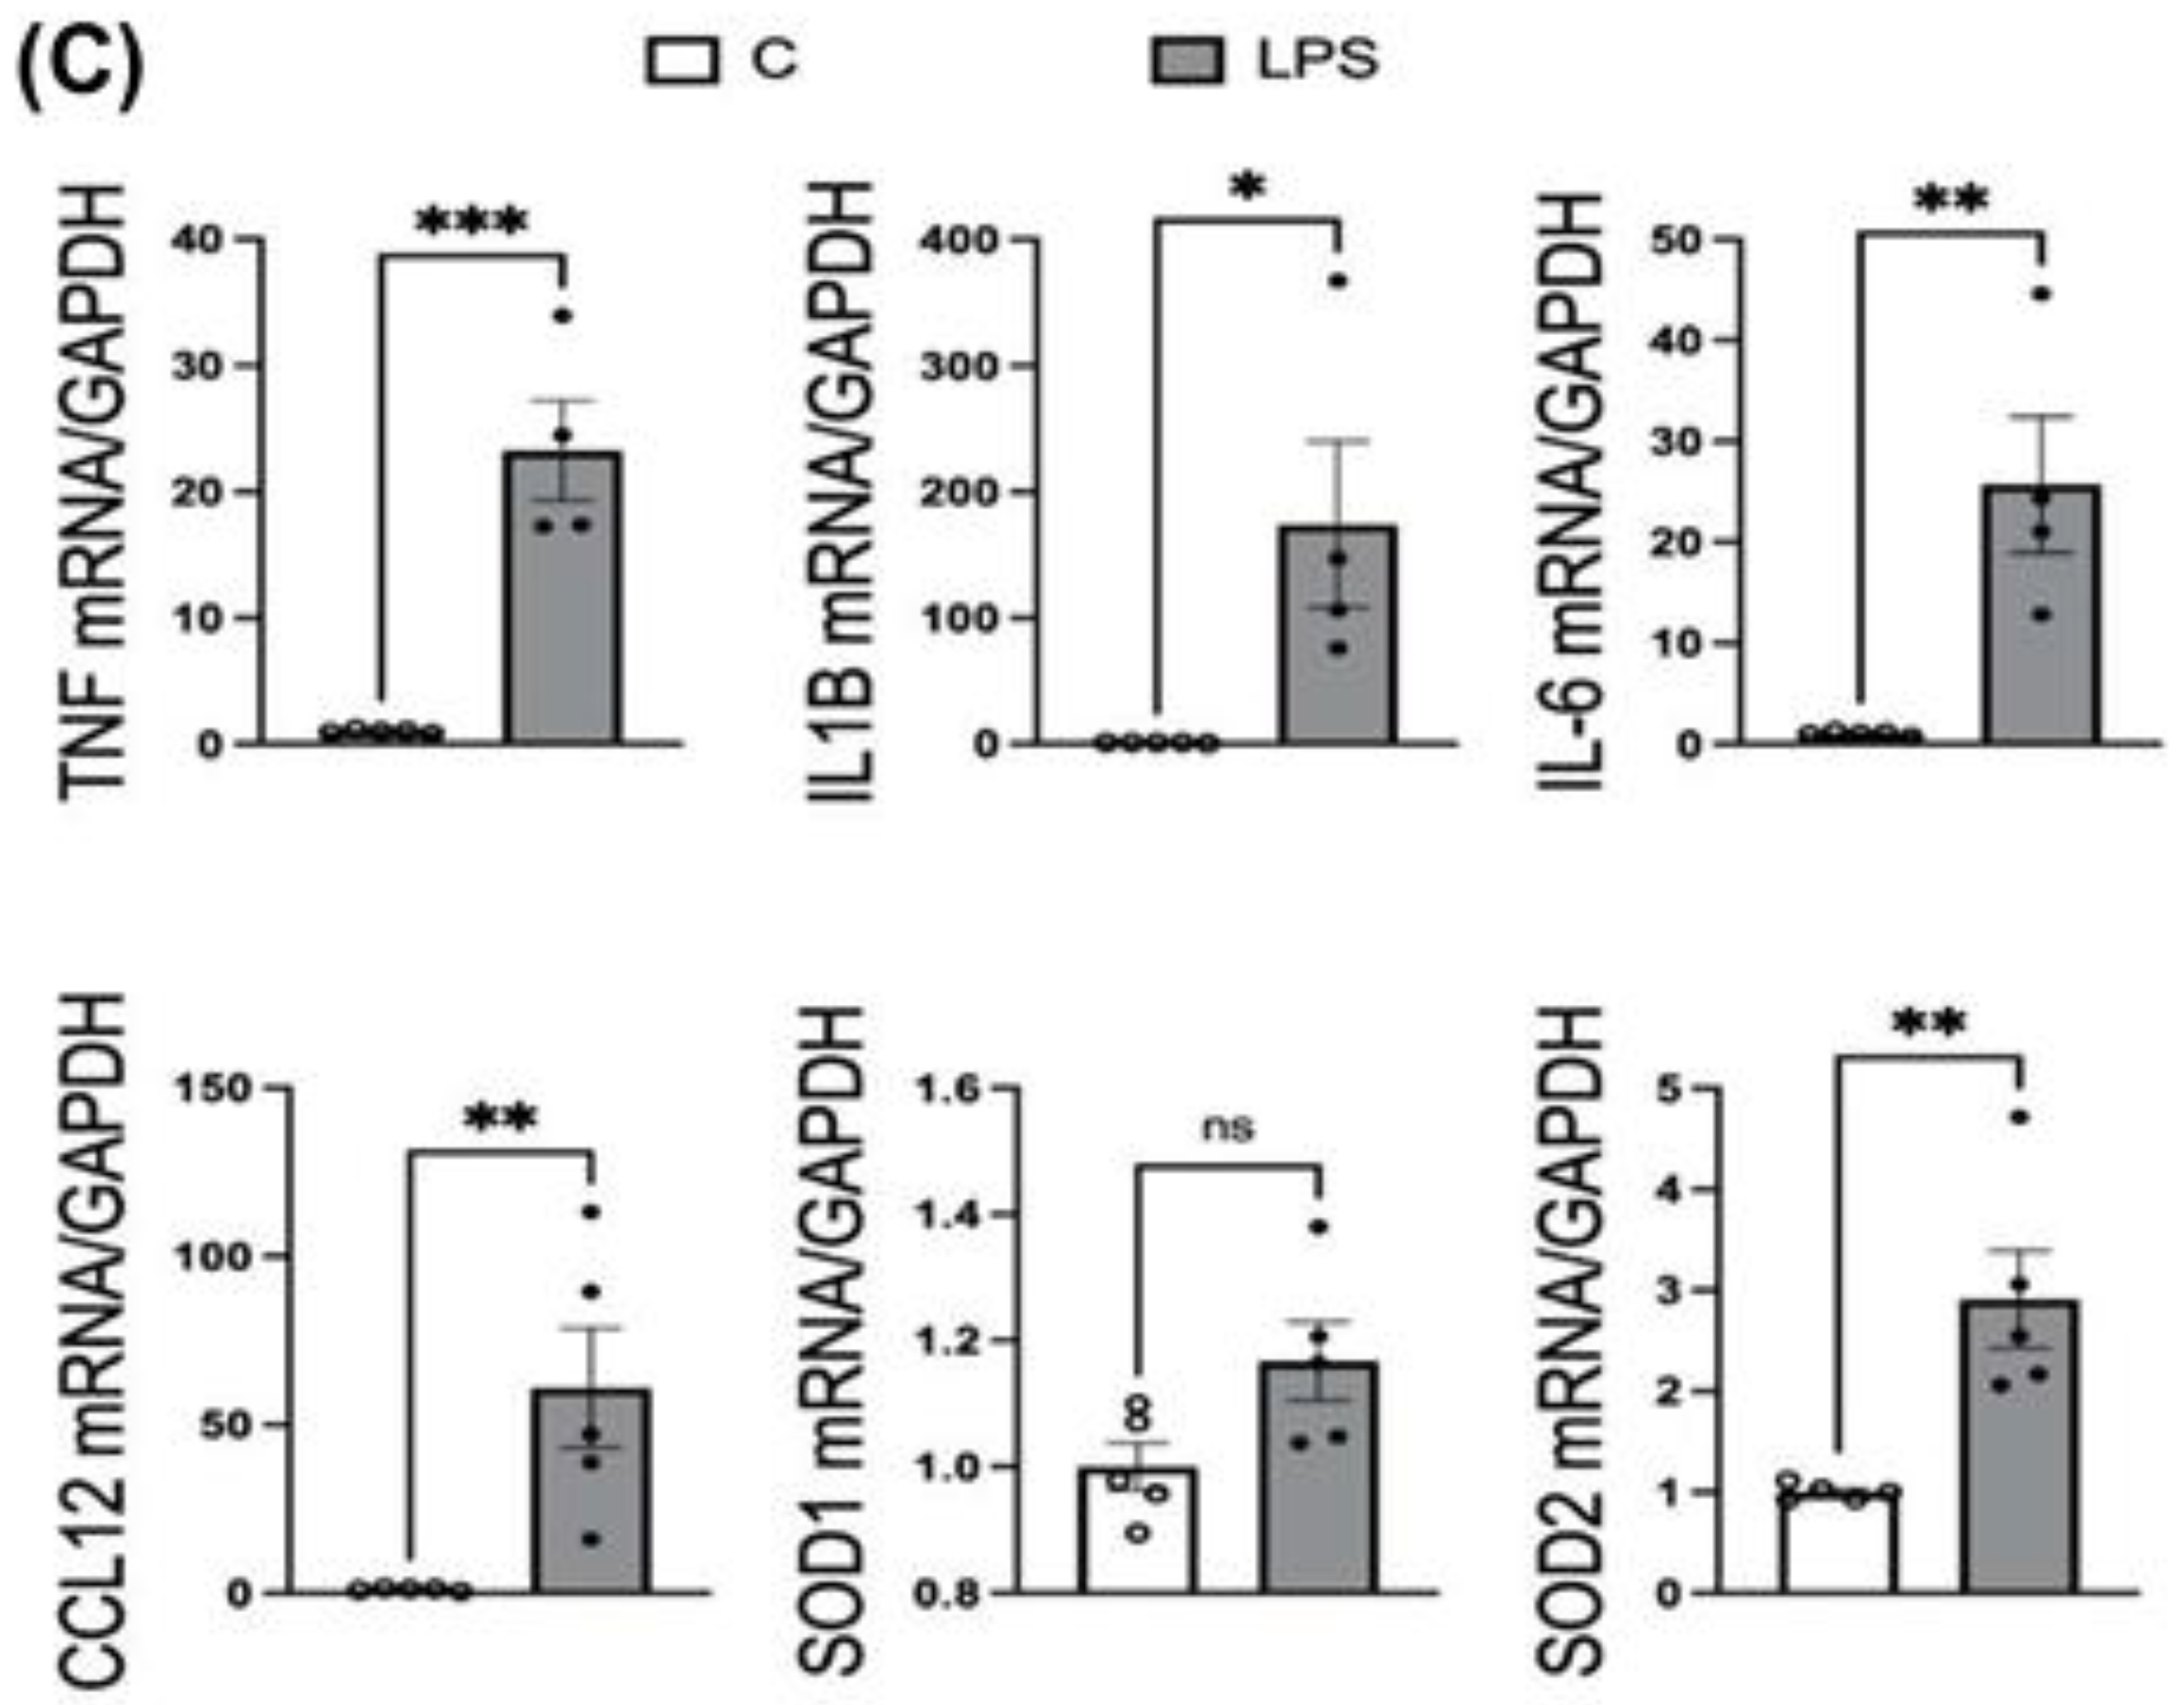
Figure 6.
Visualization of mitochondrial oxidative damage in the hippocampus regions: (A) Representative images of confocal laser scanning images of mouse brain tissue using 4% PFA perfusion. The SD rats were administrated with LPS into the lateral ventricle. For the entire figure, the red channels represent MitoGlow-ROS probe; the green channel represents GFAP- (row I), NeuN- (row II), and IBA1-positive (row III) cells in the brain sections, respectively. The fluorescent images were obtained with a confocal laser scanning fluorescent microscope using a 60 × objective. (B) The MFI of MitoGlow-ROS was quantified and compared between groups. (C) LPS-induced neuroinflammation was assessed by analyzing mRNA levels of TNFα, IL1B, IL6, CCL2, CCL5, CCL12, CYBA, SOD1, and SOD2 via real-time PCR. Statistical analysis was performed using a two-tailed Student’s t-test, with data presented as mean ± SEM. *P<0.05, **P<0.01, ***P<0.001.
4. Discussion
MitoGlow-ROS exhibited superior sensitivity and a wide dynamic range for detecting mitochondrial superoxide in a cell-free system. Its fluorescence intensity increased linearly (R² = 0.97) with superoxide production rates from 0 to 10 µM/min, achieving a 45-fold signal increase, compared to MitoSOX Red’s 14-fold increase before saturation at 5 µM/min. The LOD for MitoGlow-ROS was 0.05 µM/min, twice as sensitive as MitoSOX Red’s LOD of 0.1 µM/min. At 0.1 µM/min, MitoGlow-ROS produced a clear signal, while MitoSOX Red was at its LOD, confirming higher sensitivity. MitoGlow-ROS also showed greater reproducibility, with error bars of ±5% compared to ±7% for MitoSOX Red. Its TEMPO-based fluorescence activation ensured specificity for mtROS, avoiding non-specific oxidation issues observed with MitoSOX Red.
In PC12 cells treated with antimycin A (0–20 µM), a complex III inhibitor that induces superoxide production via electron transport chain disruption, MitoGlow-ROS fluorescence increased dose-dependently, showing a 5-fold increase at 20 µM (***P<0.001). The probe detected superoxide at 0.05 µM/min, surpassing its LOD at 1 µM antimycin A and outperforming MitoSOX Red (LOD 0.1 µM/min). Pre-treatment with 100 µM NAC reduced fluorescence by 80% at 10 µM antimycin A (###P<0.001), confirming superoxide specificity and minimal non-specific activation, unlike DCFH-DA [40]. MitoGlow-ROS’s linear response up to 20 µM antimycin A overcame MitoSOX Red’s saturation at high ROS levels [42].
MitoGlow-ROS’s sensitivity to low superoxide levels (0.05 µM/min) enables early detection of oxidative stress, critical for studying initial stages of stroke and neuroinflammation, where subtle mtROS changes trigger neuronal damage. The probe’s performance in PC12 cells supports its use in complex systems, such as primary neuronal cultures and in vivo LPS-treated SD rats. Its ability to detect a 1.2-fold superoxide increase at 0.1 µM antimycin A highlights its utility for capturing early mtROS changes in neuroinflammation, relevant to stroke progression [56,57,58].
In primary neurons treated with 100 ng/mL LPS, MitoGlow-ROS, a sensitive fluorescent probe, captured time-dependent mtROS dynamics. Fluorescence intensity increased from 1.2-fold at 3 hours (p < 0.05) to a peak of 3.5-fold at 6 hours (p < 0.001), then declined to 2.0-fold by 24 hours (p < 0.01) compared to sham controls, as measured by confocal microscopy (n = 3 replicates). This pattern reflects LPS-induced toll-like receptor 4 (TLR4) activation, which triggers rapid mtROS production through cytokine-mediated electron transport chain (ETC) dysfunction and NADPH oxidase activation [59,60,61,62]. The 3.5-fold peak at 6 hours aligns with reported superoxide surges in LPS-stimulated neuronal cultures, driven by ETC complex I inhibition and NOX2 activity [63,64]. The decline by 24 hours suggests partial oxidative stress resolution, potentially due to upregulation of antioxidant enzymes (e.g., SOD2) or anti-inflammatory cytokines like IL-10 [65]. MitoGlow-ROS’s detection of a 1.2-fold increase at 3 hours, surpassing its limit of detection (LOD, ~0.1-fold), highlights its sensitivity to early mtROS changes, while its 3.5-fold peak quantification demonstrates a broader dynamic range than MitoSOX Red, overcoming issues like non-specific staining [42].
The time-dependent mRNA expression profiles of inflammatory mediators and antioxidant enzymes correlate with the mtROS dynamics observed via MitoGlow-ROS, providing a molecular basis for the observed oxidative stress. The maximum upregulation of pro-inflammatory cytokines and chemokines at 3 hours precedes the peak in mtROS at 6 hours: TNFα (436-fold), IL1B (3513-fold), IL6 (1726-fold), CCL2 (196-fold), and CCL12 (240-fold). This suggests that earlier molecular alterations may contribute to the later rise in mtROS. These dramatic increases reflect a robust inflammatory response driven by LPS-induced TLR4 signaling, which activates NF-kB and promotes cytokine production [59,60,61,62]. Notably, the increase in IL6 and CCL5 suggests a strong chemotactic response, likely recruiting immune cells and amplifying neuroinflammation, consistent with LPS effects in neuronal cultures [59,60,61,62]. The decline in expression by 24 hours (e.g., TNFα to 28-fold, IL1B to 334-fold) indicates a resolution phase, possibly mediated by feedback mechanisms like IL-10 production, which downregulates pro-inflammatory responses [66,67].
NF-kB’s transient 10-fold increases at 3 hours, followed by a continued decline by 24 hours, aligns with its role as an early regulator of inflammatory gene expression via TLR4 pathways [59,60,61,62]. Its rapid decline suggests negative feedback mechanisms, such as IκB induction, which suppress prolonged NF-kB activation [68,69,70]. This early NF-kB activation likely initiates the cytokine surge that peaks at 3 hours, correlating with the maximum ROS production observed via MitoGlow-ROS, as cytokines like TNFα and IL1B can enhance mitochondrial ROS by impairing ETC function [71,72].
The antioxidant enzyme expression further supports the ROS dynamics. SOD2, a mitochondrial superoxide dismutase, increased 19-fold at 6 hours, coinciding with the peak ROS level, reflecting a mitochondrial-specific response to neutralize superoxide and mitigate oxidative stress. The absence of SOD1 upregulation across all time points indicates that cytosolic antioxidant defenses are less responsive, consistent with the mitochondrial origin of LPS-induced ROS [73,74]. CYBA and CYBB, subunits of NADPH oxidase, showed selective upregulation at 6 and 3 hours (CYBA: 1.6-fold, CYBB: 3.3-fold), suggesting that NADPH oxidase contributes to ROS production in response to inflammation, although the persistent CYBA and CYBB elevation at 24 hours (2.6-fold and 3.7-fold) indicates a prolonged oxidative response. The correlation between SOD2 expression and MitoGlow-ROS fluorescence at 6 hours reinforces the probe’s specificity for mitochondrial ROS, as SOD2 directly responds to superoxide levels [75,76].
The LPS-induced neuroinflammation model in primary neuronal cells mimics the inflammatory and oxidative stress conditions observed in stroke, where ischemia-reperfusion and cytokine-driven inflammation elevate mitochondrial ROS, contributing to neuronal damage [7]. The 3.4-fold ROS peak at 6 hours is comparable to the 3- to 5-fold increases reported in MCAO stroke models, validating the model’s relevance [77,78]. The decline to 2.1-fold by 24 hours mirrors the resolution phase in stroke, where anti-inflammatory mechanisms partially mitigate oxidative stress [79]. The robust inflammatory response, particularly the increase in IL6 and CCL5, reflects the cytokine storm in stroke, which amplifies ROS production and neuronal injury [80,81]. MitoGlow-ROS’s ability to track these ROS dynamics positions it as a valuable tool for studying stroke-related oxidative stress, supporting the manuscript’s broader application in in vivo LPS models.
The LPS-treated primary neuronal cell experiments demonstrate that MitoGlow-ROS effectively tracks time-dependent mitochondrial ROS generation, peaking at 3.4-fold at 6 hours, with corresponding early upregulation of inflammatory (e.g., IL6) and oxidative stress markers (e.g., CYBB). These findings validate the probe’s sensitivity and specificity, supporting its application in stroke and neuroinflammatory models, and highlight its potential for studying ROS dynamics in neurodegenerative diseases, paving the way for targeted therapeutic strategies.
The results from the LPS-induced neuroinflammation study in SD rats provide critical insights into the regional differences in mitochondrial ROS generation and the associated inflammatory and oxidative stress responses in the cortex and hippocampus, as assessed by the MitoGlow-ROS probe and real-time PCR. These findings advance the manuscript’s objective of validating MitoGlow-ROS as a tool for monitoring mitochondrial ROS in neuroinflammatory models relevant to stroke and neurodegenerative diseases, offering valuable implications for understanding regional vulnerabilities and therapeutic strategies.
The MitoGlow-ROS probe revealed a 4.1-fold increase in mtROS in the hippocampus compared to a 2.8-fold increase in the cortex of LPS-treated rats, underscoring the hippocampus’s greater susceptibility to oxidative stress [82,83]. This regional disparity is driven by the hippocampus’s higher metabolic demand and mitochondrial density, which amplifies mtROS production during neuroinflammation, coupled with its limited antioxidant capacity [7]. The hippocampus’s critical role in memory and learning makes it particularly vulnerable to mtROS-induced synaptic plasticity impairments, contributing to cognitive deficits in conditions like stroke and AD [84]. In contrast, the cortex, involved in higher-order functions such as decision-making, exhibits lower mtROS increases, likely due to reduced metabolic activity, diverse neuronal populations, and potentially stronger antioxidant defenses [12,85,86]. Additional factors, including the hippocampus’s denser microvascular network, heightened sensitivity to pro-inflammatory cytokines, and susceptibility to excitotoxicity, further exacerbate its vulnerability compared to the cortex [7,83]. These findings highlight the MitoGlow-ROS probe’s utility in detecting region-specific mtROS dynamics, supporting its application in neuroinflammatory models and guiding targeted therapeutic strategies, such as antioxidants, to mitigate hippocampal damage in diseases like stroke and AD.
The mRNA expression data strongly correlates with the ROS increases, providing molecular validation of MitoGlow-ROS’s performance. In the hippocampus, the 4.1-fold ROS increase is mirrored by significant upregulation of inflammatory mediators, with TNFα (45-fold), IL1B (647-fold), IL6 (185-fold), CCL2 (1329-fold), CCL5 (48-fold), and CCL12 (254-fold) all showing robust increases. The 48-fold surge in CCL5, in particular, indicates a potent chemotactic response, likely recruiting immune cells and amplifying neuroinflammation, consistent with LPS-induced effects in neuronal models [87]. In the cortex, the 2.8-fold ROS increase corresponds to a 23-fold increase in TNFα, 174-fold in IL1B, 26-fold in IL6, and 61-fold in CCL12, reflecting a strong inflammatory response driven by LPS via TLR4 signaling [88]. The higher increase in the pro-inflammatory cytokines and chemokines the hippocampus compared to the cortex aligns with the greater ROS elevation, suggesting that inflammation-driven ROS production is more pronounced in this region [12,85,86].
The inflammatory response’s role in driving ROS production is further supported by the timing of cytokine expression, which peaks at 3 hours prior to ROS at 6 hours in parallel LPS-treated neuronal cultures [87,89,90]. Cytokines like TNFα and IL1B can impair mitochondrial function by increasing ETC activity, leading to electron leakage and superoxide production, a mechanism consistent with the observed ROS increases [91,92,93]. The correlation between ROS and inflammatory markers validates MitoGlow-ROS’s ability to reflect inflammation-driven oxidative stress, reinforcing its utility in neuroinflammatory models.
The antioxidant enzyme expression profiles provide additional validation of the MitoGlow-ROS data. In the hippocampus, the 2.6-fold increase in SOD2 mRNA expression corresponds closely to the 4.1-fold ROS increase, reflecting a mitochondrial-specific response to neutralize superoxide [94,95]. In the cortex, the 2.9-fold SOD2 increase aligns with the 2.8-fold ROS elevation, further confirming the probe’s accuracy. SOD2, a mitochondrial superoxide dismutase, directly responds to elevated superoxide levels, and its upregulation indicates a compensatory mechanism to mitigate oxidative damage [94,95]. The slightly higher SOD2 fold increase in the cortex despite a lower ROS elevation may reflect regional differences in antioxidant capacity, with the cortex potentially having a more robust response to oxidative stress [76,96].
The lack of change in SOD1 in both regions and CYBA in the hippocampus suggests that the ROS detected by MitoGlow-ROS is primarily mitochondrial, as cytosolic antioxidant defenses (SOD1) and NADPH oxidase (CYBA) play a minimal role in this context. However, the hippocampal CYBA expression remained unchanged, while in the cortex, the 5-fold CCL12 increase may indirectly enhance NADPH oxidase activity, contributing to the sustained oxidative response. These findings highlight MitoGlow-ROS’s specificity for mitochondrial ROS, distinguishing it from probes like DCFH-DA, which cannot isolate mitochondrial signals [41].
The LPS-induced neuroinflammation model in SD rats mimics the oxidative and inflammatory stress observed in stroke, where ischemia-reperfusion elevates mitochondrial ROS, contributing to neuronal damage and inflammation [8]. The 4.1-fold and 2.8-fold ROS increases in the hippocampus and cortex, respectively, are comparable to the significant increases of ROS observed in MCAO stroke models, validating the model’s relevance [97]. The stronger hippocampal response mirrors clinical observations in stroke, where hippocampal vulnerability leads to cognitive deficits [98,99]. The cortical response, though less intense, suggests susceptibility to inflammation-driven damage, impacting functions like decision-making [100]. MitoGlow-ROS’s ability to detect these regional differences supports its application in stroke research, particularly for studying therapeutic interventions targeting oxidative stress, such as mitochondrial antioxidants.
The LPS-induced neuroinflammation study in SD rats demonstrates that MitoGlow-ROS effectively detects region-specific mitochondrial ROS increases, with a 4.1-fold elevation in the hippocampus and 2.8-fold in the cortex, corroborated by corresponding mRNA expression changes (e.g., SOD2, inflammatory mediators). These findings validate the probe’s sensitivity and specificity, highlighting its utility for studying mitochondrial oxidative stress in stroke and neuroinflammatory models, and offering insights into regional vulnerabilities with implications for neurodegenerative disease research.
5. Limitations
The validation of MitoGlow-ROS as a sensitive and specific probe for detecting mitochondrial ROS in LPS-treated primary neuronal cultures and cell-free systems underscores its potential, yet several limitations hinder its clinical applicability. By focusing on acute LPS exposure in primary neurons and brain, the study effectively captures short-term neuroinflammatory dynamics but fails to mirror the chronic inflammation central to neurodegenerative disorders like AD and PD, where sustained ROS production and compensatory mechanisms drive progressive neuronal damage over years [101,102,103]. This acute model diminishes the probe’s immediate relevance for clinical settings, where long-term inflammation is a key driver of pathology. Additionally, the absence of functional outcome assessments, such as neuronal viability, synaptic activity, or cognitive and behavioral deficits, limits the ability to correlate ROS levels with neurological impacts relevant to disease states.
6. Conclusions
The MitoGlow-ROS probe demonstrates high sensitivity and specificity for detecting mitochondrial ROS in cell-free systems, PC12 cells, LPS-treated neuronal cultures, and in vivo LPS-treated SD rats, establishing its value for studying neuroinflammatory and neurodegenerative disorders [82,83]. It outperformed MitoSOX Red in cell-free systems with a 45-fold dynamic range (R² = 0.97) and a 0.05 µM/min detection limit, driven by its dynamic quenching mechanism [104,105]. In PC12 cells, it detected a 5-fold ROS increase with antimycin A, reduced by 80% with N-acetylcysteine, confirming mitochondrial superoxide specificity. In LPS-treated neuronal cultures, it identified a 3.4-fold ROS peak at 6 hours, correlating with inflammatory and antioxidant responses, reflecting TLR4-mediated neuroinflammation [59,60,61,62]. In vivo, it revealed a 4.1-fold hippocampal and 2.8-fold cortical ROS increase, consistent with regional vulnerabilities [96] and mRNA changes (e.g., SOD2, CCL12) [96,106]. Its ability to detect subtle (1.1-fold) to significant (3- to 5-fold) ROS changes surpasses probes like DCFH-DA and MitoSOX, enabling early oxidative stress detection in stroke, AD, PD, multiple sclerosis, and amyotrophic lateral sclerosis. Despite limitations in acute modeling and functional outcomes, MitoGlow-ROS has the potential to supports evaluation of mitochondrial-targeted therapies for AD and PD [107,108,109]. Future studies should explore chronic inflammation models, integrate high-resolution imaging and multi-omics, and validate ROS specificity with HPLC/ESR to enhance its utility in elucidating ROS-driven pathology and guiding targeted therapies.
Funding
The project is supported by the NIH grant R01HL163159 (Z.S.), NIH (R15 EB035866, L.B.), and an American Heart Association (AHA) grant 1807047 (L.B.).
Acknowledgments
We sincerely thank the NIH and AHA for their generous financial support and Dr. Rick Koubek’s encouragement and unwavering support throughout our project.
References
- Kishida, K.T.; Klann, E. Sources and targets of reactive oxygen species in synaptic plasticity and memory. Antioxid Redox Signal 2007, 9, 233–244. [Google Scholar] [CrossRef] [PubMed]
- Zorov, D.B.; Juhaszova, M.; Sollott, S.J. Mitochondrial reactive oxygen species (ROS) and ROS-induced ROS release. Physiol Rev 2014, 94, 909–950. [Google Scholar] [CrossRef]
- Quinlan, C.L.; et al. Sites of reactive oxygen species generation by mitochondria oxidizing different substrates. Redox Biol 2013, 1, 304–312. [Google Scholar] [CrossRef]
- Chan, P.H. Reactive oxygen radicals in signaling and damage in the ischemic brain. J Cereb Blood Flow Metab 2001, 21, 2–14. [Google Scholar] [CrossRef]
- Piantadosi, C.A.; Zhang, J. Mitochondrial generation of reactive oxygen species after brain ischemia in the rat. Stroke 1996, 27, 327–331. [Google Scholar] [CrossRef]
- Angelova, P.R.; Abramov, A.Y. Role of mitochondrial ROS in the brain: From physiology to neurodegeneration. FEBS Lett 2018, 592, 692–702. [Google Scholar] [CrossRef] [PubMed]
- Iadecola, C.; Anrather, J. The immunology of stroke: From mechanisms to translation. Nat Med 2011, 17, 796–808. [Google Scholar] [CrossRef] [PubMed]
- Orellana-Urzúa, S.; et al. Pathophysiology of Ischemic Stroke: Role of Oxidative Stress. Curr Pharm Des 2020, 26, 4246–4260. [Google Scholar] [CrossRef]
- Chen, H.; et al. Therapeutic targets of oxidative/nitrosative stress and neuroinflammation in ischemic stroke: Applications for natural product efficacy with omics and systemic biology. Pharmacol Res 2020, 158, 104877. [Google Scholar] [CrossRef]
- Bai, R.; et al. Oxidative stress: The core pathogenesis and mechanism of Alzheimer's disease. Ageing Res Rev 2022, 77, 101619. [Google Scholar] [CrossRef]
- Ionescu-Tucker, A.; Cotman, C.W. Emerging roles of oxidative stress in brain aging and Alzheimer's disease. Neurobiol Aging 2021, 107, 86–95. [Google Scholar] [CrossRef]
- Tönnies, E.; Trushina, E. Oxidative Stress, Synaptic Dysfunction, and Alzheimer's Disease. J Alzheimers Dis 2017, 57, 1105–1121. [Google Scholar] [CrossRef]
- Cheignon, C.; et al. Oxidative stress and the amyloid beta peptide in Alzheimer's disease. Redox Biol 2018, 14, 450–464. [Google Scholar] [CrossRef]
- Reddy, P.H.; Beal, M.F. Amyloid beta, mitochondrial dysfunction and synaptic damage: Implications for cognitive decline in aging and Alzheimer's disease. Trends Mol Med 2008, 14, 45–53. [Google Scholar] [CrossRef] [PubMed]
- Manczak, M.; et al. Mitochondria are a direct site of A beta accumulation in Alzheimer's disease neurons: Implications for free radical generation and oxidative damage in disease progression. Hum Mol Genet 2006, 15, 1437–1449. [Google Scholar] [CrossRef]
- Simpson, D.S.A.; Oliver, P.L. ROS Generation in Microglia: Understanding Oxidative Stress and Inflammation in Neurodegenerative Disease. Antioxidants 2020, 9, 743. [Google Scholar] [CrossRef] [PubMed]
- Miao, J.; et al. Microglia in Alzheimer's disease: Pathogenesis, mechanisms, and therapeutic potentials. Front Aging Neurosci 2023, 15, 1201982. [Google Scholar] [CrossRef] [PubMed]
- Wang, Q.; et al. Inflammasomes in neurodegenerative diseases. Transl Neurodegener 2024, 13, 65. [Google Scholar] [CrossRef]
- Sho, T.; Xu, J. Role and mechanism of ROS scavengers in alleviating NLRP3-mediated inflammation. Biotechnol Appl Biochem 2019, 66, 4–13. [Google Scholar] [CrossRef]
- Xiao, B.; et al. Reactive oxygen species trigger Parkin/PINK1 pathway-dependent mitophagy by inducing mitochondrial recruitment of Parkin. J Biol Chem 2017, 292, 16697–16708. [Google Scholar] [CrossRef]
- Narendra, D.P.; et al. PINK1 is selectively stabilized on impaired mitochondria to activate Parkin. PLoS Biol 2010, 8, e1000298. [Google Scholar] [CrossRef] [PubMed]
- Quinn, P.M.J.; et al. PINK1/PARKIN signalling in neurodegeneration and neuroinflammation. Acta Neuropathol Commun 2020, 8, 189. [Google Scholar] [CrossRef] [PubMed]
- Gandhi, S.; et al. Dopamine induced neurodegeneration in a PINK1 model of Parkinson's disease. PLoS ONE 2012, 7, e37564. [Google Scholar] [CrossRef] [PubMed]
- Brown, S.J.; et al. PINK1 deficiency impairs adult neurogenesis of dopaminergic neurons. Sci Rep 2021, 11, 6617. [Google Scholar] [CrossRef]
- Guo, C.; et al. Oxidative stress, mitochondrial damage and neurodegenerative diseases. Neural Regen Res 2013, 8, 2003–2014. [Google Scholar]
- Wei, Y.; et al. Balanced basal-levels of ROS (redox-biology), and very-low-levels of pro-inflammatory cytokines (cold-inflammaging), as signaling molecules can prevent or slow-down overt-inflammaging, and the aging-associated decline of adaptive-homeostasis. Exp Gerontol 2023, 172, 112067. [Google Scholar] [CrossRef]
- Mosley, R.L.; et al. Neuroinflammation, Oxidative Stress and the Pathogenesis of Parkinson's Disease. Clin Neurosci Res 2006, 6, 261–281. [Google Scholar] [CrossRef]
- Isik, S.; et al. Microglia Mediated Neuroinflammation in Parkinson's Disease. Cells 2023, 12, 1012. [Google Scholar] [CrossRef]
- Anilkumar, S.; Wright-Jin, E. NF-κB as an Inducible Regulator of Inflammation in the Central Nervous System. Cells 2024, 13, 485. [Google Scholar] [CrossRef]
- Foley, P.; Riederer, P. Influence of neurotoxins and oxidative stress on the onset and progression of Parkinson's disease. J Neurol 2000, 247 (Suppl. S2), ii82–ii94. [Google Scholar] [CrossRef]
- Tiwari, P.C.; Pal, R. The potential role of neuroinflammation and transcription factors in Parkinson disease. Dialogues Clin Neurosci 2017, 19, 71–80. [Google Scholar] [CrossRef]
- Li, W.; et al. Crosstalk between ER stress, NLRP3 inflammasome, and inflammation. Appl Microbiol Biotechnol 2020, 104, 6129–6140. [Google Scholar] [CrossRef]
- Abais, J.M.; et al. Redox regulation of NLRP3 inflammasomes: ROS as trigger or effector? Antioxid Redox Signal 2015, 22, 1111–1129. [Google Scholar] [CrossRef] [PubMed]
- Kalyanaraman, B.; et al. Measuring reactive oxygen and nitrogen species with fluorescent probes: Challenges and limitations. Free Radic Biol Med 2012, 52, 1–6. [Google Scholar] [CrossRef] [PubMed]
- Dikalov, S.I.; Harrison, D.G. Methods for detection of mitochondrial and cellular reactive oxygen species. Antioxid Redox Signal 2014, 20, 372–382. [Google Scholar] [CrossRef]
- Ribou, A.C. Synthetic Sensors for Reactive Oxygen Species Detection and Quantification: A Critical Review of Current Methods. Antioxid Redox Signal 2016, 25, 520–533. [Google Scholar] [CrossRef]
- Salma, F.; et al. Methods for detection of mitochondrial reactive oxygen species in senescent cells. Methods Cell Biol 2024, 181, 33–41. [Google Scholar] [PubMed]
- Zhang, X.; Gao, F. Imaging mitochondrial reactive oxygen species with fluorescent probes: Current applications and challenges. Free Radic Res 2015, 49, 374–382. [Google Scholar] [CrossRef]
- Mailloux, R.J. An update on methods and approaches for interrogating mitochondrial reactive oxygen species production. Redox Biol 2021, 45, 102044. [Google Scholar] [CrossRef]
- Rota, C.; Fann, Y.C.; Mason, R.P. Phenoxyl free radical formation during the oxidation of the fluorescent dye 2',7'-dichlorofluorescein by horseradish peroxidase. Possible consequences for oxidative stress measurements. J Biol Chem 1999, 274, 28161–28168. [Google Scholar] [CrossRef]
- Murphy, M.P.; et al. Guidelines for measuring reactive oxygen species and oxidative damage in cells and in vivo. Nat Metab 2022, 4, 651–662. [Google Scholar] [CrossRef] [PubMed]
- Zielonka, J.; Kalyanaraman, B. Hydroethidine- and MitoSOX-derived red fluorescence is not a reliable indicator of intracellular superoxide formation: Another inconvenient truth. Free Radic Biol Med 2010, 48, 983–1001. [Google Scholar] [CrossRef]
- Cobley, J.N.; et al. Ten "Cheat Codes" for Measuring Oxidative Stress in Humans. Antioxidants 2024, 13, 877. [Google Scholar] [CrossRef] [PubMed]
- Ghanian, Z.; et al. Quantitative optical measurement of mitochondrial superoxide dynamics in pulmonary artery endothelial cells. J Innov Opt Health Sci 2018, 11, 1750018. [Google Scholar] [CrossRef]
- Cazareth, J.; et al. Molecular and cellular neuroinflammatory status of mouse brain after systemic lipopolysaccharide challenge: Importance of CCR2/CCL2 signaling. J Neuroinflammation 2014, 11, 132. [Google Scholar] [CrossRef] [PubMed]
- Roelofs, B.A.; et al. Low micromolar concentrations of the superoxide probe MitoSOX uncouple neural mitochondria and inhibit complex IV. Free Radic Biol Med 2015, 86, 250–258. [Google Scholar] [CrossRef]
- Yapici, N.B.; et al. New rhodamine nitroxide based fluorescent probes for intracellular hydroxyl radical identification in living cells. Org Lett 2012, 14, 50–53. [Google Scholar] [CrossRef]
- Wilcox, C.S. Effects of tempol and redox-cycling nitroxides in models of oxidative stress. Pharmacol Ther 2010, 126, 119–145. [Google Scholar] [CrossRef]
- Battelli, M.G.; et al. Xanthine Oxidoreductase-Derived Reactive Species: Physiological and Pathological Effects. Oxid Med Cell Longev 2016, 2016, 3527579. [Google Scholar] [CrossRef]
- Halasi, M.; et al. ROS inhibitor N-acetyl-L-cysteine antagonizes the activity of proteasome inhibitors. Biochem J 2013, 454, 201–208. [Google Scholar] [CrossRef]
- Reiniers, M.J.; et al. 2',7'-Dichlorofluorescein is not a probe for the detection of reactive oxygen and nitrogen species. J Hepatol 2012, 56, 1214–1216. [Google Scholar] [CrossRef] [PubMed]
- Yan, X.; et al. Engineering Exosomes to Specifically Target the Mitochondria of Brain Cells. ACS Omega 2023, 8, 48984–48993. [Google Scholar] [CrossRef]
- Livak, K.J.; Schmittgen, T.D. Analysis of relative gene expression data using real-time quantitative PCR and the 2(-Delta Delta C(T)) Method. Methods 2001, 25, 402–408. [Google Scholar] [CrossRef]
- Huber, M.J.; et al. Increased activity of the orexin system in the paraventricular nucleus contributes to salt-sensitive hypertension. Am J Physiol Heart Circ Physiol 2017, 313, H1075–H1086. [Google Scholar] [CrossRef]
- Fan, Y.; et al. Activation of Orexin System Stimulates CaMKII Expression. Front Physiol 2021, 12, 698185. [Google Scholar] [CrossRef] [PubMed]
- Zhu, G.; et al. Crosstalk Between the Oxidative Stress and Glia Cells After Stroke: From Mechanism to Therapies. Front Immunol 2022, 13, 852416. [Google Scholar] [CrossRef]
- Yang, M.; et al. Mitochondrial Quality Control: A Pathophysiological Mechanism and Therapeutic Target for Stroke. Front Mol Neurosci 2021, 14, 786099. [Google Scholar] [CrossRef]
- Fang, C.; et al. Natural Compounds for SIRT1-Mediated Oxidative Stress and Neuroinflammation in Stroke: A Potential Therapeutic Target in the Future. Oxid Med Cell Longev 2022, 2022, 1949718. [Google Scholar] [CrossRef] [PubMed]
- Swanson, L.; et al. TLR4 signaling and macrophage inflammatory responses are dampened by GIV/Girdin. Proc Natl Acad Sci U S A 2020, 117, 26895–26906. [Google Scholar] [CrossRef]
- Lu, Y.C.; Yeh, W.C.; Ohashi, P.S. LPS/TLR4 signal transduction pathway. Cytokine 2008, 42, 145–151. [Google Scholar] [CrossRef]
- Park, J.S.; et al. Involvement of toll-like receptors 2 and 4 in cellular activation by high mobility group box 1 protein. J Biol Chem 2004, 279, 7370–7377. [Google Scholar] [CrossRef]
- Everhardt Queen, A.; et al. Differential Expression of Inflammatory Cytokines and Stress Genes in Male and Female Mice in Response to a Lipopolysaccharide Challenge. PLoS ONE 2016, 11, e0152289. [Google Scholar] [CrossRef] [PubMed]
- Voloboueva, L.A.; et al. Inflammatory response of microglial BV-2 cells includes a glycolytic shift and is modulated by mitochondrial glucose-regulated protein 75/mortalin. FEBS Lett 2013, 587, 756–762. [Google Scholar] [CrossRef]
- Dustin, C.M.; et al. NOX2 in Alzheimer's and Parkinson's disease. Redox Biol 2024, 78, 103433. [Google Scholar] [CrossRef] [PubMed]
- Lynch, M.A. The multifaceted profile of activated microglia. Mol Neurobiol 2009, 40, 139–156. [Google Scholar] [CrossRef] [PubMed]
- Iyer, S.S.; Cheng, G. Role of interleukin 10 transcriptional regulation in inflammation and autoimmune disease. Crit Rev Immunol 2012, 32, 23–63. [Google Scholar] [CrossRef]
- Cyktor, J.C.; Turner, J. Interleukin-10 and immunity against prokaryotic and eukaryotic intracellular pathogens. Infect Immun 2011, 79, 2964–2973. [Google Scholar] [CrossRef]
- Zhang, D.; et al. Ferulic acid alleviates sciatica by inhibiting neuroinflammation and promoting nerve repair via the TLR4/NF-κB pathway. CNS Neurosci Ther 2023, 29, 1000–1011. [Google Scholar] [CrossRef]
- Zhang, J.; et al. Curcumin inhibits LPS-induced neuroinflammation by promoting microglial M2 polarization via TREM2/ TLR4/ NF-κB pathways in BV2 cells. Mol Immunol 2019, 116, 29–37. [Google Scholar] [CrossRef]
- Jin, X.; et al. Baicalin mitigates cognitive impairment and protects neurons from microglia-mediated neuroinflammation via suppressing NLRP3 inflammasomes and TLR4/NF-κB signaling pathway. CNS Neurosci Ther 2019, 25, 575–590. [Google Scholar] [CrossRef]
- van Horssen, J.; van Schaik, P.; Witte, M. Inflammation and mitochondrial dysfunction: A vicious circle in neurodegenerative disorders? Neurosci Lett 2019, 710, 132931. [Google Scholar] [CrossRef]
- Arena, G.; et al. Neurodegeneration and Neuroinflammation in Parkinson's Disease: A Self-Sustained Loop. Curr Neurol Neurosci Rep 2022, 22, 427–440. [Google Scholar] [CrossRef] [PubMed]
- Xiao, Y.; et al. Epigallocatechin-3-gallate Inhibits LPS/AβO-induced Neuroinflammation in BV2 Cells through Regulating the ROS/TXNIP/NLRP3 Pathway. J Neuroimmune Pharmacol 2024, 19, 31. [Google Scholar] [CrossRef] [PubMed]
- Shukuri, M.; et al. Ex vivo imaging and analysis of ROS generation correlated with microglial activation in rat model with acute neuroinflammation induced by intrastriatal injection of LPS. Biochem Biophys Res Commun 2021, 584, 101–106. [Google Scholar] [CrossRef]
- Flynn, J.M.; Melov, S. SOD2 in mitochondrial dysfunction and neurodegeneration. Free Radic Biol Med 2013, 62, 4–12. [Google Scholar] [CrossRef]
- Wang, Y.; et al. Superoxide dismutases: Dual roles in controlling ROS damage and regulating ROS signaling. J Cell Biol 2018, 217, 1915–1928. [Google Scholar] [CrossRef] [PubMed]
- Peters, O.; et al. Increased formation of reactive oxygen species after permanent and reversible middle cerebral artery occlusion in the rat. J Cereb Blood Flow Metab 1998, 18, 196–205. [Google Scholar] [CrossRef]
- Li, W.; Yang, S. Targeting oxidative stress for the treatment of ischemic stroke: Upstream and downstream therapeutic strategies. Brain Circ 2016, 2, 153–163. [Google Scholar]
- Briones-Valdivieso, C.; et al. Novel Multi-Antioxidant Approach for Ischemic Stroke Therapy Targeting the Role of Oxidative Stress. Biomedicines 2024, 12, 501. [Google Scholar] [CrossRef]
- Karki, R.; Kanneganti, T.D. The 'cytokine storm': Molecular mechanisms and therapeutic prospects. Trends Immunol 2021, 42, 681–705. [Google Scholar] [CrossRef]
- Puleo, M.G.; et al. Molecular Mechanisms of Inflammasome in Ischemic Stroke Pathogenesis. Pharmaceuticals 2022, 15, 1168. [Google Scholar] [CrossRef]
- Alves, J.L.; et al. Exploring different mechanisms of reactive oxygen species formation in hypoxic conditions at the hippocampal CA3 area. Mol Cell Endocrinol 2025, 601, 112517. [Google Scholar] [CrossRef] [PubMed]
- Patergnani, S.; et al. Mitochondrial Oxidative Stress and "Mito-Inflammation": Actors in the Diseases. Biomedicines 2021, 9, 216. [Google Scholar] [CrossRef]
- Adusumilli, V.S.; et al. ROS Dynamics Delineate Functional States of Hippocampal Neural Stem Cells and Link to Their Activity-Dependent Exit from Quiescence. Cell Stem Cell 2021, 28, 300–314.e6. [Google Scholar] [CrossRef]
- Popa-Wagner, A.; et al. ROS and brain diseases: The good, the bad, and the ugly. Oxid Med Cell Longev 2013, 2013, 963520. [Google Scholar] [CrossRef] [PubMed]
- MohanKumar, S.M.J.; et al. Role of cytokines and reactive oxygen species in brain aging. Mech Ageing Dev 2023, 214, 111855. [Google Scholar] [CrossRef]
- Batista, C.R.A.; et al. Lipopolysaccharide-Induced Neuroinflammation as a Bridge to Understand Neurodegeneration. Int. J. Mol. Sci. 2019, 20, 2293. [Google Scholar] [CrossRef] [PubMed]
- Skrzypczak-Wiercioch, A.; Sałat, K. Lipopolysaccharide-Induced Model of Neuroinflammation: Mechanisms of Action, Research Application and Future Directions for Its Use. Molecules 2022, 27, 5481. [Google Scholar] [CrossRef]
- Ganesan, K.; et al. Hippocampal neuroinflammation induced by lipopolysaccharide causes sex-specific disruptions in action selection, food approach memories, and neuronal activation. Brain Behav Immun 2025, 124, 9–27. [Google Scholar] [CrossRef]
- Zhou, L.; et al. Remimazolam attenuates lipopolysaccharide-induced neuroinflammation and cognitive dysfunction. Behav Brain Res 2025, 476, 115268. [Google Scholar] [CrossRef]
- Leal, M.C.; et al. Interleukin-1β and tumor necrosis factor-α: Reliable targets for protective therapies in Parkinson's Disease? Front Cell Neurosci 2013, 7, 53. [Google Scholar] [CrossRef]
- Peruzzotti-Jametti, L.; et al. Mitochondrial complex I activity in microglia sustains neuroinflammation. Nature 2024, 628, 195–203. [Google Scholar] [CrossRef] [PubMed]
- Wang, H.; et al. Mitochondrial complex I: The key to sustained microglia activation and neuroinflammation maintenance. Mil Med Res 2024, 11, 47. [Google Scholar] [CrossRef]
- Palma, F.R.; et al. Mitochondrial Superoxide Dismutase: What the Established, the Intriguing, and the Novel Reveal About a Key Cellular Redox Switch. Antioxid Redox Signal 2020, 32, 701–714. [Google Scholar] [CrossRef] [PubMed]
- Napolitano, G.; Fasciolo, G.; Venditti, P. Mitochondrial Management of Reactive Oxygen Species. Antioxidants 2021, 10, 1824. [Google Scholar] [CrossRef]
- Wang, X.; Michaelis, E.K. Selective neuronal vulnerability to oxidative stress in the brain. Front Aging Neurosci 2010, 2, 12. [Google Scholar] [CrossRef]
- Feng, S.; et al. Oxidative stress as a bridge between age and stroke: A narrative review. J Intensive Med 2023, 3, 313–319. [Google Scholar] [CrossRef]
- Nishino, H.; et al. The striatum is the most vulnerable region in the brain to mitochondrial energy compromise: A hypothesis to explain its specific vulnerability. J Neurotrauma 2000, 17, 251–260. [Google Scholar] [CrossRef] [PubMed]
- Davidson, T.L.; Stevenson, R.J. Vulnerability of the Hippocampus to Insults: Links to Blood-Brain Barrier Dysfunction. Int. J. Mol. Sci. 2024, 25, 1991. [Google Scholar] [CrossRef]
- Anthony, S.; et al. Neuroinflammation, Stem Cells, and Stroke. Stroke 2022, 53, 1460–1472. [Google Scholar] [CrossRef]
- Liu, Z.; et al. Oxidative Stress in Neurodegenerative Diseases: From Molecular Mechanisms to Clinical Applications. Oxid Med Cell Longev 2017, 2017, 2525967. [Google Scholar] [CrossRef]
- Klein, J.A.; Ackerman, S.L. Oxidative stress, cell cycle, and neurodegeneration. J Clin Invest 2003, 111, 785–793. [Google Scholar] [CrossRef] [PubMed]
- Selvaraj, N.R.; et al. Oxidative Stress and Redox Imbalance: Common Mechanisms in Cancer Stem Cells and Neurodegenerative Diseases. Cells 2025, 14, 511. [Google Scholar] [CrossRef] [PubMed]
- Żamojć, K.; et al. Fluorescence Quenching Studies on the Interactions between Chosen Fluoroquinolones and Selected Stable TEMPO and PROXYL Nitroxides. Int J Mol Sci 2021, 22, 885. [Google Scholar] [CrossRef] [PubMed]
- Zhu, P.; Clamme, J.P.; Deniz, A.A. Fluorescence quenching by TEMPO: A sub-30 A single-molecule ruler. Biophys J 2005, 89, L37–L39. [Google Scholar] [CrossRef]
- Pandya, V.A.; Patani, R. Region-specific vulnerability in neurodegeneration: Lessons from normal ageing. Ageing Res Rev 2021, 67, 101311. [Google Scholar] [CrossRef]
- Choi, E.H.; Kim, M.H.; Park, S.J. Targeting Mitochondrial Dysfunction and Reactive Oxygen Species for Neurodegenerative Disease Treatment. Int. J. Mol. Sci. 2024, 25, 7952. [Google Scholar] [CrossRef]
- Sousa, T.; Moreira, P.I.; Cardoso, S. Current Advances in Mitochondrial Targeted Interventions in Alzheimer's Disease. Biomedicines 2023, 11, 2331. [Google Scholar] [CrossRef]
- Wadan, A.S.; et al. Mitochondrial-based therapies for neurodegenerative diseases: A review of the current literature. Naunyn Schmiedebergs Arch Pharmacol 2025. [Google Scholar] [CrossRef]
Figure 2.
MitoGlow-ROS Fluorescence Response to Antimycin A in PC12 Cells with and without NAC Pre-Treatment. The plot illustrates the fluorescence intensity of the MitoGlow-ROS probe in PC12 cells exposed to varying concentrations of antimycin A (0, 0.1, 1, 5, 10, 20 µM) to induce mitochondrial superoxide production, measured in the absence (blue circles, solid line) and presence (red triangles, dashed line) of 100 µM N-acetyl-L-cysteine (NAC), a ROS scavenger. PC12 cells were treated with antimycin A for 1 hour, with NAC pre-treatment applied for 30 minutes where indicated, followed by incubation with 10 µM MitoGlow-ROS for 30 minutes. Fluorescence intensity (arbitrary units, AU) was measured at excitation 560 nm and emission 588 nm, with data presented as mean ± SEM from triplicate measurements. The horizontal dashed line at 150 AU indicates the LOD for MitoGlow-ROS (0.05 µM/min superoxide production rate). Statistical significance is denoted as follows: *P<0.05, **P<0.01, ***P<0.001 for Without NAC vs. control (0 µM antimycin A); ###P<0.001 for With NAC vs. Without NAC at each concentration (two-way unpaired Student’s t-test). The dose-dependent increase in fluorescence without NAC (up to 5-fold at 20 µM) and its 80% reduction with NAC validate the probe’s sensitivity and specificity for detecting mitochondrial ROS.
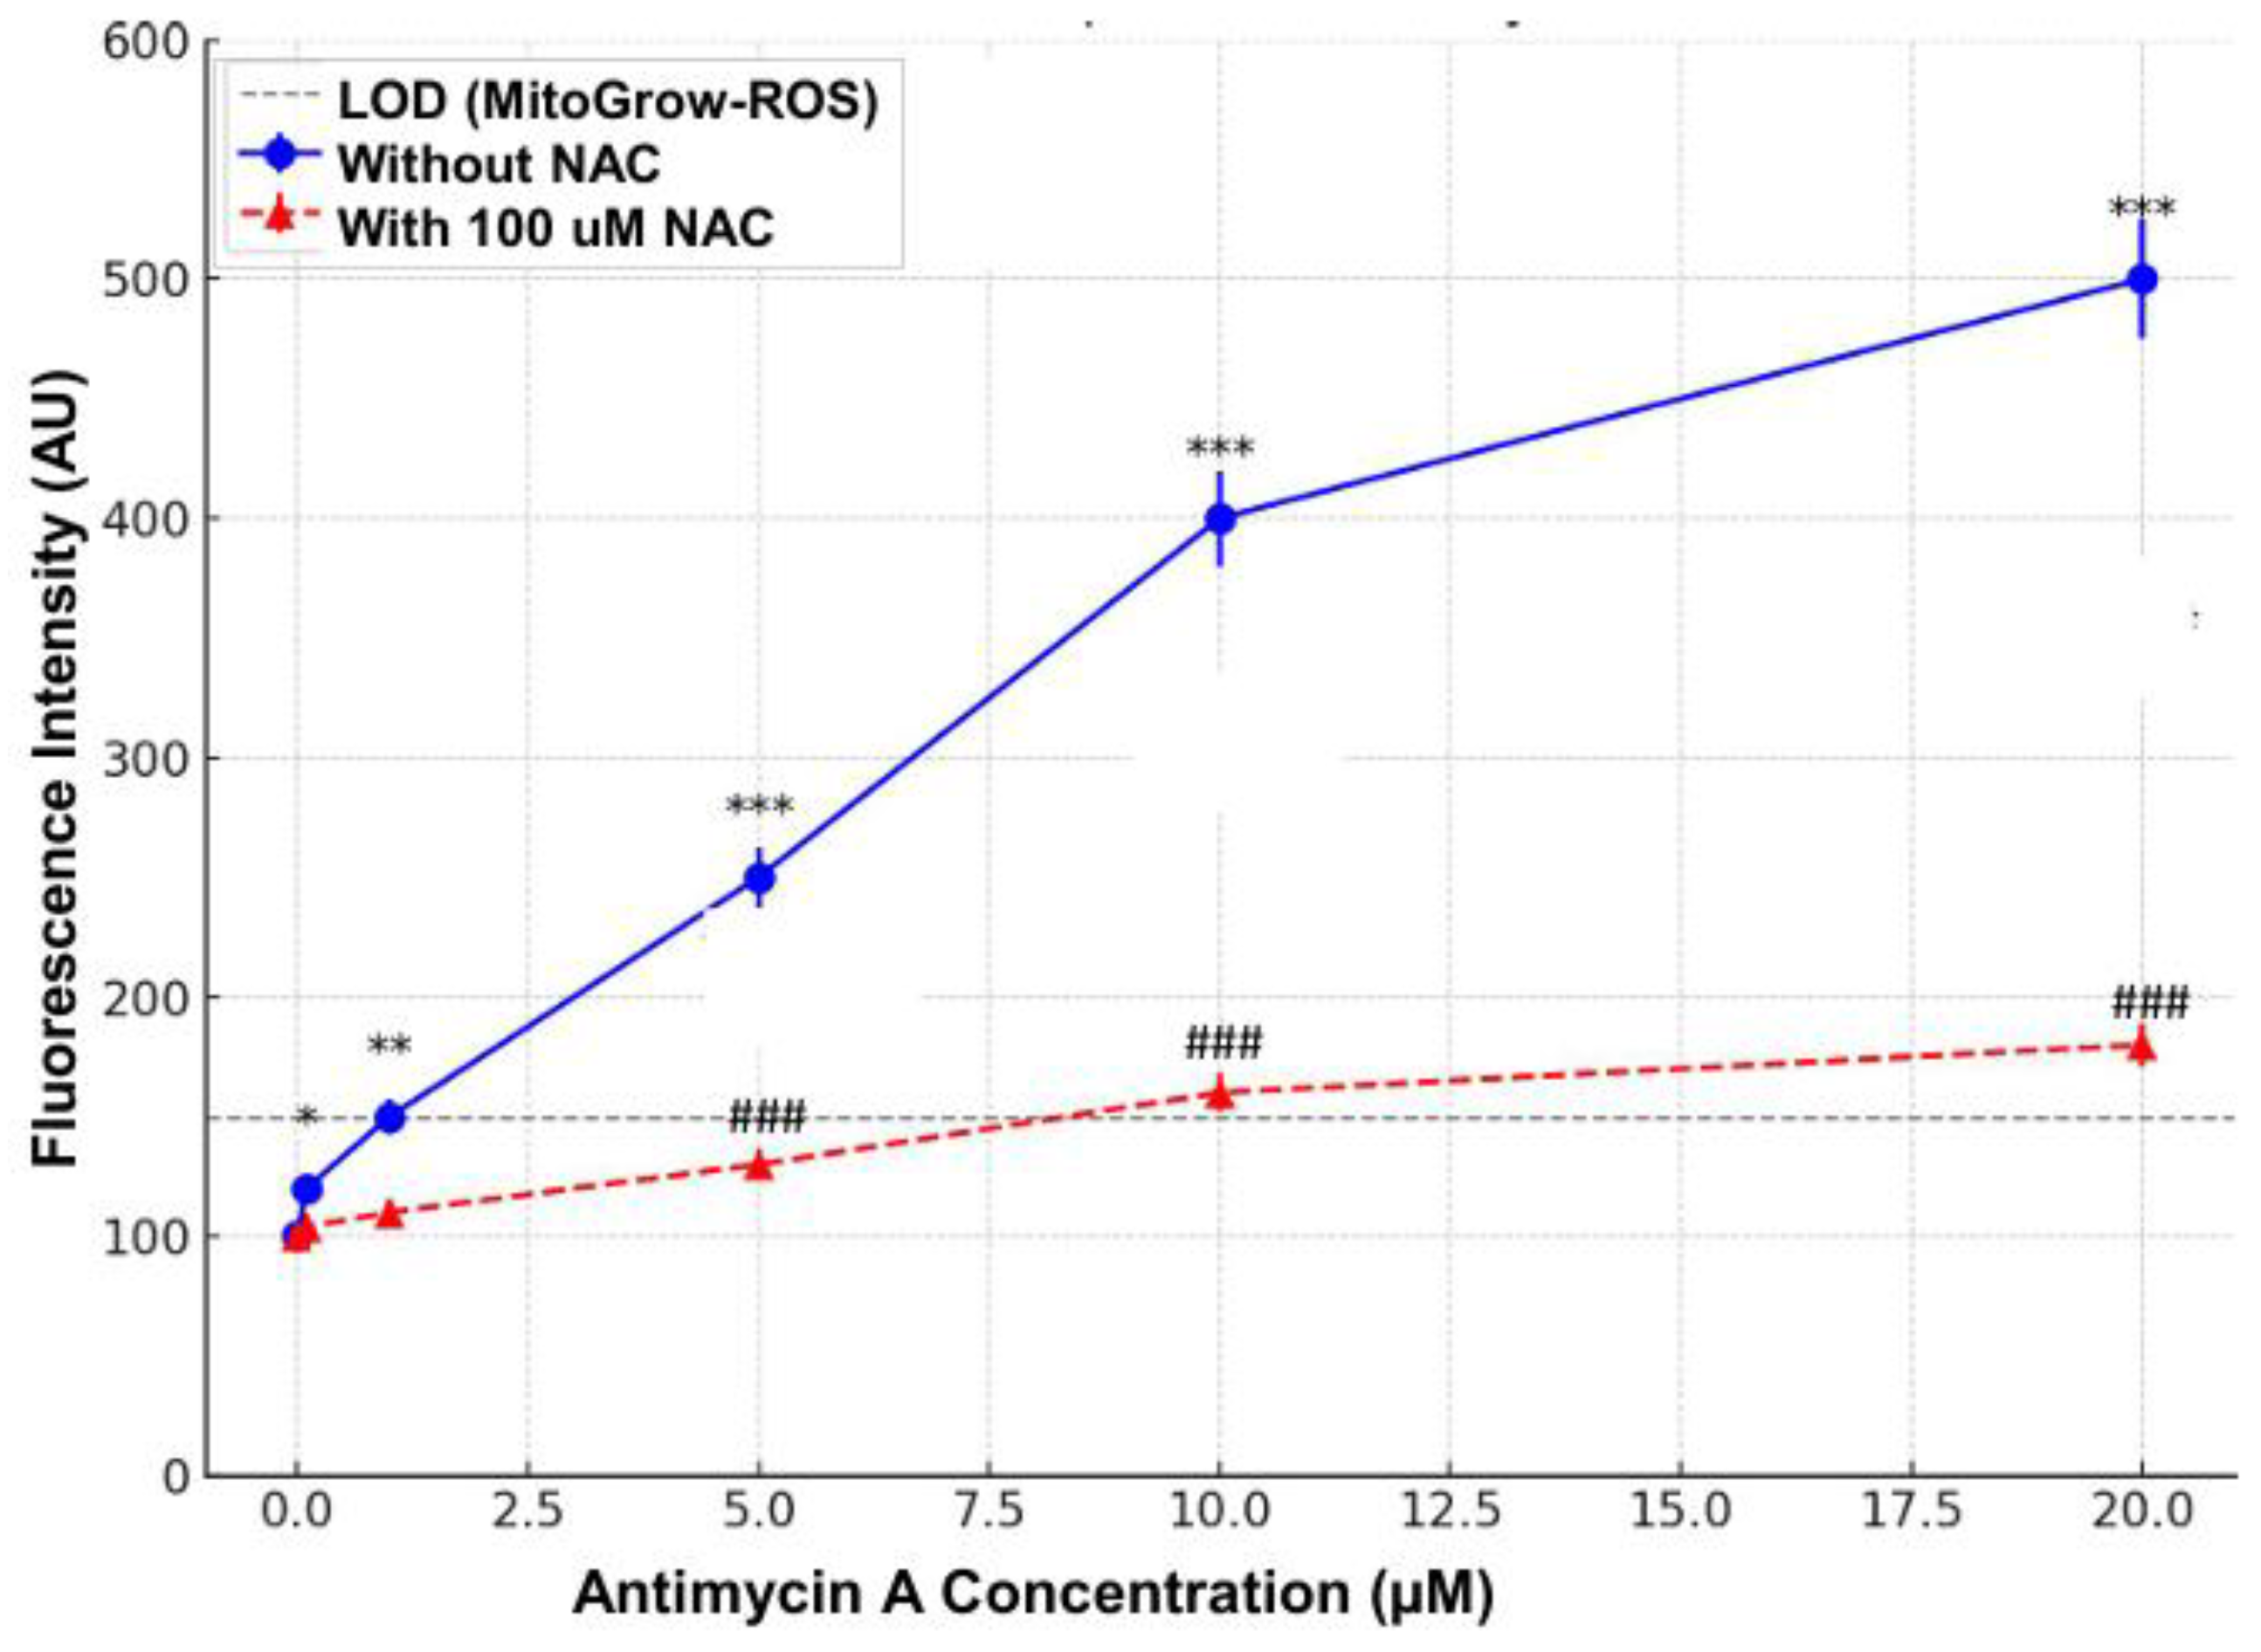
Figure 3.
(A) Representative confocal fluorescent images of primary neuronal cells treated with 100 ng/ml LPS, stained with MitoGlow-ROS (for monitoring mtROS generation). (B) Data for all time points are expressed as the MFI for LPS-treated cells as a fold change relative to the control group.
Figure 3.
(A) Representative confocal fluorescent images of primary neuronal cells treated with 100 ng/ml LPS, stained with MitoGlow-ROS (for monitoring mtROS generation). (B) Data for all time points are expressed as the MFI for LPS-treated cells as a fold change relative to the control group.
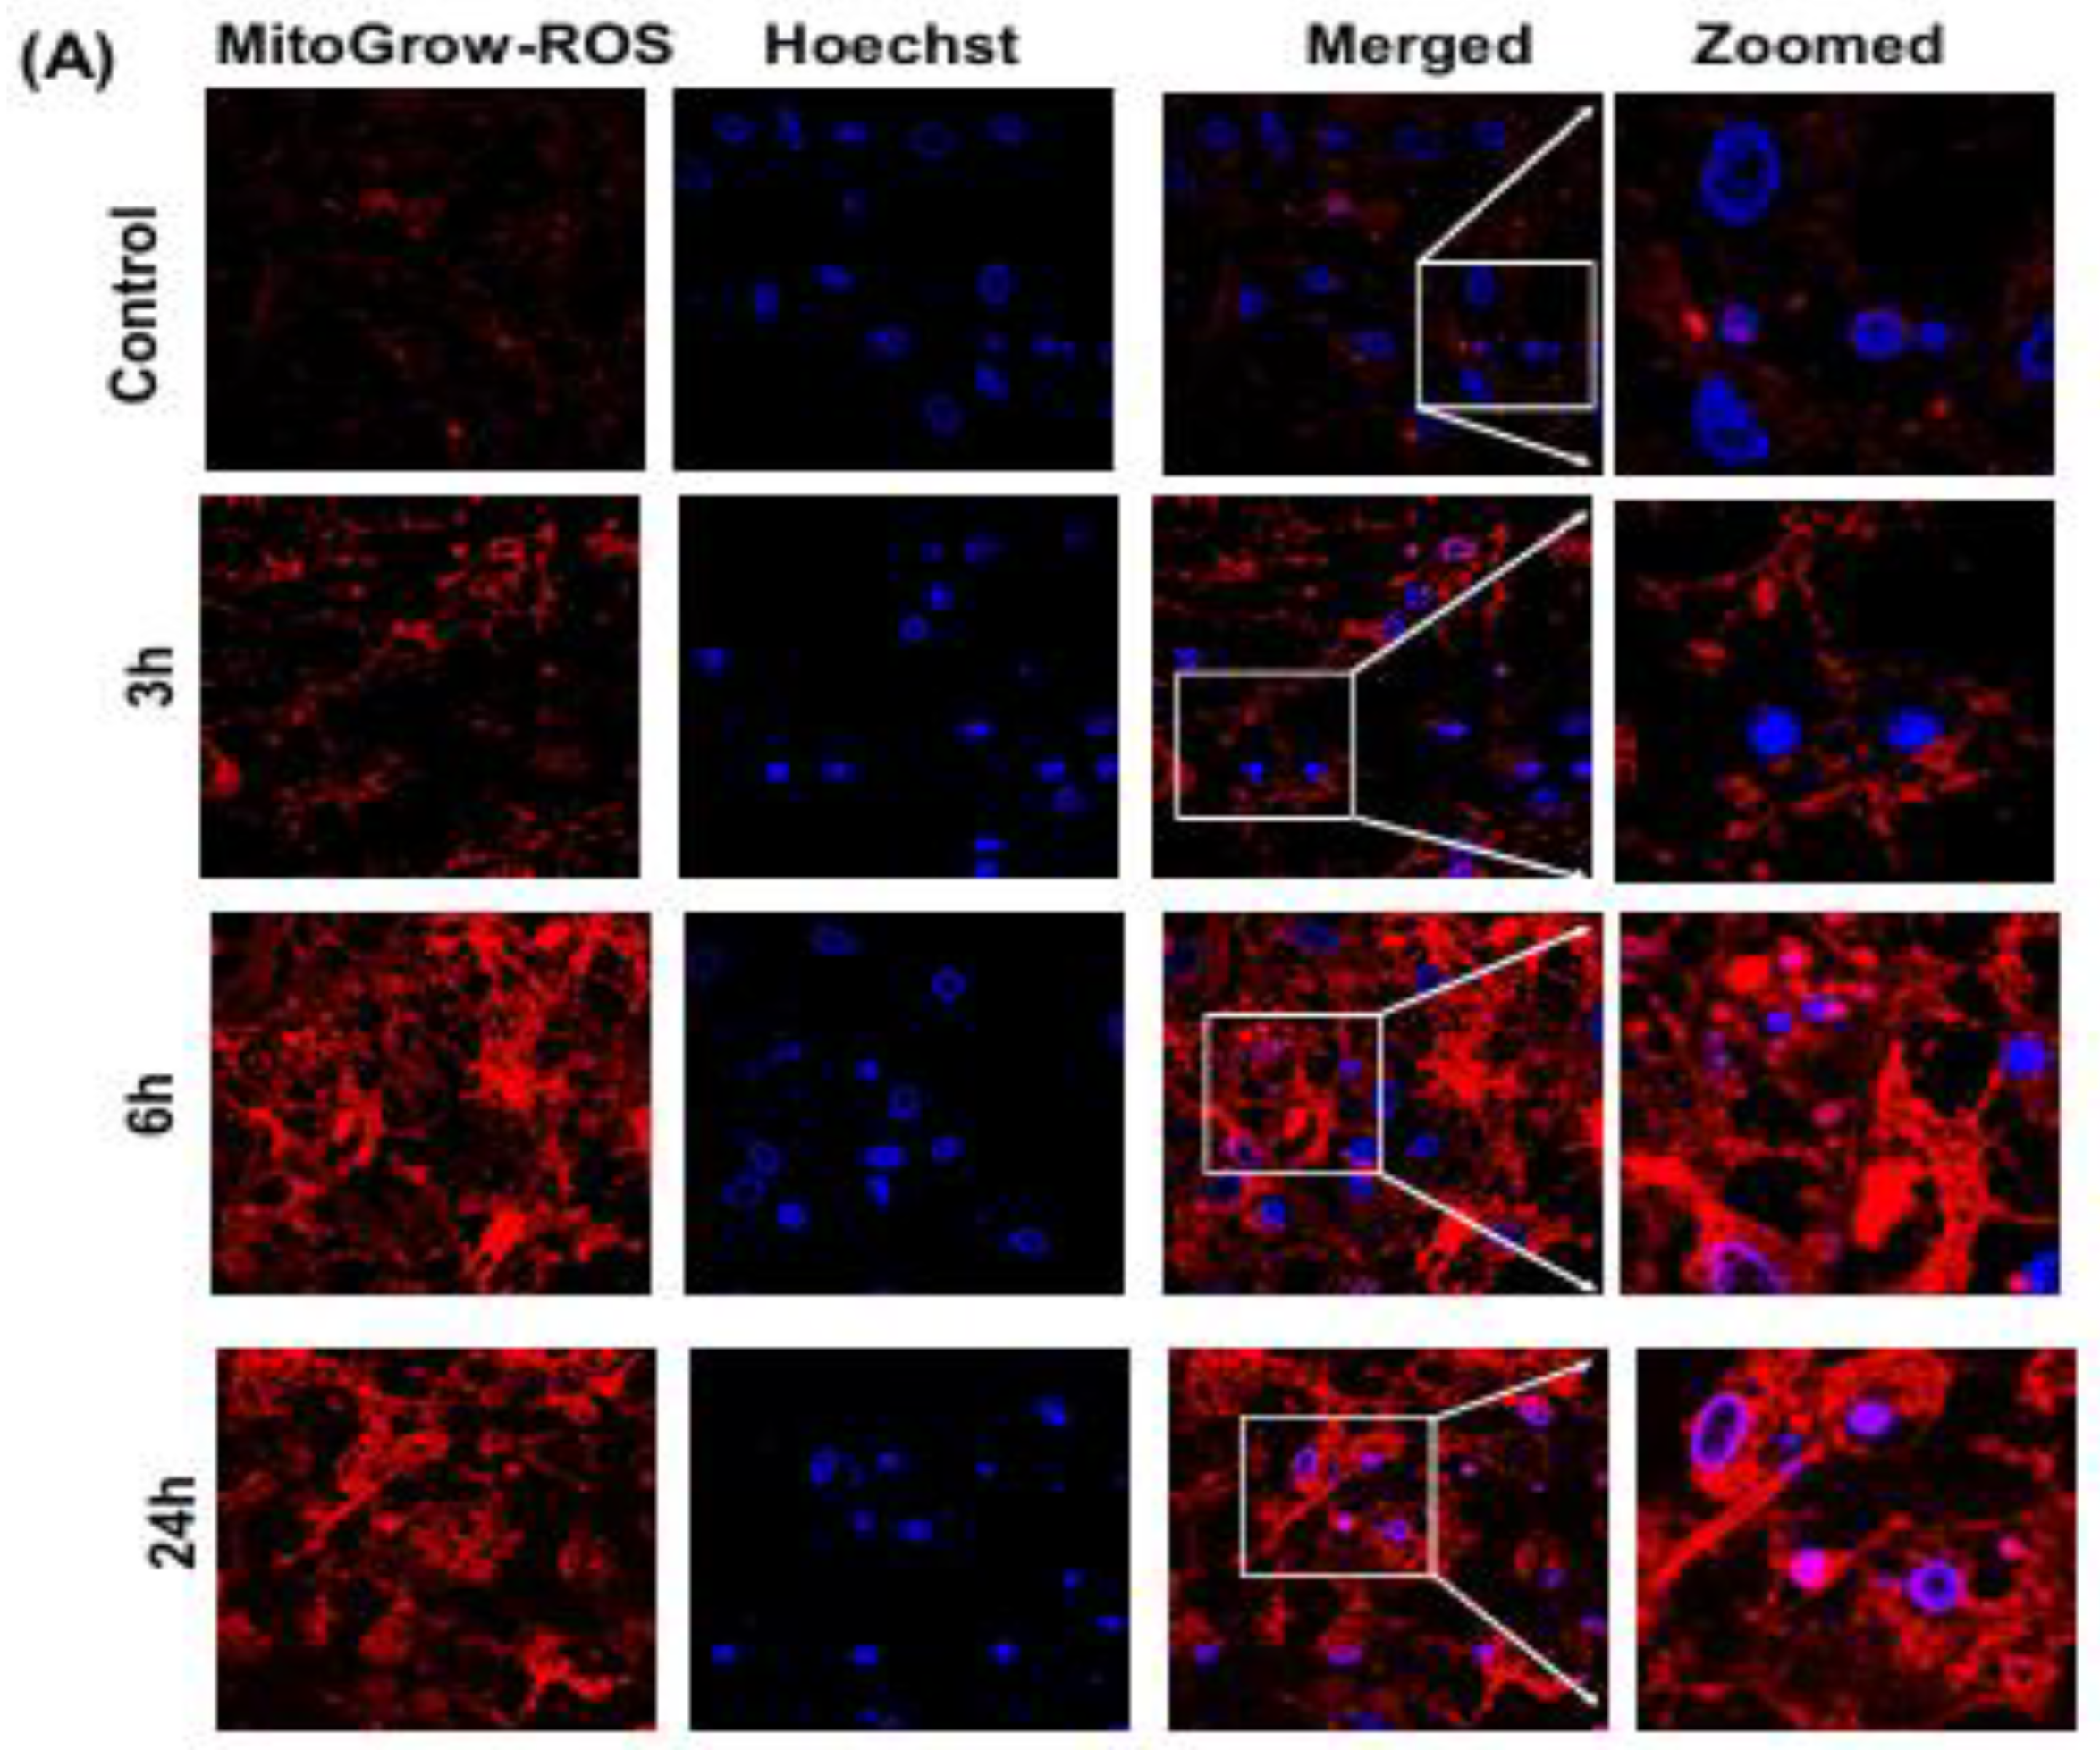
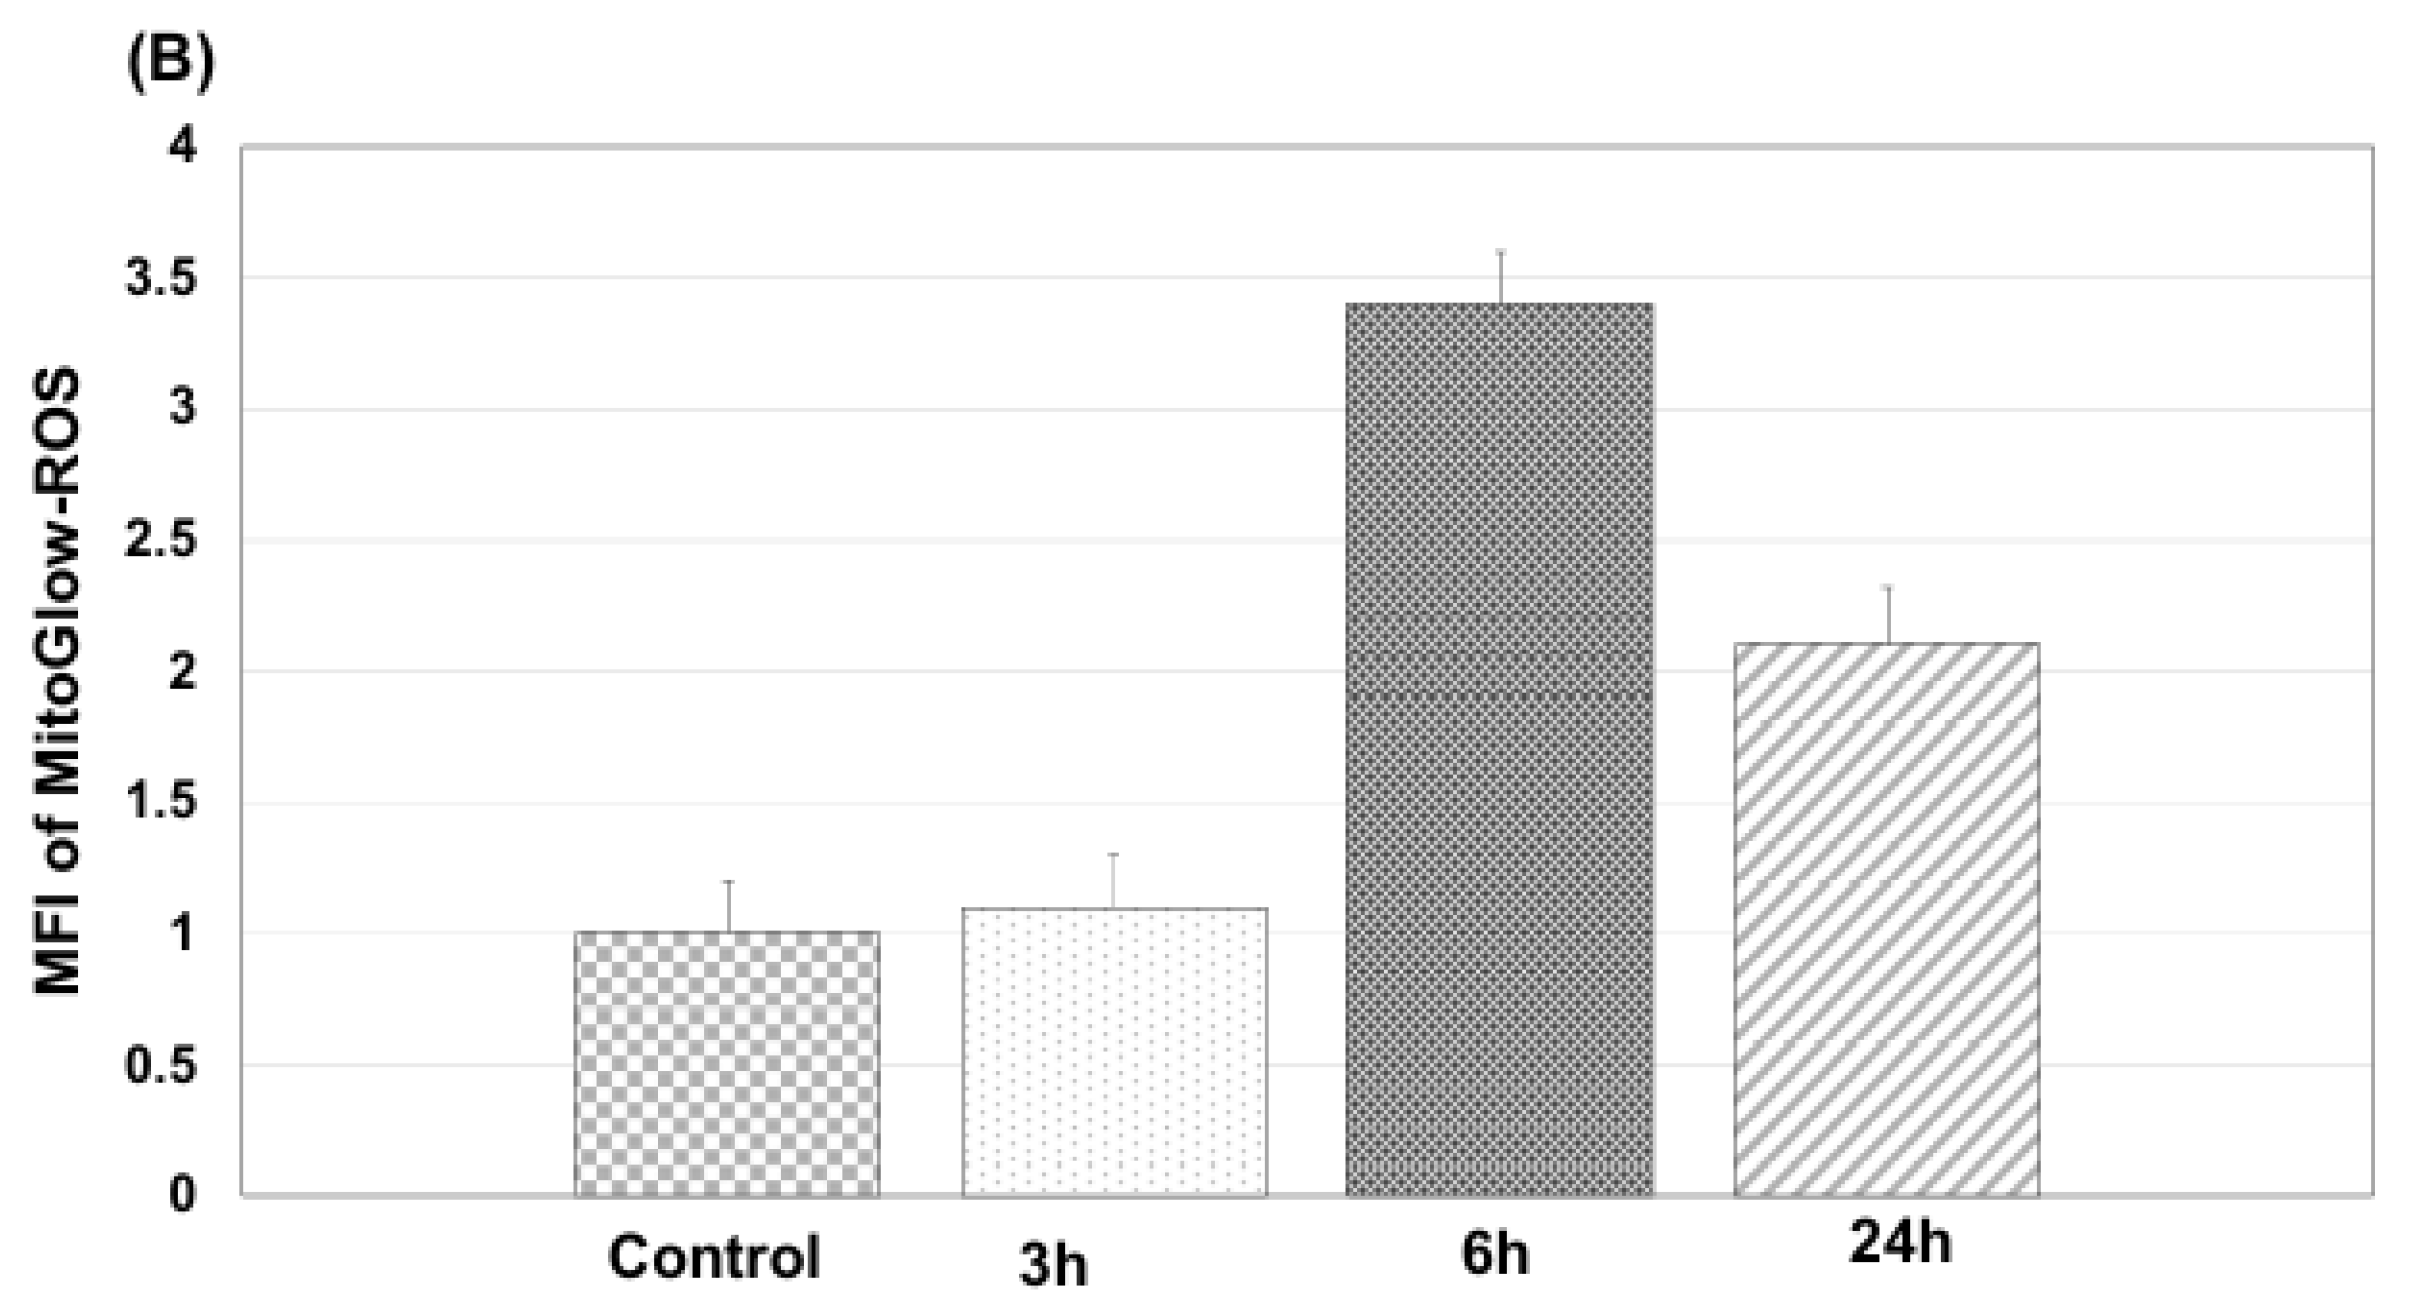
Figure 4.
The time-dependent effects of LPS treatment on inflammatory mediators and antioxidant enzymes in primary neuronal cultures. The mRNA levels of TNFα (A), IL1B (B), IL6 (C), CCL2 (D), CCL5 (E), CCL12 (F), NF-kB (G), CYBA (H), CYBB (I), SOD1 (J) and SOD2 (K) were semi-quantified by real-time PCR and compared among control, 3h-100ng/mL, 6h-100ng/mL and 24h-100ng/mL groups. The mRNA levels were normalized with GAPDH. The one-way ANOVA test was used for statistical analysis. Graphs indicate mean ± SEM. * P< 0.05, **P<0.01,***P<0.001,****P<0.0001.
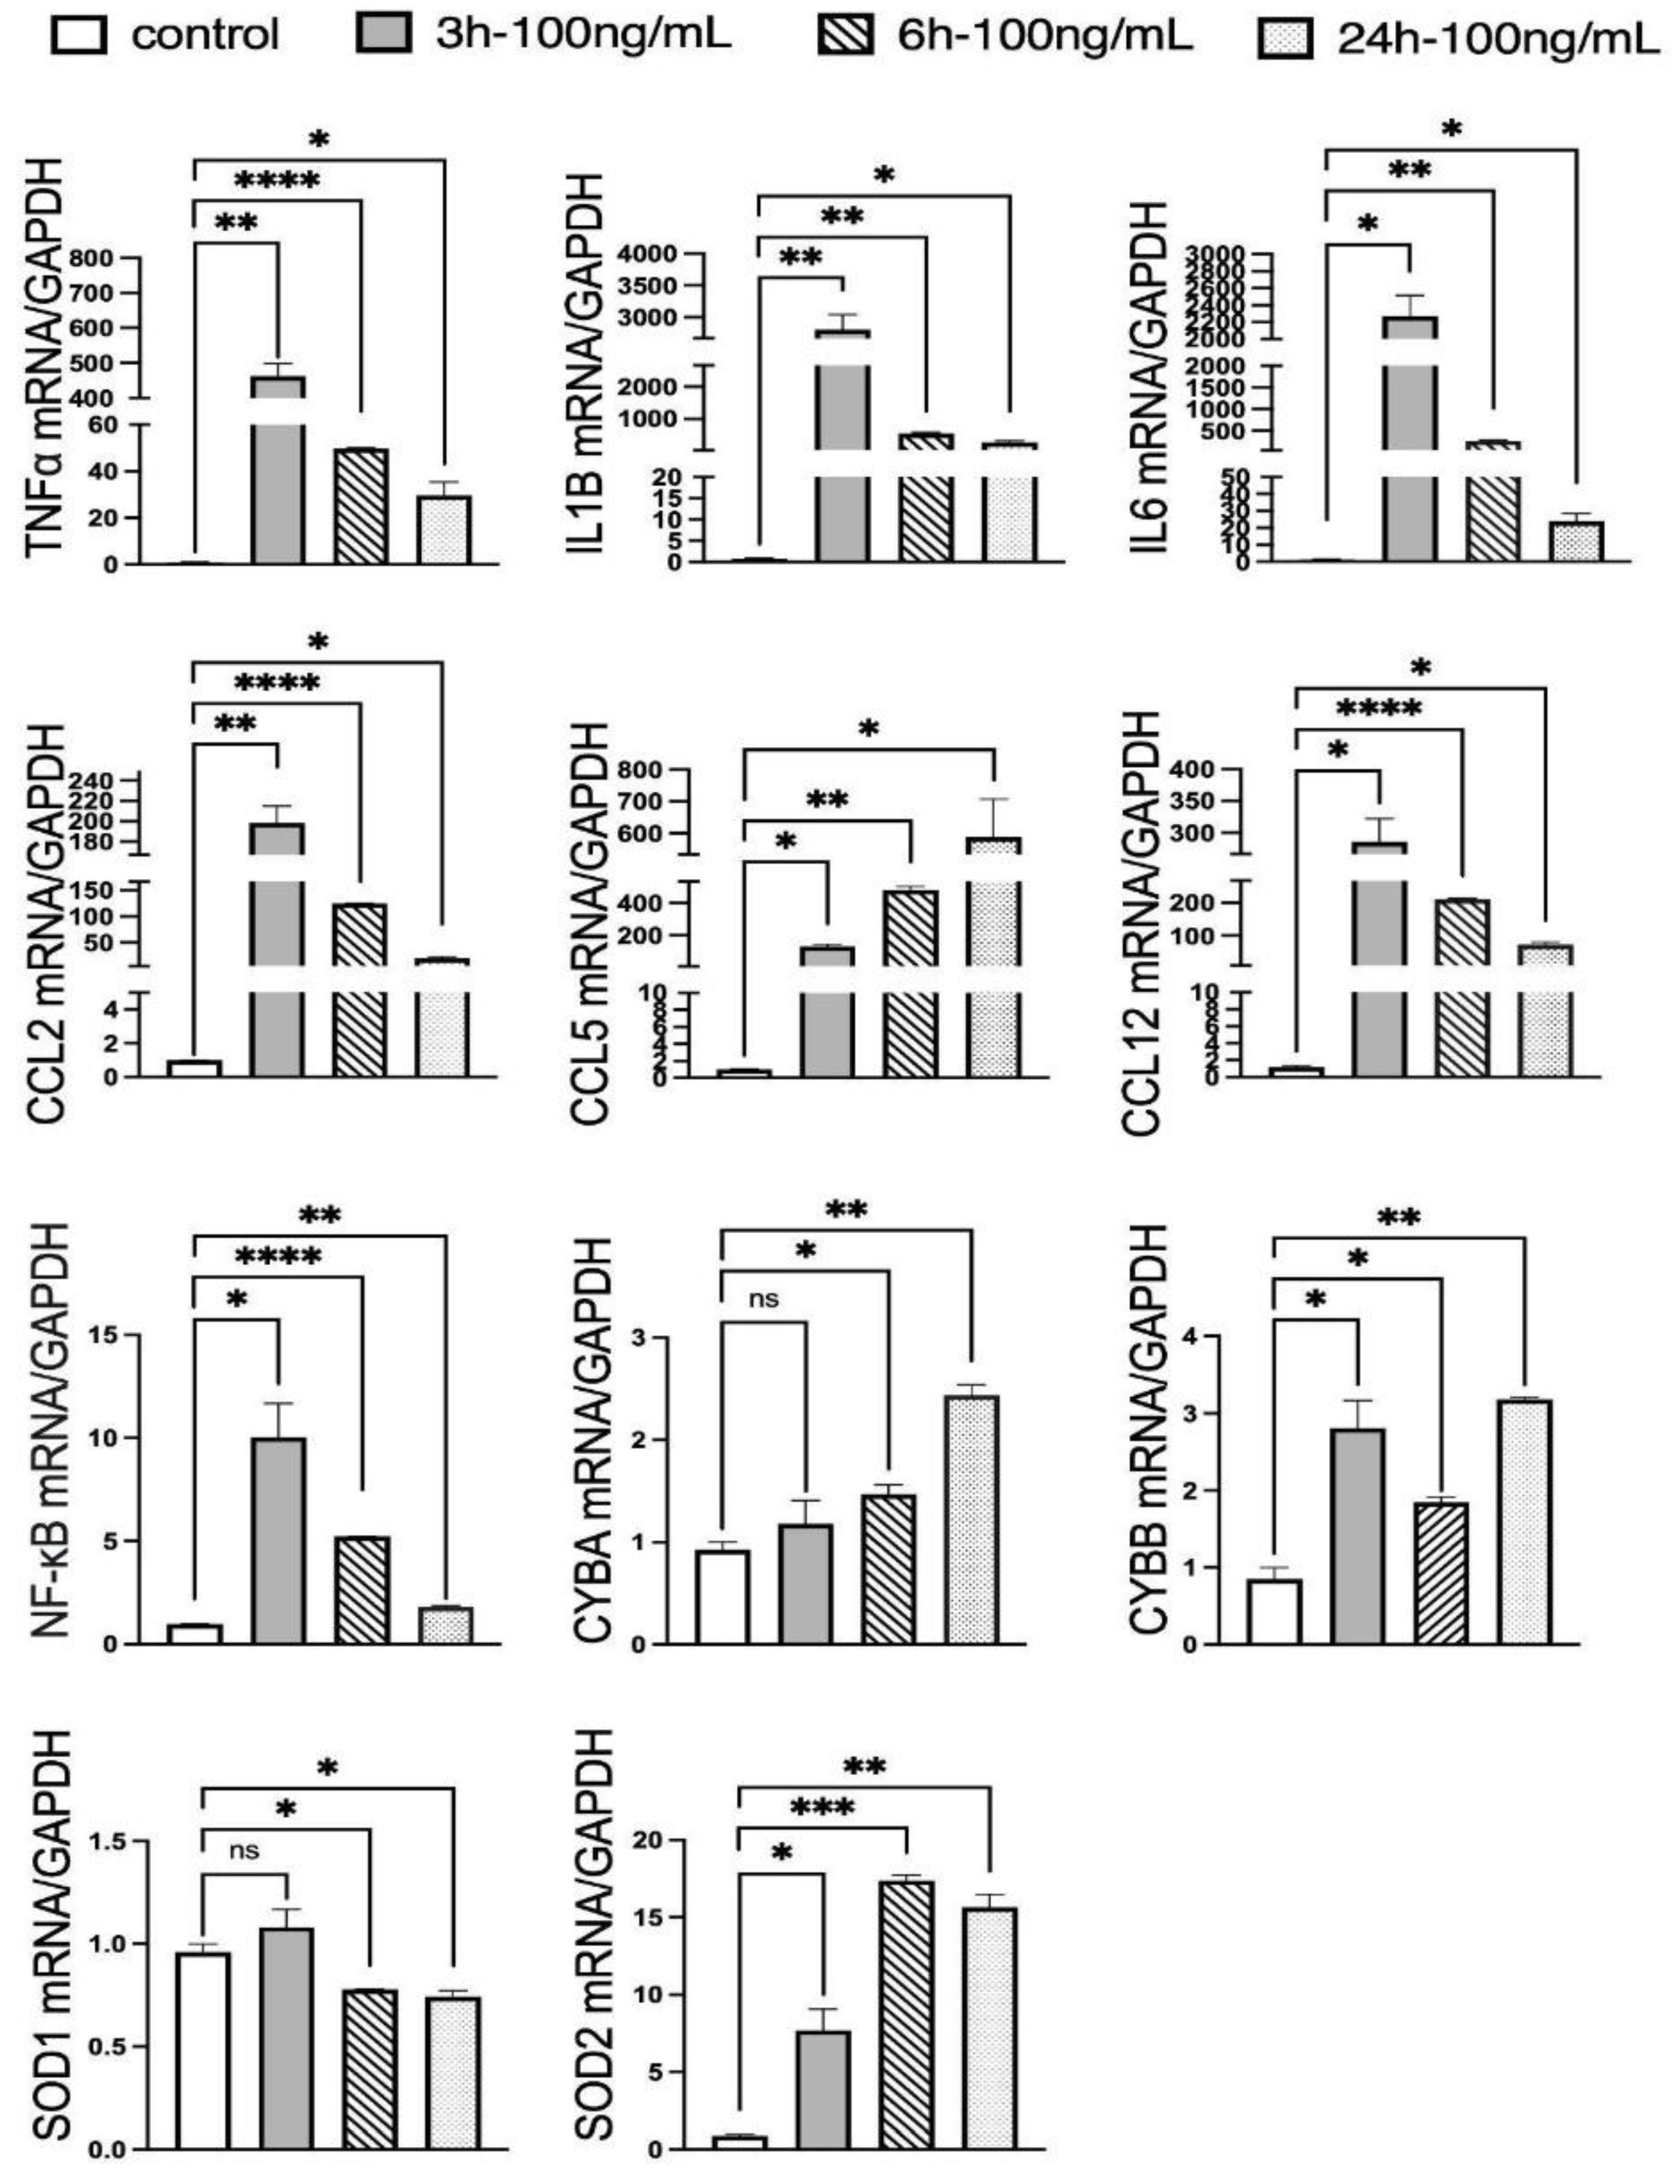
Disclaimer/Publisher’s Note: The statements, opinions and data contained in all publications are solely those of the individual author(s) and contributor(s) and not of MDPI and/or the editor(s). MDPI and/or the editor(s) disclaim responsibility for any injury to people or property resulting from any ideas, methods, instructions or products referred to in the content. |
© 2025 by the authors. Licensee MDPI, Basel, Switzerland. This article is an open access article distributed under the terms and conditions of the Creative Commons Attribution (CC BY) license (http://creativecommons.org/licenses/by/4.0/).
Copyright: This open access article is published under a Creative Commons CC BY 4.0 license, which permit the free download, distribution, and reuse, provided that the author and preprint are cited in any reuse.


