
Submitted:
06 December 2023
Posted:
08 December 2023
You are already at the latest version
Abstract
The development of biofortified and stress tolerant common bean lines contribute to counteract micronutrient malnutrition in the current condition of climate variability. Our objective was to evaluate the adaptive responses of biofortified common bean (Phaseolus vulgaris L.) lines under acidic soils and high temperature stress conditions in the Amazon region of Colombia. Adaptive responses were evaluated based on phenological, physiological and agronomic differences under combined stress conditions. A total of 247 common bean lines from the Mesoamerican gene pool were evaluated under field conditions at Florencia, Caquetá, Colombia. The common bean lines evaluated included 146 from F4 families with high iron (Fe) content and 99 common bean lines from F5 families that were obtained from simple crosses, double crosses and backcrosses among different bean lines. Lines with tolerance to combined stress conditions of acidic soil and high temperature were found with grain yields greater than 1,400 kg ha-1 from the F5 (lines: 859, 805, 865, 657) and F4 (lines: 2853, 2796) families. This improved agronomic response is likely due to the greater partitioning of photosynthates from canopy biomass (CB) toward pod formation (pod partitioning index, PPI) and grain filling (pod harvest index, PHI; harvest index, HI), which translated into higher grain yields (GY). GY was correlated with CB (r = 0.36), PPI (r = 0.6), PHI (r = 0.68), and HI (r = 0.8, P<0.001). The physiological responses that contributed toward superior agronomic performance of biofortified common bean lines include greater allocation of energy to the photosynthetic machinery (ΦII) and its dissipation in the form of heat (ΦNPQ) as the leaf temperature differential (LTD) increased under combined stress conditions. Six biofortified common bean lines (F5 lines: 859, 805, 865, 657; F4 lines: 2853, 2796) were identified with multiple stress resistance traits and these lines can serve as parents for further genetic improvement of common bean for multiple stress tolerance in the Amazon region of Colombia.
Keywords:
energy use
; leaf cooling
; phenology
; photosynthesis
; photosynthate partitioning
1. Introduction
According to the predictions of the Intergovernmental Panel on Climate Change (IPCC), the climate of the coming decades will be more drastic [1]. This situation will generate alterations related to the increase in global average temperatures, changes in precipitation patterns [2,3], decreased soil water availability and increased CO2 levels in the atmosphere [4], which affect and limit the use of agricultural land for food production [5]. Estimates for the year 2050 indicate that 60 to 100% more food will need to be produced [1], which becomes a challenge to address global food security in the coming decades, mainly in crops with high sensitivity to abiotic stress, such as beans [6,7]. Maintaining crop yields under adverse environmental conditions to some kind of "stress" is probably the greatest challenge to modern agriculture [8]. This has led to the identification and characterization of new sources of genetic resistance to different types of stresses [9], as one of the most urgent requirements to cope with the effects of climate change on crop production and crop quality [10]. The description and documentation of germplasm collections constitute an added value to the accessions, allowing genetic resources programs to recognize their potential and the genetic variability they conserve, as well as to reduce the time invested in breeding and the number of genotypes evaluated in pre-breeding early generations [11].
The common bean (Phaseolus vulgaris L.) is possibly the most important edible grain legume in the world [12]. It contributes a total of 20-36% protein, as well as 15% of daily calories [13] and has essential amino acids, such as methionine, lysine, and tryptophan, in addition to iron, calcium, and zinc [11]. These attributes allow it to have a high nutritional value and consider it as a main source of protein in resource-poor populations [14], especially in developing countries in areas of Latin America, Africa and parts of Asia [14,15]. However, despite the great attributes and contributions that beans present as food, their high susceptibility to different stress factors is a constraint to their growth and grain production [16], especially in the tropics [17]. Because of this, breeding priorities in the tropics tend to focus on alleviating productivity constraints to reduce the huge gap between yield potential and yields obtained on the farm level [15]. This makes new generations of varieties respond to recent and more variable environmental conditions, with the ability to cope with and mitigate the effect of the climate change [18]. Specifically for Colombia, common bean breeding interventions could potentially be implemented in areas with proportions of its population living in poverty, including the Amazon region [19], where 7% of school-age children are chronically malnourished with moderate to high risks of iron (Fe) deficiency [20].
Advances in plant breeding and phenotyping have been used for elucidating physiological mechanisms related to the description of developmental stages, dry matter dynamics per organ, source-sink relationships and growth models [21,22], which are of great utility for the selection of parents with traits of interest [15] in favor of improving the response of common bean to stress conditions [14,17]. One of the most important breeding traits for genetic enhancement is biofortification, which seeks to biologically increase Fe and zinc (Zn) concentration in the grain [23,24,25], whose average reported value is 55 and 28 mg kg-1, respectively, with extremes of 102 and 54 mg kg-1 [26]. One of the possible – however still not identified - causes of these low micronutrient contents are likely related to soil fertility, which significantly affects the accumulation of these two elements (Fe and Zn) in the grain [27].
In recent years, bean materials with high Fe and Zn concentration have been developed from multiparent advanced generation inter-cross (MAGIC) populations (37.9-87.6 mg kg-1 for Fe and 18.5-39 mg kg-1 for Zn) [28], or three Mesoamerican biparental populations of parents with high Fe and Zn accumulation (SMC 40, SMC 44 and SMC 33) with parental lines (SCR 16 and SCR 9) that combine resistance to drought, bean common mosaic virus (BCMV) and bean golden yellow mosaic virus (BGYMV) and these line accumulated between 49.2-108.3 mg kg-1 and 16.9-43.4 mg kg-1 of Fe and Zn, respectively [21]. Using African multiparental populations that were obtained from AND 620, HRS 454, Gofta, Nakaja, Simama and MLB 49-89A which accumulated between 30-115 mg kg-1 and 10-60 mg kg-1 of Fe and Zn, respectively [29] more than 2,800 bean samples were generated for improving Fe and Zn concentration in grain [30]. Likewise, Fe and Zn concentration of materials from different biparental populations have been generated between Cerinza × G 10022 (54-100 mg kg-1 for Fe and 23-38 mg kg-1 for Zn) [31], G 21242 × G 21078 (28-95 mg kg-1 for Fe and 17-49 mg kg-1 for Zn) [32], G 14519 × G 4825 (35-97 mg kg-1 for Fe and 17-49 mg kg-1 for Zn) [33], DOR 364 × G 19833 (40-84 mg kg-1 for Fe and 17-42 mg kg-1 for Zn) [34]; AND 696 × G 19833 (39-79 mg kg-1 for Fe and 16-29 mg kg-1 for Zn) [35], and from different bean lines developed in Brazil with concentrations ranging from 55.7-85.4 mg kg-1 for Fe and 29-47.2 mg kg-1 for Zn [36]. However, it has been reported that seed Fe and Zn concentration is highly affected by bean genotypes, environments and genotype-by-environment interactions [37,38,39].
The above studies contributed to development and identification of materials that not only accumulate a high concentration of micronutrients together with adaptation to drought stress and disease resistance. However, no results are reported on biofortified bean lines that are adapted to the combined stress conditions of acidic soil and high temperature. An evaluation program of different improved bean lines was initiated in 2018 by the University of Amazonia under the supervision of the CIAT bean breeding program where initial consideration was given to evaluate the adaptation of advanced lines (ALB: small red kidney, black kidney, lines are adapted to drought and Al toxicity; BFS: small red lines that are adapted to low soil fertility; SAB: cream speckled red, lines of the Andean gene pool are drought resistant; SMR: red, lines are drought resistant, with high mineral (Fe) content) to acid soil conditions and high temperatures in the western Amazon of Colombia [40]). This previous study identified three lines: BFS 10, BFS 143 and ALB 210 with adaptation to combined stress conditions of acidic soil and high temperature based on their physiological attributes [41] and agronomic performance [40]). Likewise, lines such as SEN 46, SEN 48, SEN 70, SMN 99, SMC 140, SMR 139-1G [42] and GGR 147, SMG 21 and SMG 12 have also been identified. These lines have shown a high adaptability with grain yields higher than 1,800 kg ha-1 [43] and have high mineral contents of Fe and Zn in seed. Therefore, the objective of this study was to evaluate the adaptive responses of biofortified bean lines to combined stress conditions of acidic soil and high temperature based on their phenological, physiological and agronomic attributes for identification of desirable attributes for further genetic improvement. We tested the hypothesis that biofortified bean lines with increased cooling capacity and energy distribution to the photosynthetic machinery have the ability to increase photosynthate partitioning toward pod formation and grain filling under combined stress conditions of acidic soil and high temperature.
2. Materials and Methods
2.1 Experimental site and meteorological conditions
The experiment was conducted under field conditions during June to September 2020 and between November 2020 and January 2021 at the Amazon Research Center CIMAZ Macagual of the University of Amazonia, located in the municipality of Florencia, Caquetá, Colombia at 1°37’ North latitude and 75°36’ West longitude and an altitude of 250 m above sea level, in a tropical rainforest ecosystem. The average annual rainfall is 3,800 mm, with periods of maximum rainfall in April and November, with an average temperature of 25.5 °C and a relative humidity of 84% with 1,700 h of sunshine per year. During the crop growth period, there was a total rainfall of 866 mm, an average humidity of 83.6% and an average ambient temperature of 36.4 °C, with minimum temperatures ranging from 18.4-26.6 °C and maximum temperatures between 25.0-36.9 °C (Figure 1). The area used for the experiment is characterized by an acidic soil (pH 4.6) with high aluminum (Al) saturation of over 70%, and with an exchangeable Al content of 6.3 cmol(+) kg-1. The soil is considered of very low fertility based on low availability of P (Bray- II) of 2.58 mg kg-1, and low organic carbon of 1.35%, together with low total base saturation of 7.1% (cmol(+) kg-1: Ca, 0.38; Mg, 0.1; K, 0.14; Na, 0.1) and low cation exchange capacity of 11.3 cmol(+) kg-1. The preparation of the land used for the experiment, as well as the sowing of seed of common bean lines, was done manually, as was the control of weeds. No fertilization or irrigation was applied to the experiment, nor were pesticides applied for pest and disease control.
2.2. Plant material and experimental design
A total of 247 common bean lines from the Mesoamerican gene pool were used: 146 bean lines from F4 families with above average seed Fe and Zn concentration (Fe 80.2±0.4 mg kg-1, Zn 28.7±0.3 mg kg-1) and 99 common bean lines from F5 families with moderate seed Fe and Zn concentration (Fe 63.5±0.7 mg kg-1, Zn 25.6±0.2 mg kg-1), with a variety of seed colors ranging from red to black, which were obtained from single crosses, double crosses and backcrosses between different bean lines (detailed pedigree of lines is presented in Table S1). Two advanced lines of Mesoamerican origin of common bean (P. vulgaris were used as controls: AMADEUS (TIO CANELA 75 × DICTA 105) (small red) and SER 16 (RAB 651 × TIO CANELA 75) × (RAB 608 × SEA 15) (small red). These germplasm sources constitute potential parental material due to their resistance to abiotic and biotic stress factors, improved grain quality (micronutrient content) and other desirable attributes that improve grain yield and market value. A completely randomized block design with three replications was used, each block consisting of the 247 genotypes and the two controls (repeated in each row and column per block, to cope with spatial variability within the experimental site). Each experimental unit (plot) consisted of three rows, each row with three meters apart. In each row, 25 bean plants were planted at a distance of 12 cm between plants, for a total of 75 plants per plot.
2.3. Canopy biomass, dry matter partitioning indices, grain yield and yield components
During the growth stage, specifically at the mid-pod filling growth stage (BBCH 79, 55 days after planting), destructive sampling was carried out in one of the central rows, in order to avoid the edge effect. A 0.5 m segment of the row corresponding to a total of four plants was taken to determine the canopy biomass (CB). Likewise, at the physiological maturity stage (BBCH 85, 76 days after planting), another 0.5 m row segment corresponding to a total of four plants was taken for destructive sampling to record the dry weight of leaves, stems, pods and seeds for each plant. The seed number per area (SNA) and the pod number per area (PNA) were also recorded during the sampling at physiological maturity. With the biomass recorded for each component in the two growth phases, different dry matter partitioning indices were determined according to Beebe et al. [14]. Pod partitioning index (PPI): dry weight of pod biomass at harvest/total canopy biomass (CB) dry weight at mid-pod fill × 100; pod harvest index (PHI): seed biomass dry weight at harvest/pod biomass dry weight at harvest × 100; and harvest index (HI): seed biomass dry weight at harvest/total canopy biomass dry weight at mid-pod fill × 100 [16]. Destructive sampling was performed in the central part of each plot at the time of harvest. The pods of harvested plants were threshed and the kernels were cleaned and dried to determine grain yield (kg ha-1). The weight (g) of 100 seeds was quantified with a homogeneous random sample.
2.4. Phenological behavior and viability of pollen
Days to flowering (DF) and days to physiological maturity (DPM) were measured in each plot. The DF corresponds to the number of days it takes for each bean line to reach at least one flower on 50% of the plants planted in the plot, and DPM relates to the number of days after planting for the pods to lose their green pigmentation on 50% of the plants planted in the plot. On the other hand, in order to determine the influence of high temperature on the different bean materials, pollen viability (PV) was evaluated following the methodology of Porch and Jahn [44] and Suzuki et al. [45]. Flower buds (n = 10) were collected before anthesis and stored in plastic jars with a 96% glacial acetic acid solution with alcohol at 4 °C. Pollen grains were removed from the anthers and then a drop of 1% acetocarmine was added. About 100 pollen grains from each flower bud per replicate were tested for pollen viability. Pollen grains that stained red were considered viable (fertile pollen), while those that did not stain were considered infertile or nonviable. After counting, the percentage viability was calculated as the ratio of stained grains to total grains.
2.5. Energy use efficiency and leaf cooling capacity under high temperature conditions
To measure differences in energy use efficiency among bean lines, the MultispeQ portable device was used which was developed by PhotosynQ [46] that has the capacity to measure different variables of the functioning of the photosynthetic apparatus, fractions of the routes taken by the energy, chlorophyll fluorescence as well as environmental variables. For this, the default protocol of Photosynthesis RIDES was used in which the measurement starts automatically once the clamp is opened and closed. During the flowering period (BBCH 65, 44 days after planting) in the central row of each plot three plants were taken at random, from each plant three fully developed leaves located between the seventh and ninth leaf from the base of the plant were taken to perform different measurements, and from each selected leaf three measurements were taken, and these measurements were made between 07:00 and 09:00 hours (solar time). Among the environmental variables that were measured simultaneously using MultispeQ were photosynthetically active radiation (PAR), as well as humidity and ambient temperature. Leaf temperature was also measured and the leaf temperature differential (LTD) was calculated using the difference between leaf temperature and ambient temperature. Different physiological variables were determined through measurements such as linear electron transport (LEF) which indicates the amount of energy moving through the chloroplast and is mainly related to photosynthetic activity, and was calculated by the equation LEF = (Φ(PAR)-YϕII) × f, where f is the fraction (f = 0.45) of absorbed radiation that is transferred to the PSII centers and ϕII corresponds to the effective quantum yield [46]. Likewise, ATP synthase activity was calculated by measuring the proton conductance of the thylakoid membrane (gH+) and the amplitude of the electrochromic band shift signal (ESCt) [47] which were determined using the dark-interval relaxation kinetic (DIRK) of electrochromic shift [48]. ESCt estimates proton transport in the trans thylakoid membrane in relation to the proton motive force (pmf). Based on the above, the proton flux was estimated as follows: (νH+ = ECSt × gH+) [49].
The different fractions of energy intake were measured, which are related to: i. Energy received by photosystem II (ΦII) and it indicates the state of the photosynthetic machinery of the plant; ii. Energy dissipated as heat (ΦNPQ); and iii. Energy not dissipated which represents potential damage to the plant (ΦNO), in which all fractions should sum to one (1=ΦII+ΦNPQ+ΦNO [50]). Likewise, the relative chlorophyll content (RChl) was measured and the other physiological variables related to quenching due to non-photochemical dissipation of absorbed light energy (NPQt) were calculated according to Tietz et al. [51]. Also different PSI redox states were estimated from those described by Kanazawa et al. [47], which corresponded to the total active PSI centers (PSIact), the fraction of oxidized (PSIox) and open-state (PSIopen) PSI centers, as well as the over-reduced PSI (PSIor) corresponding to PSI acceptor side limitations resulting from the accumulation of electrons in PSI acceptors during steady-state illumination. The data taken with the MultispeQ (n=2477) [52] were stored in the PhotosynQ platform, of which no data with errors taken during sampling were reported. The database was downloaded and each of the variables was independently analyzed for outliers using Pearson’s standardized residuals; and this process provides a measure of how well the model predicts the observation by recording those data that do not present an adequate fit [53].
2.6 Determination of Fe and Zn in seeds
The seeds of biofortified lines were used to evaluate the adaptive responses in this study. Before sowing the seeds, the seed Fe and Zn concentrations were determined. Atomic absorption spectroscopy (AA-7000, Shimadzu Co., Kyoto, Japan) was used to determine the concentration of seed Fe and Zn using the acid digestion method [54]. In brief, 0.5 g of the seed sample was digested with 3 mL of nitric acid (HNO3; 65%, P.A., ACS, ISO; PanReac AppliChem, Spain) in a porcelain crucible, heated for 30 min at 150 ± 5°C until the formation of brown vapor, then 2 mL of perchloric acid (HClO4; 70%, P.A., ACS, ISO; PanReac AppliChem, Spain) at 200 ± 5°C until the solution became translucent and white vapor formed, indicating complete digestion of the organic matter. Finally, 3 mL of hydrochloric acid (HCl; 37%, ACS, ISO; PanReac AppliChem, Spain) was added without heating and allowed to cool to room temperature, and the digested sample was transferred to 50 mL volumetric flask. The transfer was performed using qualitative filter paper (3hw, 110 mm, 65 g/m2; Boeco, Germany) and the volume of the solution was brought to 50 mL with deionized water for determination of seed Fe and Zn concentration.
2.7. Data analysis
The data of the different phenological and physiological variables and those related to biomass partitioning were graphed using scatter diagrams in order to determine the trend and relationships between the variables and thus these data be suitable to evaluate differences in determine the adaptive responses of common bean lines to combined stress conditions of acidic soil and high temperature. Different variables such as grain yield (GY), such as ΦII, ΦNPQ and ΦNO, which are related to energy use, were located on the Y axis; On the X axis, CB, PPI, PHI, ΦII, LEF and LTD were located. Likewise, a variation of the variable (SNA, PNA, SW, ΦNPQ, LTD, GY) that is related to the intensity of the color change (from red to violet from highest to lowest value) was included in the dispersion graphs and a magnitude that is related to the size of the circle (PNA, SW, CB, ΦNO, PSIox, PHI, CB, HI). In each of the scatter plots, a line was drawn on each axis which corresponds to the mean value of each variable. Likewise, a correlation analysis was carried out using the Pearson test to determine the relationship between the variables. The scatter plots were made using the ggplot2 package [55] in R language software, version R.4.2.0. [56].
3. Results
3.1. Phenotypic differences in agronomic performance
We analyzed the agronomic performance of 247 lines and we found significant phenotypic differences among the lines. We observed that about 141 lines reached the harvest stage; of which only 116 lines presented a range in grain yield (GY) from 110 to 2,109 kg ha-1 with a mean value of 593 kg ha-1 and 25 lines presented values below 100 kg ha-1. Lines of the F5 family (Lines: 859, 805, 865, 657) and F4 family (2853, 2796) achieved grain yields above 1,400 kg ha-1. We found that canopy biomass (CB) values ranged from 333 to 3153 kg ha-1 with an average value of 1,180 kg ha-1. The lines with the higher values (>2,000 kg ha-1) were three from the F5 family (775, 785, 827) and seven from the F4 family (2861, 2863, 3309, 3319, 3597, 3558, 3602, 3630) (Figure 2a).
In relation to photoassimilate remobilization from vegetative structures to pod formation, pod partitioning index (PPI) values ranged from 5 to 97% (Figure 2b). From the F5 family, eight lines (885, 887, 755, 859, 795, 667, 849, 683) and from the F4 the family four lines (2781, 3730, 2991, 2796) exhibited PPI values that were higher than 70% (P<0.001) (Figure 2b). For the remobilization of photoassimilates from the pod wall to grain formation, the pod harvest index (PHI) values in nine lines such as 873, 2853, 665, 861, 3744, 2796, 2781, 789, 657 were higher than 50% (Figure 2c). The harvest index (HI) value reached up to 49% (Figure 2d). The lines with higher grain yields such as 2796, 3730, 859 and 2853 had also exhibited higher HI values. For the seed number per area (SNA), about 13 lines stood out for producing more than 300 seeds m-2 (P<0.001). The average weight of 100 seeds was between 10 and 54 g, with lines 657, 653, 2796 and 859 presenting values higher than 37 g (P>0.001).
3.2. Phenotypic differences in phenology and pollen viability
During the time of adaptation of the promising lines from the F4 and F5 families, days to flowering ranged from 33 to 44 days after planting (DAP), respectively. Lines such as 795, 841 and 745 flowered earlier in response to combined stress conditions. Several lines (715, 3596, 663, 803, 3637, 3741, 849, 3649, 823, 3599, 843, 801, 897, 2824, 3634, 813, 2980, 837, 713, 3315, 3561, 29,17, 679, 891, 755, 2820, 833) reached the physiological maturity stage earlier. However, lines with higher GY values were found to reach maturity slightly later. Pollen viability (PV) ranged from 37% to 95% with an average value of 59.5%. About 144 lines showed values of PV above 70%. However, four lines (859, 2853, 3730, 2796) showed values below 70%.
3.3. Phenotypic differences in energy use, leaf cooling and linear electron flow
When analyzing differences in performance of photosynthetic apparatus, it was found that parameters such as LTD, LEF, ECSt, vH+ and RChl were significantly different among lines (P<0.001). In general, all lines were able to adjust their leaf temperature values below ambient temperature (AT) values providing leaf cooling. For example, lines such as 3632 and 835 presented more negative LTD values (-7 of ambient temperature; in this study we use “negative” for values, not in the sense of the meaning), indicating a marked leaf cooling compared to high air temperature value. On the other hand, some lines such as 3596 and 793 presented less negative LTD values and their energy use efficiency related to photosynthetic processes was also low (Figure 3a). However, for the case of linear electron flow (LEF) and vH+ parameters, line 3596 presented the highest values (Figure 3b), However, line 2962 presented the highest values of ECSt and PSIox. Line 815 showed the highest values in PSIor and PSIox. Chlorophyll fluorescence derived parameters were significantly influenced by high temperature and soil acidity (P<0.001). For example, higher values of GY were related to higher values of PSII quantum yield (ΦII), a situation that occurred with some lines such as 859, 2853, 805 and 2815, in addition, these lines exhibited a lower value of ΦNPQ (Figure 3a). However, the effect of stress was evidenced in most of the bean lines, due to the increase of ΦNPQ, and higher allocation to ΦNO showing a lower distribution of energy to photochemical processes (ΦII), which impacted negatively on GY as evidenced in most of the lines that exhibited GY values below 1,000 kg ha-1 (P<0.001, Figure 3a). When analyzing the relationship between GY and LEF, line 865 (GY = 1,453 kg ha-1) showed a higher electron transport rate combined with a higher proportion of open PSI centers (LEF = 228) (Figure 3b). An opposite relationship was observed with lines 859 and 2853 that showed GY values above 1,800 kg ha-1 with average values of LEF (132 and 171, respectively) (Figure 3b).
In terms of energy use, the bean lines on average used 49% and 22% for photosynthetic processes (ΦII) and dissipation of energy in the form of heat (ΦNPQ), respectively, and the remaining toward unregulated processes (~ 27% ΦNO). When we analyzed the effect of high temperature on the photosynthetic apparatus, we found very particular behaviors such as those presented by lines 859, 2815 and 805. These three lines presented ΦII values higher than 50%, which positively impacted agronomic variables such as PHI and GY. These differences were closely related to LTD by showing values of -3.8, -3.4 and -4.0 ºC for 859, 2815 and 805, respectively (Figure 4a). Even though, lines 713, 861, 863, 2866 and 3561 eliminated the negative effect of high air temperature on thylakoid membrane function but these lines were not as efficient in mobilizing photoassimilates for grain formation (900 kg ha-1) (Figure 4a). When observing in detail the behavior of the photosynthetic apparatus of the bean lines that presented higher values of GY, differences were found that are mainly related to the ability to dissipate heat. For example, line 859 presented LTD value 3 ºC lower (less negative) than that presented by genotype 2853. The latter with a significantly higher value of GY due to its greater capacity to mobilize photoassimilates towards grain development. This is probably related to the higher efficiency of PSII (Figure 4a) together with dissipating less energy as heat (Figure 4a). On contrary, lines 865 and 657 showed the lower values of ΦNO with higher (more negative) values of LTD (Figure 4c).
Looking at the magnitude of energy moving through the chloroplast when exposed to light in bean lines, we found that the lines that presented higher energy allocation toward photosynthetic processes (859, 805, 2015) (Figure 5a), presented lower energy dissipation in the form of heat (ΦNPQ) (Figure 5b). This photosynthetic response was related to higher oxidized PSI reaction centers (PSIox) and lower proton flux in the thylakoid membrane (vH+) (Figure 5b). Line 657 showed the highest value of unregulated energy dissipation (ΦNO) (Figure 5c) together with greater values of proton conductance of the thylakoid membrane (gH+), active (PSIact) and open center (PSIopen), chlorophyll content (RChl) and proton flux (vH+), and these superior values of photosynthetic performance contributed toward improved pod filling (PPI) and grain filling (PHI) through photosynthate mobilization. In general, we found 9 lines with higher values of GY with lower values of lineal electron flux, however, these lines exhibited greater ability to mobilize photosynthates that resulted in superior agronomic performance.
3.4. Correlations between physiological and agronomic traits
According to the correlation analysis, days to flowering (DF) values were negatively associated with different biomass partitioning indices (PPI, PHI, HI) (Table 1). The GY correlated with CB (r = 0.36 P<0.001), PPI (r = 0.6, P<0.001), PHI (r = 0.68, P<0.001), HI (r = 0.8, P<0.001), as well as with photosynthetic performance variables positively with LEF (r = 0.11, P<0.05), PSIact (r = 0.13, P<0.05) and negatively with ECSt (-0.16, P<0.01) (Table 1). The value of ambient temperature (AT) was related to HI (r = 0.15) and PHI (r = 0.19) and negatively to DF (r = -0.27), while DPM was positively related to LTD (Table 1). On the other hand, in the relationship between dry matter partitioning indices and the functional aspects of photosynthetic apparatus, we found that leaf cooling (LTD) positively influenced pod filling (PPI) (r = 0.15) and negatively with PSII quantum yield (ΦII) (r = 0.11). At the level of photosynthetic apparatus functioning, we found that it was negatively related to PHI (r = -0.16) and HI (r = -0.16), in addition, a negative effect was found on the proton flux of the thylakoid membrane (vH+= -0.87) (Table 1). At the level of energy use within the chloroplast, LEF was found to favor biomass partitioning (PPI, PHI and HI), and with energy dissipation in the form of heat (NPQt, r = 0.67 and ΦNPQ, r = 0.78). However, the redox states of PSI affected PHI positively (PSIact, r = 0.13) and negatively (PSIox, r = -0.03) (Table 1). As for seed Fe content, positive correlations were found with CB, DF and VH+, but negative correlations were found with some variables related to biomass partitioning (GY, PPI and HI), environmental variables (AT and PAR), and also those related to the functioning of the photosynthetic apparatus (gH+ and LEF) and chlorophyll content in the leaf. In the case of seed Zn, the content was positively correlated with PSIact and T, contrary to the negative correlation with gH+.
4. Discussion
4.1 Differences in crop development and photosynthate remobilization affect agronomic performance
High-yield phenotyping methods in crops such as common beans can facilitate the exploration of genetic resources by estimating phenotypic traits of importance and identifying accessions of interest for breeding programs [57,58]. This study provides data on phenotypic traits in selected common bean lines developed through breeding using intra- and interspecific crosses. The performance of lines is evaluated based on phenological, physiological and agronomic responses under the combined stress conditions of acidic soil and high temperature under field conditions. Previous research by Suárez et al. [40,59] indicated the importance of canopy biomass (CB) production and translocation of assimilates (PPI, PHI and HI) in identifying materials with capacity to adapt to acidic soils and high air temperatures of the Amazon region of Colombia.
Production of CB is the result of the accumulated net photosynthesis of the crop, which is sometimes significantly related to grain yield [16,60]. We found that as many as 11 lines showed a greater capacity to produce CB at mid-pod filling growth stage compared to the other lines. This trait suggests a higher net CO2 fixation capacity, greater access and use of water and nutrients under stress conditions [16,61]. However, the GY values observed in these lines were low, probably due to a greater sensitivity to high temperature. This condition has a greater impact on productive development, since it limits the translocation of assimilates for the formation of pods and grains [62,63]. On the other hand, nine lines consistently presented higher GY values (859, 2853, 805, 2796, 865, 657, 2815, 3730, 653), with lower CB production, and this suggests a yield advantage of these lines due to their superior capacity for remobilization of photosynthates from vegetative structures to reproductive organs (pods and grains) [64,65].
At the level of assimilate remobilization, four lines (859, 2796 2815 and 3730) were characterized by their higher capacity (>70%) to redistribute assimilates stored in vegetative structures for pods formation (PPI) and three lines (2853, 2796 and 657) in their ability to mobilize assimilates from pod walls to grain (>55%). However, we found that the critical point of these lines in general was in the translocation of assimilates from vegetative structures to grains (HI). On the one hand, these assimilate partitioning traits (PPI and PHI) have been previously highlighted as adaptive physiological responses of common bean [40,59,66] and to be considered for heritable effects toward genetic enhancement and varietal development [12]. On the other hand, it should be noted that a reduced efficiency in one of the assimilate translocation steps could result in susceptibility of others indices to stress conditions, in this case combined heat stress with soil acidity [40,61]. Furthermore, previous studies have observed that interspecific lines tend to be limited in the last translocation step (PHI), describing this phenomenon as "lazy pod syndrome" as the bean line fails to complete this critical last step of grain filling [14,16,40,42,66,67,68].
Likewise, combined stress conditions of soil acidity and high temperature significantly affected PNA and SNA in general. Three lines (2815, 755 and 2856) presented more than 100 pods per area, and around 400 seeds per area, however, these were penalized by abortions of pods and grains in the last stage of grain filling, which directly, negatively affected their final yield by almost 50%. Interestingly, three lines 859, 2815 and 2853 with higher GY values showed pod penalization reaching PNA values of 65, 57 and 114 pods, respectively, with a seed number of more than 350 m-2. These lines yielded more not because of their small seed size but because of their superior sink strength to be able to form more number of grains under stress conditions, with better mobilization of assimilates towards grain formation and filling (7 to 8 grains per pod), which compensates for the loss due to abortion of both pods and grains and this may be attributed to greater sink strength, an important trait for improved adaptation of new lines [69]. Overall, yield values contributed to the identification of nine significantly different lines (859, 2853, 805, 2796, 865, 657, 2815, 3730, 653), in terms of their stress response. This means that the effect of environmental conditions on the evaluated lines was negative, similarly, the stress response of these lines may reflect very different evolutionary strategies that can be reflected in increases or decreases in assimilate partitioning [15,65], as well as a possible segregation between progenies that may have separated the genes again, which may cause transgressive segregation, supporting the behavior of most of the lines of the F4 and F5 families evaluated [66].
4.2. Combined stress affects phenology and pollen viability
High temperatures have been shown to impact phenology and grain yield in the Western Amazon region of Colombia [40,42]. In this study, we observed that about 172 lines reached flowering and physiological maturity. Among the lines that obtained the higher GY values, we found that they entered both growth stages without accelerating their phenological cycles. This indicates that GY was not influenced by high temperatures in these two phenological stages. Although earliness has been shown to enhance heat tolerance of grain legumes such as common bean through avoidance mechanisms [70], these lines were not able to adjust their phenological cycle for grain production [65,71]. This was mainly attributed to the impact of high temperatures on biomass partitioning for pod and grain formation, as revealed by HI and PHI values [14,42,72]. Likewise, pollen viability (PV) values evidenced that high temperature was not a factor that negatively affected the beginning of the reproductive phase to the point of pollen denaturation and floral abortions [43,44,73]. However, we found that sink strength was limited toward translocation of assimilates from the pod wall to the grain (PHI), which may have been influenced by delayed (not early) reproductive development (in our case flowering) [12,15,65], as evidenced by the negative correlation we observed between DF and PHI.
4.3. Capacity of photosynthetic apparatus for coping with soil acidity and high temperature
At the physiological level, high temperature is a challenge mainly for the proper functioning of the photosynthetic apparatus, as it affects enzyme kinetics as well as membrane dynamics and organization [74]. Therefore, it is essential for the plant to adapt mechanisms and/or adopt strategies in favor of protecting its photosynthetic apparatus while maximizing light utilization under high temperature conditions [75]. When we look at the ability to regulate leaf temperature, we find that in general all lines manage to adjust the temperature below the ambient temperature (negative values of LTD). This mechanism is possibly triggered by the higher loss of water at the leaf surface allowing to keep the leaf surface cooler, managing to maintain an optimal metabolism [76], and as mentioned by Shanker et al. [77] a decrease in the vapor pressure deficit within the leaf. It is possible that heat stressed plants are trying to minimize the irreversible damage that can be caused by the combined stress. For example, we found that the lines that presented better CB production and GY also showed high LTD values around -7 ºC (more negative), while lines such as 859, 805, 657 with higher yields showed a lower LTD value around -3 ºC (less negative). This difference of almost 4 ºC is likely related to high water use and low transpiration efficiency [59]. We hypothesize that this is also connected to lower costs in terms of water movement through the plant.
Under stress conditions, we found low relationships between LTD and the quantum yields of PSII ΦNPQ and ΦNO. We assume that the level of stress observed was not severe, which could be the reason for the relatively low relationships observed between LTD and fluorescence parameters. Furthermore, most of the lines that exhibited assimilate translocation limitations showed high ΦNO and low ΦNPQ values, reflecting the inability of these lines to protect themselves against damage from excess illumination and possibly under the more chronic stress this will lead to a photodamage [78,79].
In our study, the bean lines responded to environmental conditions by activating regulatory mechanisms to balance photosystem performance in order to protect the photosynthetic apparatus [43]. For example, a decrease in ΦII was associated with an increase in ΦNO and NPQt under the combined stress, as was an increase in ΦNPQ associated with a lower ΦNO allocation. It appears that the lines tend to favor the light-dependent dissipative processes (ΦNPQ) at the expense of fluorescence-related mechanisms to actually mitigate reactive oxygen species (ROS) propagation [80]. This should be attributed to the increased LEF that was reported to be necessary for the activation of NPQ processes [81] and was accompanied by a decrease in ECSt, which is related to the amplitude of the light-driven pmf (proton motive force) [47]. Both high LEF and low ECSt cause to some extent an imbalance between proton availability and use for ATP synthesis, resulting in acidification of the thylakoid lumen, generating an effect on the photoprotective processes of ΦNPQ and NPQt [82]. Furthermore, the remarkable increase in NPQt under combined stress indicates the separation of light-harvesting complexes from reaction centers, a mechanism that has been reported as an adaptive response to reduce stress-induced damage [83,84].
On the other hand, in lines with higher GY, a different mechanism was observed, in this case we found decreases in ECSt and LEF, accompanied by high gH+, which could derive mainly from the decrease in intracellular CO2 concentration, leading to a decrease in ATP synthase, and thus in the plant’s ability to utilize the reducing power of NADPH and ATP, as the products of LEF [47,81,82,84]. This mechanism could be an adjustment of PSII operational efficiency so that ATP and NADPH production coincides with the decrease in CO2 assimilation [85], as well as the related ATP-NADPH metabolic consumption by the Calvin cycle, and other anabolic pathways within the chloroplast [82]. This adaptation of these lines could also be attributed in part to the reduction of leaf area (in the vegetative phase), which contributes to reaching the balance between water, nutrient and light energy supply and their consumption, as well as in the improvement of PSII quantum yield (ΦII) and in the reduction of unregulated processes (ΦNO) [84].
4.4. Differences in physiological response between common bean lines reflect possible mechanisms in the translocation of assimilates that favor better yields
The specific adaptation level of a bean line depends on its physiological responses and degree of susceptibility to a given stress condition. In this study, we observed that the group of lines is characterized by lower biomass production but high grain yield [86]. When we looked at the correlation analyses on the multiple traits evaluated, we found a positive relationship between GY and the other plant traits such as CB, PPI, PHI and HI. This clearly indicates the importance of these indices in identifying materials with adaptation to acid soil conditions together with heat stress [59]. However, the potential of these lines curiously lies in physiological traits. Specifically in the adaptive response in the adjustment of a lower LEF, in the adjustment capacity of ATP synthase (ECSt), most of PSII active centers, in order to present no impact on PSII quantum efficiency (ΦII), without a concomitant reduction in carbon supply and assimilation rates [79].
The identification of these mechanisms is important because: 1) photosynthesis is the process that contributes most to CB production; 2) an adequate mechanism in energy dissipation is related to a better translocation of assimilates (PHI and HI for pod and grain formation); 3) variations in electron transport due to heat stress can be reflected in the yield obtained also [77,87,88,89,90]. Based on the results of this study, we found that nine biofortified common bean lines [F5: 859, 805, 865, 657, 653; F4: 2853, 2796, 2815, 3730], have traits with potential for adaptation to the combined stress of acid soils and high temperatures. The average seed Fe concentration was 82±2.6 and 65.6±4.7 and Zn of 27.5±2.18 and 26.6±1.4 for the five lines of F5 (859, 805, 865, 657, 653) and four lines of F4 (2853, 2796, 2815, 3730), respectively. Out of the nine biofortified lines, six lines including four F5 lines: 859, 805, 865, 657 with 86.5±0.5 and 28.5±2.5 of Fe and Zn, respectively and two F4 lines: 2853, 2796 with 61.5±1.9 and 25.5±1.1 of Fe and Zn, respectively were superior in their seed Fe and Zn concentrations. In this sense, it has been reported that Fe and Zn concentration in shoot tissue is directly related to photosynthetic efficiency [91]. In this study, we found that Fe and Zn concentration in seed used for planting correlates negatively with some functions of the photosynthetic apparatus such as those related to ATP synthase function (gH+) and linear electron flow (LEF). This shows the need to further investigate the relationship of photosynthetic traits with seed Fe and Zn concentration in biofortified bean lines grown in different environments under stress conditions [92]. Further research is also needed to evaluate the stability and segregation of desirable traits including seed Fe and Zn concentration under field conditions. Similarly, it is necessary to evaluate the parental lines from which they are derived under the conditions of this study to determine the percentage of heritability of adaptive responses to these conditions, as well as the influence of genetic factors on photosynthesis for exploiting photosynthetic differences of these materials through bean breeding programs.
5. Conclusions
The results obtained from this study suggest that the superior agronomic performance of nine biofortified common bean lines is associated with partitioning capacity of photosynthates for the formation of pods and grain filling; and greater allocation of energy to the photosynthetic machinery (ΦII) and its dissipation in the form of heat (ΦNPQ) together with increased leaf temperature differential (LTD). We identified six biofortified bean lines (F5: 859, 805, 865, 657; F4: 2853, 2796) with yields higher than 1,400 kg ha-1 under combined stress conditions of acidic soil and high temperature. These bean lines increased canopy biomass (CB) as well as the dry matter allocation ability to increase partitioning into pods, which translated into higher values of grain yield. These are considered as desirable attributes for the genetic improvement of stress tolerance in biofortified common bean lines.
Supplementary Materials
The following supporting information can be downloaded at the website of this paper posted on Preprints.org, Supplement Table S1. List of common bean genotypes used in the study
Author Contributions
Conceptualization, J.C.S., M.O.U. and I.M.R.; data curation, J.C.S and A.T.C.; formal analysis, J.C.S., M.O.U., and I.M.R.; investigation, J.C.S., A.T.C., and M.A.G.; methodology, J.C.S., A.T.C., M.O.U., M.A.G., S.E.B. and I.M.R.; funding acquisition, J.C.S.; project administration, J.C.S.; resources, J.C.S., M.O.U., and S.E.B.; supervision, J.C.S., A.T.C., M.O.U., M.A.G., S.E.B. and I.M.R.; writing—original draft, J.C.S., A.T.C., M.O.U., and I.M.R.; writing—review & editing, J.C.S., A.T.C., M.O.U., and I.M.R.; All authors have read and agreed to the published version of the manuscript.
Funding
This research received no external funding and the article processing charges was funded by Accelerating Varietal Improvement and Seed Systems in Africa (AVISA) project OPP 1198373 funded by Bill & Melinda Gates Foundation.
Institutional Review Board Statement
Not applicable.
Informed Consent Statement
Not applicable.
Data Availability Statement
Data are available from the authors upon request.
Acknowledgments
We acknowledge the financial support from the CGIAR Research Program on Grain Legumes and Dryland Cereals and Bill and Melinda Gates foundation for the development of breeding lines of common bean. We would also like to thank all donors who supported this work through their contributions to the CGIAR Fund. MOU is grateful for the support of Deutsche Gesellschaft für Internationale Zusammenarbeit (GIZ) GmbH and Centre for International Migration and Development (CIM).
Conflicts of Interest
The authors have declared that no competing interests exist.
References
- Masson-Delmotte, V.; Zhai, P.; Pörtner, H.-O.; Roberts, D.; Skea, J.; Shukla, P.R.; et al. Resumen para responsables de políticas. Calentamiento global de 1,5 °C Informe especial del IPCC sobre los impactos del calentamiento global de 1,5 °C con respecto a los niveles preindustriales y las trayectorias correspondientes que deberían seguir las e. 2019. Available online: www.ipcc.ch (accessed on 13 November 2021).
- Rao, I.M.; Beebe, S.E.; Polania, J.; Grajales, M.; Cajiao, C.; Ricaurte, J.; et al. Evidence for genotypic differences among elite lines of common bean in the ability to remobilize photosynthate to increase yield under drought. J Agric Sci 2017, 155,857–75. Available online: https://www.cambridge.org/core/journals/journal-of-agricultural-science/article/abs/evidence-for-genotypic-differences-among-elite-lines-of-common-bean-in-the-ability-to-remobilize-photosynthate-to-increase-yield-under-drought/83C9BB85244976B650B0846AD47E (accessed on 12 July 2023).
- Masson-Delmotte, V.; P Zhai, H.-O.; Pörtner, D. Roberts, J. Skea, P.R. Shukla, A. Pirani, W. Moufouma-Okia, C. Péan, R. Pidcock, S. Connors, J.B.R. Matthews, Y. Chen, X. Zhou, M.I. Gomis, E. Lonnoy, T. Maycock MT y TW (eds. Resumen para responsables de políticas. En: Calentamiento global de 1,5 °C, Informe especial del IPCC sobre los impactos del calentamiento global de 1,5 oC con respecto a los niveles preindustriales y las trayectorias correspondientes que deberían seguir. Intergovernmental Panel on Climate Change. IPCC; 2018, pp. 26. Available online: https://bibliotecasemiaridos.ufv.br/jspui/handle/123456789/338 (accessed on 12 July 2023).
- Lobell, D.B.; Burke, M.B.; Tebaldi, C.; Mastrandrea, M.D.; Falcon, W.P.; Naylor, R.L. Prioritizing climate change adaptation needs for food security in 2030. Science 2008, 319, 607–10. Available online: https://www.science.org/doi/10.1126/science.1152339 (accessed on 27 September 2023). [CrossRef] [PubMed]
- Pourkheirandish, M.; Golicz, A.A.; Bhalla, P.L.; Singh, M.B. Global role of crop genomics in the face of climate change. Front Plant Sci. 2020, 11, 922. [Google Scholar] [CrossRef] [PubMed]
- Porch, T.G.; Beaver, J.S.; Brick, M.A. Registration of tepary germplasm with multiple-stress tolerance, TARS-Tep 22 and TARS-Tep 32. J Plant Regist. 2013, 7, 358–64. Available online: https://onlinelibrary.wiley.com/doi/full/10.3198/jpr2012.10.0047crg (accessed on 13 November 2021). [CrossRef]
- Raggi, L.; Caproni, L.; Carboni, A.; Negri, V. Genome-wide association study reveals candidate genes for flowering time variation in common bean (Phaseolus vulgaris L. ). Front Plant Sci. 2019, 10, 962. [Google Scholar] [CrossRef] [PubMed]
- Lizana, C.; Wentworth, M.; Martinez, J.P.; Villegas, D.; Meneses, R.; Murchie, E.H.; et al. Differential adaptation of two varieties of common bean to abiotic stress:, I. Effects of drought on yield and photosynthesis. J Exp Bot. 2006, 57, 685–97. Available online: https://dx.doi.org/10.1093/jxb/erj062 (accessed on 27 September 2023). [CrossRef] [PubMed]
- Rao, I.M. Digging deep into defining physiological responses to environmental stresses in the tropics: The case of common bean and Brachiaria forage grasses. In: M. Pessarakli, editor. Handbook of Plant and Crop Physiology. CRC Press,. 2021. p. 1099–140.
- Buitrago-Bitar, M.A.; Cortés, A.J.; López-Hernández, F.; Londoño-Caicedo, J.M.; Muñoz-Florez, J.E.; Carmenza Muñoz, L. , et al. Allelic diversity at abiotic stress responsive genes in relationship to ecological drought indices for cultivated tepary bean, phaseolus acutifolius a. Gray, and its wild relatives. Genes 2021, 12, 556. Available online: https://www.mdpi.com/2073-4425/12/4/556/htm (accessed on 13 November 2021). [CrossRef]
- Ligarreto, G. Componentes de variancia en variables de crecimiento y fotosíntesis en fríjol común (Phaseolus vulgaris L. ). Rev UDCA Actual Divulg Científica. 2013, 16, 87–96. Available online: http://www.scielo.org.co/scielo.php?script=sci_arttext&pid=S0123-42262013000100011&lng=en&nrm=iso&tlng=es (accessed on 27 September 2023).
- Assefa, T.; Rao, I.M.; Cannon, S.B.; Wu, J.; Gutema, Z.; Blair, M. , et al. Improving adaptation to drought stress in white pea bean (Phaseolus vulgaris L.): Genotypic effects on grain yield, yield components and pod harvest index. Plant Breed. 2017, 136, 548–61. Available online: https://onlinelibrary.wiley.com/doi/full/10.1111/pbr.12496 (accessed on 28 September 2023).
- Schmutz, J.; McClean, P.E.; Mamidi, S.; Wu, G.A.; Cannon, S.B.; Grimwood, J. , et al. A reference genome for common bean and genome-wide analysis of dual domestications. Nat Genet 2014 467. 2014, 46, 707–13. Available online: https://www.nature.com/articles/ng.3008 (accessed on 7 April 2022).
- Beebe, S.; Rao, I.M.; Blair, M.; Acosta, J. Phenotyping common beans for adaptation to drought. Front Physiol. 2013, 0, 35. [Google Scholar] [CrossRef]
- Beebe, S. Common bean breeding in the tropics. Plant Breed Rev. 2012, 36, 357–426. [Google Scholar]
- Polania, J.A.; Poschenrieder, C.; Beebe, S.; Rao, I.M. Effective use of water and increased dry matter partitioned to grain contribute to yield of common bean improved for drought resistance. Front Plant Sci. 2016, 7, 660. [Google Scholar] [CrossRef] [PubMed]
- Rao, I.M. Advances in Improving Adaptation of Common Bean and Brachiaria Forage Grasses to Abiotic Stresses in the Tropics. In: Handbook of Plant and Crop Physiology, Third Edition. CRC Press; 2014. p. 847–89. Available online: https://cgspace.cgiar.org/handle/10568/35000 (accessed on 27 September 2023).
- Jarvis, A.; Ramirez, J.; Bonilla-Findji, O.; Zapata, E. Impacts of climate change on crop production in Latin America. Crop Adapt to Clim Chang. 2011, 44–56. Available online: https://onlinelibrary.wiley.com/doi/full/10.1002/9780470960929.ch4 (accessed on 28 September 2023).
- Zapata-Caldas, E.; Hyman, G.; Pachón, H.; Monserrate, F.A.; Varela, L.V. Identifying candidate sites for crop biofortification in Latin America: Case studies in Colombia, Nicaragua and Bolivia. Int J Health Geogr. 2009, 8, 1–18. Available online: https://ij-healthgeographics.biomedcentral.com/articles/10.1186/1476-072X-8-29 (accessed on 28 September 2023). [CrossRef] [PubMed]
- ICBF (Instituto Colombiano de Bienestar Familiar). Encuesta nacional de la situación nutricional en Colombia (ENSIN). Bogotá, ICBF. 2023.
- Diaz, S.; Polania, J.; Ariza-Suarez, D.; Cajiao, C.; Grajales, M.; Raatz, B. Genetic correlation between Fe and Zn biofortification and yield components in a common bean (Phaseolus vulgaris L. ). Front Plant Sci. 2022, 12, 739033. [Google Scholar] [CrossRef] [PubMed]
- Gonzalez, A.; Lynch, J.; Tohme, J.M.; Beebe, S.E.; Macchiavelli, R.E. Characters related to leaf photosynthesis in wild populations and landraces of common bean. Crop Sci. 1995, 35, 1468–76. Available online: https://onlinelibrary.wiley.com/doi/full/10.2135/cropsci1995.0011183X003500050034x (accessed on 28 September 2023). [CrossRef]
- Amongi, W.; Nkalubo, S.T.; Ochwo-Ssemakula, M.; Badji, A.; Dramadri, I.O.; Odongo, T.L. , et al. Phenotype based clustering, and diversity of common bean genotypes in seed iron concentration and cooking time. PLoS One 2023, 18, e0284976. Available online: https://journals.plos.org/plosone/article?id=10.1371/journal.pone.0284976 (accessed on 28 September 2023).
- Huertas, R.; Karpinska, B.; Ngala, S.; Mkandawire, B.; Maling’a, J.; Wajenkeche, E. , et al. Biofortification of common bean (Phaseolus vulgaris L.) with iron and zinc: Achievements and challenges. Food Energy Secur. 2023, 12, e406. Available online: https://onlinelibrary.wiley.com/doi/full/10.1002/fes3.406 (accessed on 28 September 2023).
- Lamptey, M.; Adu-Dapaah, H.; Osei Amoako-Andoh, F.; Butare, L.; Bediako, K.A.; Amoah, R.A. , et al. Genetic studies on iron and zinc concentrations in common bean (Phaseolus vulgaris L.) in Ghana. Heliyon. 2023, 9, e17303. Available online: http://creativecommons.org/licenses/by/4.0/ (accessed on 28 September 2023). [PubMed]
- Beebe, S. Biofortification of common bean for higher iron concentration. Front Sustain Food Syst. 2020, 4, 573449. [Google Scholar] [CrossRef]
- Garg, M.; Sharma, N.; Sharma, S.; Kapoor, P.; Kumar, A.; Chunduri, V. , et al. Biofortified crops generated by breeding, agronomy, and transgenic approaches are improving lives of millions of people around the world. Vol. 5, Frontiers in Nutrition. Frontiers Media S.A.; 2018. p. 301899.
- Diaz, S.; Ariza-Suarez, D.; Izquierdo, P.; Lobaton, J.D.; de la Hoz, J.F.; Acevedo, F. , et al. Genetic mapping for agronomic traits in a MAGIC population of common bean (Phaseolus vulgaris L.) under drought conditions. BMC Genomics. 2020, 21, 1–20. Available online: https://bmcgenomics.biomedcentral.com/articles/10.1186/s12864-020-07213-6 (accessed on 29 August 2022).
- Kimani, P.M.; Warsame, A.H.M.E.D. Breeding second-generation biofortified bean varieties for Africa. Food Energy Secur. 2019, 8, e00173. Available online: https://onlinelibrary.wiley.com/doi/full/10.1002/fes3.173 (accessed on 28 September 2023). [CrossRef]
- CIAT Breeding micronutrient dense bean varieties in eastern Africa. Bean Improvement for the Tropics, Annual Report I-P1 Report, Cali, Colombia, pp. 15–25. 2008.
- Blair, M.W.; Izquierdo, P. Use of the advanced backcross-QTL method to transfer seed mineral accumulation nutrition traits from wild to Andean cultivated common beans. Theor Appl Genet. 2012, 125, 1015–31. Available online: https://link.springer.com/article/10.1007/s00122-012-1891-x (accessed on 28 September 2023). [CrossRef] [PubMed]
- Blair, M.W.; Astudillo, C.; Rengifo, J.; Beebe, S.E.; Graham, R. QTL analyses for seed iron and zinc concentrations in an intra-genepool population of Andean common beans (Phaseolus vulgaris L. ). Theor Appl Genet. 2011, 122, 511–21. Available online: https://link.springer.com/article/10.1007/s00122-010-1465-8 (accessed on 28 September 2023). [CrossRef] [PubMed]
- Blair, M.W.; González, L.F.; Kimani, P.M.; Butare, L. Genetic diversity, inter-gene pool introgression and nutritional quality of common beans (Phaseolus vulgaris L. ) from Central Africa. Theor Appl Genet. 2010, 121, 237–48. Available online: https://link.springer.com/article/10.1007/s00122-010-1305-x (accessed on 4 June 2023). [CrossRef]
- Blair, M.W.; Astudillo, C.; Grusak, M.A.; Graham, R.; Beebe, S.E. Inheritance of seed iron and zinc concentrations in common bean (Phaseolus vulgaris L. ). Mol Breed. 2009, 23, 197–207. Available online: https://link.springer.com/article/10.1007/s11032-008-9225-z (accessed on 28 September 2023). [CrossRef]
- Cichy, K.A.; Caldas, G.V.; Snapp, S.S.; Blair, M.W. QTL analysis of seed iron, zinc, and phosphorus levels in an andean bean population. Crop Sci. 2009, 49, 1742–50. Available online: https://onlinelibrary.wiley.com/doi/full/10.2135/cropsci2008.10.0605 (accessed on 28 September 2023). [CrossRef]
- Pereira, H.; Del Peloso, M.; Bassinello, P.; Guimarães, C.; Melo, L.; Faria, L. Genetic variability for iron and zinc content in common bean lines and interaction with water availability. Genet Mol Res. 2014, 13, 6773–85. Available online: http://dx.doi.org/10.4238/2014.August.28.21 (accessed on 28 September 2023). [CrossRef]
- Cichy, K.; Chiu, C.; Isaacs, K.; Glahn, R. Dry Bean Biofortification with Iron and Zinc. Biofortification Staple Crop. 2022, 225–70. Available online: https://link.springer.com/chapter/10.1007/978-981-16-3280-8_10 (accessed on 28 September 2023).
- Saradadevi, R.; Mukankusi, C.; Li, L.; Amongi, W.; Mbiu, J.P.; Raatz, B. , et al. Multivariate genomic analysis and optimal contributions selection predicts high genetic gains in cooking time, iron, zinc, and grain yield in common beans in East Africa. Plant Genome. 2021, 14, e20156. Available online: https://onlinelibrary.wiley.com/doi/full/10.1002/tpg2.20156 (accessed on 28 September 2023). [PubMed]
- Philipo, M.; Ndakidemi, P.A.; Mbega, E.R. Environmental and genotypes influence on seed iron and zinc levels of landraces and improved varieties of common bean (Phaseolus vulgaris L. ) in Tanzania. Ecol Genet Genomics. 2020, 15, 100056. [Google Scholar] [CrossRef]
- Suárez, J.C.; Polanía, J.A.; Contreras, A.T.; Rodríguez, L.; Beebe, S.; Rao, I.M. Agronomical, phenological and physiological performance of common bean lines in the Amazon region of Colombia. Theor Exp Plant Physiol. 2018, 30, 303–20. Available online: https://link.springer.com/article/10.1007/s40626-018-0125-2 (accessed on 13 November 2021).
- Suárez, J.C.; Rao, I.M. Photosynthetic response of common bean and tepary bean genotypes grown under the combined stress conditions of acid soil and high temperature. In: Pessarakli M, editor. Handbook of Photosynthesis. 4th Editio. 2024.
- Suárez, J.C.; Polanía, J.A.J.A.; Contreras, A.T.; Rodríguez, L.; Machado, L.; Ordoñez, C. , et al. Adaptation of common bean lines to high temperature conditions: genotypic differences in phenological and agronomic performance. Euphytica 2020, 216, 1–20. Available online: https://doi.org/10.1007/s10681-020-2565-4 (accessed on 23 July 2020). [CrossRef]
- Suárez, J.C.; Urban, M.O.; Contreras, A.T.; Grajales, M.Á.; Cajiao, C.; Beebe, S.E. , et al. Adaptation of interspecific mesoamerican common bean lines to acid soils and high temperature in the amazon region of colombia. Plants 2021, 10, 2412. Available online: https://www.mdpi.com/2223-7747/10/11/2412/htm (accessed on 4 June 2023). [PubMed]
- Porch, T.G.; Jahn, M. Effects of high-temperature stress on microsporogenesis in heat-sensitive and heat-tolerant genotypes of Phaseolus vulgaris. Plant Cell Environ. 2001, 24, 723–31. Available online: https://onlinelibrary.wiley.com/doi/full/10.1046/j.1365-3040.2001.00716.x (accessed on 12 July 2023). [CrossRef]
- Suzuki, K.; Tsukaguchi, T.; Takeda, H.; Egawa, Y. Decrease of pollen stainability of green bean at high temperatures and relationship to heat tolerance. J Am Soc Hortic Sci. 2001, 126, 571–4. Available online: https://journals.ashs.org/jashs/view/journals/jashs/126/5/article-p571.xml (accessed on 13 November 2021). [CrossRef]
- Kuhlgert, S.; Austic, G.; Zegarac, R.; Osei-Bonsu, I.; Hoh, D.; Chilvers, M.I.; et al. MultispeQ Beta: A tool for large-scale plant phenotyping connected to the open photosynQ network. R Soc Open Sci. 2016, 3. Available online: https://royalsocietypublishing.org/doi/abs/10.1098/rsos.160592 (accessed on 28 September 2021).
- Kanazawa, A.; Ostendorf, E.; Kohzuma, K.; Hoh, D.; Strand, D.D.; Sato-Cruz, M. , et al. Chloroplast ATP synthase modulation of the thylakoid proton motive force: implications for photosystem I and photosystem II photoprotection. Front Plant Sci. 2017, 8, 264832. [Google Scholar]
- Sacksteder, C.A.; Kramer, D.M. Dark-interval relaxation kinetics (DIRK) of absorbance changes as a quantitative probe of steady-state electron transfer. Photosynth Res. 2000, 66, 145–58. Available online: https://link.springer.com/article/10.1023/A:1010785912271 (accessed on 28 September 2023).
- Chovancek, E.; Zivcak, M.; Brestic, M.; Hussain, S.; Allakhverdiev, S.I. The different patterns of post-heat stress responses in wheat genotypes: the role of the transthylakoid proton gradient in efficient recovery of leaf photosynthetic capacity. Photosynth Res. 2021, 150(1–3):179–93. Available online: https://link.springer.com/article/10.1007/s11120-020-00812-0 (accessed on 28 September 2023).
- Kramer, D.M.; Johnson, G.; Kiirats, O.; Edwards, G.E. New fluorescence parameters for the determination of QA redox state and excitation energy fluxes. Photosynth Res. 2004, 79, 209–18. Available online: https://link.springer.com/article/10.1023/B:PRES.0000015391.99477.0d (accessed on 28 September 2021). [CrossRef] [PubMed]
- Tietz, S.; Hall, C.C.; Cruz, J.A.; Kramer, D.M. NPQ(T): a chlorophyll fluorescence parameter for rapid estimation and imaging of non-photochemical quenching of excitons in photosystem-II-associated antenna complexes. Plant Cell Environ. 2017, 40, 1243–55. Available online: https://onlinelibrary.wiley.com/doi/full/10.1111/pce.12924 (accessed on 28 September 2023). [CrossRef] [PubMed]
- Suárez, J.C.; Contreras, A.T. BD Exp. C17d y F5.9_Sco. PROJECT ID: 11013, 4169. [Dataset). Universidad de la Amazonia. 2023. Available online: https://www.photosynq.org/projects/bd-exp-c17d-y-f5-9_sco.
- Di Rienzo, J.A.; Macchiavelli, R.; Casanoves, F. Mixed models in Infostat. Electronic version. 2012. 1994 p.
- Bankaji, I.; Kouki, R.; Dridi, N.; Ferreira, R.; Hidouri, S.; Duarte, B. , et al. Comparison of Digestion Methods Using Atomic Absorption Spectrometry for the Determination of Metal Levels in Plants. 2023, 10, 40. Available online: https://www.mdpi.com/2297-8739/10/1/40/htm (accessed on 3 December 2023).
- Wickham, H. ggplot2: Elegant Graphics for Data Analysis. Second Edition. Springer. 2016. [Google Scholar] [CrossRef]
- R Development Core Team. R version 4.2.0 (2022-04-22) -- “Vigorous Calisthenics” Copyright (C) 2024 The R Foundation for Statistical Computing Platform: x86_64-apple-darwin17.0 (64-bit). 2023; Available online: https://www.r-project.org/.
- Nguyen, N.; Drakou, E.G. Farmers intention to adopt sustainable agriculture hinges on climate awareness: The case of Vietnamese coffee. J Clean Prod. 2021, 303, 126828. [Google Scholar] [CrossRef]
- Rodriguez, D.F.C.; Urban, M.O.; Santaella, M.; Gereda, J.M.; Contreras, A.D.; Wenzl, P. Using phenomics to identify and integrate traits of interest for better-performing common beans: A validation study on an interspecific hybrid and its Acutifolii parents. Front Plant Sci. 2022, 13, 1008666. [Google Scholar] [CrossRef]
- Suárez, J.C.; Urban, M.O.; Contreras, A.T.; Noriega, J.E.; Deva, C.; Beebe, S.E. , et al. Water use, leaf cooling and carbon assimilation efficiency of heat resistant common beans evaluated in Western Amazonia. Front Plant Sci. 2021, 12, 644010–644010. Available online: https://europepmc.org/article/med/34912351 (accessed on 7 April 2022). [PubMed]
- Araus, J.L.; Slafer, G.A.; Reynolds, M.P.; Royo, C. Plant breeding and drought in C3 cereals: what should we breed for? Ann Bot. 2002, 85, 925–40. [Google Scholar] [CrossRef] [PubMed]
- Polania, J.; Poschenrieder, C.; Rao, I.M.; Beebe, S. Estimation of phenotypic variability in symbiotic nitrogen fixation ability of common bean under drought stress using 15N natural abundance in grain. Eur J Agron. 2016, 79, 66–73. [Google Scholar] [CrossRef]
- Farooq, M.; Gogoi, N.; Barthakur, S.; Baroowa, B.; Bharadwaj, N.; Alghamdi, S.S. , et al. Drought stress in grain legumes during reproduction and grain filling. J Agron Crop Sci. 2017, 203, 81–102. Available online: https://onlinelibrary.wiley.com/doi/full/10.1111/jac.12169 (accessed on 29 September 2023).
- Kazai, P.; Noulas, C.; Khah, E.; Vlachostergios, D. Yield and seed quality parameters of common bean cultivars grown under water and heat stress field conditions. AIMS Agric Food. 2019, 4, 285–302. Available online: http://www.aimspress.com/journal/agriculture (accessed on 29 September 2023). [CrossRef]
- Rao, I.M.; Beebe, S.E.; Polanía, J.; Grajales, M.; Cajiao, C.; García, R. , et al. Physiological basis of improved drought resistance in common bean: the contribution of photosynthate mobilization to grain. In: Paper presented at Interdrought III: the 3rd International Conference on Integrated Approaches to Improve Crop Production Under Dro. 2009.
- Beebe, S.E.; Rao, I.M.; Cajiao, C.; Grajales, M. Selection for drought resistance in common bean also improves yield in phosphorus limited and favorable environments. Crop Sci. 2008, 48, 582–92. Available online: https://onlinelibrary.wiley.com/doi/full/10.2135/cropsci2007.07.0404 (accessed on 11 July 2023). [CrossRef]
- Assefa, T.; Beebe, S.E.; Rao, I.M.; Cuasquer, J.B.; Duque, M.C.; Rivera, M. , et al. Pod harvest index as a selection criterion to improve drought resistance in white pea bean. F Crop Res. 2013, 148, 24–33. [Google Scholar]
- Beebe, S.E.; Rao, I.M.; Blair, M.; Butare, L. Breeding for abiotic stress tolerance in common bean: present and future challenges. In: Proceedings of the 14th Australian Plant Breeding & 11th SABRAO Conference, 10–14 August, Brisbane, Australia. In.
- Klaedtke, S.M.; Cajiao, C.; Grajales, M.; Polanía, J.; Borrero, G.; Guerrero, A. , et al. Photosynthate remobilization capacity from drought-adapted common bean (Phaseolus vulgaris L.) lines can improve yield potential of interspecific populations within the secondary gene pool. J Plant Breed Crop Sci. 2012, 4, 49–61. Available online: http://www.academicjournals.org/JPBCS (accessed on 29 September 2023).
- Rao, I.M.; Beebe, S.; Polania, J.; Ricaurte, J.; Cajiao, C.; Garcia, R. , et al. Can tepary bean be a model for improvement of drought resistance in common bean? African Crop Sci J. 2013, 21, 265–81. Available online: https://www.ajol.info/index.php/acsj/article/view/95291 (accessed on 13 November 2021).
- Hall, A.E. Comparative ecophysiology of cowpea, common bean, and peanut. Physiol Biotechnol Integr Plant Breed. 2004, 243–87. Available online: https://www.taylorfrancis.com/chapters/edit/10.1201/9780203022030-11/comparative-ecophysiology-cowpea-common-bean-peanut-anthony-hall (accessed on 29 September 2021).
- Rosales-Serna, R.; Kohashi-Shibata, J.; Acosta-Gallegos, J.A.; Trejo-López, C.; Ortiz-Cereceres, J.; Kelly, J.D. Biomass distribution, maturity acceleration and yield in drought-stressed common bean cultivars. F Crop Res. 2004, 85, 203–11. [Google Scholar] [CrossRef]
- Polania, J.; Rao, I.M.; Cajiao, C.; Rivera, M.; Raatz, B.; Beebe, S. Physiological traits associated with drought resistance in Andean and Mesoamerican genotypes of common bean (Phaseolus vulgaris L. ). Euphytica. 2016, 210, 17–29. Available online: https://link.springer.com/article/10.1007/s10681-016-1691-5 (accessed on 29 July 2023). [CrossRef]
- Omae, H.; Kumar, A.; Shono, M. Adaptation to high temperature and water deficit in the common bean (Phaseolus vulgaris L.) during the reproductive period. J Bot. 2012, 2012.
- Yamori, W.; Hikosaka, K.; Way, D.A. Temperature response of photosynthesis in C3, C4, and CAM plants: Temperature acclimation and temperature adaptation. Photosynth Res. 2014, 119, 101–17. Available online: https://link.springer.com/article/10.1007/s11120-013-9874-6 (accessed on 29 September 2023). [CrossRef] [PubMed]
- Sattari, H.V.; Tavalaei, S.; Grillon, A.; Meyer, L.; Ballabani, G.; Glauser, G. , et al. Growth temperature influence on lipids and photosynthesis in Lepidium sativum. Front Plant Sci. 2020 Jun 4;11:515048.
- Shanker, A.K.; Bhanu, D.; Sarkar, B.; Yadav, S.K.; Jyothilakshmi, N.; Maheswari, M. Infra red thermography reveals transpirational cooling in pearl millet (Pennisetum glaucum) plants under heat stress. bioRxiv. 2020. 2020.09.04.283283. Available online: https://www.biorxiv.org/content/10.1101/2020.09.04.283283v2 (accessed on 29 September 2023).
- Shanker, A.K.; Amirineni, S.; Bhanu, D.; Yadav, S.K.; Jyothilakshmi, N.; Vanaja, M. , et al. High-resolution dissection of photosystem II electron transport reveals differential response to water deficit and heat stress in isolation and combination in pearl millet [Pennisetum glaucum (L.) R. Br. Front Plant Sci. 2022, 13, 892676. [Google Scholar]
- Klughammer, C.; Schreiber, U. Complementary PS II quantum yields calculated from simple fluorescence parameters measured by PAM fluorometry and the saturation pulse method. PAM Appl Notes. 2008, 1, 27–35. Available online: http://www.walz.com/http://www.walz.com/ (accessed on 29 September 2023).
- Fernández-Calleja, M.; Monteagudo, A.; Casas, A.M.; Boutin, C.; Pin, P.A.; Morales, F. , et al. Rapid on-site phenotyping via field fluorimeter detects differences in photosynthetic performance in a hybrid—parent barley germplasm set. Sensors (Switzerland). 2020, 20, 1486. Available online: https://www.mdpi.com/1424-8220/20/5/1486/htm (accessed on 7 April 2022).
- Tikkanen, M.; Mekala, N.R.; Aro, E.M. Photosystem II photoinhibition-repair cycle protects Photosystem I from irreversible damage. Biochim Biophys Acta - Bioenerg. 2014, 1837, 210–5. [Google Scholar] [CrossRef] [PubMed]
- Huang, W.; Yang, S.J.; Zhang, S.B.; Zhang, J.L.; Cao, K.F. Cyclic electron flow plays an important role in photoprotection for the resurrection plant Paraboea rufescens under drought stress. Planta. 2012, 235, 819–28. Available online: https://link.springer.com/article/10.1007/s00425-011-1544-3 (accessed on 29 September 2023). [CrossRef] [PubMed]
- Rott, M.; Martins, N.F.; Thiele, W.; Lein, W.; Bock, R.; Kramer, D.M. , et al. ATP synthase repression in tobacco restricts photosynthetic electron transport, CO2 assimilation, and plant growth by overacidification of the thylakoid lumen. Plant Cell. 2011, 23, 304–321. Available online: https://dx.doi.org/10.1105/tpc.110.079111 (accessed on 29 September 2023). [CrossRef] [PubMed]
- Basu, S.; Ramegowda, V.; Kumar, A.; Pereira, A. Plant adaptation to drought stress. F1000Research. 2016, 5. Available online: http://pmc/articles/PMC4937719/ (accessed on 29 September 2023).
- Ben-Jabeur, M.; Gracia-Romero, A.; López-Cristoffanini, C.; Vicente, R.; Kthiri, Z.; Kefauver, S.C. , et al. The promising MultispeQ device for tracing the effect of seed coating with biostimulants on growth promotion, photosynthetic state and water–nutrient stress tolerance in durum wheat. Euro-Mediterranean J Environ Integr. 2021, 6, 1–11. Available online: https://link.springer.com/article/10.1007/s41207-020-00213-8 (accessed on 29 September 2023).
- Baker, N.R. Chlorophyll fluorescence: A probe of photosynthesis in vivo.Vol. 59, Annual Review of Plant Biology. Annual Reviews; 2008, 89–113. Available online: https://www.annualreviews.org/doi/abs/10.1146/annurev.arplant.59.032607.092759 (accessed on 7 April 2022).
- Rao, I.M. Role of physiology in improving crop adaptation to abiotic stresses in the tropics: the case of common bean and tropical forages. In Handbook of Plant and Crop Physiology; CRC Press: Boca Raton, FL, USA, 2001; pp. 605–636. [Google Scholar]
- Çiçek, N.; Pekcan, V.; Arslan, Ö.; Çulha Erdal, Ş.; Balkan Nalçaiyi, A.S.; Çil, A.N. , et al. Assessing drought tolerance in field-grown sunflower hybrids by chlorophyll fluorescence kinetics. Rev Bras Bot. 2019, 42, 249–60. Available online: https://link.springer.com/article/10.1007/s40415-019-00534-1 (accessed on 29 September 2023).
- Che, X.; Zhang, T.; Li, H.; Zhang, L.; Liu, J. Effect of hypoxia on photosystem II of tropical seagrass enhalus acoroides in the dark. Photochem Photobiol. 2022, 98, 421–8. Available online: https://onlinelibrary.wiley.com/doi/full/10.1111/php.13522 (accessed on 29 September 2023). [CrossRef] [PubMed]
- Giorio, P.; Sellami, M.H. Polyphasic okjip chlorophyll a fluorescence transient in a landrace and a commercial cultivar of sweet pepper (Capsicum annuum L. ) under long-term salt stress. Plants. 2021, 10, 887. Available online: https://www.mdpi.com/2223-7747/10/5/887/htm (accessed on 29 September 2023). [PubMed]
- Janeeshma, E.; Kalaji, H.M.; Puthur, J.T. Differential responses in the photosynthetic efficiency of Oryza sativa and Zea mays on exposure to Cd and Zn toxicity. Acta Physiol Plant. 2021, 43, 1–16. Available online: https://link.springer.com/article/10.1007/s11738-020-03178-x (accessed on 29 September 2023). [CrossRef]
- Nsiri, K.; Krouma, A. The Key Physiological and Biochemical Traits Underlying Common Bean (Phaseolus vulgaris L. ) Response to Iron Deficiency, and Related Interrelationships. Agronomy. 2023, 13, 2148. Available online: https://www.mdpi.com/2073-4395/13/8/2148/htm (accessed on 3 December 2023).
- Mari, S.; Bailly, C.; Thomine, S. Handing off iron to the next generation: How does it get into seeds and what for? . Biochemical Journal. Portland Press; 2020, 477, 259–74. Available online: https://biochemj/article/477/1/259/221883/Handing-off-iron-to-the-next-generation-how-does (accessed on 3 December 2023). [CrossRef]
Figure 1.
Distribution of maximum/minimum temperatures and relative humidity during the crop growing period at Centro de Investigaciones Amazónicas CIMAZ Macagual, Universidad de la Amazonia, Colombia in two seasons. Red and blue line means the average of the maximum and minimum air temperature, respectively. June to September 2020: Tmax: 27.11±0.27 °C, Tmin: 20.11±0.11 °C, RH: 79.97±0.60%. November 2020 and January 2021: Tmax: 26.39±0.15 °C, Tmin: 21.18±0.07 °C, RH: 88.74±0.48%.
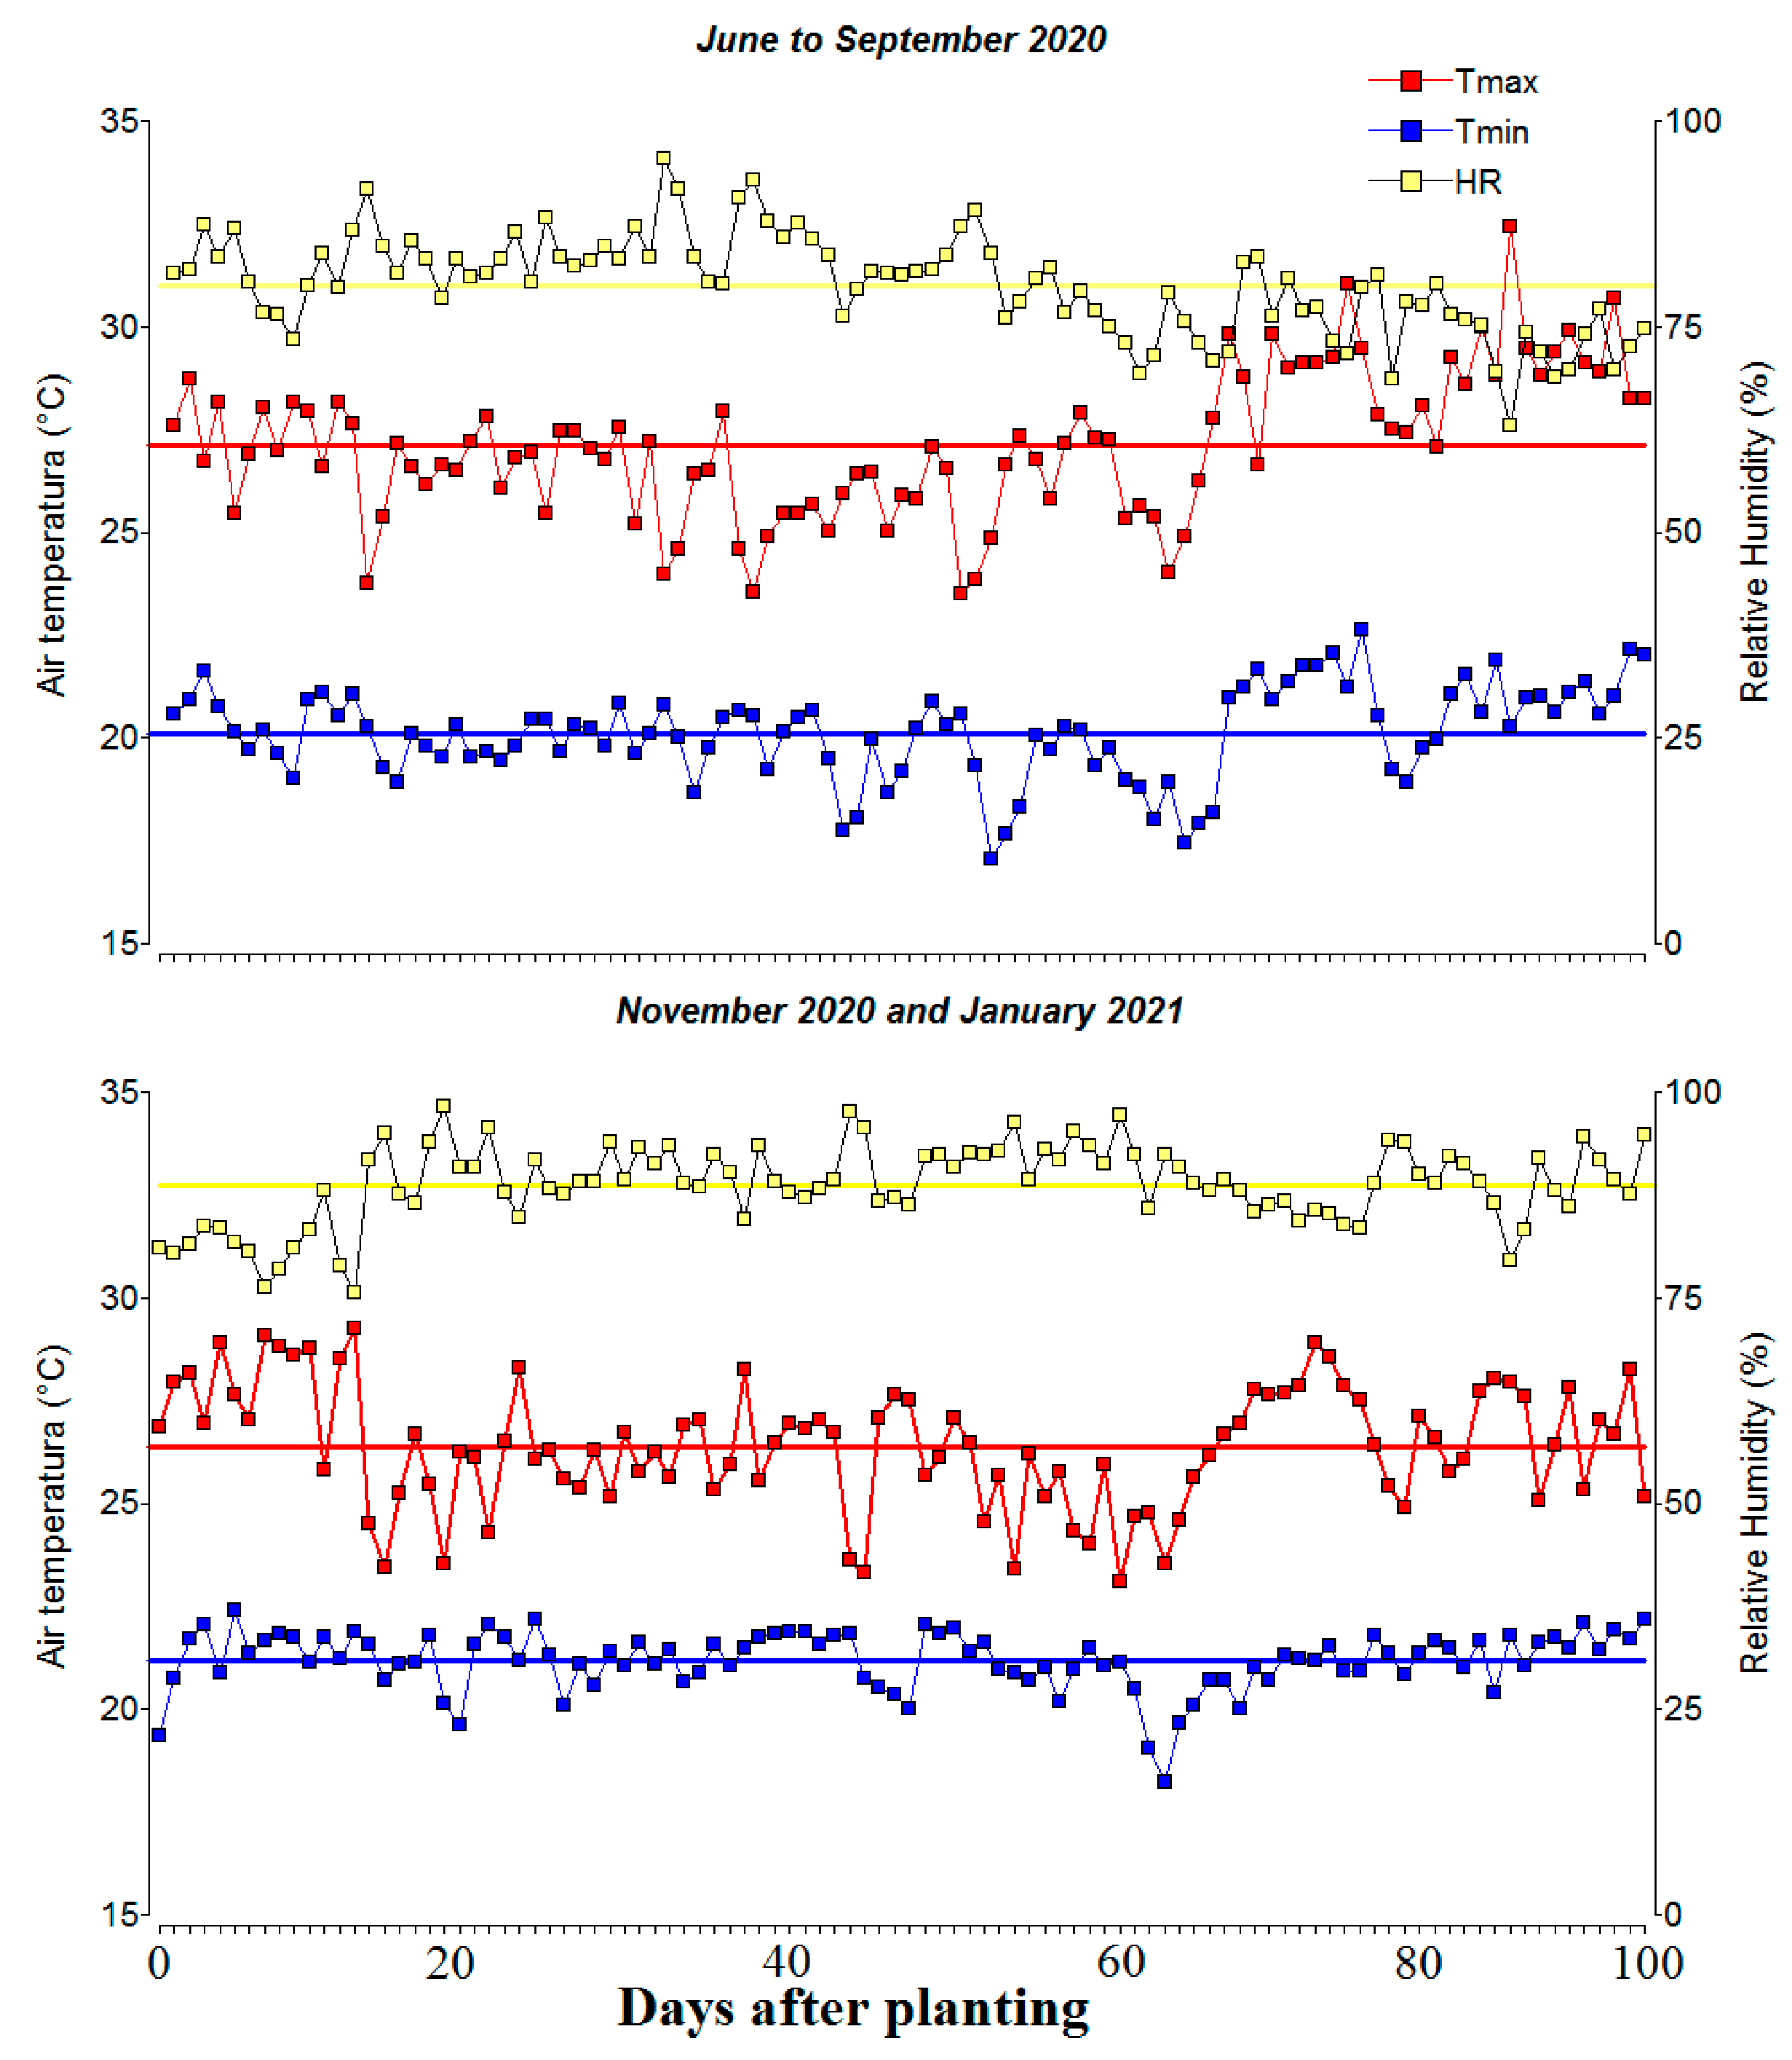
Figure 2.
Relationship between grain yield (GY) and dry matter partitioning indices as a function of seed number per area (SNA), pod number per area (PNA), 100-seed weight (SW), and canopy biomass (CB) of biofortified common bean lines grown under the combined stress conditions of acidic soil and high temperature. (a) Grain yield and canopy biomass (CB) as a function of the gradient of SNA (change in color gradient from blue to red indicating higher to lower value) and the magnitude of PNA (circle size); (b) Grain yield and pod partition index (PPI) as a function of the gradient of PNA (change in color gradient from blue to red indicating higher to lower value) and the magnitude of SW (circle size); (c) Grain yield and pod harvest index (PHI) as a function of the gradient of SNA (change in color gradient from blue to red indicating higher to lower value) and the magnitude of SW (circle size); (d) Grain yield and harvest index (HI) as a function of the gradient of SW and the magnitude of CB (circle size). The dotted lines on the axes correspond to the means of the dependent and independent variables.
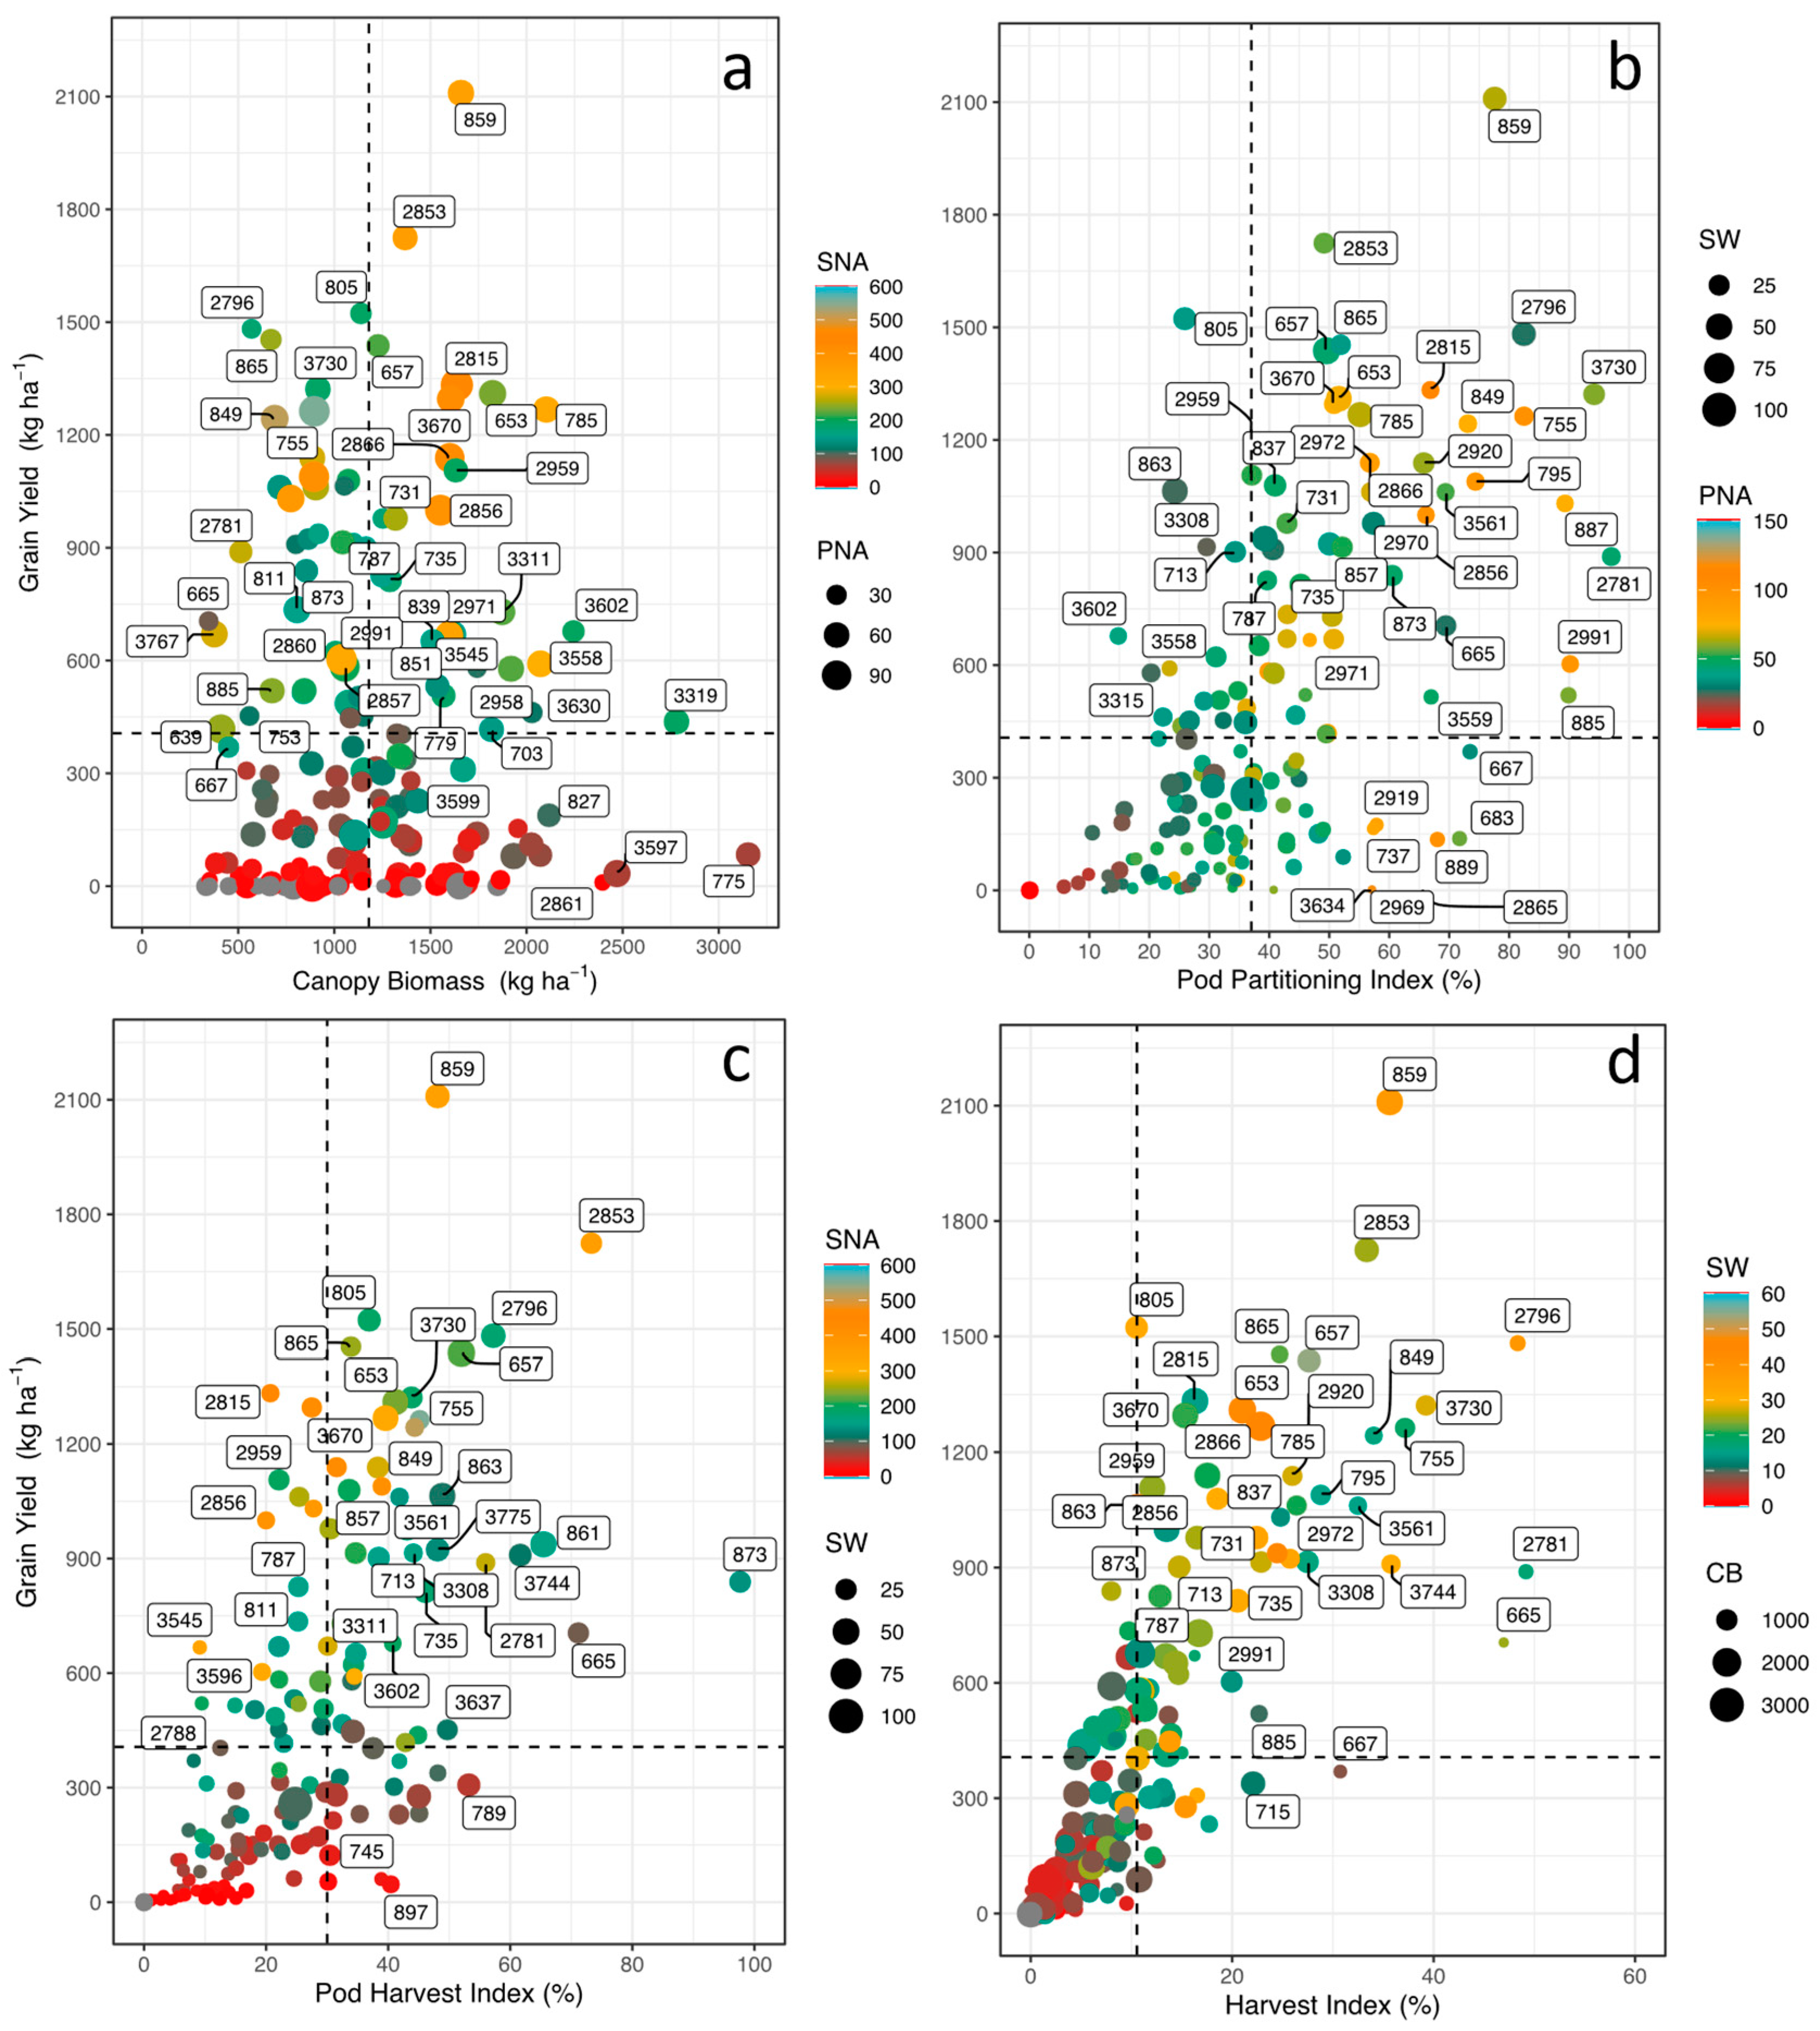
Figure 3.
Relationship between grain yield (GY) and two different variables related to the functioning of the photosynthetic apparatus in biofortified common bean lines grown under the combined stress conditions of acidic soil and high temperature. (a) Grain yield (GY) and quantum yield of photosystem II (ΦII) as a function of the non-photochemical extinction gradient ΦNPQ (change in the color gradient of blue to red indicating higher to lower value) and the magnitude of unregulated processes ΦNO (circle size), parameters affecting the response variable (second); (b) Grain yield (GY) and linear electron flow (LEF) as a function of the leaf temperature differential (LTD) gradient (change in color gradient from blue to red indicating higher to lower value) and magnitude of PSI Oxidized Centers (PSIox) (circle size), parameters affecting the response variable. The dotted lines on the axes correspond to the means of the dependent and independent variables.
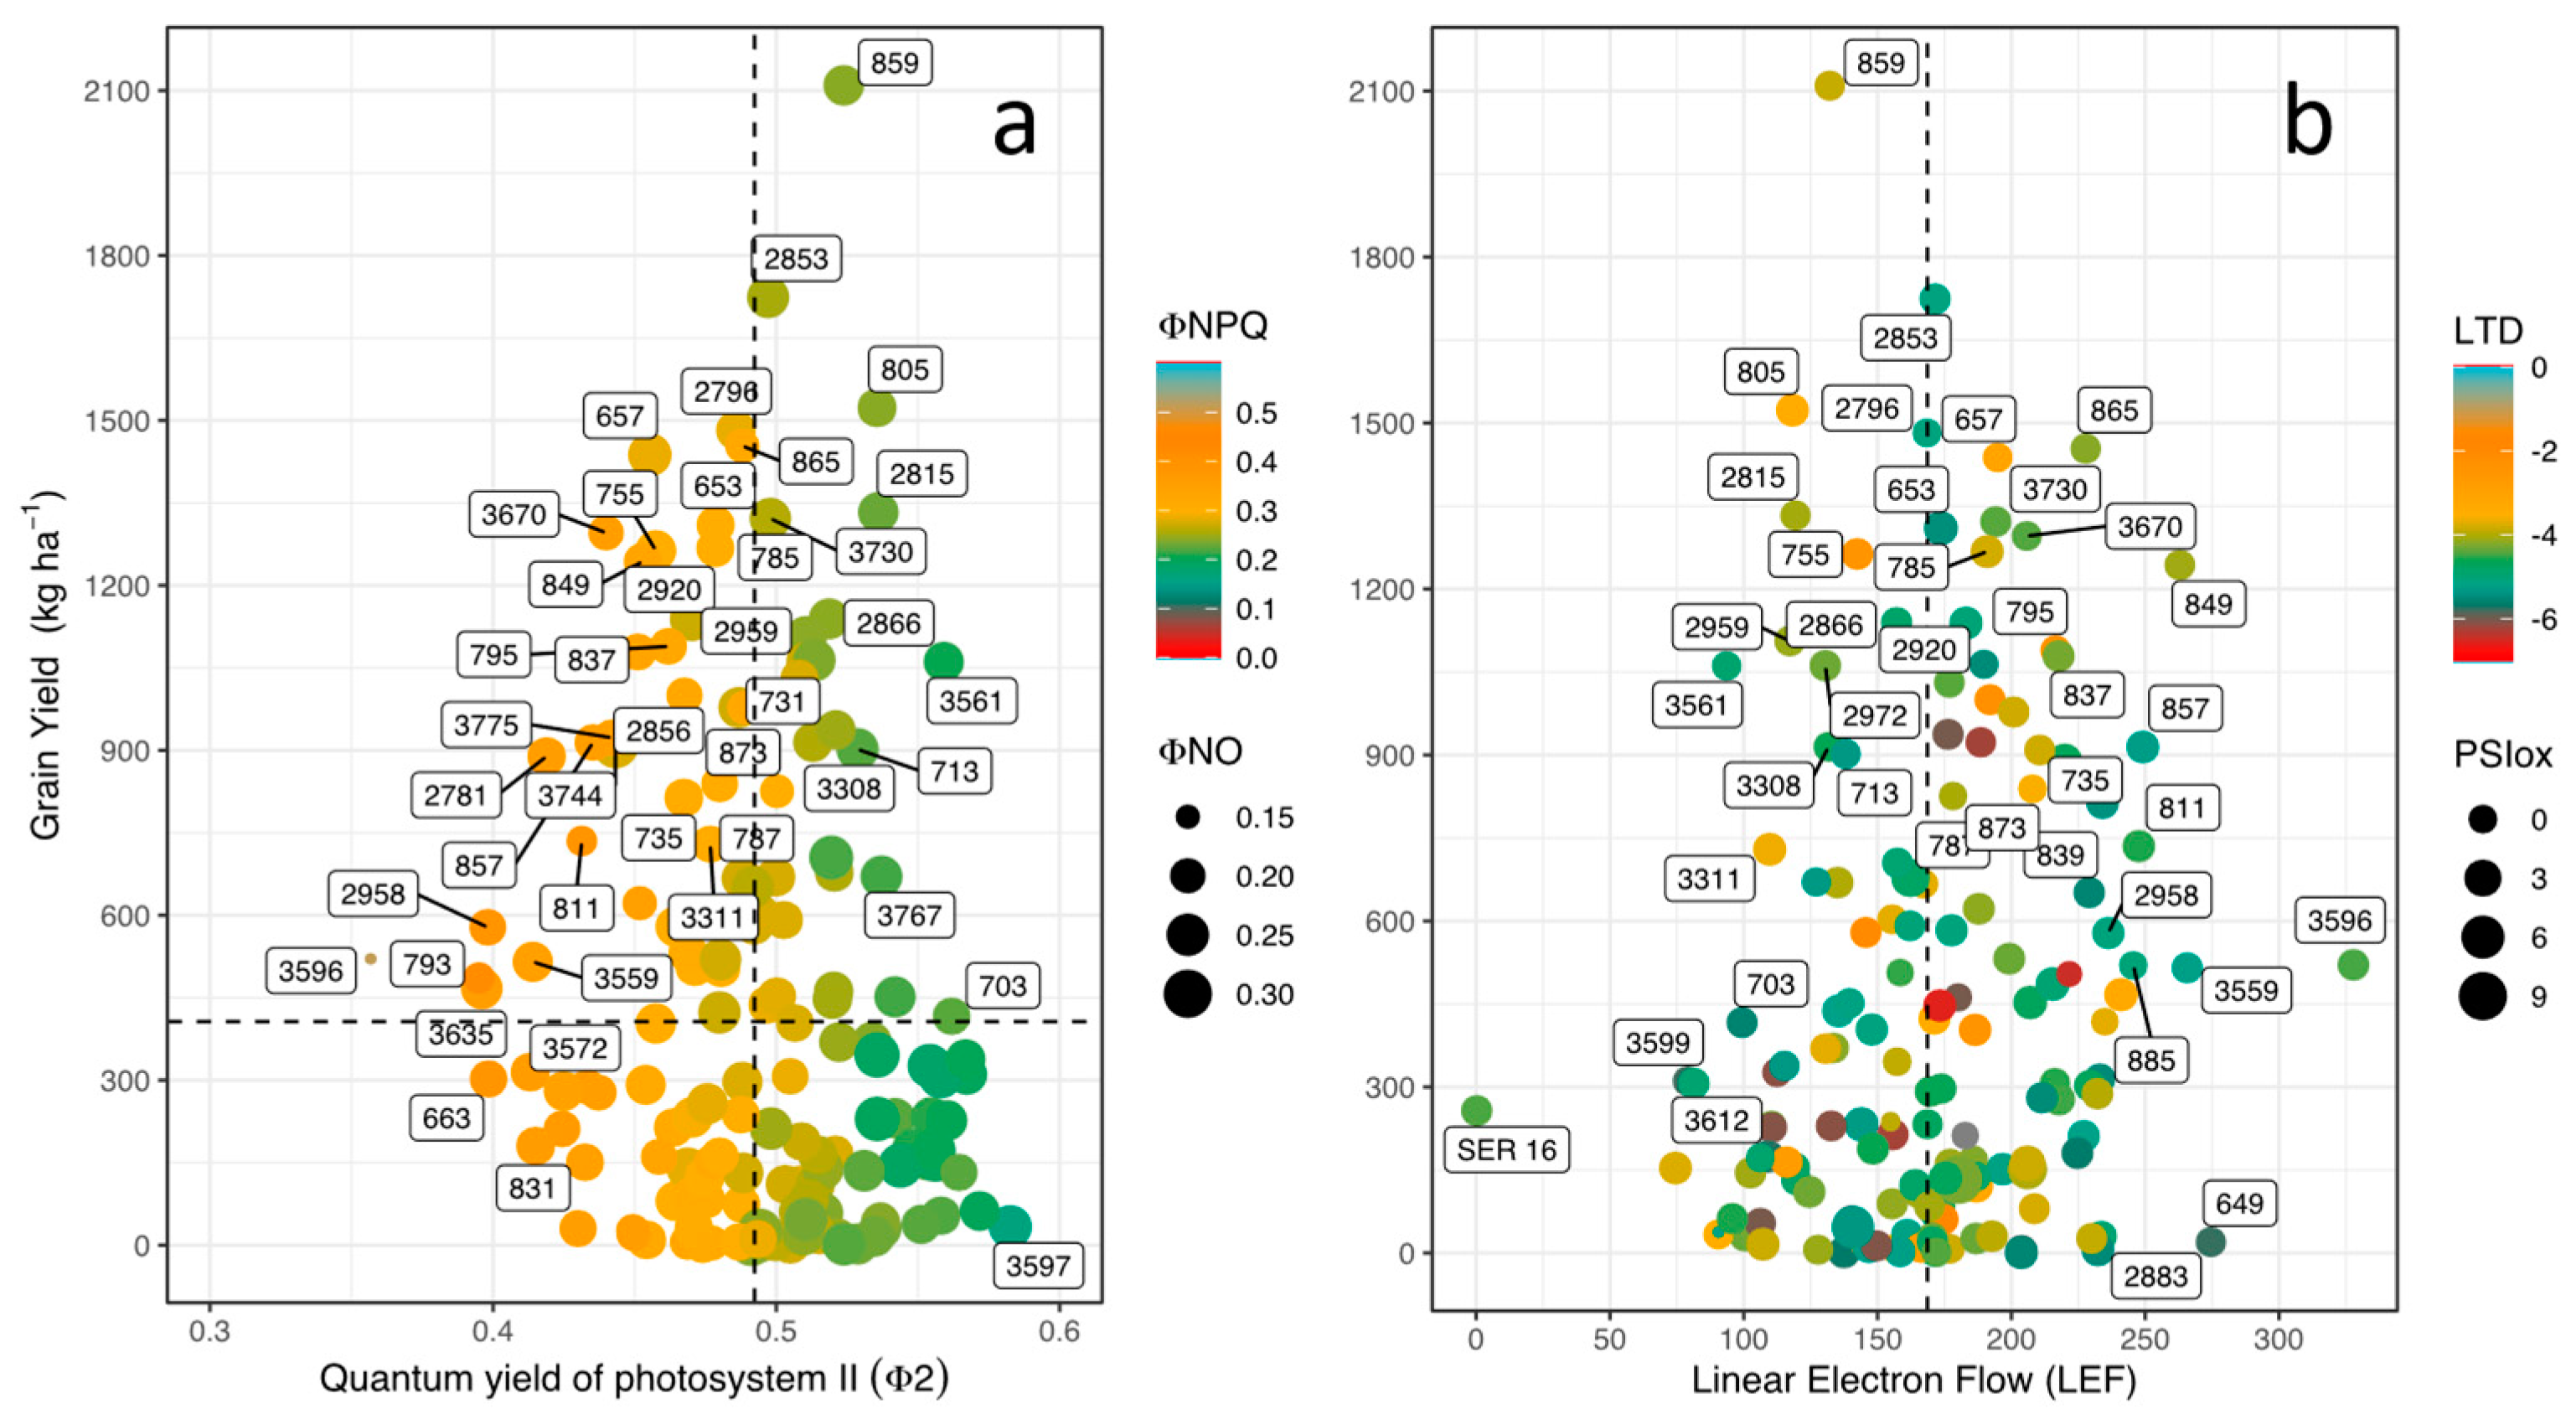
Figure 4.
Relationship between leaf temperature differential (LTD) and energy use in photosynthesis as a function of grain yield (GY), pod harvest index (PHI) and canopy biomass (CB) of biofortified common bean lines grown under the combined stress conditions of acidic soil and high temperature. (a) Quantum yield of photosystem II (ΦII) and leaf temperature differential (LTD) as a function of GY (change in the color gradient from blue to red indicating higher to lower value) and PPI (circle size), (b) Quantum yield of regulated non-photochemical energy loss in PSII (ΦNPQ) and leaf temperature differential (LTD) as a function of GY (change in the color gradient from blue to red indicating higher to lower value) and CB (circle size), (c) Quantum yield of regulated non-photochemical energy loss in PSII (ΦNO) and leaf temperature differential (LTD) as a function of GY (change in the color gradient from blue to red indicating higher to lower value) and CB (circle size). The dotted lines on the axes correspond to the means of the dependent and independent variables.
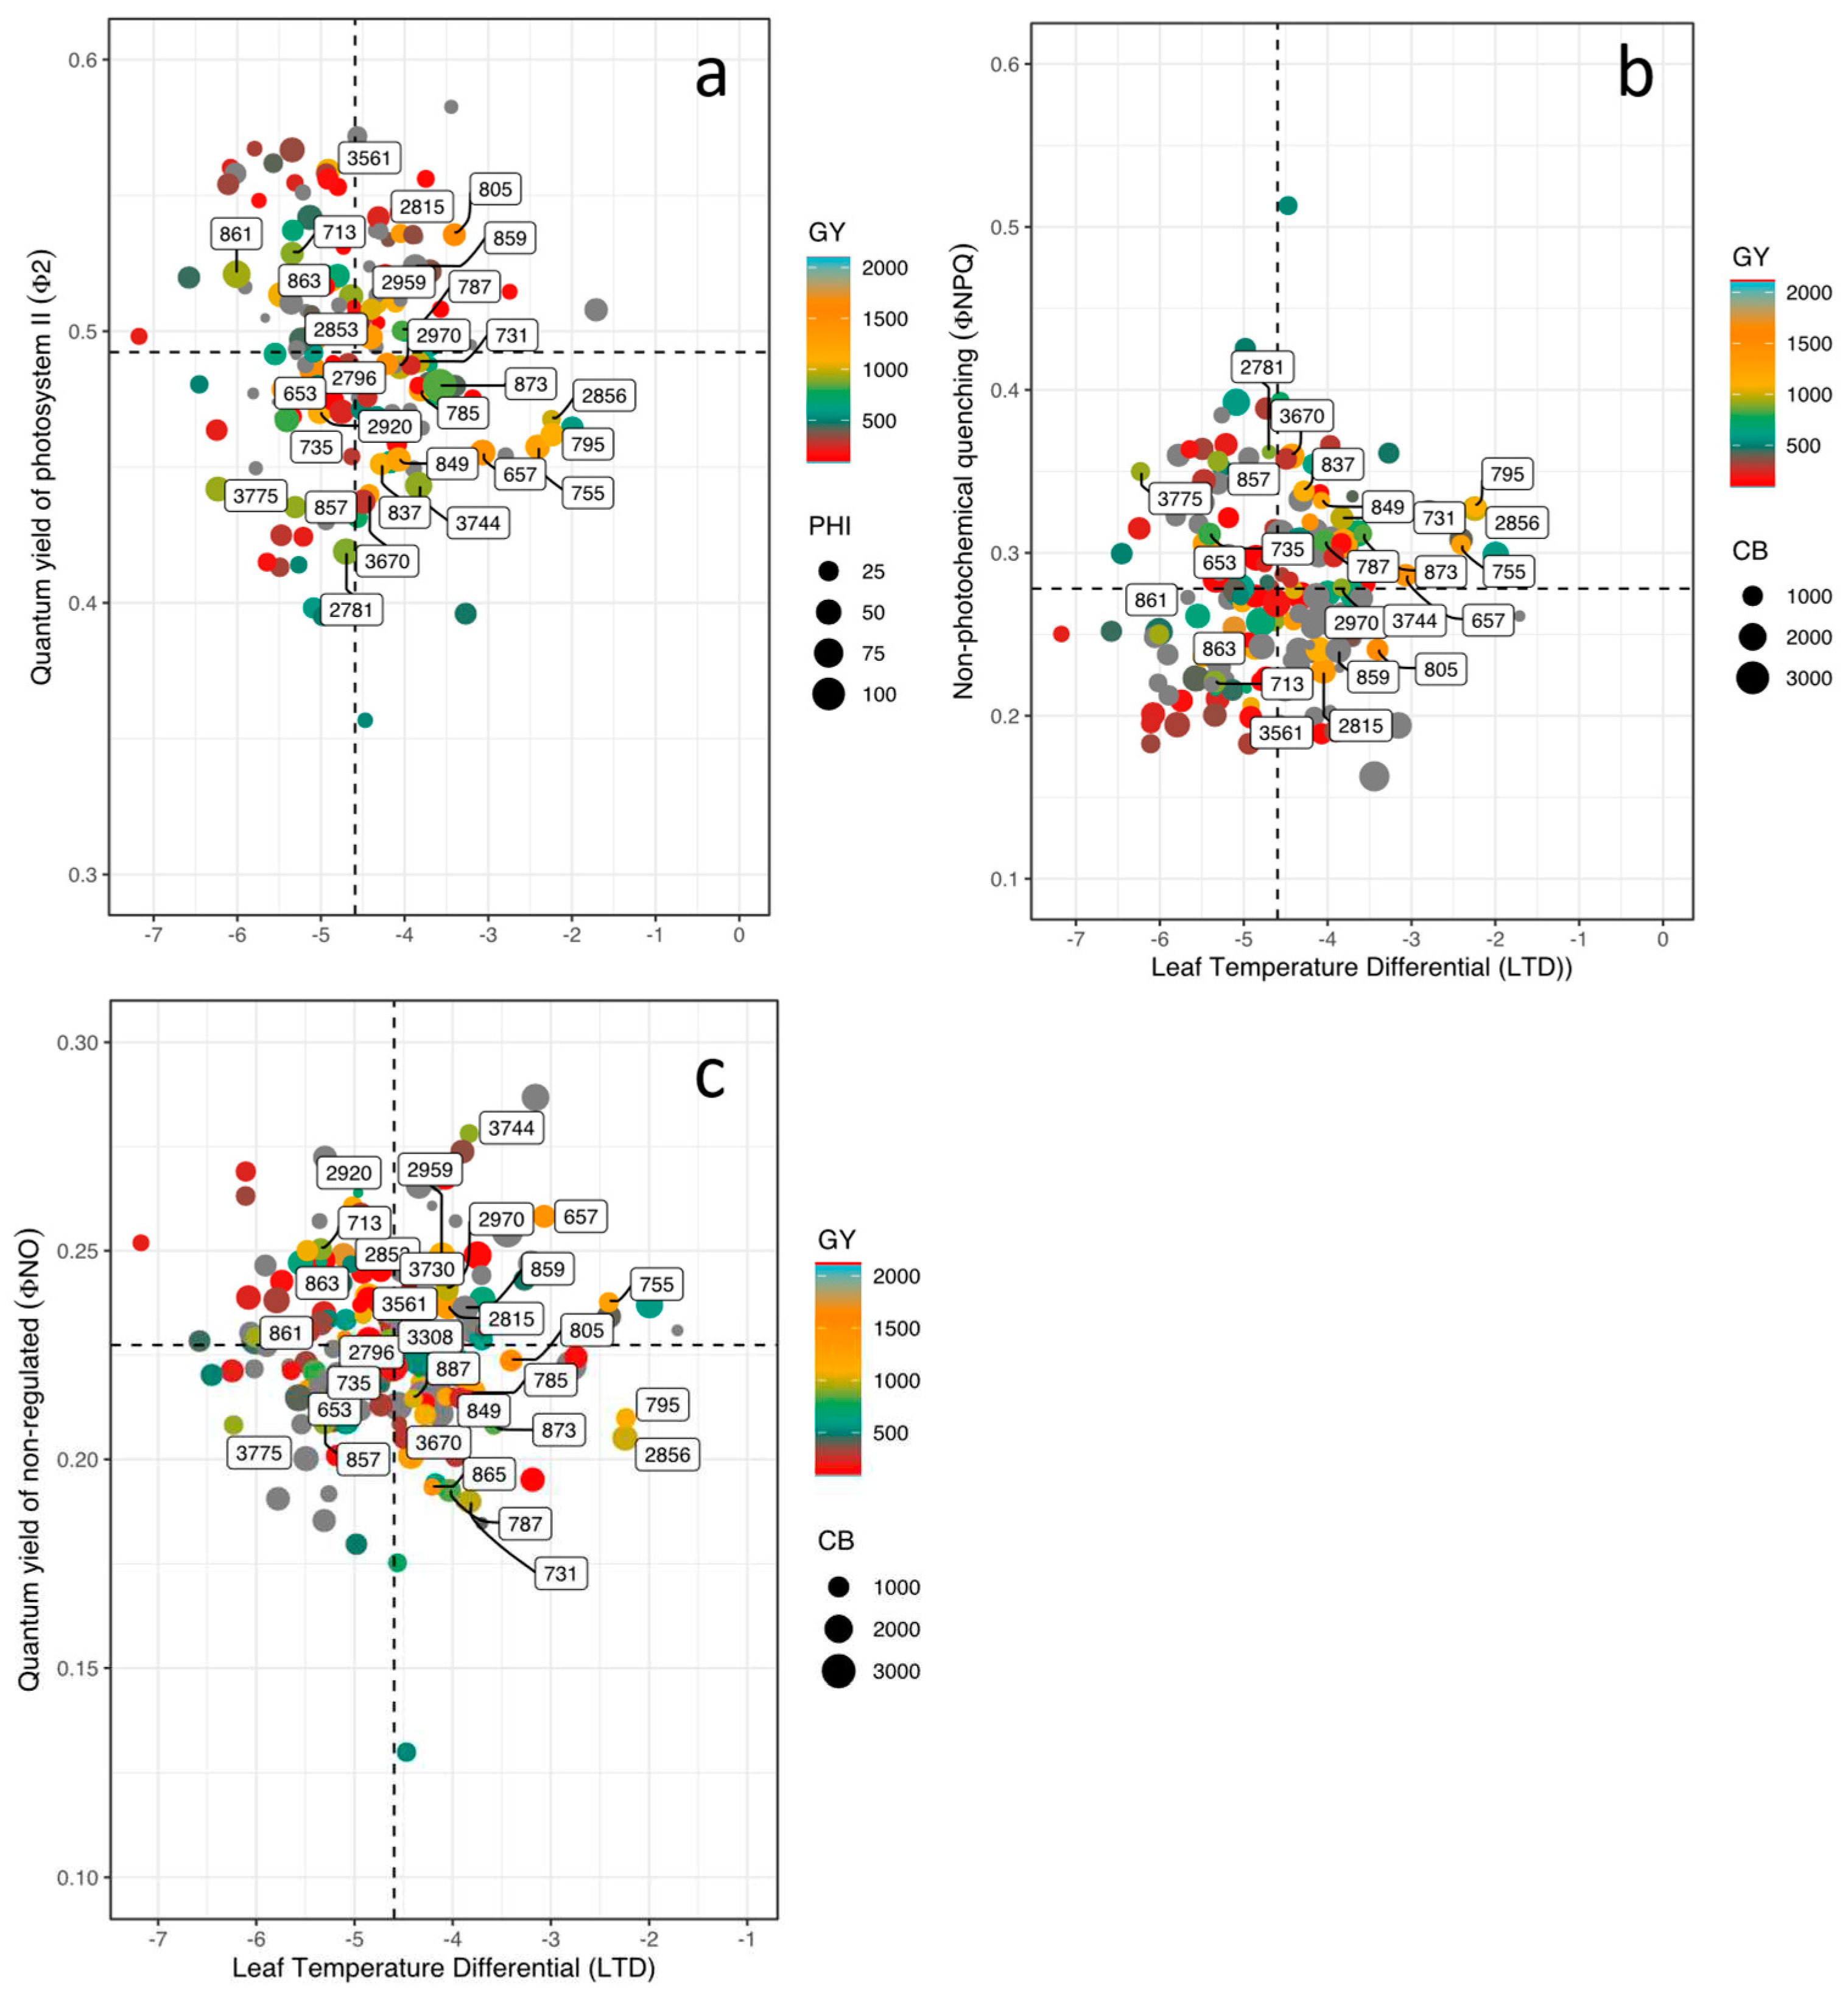
Figure 5.
Relationship between different energy pathways and linear electron flux (LEF) as a function of the magnitude of the harvest index (HI) (circle size) and the gradient of grain yield (GY) (change in color gradient from blue to red indicating higher to lower value) of biofortified common bean lines grown under the combined stress conditions of acidic soil and high temperature. (a) Quantum yield of photosystem II (ΦII) and LEF; (b) Quantum yield of regulated non-photochemical energy loss in PSII (ΦNPQ) and LEF; (c) Quantum yield of regulated non-photochemical energy loss in PSII (ΦNO) and LEF. The dotted lines on the axes correspond to the means of the dependent and independent variables.
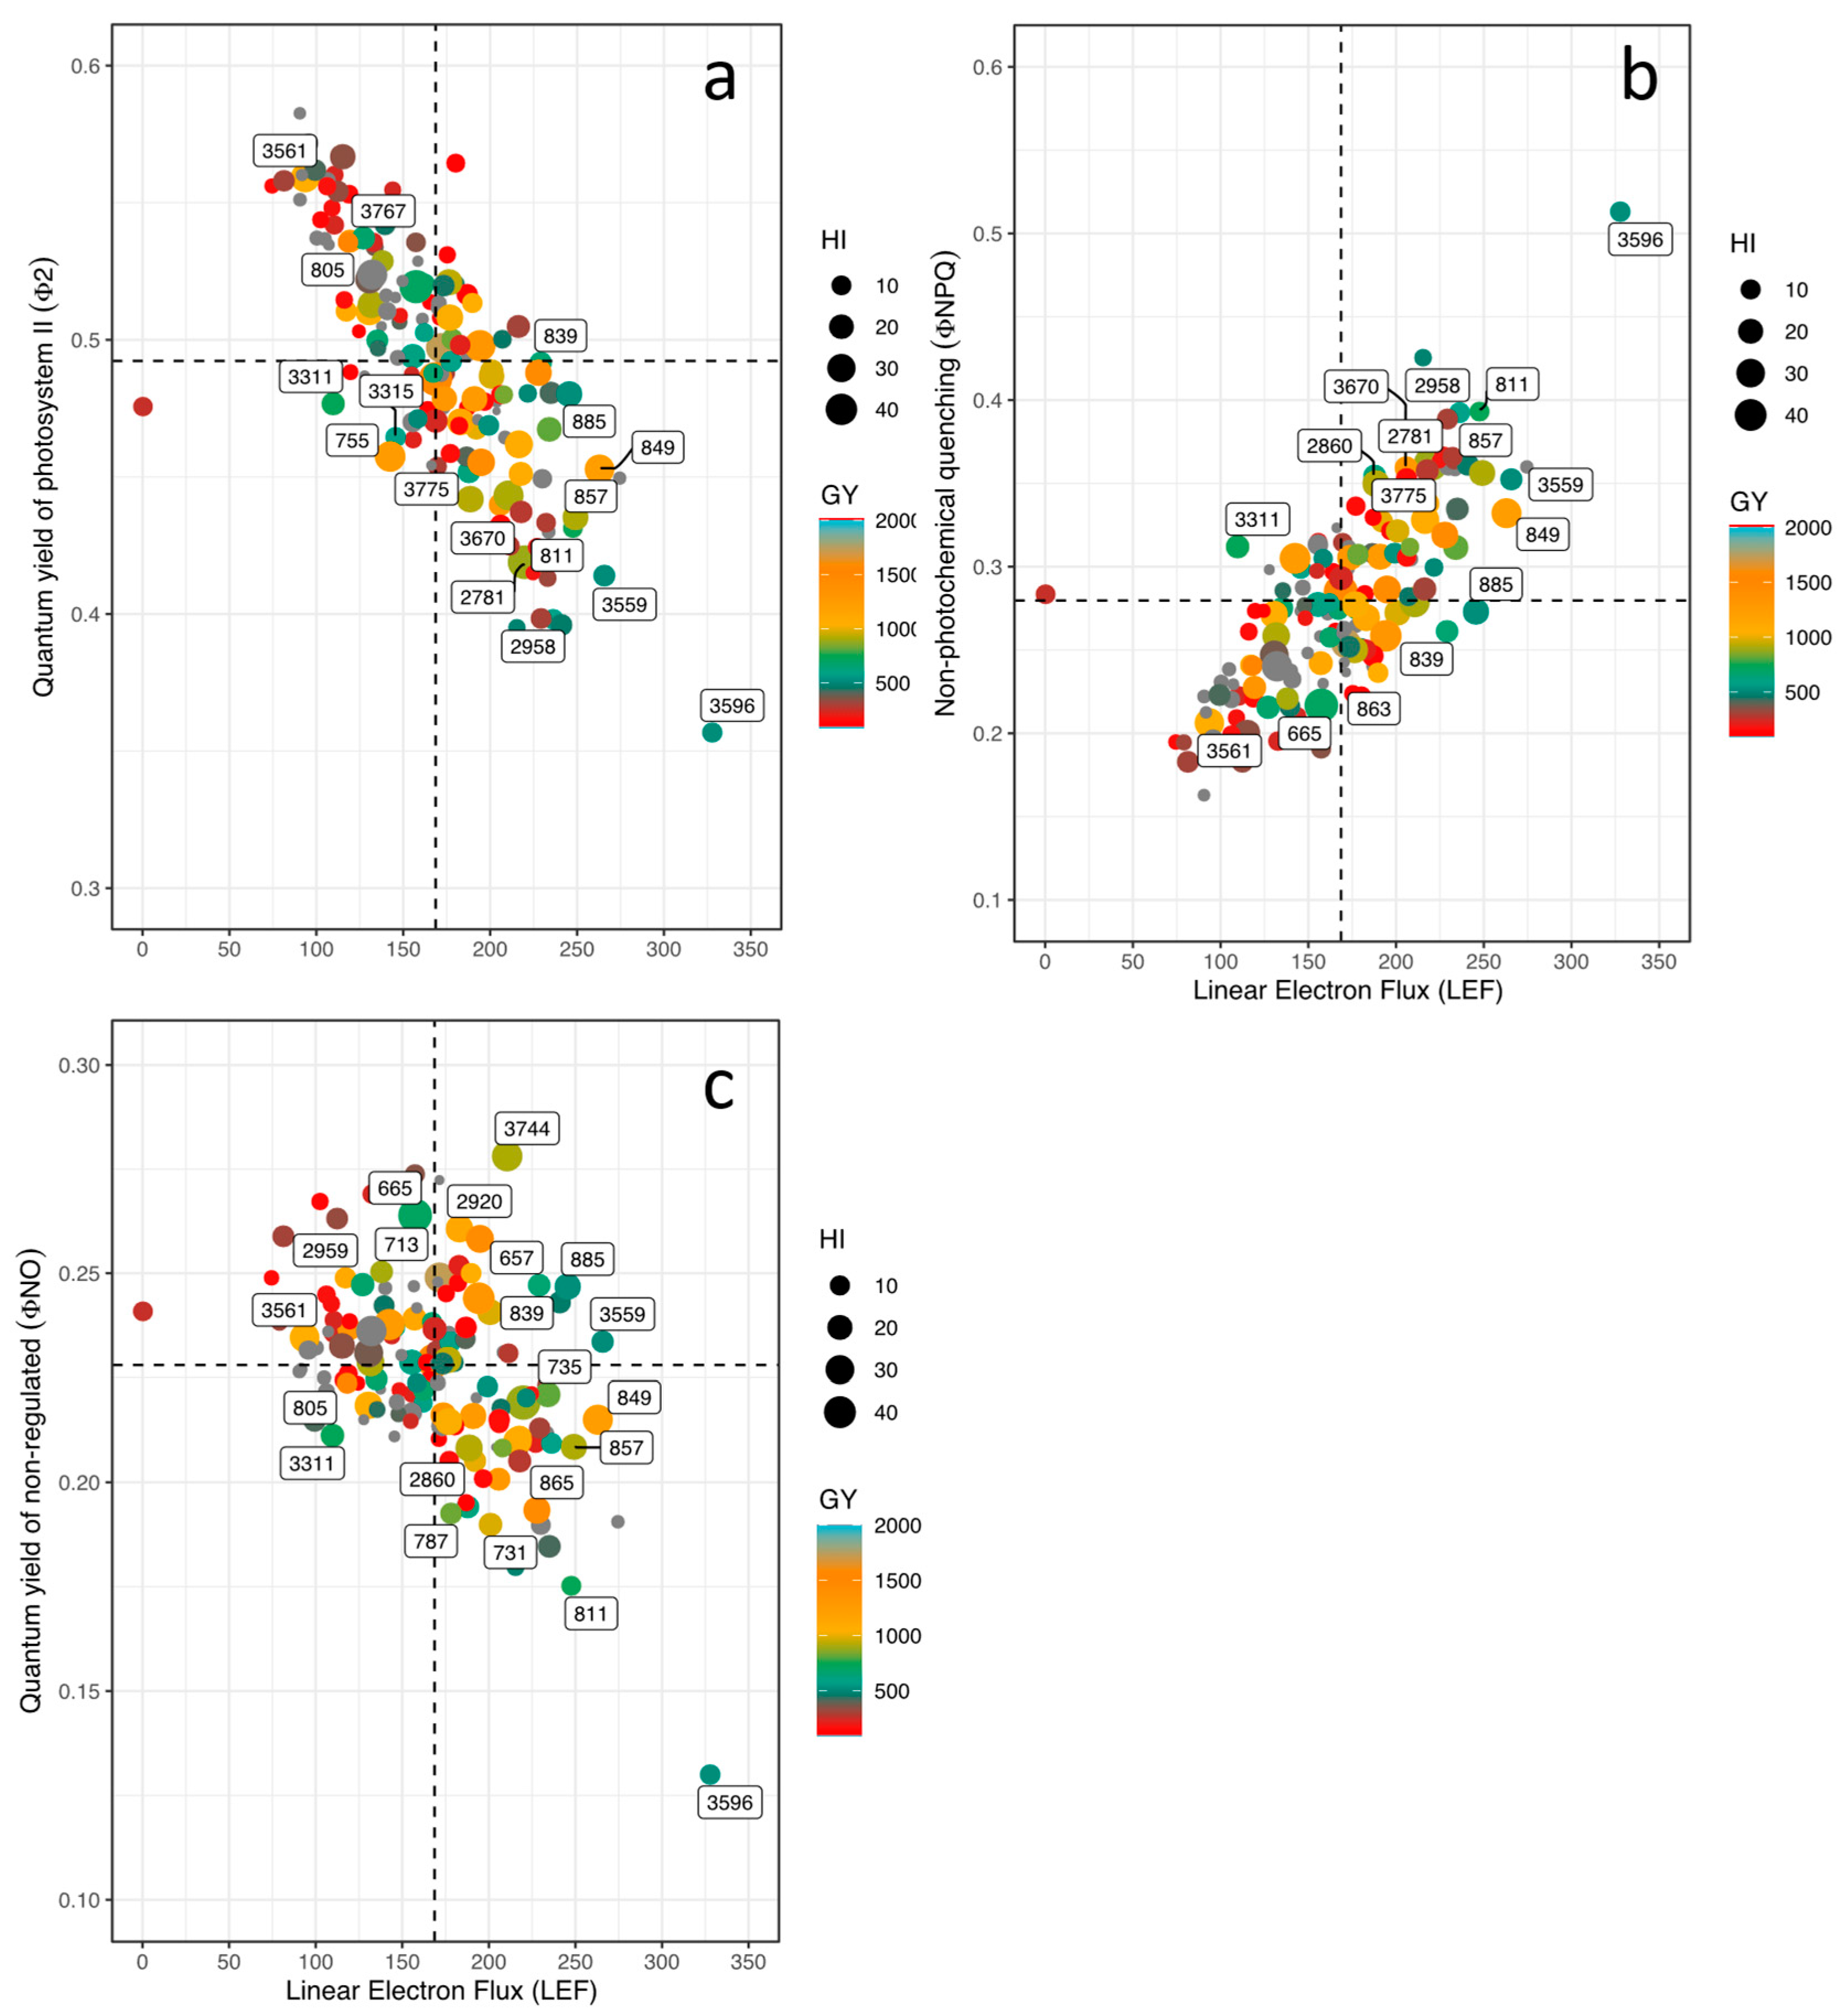

Table 1.
Correlation coefficients (P<0.05) between different phenological, physiological and agronomic variables of biofortified common bean lines grown under the combined stress conditions of acidic soil and high temperature.
Table 1.
Correlation coefficients (P<0.05) between different phenological, physiological and agronomic variables of biofortified common bean lines grown under the combined stress conditions of acidic soil and high temperature.
| Variables | GY | HI | PHI | DF | DPM | LTD | ΦII | LEF | Seed Fe | Seed Zn |
|---|---|---|---|---|---|---|---|---|---|---|
| Grain yield (GY) | 0.8*** | 0.68*** | 0.11* | -0.17* | ||||||
| Canopy biomass (CB) | 0.36*** | -0.23*** | 0.13* | |||||||
| Pod partitioning index (PPI) | 0.6*** | 0.73*** | 0.42*** | -0.15* | 0.15* | 0.18* | ||||
| Pod harvest index (PHI) | 0.68*** | 0.75*** | -0.25*** | -0.16 | 0.2** | -0.17* | ||||
| Harvest index (HI) | 0.8*** | 0.75*** | -0.18* | -0.16 | 0.19** | -0.14* | ||||
| Days to flowering (DF) | -0.25*** | -0.19** | 0.21* | |||||||
| Days to physiological maturity (DPM) | 0.2** | -0.13 | ||||||||
| Ambient humidity (AH) | 0.68*** | 0.21*** | -0.31*** | |||||||
| Ambient temperature (AT) | 0.15* | 0.19** | -0.27*** | -0.55*** | -0.23*** | 0.46*** | -0.39* | |||
| Amplitude of electrochromic band shift signal (ECSt mAU) | -0.16** | -0.21** | ||||||||
| Activity of ATP synthase (gH+) | -0.28*** | 0.24*** | -0.38* | -0.29* | ||||||
| Leaf angle (LA) | 0.27*** | 0.19* | 0.11* | -0.15* | ||||||
| Leaf temperature differential (LTD) | 0.2** | -0.11* | ||||||||
| Linear electron flow (LEF) | 0.11* | 0.19** | 0.2** | -0.19** | -0.78*** | -0.18* | ||||
| Photosynthetically active radiation (PAR) | 0.19** | 0.19** | -0.15* | -0.9*** | 0.96*** | -0.14* | ||||
| Energy dissipated as heat total (NPQt) | -0.13* | -0.76*** | 0.67*** | |||||||
| Fractions of energy received by photosystem II (ΦII) | -0.16* | -0.16* | -0.11* | -0.78*** | ||||||
| Fractions of energy not dissipated (ΦNO) | 0.01* | 0.16* | 0.35*** | -0.41*** | ||||||
| Fractions of energy dissipated as heat (ΦNPQ) | -0.93*** | 0.78*** | ||||||||
| Total active PSI centers (PSIact) | 0.13* | 0.17* | 0.13* | 0.14* | ||||||
| Over-reduced PSI (PSIor) | 0.14* | |||||||||
| Fraction of oxidized PSI center (PSIox) | -0.03* | |||||||||
| Relative chlorophyll content (RChl) | 0.2** | 0.22*** | -0.22*** | -0.16** | 0.25*** | -0.21* | ||||
| Leaf thickness (T) | -0.1 | -0.15* | 0.17** | 0.16* | ||||||
| Proton flux (vH+) | 0.15* | 0.16 | -0.18* | -0.87*** | 0.92*** | 0.17* |
Mean values were used in the correlation analysis and *, **, and *** represent levels of significance at 0.05, 0.01, and 0.001, respectively.
Disclaimer/Publisher’s Note: The statements, opinions and data contained in all publications are solely those of the individual author(s) and contributor(s) and not of MDPI and/or the editor(s). MDPI and/or the editor(s) disclaim responsibility for any injury to people or property resulting from any ideas, methods, instructions or products referred to in the content. |
© 2023 by the authors. Licensee MDPI, Basel, Switzerland. This article is an open access article distributed under the terms and conditions of the Creative Commons Attribution (CC BY) license (http://creativecommons.org/licenses/by/4.0/).
Copyright: This open access article is published under a Creative Commons CC BY 4.0 license, which permit the free download, distribution, and reuse, provided that the author and preprint are cited in any reuse.


