
Submitted:
02 January 2025
Posted:
02 January 2025
You are already at the latest version
Abstract
Tomato (Solanum lycopersicum L.) is economically important worldwide, particularly in tropical and subtropical regions, and production is significantly affected by climate change, notably heat stress. This study evaluated the effects of heat stress on root and shoot morphology, photosynthesis, fruit set, and yield traits in five tomato genotypes to identify the characteristics that differentiate heat tolerance from susceptibility, which will enable us to identify sources for key traits for breeding. The heat stress experiment was conducted during the summer under naturally high temperature conditions in a polyhouse, while a non-stress trial was conducted during the winter under permissive natural conditions in a polyhouse. Significant differences were observed between the trials and among genotypes, with heat tolerant MG785-1 and CLN1621L demonstrating superior root system architecture, greater leaf area and better physiological performance compared to the susceptible genotype CLN3961D. Root dry weight and root to shoot ratio were key indicators for heat tolerance, while the photosynthetic rate was critical for maintaining plant growth under stress. These findings highlight the importance of strong root systems and effective photosynthesis for heat tolerant tomato, providing new insights into improving crop resilience for regions affected by climate change.
Keywords:
tomato
; heat stress
; root traits
; morphology
; physiology
; gas exchange
; high-throughput phenotyping
1. Introduction
Tomato (Solanum lycopersicum L.) is one of the most widely cultivated and consumed vegetable crops globally, valued for its economic value and nutritional content, including vitamins, minerals, and antioxidants such as lycopene [1]. With more than 60% of the global tomato production, Asia is the greatest tomato producer, followed by America, Europe and Africa, contributing 13.4%, 13.5%, and 11.8% of the total tomato harvest, respectively [2]. However, tomato production is increasingly threatened by abiotic stresses, particularly heat stress, which adversely affects growth, yield and fruit quality. Climate change scenarios indicate that global temperatures will rise further and heatwaves will become more frequent, intense and prolonged in the future. This may drastically lower tomato yields, and food production and food quality in general [3]
Heat stress, defined as the exposure of plants to temperatures above their optimal range, disrupts various physiological processes [4]. In tomato plants, temperatures exceeding 32°C can impair photosynthesis, reduce pollen viability and hinder fruit set, ultimately leading to significant yield losses [5,6,7]. The optimal mean day/night temperatures for tomato are 26/20°C depending on developmental stage [8,9]. Temperatures only a few degrees above optimum can reduce fruit production and seed set [10]. The impact of heat stress on tomato plants is multifaceted, affecting morphological and physiological traits of the entire plant. High temperatures can lead to reduced leaf area and fruit set, ultimately diminishing overall plant productivity [11]. Heat stress disrupts key processes such as photosynthesis, reduces chlorophyll content and accelerates leaf senescence, weakening the plant's ability to sustain growth and development [12]. The root system, crucial for water and nutrient uptake, is also compromised under heat stress, with reduced root growth and function aggravating the plant's vulnerability to other environmental stresses [13].
Assessing heat stress tolerance in tomato genotypes has traditionally focused on morphological traits, such as stem diameter, leaf area, day to 50 percent flowering and fruit set, as well as physiological traits like photosynthetic efficiency and stomatal conductance [14]. While these assessments provide valuable insights, they often overlook traits that are challenging to observe directly, such as root characteristics, which are increasingly recognized as essential determinants of plant resilience under stress conditions due to their role in water and nutrient uptake, hormonal signaling, and overall plant health [15].
The implementation of advanced phenotyping technologies accelerates the development of better adapted varieties to enable agriculture to adapt to shifting climatic conditions and other emerging challenges [20]. Current approaches to analyzing complex plant-environment interactions include proximal and remote sensing plant phenotyping techniques, which utilize multispectral imaging, chlorophyll fluorescence imaging, and gas exchange analysis [21]. These methods, along with continuous, high-throughput monitoring, enable a comprehensive investigation of plant performance and stress responses, offering insights into stress tolerance mechanisms and identifying key traits conferring resilience [18,19].
In this study, we aim to identify and characterize key root, morphological, physiological, and yield traits that are indicative of heat stress tolerance in a diverse set of tomato genotypes. This study seeks to provide a detailed understanding of heat stress impacts on these traits and contribute to the development of heat-tolerant tomato lines suitable for future climatic conditions.
2. Results
For the Heat Stress Trial (Figure 1a), temperature data were recorded after transplanting the plants into pots, which occurred 30 days after sowing. Throughout the experimental period, spanning from mid-June to mid-August, the average day and night temperatures were 34.7°C and 27.6°C, respectively. These values are significantly higher than the optimal temperature range for tomato cultivation. The consistently elevated temperatures subjected the plants to severe heat stress, potentially impacting their physiological processes and growth. This prolonged exposure highlights the severity of the stress conditions applied during the trial, making it an effective representation of heat stress for assessing plant adaptation and performance.
In contrast, the Non-Stress Trial (Figure 1b) captured temperature dynamics from mid-October to mid-December under similar natural conditions in the plastic house. The average day and night temperatures during this period were 26.9°C and 21.0°C, respectively, which fall within the optimal range for tomato growth and development. These moderate and stable temperatures ensured minimal environmental stress, providing favorable conditions for physiological functions and growth. Thus, the Non-Stress Trial served as a baseline for evaluating plant performance under ideal conditions. Together, these trials demonstrate the contrasting environmental conditions used to assess tomato plant responses to stress and non-stress environments.
Heat stress had a significant impact on morphological, physiological and yield traits in five tomato genotypes, affecting key processes such as photosynthetic rate (A), stomatal conductance (Gs) and transpiration along with biomass allocation and root traits. ANOVA analysis revealed the sources of variance, highlighting significant interactions between genotype and stress conditions for several traits, including root dry weight (RDW), Soil Plant Analysis Development (SPAD) chlorophyll meter values and harvest index (HI), which underscores the differential responses of genotypes to heat stress (Table 1).
2.1. Effect of Heat Stress on Morphological Root Traits of Tomato Genotypes
2.1.1. Root Length (RL)
RL demonstrated no significant variability among genotypes and between non stress and heat stress conditions (Figure 2a). Under non-stress conditions, MG806-1 exhibited the longest RL (50.0 ± 0.56), followed by CLN1621L (49.1 ± 4.17), while CLN3961D displayed the shortest RL (37.2 ± 0.37). Notably, CLN1621L maintained the longest RL under stress (43.5 ± 3.39), whereas MG806-1 showed the lowest RL (36.3 ± 0.46) under heat stress.
2.1.2. Root Projected Area (RPA)
RPA was significantly affected by heat stress (Figure 2b) Under non-stress conditions, MG785-1 recorded the highest RPA (222.4 ± 12.0), while CLN4786F1 had the lowest RPA (167.7 ± 32.6). Heat stress reduced RPA across genotypes, with MG785-1 retained the largest RPA (177.9 ± 14.7) and MG806-1 exhibiting the smallest RPA (102.1 ± 6.41) under stress.
2.1.3. Root Dry Weight (RDW)
Significant differences were observed in RDW between non-stress and heat stress conditions and among genotypes (Figure 2c). Under non-stress conditions, CLN3961D exhibited the highest RDW (3.20 ± 0.53), followed by MG785-1 (2.83 ± 0.26). Heat stress caused an overall increase in RDW across all genotypes, with MG785-1 recorded highest RDW (5.91 ± 0.53). In contrast, CLN3961D showed a reduction in RDW (2.57 ± 0.24) under heat stress conditions.
2.1.4. Root to Shoot Ratio
The root shoot ratio showed significant variability under non-stress and heat stress conditions (Figure 2d). Under non-stress conditions, CLN3961D displayed the highest RSR (0.12 ± 0.02), followed by MG785-1 (0.09 ± 0.00). Heat stress significantly increased the RSR across all genotypes with MG785-1 exhibited the highest RSR (0.19 ± 0.01). In contrast, CLN3961D showed a decline in RSR (0.10 ± 0.01) under heat stress.
2.2. Effect of Heat Stress on Morphological Shoot Traits of Tomato Genotypes
The bar graphs represent the variation of morphological traits of different tomato genotypes under heat stress.
2.2.1. 3D Leaf Area (LA3D)
The LA3D showed highly significant variation between non stress and heat stress conditions and no significant variation among genotypes under the same conditions (Figure 3a). Under non-stress conditions, MG806-1 exhibited the largest leaf area (2099.9 ± 148.0), followed by CLN4786F1 (2056.0 ± 70.8), while CLN1621L showed the smallest leaf area (1801.2 ± 19.4). Heat stress led to a substantial reduction in leaf area across all genotypes. Despite this, CLN1621L maintained the highest leaf area under heat stress (1151.8 ± 96.4), whereas CLN3961D was most affected, reducing to (883.42 ± 22.2).
2.2.2. Green Leaf Index (GLI)
GLI values were significantly impacted by heat stress (Figure 3b). Under non-stress conditions, MG806-1 displayed the highest GLI (0.27 ± 0.01), while CLN3961D showed the lowest (0.21 ± 0.01). Heat stress caused a decline in GLI across all genotypes, with CLN1621L maintained the highest value (0.21 ± 0.00), while CLN3961D recorded the lowest (0.17 ± 0.00) under stress conditions.
2.2.3. Stem Diameter (SD)
SD showed resilience to heat stress among the genotypes (Figure 3c). Under non-stress conditions, CLN3961D recorded the largest SD (8.10 ± 0.70), followed by CLN1621L (7.65 ± 0.55). Under heat stress, CLN1621L (10.08 ± 0.78) retained a relatively larger SD while MG806-1, which had the lowest SD (8.36 ± 0.38).
2.2.4. Shoot Dry Weight (SDW)
Under non-stress conditions, MG785-1 (30.61 ± 3.07) exhibited the highest shoot dry weight, followed by other genotypes with comparable values. Heat stress did not drastically affect SDW in most genotypes, with CLN1621L (36.3 ± 0.4) showing a relatively consistent performance under both conditions. This trait showed less variation compared to fresh weights under heat stress (Figure 3d).
2.2.5. Total Fresh Weight (TFW)
Significant differences were observed in TFW between the non stress and heat stress condition and among the genotypes. was highest in MG785-1 (254.99 ± 10.09) and CLN1621L (252.29 ± 8.26) under non-stress conditions. Heat stress caused a notable reduction in TFW for all genotypes. CLN1621L (222.82 ± 4.68) maintained relatively higher TFW under stress, reflecting better overall performance. In contrast, MG806-1 (158.3 ± 3.32) and CLN3961D (163.08 ± 6.9) experienced a significant decline, indicating lower heat tolerance (Figure 3e).
2.2.6. Total Dry Weight (TDW)
TDW demonstrated a significant increase under heat stress and in most of the genotypes (Figure 3f). Under stress conditions, MG785-1 had the highest TDW (33.44 ± 3.28), followed by CLN4786F1 (30.94 ± 1.28). However, under heat stress, CLN1621L (40.49 ± 0.56) showed an increase in biomass, while MG806-1 experienced the most severe reduction (23.96 ± 3.96).
2.3. Effect of Heat Stress on Physiological Traits of Tomato Genotypes
The bar graphs represent the variation in physiological traits of different tomato genotypes under non-stress and heat stress conditions. The traits include photosynthetic rate (A), transpiration rate (E), stomatal conductance (Gs) and measurements with a SPAD meter.
2.3.1. Photosynthetic Rate (A)
The photosynthesis rate (A) varied significantly across genotypes and between conditions (Figure 4a). Under non-stress conditions, MG785-1 exhibited the highest photosynthetic rates (A) (13.78 ± 0.46) suggesting superior carbon assimilation. CLN3961D had significantly lower photosynthetic rates (10.07 ± 0.98). However, under heat stress, photosynthetic rates decreased for all genotypes, with MG785-1 maintaining the highest photosynthesis rate (11.71 ± 1.61) while CLN3961D exhibited the lowest (7.04 ± 0.31).
2.3.2. Transpiration Rate (E)
The Transpiration rate (E) exhibited significant differences among genotypes and between conditions (Figure 4b). Under non-stress conditions, the highest transpiration rate was recorded in CLN3961D (5.63 ± 0.15), while CLN1621L had the lowest (4.21 ± 0.90). MG806-1 showed the highest transpiration rates (6.04 ± 0.60) which may indicated better evaporative cooling and water regulation under heat stress. CLN3961D (2.45 ± 0.33) had significantly lower transpiration rates indicate poor water management under stress.
2.3.3. Stomatal Conductance (Gs)
The Stomatal conductance (Gs) exhibited less significant differences among genotypes and between conditions (Figure 4c). Under non-stress conditions, values ranged from 0.46 ± 0.09 in CLN1621L to 0.64 ± 0.03 in CLN3961D. Under stress conditions, CLN3961D exhibited the lowest stomatal conductance (0.18 ± 0.01), while MG785-1 maintained a relatively higher value (0.54 ± 0.09).
2.3.4. Soil and Plant Analysis Development (SPAD-520)
Chlorophyll content, measured as SPAD, increased under heat stress in most of the genotypes (Figure 4d). Under non-stress conditions, MG785-1 (54.47 ± 1.89) and CLN1621L (52.10 ± 2.66) showed the highest SPAD values, whereas MG806-1 (47.0 ± 0.42) had the lowest SPAD value. Under heat stress, MG785-1 retained the highest chlorophyll content (70.17 ± 1.72), while CLN3961D experienced the largest decline (46.03 ± 1.33).
2.4. Effect of Heat Stress on Yield Traits of Tomato Genotypes
2.4.1. Number of Fruits per Plant (NF)
Under non-stress conditions, genotypes CLN1621L (23 ± 0.58) and MG785-1 (23 ± 2.52) exhibited the highest number of fruits, followed by MG806-1 (18 ± 0.67) and CLN4786F1 (13 ± 0.33), while CLN3961D (10 ± 0.88) produced the lowest fruit count. Heat stress caused a significant reduction in the number of fruits across all genotypes. MG785-1 (15 ± 2.33) demonstrated relative resilience, maintaining a higher fruit count compared to the other genotypes, while CLN3961D was the most adversely affected, showing a drastic decline in fruit production (Figure 5a).
2.4.2. Yield per Plant (Y)
The yield under non-stress conditions was highest in MG806-1 (507.24 ± 61.2), with CLN3961D (340.47 ± 15.2) recording the lowest yield. Heat stress significantly reduced yields in all genotypes. MG785-1 (298.01 ± 25.1) maintained relatively higher yields under stress, indicating better heat tolerance. In contrast, CLN3961D exhibited negligible yield under heat stress, highlighting its sensitivity to high temperatures (Figure 5b).
2.4.3. Harvest Index (HI)
Under non-stress conditions, the harvest index was higher than under stress in all genotypes, except CLN3961D, which did not set any fruit. CLN4786F1 (0.65 ± 0.01) and MG806-1 (0.64 ± 0.03) recorded the highest HI values. Heat stress caused a notable decline in HI across all genotypes. MG785-1 (0.59 ± 0.01) and CLN4786F1 (0.44 ± 0.02) maintained higher HI values compared to the other (Figure 5c).
Overall, tomato genotypes showed varied resilience to heat stress. CLN1621L and MG806-1 performed best, with the highest fruit count, yield and harvest index, indicating continued carbon allocation to fruits. Conversely, CLN3961D had poor performance, with low or no fruit production.
2.5. Correlation and PCA Analyses
Correlation matrices among SD, SPAD, SDW, RL, RPA, RDW, RSR, TDW, TFW, A, E, Gs, LA3D, GLI, NF, Y, and HI each of non stress and heat stress environment are shown in Figure 6a,b.
Under non-stress conditions (Figure 6a), most traits showed weak or insignificant correlations, with a few traits with significant negative correlation, indicating minimal variability and interaction and for some traits such as GLI with RDW and RSR trade-offs. In contrast, heat stress (Figure 6b) induced a notable shift toward positive correlations across physiological, growth, and yield-related parameters. Yield (Y) exhibited strong positive correlations with RDW, RSR, NF, SPAD, A, Gs, and GLI, emphasizing their role in maintaining productivity under stress. SPAD, a measure of leaf greenness, correlated positively with photosynthetic traits (A, Gs, and E) and biomass-related traits, highlighting its importance in sustaining leaf health and productivity under heat stress. Traits like RPA and SDW showed enhanced correlations with TDW and TFW, reflecting their contribution to stress adaptation.
NF shifted to stronger positive correlations with SPAD, RDW, TFW, and GLI, underscoring its critical role in driving productivity under stress. Scatterplots in the lower triangle visually reinforced these stronger correlations, while density plots along the diagonal illustrated greater variability in key traits like SD, A, Gs, E, TFW, and Y under stress. These findings reveal the activation of adaptive physiological and growth mechanisms, enabling tomato plants to counter heat stress and maintain productivity, providing valuable insights into trait interdependence and resilience mechanisms.
Principal component analysis (PCA), a multivariate statistical tool, was utilized to assess the contributions of various traits under non-stress and heat stress conditions across five tomato genotypes. PCA effectively reduced the dimensionality of the data while preserving most of the variability. The biplot (Figure 7) reveals that PC1 and PC2 together account for 64.1% of the total variability, with PC1 contributing 43.4% and PC2 explaining 20.3%.
In the biplot for treatments (Figure 7a), PC1 distinctly separated observations into non-stress and heat stress groups. Non-stress samples clustered with higher contributions from traits such as GLI, E, RL, and A, representing physiological efficiency and growth attributes under favorable conditions. Conversely, the heat stress group was closely associated with stress-adaptive traits, including RSR, SPAD, SD, and RDW, highlighting their significant roles in coping with heat-induced challenges.
The genotype-specific biplot (Figure 7b) illustrates clear clustering patterns of heat-tolerant genotypes, such as CLN1621L, MG785-1 and CLN4786F1, which were influenced by traits like RSR, SPAD, and SD. These genotypes demonstrated superior adaptive responses to heat stress. On the other hand, the heat-susceptible genotype CLN3961D was positioned closer to the non-stress cluster, reflecting its limited ability to respond to stress conditions. Tolerant genotypes exhibited more resilient physiological and resource allocation mechanisms, enabling better performance under heat stress conditions. These findings provide insights into trait-genotype associations that can inform breeding strategies for heat tolerance in tomatoes.
3. Discussion
Breeding for heat tolerance in tomato plants requires a clear knowledge how the plants respond to high temperatures, and which factors are limiting for yield. Particularly information on how shoot and root morphology, physiological factors such as transpiration and photosynthesis, and yield parameters including fruit set and size contributes to this understanding. This study evaluated the effects of heat stress on morphological root and shoot traits, transpiration, photosynthesis, stomatal conductance at fruit setting stage and yield traits during harvesting. Consistent heat stress with prolonged exposure to high temperatures during the day and moderately elevated temperatures at night was applied with the aim to assess heat variation in the measured parameters to identify key traits for heat tolerance. To compare, a non-stress trial was conducted under natural temperature dynamics in a plastic house. The variability of the responses among the genotypes highlighted the complexity of heat stress responses and correlation analysis informed about root, physiological and morphological traits contributing to fruit set and yield.
The analysis of root traits under non stress and high-temperature stress conditions in the polyhouse revealed that certain tomato genotypes exhibited superior performance, particularly in terms of maintaining RDW, RSR and RPA under heat stress. Genotypes CLN1621L and MG785-1 demonstrated significantly higher RPA and RDW compared to other genotypes. These findings align with previous studies that emphasize the importance of root system architecture in enhancing heat stress resilience [14]. The superior root traits observed in these genotypes could contribute to improved water and nutrient uptake, supporting their resilience under stress conditions [15].
Conversely, CLN3961D exhibited significantly lower values across most root parameters, which likely contributes to its susceptibility to heat stress. These results are consistent with the findings of [9], which suggested that genotypes with less efficient root systems are less capable of withstanding environmental stressors.
In terms of morphological shoot traits, genotypes such as CLN1621L and MG785-1 displayed superior characteristics, including LA3D, GLI, SD, and TDW which are indicative of better heat tolerance and resilience. SD varies independently and did not contribute to yield in the test panel and other measured parameters. This is supported by research showing that plants with larger SD can better withstand heat stress due to increased structural stability [16,17]. On the other hand, genotypes like CLN3961D, which exhibited smaller leaf area and green leaf index demonstrated poorer performance under heat stress. The genotypes with higher GLI and greater leaf greenness are better at maintaining photosynthetic efficiency and overall health in stressful environments [18]
Genotypes MG785-1 and CLN1621L exhibited significantly higher photosynthetic and transpiration rates, indicating better carbon assimilation and water regulation under heat stress. Higher photosynthetic rates may contribute to improved resilience, as reported by previous studies [19,20]. In contrast, CLN3961D exhibited significantly lower photosynthetic rates and higher leaf temperatures, reflecting reduced efficiency in photosynthesis and heat dissipation. This finding reinforces the notion that physiological traits such as transpiration rate and stomatal conductance play crucial roles in determining a plant's ability to withstand heat stress [21].
The genotypes showed significant variation in yield-related traits under heat stress, pinpointing tolerant and susceptible materials. Genotypes CLN1621L, MG785-1 and MG806-1 exhibited the highest yields pointing towards their superior tolerance to high temperatures [22]. The genotypes CLN1621L and MG785-1 exhibited the highest fruit number per plant among the tested genotypes while CLN3961D showed minimal to no yield, underscoring the detrimental effects of heat stress on fruit set in this genotype [12,16]. Tomato breeding is looking for tolerant genotypes that have maintained capacity to allocate resources toward the economically useful part of the plant under stress [23]. Harvest index (HI) varied significantly, with MG806-1 achieving the highest values, indicating efficient resource use under stress [24].
The correlation analysis (Figure 6) illustrates intricate relationships among various growth and yield parameters in tomato genotypes subjected to non-stress and heat stress. Under heat stress, significant positive correlations were observed between photosynthesis rate (A), transpiration rate (E), and stomatal conductance (Gs), suggesting coordinated gas exchange mechanisms that support photosynthesis under stress [25]. Additionally, LA3D was strongly correlated with TDW and GLI, indicating the importance of leaf area and greenness for maintaining biomass and photosynthetic efficiency under heat stress[26]. A significant positive correlation between plant biomass traits and root projected area indicates the critical role of the root system in supporting biomass production, consistent with findings by [27], who emphasized the importance of root architecture in nutrient uptake and stress resilience. Additionally, the strong correlation between yield and the number of fruits underscores the pivotal role that fruit number plays in determining overall yield, reinforcing the concept that reproductive success is closely tied to vegetative health [23]. Under non-stress conditions, correlations were more stable with moderate positive correlations between LA3D and TDW. However, a negative correlation between photosynthetic rate (A) and GLI suggests a trade-off between photosynthesis and leaf greenness in optimal conditions [28].
The positive correlations between photosynthetic rate (A), stomatal conductance (Gs) and transpiration rate (E) highlight the crucial role of stomatal activity in promoting photosynthesis, especially under heat stress. These findings align with previous research linking stomatal function to plant performance in challenging conditions. Several correlations were found to be non-significant, such as that between stomatal conductance (Gs) and RL these results indicate the complexity of interactions among traits under non stress and heat stress, which warrants further investigation to understand the underlying mechanisms. These results demonstrate that heat stress amplifies trait correlations, reflecting adaptive mechanisms for stress tolerance, while non-stress conditions show more stable trait relationships. This highlights the importance of coordinated physiological and morphological traits in stress resilience.
The presented results inform about both the agronomic performance of five tomato genotypes under heat stress, and the morphological and physiological differences among the genotypes, which may contribute to build up more or less yield under heat stress. The correlations between the trait values help generate a hypothesis of responses that contribute to greater yield in the test panel. This analysis revealed that under non-stress conditions, genotypes exhibited physiological traits associated with efficient growth, including higher GLI, transpiration rate (E), RL and photosynthesis rate (A). These traits reflect the plant’s ability to maintain healthy growth and efficient metabolic function in optimal environments [29]. Under heat stress conditions, the PCA biplot (Figure 7a) clearly segregated the samples, with heat stress conditions clustering with stress-adaptive traits such as root shoot ratio, SPAD chlorophyll content, stem diameter, and root dry weight. These traits are critical for managing water and nutrient availability under stress and are typically associated with heat tolerance mechanisms in plants [30]. The clustering pattern indicates that heat adaptive genotypes, such as CLN1621L and MG785-1, rely heavily on these traits to withstand elevated temperatures, maintaining higher photosynthetic capacity and biomass under heat stress [31].
The genotype-specific PCA biplot (Figure 7b) demonstrated that heat-tolerance in CLN1621L, MG785-1 and CLN4786F1, was closely associated with traits like SPAD, SD, and RSR, highlighting their superior capacity for coping with heat stress. These genotypes exhibit enhanced physiological responses, including improved water-use and nutrient allocation, which support better performance under high-temperature conditions [30]. In contrast, CLN3961D, a heat-sensitive genotype, clustered closer to the non-stress group, underscoring its limited adaptability to heat stress. This genotype showed poorer physiological responses under heat stress, reflecting its vulnerability to environmental challenges [32]. The clustering of genotypes based on these traits offers valuable insights into their adaptive mechanisms and can guide breeding programs aimed at improving heat tolerance in tomatoes. The results indicate that genuine heat stress conditions were present during the trial, providing strong evidence. These findings are consistent with previous studies that confirm the impact of heat stress on traits like root growth, photosynthesis, and transpiration [33].
4. Materials and Methods
4.1. Plant Material and Experimental Design
Five tomato genotypes (Table 2) were used for this study. These genotypes were developed by the World Vegetable Center (WorldVeg) for their heat tolerance. Among them, CLN3961D serves as a susceptible check, while CLN1621L is used as a heat-tolerant check. These genotypes were evaluated to compare root system performance and physiological and morphological responses under different environmental conditions.
The experiment was conducted under two contrasting temperature regimes a heat stress trial from mid-May to mid- August and a non-stress trial from mid-September to mid-December, both under natural conditions in a plastic house. The temperatures were recorded using data loggers in both the trials.
The seeds were sown in mid-May for heat stress trial and in mid-September for the non-stress trial. Seedlings were raised in controlled conditions for 30 days and transplanted into 18 cm × 18 cm plastic pots in mid-June for heat stress trial and mid-October for non-stress trial. The pots were filled with sterilized field soil, consisting of a mixture of sand, silt, and organic matter to ensure uniform growing conditions. The experiment followed a completely randomized design (CRD) with factorial arrangements based on the tomato genotypes. The plants were managed under standard agronomic practices, including regular irrigation, fertilization and pest control to isolate the effects of temperature conditions.
4.2. Root Trait Measurements
Root Washing Technique
To assess root morphology and biomass under heat stress and non-stress conditions, a modified root washing technique based on the method described by [34] was employed to prevent damage to the delicate root structures. The above-ground parts of the plants in different growth stages were excised at 1cm from the soil surface to facilitate the isolation of the root system. Pots containing the root-soil samples were thoroughly irrigated and allowed to soak for 10 minutes. After the soil was fully saturated, the pots were carefully inverted to release the soil-root clumps. The root system samples were then immersed in water and the soil was gently washed away using a light stream of water from a hose, ensuring the integrity of the root structure. The cleaned roots were subsequently used for further analysis (Figure 8). The different root traits measured included RL, RPA, RDW, and RSR. Root length and root projected area were taken at 50% fruit setting stage.
The washed roots were spread out on a flat surface and digital images were captured using a Canon G7X camera. The images were subsequently analyzed using ImageJ© software (version 1.53e) [35] to quantify RL and RPA. RDW(g) was recorded after oven drying using a precision balance [36]. The RSR was calculated by dividing the dry weight of the roots by the dry weight of the shoots (Section 4.3.3), determining the allocation of biomass between the root and shoot systems.
4.3. Phenotyping
4.3.1. Digital Phenotyping
Digital phenotyping was carried out by using the Trait Finder system with two Plant Eye 3D scanners (Plant Eye F500, Phenospex, The Netherlands) for collecting multispectral data at 50 % fruit set with three replications. The reflection of light in several spectral bands can detect potential variations in spectral properties of plants LA3D and GLI.
4.3.2. Stem Diameter
SD (mm)was measured at the base of the stem, just above the soil surface, using a digital caliper (CD-20APX, Mitutoyo Co., Ltd., Japan) with a precision of 0.01 mm to ensure high measurement accuracy. Each plant's stem diameter was measured in three different locations at the base of the stem to account for potential variations in the stem shape and thickness. These triplicate measurements were taken for each plant to minimize measurement errors and provide a more reliable estimate of stem thickness.
4.3.3. Total Dry Weight
The TDW (g)was calculated by adding the shoot dry weight and root dry weight. Both parts were dried in an oven at 80°C for 48 hours until reaching a constant weight before measurement.
4.4. Physiological Measurements
4.4.1. Gas Exchange Parameters
The measurements were conducted using a portable photosynthetic system (LI-6800, LICOR Biosciences, USA) between 10:00 am and 2:00 pm at 50% fruit setting stage. Gas exchange parameters viz., photosynthetic rate (A, µmol CO2 m−2s−1), stomatal conductance (Gs, mol m−2s−1) and transpiration rate (E, mmol m−2s−1) were measured on the third fully expanded leave of 5 tomato genotypes with three replications per genotype.
4.4.2. SPAD
The non-destructive chlorophyll content index was measured as an average of three leaves per plant using SPAD meter (SPAD-502 Plus, Minolta, Osaka, Japan) at 50 % fruit set. The average of the three plants measurements was used for analysis.
4.5. Yield Traits and Harvest Index
The average yield (Y, g), number of fruits per plant (NF) and were recorded at the harvesting stage. The HI was calculated as the ratio of the economic yield (weight of harvest fruits) to the total plant biomass.
4.6. Statistical Analysis
The statistical analysis was performed to evaluate the physiological, morphological, root, and yield traits under non stress and heat stress conditions across different genotypes. Two-way ANOVA, performed using base R [37], was applied to assess the effects of genotype, condition, and their interaction on each trait. Post-hoc pairwise comparisons were conducted using the agricolae package with the Hochberg-adjusted Least Significant Difference (LSD) test to determine significant differences between treatment combinations, with grouping letters indicating homogeneity. Mean and standard error were computed for all traits using dplyr and bar plots with error bars and grouping letters were generated using ggplot2. Correlation matrix scatterplot, principal component analysis (PCA) biplot were constructed using the ggpairs and fviz_pca function.
5. Conclusions
This study highlights the critical traits contributing to heat stress tolerance in tomato, offering valuable insights for breeding programs aimed at developing resilient varieties. Genotypes such as MG785-1, CLN1621L, exhibiting superior root system traits, enhanced photosynthetic efficiency, and sustained yields under stress conditions. Root traits like RDW and RSR played pivotal roles in water and nutrient uptake, while physiological traits like photosynthetic rate (A) and SPAD values supported carbon assimilation and leaf health. The heat-sensitive genotype CLN3961D demonstrated significant yield reductions, reinforcing the need to enhance stress adaptability. Correlation and PCA analyses revealed strong linkages between root, physiological, and yield traits under heat stress, emphasizing the importance of integrated traits for resilience. These findings provide a framework for developing climate-smart tomato varieties that can sustain productivity under rising temperatures.
Funding
The work was funded by the long-term strategic donors to the World Vegetable Center, Taiwan: UK aid from the UK Government, United States Agency for International Development (USAID), Australian Centre for International Agricultural Research (ACIAR), Germany, Thailand, Philippines, Korea, and Japan.
Data Availability Statement
We encourage all authors of articles published in MDPI journals to share their research data. In this section, please provide details regarding where data supporting reported results can be found, including links to publicly archived datasets analyzed or generated during the study. Where no new data were created, or where data is unavailable due to privacy or ethical restrictions, a statement is still required. Suggested Data Availability Statements are available in section “MDPI Research Data Policies” at https://www.mdpi.com/ethics.
Acknowledgments
We would like to express our gratitude to the World Vegetable Center, Shanhua, Taiwan, for providing the resources and facilities essential for conducting this research. Our sincere appreciation goes to all the technical staff and team members who contributed to the experimental setup and data collection. Special thanks are extended to our colleagues for their insightful discussions and constructive feedback during the preparation of this manuscript. Finally, we acknowledge the funding sources and administrative support that made this work possible. Your contributions are invaluable in advancing our understanding of heat stress resilience in tomato.
Conflicts of Interest
The authors declare no conflicts of interest.
References
- Klee, H.J.; Tieman, D.M. The genetics of fruit flavour preferences. Nat Rev Genet 2018, 19, 347–356. [Google Scholar] [CrossRef]
- FAO. Food and Agriculture Organization of the United Nations. FAOSTAT statistical database [Internet] 2022.
- IPCC. Climate Change 2021: The Physical Science Basis. Contribution of Working Group I to the Sixth Assessment Report of the Intergovernmental Panel on Climate Change. IPCC 2021.
- J, Y.; T, Z.; D, Y.; S, S. Physiological and Molecular Biology of High Temperature Stress in Plants. Annals of Agricultural & Crop Sciences 2021, 6. [CrossRef]
- Barnabas, B.; Jager, K.; Feher, A. The effect of drought and heat stress on reproductive processes in cereals. Plant Cell Environ 2008, 31, 11–38. [Google Scholar] [CrossRef]
- Awasthi, R.; Kaushal, N.; Vadez, V.; Turner, N.C.; Berger, J.; Siddique, K.H.M.; Nayyar, H. Individual and combined effects of transient drought and heat stress on carbon assimilation and seed filling in chickpea. Funct Plant Biol 2014, 41, 1148–1167. [Google Scholar] [CrossRef]
- Alsamir, M.; Ahmad, N.M.; Keitel, C.; Mahmood, T.; Trethowan, R. Identification of High-Temperature Tolerant and Agronomically Viable Tomato (S. lycopersicum) Genotypes from a Diverse Germplasm Collection. Advances in Crop Science and Technology 2017, 05. [Google Scholar] [CrossRef]
- Ayankojo, I.T.; Morgan, K.T. Increasing Air Temperatures and Its Effects on Growth and Productivity of Tomato in South Florida. Plants (Basel) 2020, 9, 1245. [Google Scholar] [CrossRef] [PubMed]
- Alsamir, M.; Mahmood, T.; Trethowan, R.; Ahmad, N. An overview of heat stress in tomato (Solanum lycopersicum L.). Saudi J Biol Sci 2021, 28, 1654–1663. [Google Scholar] [CrossRef] [PubMed]
- Laxman, R.; Srinivasa, R.; Bhatt, R.; Sadashiva, A.; Sunoj, V.J.; Geeta, B.; Pavithra, C.; Manasa, K.; Dhanyalakshmi, K.J.J.A. Response of tomato (Lycopersicon esculentum Mill. ) genotypes to elevated temperature. 2013, 1, 1–10. [Google Scholar]
- Sato, S.; Peet, M.M.; Thomas, J.F. Physiological factors limit fruit set of tomato (Lycopersicon esculentum Mill.) under chronic, mild heat stress. Plant, Cell & Environment 2001, 23, 719–726. [Google Scholar] [CrossRef]
- Bita, C.E.; Gerats, T. Plant tolerance to high temperature in a changing environment: scientific fundamentals and production of heat stress-tolerant crops. Front Plant Sci 2013, 4, 273. [Google Scholar] [CrossRef]
- Chaves, M.M.; Flexas, J.; Pinheiro, C. Photosynthesis under drought and salt stress: regulation mechanisms from whole plant to cell. Ann Bot 2009, 103, 551–560. [Google Scholar] [CrossRef]
- Wang, X.; Altaf, M.A.; Hao, Y.; Wang, Z.; Zhu, G. Effect of Heat Stress on Root Architecture, Photosynthesis, and Antioxidant Profile of Water Spinach (Ipomoea aquatica Forsk) Seedlings. Horticulturae 2023, 9, 923. [Google Scholar] [CrossRef]
- Dash, G.K.; Purkaystha, S.; Sahoo, S.K.; Kumar, A.; Jena, J.; Nayak, L.; Lal, P.; Kumar, R.; Tiwari, R.K.; Lal, M.K. Redesigning Root Architecture for Improved Performance of Plants Under Stress. In New Frontiers in Plant-Environment Interactions: Innovative Technologies and Developments; Springer: 2023; pp. 515-534.
- Graci, S.; Barone, A. Tomato plant response to heat stress: a focus on candidate genes for yield-related traits. Front Plant Sci 2023, 14, 1245661. [Google Scholar] [CrossRef] [PubMed]
- Berova, M.; Stoeva, N.; Zlatev, Z.; Ganeva, D.J.J.o.C.E.A. Physiological response of some tomato genotypes (Lycopersicon esculentum L.) to high temperature stress. 2008, 9, 723–732. [Google Scholar] [CrossRef]
- Hossain, M.L.; Li, J. NDVI-based vegetation dynamics and its resistance and resilience to different intensities of climatic events. Global Ecology and Conservation 2021, 30, e01768. [Google Scholar] [CrossRef]
- Zhou, R.; Yu, X.; Kjær, K.H.; Rosenqvist, E.; Ottosen, C.-O.; Wu, Z. Screening and validation of tomato genotypes under heat stress using Fv/Fm to reveal the physiological mechanism of heat tolerance. Environmental and Experimental Botany 2015, 118, 1–11. [Google Scholar] [CrossRef]
- Bhattarai, S.; Harvey, J.T.; Lee, C.; Joshi, V.; Leskovar, D.I. Assessment of physiological and biochemical thermotolerance traits in tomato genotypes. Scientia Horticulturae 2024, 324, 112561. [Google Scholar] [CrossRef]
- Zhao, J.; Lu, Z.; Wang, L.; Jin, B. Plant Responses to Heat Stress: Physiology, Transcription, Noncoding RNAs, and Epigenetics. Int J Mol Sci 2020, 22, 117. [Google Scholar] [CrossRef]
- Dasgan, H.Y.; Dere, S.; Akhoundnejad, Y.; Arpaci, B.B.; Durazzo, A. Effects of High-Temperature Stress during Plant Cultivation on Tomato (Solanum lycopersicum L.) Fruit Nutrient Content. Journal of Food Quality 2021, 2021, 1–15. [Google Scholar] [CrossRef]
- Egea, I.; Estrada, Y.; Flores, F.B.; Bolarín, M.C. Improving production and fruit quality of tomato under abiotic stress: Genes for the future of tomato breeding for a sustainable agriculture. Environmental and Experimental Botany 2022, 204, 105086. [Google Scholar] [CrossRef]
- Sato, S.; Peet, M.M.; Thomas, J.F. Determining critical pre- and post-anthesis periods and physiological processes in Lycopersicon esculentum Mill. exposed to moderately elevated temperatures. J Exp Bot 2002, 53, 1187–1195. [Google Scholar] [CrossRef] [PubMed]
- Francesca, S.; Vitale, L.; Graci, S.; Addonizio, M.; Barone, A.; Rigano, M.J.P.S. Integrated physiological and genetic data reveal key-traits for heat tolerance in tomato. 2024, 13, 100555.
- Kleyer, M.; Trinogga, J.; Cebrián-Piqueras, M.A.; Trenkamp, A.; Fløjgaard, C.; Ejrnæs, R.; Bouma, T.J.; Minden, V.; Maier, M.; Mantilla-Contreras, J.J.J.o.E. Trait correlation network analysis identifies biomass allocation traits and stem specific length as hub traits in herbaceous perennial plants. 2019, 107, 829-842.
- Li, H.; Testerink, C.; Zhang, Y.J.T.i.p.s. How roots and shoots communicate through stressful times. 2021, 26, 940-952.
- Kostidis, G.; Karabourniotis, G.J.D.P. The intraspecific trade-off between photosynthesis and phenolics in selected crop species: A meta-analysis study. 2024, 1, 29.
- Sharma, P.; Sareen, S.; Saini, M.J.P.G.R. Assessing genetic variation for heat stress tolerance in Indian bread wheat genotypes using morpho-physiological traits and molecular markers. 2017, 15, 539-547.
- Mesa, T.; Polo, J.; Arabia, A.; Caselles, V.; Munné-Bosch, S.J.J.o.P.P. Differential physiological response to heat and cold stress of tomato plants and its implication on fruit quality. 2022, 268, 153581.
- Hasan, M.M.; Mia, M.A.B.; Ahmed, J.U.; Karim, M.A.; Islam, A.A.; Mohi-Ud-Din, M.J.H. Heat stress tolerance in wheat seedling: Clustering genotypes and identifying key traits using multivariate analysis. 2024, 10.
- Dhyani, K.; Ansari, M.W.; Rao, Y.R.; Verma, R.S.; Shukla, A.; Tuteja, N.J.P.s. ; behavior. Comparative physiological response of wheat genotypes under terminal heat stress. 2013, 8, e24564. [Google Scholar]
- Wahid, A.; Gelani, S.; Ashraf, M.; Foolad, M. Heat tolerance in plants: An overview. Environmental and Experimental Botany 2007, 61, 199–223. [Google Scholar] [CrossRef]
- Böhm, W.; Böhm, W.J.M.o.s.r.s. Techniques of root washing. 1979, 115-124. [CrossRef]
- Schneider, C.A.; Rasband, W.S.; Eliceiri, K.W. NIH Image to ImageJ: 25 years of image analysis. Nat Methods 2012, 9, 671–675. [Google Scholar] [CrossRef]
- Kadirimangalam, S.R.; Jadhav, Y.; Nagamadhuri, K.V.; Putta, L.; Murugesan, T.; Variath, M.T.; Vemula, A.K.; Manohar, S.S.; Chaudhari, S.; Choudhary, S.; et al. Genetic approaches for assessment of phosphorus use efficiency in groundnut (Arachis hypogaea L.). Sci Rep 2022, 12, 21552. [Google Scholar] [CrossRef]
- Team, R. RStudio: Integrated Development Environment for R. 2023.
Figure 1.
Temperature profiles during the experimental period for (a) Heat Stress Trial (mid-June to mid-August) and (b) Non-Stress Trial (mid-October to mid-December) under natural conditions in a plastic house.
Figure 1.
Temperature profiles during the experimental period for (a) Heat Stress Trial (mid-June to mid-August) and (b) Non-Stress Trial (mid-October to mid-December) under natural conditions in a plastic house.
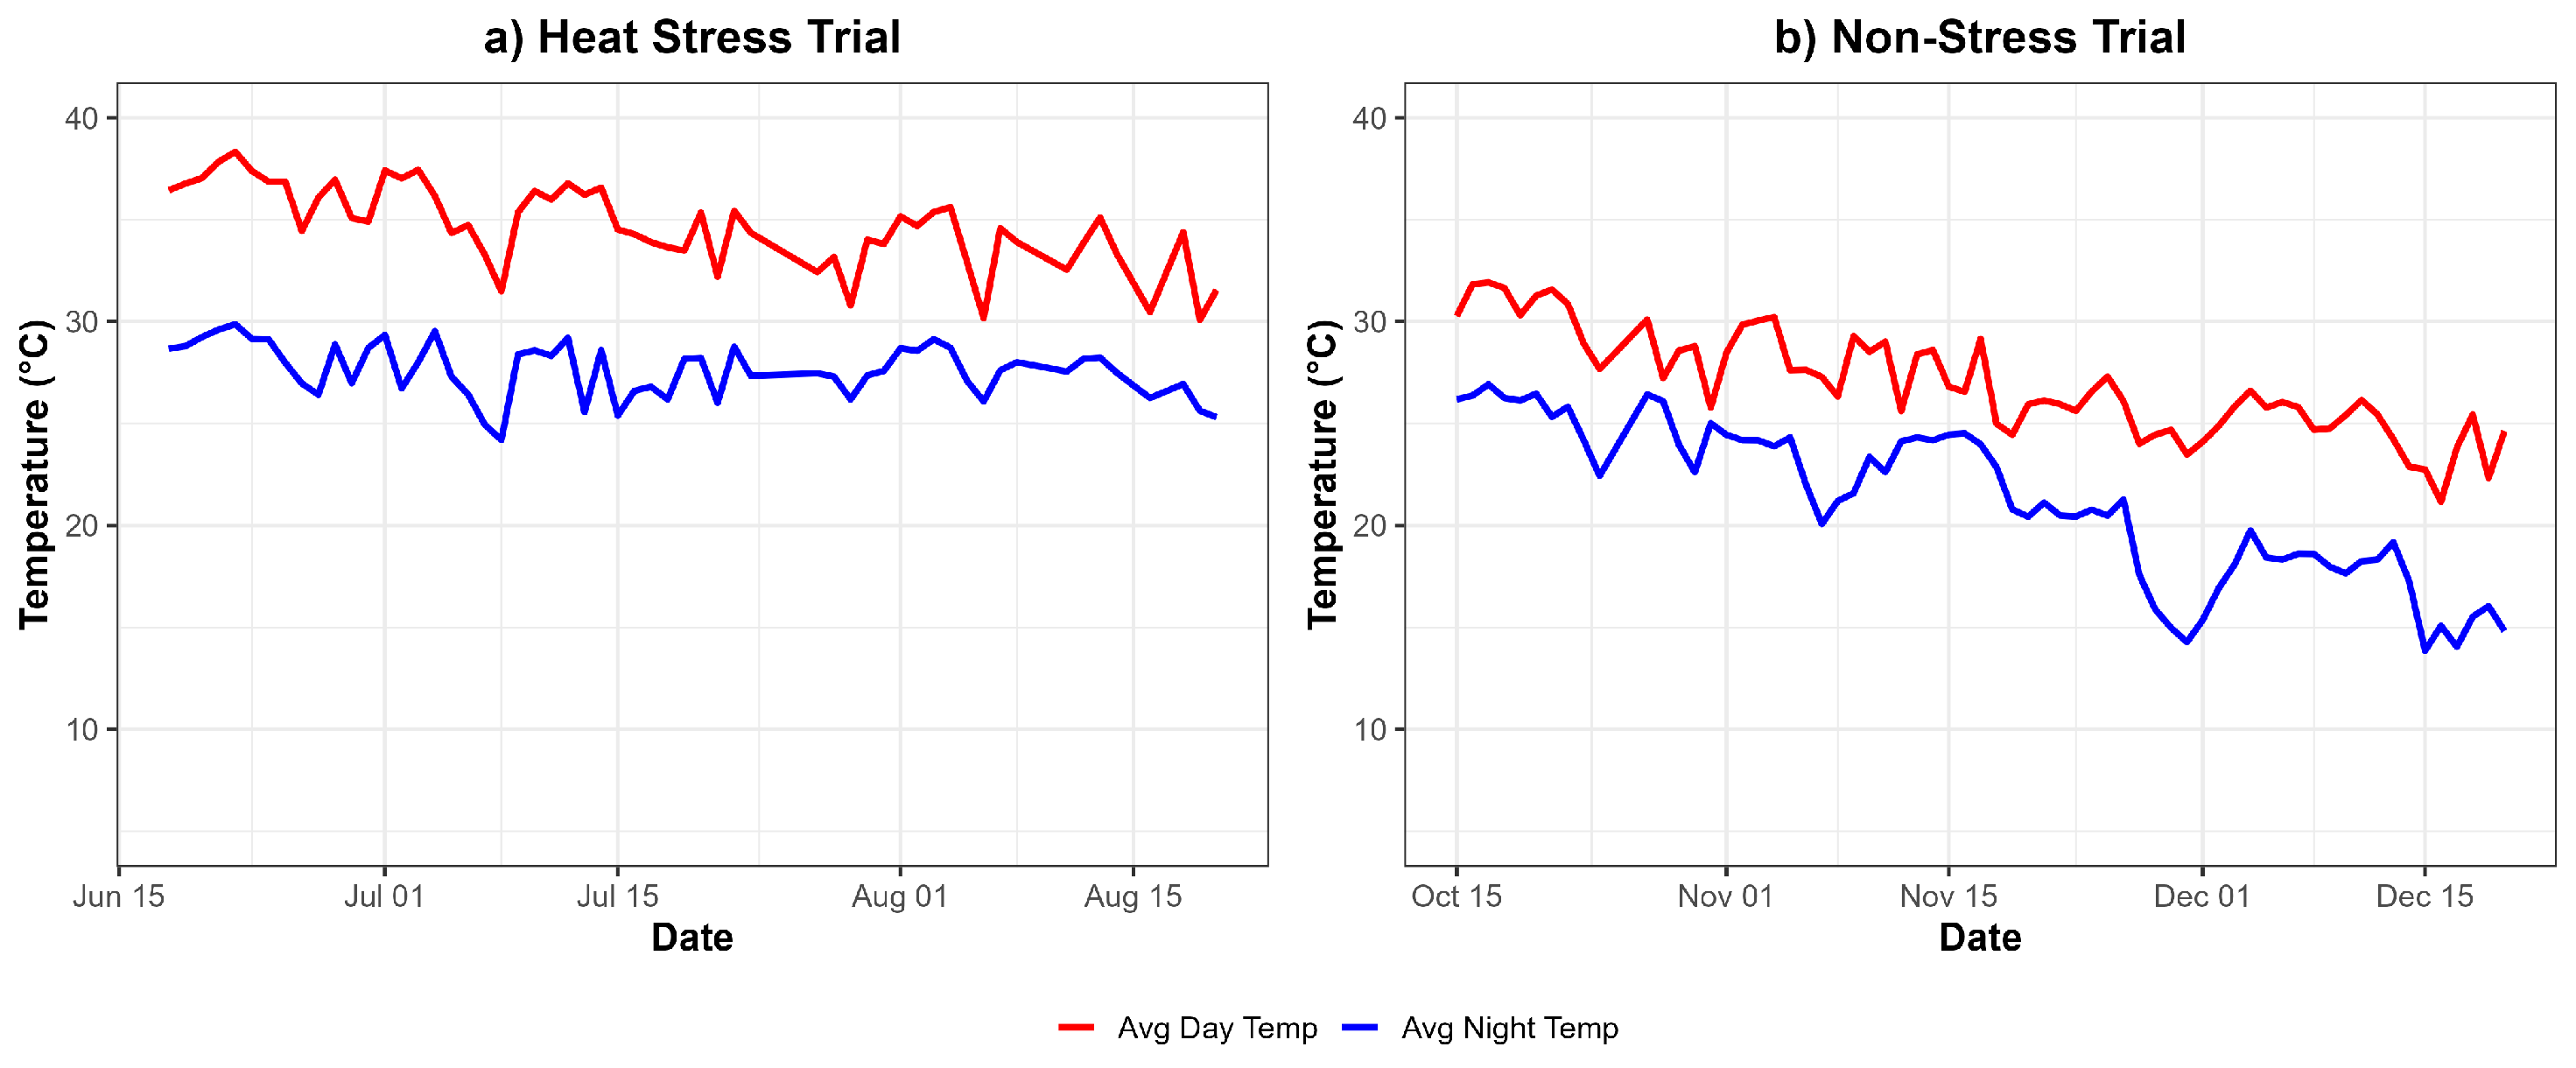
Figure 2.
Effects on morphological root traits of tomato genotypes under non-stress and heat stress conditions a) RL, b) RPA, c) RDW and d) RSR. Each bar represents the mean ± SE (n=3); Different letters above the bars represent statistical significance (p ≤ 0.05, LSD) and with the same letters indicating no significant difference between the genotypes.
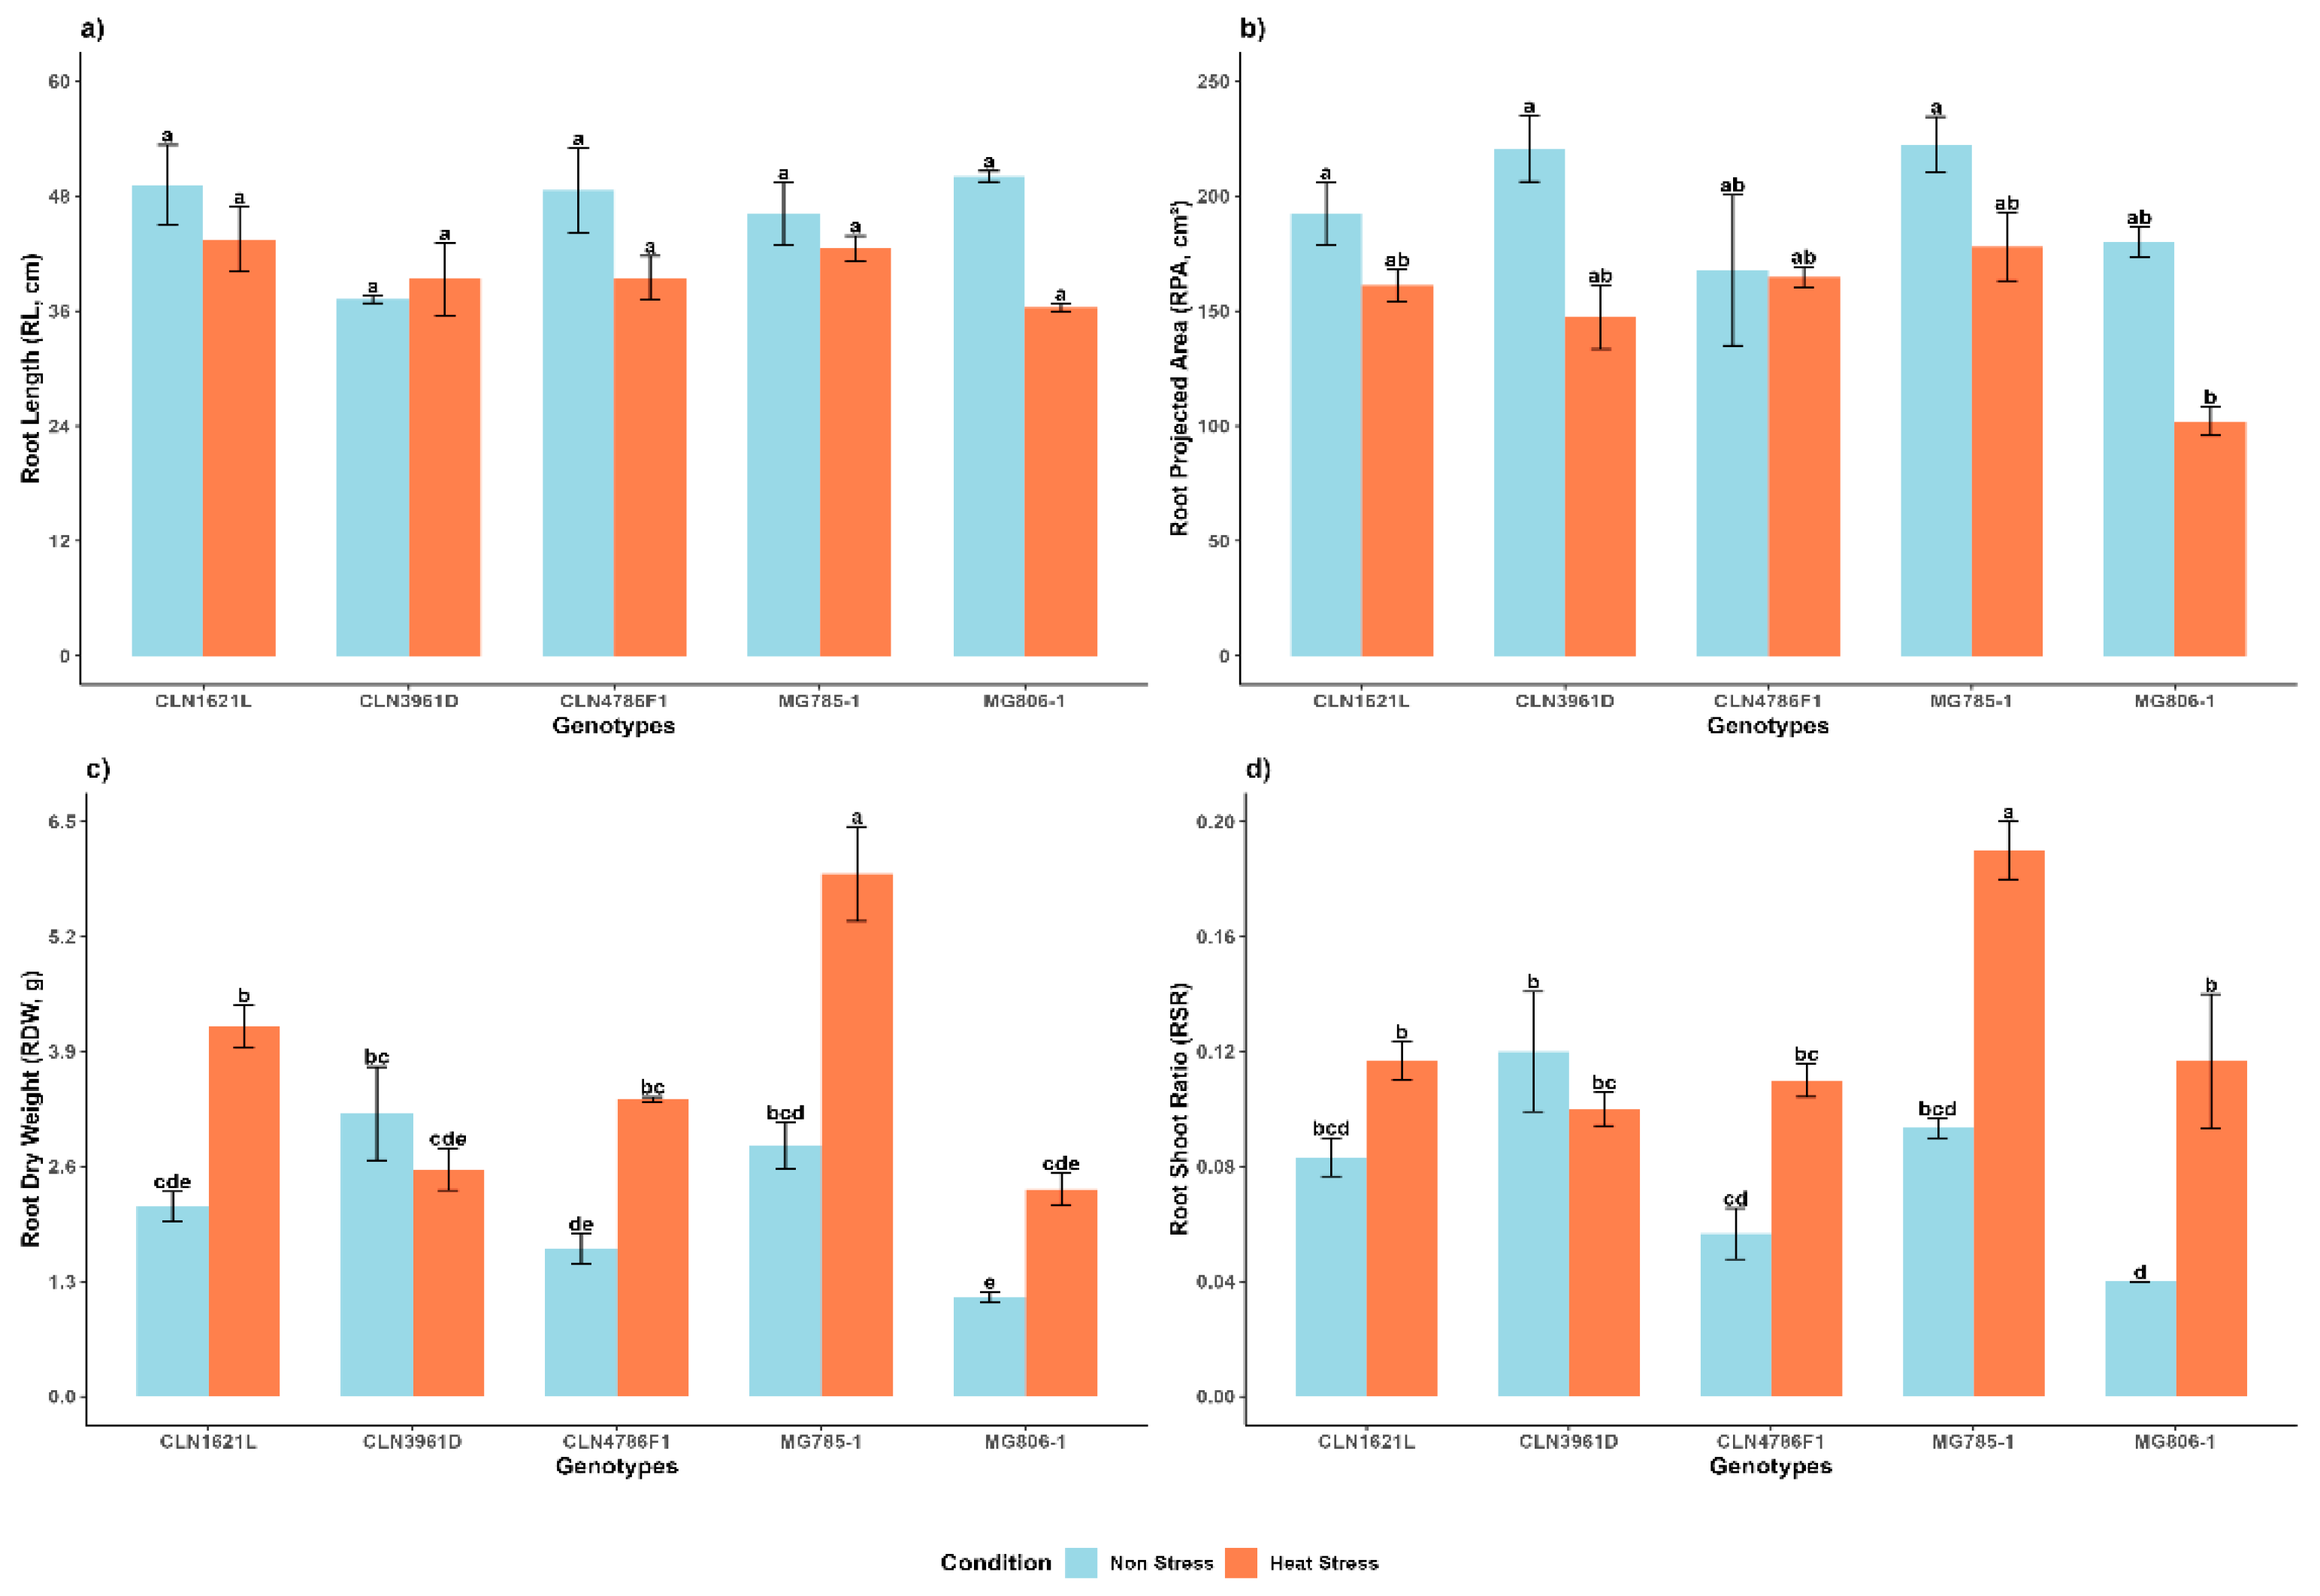
Figure 3.
Effects on morphological shoot traits of tomato genotypes under non-stress and heat stress conditions a) LA3D, b) GLI, c) SD, d) SDW, e) TFW and f) TDW. Each bar represents the mean value of the trait for a specific genotype and error bars indicate the standard error. Different letters above the bars represent statistical significance (p ≤ 0.05, Fisher’s LSD) and with the same letters indicating no significant difference between the genotypes.
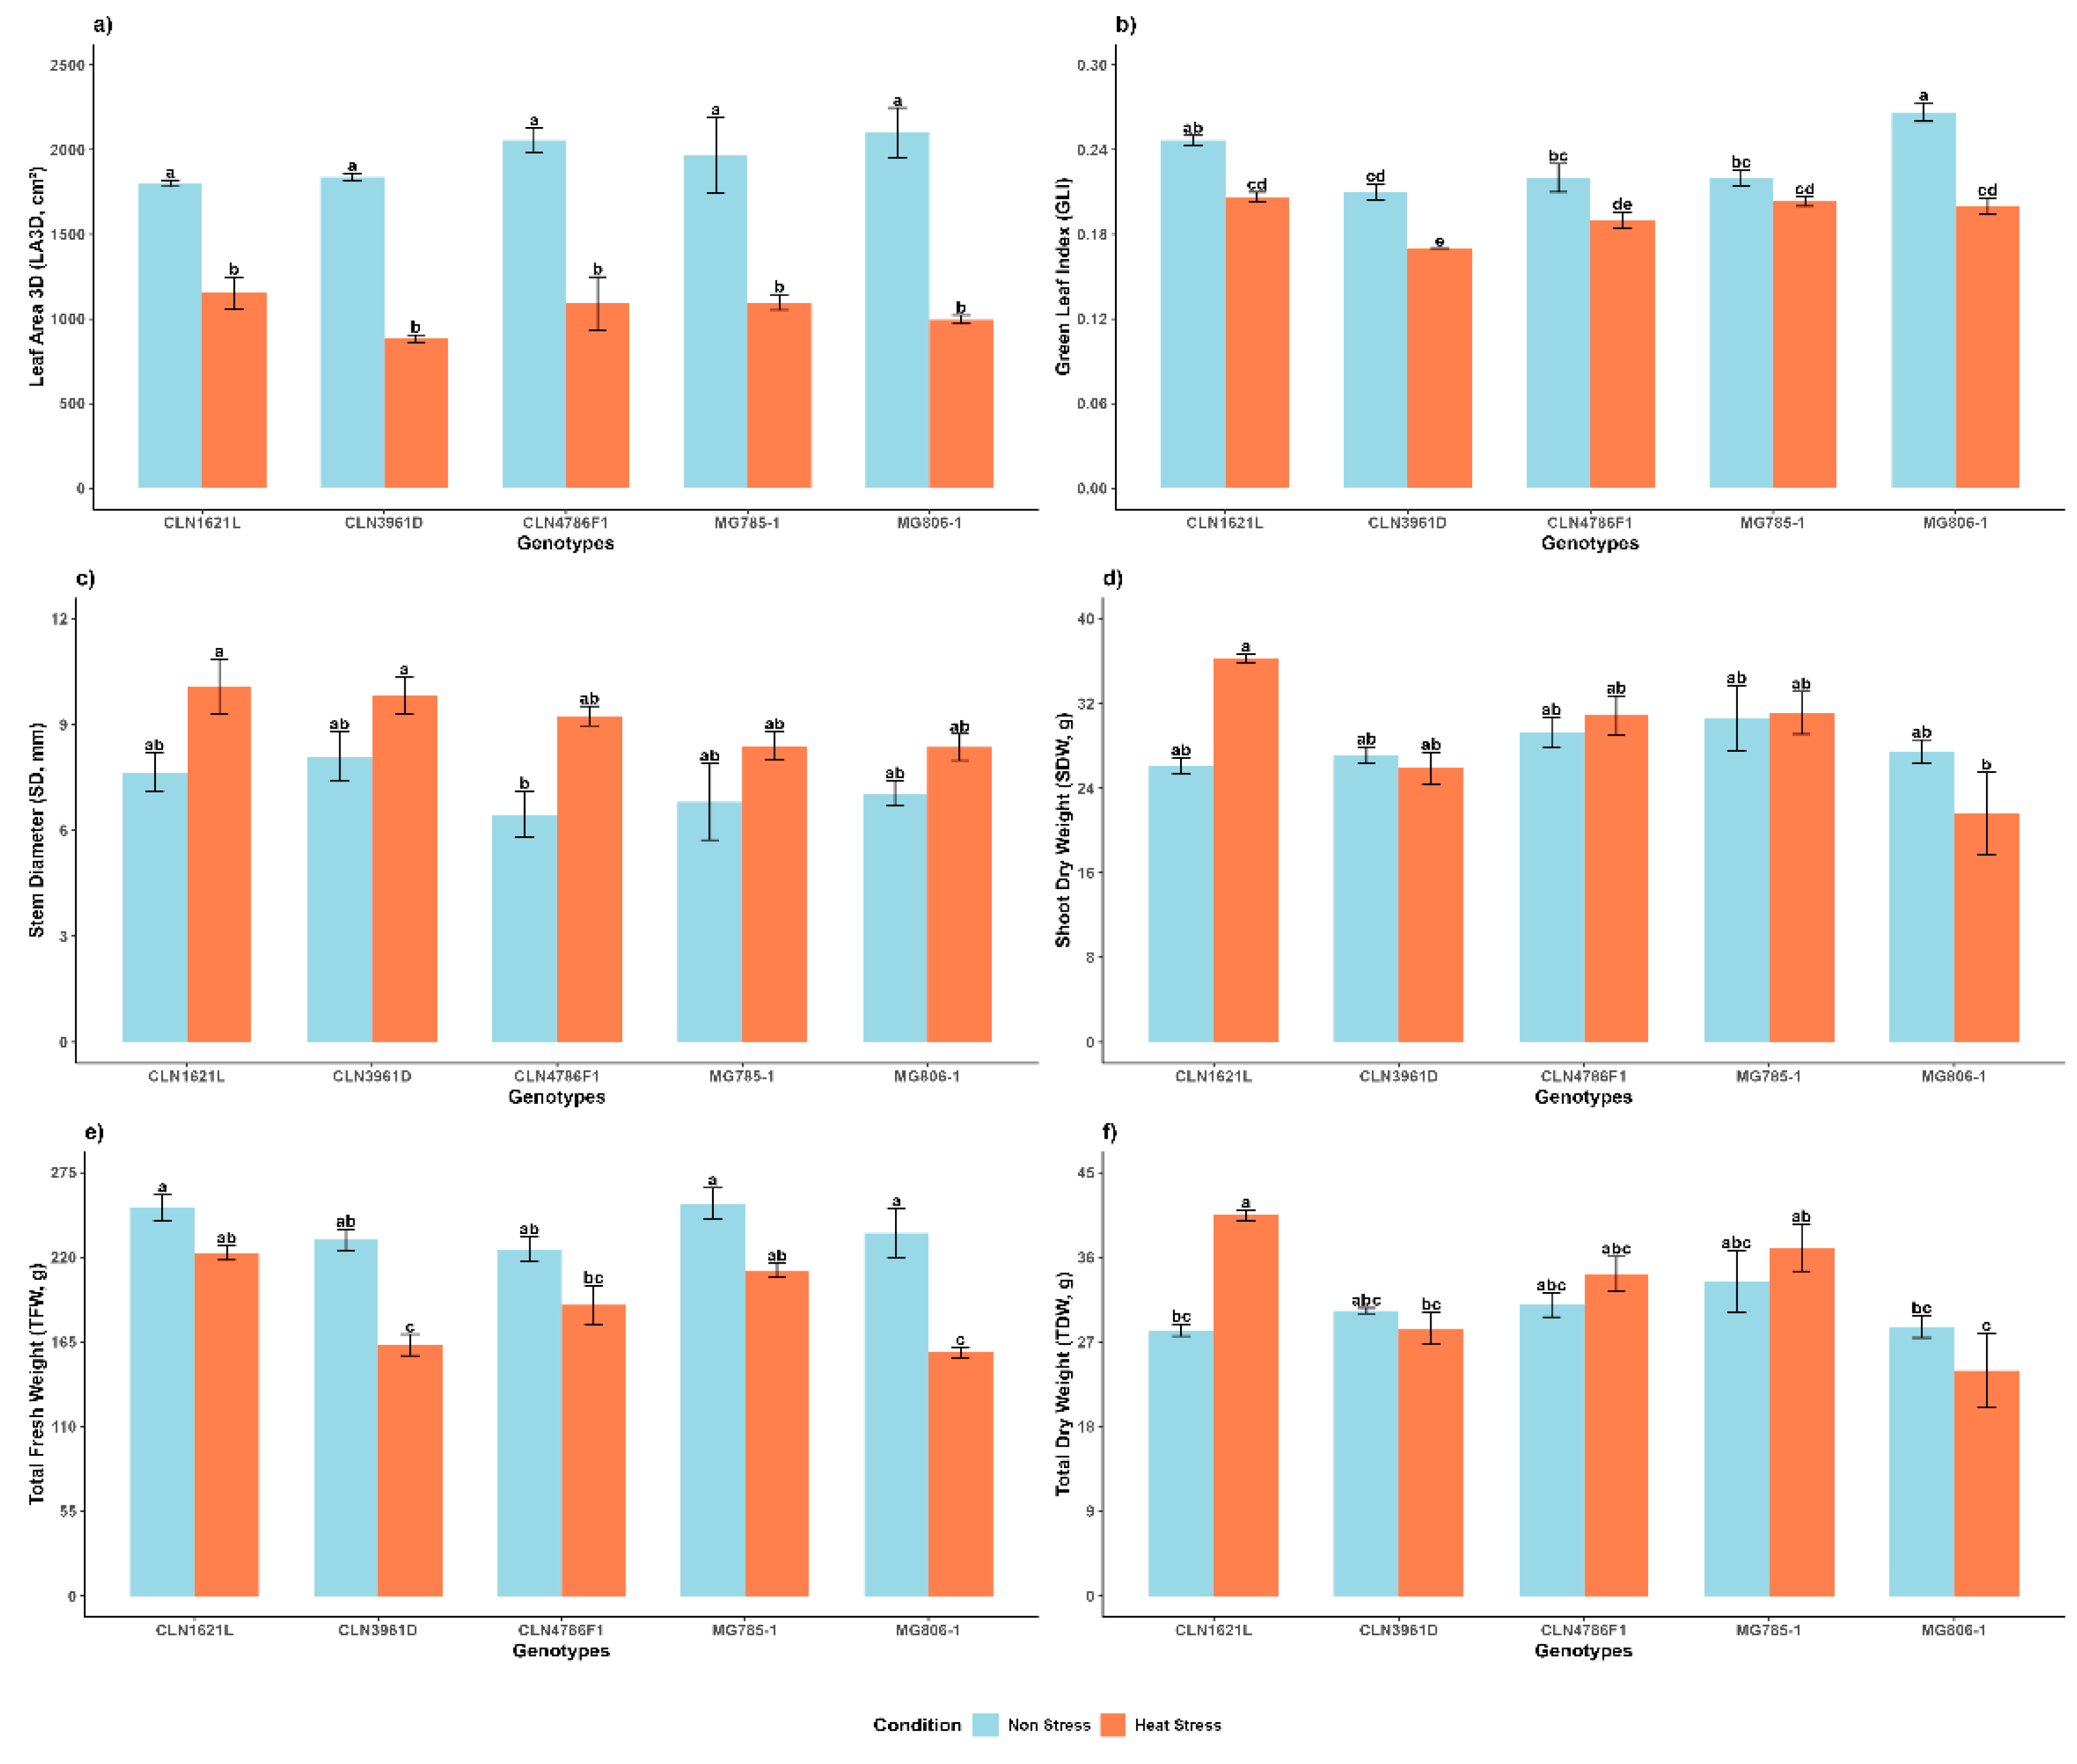
Figure 4.
Effects on physiological traits of tomato genotypes under non-stress and heat stress conditions a) Photosynthetic rate (A), b) transpiration rate (E), c) stomatal conductance (Gs) and d) SPAD under heat stress in tomato genotypes. Each bar represents the mean value of the trait for a specific genotype and error bars indicate the standard error. Different letters above the bars represent statistical significance (p ≤ 0.05, Fishers LSD) and with the same letters indicating no significant difference between the genotypes.
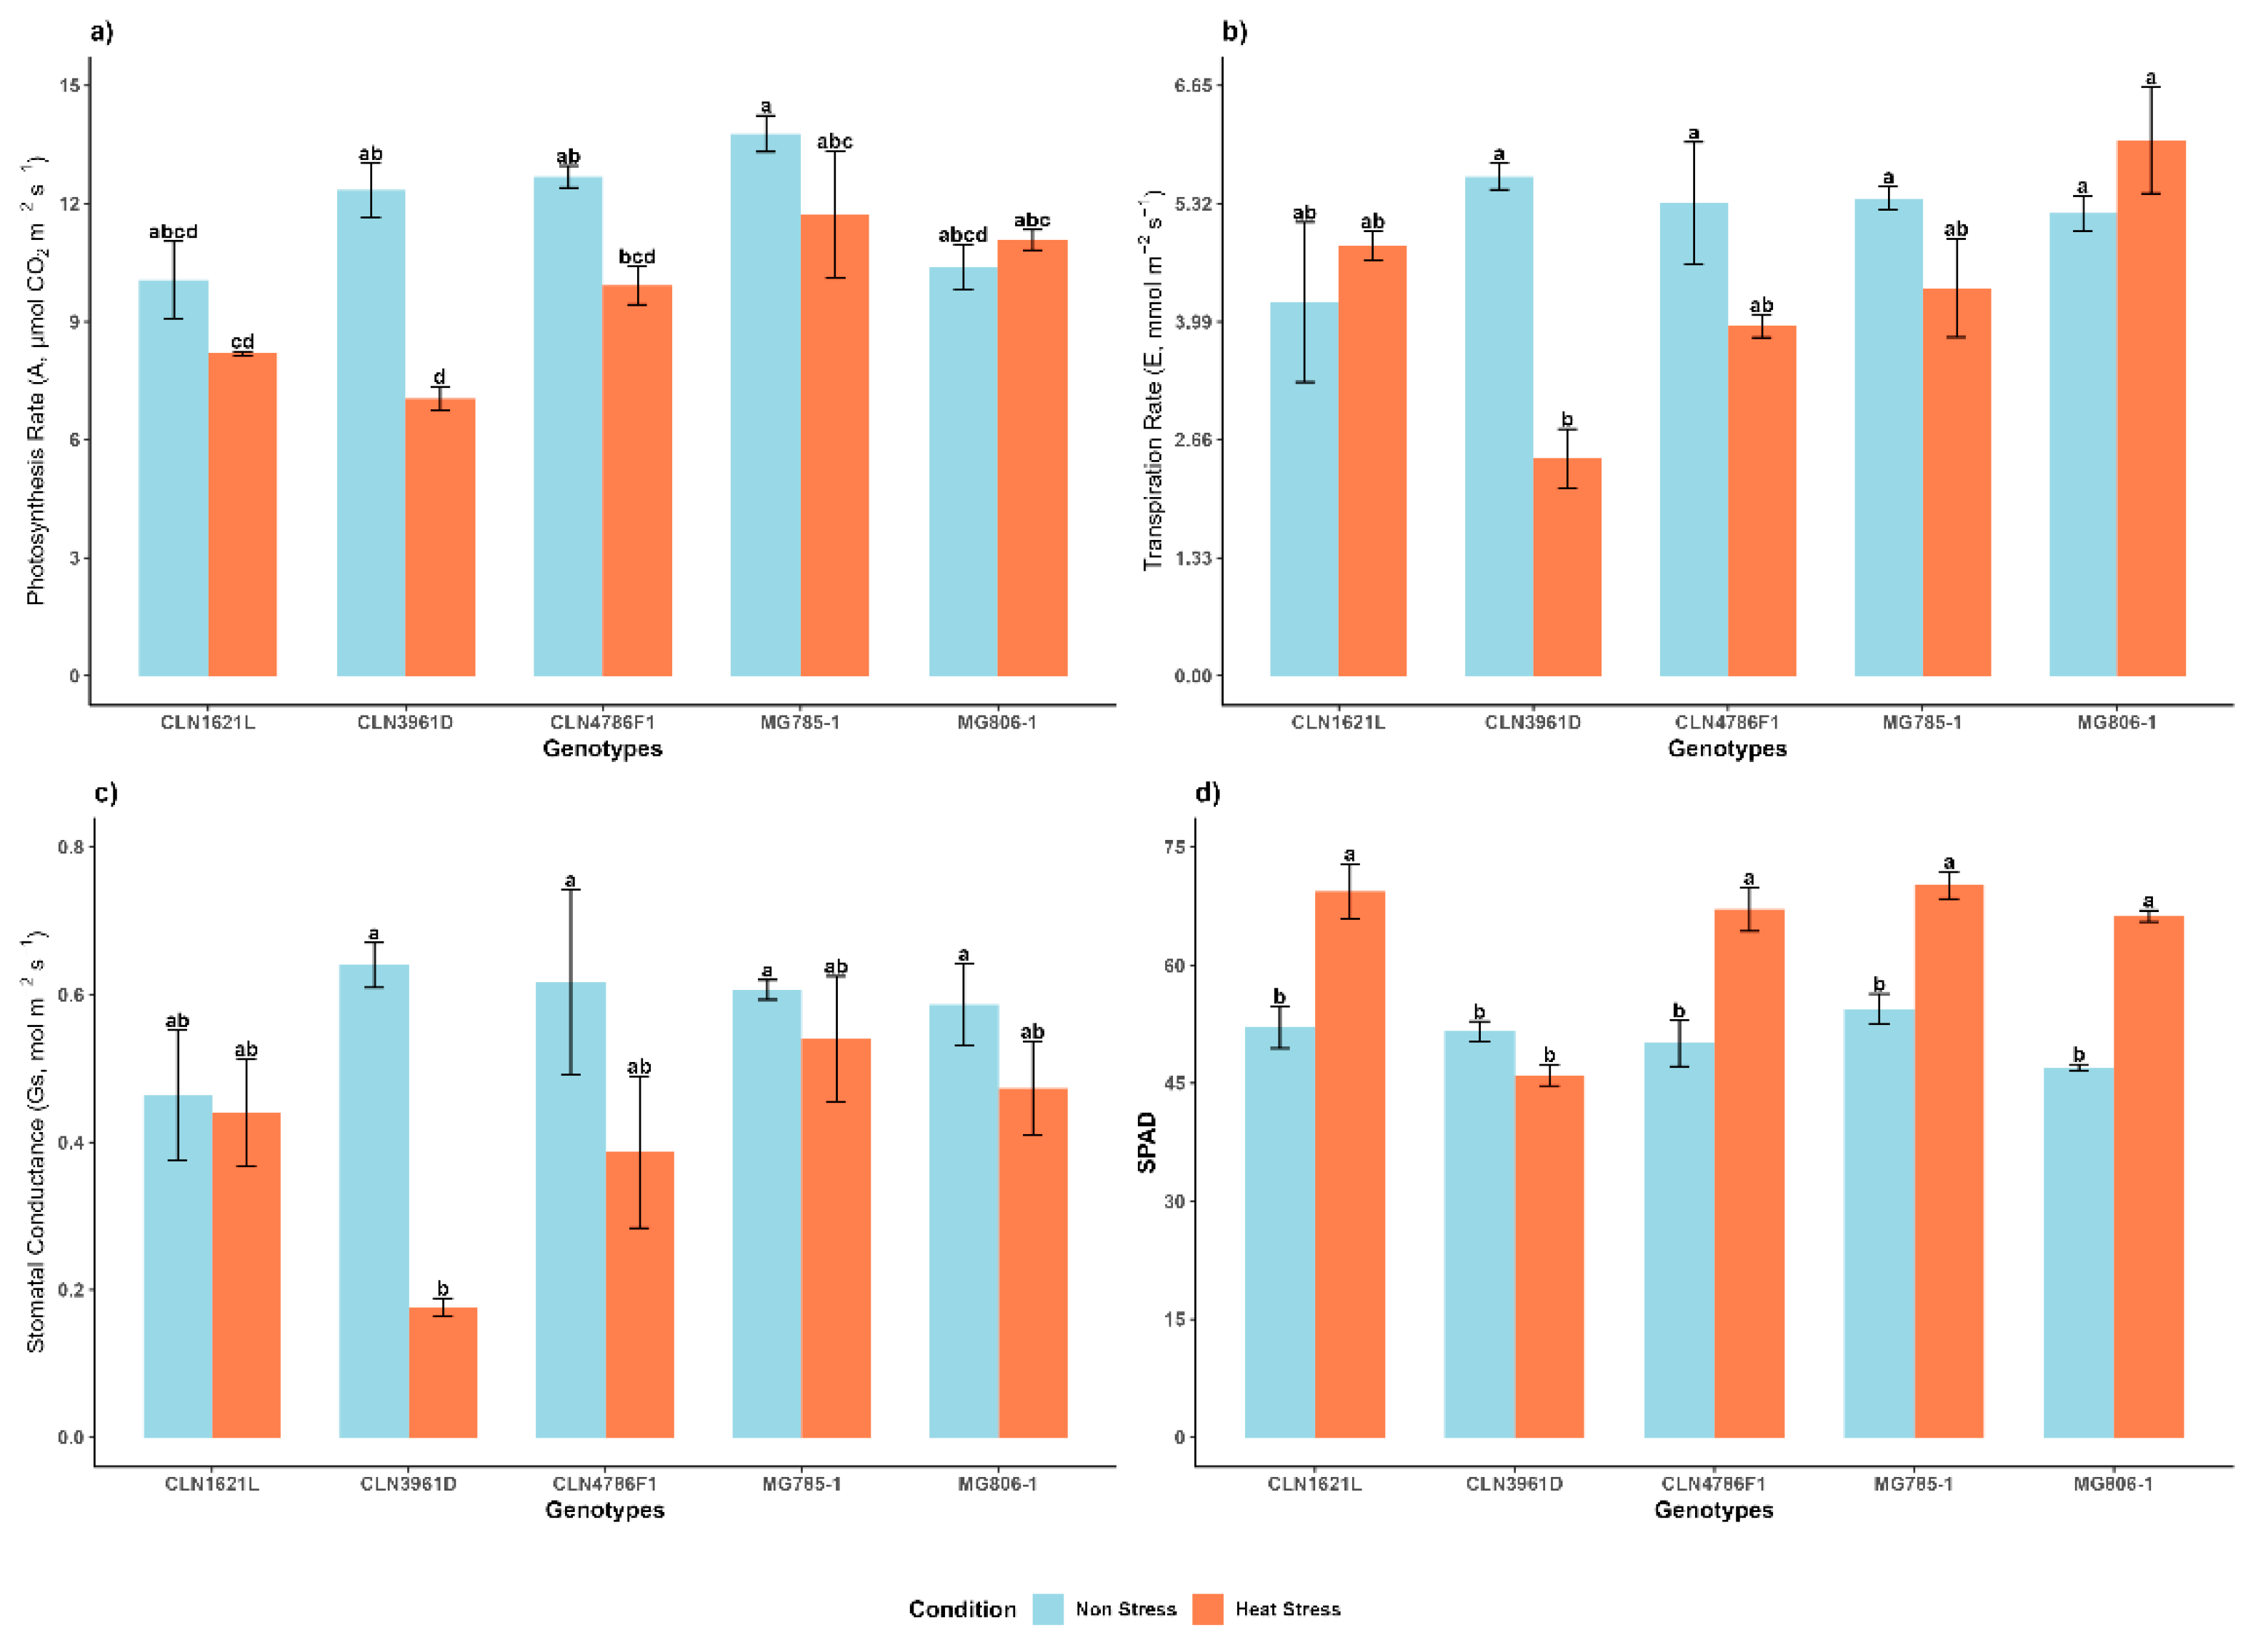
Figure 5.
Yield trait measurements of tomato genotypes under non-stress and heat stress a) Number of fruits per plant (NF) b) Yield (Y) and c) Harvest index (HI). Each bar represents the mean value of the trait for a specific genotype and error bars indicate the standard error. Different letters above the bars represent statistical significance (p ≤ 0.05, Fishers LSD) and with the same letters indicating no significant difference between the genotypes.
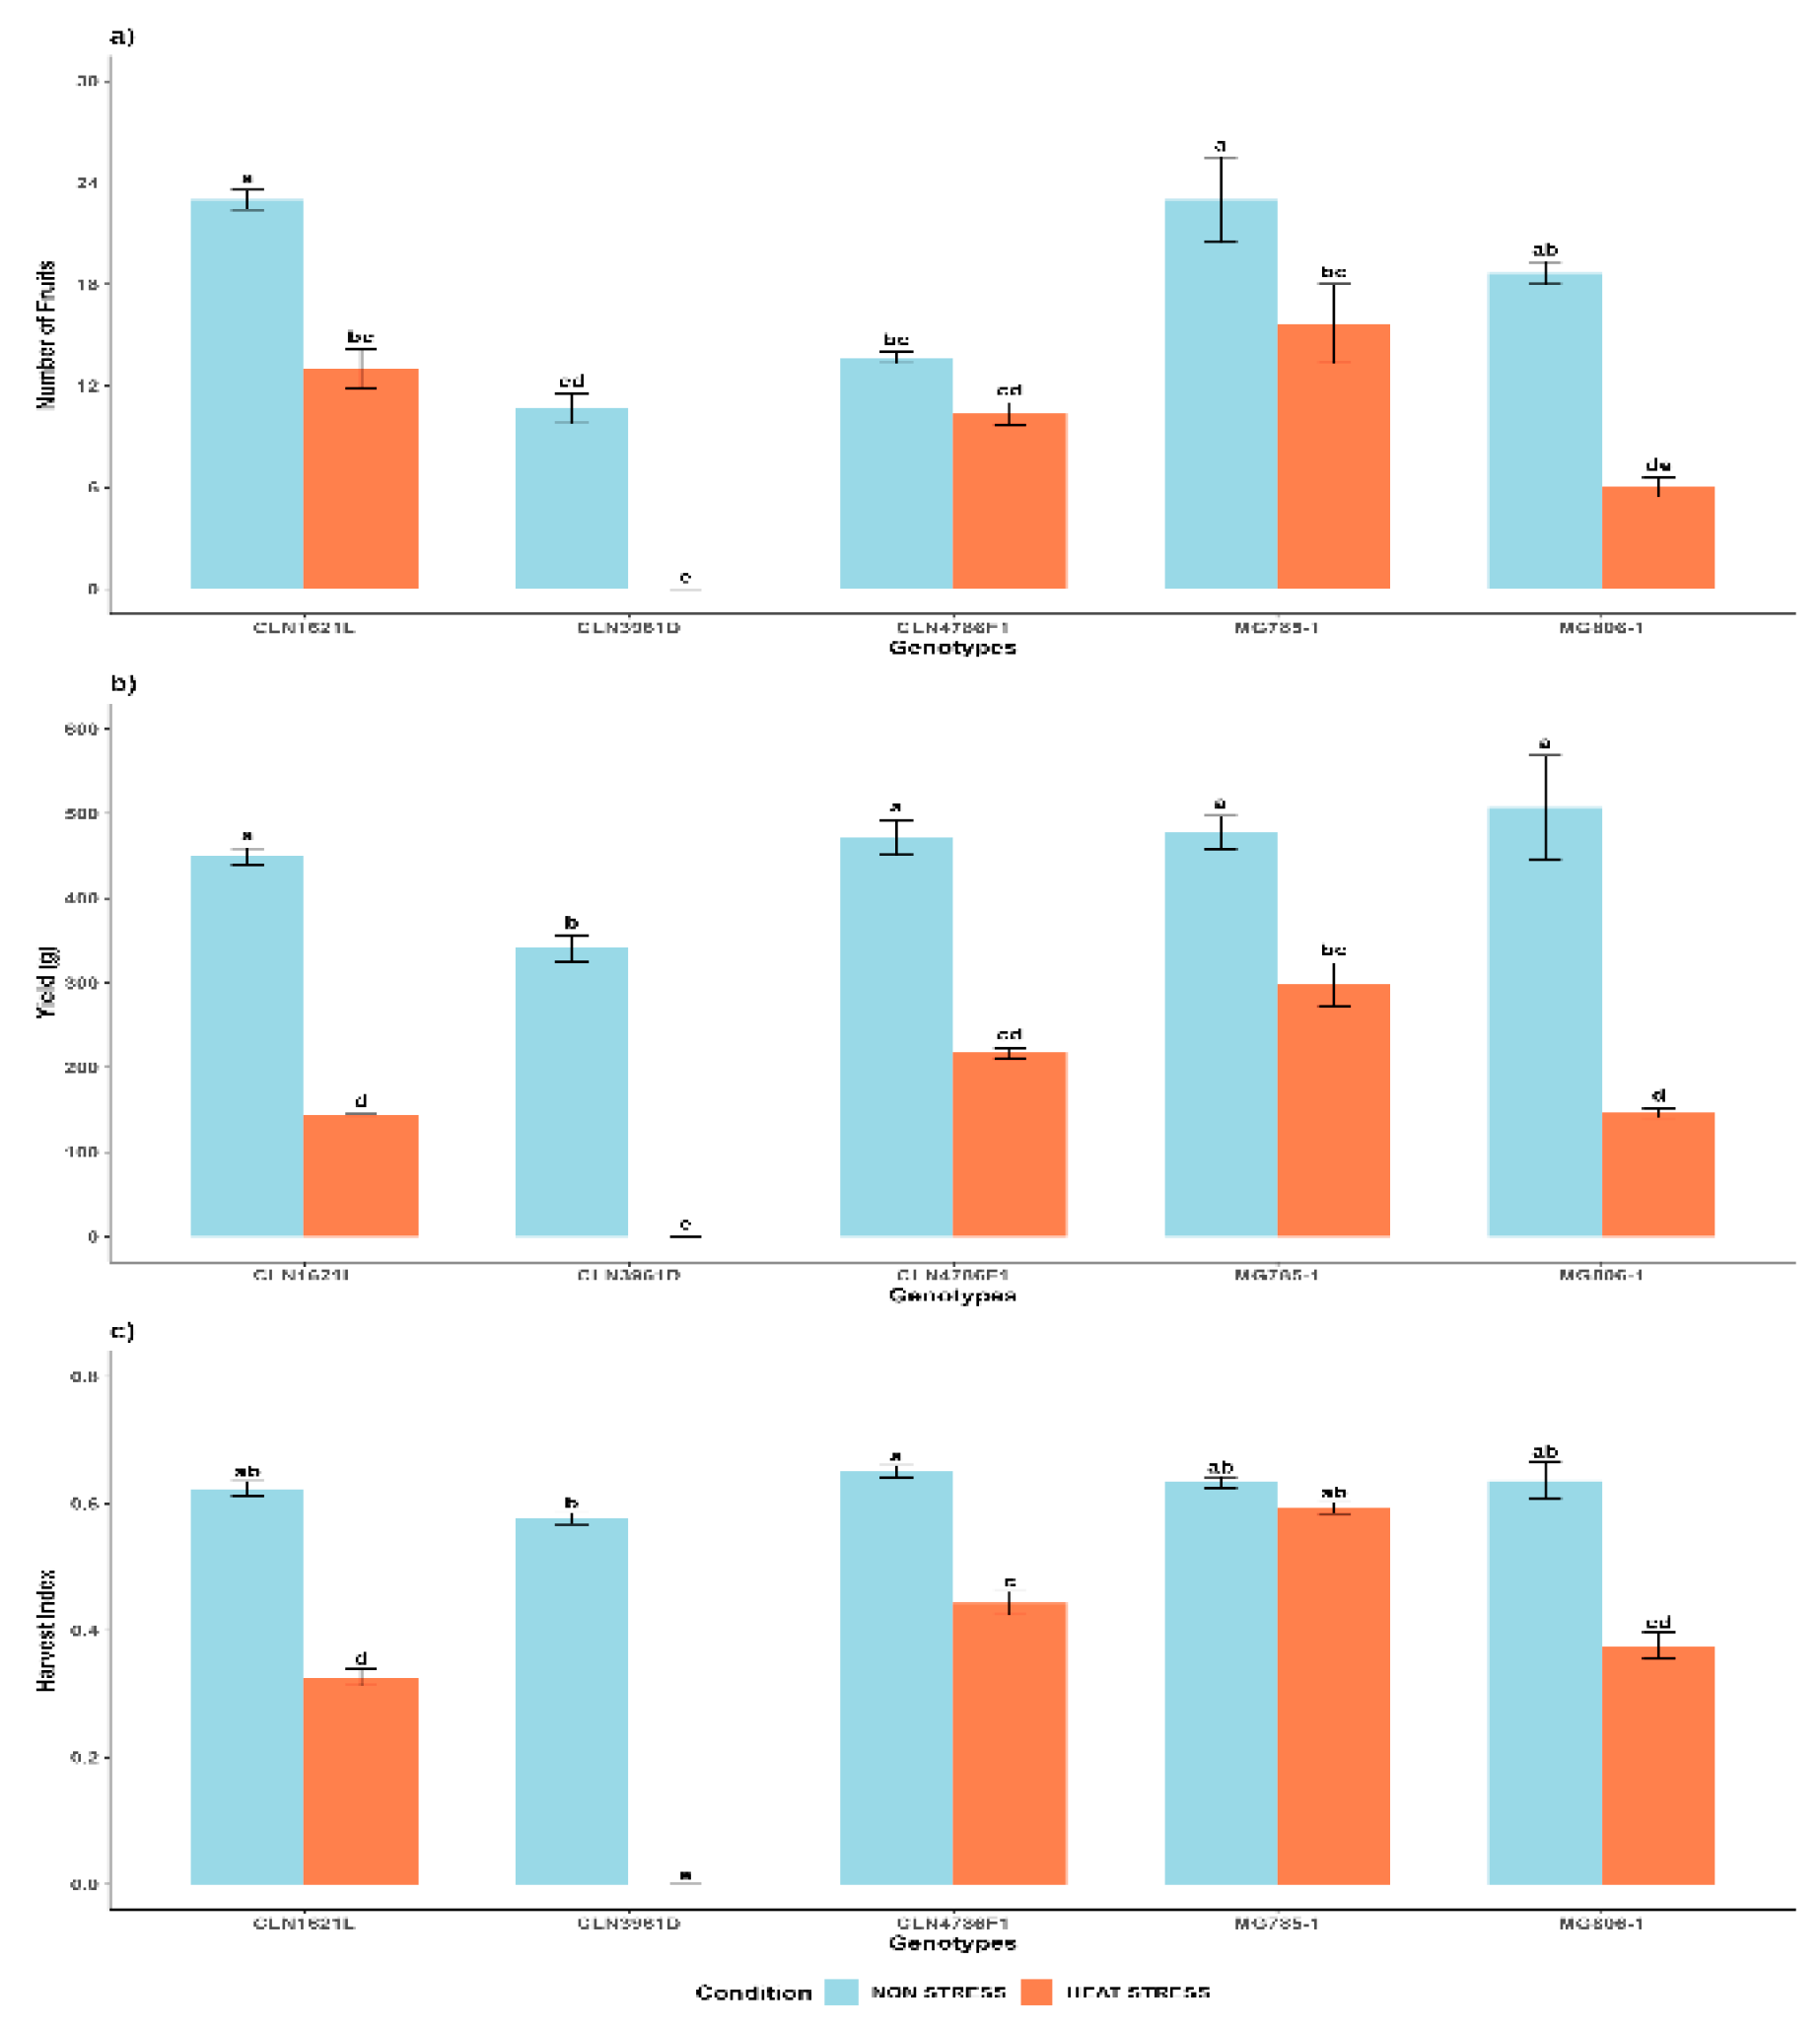
Figure 6.
Scatterplot and correlation matrix of tomato traits under (a) Non-Stress and (b) Heat Stress conditions. Green and red boxes show positive and negative correlations, with color intensity reflecting correlation strength. Scatterplots in the lower triangle highlight trait relationships, while density plots on the diagonal show data distribution. *, **, and *** represent significance at 5%, 1%, and 0.1%, respectively. SD = Stem diameter , SPAD = Soil plant analysis development , SFW = Shoot fresh weight, SDW = Shoot dry weight, RL = Root length, RPA = Root projected area, RFW = Root fresh weight, RDW = Root dry weight , RSR = Root Shoot Ratio, TFW = Total fresh weight, TDW = Total dry weight , A = Photosynthetic rate, E = Transpiration rate , Gs = Stomatal conductance, LA3D = 3D Leaf area, GLI = Green leaf index, NF = Number of fruits, Y = Yield and HI = Harvest Index.
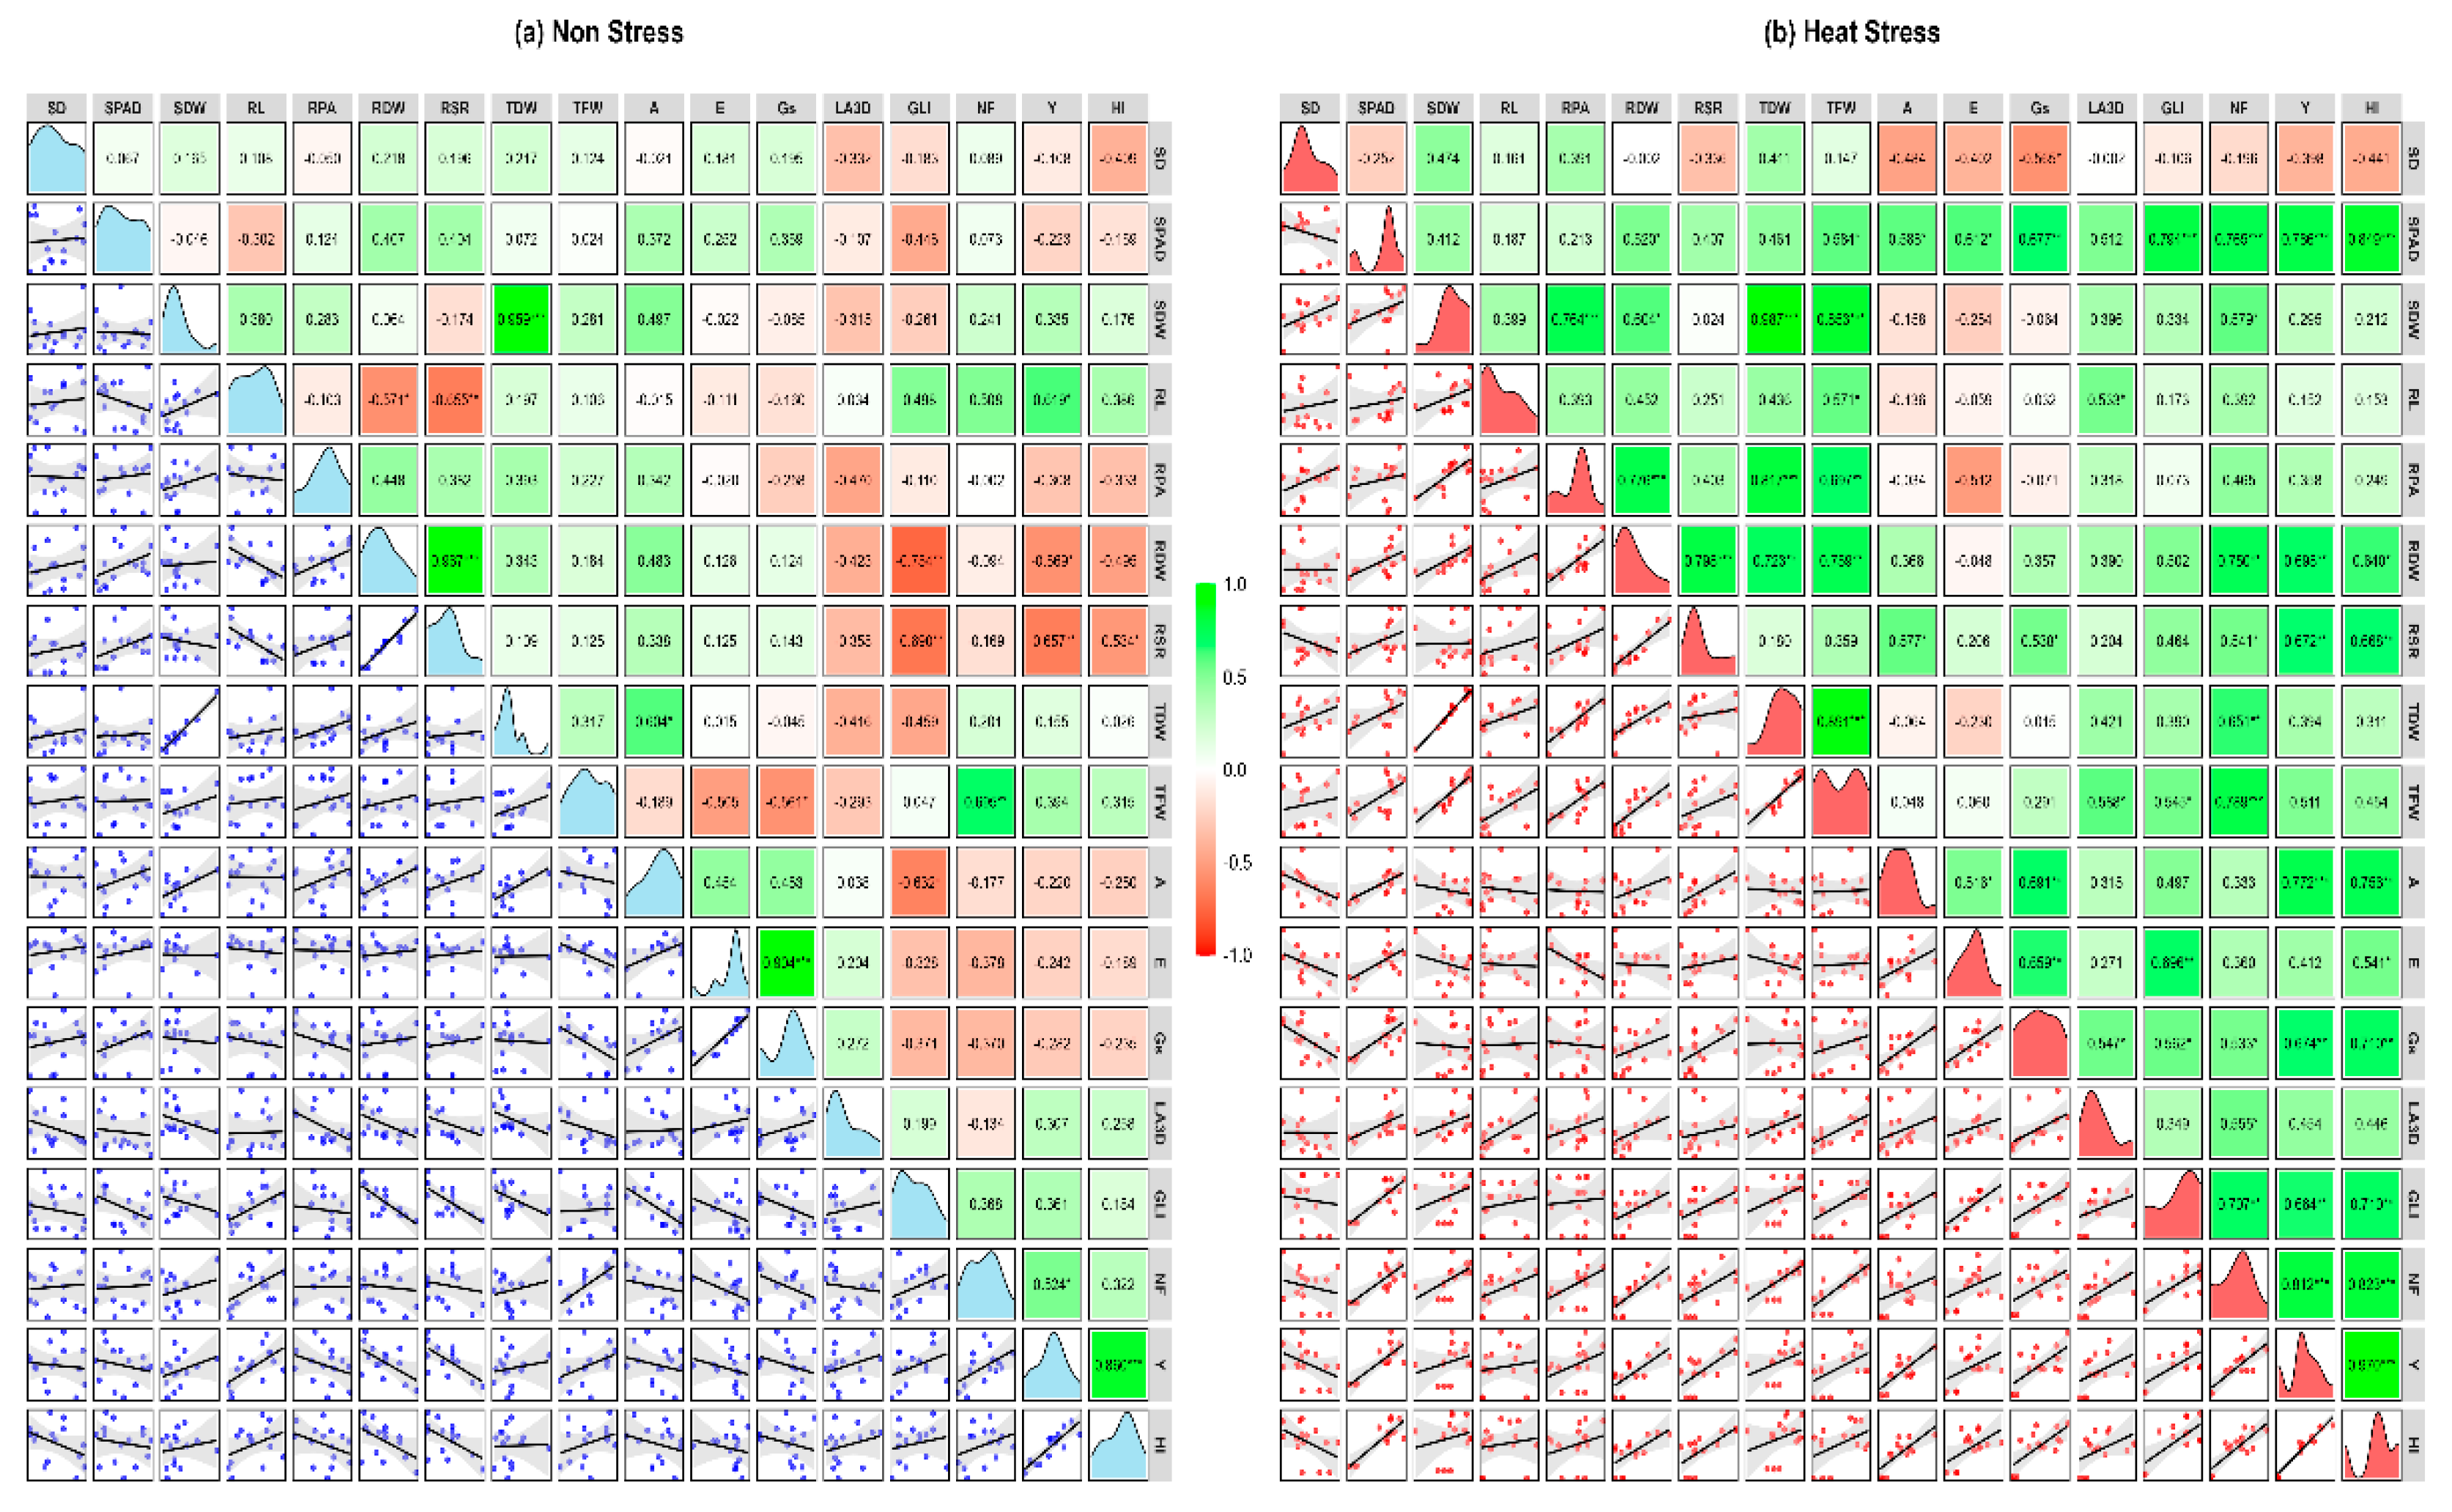
Figure 7.
Principal Component Analysis (PCA) biplots showing the contributions of traits and the clustering of treatments and genotypes under non-stress and heat stress conditions. (a) PCA biplot illustrating the separation of treatments under non-stress and heat stress conditions based on principal components. (b) PCA biplot grouping genotypes according to their responses to non-stress and heat stress conditions.
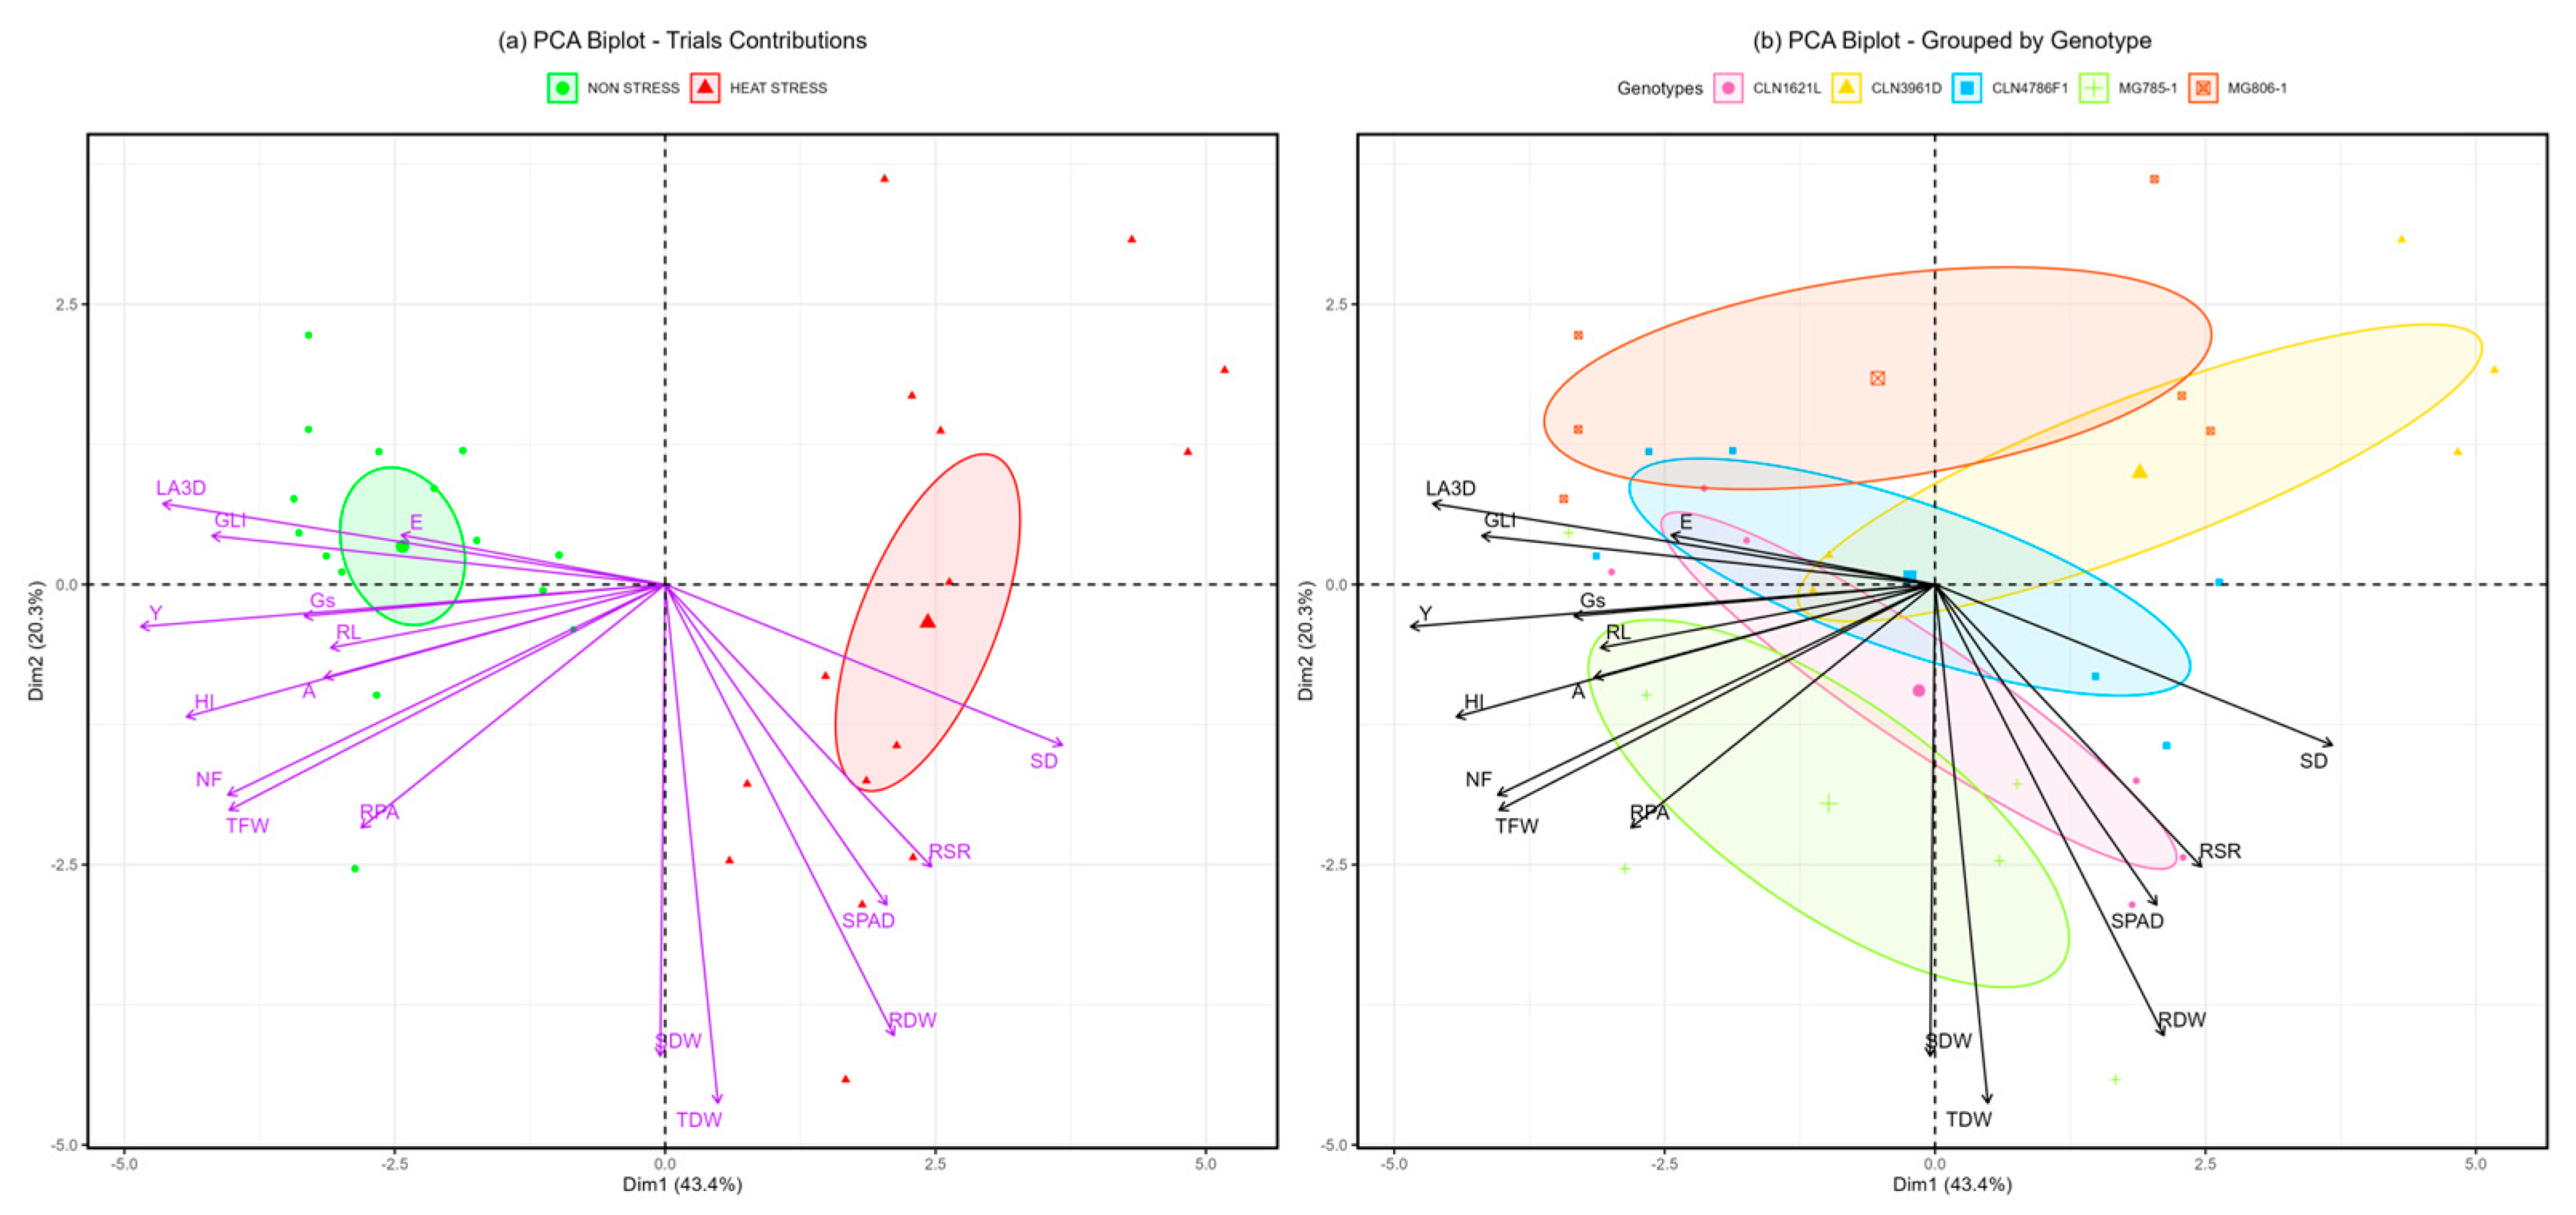
Figure 8.
Root washing technique for isolating and cleaning root systems. Plants were excised above the soil, soil-root clumps were saturated and inverted, and roots were washed gently with water to preserve integrity for further analysis.
Figure 8.
Root washing technique for isolating and cleaning root systems. Plants were excised above the soil, soil-root clumps were saturated and inverted, and roots were washed gently with water to preserve integrity for further analysis.
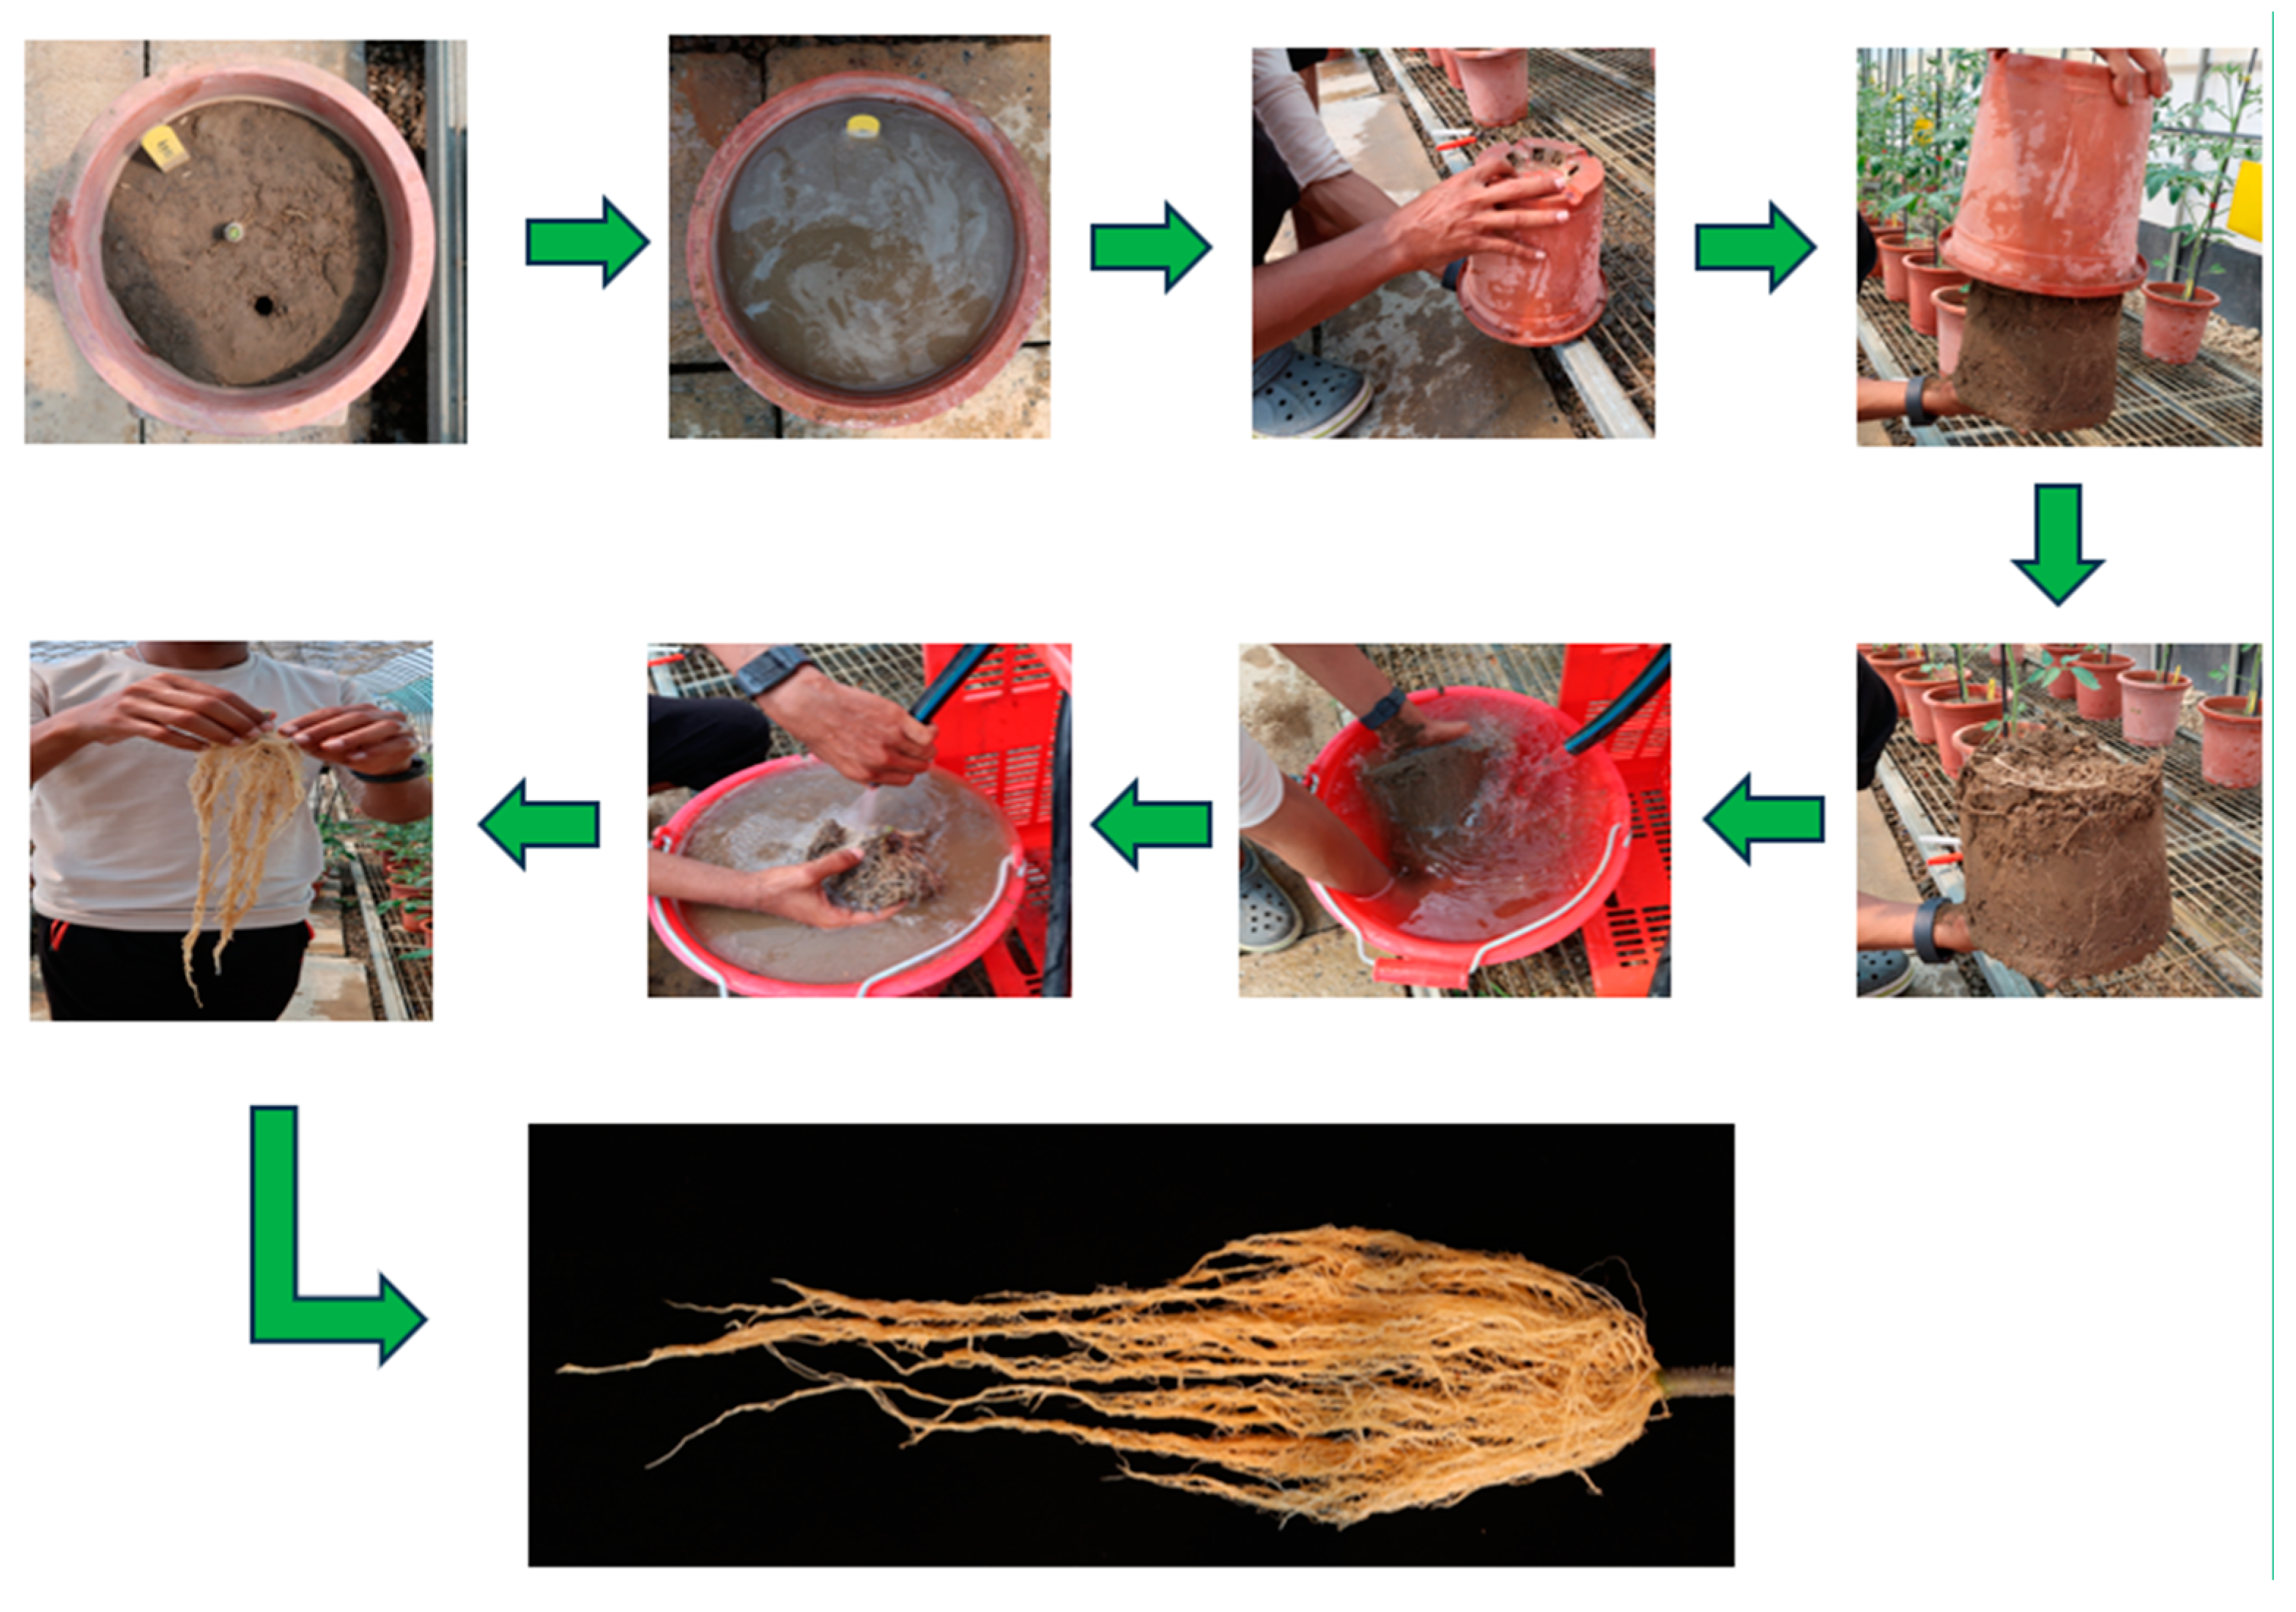

Table 1.
Analysis of Variance (ANOVA) result for morphological, physiological and yield traits under heat stress and non-stress conditions.
Table 1.
Analysis of Variance (ANOVA) result for morphological, physiological and yield traits under heat stress and non-stress conditions.
| Parameter | Source of Variation | ||
|---|---|---|---|
| Genotype (G) | Conditions (C) | Interaction (G x C) | |
| Stem diameter (SD) | NS | *** | NS |
| SPAD | *** | *** | *** |
| Shoot fresh weight (SFW) | ** | *** | * |
| Shoot dry weight (SDW) | ** | NS | * |
| Root length (RL) | NS | ** | NS |
| Root projected area (RPA) | * | *** | NS |
| Root fresh weight (RFW) | *** | *** | NS |
| Root dry weight (RDW) | *** | *** | *** |
| Root to shoot ratio (RSR) | *** | *** | ** |
| Total dry weight (TDW) | ** | NS | * |
| Total fresh weight (TFW) | *** | *** | NS |
| Photosynthetic rate (A) | ** | *** | ** |
| Transpiration rate (E) | NS | * | ** |
| Stomatal conductance (Gs) | NS | *** | NS |
| 3D leaf area (LA3D) | NS | *** | NS |
| Green leaf index (GLI) | *** | *** | ** |
| No of fruits (NF) | *** | *** | * |
| Yield (Y) | *** | *** | ** |
| Harvest index (HI) | *** | *** | *** |
* = Significant at 5% level, ** = Significant at 1% level, *** = Significant at 0.1% level; NS = Nonsignificant.
Table 2.
Tomato genotypes analyzed in this study.
| S. No | Genotype | Growth Habit | Origin |
|---|---|---|---|
| 1 | CLN1621L | Determinate | World Veg, Taiwan |
| 2 | CLN3961D | Semi determinate | World Veg, Taiwan |
| 3 | CLN4786F1 | Semi determinate | World Veg, Taiwan |
| 4 | MG806-1 | Semi determinate | World Veg, Taiwan |
| 5 | MG785-1 | Semi determinate | World Veg, Taiwan |
Disclaimer/Publisher’s Note: The statements, opinions and data contained in all publications are solely those of the individual author(s) and contributor(s) and not of MDPI and/or the editor(s). MDPI and/or the editor(s) disclaim responsibility for any injury to people or property resulting from any ideas, methods, instructions or products referred to in the content. |
© 2025 by the authors. Licensee MDPI, Basel, Switzerland. This article is an open access article distributed under the terms and conditions of the Creative Commons Attribution (CC BY) license (http://creativecommons.org/licenses/by/4.0/).
Copyright: This open access article is published under a Creative Commons CC BY 4.0 license, which permit the free download, distribution, and reuse, provided that the author and preprint are cited in any reuse.


