
Submitted:
30 July 2025
Posted:
31 July 2025
You are already at the latest version
Abstract
Phaseolus coccineus L. (runner bean) stands out for its high nutritional value, richness in bioactive compounds, and broad genetic diversity—traits that make it a valuable candidate for crop improvement and integration into sustainable agricultural systems, particularly under the changing climate conditions. In this context, this study aimed to assess the individual and combined effects of three runner bean cultivars (Cozia1, Cozia2, and Cozia3), two irrigation regimes (2000 and 2500 m³·ha⁻¹), and three fertilisation strategies (chemical, organic, and unfertilised) on key physiological, morphological, and biochemical parameters. The field experiment was conducted over two consecutive growing seasons using a randomized block design with three replications. The results showed that genotype had the most significant influence on the majority of traits, highlighting its dominant role over fertilization and irrigation. Among cultivars, Cozia2 was highly responsive to fertilisation and irrigation variation, showing both the highest and lowest values for pod number, seed weight, and seeds per pod depending on treatment. Under chemical fertilization and 2500 m³·ha⁻¹ irrigation, Cozia2 achieved the highest grain yield (3427.60 kg·ha⁻¹) and pod number (48.13), while Cozia1 combined with chemical fertilization under 2000 m³·ha⁻¹ irrigation recorded the highest total phenolic content (0.47 mg GAE·100 g⁻¹ d.w.). Notably, the highest photosynthetic assimilation rates were observed in Cozia2 × IR2 × UF and Cozia3 × IR1 × OR combinations. These findings therefore highlight the necessity of choosing optimal genotype-input combinations to enhance yield, quality, and resource efficiency in runner bean production.
Keywords:
runner bean
; growth performance
; yield traits
; bean quality
; open-field crop
1. Introduction
In recent years, legumes have transitioned from being neglected crops to becoming promising solutions for the challenges of global food security. They have garnered increasing scientific interest due to their potential contributions to sustainable agriculture, soil health, and nutrition. Research highlights the ability of legumes to fix atmospheric nitrogen, which improves soil fertility and reduces the need for synthetic fertilizers. Additionally, their diverse nutrient profiles make them essential in combating malnutrition and promoting healthier diets. For example, these plants offer a sustainable alternative to traditional animal-based proteins and are recognized for their high protein content, which ranges from 160 to 250 grams per kilogram [1,2]. Furthermore, legumes are recognized for their complex phytochemical composition, rich in bioactive substances such as flavonoids, phenolic acids, and anthocyanins, compounds associated with antioxidant, antimutagenic, anticarcinogenic, and anti-inflammatory effects [3,4,5,6]. Therefore, these crops, rich in fiber, essential amino acids, vitamins, and minerals, can effectively complement primarily cereal-based diets. They contribute to dietary diversification and help reduce nutritional deficiencies, positioning legumes among the most nutritious plant-based crops available [7].
The Phaseolus genus includes 75 infrageneric taxa [8], with approximately 150 species [9]. Within this genus, several species are cultivated worldwide as food sources for human consumption, including P. vulgaris, P. lunatus, P. coccineus, P. dumosus, and P. acutifolius [10,11,12]. The common bean (Phaseolus vulgaris L.) and runner bean (Phaseolus coccineus L.) are often cultivated together [13], as they are closely related and capable of partial interbreed [9,14].
Phaseolus coccineus L. is originally from Mexico and Central America, where it is a perennial plant. However, in temperate regions, such as Romania, it behaves as an annual plant due to its sensitivity to low temperatures [15,16,17]. It is a herbaceous species with hypogeal emergence and cross-pollination, characterized by vigorous, twining stems (≥4 m) that require support. While it is widely cultivated in its native regions, in Romania it is grown on a smaller scale, primarily in home gardens, for its tender pods and dry beans [15,18,19]. Due to its nutritional value, bioactive compound content, and genetic diversity, P. coccineus holds considerable potential for improvement and integration into sustainable farming systems [15,17,20]. Compared to other species within the genus, it exhibits greater tolerance to low temperatures during the early growth stages [18,21]. Although it shows greater tolerance to low temperatures during the early growth stages compared to other species in its genus, it is still vulnerable to heat stress during the flowering period. High temperatures can negatively impact fertility, leading to flower abortion and reduced yields [22]. Furthermore, the beans are the species with high water and nutrient demands, especially during critical growth stages such as flowering and pod filling [23,24].
Currently, due to climate change, which is marked by rising global temperatures and more frequent extreme weather events, water resources are becoming increasingly scarce and challenging to manage. This situation poses a significant challenge for bean cultivation [25,26]. Rational water use in agriculture is therefore essential, as climate projections predict increased evapotranspiration alongside reduced water availability [25]. In this context, integrated irrigation strategies, the selection of drought-tolerant genotypes, and soil moisture monitoring technologies are vital components for sustainable and resilient agricultural practices [27]. Water scarcity not only affects plant hydration but also limits the uptake of essential nutrients, thereby compromising key physiological processes such as photosynthesis. The intensity of the photosynthetic process and the resulting yield are affected by the availability of nutrients in the soil, which can be enhanced through appropriate fertilization. However, nutrient uptake is strongly dependent on adequate soil moisture, which under drought conditions can be significantly reduced [28,29].
In addition to water management and genetic adaptation, proper nutrient supply is critical for optimizing the growth and yield of Phaseolus coccineus L. Growing beans often requires significant nitrogen application to enhance growth and yield, even though the plant can naturally fix atmospheric nitrogen through a symbiotic relationship with microorganisms [30]. It is well documented that chemical fertilizers contribute significantly to yield increases in vegetable crops, due to their high nitrogen content in a form readily assimilated by plants compared to organic fertilizers [30,31]. However, there is a growing trend towards the use of organic fertilizers, including in conventional farming systems. In this context, organic and microbiological fertilizers have proven to be effective, providing not only comparable production performance [32,33], but also improvements in crop quality, thus adding agricultural value [34,35,36].
Despite the challenges posed by environmental stresses and resource limitations, Phaseolus coccineus L. exhibits significant genetic variability, offering valuable opportunities for breeding programs aimed at improving tolerance to biotic and abiotic stress [37]. Therefore, exploiting local genetic resources, such as traditional cultivars and indigenous populations, becomes essential for diversifying the genetic base of crop species. These have valuable adaptive traits acquired through natural and agricultural selection, including abiotic stress tolerance, disease and pest resistance [38]. Studying and integrating these genetic resources into breeding programs can support the development of modern, resilient, and sustainable crop varieties adapted to climate change and the degradation of natural resources [38]. Furthermore, to optimize yields, it is essential to combine balanced fertilization with the use of high-performing cultivars, appropriate plant spacing, and efficient irrigation management [29,30,39]. Implementing integrated water and nutrient management strategies alongside drought-tolerant P. coccineus genotypes is particularly important in the face of climate change and increasing water scarcity, ensuring the sustainability and productivity of cultivation systems.
In this context, the present study aimed to investigate the individual and combined effects of three runner bean cultivars (Cozia1, Cozia2, and Cozia3), two irrigation regimes (2000 m3·ha−1 and 2500 m3·ha−1), and three fertilization treatments (chemical, organic, and unfertilized) on a wide range of physiological, morphological, and biochemical parameters. These include photosynthetic assimilation rate, chlorophyll content, pod and bean yield traits, and bean quality indicators such as antioxidant activity and total phenolic content. Therefore, this integrative approach focuses on identifying the optimal management practices that enhance yield and quality, thereby supporting the sustainable and efficient cultivation of runner beans in temperate regions such as Romania.
2. Materials and Methods
2.1. The Design and the Experimental Protocol
The experiment was conducted in 2022 and 2023 at the vegetable cultivation experimental open field of V. Adamachi farm, part of the Iasi University of Life Sciences. Three key links of the technology of growing runner beans were studied: genotype, irrigation norm, and fertilization regime. The experiment was set up on May 20 of each year and finished on October 31.
Cozia1, Cozia2, and Cozia3, which originate from Cozia in Iasi County, were selected as local populations of runner beans. These populations share several common characteristics, including a climbing growth habit, white flowers, green pods, completely white beans, and a thousand-grain weight (TGW) exceeding 1,300 grams.
The experiment was structured in randomized blocks with three replications (Figure 1). Each replication consisted of a regular square pyramid arrangement of eight nests, with three nests per side at 80 cm spacing between them. Three seeds were sown per nest at a depth of 4 cm. After emergence, thinning was performed to retain two plants per nest, resulting in an average planting density of approximately 12,500 nests per hectare. To support plant growth, a bamboo staking system with a height of 2.7 meters was installed. The distance between pyramid units was one meter.
During the growing season, total precipitation amounted to 241 mm in 2022 and 246 mm in 2023, based on data from Meteostat.net [40] (Figure 2). Additional water was provided through a drip irrigation system, applying two distinct irrigation regimes: 2000 m³·ha⁻¹ (IR1) and 2500 m³·ha⁻¹ (IR2).
In terms of fertilization, three different regimes were applied: organic fertilization (OR), chemical fertilization (CH), and an unfertilized control (UF). In the organic fertilization variant, poultry manure was applied at a rate of 1875 kg·ha−1 (50% of the total amount at sowing, 25% after the appearance of the first flowers, and 25% after the formation of the first pods). The manure contained 4% total nitrogen, 4% phosphorus pentoxide, 4% potassium oxide, 0.5% water-soluble magnesium oxide, and 41% organic biochar.
The chemical fertilization (CH) involved two types of NPK fertilizers. The first, NPK–14:40:5, was applied at a total dose of 320 kg·ha⁻¹, with two-thirds applied as basal fertilization and one-third after the appearance of the first flowers. Its chemical composition was 14% total nitrogen (all ammonium nitrogen), 40% phosphorus anhydride, 5% potassium oxide, and 13% sulfuric anhydride, along with trace elements including 0.10% boron, iron, and zinc, and 0.05% copper, and 0.01% molybdenum. The second fertilizer, NPK–23:5:5, contained 23% total nitrogen (17% ammonium nitrogen and 6% nitrate nitrogen), 10% phosphorus pentoxide, 5% potassium oxide, and 29% sulfuric anhydride, along with 0.10% iron and zinc, and 0.05% manganese as trace elements. A total of 65 kg·ha−1 of NPK–23:5:5 was applied after the formation of the first pods. Given that organic fertilizers release nutrients more slowly than the immediate availability of chemical fertilizers, 25% more macronutrients were applied through organic fertilisation to meet the nutrient requirements of runner beans [41].
Throughout the growing season, crop maintenance activities were carried out following established guidelines from the literature [42,43]. Additionally, variations in temperature, humidity, and dew point were systematically monitored using a Data Logger® digital device, which continuously recorded data from the planting phase to the harvest (Figure 3).
2.2. Methods of Analysis of the Analyzed Parameters
The individual and combined effects of the studied factors on physiological parameters were evaluated through measurements taken midway through the growing season. Leaf gas exchange, expressed as assimilation rate (A) in µmol m⁻²·s⁻¹, was measured using the portable LCpro T® system (ADC BioScientific Ltd., UK). The chlorophyll content index (CCI) was determined using the portable CCM 200plus device (Opti-Sciences, ADC BioScientific Ltd., UK).
After harvesting, the quantitative characteristics of the pods—such as the number of pods per plant, beans per pod, as well as the percentage weights of beans and pericarp—were recorded. Additionally, measurements included pod length (cm) and width (mm). Following the pod analysis, a quantitative assessment of the beans was conducted, measuring bean length, width, and thickness (all in millimetres), as well as the thousand-grain weight (TGW in grams), and yield per hectare (kilograms). The quality assessments of the beans, including total polyphenol content (TPC) and antioxidant activity, as determined by both DPPH and ABTS methods, completed the analysis cycle.
Total polyphenol content (TPC) was measured using the Folin-Ciocalteu reagent following the Slinkard and Singleton method [44]. The experimental protocol involved mixing 10 µL of hydrophilic extract with 175 µL of distilled water and 12 µL of Folin-Ciocalteu reagent. After a 3-minute reaction time, 30 µL of a 20% aqueous sodium carbonate solution was added, and the mixture was incubated in the dark for 60 minutes. After the incubation, absorbance was measured at 765 nm using a microplate spectrophotometer (Thermo Scientific Multiskan GO, Vantaa, Finland). The polyphenol content was quantified by comparing the readings to a standard curve created using gallic acid solutions of known concentrations, prepared in a similar manner. The results are expressed in milligrams of gallic acid equivalents per 100 g of dry weight (mg GAE·100 g−1 d.w.) [45].
The antioxidant activity, assessed using the DPPH method, involved preparing a reagent by dissolving 3.5 mg of DPPH in 10 mL of methanol. The absorbance was adjusted to 0.98 ± 0.02 at 515 nm at a microplate spectrophotometer (Thermo Scientific Multiskan GO, Vantaa, Finland). Then, 100 µL of the DPPH solution and 10 µL of the sample extract (supernatant) or Trolox standard solutions were added to the microplate wells, and absorbance was measured at 515 nm. After the initial reading, DPPH reagent was added, and the mixture was left for 60 minutes before taking a second measurement at 515 nm. A calibration curve was established using Trolox solutions ranging from 50 to 3000 µM in methanol. The antioxidant capacity was determined by comparing the sample readings to the standards. Results are expressed as micromoles of Trolox equivalents per gram of dry matter (mmol TE·100 g−1 d.w.).
To assess antioxidant capacity using the ABTS assay, a reaction mixture was prepared by combining 175 µL of distilled water, 190 µL of ABTS solution, and 10 µL of plant extract (supernatant). The mixture was then incubated in the dark for 15 minutes prior to absorbance measurement. The ABTS solution was prepared by dissolving 38.6 mg of ABTS in 10 mL of 2.45 mM potassium persulfate, which was obtained by dissolving 334.4 mg of potassium persulfate in 500 mL of distilled water. This solution was left to incubate for 16 hours in the dark to allow full generation of the ABTS radical required for the assay. Absorbance was measured at 730 nm using a Thermo Scientific Multiskan GO microplate spectrophotometer (Vantaa, Finland). A calibration curve was prepared using Trolox standards dissolved in 0.1 mM methanol and subjected to the same analytical procedure as the samples. Antioxidant activity was expressed as micromoles of Trolox equivalents per gram of dry weight (mmol TE·100 g−1 d.w.) [45,46].
All analyses were performed in triplicate and the mean values and standard deviation were calculated for each sample.
2.3. Statistical Analysis of Results
To analyze the relationships between variables and identify significant differences in the data set, several statistical techniques were applied. In the first stage, analysis of variance (ANOVA) was employed to assess statistically significant differences between groups. Subsequently, the Duncan post-hoc test at a significance level of p ≤ 0.05 was applied to compare means. These analyses were performed using SPSS software, version 26 (IBM Corp., Armonk, NY, USA), and results were presented as mean ± standard error (SE). To gain a deeper understanding of the structure and interrelations among traits across the different combinations between Cozia bean cultivars, irrigation regimes, and fertilisation treatments, multivariate analysis was performed using Principal Component Analysis (PCA) alongside Pearson correlation. The analyses were carried out using the OriginLab Pro 2025b free trial (OriginLab Corporation, Northampton, MA, USA).
3. Results
3.1. Influence of Experimental Factors on Physiological Indicators
The rate of photosynthetic assimilation in the leaves of runner beans varied significantly with cultivar and fertilization regime, while no significant differences were found with irrigation norm (Figure 3a). Among the different genotypes, the cultivar Cozia1 exhibited the highest photosynthetic assimilation rate at 11.92 µmol m−2∙s−1, while the cultivar Cozia3 had the lowest rate at 10.64 µmol m−2∙s−1. In terms of fertilization, the organically fertilized variant achieved the highest assimilation rate of 11.53 µmol m−2∙s−1. This rate is significantly higher compared to the non-fertilized variant (10.92 µmol m−2∙s−1), but not significantly different from the chemically fertilized variant (11.21 µmol m−2∙s−1).
The analysis of the individual impact of the experimental factors on chlorophyll pigment content (CCI) showed no statistically significant effects (Figure 3b). Among the cultivars, Cozia1 recorded the highest CCI value (18.99), followed by Cozia2 (18.88), while Cozia3 had the lowest content (18.54). In terms of irrigation, the highest CCI values were observed under the IR1 norm. Regarding fertilization, the treatment with chemical fertilizers resulted in the highest CCI (18.95), closely followed by organic fertilization (18.90).
Photosynthetic assimilation and chlorophyll content index both exhibited statistically significant differences due to the interaction between genotype and irrigation (Figure 4). The Cozia1 × IR1 variant achieved the highest CO2 assimilation rate of 12.38 µmol m−2∙s−1, which is 14% higher than the Cozia3 × IR1 (10.63 µmol m−2∙s−1), Cozia2 × IR1 (10.64 µmol m−2∙s−1), and Cozia3 × IR2 (10.65 µmol m−2∙s−1) variants, which recorded the lowest rates. The Cozia2 × IR2 and Cozia1 × IR2 variants produced intermediate results with rates of 11.57 and 11.45 µmol m−2∙s−1, respectively. Regarding the CCI analysis, the Cozia1 × IR1 variant exhibited a chlorophyll content (19.54) approximately 6% higher compared to the Cozia3 × IR2 and Cozia1 × IR2 variants. In contrast, no significant differences were observed compared to the other experimental variants.
Analysis of the data on the interaction between cultivar and fertilization also revealed significant differences in both the photosynthetic assimilation rate and the chlorophyll content index (CCI). For example, the combinations Cozia1 × OR, Cozia1 × CH, Cozia2 × UF, and Cozia3 × OR exhibited the highest values, which were significantly greater than those of the other variants. Furthermore, as shown in Figure 5a, the unfertilized Cozia3 variant recorded the lowest photosynthetic assimilation rate (10.34 µmol m⁻²·s⁻¹), a value significantly lower than those observed in all other experimental combinations. Regarding CCI (Figure 5b), the highest value was observed in the Cozia1 × CH variant at 19.73 CCI, which is 8% higher than the Cozia3 × CH and Cozia1 × OR variants, with values of 18.21 and 18.35 CCI, respectively. The other experimental variants showed intermediate values, ranging from 18.52 to 19.18 CCI, with no statistically significant differences compared to either the highest or lowest values.
Considering the interaction between irrigation and fertilisation, it was found that their combination caused significant differences among the experimental variants in both analysed physiological indicators (Figure 6). The highest photosynthetic assimilation rate was recorded in the IR1 × OR variant (11.92 µmol m⁻²∙s⁻¹), showing no significant difference only in comparison with the IR2 × CH variant. The lowest value was observed in the IR1 × CH variant (10.82 µmol m⁻²∙s⁻¹). For the CCI indicator, the highest value was observed in the IR1 × CH variant (19.61 CCI). This was significantly higher only compared to the IR2 × CH and IR2 × UF variants, while the differences with the other variants were not statistically significant.
The data on the Interaction among the three considered factors revealed that the Cozia1 cultivar, under the influence of IR2 × UF, recorded the lowest values for both the photosynthetic assimilation rate and CCI. In contrast, the Cozia2 cultivar, under the same conditions, exhibited the highest values for these indicators. For Cozia3, the IR1 × UF combination proved to be the most unfavourable in terms of both physiological parameters (Figure 7). Nevertheless, statistical analysis showed that the combination of factors caused the greatest variation in the photosynthetic assimilation rate, while its impact on CCI was comparatively less significant (Figure 7). Significant differences in the photosynthetic assimilation rate values for the Cozia1 cultivar were observed between the Cozia1 × IR1 × OR combination and the other experimental variants, as well as between the Cozia1 × IR1 × UF combination and the rest of the treatments. For the Cozia2 cultivar, the IR2 × UF combination resulted in a photosynthetic assimilation rate that was statistically significantly higher than those recorded under the other treatment combinations. Similarly, in the case of Cozia3, the IR1 × OR treatment led to a statistically significant increase in photosynthetic assimilation rate compared to the remaining interactions between factors.
Regarding the CCI, the highest value was recorded in the Cozia1 × IR1 × CH variant, with a mean CCI of 20.38. This value was statistically significantly higher (at p < 0.05) only when compared with the levels determined in the treatment combinations: Cozia1 × IR1 × OR, Cozia1 × IR2 × UF, Cozia2 × IR1 × UF, Cozia3 × IR2 × CH, and Cozia3 × IR1 × UF. No statistically significant differences were observed either between Cozia1 × IR1 × CH and the remaining treatments, or among the remaining treatments themselves.
3.2. Influence of Experimental Factors on Biometric Indicators
The analysis of biometric indicators revealed that their variation was significantly more influenced by genotype and irrigation regime than by the type of fertilizer applied, as shown in Table 1 and Table 2. The effects of genotype and irrigation were consistently observed across multiple traits, indicating a more substantial impact of these factors on plant morphology. Genotypic variation induced statistically significant differences in all indicators except for the number of seeds per pod. The Cozia1 cultivar is distinguished by higher pericarp weight percentage, pod length, bean length, bean thickness, and thousand grain weight (TGW). Conversely, Cozia2 has higher values for the number of pods per plant, seeds weight percentage, and bean width. Cozia3 demonstrates significantly larger pod width and grain mass compared to the other cultivars.
The irrigation regime mainly affected a few biometric indicators: the number of pods per plant, seed weight percentage, and pericarp weight percentage. While most traits did not differ significantly, the IR2 treatment generally exhibited the highest values for most parameters analysed, except for seed weight percentage.
The overall impact of fertilizer type was relatively minor, and most measured parameters did not show statistically significant differences. Nevertheless, notable differences were found in the number of pods per plant, pod width, and grain mass, with chemical fertilization yielding the highest values for these traits (33.85 pods per plant, a pod width of 18.88 mm, and a grain yield of 2836.43 kg·ha⁻¹). Conversely, the organically fertilized variant exhibited the highest values for seed weight percentage (75.06%), pod length (9.95 cm), bean length (20.40 mm), and bean thickness (8.49 mm), though these were not statistically significant. The control (unfertilized) treatment resulted in the highest pericarp weight percentage (25.46%) and TGW of 1430.88 g.
As shown in Table 3 and Table 4, the genotype × irrigation, genotype × fertilization, and irrigation × fertilization interactions significantly influenced both the quantitative traits of runner bean pods and beans.
The genotype × irrigation interaction significantly influenced all pod and seed traits, except the number of seeds per pod, which showed only minor variation (2.26–2.33). The highest number of pods per plant (37.05) was recorded in Cozia2 × IR2, exceeding Cozia1 × IR2 by over 23%. Seed weight percent ranged from 73.69% (Cozia1 × IR2) to 75.97% (Cozia2 × IR1), with an inversely proportional pericarp weight. Cozia1 × IR1 produced the longest pods (10.20 cm), while Cozia3 × IR2 showed the greatest pod width (19.38 mm). Bean biometric traits were also strongly affected by this interaction. Cozia1 × IR1 achieved the highest seed length (21.22 mm) and TGW (1449.82 g), while Cozia3 × IR1 had the lowest values across most seed traits, including yield (2483.07 kg·ha⁻¹). In contrast, the highest yield (2995.21 kg·ha⁻¹) was recorded for Cozia3 × IR2, indicating a 17% increase due to the interaction.
The genotype × fertilization interaction similarly affected all pod traits except seed number. The number of pods per plant ranged from 28.47 (Cozia2 × UF) to 36.98 (Cozia2 × CH), with a variation of up to 23%. The highest seed weight percentage (76.20%) was recorded in Cozia2 × OR, while the lowest (73.53%) was in Cozia3 × UF, showing an inverse relationship with pericarp content. Pod length varied from 9.58 cm (Cozia3 × UF) to 10.36 cm (Cozia1 × CH), and pod width had nearly a 9% difference, reaching 19.66 mm in Cozia3 × CH. The longest seed grains were observed in Cozia1 × UF at 21.23 mm, which is 7.77% taller than those in Cozia3 × UF (19.58 mm). The largest seed width and TGW were observed in Cozia2 × UF, with 13.97 mm and 1503.05 g, respectively. The smallest bean width was 12.88 mm for Cozia1 × OR, and the lightest TGW was 1352.81 g for Cozia2 × OR. Bean thickness varied approximately 10%, from 7.92 mm (Cozia3 × UF) to 8.78 mm (Cozia2 × CH). The highest yield was found in the Cozia3 × CH variant, at 3130.37 kg·ha⁻¹, while the lowest, 23% less, was in the Cozia2 × UF variant, with 2404.74 kg·ha⁻¹.
The irrigation × fertilization interaction significantly influenced all measured traits. IR2 × CH had the highest values for number of pods (36.69), pericarp percentage (26.59%) and pod width (19.03 mm), while IR1 × CH had the highest number of seeds per pod (2.39), seed weight percentage (75.98%) and pod length (10.09 cm). In contrast, IR1 × UF showed the lowest values for the number of pods (29.18), the number of seeds (2.17), and pod length (9.49 cm), illustrating the combined effect of limited water and nutrients. In terms of bean characteristics, the IR2 × OR variant had the highest values for bean length (20.46 mm), bean thickness (8.62 mm) and yield (2993.76 kg-ha-¹). The widest beans (13.54 mm) were observed in IR1 × CH and IR2 × CH, while the narrowest (13.08 mm) occurred in IR1 × UF. The highest TGW was recorded in IR2 × UF (1441.47 g), while IR1 × OR had the lowest (1374.10 g). The shortest grains were found in IR2 × CH (20.24 mm), while IR1 × UF also recorded the smallest thickness (8.17 mm). Despite a high TGW, IR2 × UF had the lowest yield (2452.47 kg-ha-¹).
The three-way interaction among genotype, irrigation, and fertilization significantly influenced the traits studied. The evaluation revealed notable impacts on various characteristics, highlighting the complex interactions that affect pod and beans traits, as shown in Table 5 and Table 6. The Cozia2 cultivar exhibited the highest number of pods per plant, with a total of 30 pods. In comparison, the Cozia2 × IR2 × CH variant produced an impressive 48.13 pods, while the Cozia2 × IR1 × CH variant had 25 pods. The number of seeds per pod varied, ranging from 2.10 in the Cozia2 × IR1 × UF variant to 2.43 in both the Cozia2 × IR1 × CH and Cozia3 × IR2 × UF variants. The highest seed weight percentage was found in the Cozia2 × IR1 × OR variant, at 76.77%, which was negatively correlated with pericarp weight percentage, recorded at 23.23%. Conversely, the Cozia1 × IR1 × OR variant had the highest pericarp weight percentage of 28.04%, which was negatively correlated with seed weight at 71.96%. In terms of pod length, the longest pods were observed in the Cozia1 × IR1 × CH variant, measuring 10.67 cm, which is 13% longer than the pods of the Cozia3 × IR1 × UF variant, measuring 9.24 cm. The widest pods were produced by the Cozia3 × IR2 × CH variant, with a width of 20.17 mm, 12% greater than the Cozia2 × IR1 × OR variant, which measured 17.80 mm.
Regarding the seed morphological and yield traits of runner beans, the three-way interaction between genotype, irrigation, and fertilisation showed that the Cozia3 × IR1 × UF variant produced beans with the lowest measurements for length (19.24 mm, −11.4%), width (12.55 mm, −11.7%), and thickness (7.76 mm, −15.1%). In contrast, the highest measurements were recorded for bean length in Cozia1 × IR1 × UF (21.72 mm), grain width in Cozia2 × IR2 × UF (14.21 mm), and bean thickness in Cozia2 × IR2 × OR (9.14 mm). The maximum TGW was observed in Cozia2 × IR2 × UF (1525.19 g), representing a 13% increase compared to Cozia2 × IR1 × OR (1323.20 g). The highest yield was obtained from the Cozia2 × IR2 × CH variant, with 3427.60 kg·ha⁻¹, which is 36% higher than those recorded for Cozia1 × IR1 × OR (2193.43 kg·ha⁻¹) (Table 6).
3.3. Influence of Experimental Factors on Biochemical Indicators
The quality of runner bean seeds showed significant variation in total polyphenol content (TPC) and antioxidant capacity depending on genotype, while only DPPH was affected by fertilization. In contrast, irrigation had no notable impact on TPC, DPPH, or ABTS (Table 7). Among cultivars, Cozia3 exhibited the highest TPC at 0.37 mg GAE·100 g⁻¹ d.w., a value significantly higher than Cozia1 (0.32 mg GAE·100 g−¹ d.w.) and Cozia2 (0.31 mg GAE·100 g−¹ d.w.). Cozia3 also showed the highest DPPH activity (0.13 mmol TE·100 g−1 d.w.), but the lowest ABTS (0.26 mmol TE·100 g−1 d.w.). Regarding fertilization, the data indicated that chemical fertilization resulted in the highest TPC (0.35 mg GAE·100 g−¹ d.w.) and DPPH activity (0.14 mmol TE·100 g−¹ d.w.), while the unfertilized variant reached the lowest values (0.32 mg GAE·100 g−¹ d.w. and 0.12 mmol TE·100 g−¹ d.w.).
The two-way interactions between genotype, irrigation, and fertilisation significantly affected the biochemical properties of runner bean seeds. Only ABTS activity showed no significant differences in the genotype × fertilisation and irrigation × fertilisation interactions, as detailed in Table 8. While irrigation alone did not cause notable changes in biochemical traits, its interaction with genotype led to significant variations. Specifically, higher irrigation levels increased TPC content in Cozia1 (0.39 mg GAE·100 g⁻¹ d.w.) but decreased DPPH activity in Cozia2. Additionally, although increased irrigation improved TPC in Cozia1, it reduced TPC levels in the other two cultivars. Furthermore, in the irrigation × fertilisation interaction, the highest TPC values were observed in the IR1 × CH and IR2 × OR variants, which were significantly higher than other treatments. Conversely, the IR2 × OR combination resulted in the lowest DPPH content. Under the cultivar × fertilisation interaction, the Cozia3 × OR variant registered the highest TPC value (0.44 mg GAE·100 g⁻¹ d.w.), which was 36% higher than in Cozia1 × OR and Cozia1 × UF, variants with the lowest TPC content. Antioxidant activity measured by the DPPH assay was highest in the Cozia3 × CH variant (0.16 mmol TE·100 g⁻¹ d.w.), showing a 31% difference compared to the lowest value recorded in Cozia1 × UF (0.11 mmol TE·100 g⁻¹ d.w.). The ABTS assay, in contrast, showed no statistically significant variation across treatments, with differences limited to a 10% range.
The three-way interactions among genotype, irrigation, and fertilisation indicated that the combination of Cozia1 × IR1 × CH recorded the highest TPC, at 0.47 mg GAE·100 g−1 d.w. This value was not significantly different from those of Cozia3 × IR1 × OR and Cozia3 × IR2 × OR, but it was significantly higher than those observed in the other experimental variants. However, under the influence of IR1 × OR and IR1 × UF, the Cozia1 cultivar exhibited the lowest TPC values, with 0.17 mg GAE·100 g−1 d.w. and 0.21 mg GAE·100 g−1 d.w., respectively, highlighting a strong interaction effect between fertilization type and genotype under the same irrigation regime.
Regarding antioxidant activity, the three-way interaction among factors showed that the values determined by the DPPH assay varied by 47%, ranging from 0.09 mmol TE·100 g⁻¹ d.w. in the Cozia2 × IR2 × OR variant to 0.17 mmol TE·100 g⁻¹ d.w. in the Cozia3 × IR2 × CH variant. The ABTS assay revealed the highest antioxidant activity in the Cozia1 × IR2 × UF variant, with a value of 0.31 mmol TE·100 g⁻¹ d.w., which was 23% higher than that of the Cozia2 × IR2 × UF variant (0.24 mmol TE·100 g⁻¹ d.w.). Statistically, the variation in antioxidant compound levels measured by the DPPH assay was notably greater than by the ABTS. The Cozia3 × IR2 × CH variant, with the highest DPPH antioxidant content, was significantly higher than all other variants, except when compared with Cozia3 × IR1 × CH (Table 9). In contrast, regarding the ABTS assay, the Cozia2 × IR2 × UF variant showed significantly lower antioxidant activity compared only to Cozia1 × IR1 × OR, Cozia1 × IR2 × UF, and Cozia2 × IR2 × OR.
3.4. Multivariate Relationships Among Traits
The multivariate analysis combining Principal Component Analysis (PCA) and Pearson correlation provided valuable insights into the underlying structure and interrelationships among traits across various combinations of Cozia bean cultivars, irrigation regimes, and fertilization treatments. PCA conducted on the complete dataset showed that seven of the sixteen principal components had eigenvalues greater than 1, indicating significant dimensions of trait variability. The first three components explained a cumulative 60.64% of the total variance, with PC1 accounting for 26.34% (eigenvalue: 4.21), PC2 for 21.53% (eigenvalue: 3.45), and PC3 for 12.77% (eigenvalue: 2.04), as presented in Table 10 and illustrated in Figure 8.
According to Table S1, the main positive contributors to PC1 were assimilation rate (0.292), CCI (0.376), number of seeds per pod (0.315), and seed weight percent (0.376), while pericarp weight percent (-0.376) and ABTS (-0.307) were the most substantial negative contributors. This pattern suggests that PC1 captures a dimension related to plant productivity and photosynthetic efficiency. In contrast, pericarp weight percent and ABTS, which exhibited a high negative loading on PC1, suggest a strong and inverse contribution to the component primarily associated with photosynthetic efficiency and yield performance. Thus, the Cozia cultivars influenced by irrigation and fertilisation regimes located on the negative side of PC1 tend to show higher pericarp biomass and antioxidant activity, often at the detriment of traits related to yield and photosynthetic efficiency. Regarding PC2, it exhibited strong positive loadings for bean thickness (0.368), pod length (0.311), bean length (0.325), and ABTS antioxidant activity (0.279). This component appears to capture variation primarily associated with pod and seed morphology, as well as antioxidant potential. These associations suggest that PC2 reflects a combination of morphological and biochemical traits, potentially influenced by genetic differences among cultivars and/or interactions between genotype, irrigation regime, and fertilization treatments. For PC3, the main positive contributors were pod width (0.455), pod length (0.305), TGW (0.335), and pericarp weight percentage (0.312), further highlighting the emphasis of this component on size-related attributes.
In summary, PCA revealed that the main sources of variation in the dataset are related to traits involved in productivity, morphology, and antioxidant capacity, which are influenced by the interaction of genotype, water availability, and nutrient management.
Furthermore, the Pearson correlation analysis reveals several strong associations between morphological, physiological, and biochemical traits across cultivars, irrigation norms, and fertilization treatment interactions (Figure 9). The seeds' weight percentage, chlorophyll content index (CCI), assimilation rate, grain mass, and seeds per pod are positively correlated among themselves, with low to moderate correlations (e.g., assimilation rate vs. seeds per pod: r = 0.35; CCI vs. grain mass: r = 0.33). Bean width is weakly negatively correlated with bean thickness (r = −0.13) and bean length (r = −0.14), while it is strongly positively correlated with pod width (r = 0.74). The seeds' weight percentage and grain mass (r = 0.37) indicate that heavier seeds contribute significantly to total grain yield. As expected, pericarp weight percentage was strongly negatively correlated with seed weight percentage (r = –1.00), reflecting their complementary relationship within total pod mass. Additionally, the pericarp weight percentage exhibits a negative correlation with grain mass (r = −0.37), indicating that higher pericarp content may limit harvestable seed yield. TGW correlates moderately positively with bean length (r = 0.50), but has a low negative correlation with grain mass (r = −0.10).
A notable pattern emerged between photosynthetic traits and antioxidant capacity: both assimilation rate and CCI were negatively correlated with DPPH and ABTS activities (r ranging from –0.17 to –0.53), suggesting that increased photosynthetic performance may be linked to lower antioxidant levels. Furthermore, the number of seeds per pod showed a positive correlation with both the assimilation rate (r = 0.35) and CCI (r = 0.30), reinforcing the connection between photosynthetic efficiency and reproductive success. The weak negative correlation between ABTS and DPPH (r = –0.17) further indicates that the two antioxidant assays only partially measure the same aspects of antioxidant potential in the studied samples. Likewise, biometrical traits of pods and seeds, such as pod length, pod width, seed size, and seed weight, also showed negative correlations with both antioxidant assays. These findings suggest a possible trade-off between yield-related morphological traits and biochemical quality indicators, where genotypes or treatments that promote higher productivity may exhibit lower antioxidant potential.
4. Discussion
The findings of this study demonstrate that cultivar, irrigation regime, and fertilisation strategy significantly influence the physiological, biometric, and biochemical traits of runner bean, both through individual and interactive effects.
The cultivar and fertilization significantly influenced the photosynthetic assimilation rate, whereas irrigation alone had no statistically significant effect. Cozia1 showed notably higher photosynthetic performance than the other two cultivars, highlighting the significance of genetic variability under the same environmental conditions. The influence of genetic variation on photosynthetic efficiency has been consistently documented in the literature, as reported by Álvarez-Iglesias et al. [47] in six maize inbred lines, by Huo and Guo [48] in four chestnut cultivars, as well as by Gong et al. [49] and Ukwu et al. [50] in various mung bean genotypes. The increase in photosynthetic assimilation rate of runner beans with organic fertilization, as shown in this study, compared to both chemically fertilized and unfertilized options, is probably due to better soil structure, increased microbial activity, and sustained nutrient release associated with organic amendments [28,51]. Unlike chemical fertilization, which often leads to rapid but short-term nutrient availability, organic inputs contribute to a more balanced and prolonged nutrient supply, promoting better root development and more efficient assimilation of essential elements such as nitrogen and phosphorus. In contrast, the unfertilized control exhibited reduced photosynthetic efficiency, likely due to nutrient limitations and lower soil biological activity [52,53]. Similarly, Precupeanu et al. [54] found a significantly higher assimilation rate in organically fertilized perennial wall rocket compared to the chemically fertilized and unfertilized treatments.
Although individual factors did not significantly influence the chlorophyll content index (CCI), Cozia1 consistently recorded the highest values, suggesting a possible genotype-related capacity for higher pigment accumulation under the same environmental conditions. A slight increase in CCI was observed in chemically fertilized plants, whereas the lowest values were found in the unfertilized variants, likely due to nutrient limitations that hindered chlorophyll biosynthesis [28]. The higher CCI values in plants treated with chemical fertilizers are due to the immediate availability of essential nutrients, especially nitrogen which plays a crucial role in the formation of photosynthetic pigments. Chemical fertilizers, being highly soluble, provide nitrogen in readily available forms, leading to rapid chlorophyll accumulation, especially in the early vegetative stages [55]. Conversely, organic fertilizers release nutrients more gradually because soil microorganisms must mineralize nitrogen before plants can absorb it. This slow nutrient release may reduce chlorophyll accumulation but can support extended pigment synthesis, particularly in later growth stages [52,53].
The interaction between genotype and irrigation regime revealed differences in water needs among cultivars, indicating that each genotype responds uniquely to water availability based on its physiological traits. For example, Cozia1 under the lower irrigation regime (IR1) exhibited a higher photosynthetic assimilation rate and increased chlorophyll accumulation, indicating an efficient physiological adjustment to a limited water supply. Conversely, Cozia2 displayed higher values in both physiological responses. Cozia3 did not show a strong preference for any specific irrigation regime, as its physiological responses remained relatively consistent across different treatments. This suggests a more generalized or less sensitive adaptation to water supply variations. These findings suggest that Cozia1 responds to moderate irrigation by prioritizing physiological processes, such as photosynthetic activity and chlorophyll accumulation, whereas Cozia3 may rely on alternative adaptive mechanisms to maintain performance under varying water regimes. This genotype-specific behaviour suggests that traits like water use efficiency and stomatal regulation play key roles in mediating responses to irrigation, as also noted in previous studies [56,57]. Similarly, Papathanasiou et al. [58] observed genotype-dependent variation in chlorophyll content in Phaseolus vulgaris L., which was not significantly affected by irrigation treatments, further supporting the genotype-driven nature of physiological adaptation.
Variation in physiological responses due to the interaction between cultivar and nutrient supply observed in this study confirms that genotypic traits strongly influence nutrient uptake and utilization efficiency [51,59]. Specifically, Cozia1 showed better performance in CO₂ assimilation rate and chlorophyll content index (CCI) under chemical fertilisation, indicating high responsiveness to available nutrient forms. Conversely, Cozia2 exhibited the highest CO₂ assimilation in the unfertilised control and the highest CCI under organic fertilisation, suggesting a greater adaptability to low-input or organic systems. Cozia3 outperformed the others two cultivars under organic fertilisation for both parameters, demonstrating efficient use of organic nutrients. The preference of certain cultivars for specific types of fertilisers was also reported by Jawad Moharam Al-Bayati et al. [60] in their study on pea. The local cultivar exhibited higher chlorophyll content under organic fertilisation with poultry manure, whereas the Holland Ian cultivar responded better to chemical fertilisation. In another study, it was found that the basil cultivar Aromat de Buzău showed a higher CO₂ assimilation rate under chemical fertilisation, whereas the cultivars Macedon, Cuișoare, and Serafim performed better under organic fertilisation [61].
The interaction between irrigation regime and fertilisation highlights the complex influence of water and nutrient availability on plant physiological responses. The highest photosynthetic rate was observed in the IR1 × OR (organic fertilisation) treatment, closely followed by the IR2 × CH (chemical fertilisation) treatment, with no significant difference between them. On the other hand, the IR1 × CH treatment resulted in the lowest photosynthetic rate, suggesting a possible discrepancy between low irrigation and chemical fertilisation under the tested conditions. Interestingly, chlorophyll pigment accumulation increased under the IR1 × CH combination. At the same time, the IR2 × CH variant showed reduced chlorophyll content, indicating that pigment accumulation and photosynthesis may respond differently to the interaction of irrigation and fertilisation. These differences are likely due to the complex interaction among nutrient availability, water supply, and genotype-specific physiological responses. As Cheng et al. [62] explain, water is essential for nutrient uptake, as nutrients must be dissolved in water to be absorbed by plants. Therefore, the low photosynthesis in IR1 × CH may be due to limited nutrient solubilisation caused by insufficient water, despite higher chlorophyll levels, which may reflect a compensatory response. Conversely, the IR1 × OR combination likely provided a balanced nutrient release and optimal soil conditions, thereby supporting higher photosynthetic activity.
Following the analysis of genotype × fertilisation and irrigation × fertilisation interactions, the combined effect of the three factors revealed that different irrigation and fertilisation regimes affect the three runner bean cultivars in distinct ways. Cozia1 exhibited the lowest photosynthetic rate and CCI under the IR2 × UF treatment, indicating a negative response to increased irrigation without fertilization. On the other hand, Cozia2 was most effective in these conditions, indicating it adapts better to higher water levels even without extra nutrients. The IR1 × UF combination had the most negative impact on Cozia3, demonstrating its sensitivity to water and nutrient shortages. Statistically, the photosynthetic rate was more affected by the treatment combinations than CCI, which stayed relatively stable across varieties. The highest CCI was observed in Cozia1 under IR1 × CH, though differences were not highly significant. Overall, these findings emphasise the need for cultivar-specific irrigation and fertilization plans to enhance physiological performance.
Analysis of the individual influence of factors revealed that genotype had a significant effect on the biometric traits of pods and seeds, emphasising its key role in determining morphological characteristics. These findings align with previous research that highlighting the significance of genetic variability in influencing yield-related and morphological traits [20,63,64,65]. Significant variations related to genotype were observed in almost all parameters, apart from the number of seeds per pod. Among the cultivars, Cozia2 exhibited the highest number of pods per plant and seed weight percentage, reflecting strong reproductive vigour compared to the other two cultivars. Cozia1 showed superior pod length and pericarp weight, while Cozia3 had the largest pod width. In contrast, the irrigation regime induced significant variation in the number of pods per plant, seed weight percentage, and pericarp weight percentage. These results highlight the critical role of water availability during key developmental stages such as pod formation and seed filling. Increased irrigation probably enhances assimilate transport and allocation to reproductive structures, thereby improving these yield-related parameters. This finding aligns with results from other studies, which have reported improved reproductive efficiency and seed development under optimal water supply conditions [66,67,68]. Fertilisation had a significant impact on the number of pods per plant, pod width, and grain mass, indicating that nutrient availability plays key roles in shaping pod and seed development [28,69].
The two-way interactions of factors (genotype × irrigation, genotype × fertilization, and irrigation × fertilization) revealed that the biometric response of runner beans depends on a specific combination of genotype and irrigation or fertilisation regime. This suggests that the adaptability and performance of cultivars are strongly influenced by their interactions with water and nutrient availability. Although the interaction between genotype and irrigation did not generally lead to significant differences in the biometric traits analysed, cultivar-specific responses were observed. Notably, Cozia1 showed an inverse relationship with increasing irrigation volume, with most biometric parameters decreasing with increasing water intake. In contrast, Cozia2 and Cozia3 responded positively to increased irrigation, improving in several yield-related traits. These contrasting responses suggest variations in water use efficiency and adaptive strategies among the cultivars, with Cozia1 potentially better suited to moderate or limited water conditions, while Cozia2 and Cozia3 benefit more from greater water availability. Similar results were reported by El-Noemani et al. [70], who observed differential responses to irrigation between the Bronco and Paulista bean varieties, further supporting the idea that water availability interacts differently with specific genotypes.
Genotype × fertilisation interactions revealed distinct nutrient requirements among cultivars. Cozia2 × CH showed the highest pod number, with a 23% increase compared to the unfertilised variant, while Cozia2 × OR recorded the highest seed weight percentage, suggesting enhanced reproductive allocation under organic input. Pod length was maximised in Cozia1 × CH, 7.5% longer than in Cozia3 × UF. Seed size and TGW also varied, with Cozia2 × UF having the best results, while Cozia2 × OR and Cozia1 × OR showed weaker responses. These results emphasise the importance of aligning fertilisation regimes with genotype-specific nutrient requirements to maximise yield and quality. Under the influence of irrigation and fertilisation, it was found that the highest pod number, pericarp weight percentage, and pod width were in the IR2 × CH variant. Conversely, IR1 × CH yielded the most significant number of seeds per pod and the longest pods, highlighting different nutrient uptake dynamics under varying water availability. Poor performance under IR1 × UF emphasises the combined effect of water and nutrient limitations. For bean traits, the IR2 × OR interaction improved seed length, thickness, and yield, while the lowest TGW and yield were recorded under IR1 × OR and IR2 × UF, respectively. These findings suggest that achieving optimal productivity requires aligning fertilisation strategies with irrigation levels to meet genotype-specific demands, as observed by Khlila et al. [71] in wheat cultivation, Dong et al. [72] in peanuts, or by Song et al. [73] in tomatoes.
Analysis of the three-factor interactions revealed that Cozia2 is a cultivar more sensitive to variations in both fertilisation and irrigation regimes, compared to the other two cultivars tested. For example, Cozia2 recorded the highest number of pods under the IR2 × CH interaction, while the lowest number was also observed in Cozia2 under IR1 × CH. This cultivar also had the highest TGW under the IR2 × UF treatment and lowest under IR1 × OR, confirming the high resilience of this genotype to environmental conditions. Regarding the number of seeds per pod, Cozia2 again showed marked sensitivity, registering the highest value under the IR1 × CH interaction and the lowest under IR1 × UF. In contrast, the other two cultivars exhibited relatively stable and intermediate values for this trait regardless of fertilisation and irrigation variations.
Variation in genotype, irrigation and fertilisation regimes, as well as their interactions, had a significant impact on bean seed quality. Biochemical analyses revealed that Cozia3 recorded the highest total polyphenol content (TPC) in seeds, significantly surpassing the other two cultivars. In contrast, the individual effects of irrigation and fertilization did not lead to substantial changes in TPC levels in runner bean seeds. However, their interaction with genotype had a pronounced impact on polyphenol accumulation. Under different irrigation regimes, Cozia3 reached the highest TPC level in the IR1 variant, while Cozia1 achieved comparable levels under IR2. With respect to fertilization, Cozia3 again showed the highest TPC, particularly under organic fertilization, whereas Cozia1 responded best to chemical fertilization. Compared with Cozia1 × OR and Cozia1 × UF, which had the lowest TPC levels, the TPC in Cozia3 × OR was approximately 36% higher. The interaction between irrigation and fertilization identified IR1 × CH and IR2 × OR as the most favorable combinations for TPC accumulation. Moreover, the three-way interaction (cultivar × irrigation × fertilization) revealed that the highest TPC was recorded in the Cozia1 × IR1 × CH combination (0.47 mg GAE·100 g−1 d.w.), followed by Cozia3 × IR1 × OR (0.45 mg GAE·100 g−1 d.w.) and Cozia3 × IR2 × OR (0.43 mg GAE·100 g−1 d.w.). These findings suggest that, in the case of Cozia3, the fertilisation type has a relatively limited influence, while genotype and irrigation level play a more significant role in determining TPC content.
Antioxidant compound accumulation, as determined by the DPPH assay, was primarily influenced by fertilisation strategy and genotype, rather than by irrigation alone. Chemical fertilisation resulted in a marked increase in antioxidant levels across treatments, suggesting a stimulatory effect on secondary metabolism. Among the studied genotypes, Cozia3 consistently displayed the highest antioxidant content in seeds, indicating a superior capacity to synthesise or accumulate these compounds under favourable nutritional conditions. The two-way interaction between genotype and irrigation did not produce significant changes in antioxidant content across any cultivar. However, the combination of Cozia3 and chemical fertilization resulted in a marked increase in antioxidant accumulation. The results associated with the interaction between irrigation and fertilisation showed that the IR2 × CH treatment produced the highest antioxidant levels, while the IR2 × OR treatment resulted in the lowest. The three-way interaction (genotype × irrigation × fertilization) further highlighted significant differences, with the highest antioxidant content observed in Cozia3 × IR2 × CH, and the lowest in Cozia2 × IR2 × OR. Overall, DPPH antioxidant activity varied by 47%, confirming the superior antioxidant potential of Cozia3 under nutrient-rich and well-irrigated conditions. Although the ABTS assay did not show strong overall statistical significance across individual factors, significant differences appeared in the interaction between genotype and irrigation regime, as well as in the three-way interaction involving genotype, irrigation, and fertilisation. These results suggest that the antioxidant activity assessed by ABTS is more influenced by a combination of environmental and genetic factors rather than by individual factors alone. The 23% difference between Cozia1 × IR2 × UF and Cozia2 × IR2 × UF underscores the importance of genotype-specific responses, even when external conditions are identical.
The findings of this study therefore align with the hypothesis that genetic background plays a primary role in modulating the synthesis of polyphenols and antioxidant compounds in bean seeds—a trend also reported in the studies conducted by Carbas et al. [74], Yang et al. [75], Yaneva et al. [76], García-Díaz et al. [77] or Kivu et al. [78]. While environmental and agronomic factors, such as irrigation and fertilisation, also influenced antioxidant levels, their effects were secondary and strongly dependent on genotype. Enhanced nutrient and water availability appeared to stimulate key physiological processes and promote the biosynthesis of secondary metabolites in reproductive organs, particularly in seeds. This observation is consistent with the findings of Salas-Salazar et al. [79], who reported that variation in fertilisation regimes significantly alters the content of bioactive compounds in Pinto Centauro bean. In addition, the findings of Nina et al. [80] support the idea that water stress can lead to increased levels of phenolic and antioxidant compounds in Phaseolus vulgaris L., highlighting the role of irrigation as a critical environmental factor influencing antioxidant metabolism. Together, these studies reinforce the view that both nutrient availability and water regime can modulate antioxidant profiles in a genotype-dependent manner.
In addition to the above, PCA results revealed that traits associated with photosynthetic efficiency, seed productivity, and antioxidant capacity were the main contributors to overall variability, reflecting the combined influence of genotype, irrigation regime, and fertilisation type. These traits proved to be highly responsive to both environmental and genetic factors, highlighting their potential as reliable indicators of physiological performance and adaptability. Furthermore, through Pearson correlation analysis the aim was to validate these associations and explore direct relationships among traits. This revealed that assimilation rate, CCI, seed weight percentage, grain mass, and seeds per pod showed low to moderate positive correlations, indicating interconnected effects on productivity. A strong negative correlation was observed between pericarp and seed weight percentages, reflecting their complementary roles in pod structure. Photosynthetic traits (assimilation rate and CCI) were negatively correlated with antioxidant activity (DPPH and ABTS), suggesting a trade-off between growth efficiency and antioxidant accumulation. Additionally, yield-related traits showed weak to moderate negative associations with antioxidant capacity, indicating that higher productivity may come at the detriment of biochemical quality. The correlation patterns supported the PCA findings and underscored the functional interdependence between physiological traits and yield-related performance, emphasizing their relevance in selecting genotypes with superior adaptability under varying environmental and management conditions.
To further analyze the relationships among traits, both PCA and Pearson correlation analyses were conducted on data subsets organized by cultivar, irrigation regime, and fertilization type. This approach, which focused on subgroups, revealed notable differences in trait behavior and variability, highlighting the influence of genotype and treatment on runner bean responses (Figures S1-S3). For example, the Pearson correlation analysis showed that photosynthetic efficiency traits of Cozia1, exhibited strong positive correlations with each other (r = 0.76), but assimilation rate was negatively associated with several pod and bean morphological traits, most notably bean thickness (r = –0.89). In contrast, Cozia2 and Cozia3 exhibited more favorable correlations between photosynthetic efficiency and yield components. In Cozia2, assimilation rate was positively associated with pod width, bean dimensions, and TGW (r > 0.65), indicating efficient physiological-to-yield conversion. Moderate positive correlations were also observed in Cozia3, particularly with pods per plant (r = 0.26) and seeds per pod (r = 0.45). Regarding antioxidant traits, Cozia1 showed strong negative correlations between ABTS and both assimilation rate (r = –0.91) and grain mass (r = –0.86), implying a potential trade-off between stress protection and productivity. A similar trend was found in Cozia3, while Cozia2 displayed weak or inconsistent associations, suggesting a more balanced relationship between oxidative stress responses and yield (Figure S1).
The analysis of the irrigation regime showed that under IR1 (the lower amount of irrigation), the relationships between physiological traits and morpho-agronomic characteristics ranged from weak to strong positive correlations. This suggests a consistent and beneficial interaction between functional traits and yield-related parameters. In contrast, under IR2 (higher irrigation amount), these relationships tended to be weakly positive or even negative, indicating a disruption in the coordination between physiological processes and agronomic performance, potentially due to waterlogging (Figure S2). As reported by Topali et al. [81] and Luo et al. [82], excessive irrigation can cause nutrient leaching and oxygen deficiency in the root zone, which may impair root function and plant development.
In addition, correlation analysis revealed distinct patterns between fertilization regimes (Figure S3). In the case of chemical fertilization, the relationships between physiological, morphological, and biochemical traits were generally stronger and more consistent, suggesting improved coordination between plant function and yield. In contrast, the organic regime showed more balanced and selective correlations, particularly strengthening associations between seed traits, which may indicate a more efficient allocation of internal resources in the case of natural nutrient sources. At the same time, the unfertilized condition showed predominantly weak or negative correlations, particularly between physiological traits (e.g., assimilation rate) and biochemical traits (e.g., TPC, DPPH), highlighting a potential disruption of plant function due to nutrient limitation.
5. Conclusions
The findings of this study demonstrate that cultivar, irrigation regime, and fertilisation strategy significantly influence the physiological, morphological, and biochemical traits of runner bean, both individually and through interactive effects. Among these, genotype exerted the predominant influence under temperate conditions specific to the north-eastern region of Romania.
Photosynthetic parameters were generally higher in Cozia1 and Cozia2 cultivars, particularly under chemical or organic fertilisation and their combinations. In contrast, biochemical markers such as total polyphenol content (TPC) and DPPH antioxidant activity reached their highest levels in Cozia3, especially under chemical fertilisation. Interestingly, ABTS activity was highest in Cozia1 under unfertilised or organically fertilised conditions, suggesting a differential cultivar response depending on the antioxidant mechanism.
Furthermore, the analysis of three-factor interactions revealed that Cozia2 is more sensitive to variations in both fertilization and irrigation regimes compared to the other two cultivars tested. For instance, Cozia2 recorded the highest number of pods under the IR2 × CH interaction, while it showed the lowest number under IR1 × CH. This cultivar also had the highest thousand grain weight under the IR2 × UF treatment and the lowest under IR1 × OR, confirming its high resilience to environmental conditions. Regarding the number of seeds per pod, Cozia2 demonstrated notable sensitivity, achieving the highest value under the IR1 × CH interaction and the lowest under IR1 × UF. In contrast, the other two cultivars exhibited relatively stable and intermediate values for these traits, regardless of variations in fertilization and irrigation.
Overall, these findings provide valuable insights into the adaptability and performance of runner bean cultivars in temperate climates, emphasizing the importance of optimizing input combinations based on genotype-specific responses. However, further studies are needed to confirm these results across different environments and growing seasons. Future research should also consider the formal registration of these cultivars as official varieties. Moreover, given the comparable performance of organic and chemical fertilisation, investigating integrated nutrient management strategies, including the use of organic fertilisers combined with microbial biofertilisers, could support the development of more sustainable and resilient cultivation systems.
Supplementary Materials
The following supporting information can be downloaded at the website of this paper posted on Preprints.org, Figure S1: PCA score plots and Pearson correlation heatmaps showing the variation in physiological, biometric, and biochemical traits of runner bean under the influence of genotype; Figure S2: PCA score plots and Pearson correlation heatmaps showing the variation in physiological, biometric, and biochemical traits of runner bean under the influence of irrigation norm; Figure S3: PCA score plots and Pearson correlation heatmaps showing the variation in physiological, biometric, and biochemical traits of runner bean under the influence fertilization regime; Table S1: Eigenvalues of the correlation matrix showing the affinities of the physiological, biometric, and biochemical traits of runner bean to PCs.
Author Contributions
Conceptualization, V.S., G.R., and G.-C.T.; methodology, G.R., G.-C.T., J.L.O.-D., J.M.M.-R. and V.S.; validation, V.S., J.M.M.-R. and M.R.; formal analysis, G.R. and M.R.; investigation, G.R., C.P., M.R. and G.-C.T.; data curation, G.R., C.P., G.-C.T., M.R., J.L.O.-D., J.M.M.-R. and V.S.; writing—original draft preparation, G.R., M.R. and V.S.; writing—review and editing, G.R., M.R. and V.S.; supervision, J.M.M.-R. and V.S. All authors have read and agreed to the published version of the manuscript.
Funding
This research received no external funding.
Institutional Review Board Statement
Not applicable
Data Availability Statement
Data are contained within the article.
Acknowledgments
The authors express their deep gratitude to “Ion Ionescu de la Brad” Iasi University of Life Sciences, Romania, and the Andalusian Institute of Agricultural and Fisheries Research and Training, Cordoba, Spain, for their invaluable support throughout the execution of this study.
Conflicts of Interest
The authors declare that they have no conflicts of interest.
References
- Sánchez-Chino, X.; Jiménez-Martínez, C.; Dávila-Ortiz, G.; Álvarez-González, I.; Madrigal-Bujaidar, E. Nutrient and Nonnutrient Components of Legumes, and Its Chemopreventive Activity: A Review. Nutrition and Cancer 2015, 67, 401–410. [Google Scholar] [CrossRef]
- Suárez-Martínez, S.E.; Ferriz-Martínez, R.A.; Campos-Vega, R.; Elton-Puente, J.E.; De La Torre Carbot, K.; García-Gasca, T. Bean Seeds: Leading Nutraceutical Source for Human Health. CyTA - Journal of Food 2016, 14, 131–137. [Google Scholar] [CrossRef]
- Cardador-Martínez, A.; Castaño-Tostado, E.; Loarca-Piña, G. Antimutagenic Activity of Natural Phenolic Compounds Present in the Common Bean (Phaseolus vulgaris) against Aflatoxin B 1. Food Additives and Contaminants 2002, 19, 62–69. [Google Scholar] [CrossRef]
- Alvarado-López, A.N.; Gómez-Oliván, L.M.; Heredia, J.B.; Baeza-Jiménez, R.; Garcia-Galindo, H.S.; Lopez-Martinez, L.X. Nutritional and Bioactive Characteristics of Ayocote Bean (Phaseolus coccienus L.): An Underutilized Legume Harvested in Mexico. CyTA - Journal of Food 2019, 17, 199–206. [Google Scholar] [CrossRef]
- Díaz-Batalla, L.; Widholm, J.M.; Fahey, G.C.; Castaño-Tostado, E.; Paredes-López, O. Chemical Components with Health Implications in Wild and Cultivated Mexican Common Bean Seeds (Phaseolus vulgaris L.). J. Agric. Food Chem. 2006, 54, 2045–2052. [Google Scholar] [CrossRef] [PubMed]
- Oomah, B.D.; Corbé, A.; Balasubramanian, P. Antioxidant and Anti-Inflammatory Activities of Bean (Phaseolus vulgaris L.) Hulls. J. Agric. Food Chem. 2010, 58, 8225–8230. [Google Scholar] [CrossRef] [PubMed]
- Calles, T. The International Year of Pulses: What Are They and Why Are They Important? Agriculture for Development 27 2016, 40–42. [Google Scholar]
- Acosta-Diaz, E.; Hernandez-Torres, I.; Amador-Ramirez, M.D.; Padilla-Ramirez, J.S.; Zavala-García, F.; Baez-Gonzalez, A.D. Collection and Characterization of Wild Species of Phaseolus (Fabaceae) in Northeastern Mexico for Ex Situ Conservation. Plecevo 2015, 148, 119–127. [Google Scholar] [CrossRef]
- Giurcă, D.M. Morphological and Phenological Differences between the Two Species of the Phaseolus Genus (Phaseolus vulgaris and Phaseolus coccineus). Cercetari Agronomice in Moldova 2008, 42, 39–45. [Google Scholar]
- Assunção Neto, W.V.D.; Medeiros, A.M.; Carvalho, L.C.B.; Ferreira, C.D.S.; Lopes, A.C.D.A.; Gomes, R.L.F. Selection of Landraces of Lima Bean for Family Agriculture. Rev. Caatinga 2022, 35, 137–147. [Google Scholar] [CrossRef]
- Myers, J.R.; Formiga, A.K.; Janick, J. Iconography of Beans and Related Legumes Following the Columbian Exchange. Front. Plant Sci. 2022, 13, 851029. [Google Scholar] [CrossRef] [PubMed]
- Alcázar-Valle, M.; Lugo-Cervantes, E.; Mojica, L.; Morales-Hernández, N.; Reyes-Ramírez, H.; Enríquez-Vara, J.N.; García-Morales, S. Bioactive Compounds, Antioxidant Activity, and Antinutritional Content of Legumes: A Comparison between Four Phaseolus Species. Molecules 2020, 25, 3528. [Google Scholar] [CrossRef] [PubMed]
- Sicard, D.; Nanni, L.; Porfiri, O.; Bulfon, D.; Papa, R. Genetic Diversity of Phaseolus Vulgaris L. and P. Coccineus L. Landraces in Central Italy. Plant Breeding 2005, 124, 464–472. [Google Scholar] [CrossRef]
- Romero-Astudillo, M.J.; Tapia, C.; Giménez De Azcárate, J.; Montalvo, D. Diversity of Common Bean (Phaseolus vulgaris L.) and Runner Bean (Phaseolus coccineus L.) Landraces in Rural Communities in the Andes Highlands of Cotacachi—Ecuador. Agronomy 2024, 14, 1666. [Google Scholar] [CrossRef]
- Popa, L.-D. Research on agrobiology of Phaseolus coccineus L., in order to optimize the cultivation., University of Agricultural Sciences and Veterinary Medicine: Iasi, Romania., 2010.
- Rodiño, A.P.; Lema, M.; Pérez-Barbeito, M.; Santalla, M.; De Ron, A.M. Assessment of Runner Bean (Phaseolus coccineus L.) Germplasm for Tolerance to Low Temperature during Early Seedling Growth. Euphytica 2007, 155, 63–70. [Google Scholar] [CrossRef]
- Labuda, H. Runner Bean (Phaseolus coccineus L.) - Biology and Use. Acta Scientiarum Polonorum, 2010, 9, 117–132. [Google Scholar]
- Vargas Vázquez, Ma.L.P.; Muruaga Martínez, J.S.; Lépiz Ildefonso, R.; Pérez Guerrero, A. La colección INIFAP de frijol ayocote (Phaseolus coccineus L.) I. Distribución geográfica de sitios de colecta. Remexca 2012, 3, 1247–1259. [Google Scholar] [CrossRef]
- Munteanu, N. Preliminary study on biodiversity of species Phaseolus coccineus L. Scientific Papers, USAMV Iaşi 2005, 83–92.
- Sinkovič, L.; Pipan, B.; Vasić, M.; Antić, M.; Todorović, V.; Ivanovska, S.; Brezeanu, C.; Šuštar-Vozlič, J.; Meglič, V. Morpho-Agronomic Characterisation of Runner Bean (Phaseolus coccineus L.) from South-Eastern Europe. Sustainability 2019, 11, 6165. [Google Scholar] [CrossRef]
- Schwember, A.R.; Carrasco, B.; Gepts, P. Unraveling Agronomic and Genetic Aspects of Runner Bean (Phaseolus coccineus L.). Field Crops Research 2017, 206, 86–94. [Google Scholar] [CrossRef]
- Rose, T.; Lowe, C.; Miret, J.A.; Walpole, H.; Halsey, K.; Venter, E.; Urban, M.O.; Buendia, H.F.; Kurup, S.; O’Sullivan, D.M.; et al. High Temperature Tolerance in a Novel, High-Quality Phaseolus vulgaris Breeding Line Is Due to Maintenance of Pollen Viability and Successful Germination on the Stigma. Plants 2023, 12, 2491. [Google Scholar] [CrossRef]
- Karavidas, I.; Ntatsi, G.; Vougeleka, V.; Karkanis, A.; Ntanasi, T.; Saitanis, C.; Agathokleous, E.; Ropokis, A.; Sabatino, L.; Tran, F.; et al. Agronomic Practices to Increase the Yield and Quality of Common Bean (Phaseolus vulgaris L.): A Systematic Review. Agronomy 2022, 12, 271. [Google Scholar] [CrossRef]
- Alicandri, E.; Badiani, E.; Paolacci, A.R.; Lo Presti, E.; Caridi, R.; Rea, R.; Pati, F.; Badiani, M.; Ciaffi, M.; Sorgonà, A. Screening for Drought Tolerance Within a Common Bean (Phaseolus vulgaris L.) Landrace Accessions Core Collection from the Lazio Region of Italy. Plants 2024, 13, 3132. [Google Scholar] [CrossRef]
- Climate Change 2014: Impacts, Adaptation, and Vulnerability: Working Group II Contribution to the Fifth Assessment Report of the Intergovernmental Panel on Climate Change; Field, C. B., Barros, V.R., Intergovernmental Panel on Climate Change, Eds.; Cambridge University Press: New York, NY, 2014; ISBN 978-1-107-64165-5. [Google Scholar]
- Morton, J.F. The Impact of Climate Change on Smallholder and Subsistence Agriculture. Proc. Natl. Acad. Sci. U.S.A. 2007, 104, 19680–19685. [Google Scholar] [CrossRef] [PubMed]
- Pereira, L.S.; Cordery, I.; Iacovides, I. Improved Indicators of Water Use Performance and Productivity for Sustainable Water Conservation and Saving. Agricultural Water Management 2012, 108, 39–51. [Google Scholar] [CrossRef]
- Teliban, G.-C.; Stoleru, V.; Bireescu, G.; Mihalache, G.; Burducea, M.; Munteanu, N.; Țopa, D.; Matei, G.; Rădeanu, G.; Popa, L.-D.; et al. The Response of Runner Bean Crop to Irrigation and Fertilization. RAR 2022, 39, 269–281. [Google Scholar] [CrossRef]
- Kawaka, F.; Dida, M.; Opala, P.; Ombori, O.; Maingi, J.; Amoding, A.; Muoma, J. Effect of Nitrogen Sources on the Yield of Common Bean (Phaseolus vulgaris) in Western Kenya. Journal of Plant Nutrition 2018, 41, 1652–1661. [Google Scholar] [CrossRef]
- Santosa, M. ; Maghfoer, Moch.D.; Tarno, H. The Influence of Organic and Inorganic Fertilizers on the Growth and Yield of Green Bean, Phaseolus vulgaris L. Grown in Dry and Rainy Season. Agrivita.J.Agr.Sci 2017, 39. [CrossRef]
- Kontopoulou, C.-K.; Bilalis, D.; Pappa, V.A.; Rees, R.M.; Savvas, D. Effects of Organic Farming Practices and Salinity on Yield and Greenhouse Gas Emissions from a Common Bean Crop. Scientia Horticulturae 2015, 183, 48–57. [Google Scholar] [CrossRef]
- Uyanoz, R. The Effects of Different Bio-Organic, Chemical Fertilizers and Their Combination on Yield, Macro and Micro Nutrition Content of Dry Bean (Phaseolus vulgaris L.). International Journal of Agricultural Research 2007, 2, 115–125. [Google Scholar] [CrossRef]
- Karungi, J.; Ekbom, B.; Kyamanywa, S. Effects of Organic versus Conventional Fertilizers on Insect Pests, Natural Enemies and Yield of Phaseolus vulgaris. Agriculture, Ecosystems & Environment 2006, 115, 51–55. [Google Scholar] [CrossRef]
- Prabhakar, M.; Hebbar, S.S.; Nair, A.K. Growth and Yield of French Bean (Phaseolus vulgaris L.) under Organic Farming. JAH 2011, 13, 72–73. [Google Scholar] [CrossRef]
- Fernández-Luqueño, F.; Reyes-Varela, V.; Martínez-Suárez, C.; Salomón-Hernández, G.; Yáñez-Meneses, J.; Ceballos-Ramírez, J.M.; Dendooven, L. Effect of Different Nitrogen Sources on Plant Characteristics and Yield of Common Bean (Phaseolus vulgaris L.). Bioresource Technology 2010, 101, 396–403. [Google Scholar] [CrossRef]
- Amalfitano, C. , Gomez, L.D., Frendo, P., De Pascale, S., Pepe, O., Simister, R., Ventorino V., Agrelli D., Borrelli C., McQueen-Mason, S.J., Caruso, G., Plant-Rhizobium Symbiosis, Seed Nutraceuticals, and Waste Quality for Energy Production of Vicia faba L. as Affected by Crop Management. Chemical and Biological Technologies in Agriculture 2018, 5.
- Bomers, S.; Sehr, E.M.; Adam, E.; Von Gehren, P.; Hansel-Hohl, K.; Prat, N.; Ribarits, A. Towards Heat Tolerant Runner Bean (Phaseolus coccineus L.) by Utilizing Plant Genetic Resources. Agronomy 2022, 12, 612. [Google Scholar] [CrossRef]
- Blair, M.W.; González, L.F.; Kimani, P.M.; Butare, L. Genetic Diversity, Inter-Gene Pool Introgression and Nutritional Quality of Common Beans (Phaseolus vulgaris L.) from Central Africa. Theor Appl Genet 2010, 121, 237–248. [Google Scholar] [CrossRef] [PubMed]
- Brandão, D. , de Freitas, P. S.L., Rezende, R., Dallacort, R., Garcia, M.M., Effects of Water Stress on Photosynthesis and Evapotranspiration in Common Bean Plants. Journal of Food, Agriculture & Environment 2013, 11, 383–388. [Google Scholar]
- Meteostat.net, Iaşi | Weather History & Climate Available online:. Available online: https://meteostat.net/en/place/ro/iasi (accessed on 28 July 2025).
- Stoleru, V.; Inculet, S.-C.; Mihalache, G.; Cojocaru, A.; Teliban, G.-C.; Caruso, G. Yield and Nutritional Response of Greenhouse Grown Tomato Cultivars to Sustainable Fertilization and Irrigation Management. Plants 2020, 9, 1053. [Google Scholar] [CrossRef]
- Hamburda, S.B.; Munteanu, N. The technology of runner beans (Phaseolus coccineus) cultivation, (in Romanian); Performantica: Iasi, Romania, 2016. [Google Scholar]
- Popa, D.L.; Teliban, G.C.; Stoleru, V.; Vlăduţ, N.V. Agrobiological principles of runner bean (Phaseolus coccineus L.) cultivation, (in Romanian); Ion Ionescu de la Brad: Iasi, Romania, 2020. [Google Scholar]
- Slinkard, K. , & Singleton, V. L. Total Phenol Analysis: Automation and Comparison with Manual Methods. American journal of enology and viticulture 1977, 28, 49–55. [Google Scholar]
- Cuevas, F.J.; Pradas, I.; Ruiz-Moreno, M.J.; Arroyo, F.T.; Perez-Romero, L.F.; Montenegro, J.C.; Moreno-Rojas, J.M. Effect of Organic and Conventional Management on Bio-Functional Quality of Thirteen Plum Cultivars (Prunus salicina Lindl. ). PLoS ONE 2015, 10, e0136596. [Google Scholar] [CrossRef]
- Martínez-Castaño, M.; Mejía Díaz, D.P.; Contreras-Calderón, J.; Gallardo Cabrera, C. Physicochemical Properties of Bean Pod (Phaseolus vulgaris) Flour and Its Potential as a Raw Material for the Food Industry. Rev. Fac. Nac. Agron. Medellín 2020, 73, 9179–9187. [Google Scholar] [CrossRef]
- Álvarez-Iglesias, L.; Vales, M.I.; De Ron, A.M.; Rodiño, A.P.; Tejada-Hinojoza, J.L.; Taboada, A.; Revilla, P. Variability of Photosynthetic and Related Traits in Maize and Other Summer Crops in a Temperate Humid Area. Plant Physiol. Rep. 2022, 27, 596–602. [Google Scholar] [CrossRef]
- Hou, Y.; Guo, S. Comparative Analysis of Photosynthetic Traits, Yield, and Fruit Quality Among Different Chestnut Cultivars. Agronomy 2024, 14, 2635. [Google Scholar] [CrossRef]
- Gong, X.; Liu, C.; Dang, K.; Wang, H.; Du, W.; Qi, H.; Jiang, Y.; Feng, B. Mung Bean (Vigna radiata L.) Source Leaf Adaptation to Shading Stress Affects Not Only Photosynthetic Physiology Metabolism but Also Control of Key Gene Expression. Front Plant Sci 2022, 13, 753264. [Google Scholar] [CrossRef]
- Ukwu, U.N.; Muller, O.; Meier-Grüll, M.; Uguru, M.I. Agrivoltaics Shading Enhanced the Microclimate, Photosynthesis, Growth and Yields of Vigna radiata Genotypes in Tropical Nigeria. Sci Rep 2025, 15, 1190. [Google Scholar] [CrossRef]
- Stefan, M.; Munteanu, N.; Stoleru, V.; Marius, M. Effects of Inoculation with Plant Growth Promoting Rhizobacteria on Photosynthesis, Antioxidant Status and Yield of Runner Bean. Romanian Biotechnological Letters 2013, 18, 8132–8143. [Google Scholar]
- Liu, Y.; Lan, X.; Hou, H.; Ji, J.; Liu, X.; Lv, Z. Multifaceted Ability of Organic Fertilizers to Improve Crop Productivity and Abiotic Stress Tolerance: Review and Perspectives. Agronomy 2024, 14, 1141. [Google Scholar] [CrossRef]
- Khan, M.T.; Aleinikovienė, J.; Butkevičienė, L.-M. Innovative Organic Fertilizers and Cover Crops: Perspectives for Sustainable Agriculture in the Era of Climate Change and Organic Agriculture. Agronomy 2024, 14, 2871. [Google Scholar] [CrossRef]
- Precupeanu, C.; Rădeanu, G.; Teliban, G.-C.; Roșca, M.; Ordóñez-Díaz, J.L.; Moreno-Rojas, J.M.; Stoleru, V. Effects of Mulch and Fertilization on the Quantity and Quality of Perennial Wall–Rocket (Diplotaxis tenuifolia). Plants 2025, 14, 1421. [Google Scholar] [CrossRef]
- Nasar, J.; Wang, G.-Y.; Ahmad, S.; Muhammad, I.; Zeeshan, M.; Gitari, H.; Adnan, M.; Fahad, S.; Khalid, M.H.B.; Zhou, X.-B.; et al. Nitrogen Fertilization Coupled with Iron Foliar Application Improves the Photosynthetic Characteristics, Photosynthetic Nitrogen Use Efficiency, and the Related Enzymes of Maize Crops under Different Planting Patterns. Front. Plant Sci. 2022, 13. [Google Scholar] [CrossRef]
- Asargew, M.F.; Masutomi, Y.; Kobayashi, K.; Aono, M. Water Stress Changes the Relationship between Photosynthesis and Stomatal Conductance. Science of The Total Environment 2024, 907, 167886. [Google Scholar] [CrossRef]
- Khonghintaisong, J.; Onkaeo, A.; Songsri, P.; Jongrungklang, N. Water Use Efficiency Characteristics and Their Contributions to Yield in Diverse Sugarcane Genotypes with Varying Drought Resistance Levels Under Different Field Irrigation Conditions. Agriculture 2024, 14, 1952. [Google Scholar] [CrossRef]
- Papathanasiou, F.; Ninou, E.; Mylonas, I.; Baxevanos, D.; Papadopoulou, F.; Avdikos, I.; Sistanis, I.; Koskosidis, A.; Vlachostergios, D.N.; Stefanou, S.; et al. The Evaluation of Common Bean (Phaseolus vulgaris L.) Genotypes under Water Stress Based on Physiological and Agronomic Parameters. Plants (Basel) 2022, 11, 2432. [Google Scholar] [CrossRef]
- Tantray, A.Y.; Hazzazi, Y.; Ahmad, A. Physiological, Agronomical, and Proteomic Studies Reveal Crucial Players in Rice Nitrogen Use Efficiency under Low Nitrogen Supply. International Journal of Molecular Sciences 2022, 23, 6410. [Google Scholar] [CrossRef]
- Jawad Moharam Al-Bayati, H. ; F. R.Ibraheem, F.; Allela, W.; Al-Taey, D. Role of Organic and Chemical Fertilizer on Growth and Yield of Two Cultivars of Pea (Pisum sativum L.). Plant Archives 2019, 19, 2581–6063. [Google Scholar]
- Teliban, G.-C.; Burducea, M.; Mihalache, G.; Zheljazkov, V.D.; Dincheva, I.; Badjakov, I.; Popa, L.-D.; Bodale, I.; Vlăduț, N.-V.; Cojocaru, A.; et al. Morphological, Physiological and Quality Performances of Basil Cultivars under Different Fertilization Types. Agronomy 2022, 12, 3219. [Google Scholar] [CrossRef]
- Cheng, M.; Wang, H.; Zhang, F.; Wang, X.; Liao, Z.; Zhang, S.; Yang, Q.; Fan, J. Effects of Irrigation and Fertilization Regimes on Tuber Yield, Water-Nutrient Uptake and Productivity of Potato under Drip Fertigation in Sandy Regions of Northern China. Agricultural Water Management 2023, 287, 108459. [Google Scholar] [CrossRef]
- Touckia, G.I.; Elian, H.D.B.; Aba-Toumnou, L.; Rekya, F.A.; Orolo, S.N.; Zimaga, D.B.; Yongo, O.D.; Kokou, K. Agro-Morphological Performances of Common Bean Varieties (Phaseolus vulgaris L.) Introduced in the Central African Republic. International Journal of Plant & Soil Science 2021, 1–9. [CrossRef]
- Geleta, R.J.; Roro, A.G.; Terfa, M.T. Phenotypic and Yield Responses of Common Bean (Phaseolus vulgaris L.) Varieties to Different Soil Moisture Levels. BMC Plant Biology 2024, 24, 242. [Google Scholar] [CrossRef]
- Arriagada, O.; Schwember, A.R.; Greve, M.J.; Urban, M.O.; Cabeza, R.A.; Carrasco, B. Morphological and Molecular Characterization of Selected Chilean Runner Bean (Phaseolus coccineus L.) Genotypes Shows Moderate Agronomic and Genetic Variability. Plants 2021, 10, 1688. [Google Scholar] [CrossRef]
- Petrova, R.; Matev, A. Defficit Irrigation for Green Beans - Late Fiеld Production. Scientific Papers. Series A. Agronomy 2020, LXIII, 475–483. [Google Scholar]
- Negash, T.W.; Tefera, A.T.; Bayisa, G.D.; Ashami, G.; Bizuneh, K.T.; Worku, T.; Gurms, A. Optimal Irrigation Water Allocation for Enhanced Productivity of Haricot Bean (Phaseolus vulgaris) and Economic Gain: An Experiment Conducted in the Semi-Arid Area of Ethiopia. Journal of Agriculture and Food Research 2025, 19, 101668. [Google Scholar] [CrossRef]
- Polania, J.A.; Poschenrieder, C.; Beebe, S.; Rao, I.M. Effective Use of Water and Increased Dry Matter Partitioned to Grain Contribute to Yield of Common Bean Improved for Drought Resistance. Front. Plant Sci. 2016, 7. [Google Scholar] [CrossRef]
- Nabati, J.; Nezami, A.; Yousefi, A.; Oskoueian, E.; Oskoueian, A.; Ahmadi-Lahijani, M.J. Biofertilizers Containing Plant Growth Promoting Rhizobacteria Enhance Nutrient Uptake and Improve the Growth and Yield of Chickpea Plants in an Arid Environment. Sci Rep 2025, 15. [Google Scholar] [CrossRef]
- El-Noemani, A.; El-Zeiny, H.; El-Gindy, A.-G.; El-Sahhar, E.; El-Shawadfy, M. Performance of Some Bean (Phaseolus vulgaris L.) Varieties under Different Irrigation Systems and Regimes. Australian Journal of Basic and Applied Sciences 2010, 4, 6185–6196. [Google Scholar]
- Khlila, I.; Baidani, A.; Hnizil, O.; Amamou, A. Integrated Management of Water, Nitrogen, and Genotype Selection for Enhanced Wheat Productivity in Moroccan Arid and Semi-Arid Regions. Agronomy 2025, 15, 612. [Google Scholar] [CrossRef]
- Dong, J.; Shen, X.; Zhang, X.; Chen, J.; Li, H.; Li, Q.; He, J.; Liu, H. Optimizing Water-Nitrogen Management Enhances Productivity for Peanut (Arachis hypogaea L.) with Drip-Irrigated under Mulched in Northwest of China. Agricultural Water Management 2025, 317, 109659. [Google Scholar] [CrossRef]
- Song, Y.; Xu, J.; Zhang, S.; Xing, J.; Wang, L.; Wang, X.; Hu, C.; Li, W.; Tan, Z.; Cheng, Y. Optimizing Water–Fertilizer Coupling Across Different Growth Stages of Tomato in Yellow Sand Substrate: Toward Enhanced Yield, Quality, and Resource Use Efficiency. Plants (Basel) 2025, 14, 936. [Google Scholar] [CrossRef] [PubMed]
- Carbas, B.; Machado, N.; Oppolzer, D.; Ferreira, L.; Queiroz, M.; Brites, C.; Rosa, E.A.; Barros, A.I. Nutrients, Antinutrients, Phenolic Composition, and Antioxidant Activity of Common Bean Cultivars and Their Potential for Food Applications. Antioxidants 2020, 9, 186. [Google Scholar] [CrossRef]
- Yang, Q.-Q.; Farha, A.K.; Cheng, L.; Kim, G.; Zhang, T.; Corke, H. Phenolic Content and in Vitro Antioxidant Activity in Common Beans (Phaseolus vulgaris L.) Are Not Directly Related to Anti-Proliferative Activity. Food Bioscience 2020, 36, 100662. [Google Scholar] [CrossRef]
- Yaneva, T.G.; Wiczkowski, W.; Marchev, A.S.; Iserliyska, D.; Georgiev, M.I.; Tomlekova, N.B. Evaluation of Polyphenols Synthesized in Mature Seeds of Common Bean (Phaseolus vulgaris L.) Advanced Mutant Lines. International Journal of Molecular Sciences 2024, 25, 5638. [Google Scholar] [CrossRef]
- García-Díaz, Y.D.; Aquino-Bolaños, E.N.; Chávez-Servia, J.L.; Vera-Guzmán, A.M.; Carrillo-Rodríguez, J.C.; García-Díaz, Y.D.; Aquino-Bolaños, E.N.; Chávez-Servia, J.L.; Vera-Guzmán, A.M.; Carrillo-Rodríguez, J.C. Bioactive Compounds and Antioxidant Activity in the Common Bean Are Influenced by Cropping Season and Genotype. Chilean journal of agricultural research 2018, 78, 255–265. [Google Scholar] [CrossRef]
- Kivu, B.E.; Ion, V.A.; Barcanu, E.; Agapie, O.L.; Gherase, I.; Dobre, G.; Moț, A.; Asănică, A. Comparative Study of the Chemical Composition of Some Bean Accessions. Acta Hortic. 2024, 247–252. [Google Scholar] [CrossRef]
- Salas-Salazar, N.A.; Sánchez-Chávez, E.; Sánchez, D.E.; Chávez-Martínez, A.; Soto-Caballero, M.C.; Flores-Cordova, M.A. Influence of Fertilization Schemes on Bioactive Compounds, Antioxidant Activity and Volatile Profile in Pinto Centauro Bean (Phaseolus vulgaris L.). Notulae Botanicae Horti Agrobotanici Cluj-Napoca 2025, 53, 14499–14499. [Google Scholar] [CrossRef]
- Nina, N.; Theoduloz, C.; Tapia, G.; Jimenéz-Aspee, F.; Márquez, K.; Schmeda-Hirschmann, G. Changes in Polyphenol Composition, Antioxidant Capacity and Enzyme Inhibition in Phaseolus Vulgaris L. Submitted to Hydric Stress. Scientia Horticulturae 2023, 317, 112070. [Google Scholar] [CrossRef]
- Topali, C.; Antonopoulou, C.; Chatzissavvidis, C. Effect of Waterlogging on Growth and Productivity of Fruit Crops. Horticulturae 2024, 10, 623. [Google Scholar] [CrossRef]
- Luo, H.; Liu, S.; Song, Y.; Qin, T.; Xiao, S.; Li, W.; Xu, L.; Zhou, X. Effects of Waterlogging Stress on Root Growth and Soil Nutrient Loss of Winter Wheat at Seedling Stage. Agronomy 2024, 14, 1247. [Google Scholar] [CrossRef]
Figure 1.
Crop aspects at (a) the beginning of the growing season and (b) in the middle of the growing season.
Figure 1.
Crop aspects at (a) the beginning of the growing season and (b) in the middle of the growing season.
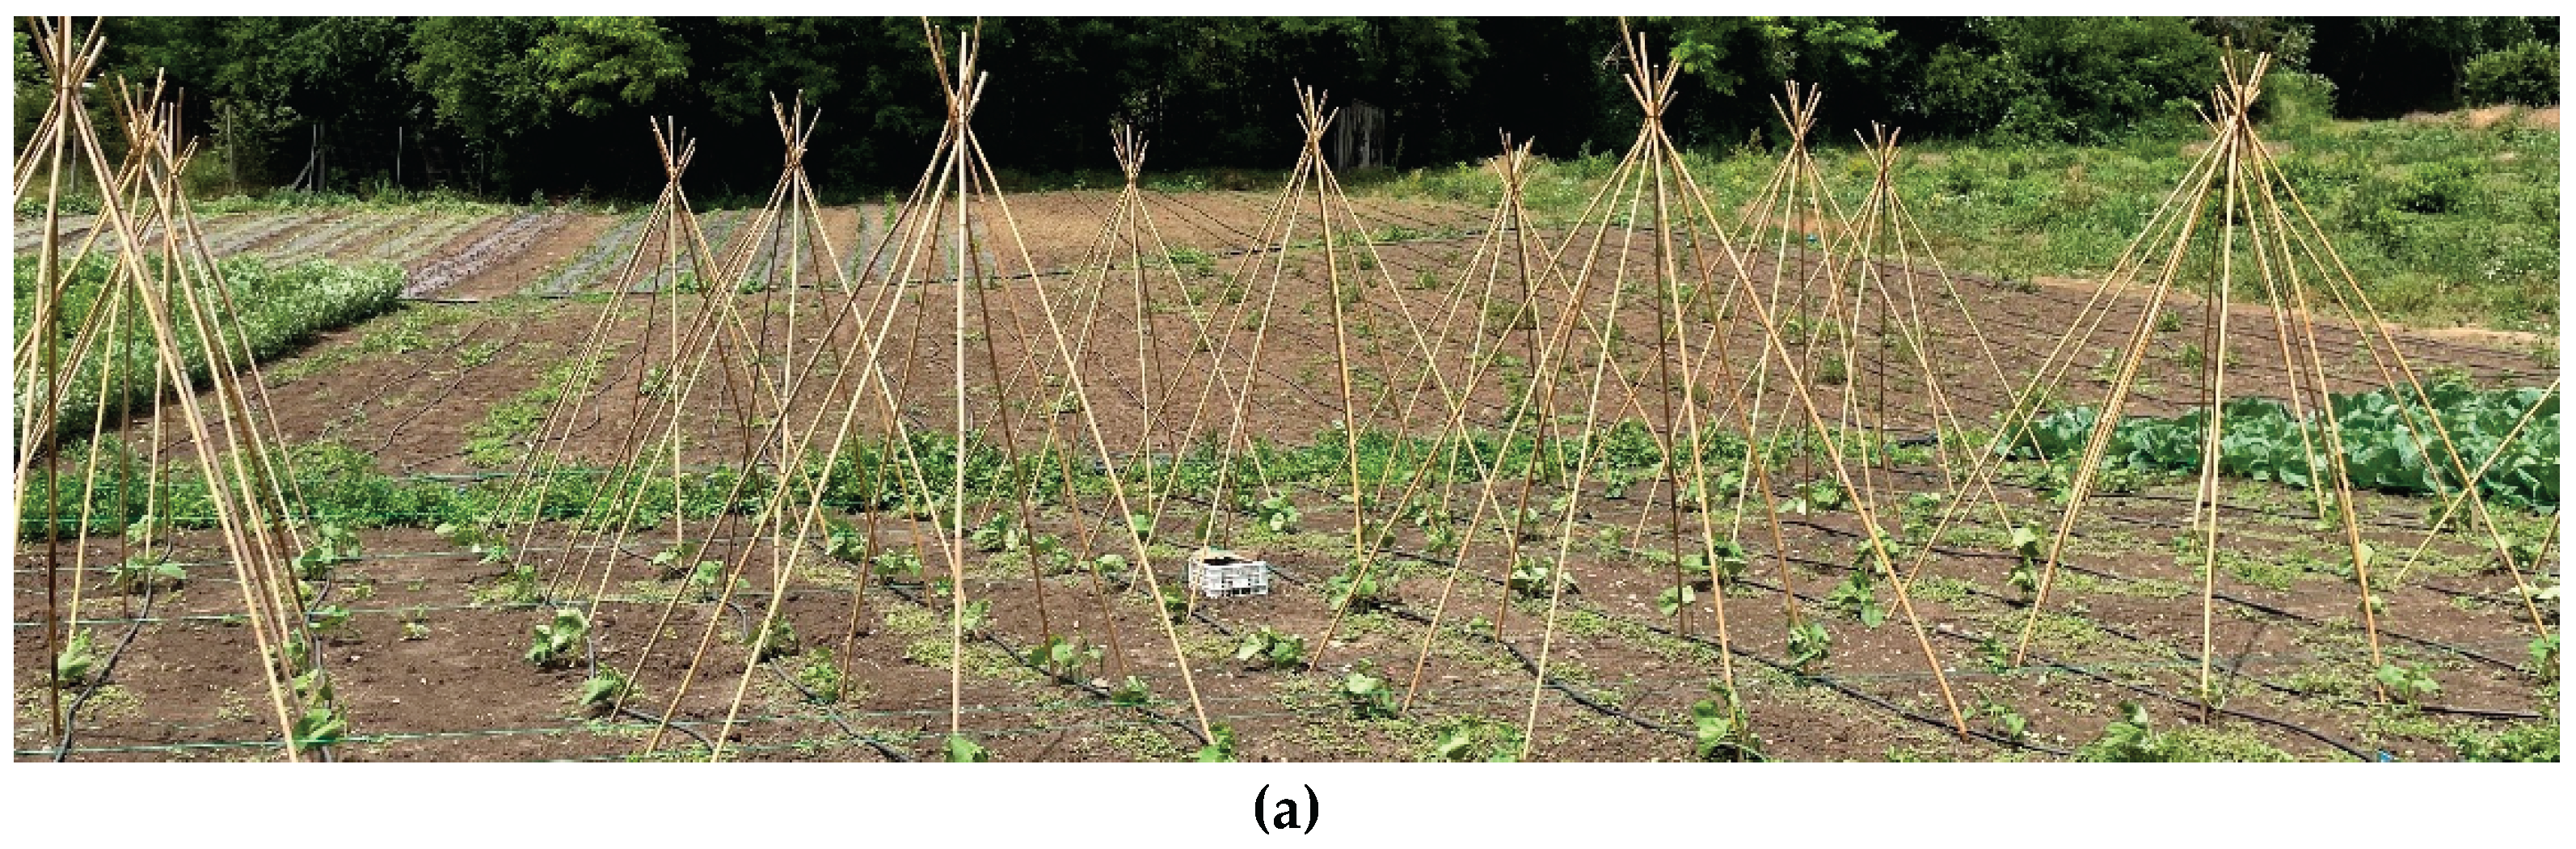
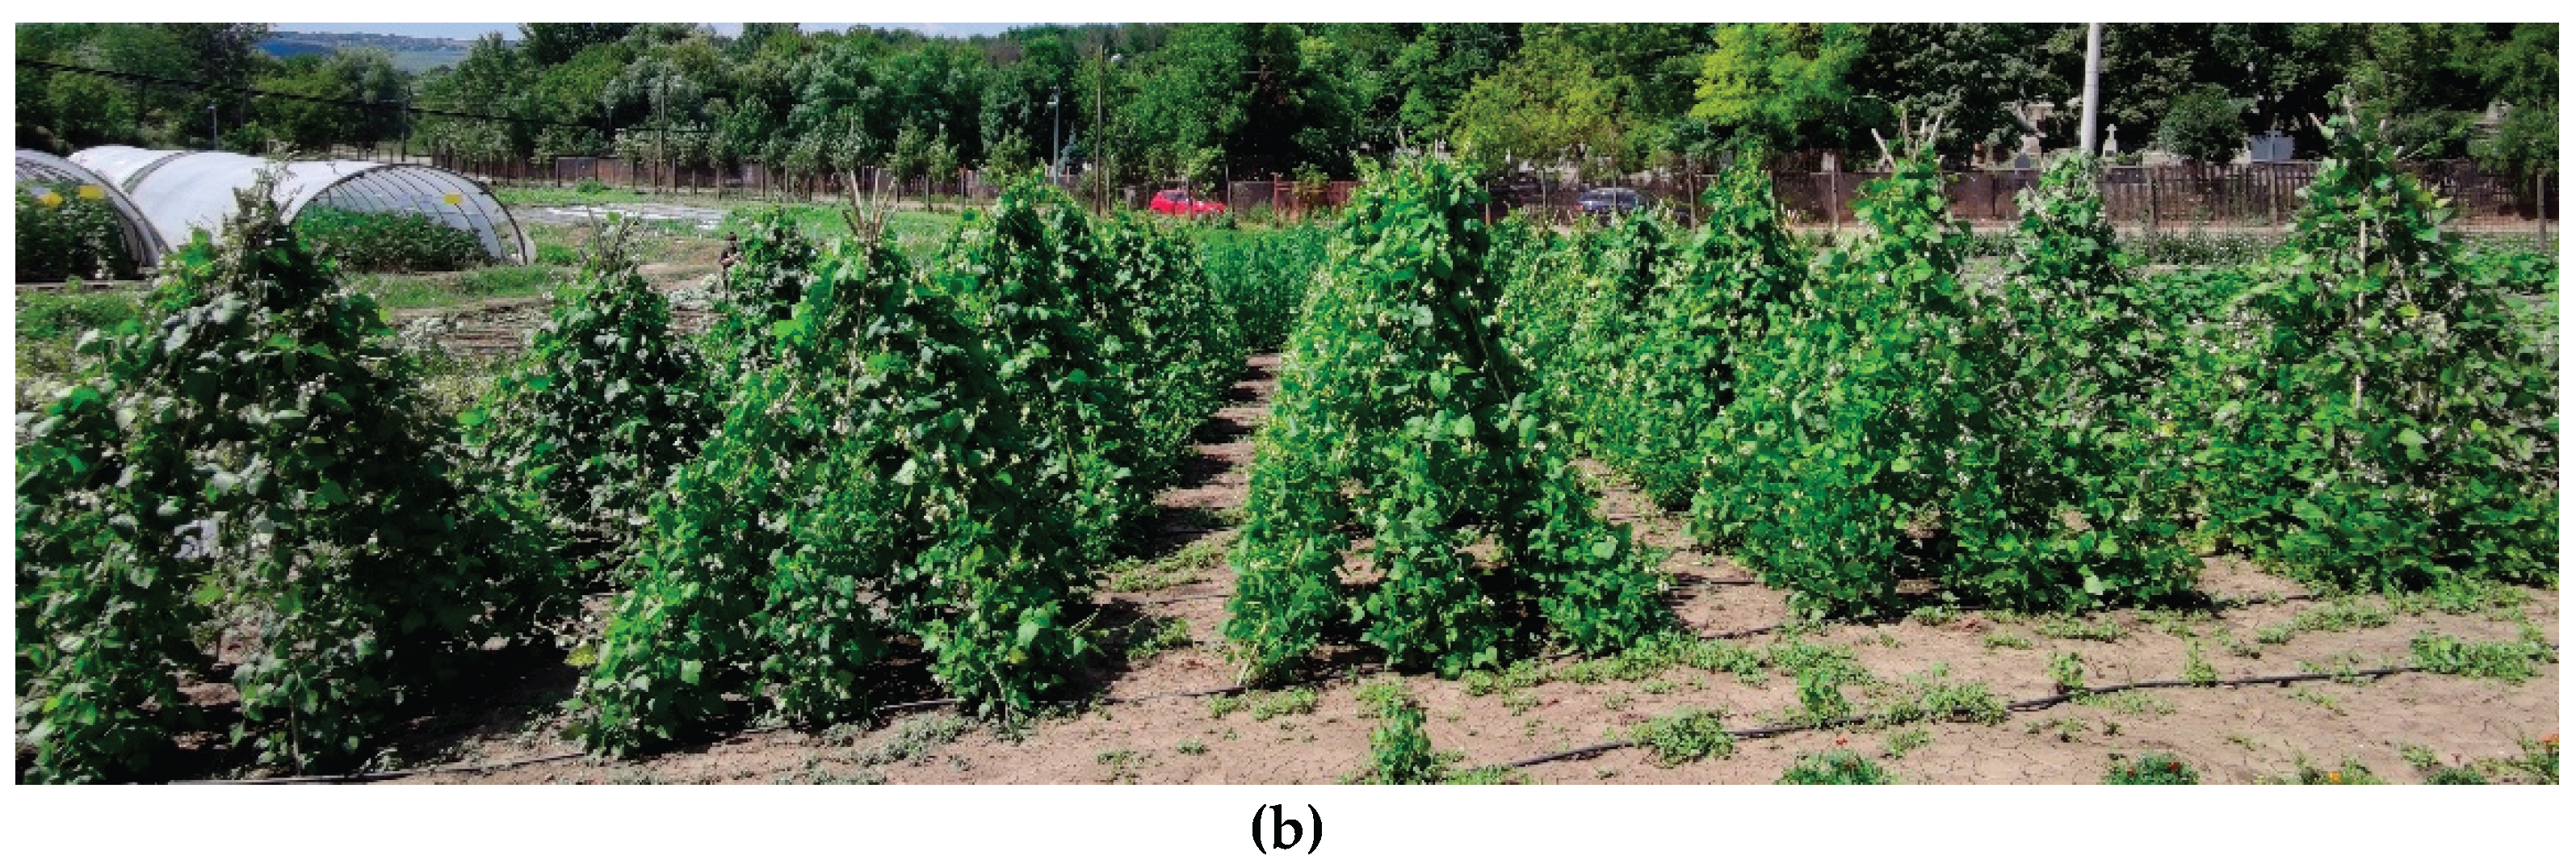
Figure 2.
Precipitations registered (mm) during the growing season (20.05 – 31.10) in 2022 and 2023.
Figure 2.
Precipitations registered (mm) during the growing season (20.05 – 31.10) in 2022 and 2023.
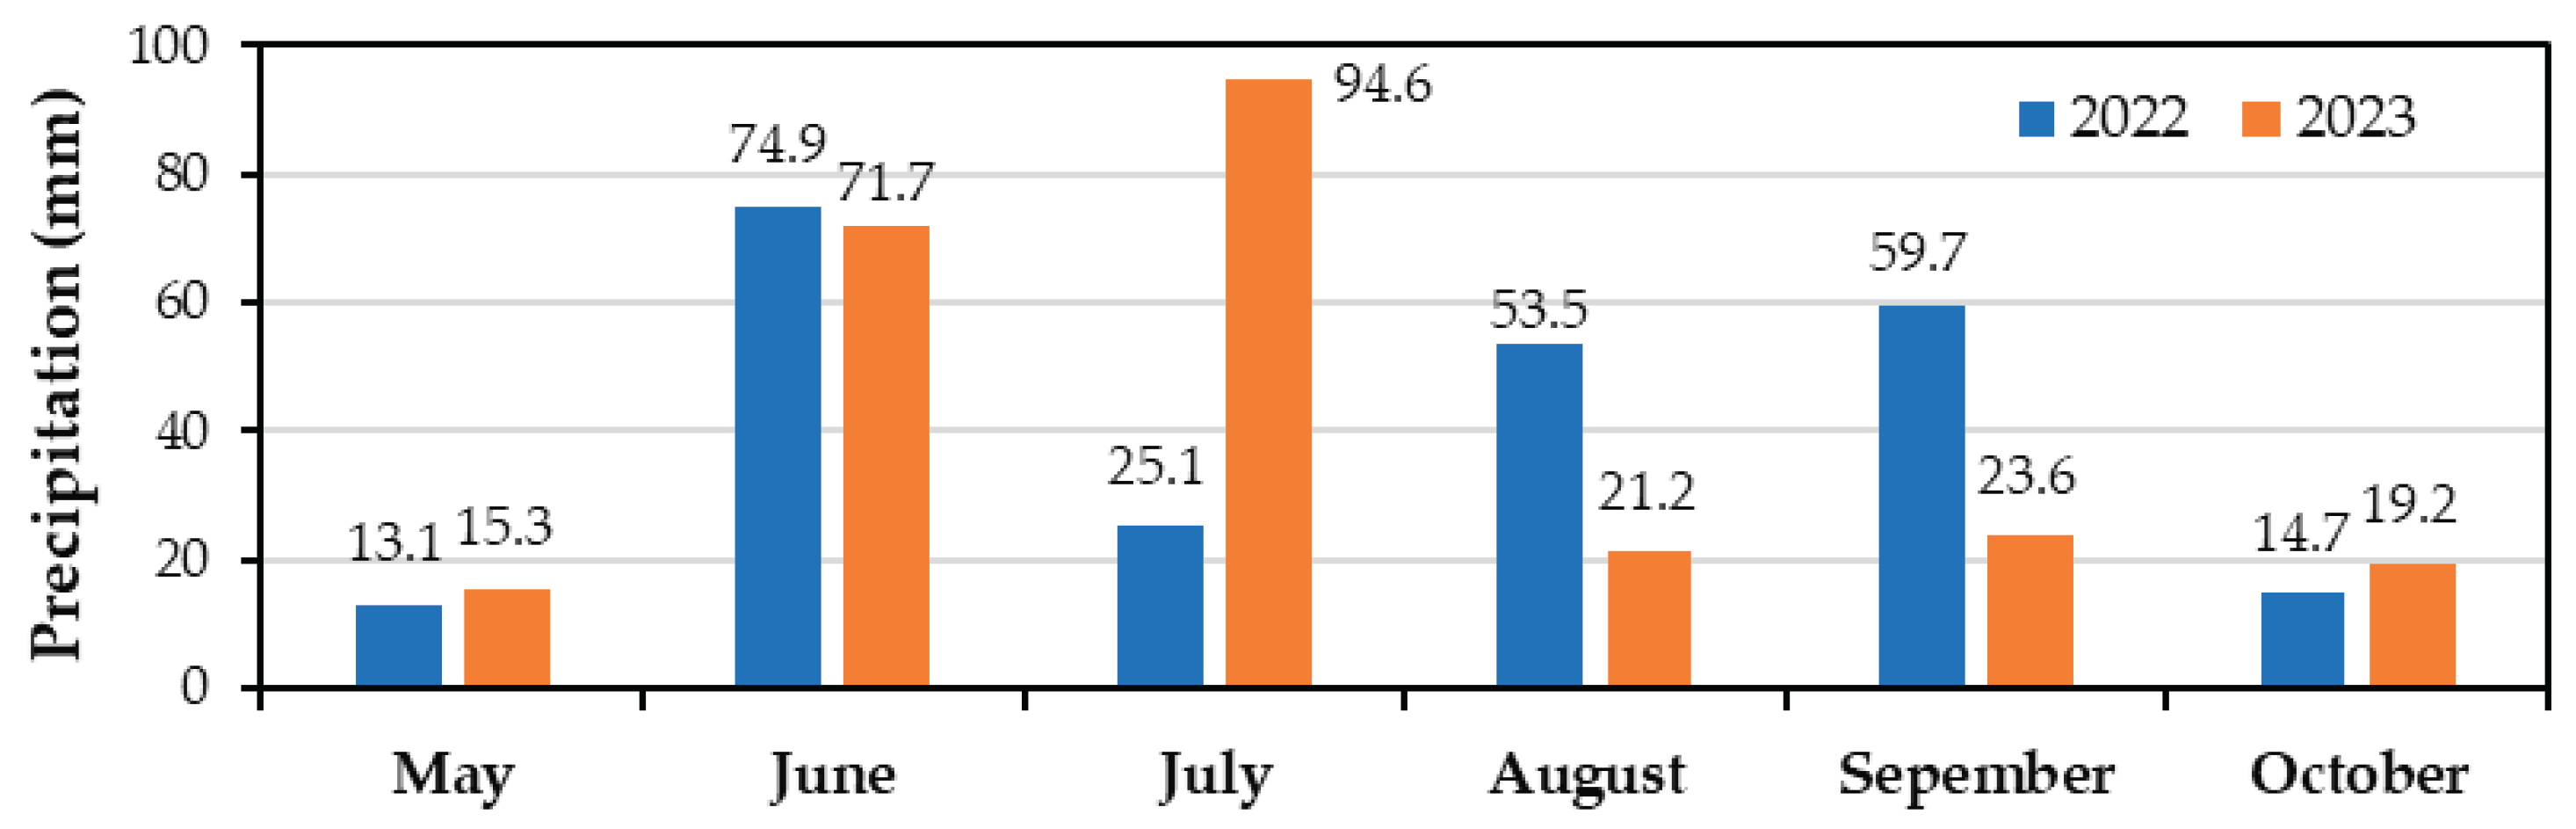
Figure 2.
Variations in temperature, dew point and relative humidity at plant level during the growing season in 2022 and 2023.
Figure 2.
Variations in temperature, dew point and relative humidity at plant level during the growing season in 2022 and 2023.
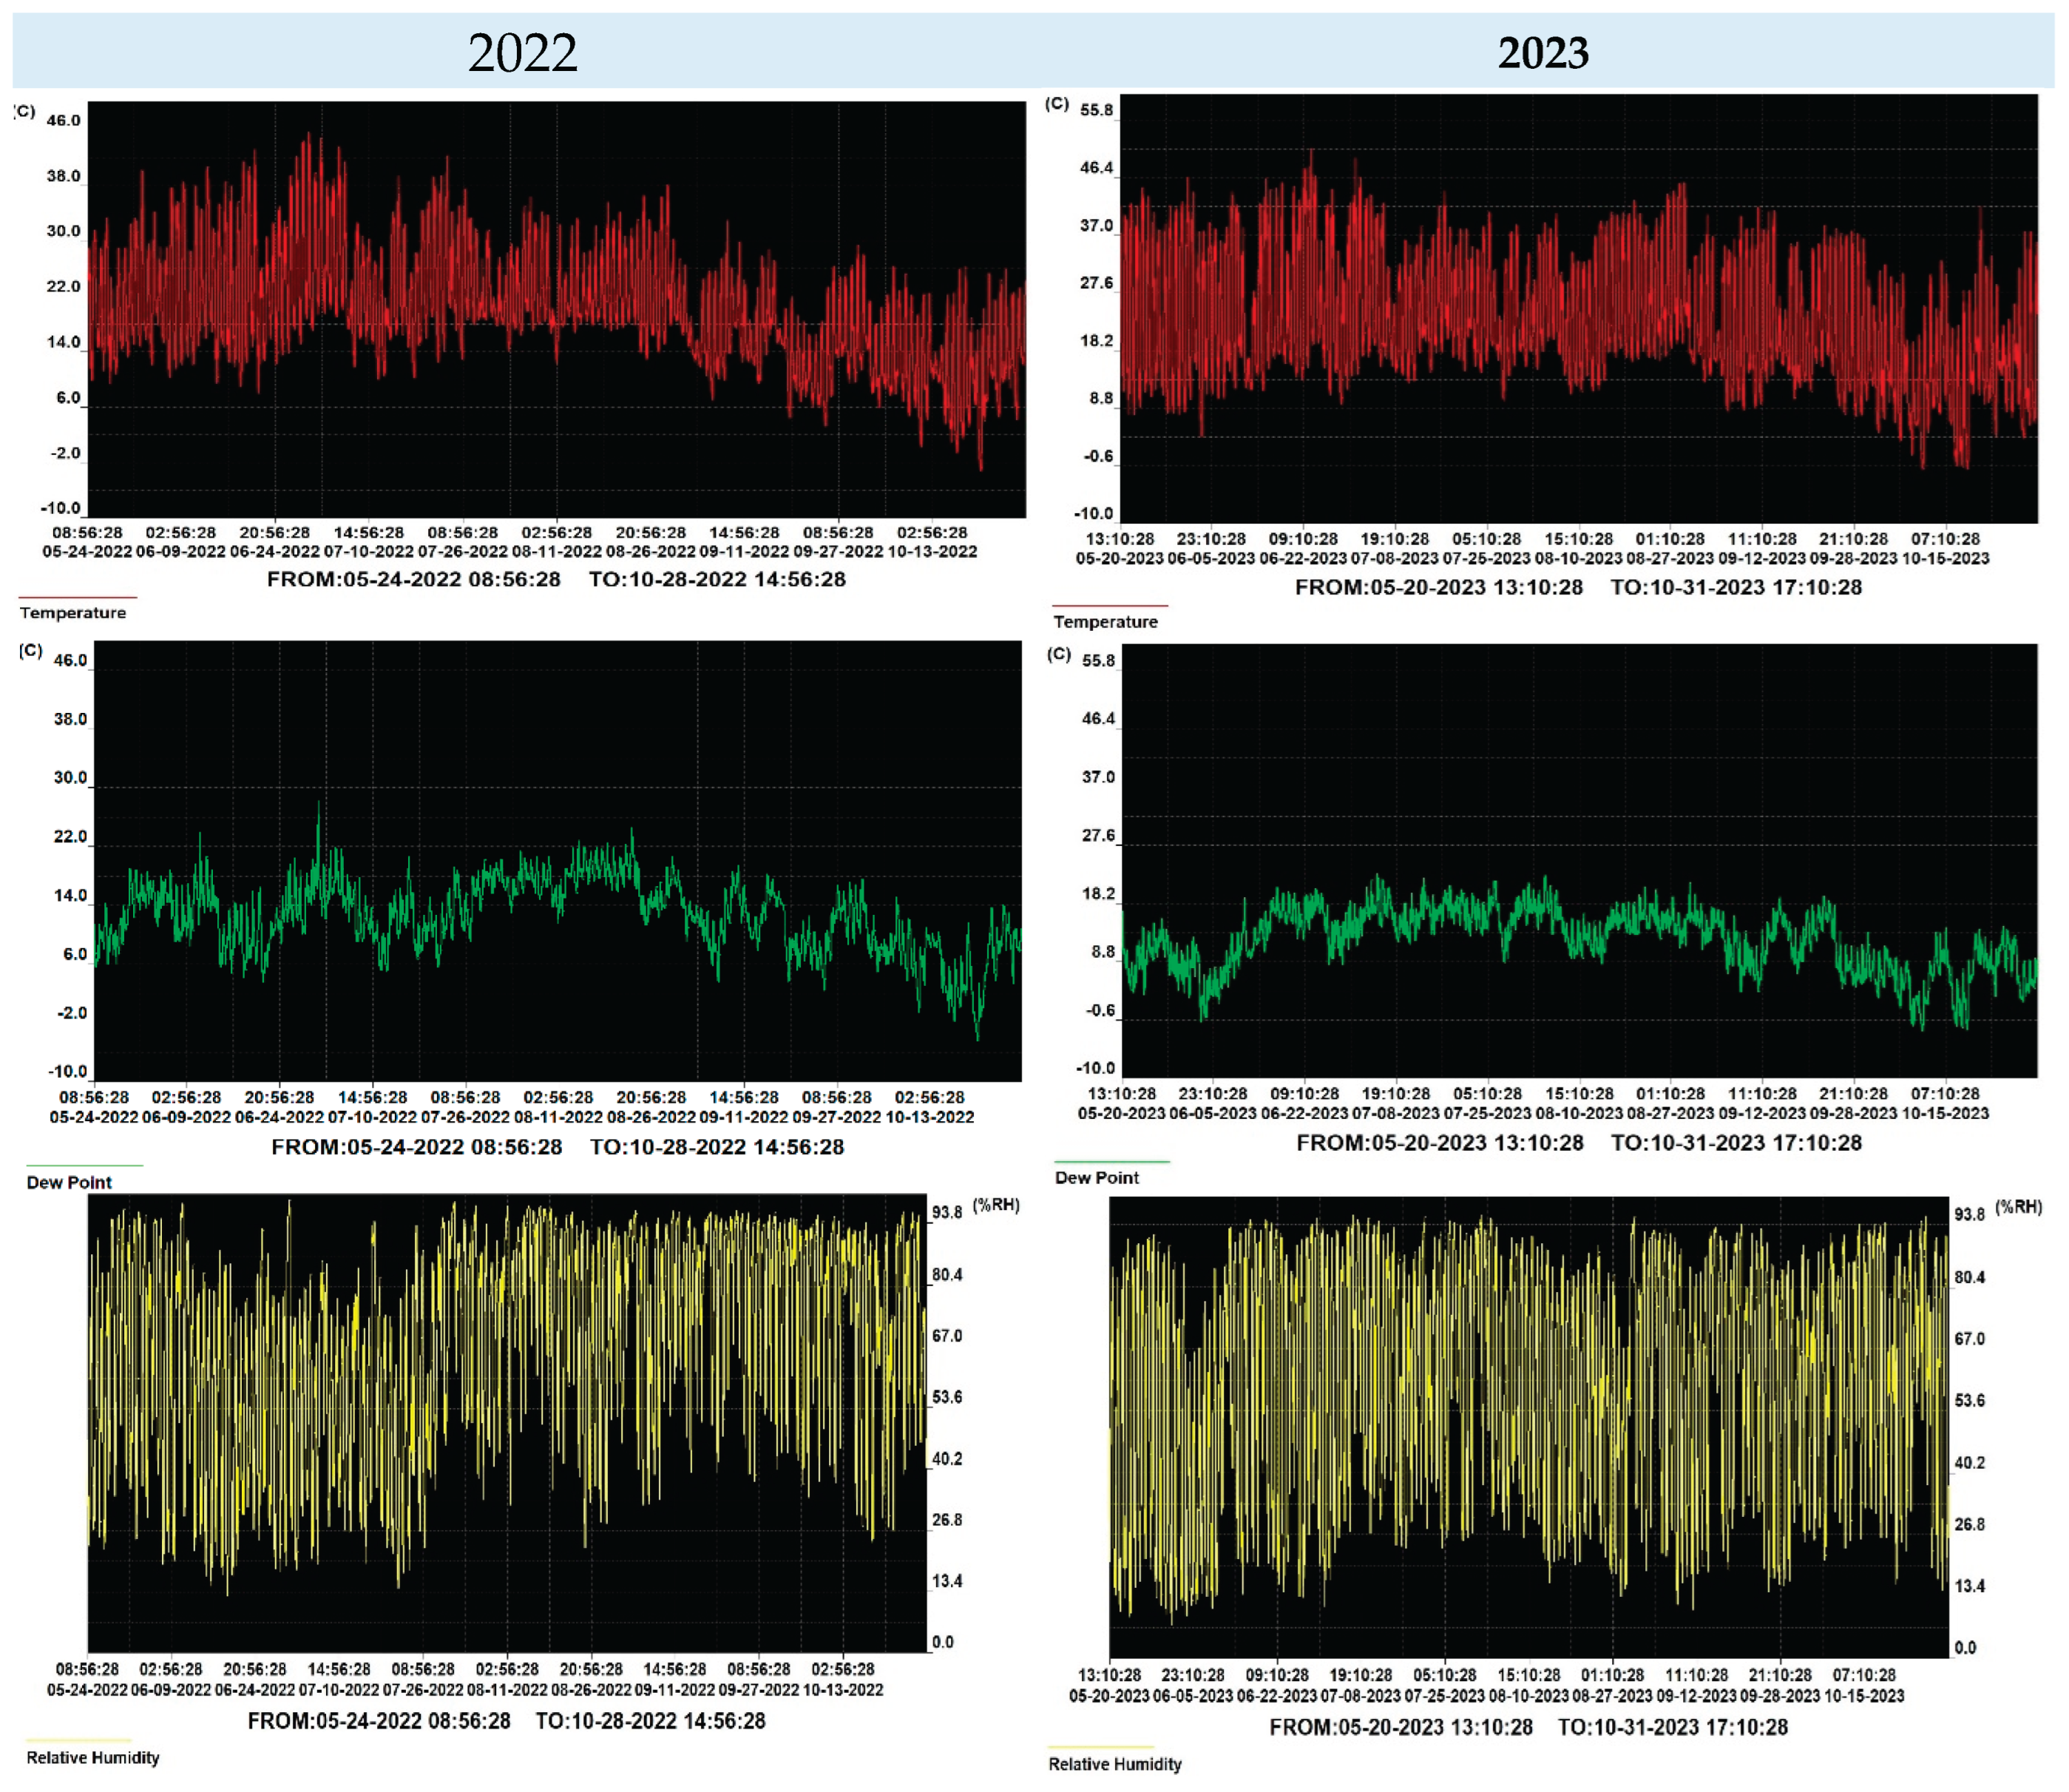
Figure 3.
(a) Photosynthetic assimilation rate – A and (b) chlorophyll content index – CCI in runner bean leaves under individual influence of cultivar, irrigation, and fertilization regime. Values are presented as mean ± standard error of individual replicates. Within each factor: ns – statistically insignificant differences; *− statistically significant differences at p ≤ 0.05 according to Duncan’s test. The different letters indicate statistical differences between variants, with ‘a’ representing the highest values. Cozia1, Cozia2, Cozia3 are beans cultivars; IR1 – 2000 m3·ha−1 irrigation; IR2 – 2500 m3·ha−1 irrigation; OR – organic fertilization; CH – chemical fertilization; UF – unfertilized.
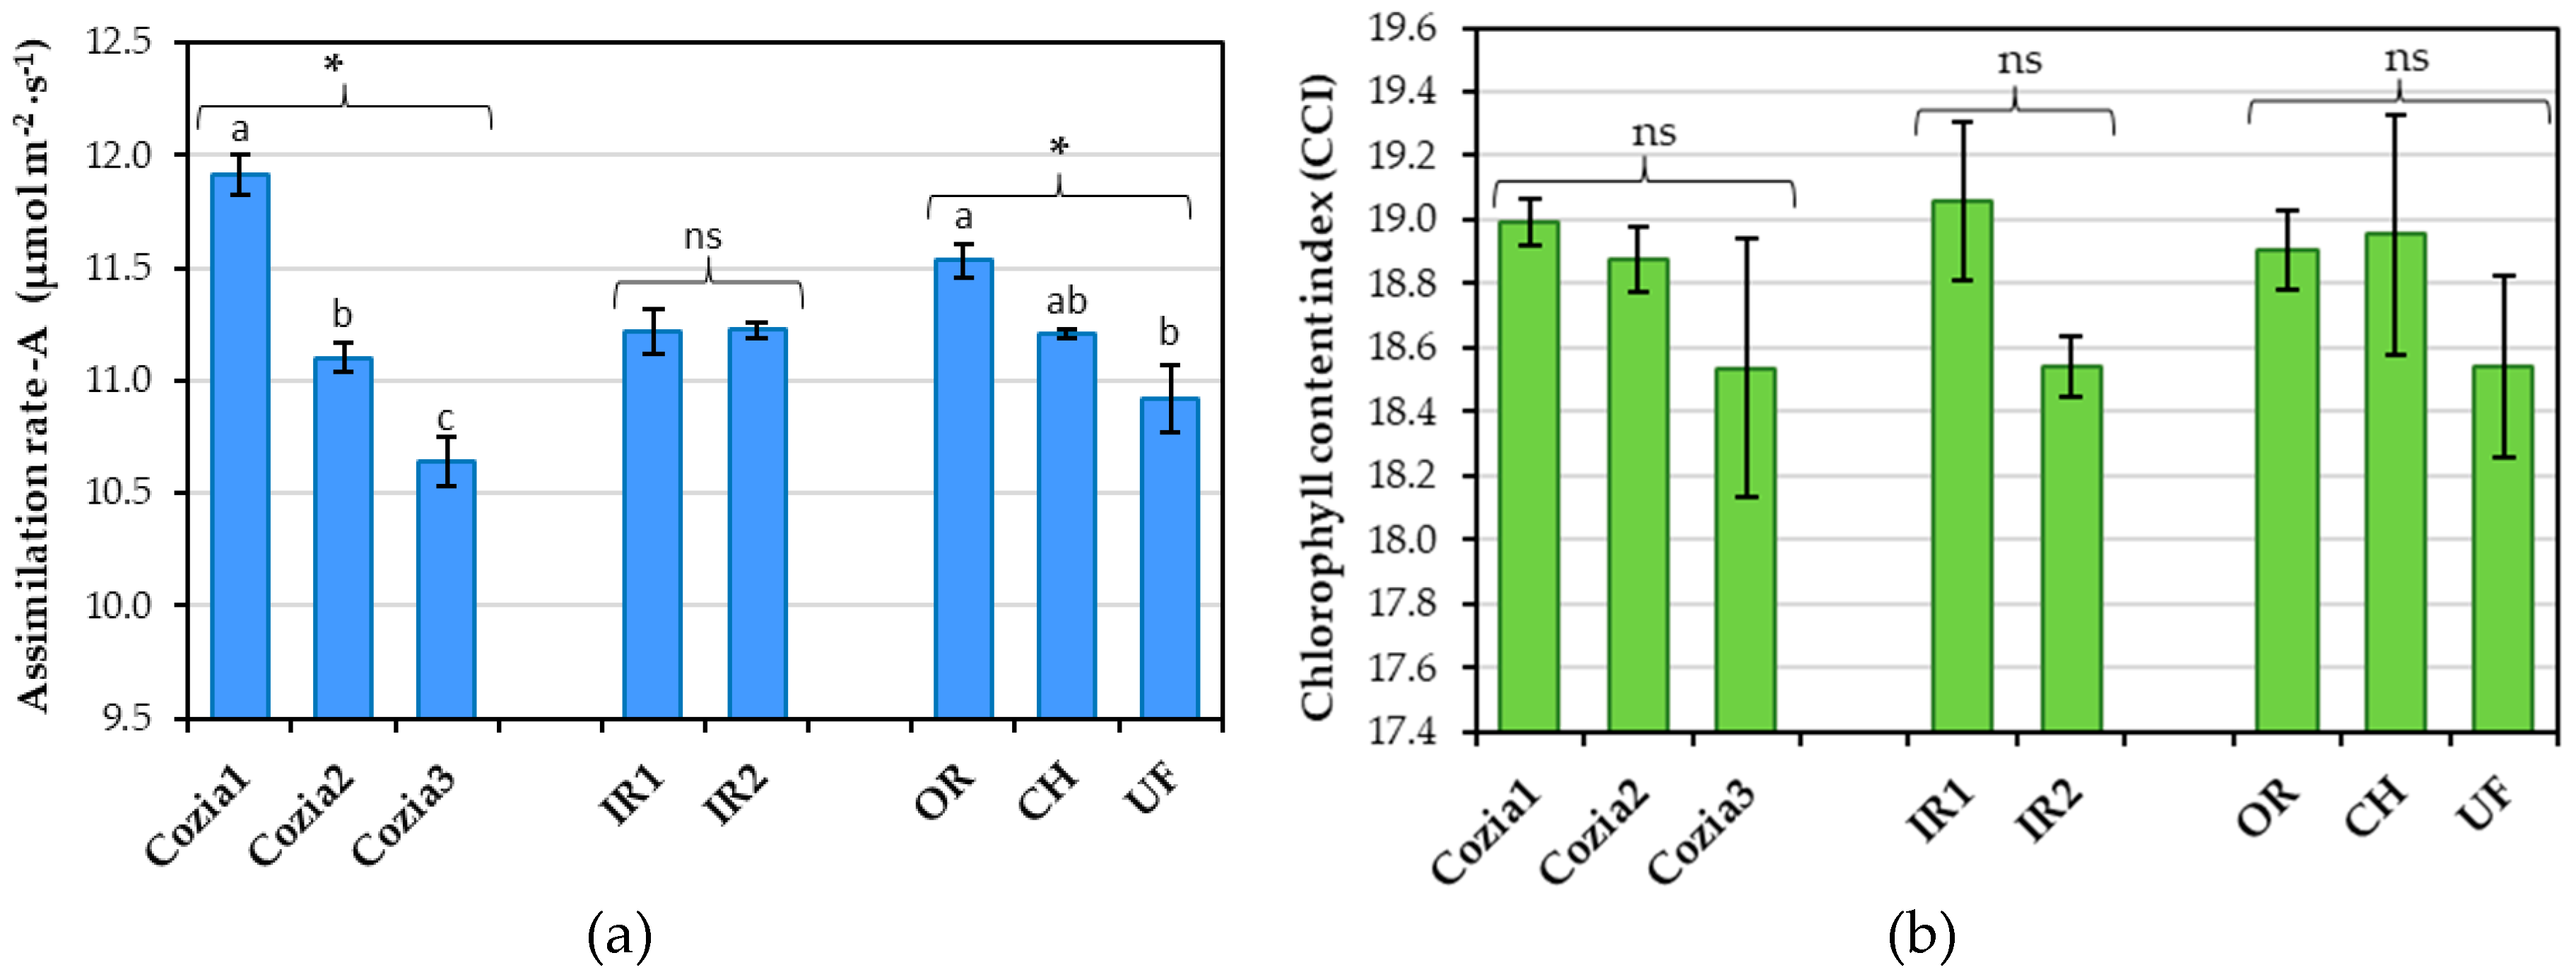
Figure 4.
(a) Photosynthetic assimilation rate – A and (b) chlorophyll content index – CCI in runner bean leaves under the combined influence of cultivar and irrigation. Values are presented as mean ± standard error of individual replicates. Different letters represent statistical differences between variants at p ≤ 0.05 according to Duncan’s test, with ‘a’ representing the highest values. Cozia1, Cozia2, Cozia3 are beans cultivars; IR1 – 2000 m3·ha−1 irrigation; IR2 – 2500 m3·ha−1 irrigation.
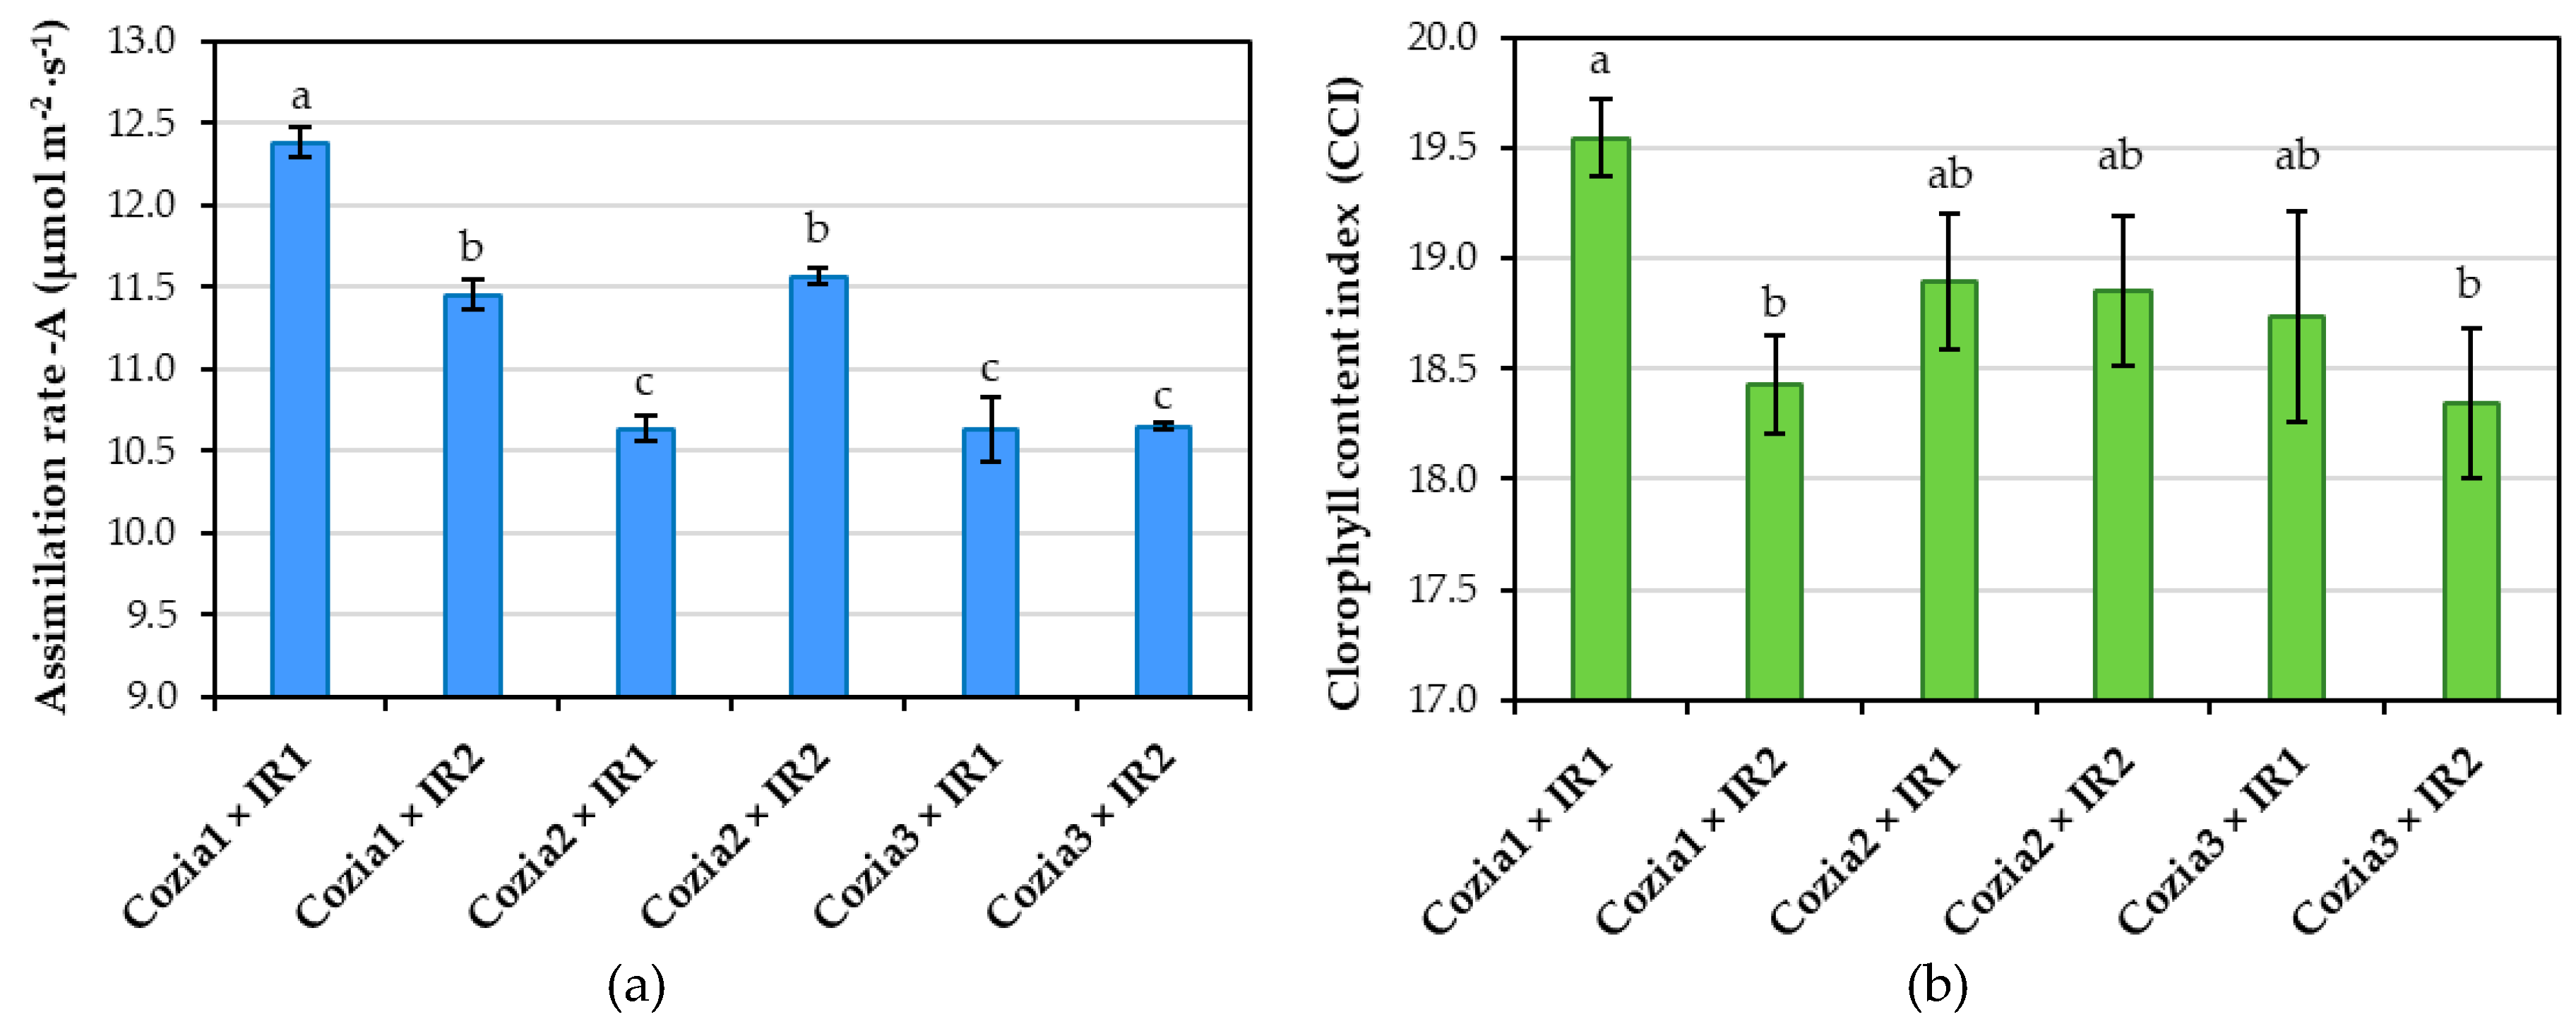
Figure 5.
(a) Photosynthetic assimilation rate – A and (b) chlorophyll content index – CCI in runner bean leaves under the combined influence of cultivar and fertilization regime. Values are presented as mean ± standard error of individual replicates. Different letters represent statistical differences between variants at p ≤ 0.05 according to Duncan’s test, with ‘a’ representing the highest values. Cozia1, Cozia2, Cozia3 are beans cultivars; OR – organic fertilization; CH – chemical fertilization; UF – unfertilized.
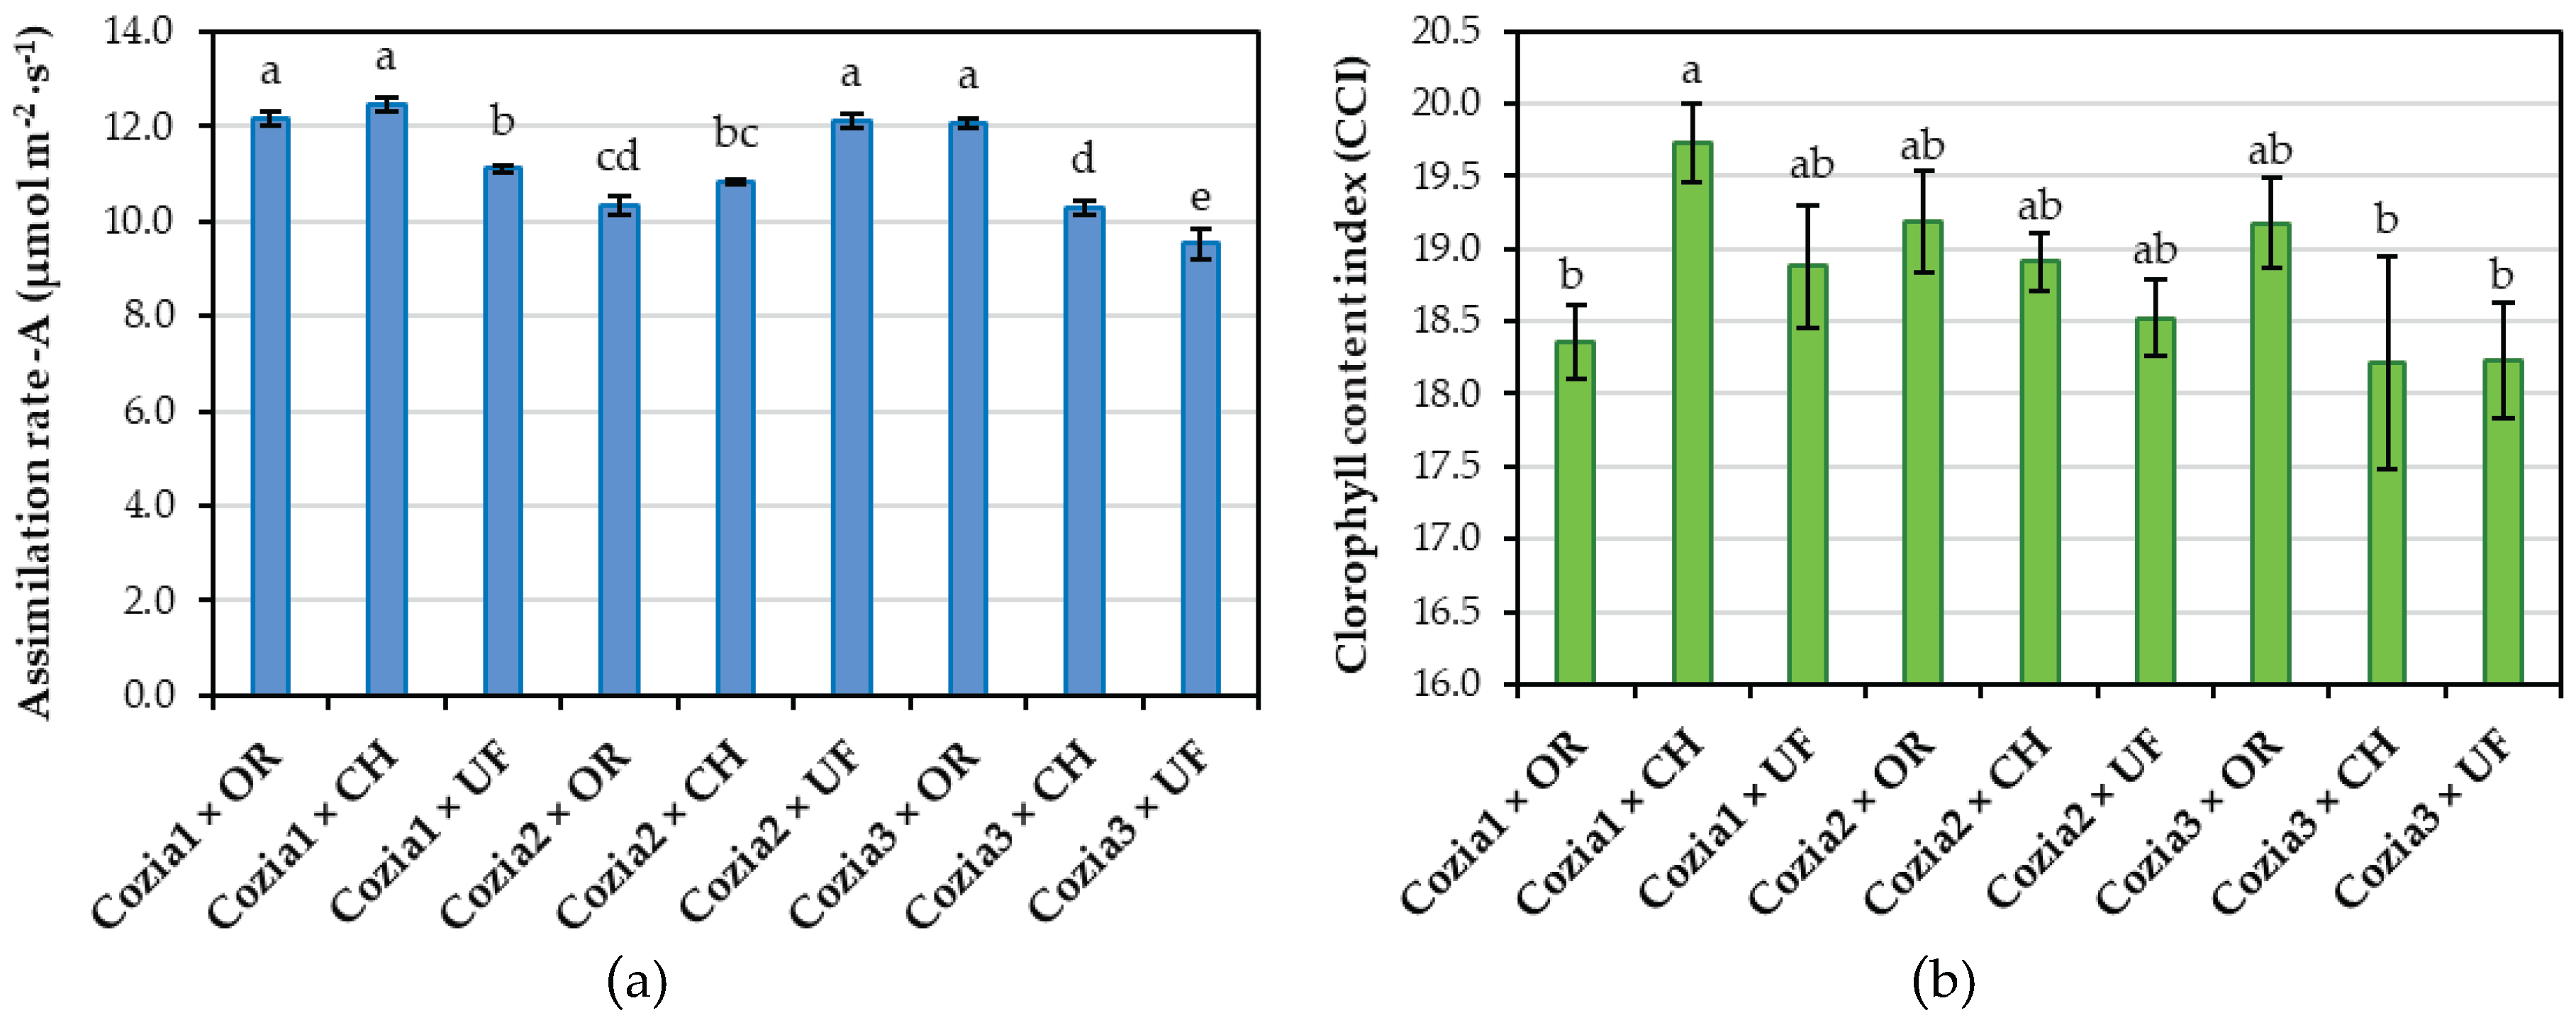
Figure 6.
(a) Photosynthetic assimilation rate – A and (b) chlorophyll content index – CCI in runner bean leaves under the combined influence of irrigation and fertilization regime. Values are presented as mean ± standard error of individual replicates. Different letters represent statistical differences between variants at p ≤ 0.05 according to the Duncan test, with ‘a’ representing the highest values. IR1 – 2000 m3·ha−1 irrigation; IR2 – 2500 m3·ha−1 irrigation; OR – organic fertilization; CH – chemical fertilization; UF – unfertilized.
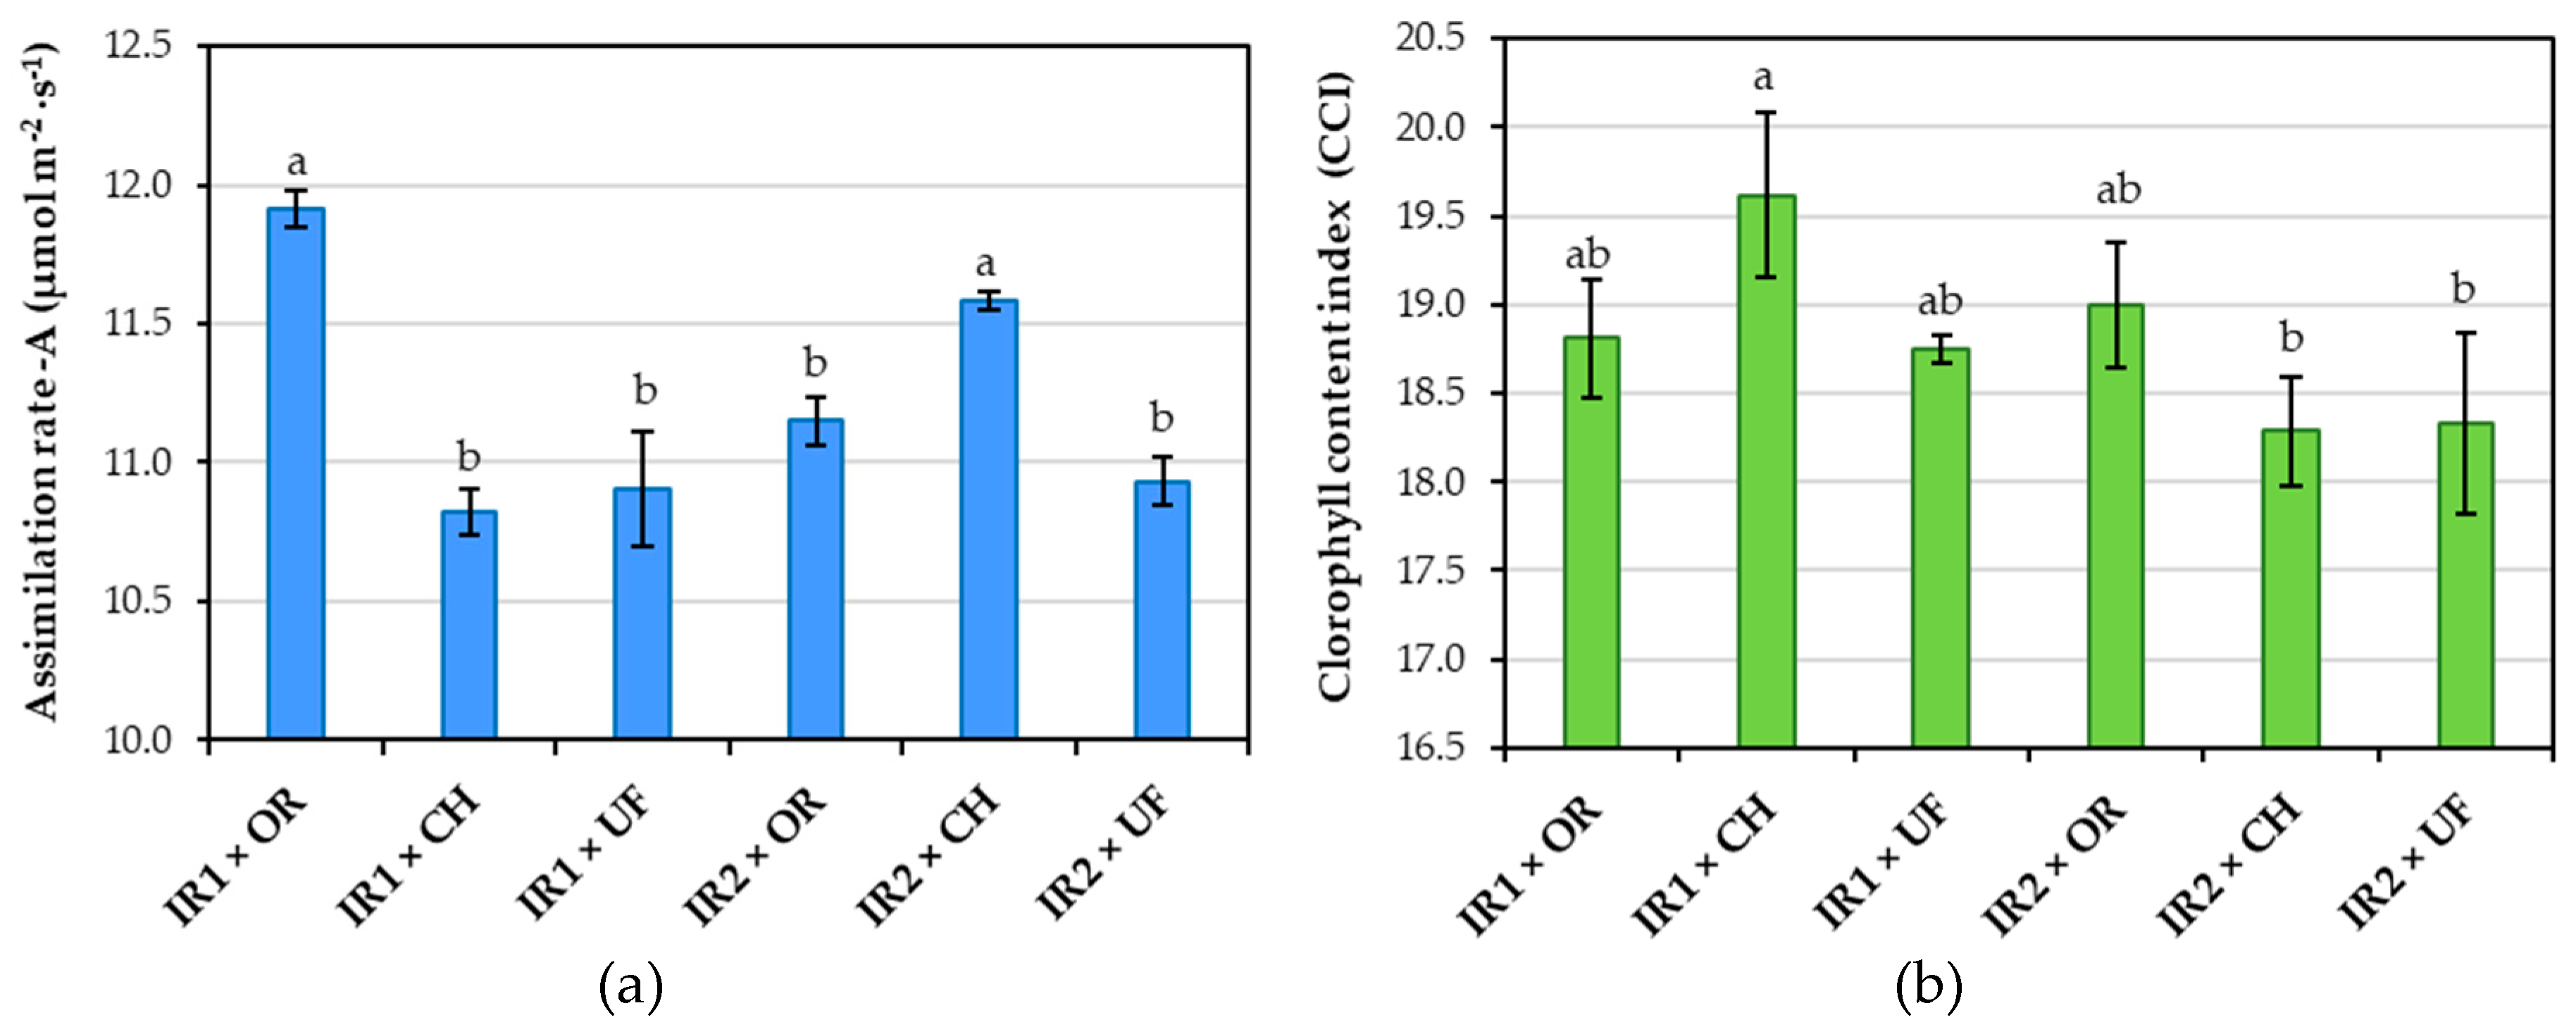
Figure 7.
(a) Photosynthetic assimilation rate - A and (b) chlorophyll content index – CCI in runner bean leaves under the combined influence of cultivar, irrigation, and fertilization regime. Values are presented as mean ± standard error of individual replicates. The different letters represent statistical differences between variants at p ≤ 0.05 according to Duncan's test, with 'a' representing the highest values. Cozia1, Cozia2, Cozia3 are beans cultivars; IR1 − 2000 m3·ha−1 irrigation; IR2 − 2500 m3·ha−1 irrigation; OR − organic fertilization; CH − chemical fertilization; UF – unfertilized.
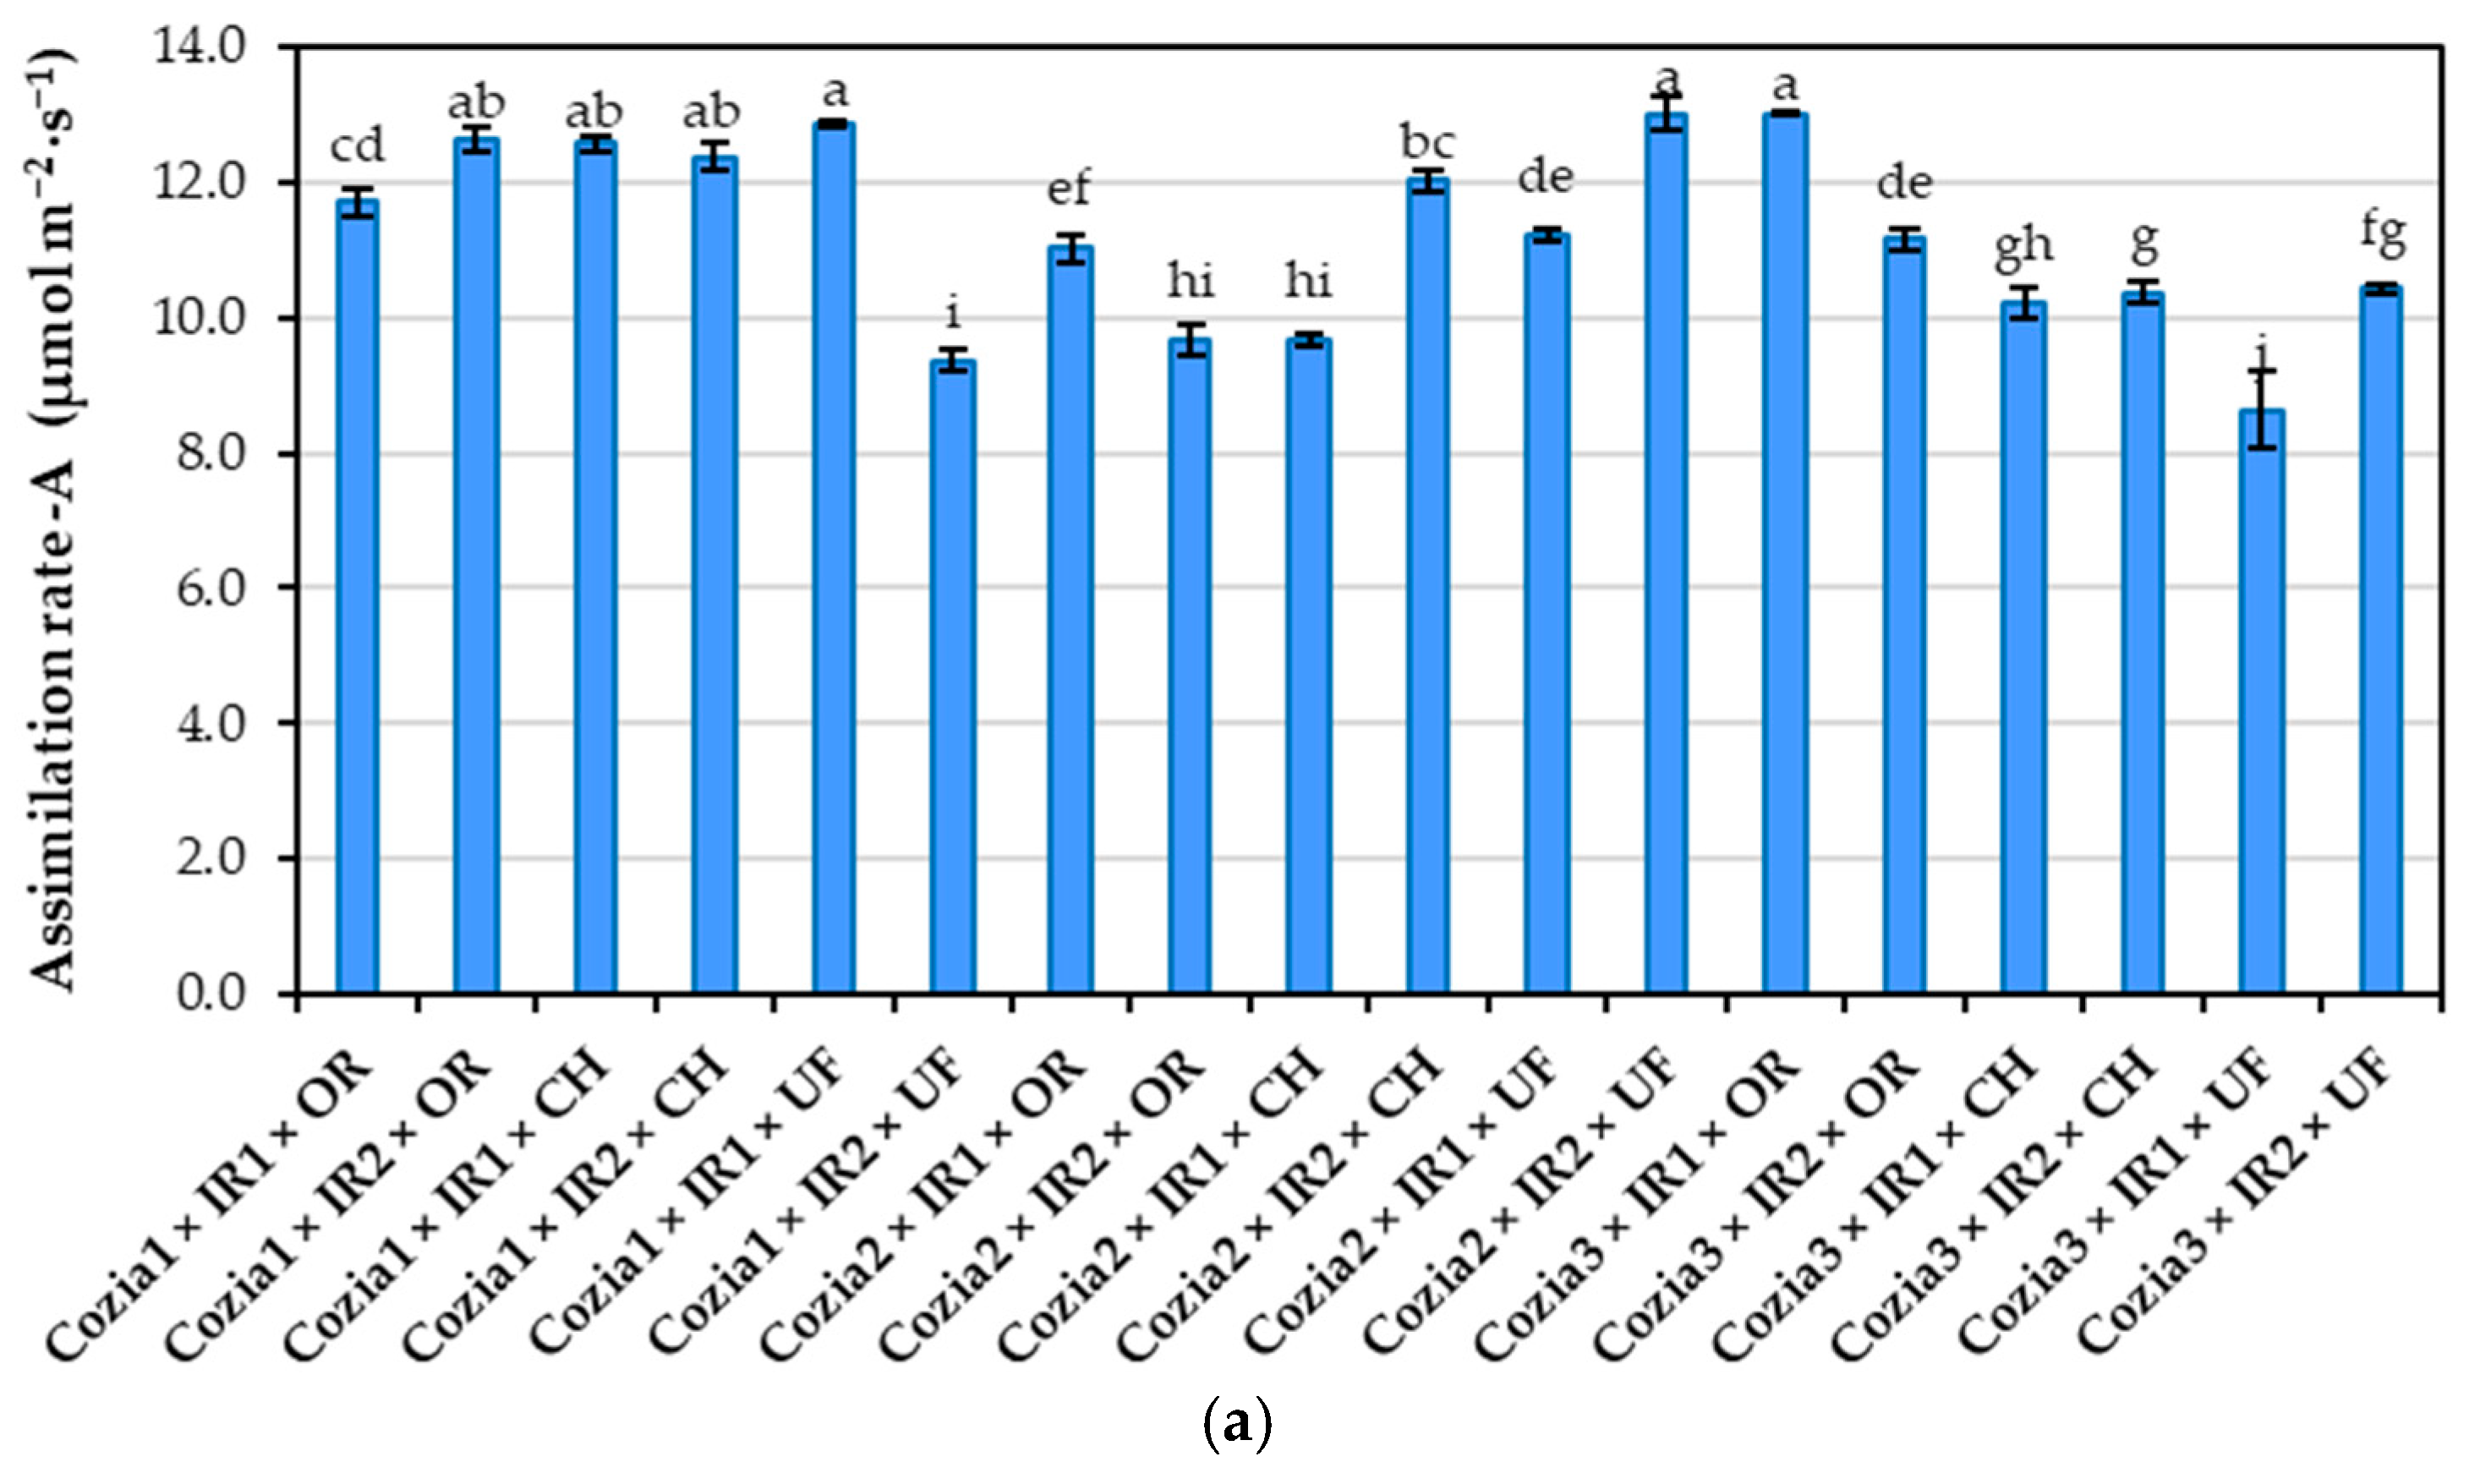
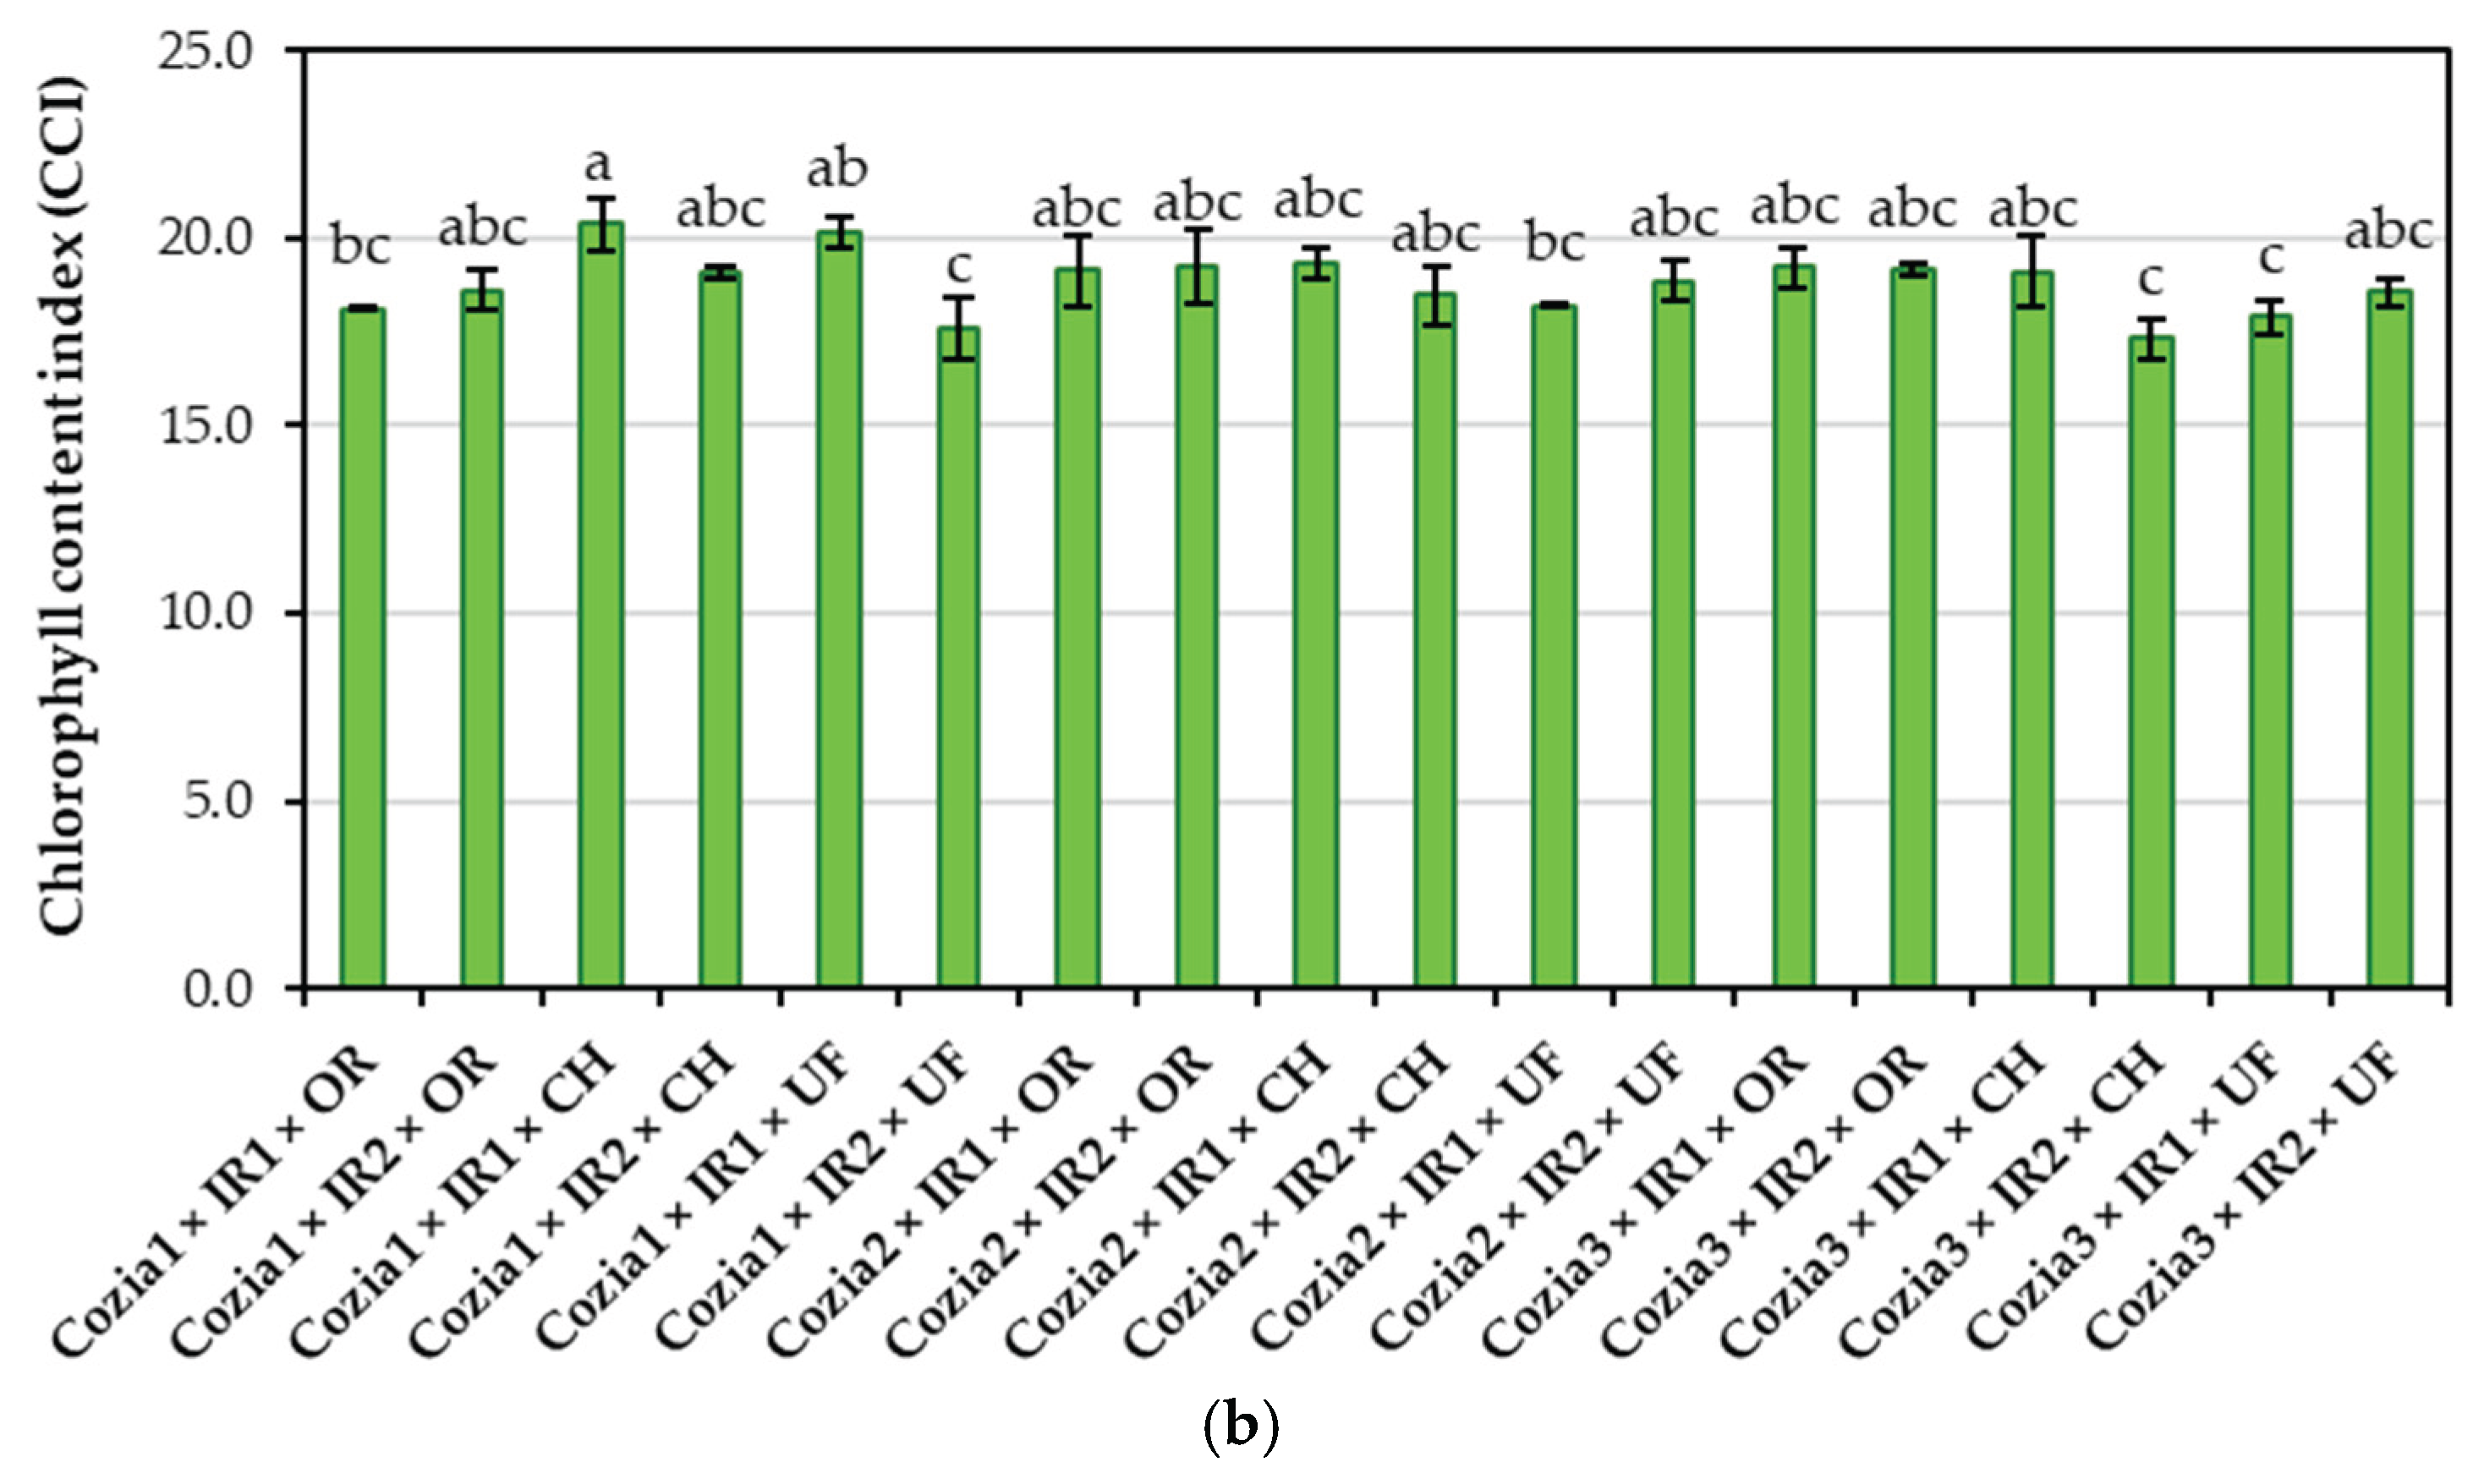
Figure 8.
Principal component analysis score plot showing the variation in physiological, biometric, and biochemical traits of Cozia cultivars under fertilization treatments and irrigation norms.
Figure 8.
Principal component analysis score plot showing the variation in physiological, biometric, and biochemical traits of Cozia cultivars under fertilization treatments and irrigation norms.
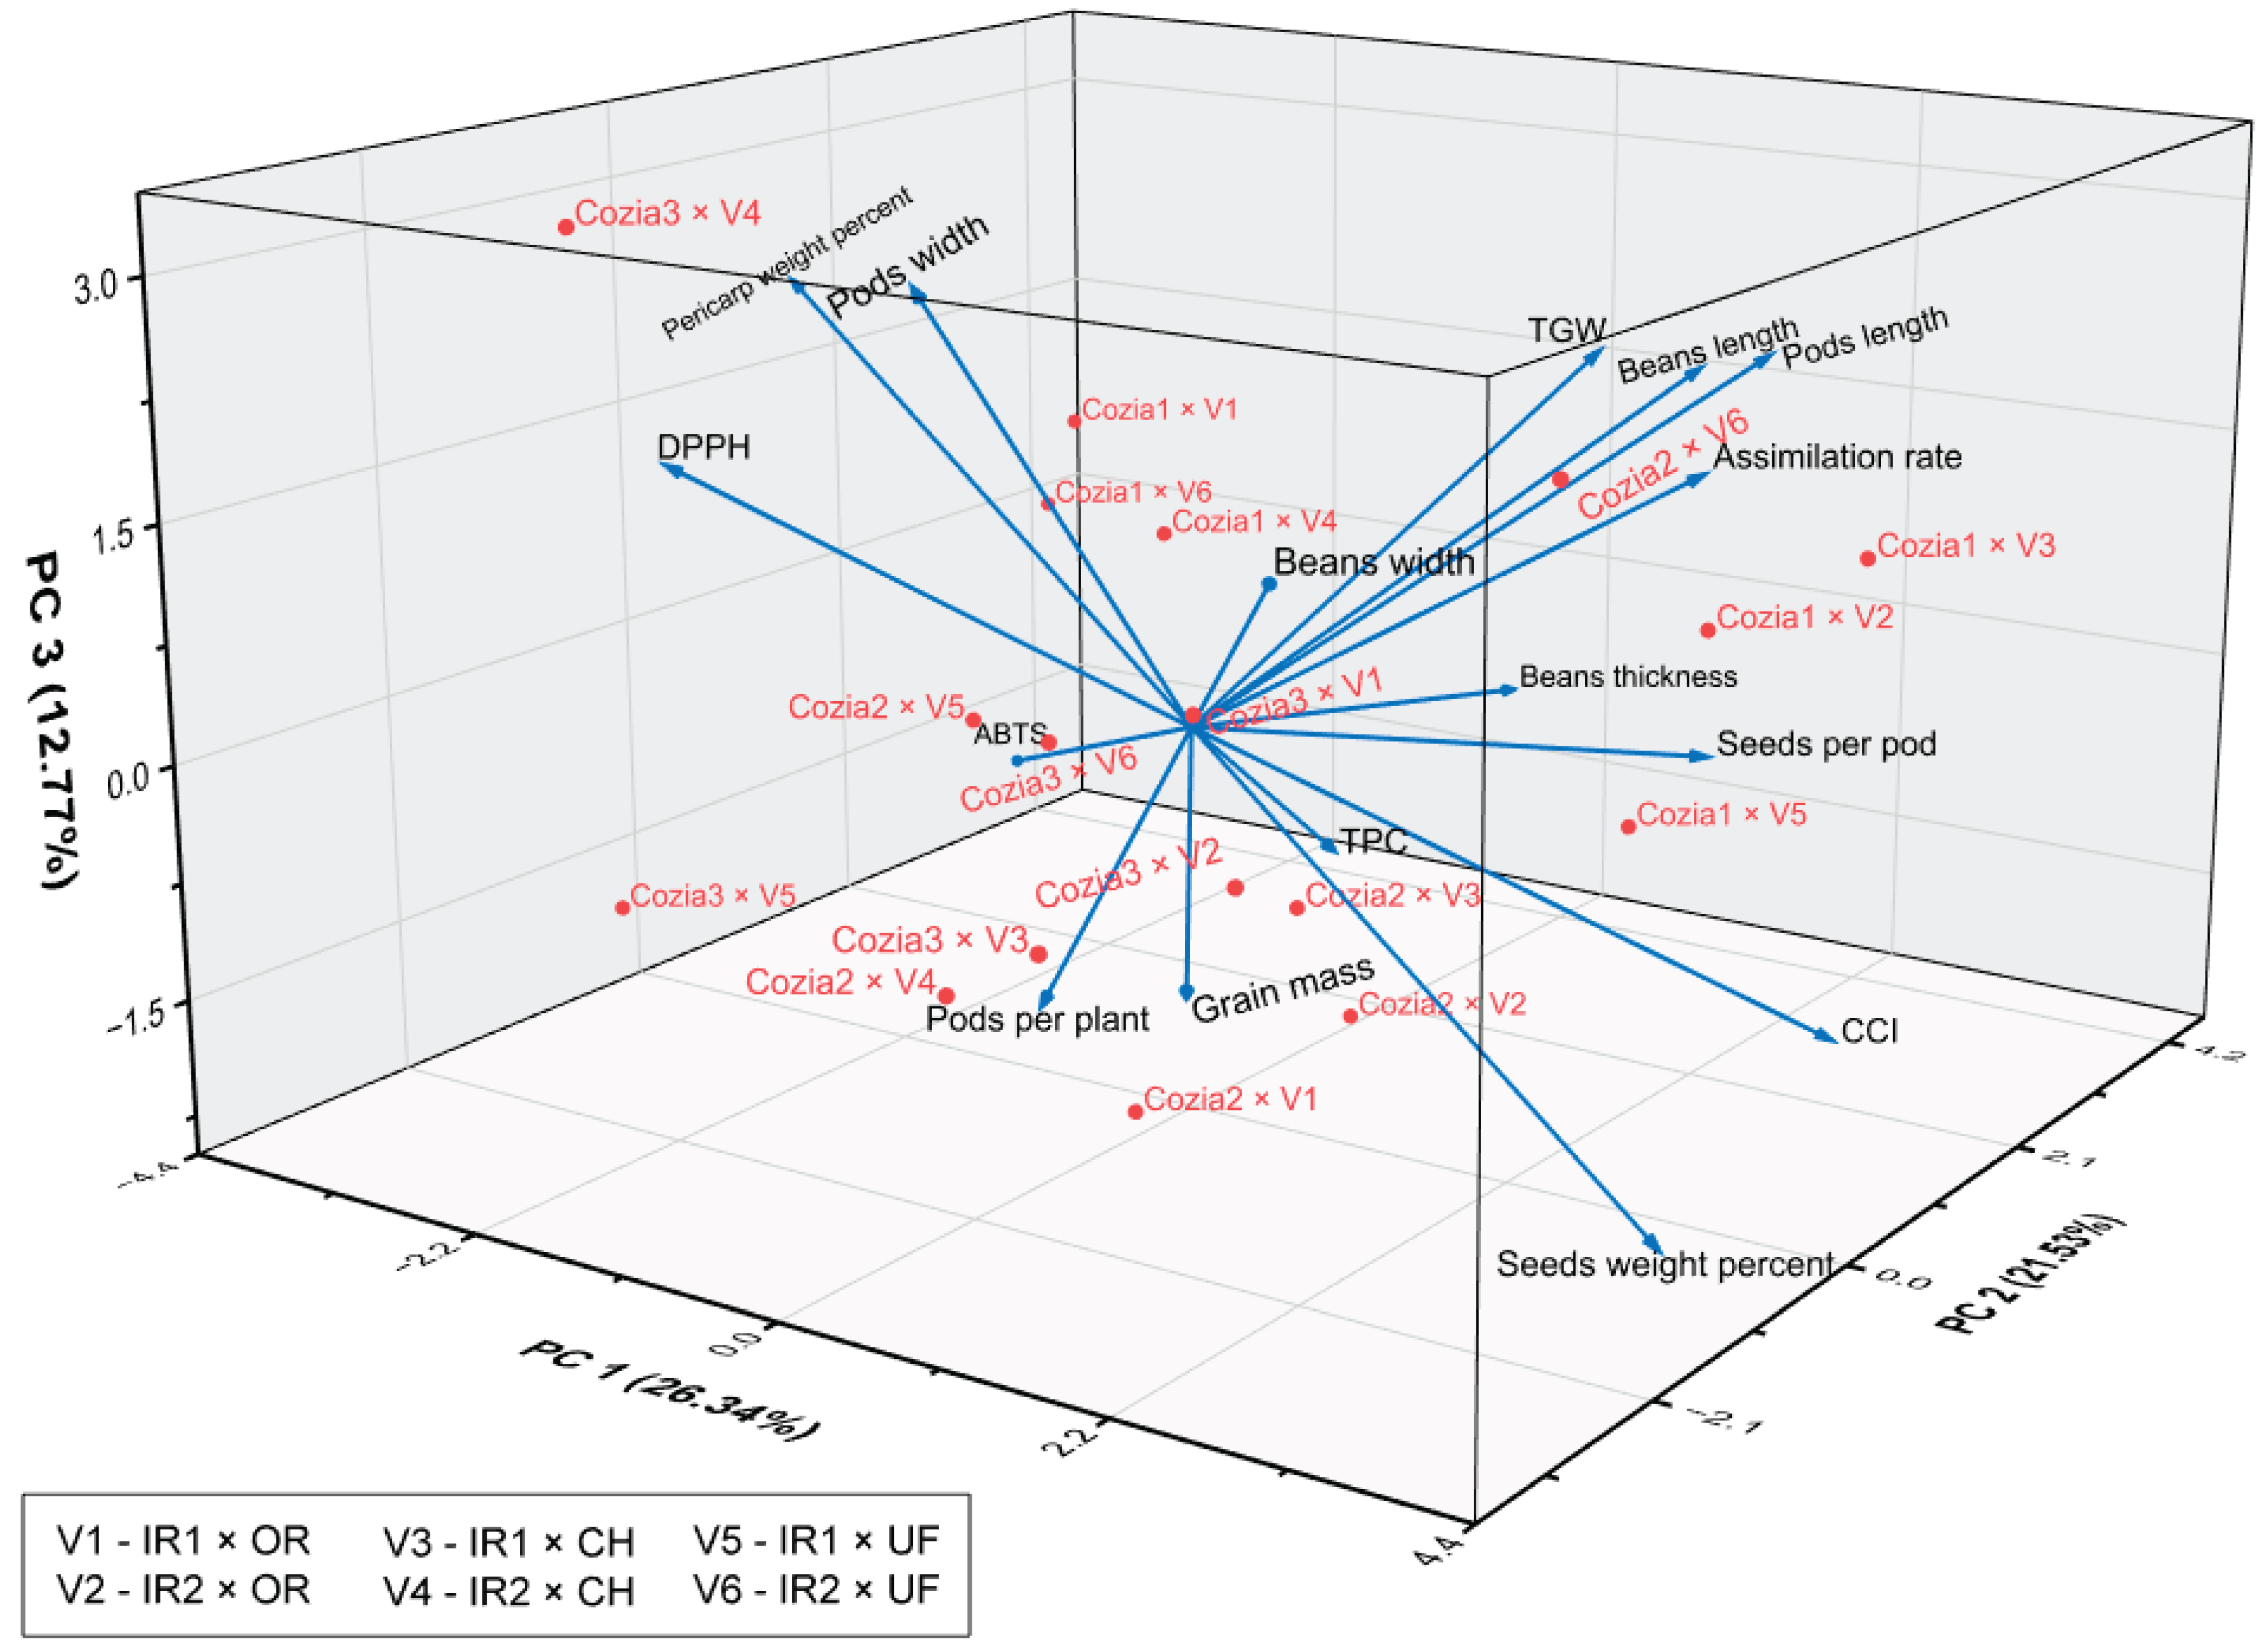
Figure 9.
Heatmap of Pearson correlation coefficients among physiological, biometric, and biochemical traits of Cozia cultivars under fertilization treatments and irrigation norms.
Figure 9.
Heatmap of Pearson correlation coefficients among physiological, biometric, and biochemical traits of Cozia cultivars under fertilization treatments and irrigation norms.
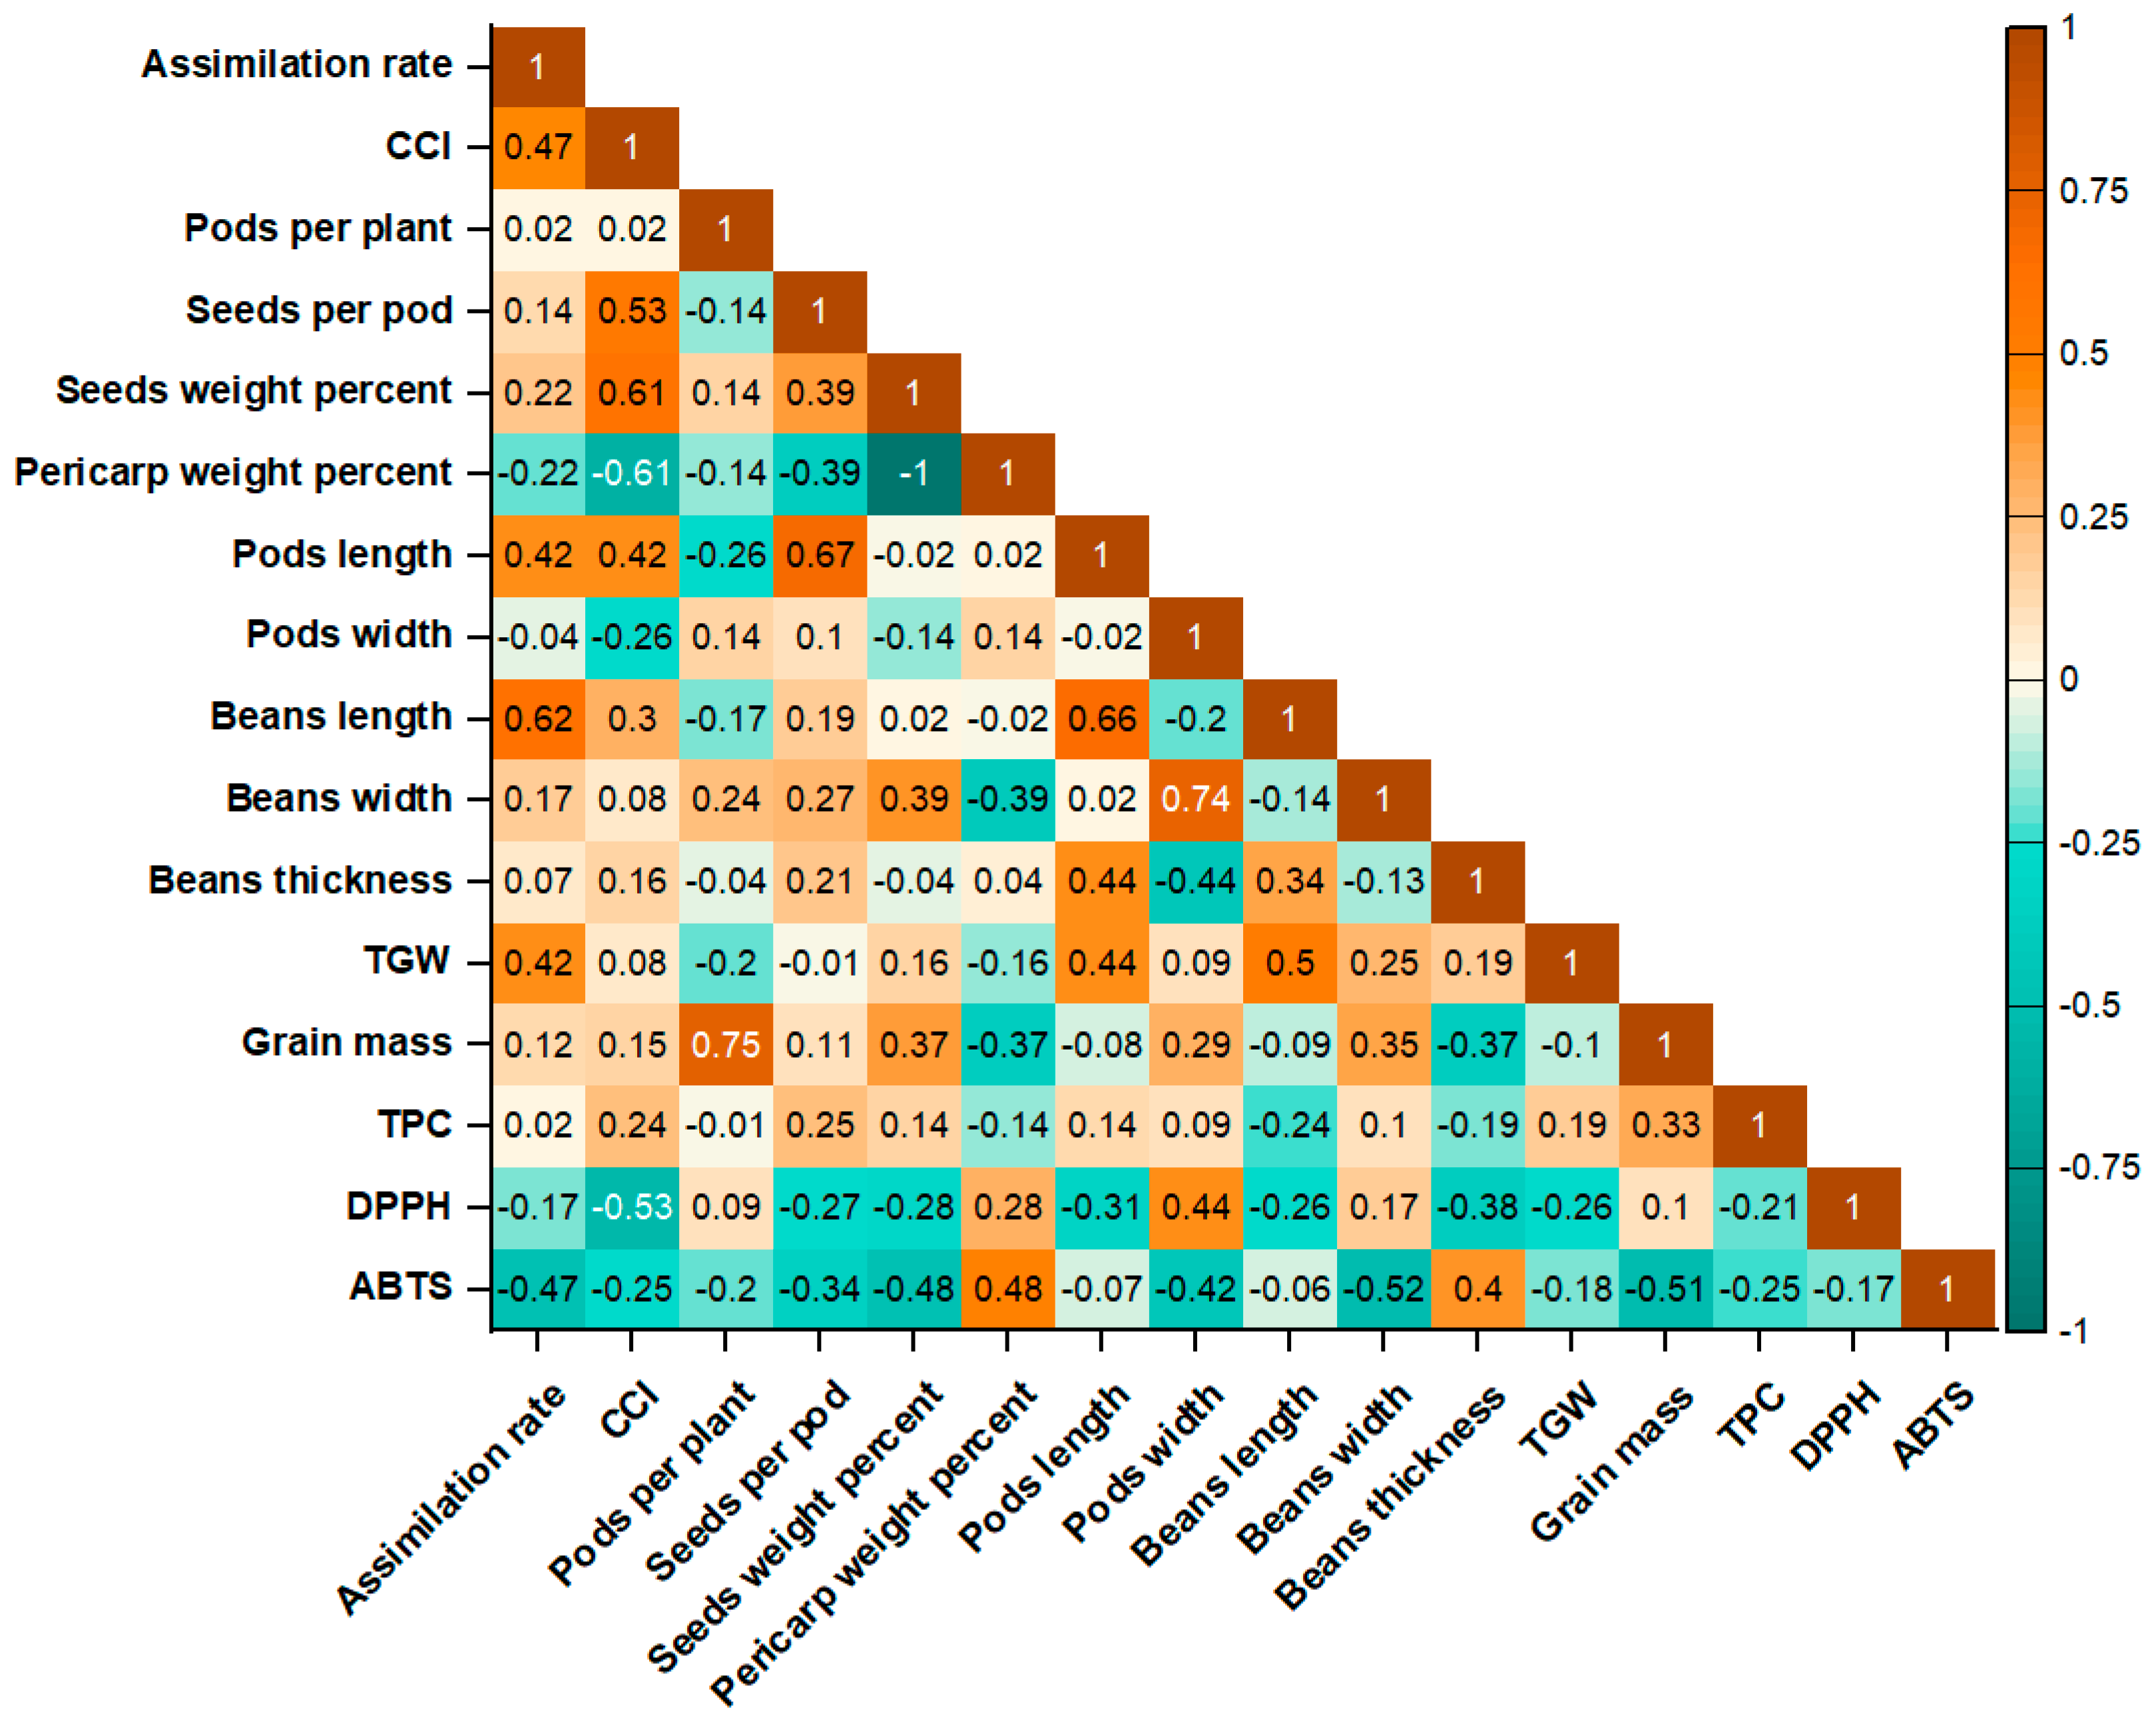

Table 1.
Individual influences of genotype, irrigation and fertilization on the characteristics of runner bean pods.
Table 1.
Individual influences of genotype, irrigation and fertilization on the characteristics of runner bean pods.
| Treatment | Pods per plant | Seeds per pod | Seeds weight percent (%) | Pericarp weight percent (%) | Pods length (cm) |
Pods width (mm) |
|---|---|---|---|---|---|---|
| Cozia1 | 29.72 ± 0.22 b | 2.30 ± 0.02 | 74.04 ± 0.16 b | 25.96 ± 0.16 a | 10.16 ± 0.03 a | 18.19 ± 0.09 b |
| Cozia2 | 33.30 ± 0.07 a | 2.30 ± 0.02 | 75.94 ± 0.20 a | 24.06 ± 0.20 b | 9.70 ± 0.02 b | 18.50 ± 0.03 b |
| Cozia3 | 32.84 ± 0.19 a | 2.30 ± 0.01 | 74.32 ± 0.34 b | 25.68 ± 0.34 a | 9.75 ± 0.09 b | 19.06 ± 0.14 a |
| Signification | * | ns | * | * | * | * |
| IR1 | 30.46 ± 0.47 | 2.28 ± 0.01 | 75.05 ± 0.06 | 24.95 ± 0.06 | 9.80 ± 0.07 | 18.40 ± 0.22 |
| IR2 | 33.45 ± 0.29 | 2.31 ± 0.02 | 74.48 ± 0.08 | 25.52 ± 0.08 | 9.94 ± 0.03 | 18.77 ± 0.09 |
| Signification | * | ns | * | * | ns | Ns |
| OR | 32.23 ± 0.22 b | 2.31 ± 0.02 | 75.06 ± 0.27 | 24.94 ± 0.27 | 9.95 ± 0.03 | 18.28 ± 0.10 b |
| CH | 33.85 ± 0.31 a | 2.32 ± 0.01 | 74.70 ± 0.16 | 25.30 ± 0.16 | 9.93 ± 0.06 | 18.88 ± 0.03 a |
| UF | 29.78 ± 0.52 c | 2.26 ± 0.02 | 74.54 ± 0.27 | 25.46 ± 0.27 | 9.72 ± 0.12 | 18.60 ± 0.15 ab |
| Signification | * | ns | ns | ns | ns | * |
The values are presented as mean ± standard error of individual replicates. Within each column, and factor group: ns − statistically insignificant differences; * − statistically significant differences at p ≤ 0.05 according to Duncan's test. The different letters indicate statistical differences between variants, with 'a' representing the highest values. Cozia1, Cozia2, Cozia3 are the beans cultivars; IR1 − 2000 m3·ha−1 irrigation; IR2 − 2500 m3·ha−1 irrigation; OR − organic fertilization; CH − chemical fertilization; UF – unfertilized.
Table 2.
Individual influences of the genotype, irrigation and fertilization on the seed morphological and yield traits of runner bean.
Table 2.
Individual influences of the genotype, irrigation and fertilization on the seed morphological and yield traits of runner bean.
| Treatment | Beans length (mm) |
Beans width (mm) |
Beans thickness (mm) |
TGW (g) |
Grain mass (kg·ha⁻¹) |
|---|---|---|---|---|---|
| Cozia1 | 21.01 ± 0.16 a | 13.03 ± 0.02 b | 8.69 ± 0.10 a | 1444.40 ± 10.00 a | 2505.60 ± 39.54 c |
| Cozia2 | 20.05 ± 0.02 b | 13.64 ± 0.02 a | 8.61 ± 0.06 a | 1412.84 ± 14.62 ab | 2674.23 ± 17.26 b |
| Cozia3 | 20.00 ± 0.17 b | 13.45 ± 0.11 a | 7.98 ± 0.02 b | 1388.69 ± 8.01 b | 2951.81 ± 19.94 a |
| Signification | * | * | * | * | * |
| IR1 | 20.34 ± 0.03 | 13.25 ± 0.10 | 8.33 ± 0.04 | 1407.88 ± 3.38 | 2648.38 ± 40.19 |
| IR2 | 20.37 ± 0.02 | 13.49 ± 0.02 | 8.52 ± 0.06 | 1422.74 ± 10.68 | 2772.70 ± 27.52 |
| Signification | ns | ns | ns | ns | Ns |
| OR | 20.40 ± 0.05 | 13.29 ± 0.03 | 8.49 ± 0.06 | 1405.71 ± 12.49 | 2807.84 ± 32.11 a |
| CH | 20.28 ± 0.01 | 13.54 ± 0.03 | 8.47 ± 0.06 | 1409.35 ± 20.03 | 2836.43 ± 68.70 a |
| UF | 20.37 ± 0.06 | 13.28 ± 0.12 | 8.32 ± 0.10 | 1430.88 ± 4.96 | 2487.37 ± 57.67 b |
| Signification | ns | ns | ns | ns | * |
The values are presented as mean ± standard error of individual replicates. Within each column, and factor group: ns − statistically insignificant differences; * − statistically significant differences at p ≤ 0.05 according to Duncan's test. The different letters represent statistical differences between variants, where 'a' represents the highest values. Cozia1, Cozia2, Cozia3 are the beans cultivars IR1 − 2000 m3·ha−1 irrigation; IR2 − 2500 m3·ha−1 irrigation; OR − organic fertilization; CH − chemical fertilization; UF – unfertilized.
Table 3.
Influence of genotype × irrigation, genotype × fertilisation, and irrigation × fertilisation interactions on the characteristics of runner bean pods.
Table 3.
Influence of genotype × irrigation, genotype × fertilisation, and irrigation × fertilisation interactions on the characteristics of runner bean pods.
| Treatment | Pods per plant | Seeds per pod | Seeds weight percent (%) | Pericarp weight percent (%) | Pods length (cm) |
Pods width (mm) |
|---|---|---|---|---|---|---|
| Cozia1 × IR1 | 30.78 ± 1.92 b | 2.29 ± 0.02 | 74.39 ± 0.20 b | 25.61 ± 0.20 a | 10.20 ± 0.05 a | 18.17 ± 0.21 b |
| Cozia1 × IR2 | 28.67 ± 1.50 b | 2.31 ± 0.02 | 73.69 ± 0.23 b | 26.31 ± 0.23 a | 10.12 ± 0.01 ab | 18.21 ± 0.09 b |
| Cozia2 × IR1 | 29.54 ± 0.61 b | 2.29 ± 0.01 | 75.97 ± 0.46 a | 24.03 ± 0.46 b | 9.60 ± 0.03 d | 18.29 ± 0.11 b |
| Cozia2 × IR2 | 37.05 ± 0.58 a | 2.31 ± 0.02 | 75.90 ± 0.23 a | 24.10 ± 0.23 b | 9.80 ± 0.02 cd | 18.70 ± 0.09 b |
| Cozia3 × IR1 | 31.06 ± 0.53 b | 2.26 ± 0.04 | 74.80 ± 0.12 ab | 25.20 ± 0.12 ab | 9.62 ± 0.18 cd | 18.75 ± 0.34 b |
| Cozia3 × IR2 | 34.63 ± 0.17 a | 2.33 ± 0.01 | 73.84 ± 0.70 b | 26.16 ± 0.70 a | 9.88 ± 0.05 bc | 19.38 ± 0.17 a |
| Signification | * | ns | * | * | * | * |
| Cozia1 × OR | 28.93 ± 0.32 c | 2.29 ± 0.02 | 74.00 ± 0.41 cd | 26.00 ± 0.41 ab | 10.22 ± 0.03 ab | 17.91 ± 0.09 d |
| Cozia1 × CH | 29.89 ± 0.38 c | 2.34 ± 0.03 | 73.92 ± 0.34 cd | 26.08 ± 0.34 ab | 10.36 ± 0.05 a | 18.50 ± 0.17 bcd |
| Cozia1 × UF | 30.34 ± 0.38 c | 2.27 ± 0.01 | 74.21 ± 0.39 cd | 25.79 ± 0.39 ab | 9.91 ± 0.10 bc | 18.16 ± 0.11 cd |
| Cozia2 × OR | 34.44 ± 0.26 b | 2.35 ± 0.05 | 76.20 ± 0.55 a | 23.80 ± 0.55 d | 9.81 ± 0.08 c | 18.01 ± 0.27 cd |
| Cozia2 × CH | 36.98 ± 0.59 a | 2.31 ± 0.01 | 75.73 ± 0.02 ab | 24.27 ± 0.02 cd | 9.62 ± 0.09 c | 18.49 ± 0.10 bcd |
| Cozia2 × UF | 28.47 ± 0.39 c | 2.24 ± 0.01 | 75.88 ± 0.32 a | 24.12 ± 0.32 d | 9.67 ± 0.06 c | 19.01 ± 0.13 b |
| Cozia3 × OR | 33.33 ± 0.67 b | 2.31 ± 0.01 | 74.99 ± 0.09 abc | 25.01 ± 0.09 bcd | 9.84 ± 0.01 c | 18.92 ± 0.07 b |
| Cozia3 × CH | 34.67 ± 1.19 b | 2.30 ± 0.02 | 74.44 ± 0.83 bcd | 25.56 ± 0.83 abc | 9.82 ± 0.08 c | 19.66 ± 0.17 a |
| Cozia3 × UF | 30.52 ± 1.20 c | 2.28 ± 0.08 | 73.53 ± 0.20 d | 26.47 ± 0.20 a | 9.58 ± 0.30 c | 18.61 ± 0.47 bc |
| Signification | * | ns | * | * | * | * |
| IR1 × OR | 31.18 ± 0.61 c | 2.28 ± 0.03 bc | 74.27 ± 0.24 bc | 25.73 ± 0.24 ab | 9.83 ± 0.04 a | 18.21 ± 0.30 c |
| IR1 × CH | 31.01 ± 0.11 cd | 2.39 ± 0.01 a | 75.98 ± 0.15 a | 24.02 ± 0.15 c | 10.09 ± 0.05 a | 18.73 ± 0.07 abc |
| IR1 × UF | 29.18 ± 1.14 d | 2.17 ± 0.05 d | 74.89 ± 0.11 ab | 25.11 ± 0.11 bc | 9.49 ± 0.23 b | 18.27 ± 0.32 c |
| IR2 × OR | 33.28 ± 0.20 b | 2.35 ± 0.02 ab | 75.85 ± 0.52 a | 24.15 ± 0.52 c | 10.08 ± 0.04 a | 18.34 ± 0.11 bc |
| IR2 × CH | 36.69 ± 0.63 a | 2.24 ± 0.03 cd | 73.41 ± 0.17 c | 26.59 ± 0.17 a | 9.78 ± 0.08 ab | 19.03 ± 0.12 a |
| IR2 × UF | 30.38 ± 0.10 cd | 2.36 ± 0.01 ab | 74.18 ± 0.59 bc | 25.82 ± 0.59 ab | 9.95 ± 0.05 a | 18.92 ± 0.07 ab |
| Signification | * | * | * | * | * | * |
The values are presented as mean ± standard error of individual replicates. Within each column, and for each combination of two factors: ns − statistically insignificant differences; * − statistically significant differences at p ≤ 0.05 according to Duncan's test. The different letters indicate statistical differences between variants, with 'a' representing the highest values. Cozia1, Cozia2, Cozia3 are the beans cultivars; IR1 − 2000 m3·ha−1 irrigation; IR2 − 2500 m3·ha−1 irrigation; OR − organic fertilization; CH − chemical fertilization; UF – unfertilized.
Table 4.
Influence of genotype × irrigation, genotype × fertilisation, and irrigation × fertilisation interactions on the seed morphological and yield traits of runner bean.
Table 4.
Influence of genotype × irrigation, genotype × fertilisation, and irrigation × fertilisation interactions on the seed morphological and yield traits of runner bean.
| Treatment | Beans length (mm) |
Beans width (mm) |
Beans thickness (mm) |
TGW (g) |
Grain mass (kg·ha⁻¹) |
|---|---|---|---|---|---|
| Cozia1 × IR1 | 21.22 ± 0.36 a | 13.05 ± 0.09 b | 8.62 ± 0.10 a | 1449.82 ± 29.03 a | 2528.13 ± 108.51 b |
| Cozia1 × IR2 | 20.80 ± 0.06 a | 13.00 ± 0.04 b | 8.77 ± 0.12 a | 1438.99 ± 9.82 ab | 2483.07 ± 29.48 b |
| Cozia2 × IR1 | 19.96 ± 0.10 b | 13.55 ± 0.01 a | 8.49 ± 0.09 a | 1388.15 ± 19.39 b | 2508.62 ± 19.20 b |
| Cozia2 × IR2 | 20.14 ± 0.07 b | 13.73 ± 0.05 a | 8.73 ± 0.07 a | 1437.52 ± 10.89 ab | 2839.83 ± 42.35 a |
| Cozia3 × IR1 | 19.83 ± 0.31 b | 13.16 ± 0.23 b | 7.89 ± 0.10 b | 1385.69 ± 8.21 b | 2908.40 ± 65.91 a |
| Cozia3 × IR2 | 20.16 ± 0.02 b | 13.73 ± 0.03 a | 8.08 ± 0.07 b | 1391.70 ± 15.73 b | 2995.21 ± 32.56 a |
| Signification | * | * | * | * | * |
| Cozia1 × OR | 21.11 ± 0.03 ab | 12.88 ± 0.02 c | 8.69 ± 0.09 a | 1455.05 ± 15.48 ab | 2584.88 ± 1.39 bcd |
| Cozia1 × CH | 20.69 ± 0.14 abc | 13.25 ± 0.06 bc | 8.69 ± 0.07 a | 1453.49 ± 3.42 ab | 2506.75 ± 55.26 cd |
| Cozia1 × UF | 21.23 ± 0.58 a | 12.94 ± 0.02 c | 8.70 ± 0.22 a | 1424.67 ± 11.69 abc | 2425.17 ± 64.82 d |
| Cozia2 × OR | 19.93 ± 0.12 cd | 13.37 ± 0.04 b | 8.71 ± 0.14 a | 1352.81 ± 4.89 c | 2745.76 ± 13.25 bc |
| Cozia2 × CH | 19.92 ± 0.02 cd | 13.59 ± 0.05 ab | 8.78 ± 0.15 a | 1382.65 ± 11.61 bc | 2872.18 ± 65.49 ab |
| Cozia2 × UF | 20.30 ± 0.17 bcd | 13.97 ± 0.03 a | 8.35 ± 0.03 ab | 1503.05 ± 40.52 a | 2404.74 ± 51.88 d |
| Cozia3 × OR | 20.15 ± 0.08 cd | 13.61 ± 0.07 ab | 8.06 ± 0.04 bc | 1409.25 ± 17.18 bc | 3092.85 ± 85.37 a |
| Cozia3 × CH | 20.25 ± 0.16 bcd | 13.78 ± 0.09 a | 7.96 ± 0.11 bc | 1391.92 ± 52.65 bc | 3130.37 ± 197.78 a |
| Cozia3 × UF | 19.58 ± 0.56 d | 12.95 ± 0.36 c | 7.92 ± 0.18 c | 1364.91 ± 19.04 c | 2632.19 ± 153.27 bcd |
| Signification | * | * | * | * | * |
| IR1 × OR | 20.33 ± 0.08 | 13.14 ± 0.07 bc | 8.36 ± 0.05 ab | 1374.10 ± 21.13 b | 2621.90 ± 8.82 bc |
| IR1 × CH | 20.34 ± 0.07 | 13.54 ± 0.02 a | 8.47 ± 0.11 ab | 1429.27 ± 19.03 ab | 2800.98 ± 19.75 ab |
| IR1 × UF | 20.35 ± 0.10 | 13.08 ± 0.25 c | 8.17 ± 0.14 b | 1420.29 ± 8.01 ab | 2522.27 ± 125.06 c |
| IR2 × OR | 20.46 ± 0.03 | 13.43 ± 0.02 ab | 8.62 ± 0.14 a | 1437.31 ± 7.82 a | 2993.76 ± 55.51 a |
| IR2 × CH | 20.24 ± 0.07 | 13.54 ± 0.04 a | 8.48 ± 0.05 ab | 1389.44 ± 22.45 ab | 2871.88 ± 124.45 a |
| IR2 × UF | 20.40 ± 0.02 | 13.49 ± 0.01 a | 8.48 ± 0.08 ab | 1441.47 ± 15.09 a | 2452.47 ± 25.01 c |
| Signification | Ns | * | * | * | * |
The values are presented as mean ± standard error of individual replicates. Within each column, and for each combination of two factors: ns − statistically insignificant differences; * − statistically significant differences at p ≤ 0.05 according to Duncan's test. The different letters indicate statistical differences between variants, with 'a' representing the highest values. Cozia1, Cozia2, Cozia3 are the beans cultivars; IR1 − 2000 m3·ha−1 irrigation; IR2 − 2500 m3·ha−1 irrigation; OR − organic fertilization; CH − chemical fertilization; UF – unfertilized.
Table 5.
The influence of genotype × irrigation × fertilisation on the characteristics of runner bean pods.
Table 5.
The influence of genotype × irrigation × fertilisation on the characteristics of runner bean pods.
| Treatment | Pods per plant | Seeds per pod | Seeds weight percent (%) | Pericarp weight percent (%) | Pods length (cm) |
Pods width (mm) |
|---|---|---|---|---|---|---|
| Cozia1 × IR1 × OR | 30.27 ± 2.71 c÷g | 2.20 ± 0.03 d÷g | 71.96 ± 0.28 e | 28.04 ± 0.28 a | 10.04 ± 0.06 bc | 17.95 ± 0.13 efg |
| Cozia1 × IR2 × OR | 27.58 ± 2.75 efg | 2.39 ± 0.01 abc | 76.04 ± 0.61 ab | 23.96 ± 0.61 de | 10.40 ± 0.05 ab | 17.86 ± 0.14 fg |
| Cozia1 × IR1 × CH | 30.79 ± 1.43 c÷f | 2.41 ± 0.01 ab | 75.14 ± 0.40 abc | 24.86 ± 0.40 cde | 10.67 ± 0.04 a | 18.57 ± 0.41 b÷g |
| Cozia1 × IR2 × CH | 29.01 ± 0.84 d÷g | 2.28 ± 0.03 b÷e | 72.69 ± 0.34 de | 27.31 ± 0.34 ab | 10.04 ± 0.09 bc | 18.42 ± 0.09 b÷g |
| Cozia1 × IR1 × UF | 31.28 ± 2.14 cde | 2.28 ± 0.01 b÷e | 76.06 ± 0.49 ab | 23.94 ± 0.49 de | 9.89 ± 0.17 bcd | 17.97 ± 0.18 d÷g |
| Cozia1 × IR2 × UF | 29.41 ± 1.37 d÷g | 2.26 ± 0.01 c÷f | 72.36 ± 0.30 de | 27.64 ± 0.30 ab | 9.94 ± 0.07 bc | 18.35 ± 0.14 b÷g |
| Cozia2 × IR1 × OR | 32.85 ± 1.31 bcd | 2.33 ± 0.04 a÷d | 76.77 ± 0.96 a | 23.23 ± 0.96 e | 9.61 ± 0.05 c÷f | 17.80 ± 0.55 g |
| Cozia2 × IR2 × OR | 36.02 ± 1.38 b | 2.36 ± 0.06 abc | 75.62 ± 0.87 ab | 24.38 ± 0.87 de | 10.01 ± 0.11 bc | 18.21 ± 0.02 c÷g |
| Cozia2 × IR1 × CH | 25.83 ± 0.38 g | 2.43 ± 0.02 a | 76.11 ± 0.47 ab | 23.89 ± 0.47 de | 9.84 ± 0.11 cde | 18.46 ± 0.11 b÷g |
| Cozia2 × IR2 × CH | 48.13 ± 0.95 a | 2.18 ± 0.01 efg | 75.35 ± 0.52 abc | 24.65 ± 0.52 cde | 9.39 ± 0.08 def | 18.51 ± 0.14 b÷g |
| Cozia2 × IR1 × UF | 29.94 ± 0.56 c÷g | 2.10 ± 0.02 g | 75.02 ± 0.20 abc | 24.98 ± 0.20 cde | 9.35 ± 0.05 ef | 18.63 ± 0.11 b÷g |
| Cozia2 × IR2 × UF | 27.00 ± 0.99 efg | 2.38 ± 0.02 abc | 76.74 ± 0.69 a | 23.26 ± 0.69 e | 10.00 ± 0.08 bc | 19.38 ± 0.14 ab |
| Cozia3 × IR1 × OR | 30.42 ± 0.55 c÷g | 2.31 ± 0.02 a÷e | 74.09 ± 0.15 bcd | 25.91 ± 0.15 bcd | 9.86 ± 0.03 cd | 18.89 ± 0.30 b÷f |
| Cozia3 × IR2 × OR | 36.24 ± 0.83 b | 2.30 ± 0.01 a÷e | 75.89 ± 0.16 ab | 24.11 ± 0.16 de | 9.83 ± 0.05 cde | 18.95 ± 0.18 b÷e |
| Cozia3 × IR1 × CH | 36.42 ± 1.07 b | 2.34 ± 0.01 abc | 76.71 ± 0.32 a | 23.29 ± 0.32 e | 9.76 ± 0.07 cde | 19.15 ± 0.24 bc |
| Cozia3 × IR2 × CH | 32.92 ± 1.33 bcd | 2.26 ± 0.04 c÷f | 72.18 ± 1.35 de | 27.82 ± 1.35 ab | 9.89 ± 0.08 bcd | 20.17 ± 0.30 a |
| Cozia3 × IR1 × UF | 26.33 ± 1.83 fg | 2.14 ± 0.14 fg | 73.60 ± 0.59 cde | 26.40 ± 0.59 abc | 9.24 ± 0.57 f | 18.20 ± 0.90 c÷g |
| Cozia3 × IR2 × UF | 34.72 ± 0.68 bc | 2.43 ± 0.02 a | 73.46 ± 0.87 cde | 26.54 ± 0.87 abc | 9.92 ± 0.05 bc | 19.02 ± 0.12 bcd |
The values are presented as mean ± standard error of individual replicates. Within each column, the different letters represent statistical differences between variants at p ≤ 0.05 according to Duncan's test, where 'a' represents the highest values. Cozia1, Cozia2, Cozia3 are beans cultivars; IR1 − 2000 m3·ha−1 irrigation; IR2 − 2500 m3·ha−1 irrigation; OR − organic fertilization; CH − chemical fertilization; UF – unfertilized.
Table 6.
The influence of genotype × irrigation × fertilisation on the seed morphological and yield traits of runner bean.
Table 6.
The influence of genotype × irrigation × fertilisation on the seed morphological and yield traits of runner bean.
| Treatment | Beans length (mm) |
Beans width (mm) |
Beans thickness (mm) |
TGW (g) |
Grain mass (kg·ha⁻¹) |
|---|---|---|---|---|---|
| Cozia1 × IR1 × OR | 20.87 ± 0.02 abc | 12.71 ± 0.05 h | 8.74 ± 0.14 abc | 1424.81 ± 34.81 a÷d | 2193.43 ± 70.42 i |
| Cozia1 × IR2 × OR | 21.35 ± 0.04 ab | 13.06 ± 0.08 d÷h | 8.65 ± 0.06 a÷e | 1485.29 ± 4.24 ab | 2976.34 ± 71.44 bcd |
| Cozia1 × IR1 × CH | 21.07 ± 0.15 abc | 13.48 ± 0.13 b÷g | 8.67 ± 0.08 a÷d | 1524.20 ± 21.83 a | 2758.95 ± 118.60 def |
| Cozia1 × IR2 × CH | 20.30 ± 0.14 bcd | 13.01 ± 0.01 e÷h | 8.70 ± 0.08 abc | 1382.78 ± 15.11 bcd | 2254.53 ± 41.62 hi |
| Cozia1 × IR1 × UF | 21.72 ± 1.14 a | 12.96 ± 0.08 fgh | 8.45 ± 0.13 b÷e | 1400.44 ± 36.29 bcd | 2632.00 ± 159.87 d÷h |
| Cozia1 × IR2 × UF | 20.74 ± 0.18 abc | 12.93 ± 0.04 gh | 8.95 ± 0.31 ab | 1448.90 ± 16.93 abc | 2218.33 ± 31.51 i |
| Cozia2 × IR1 × OR | 19.96 ± 0.15 cd | 13.30 ± 0.05 c÷g | 8.27 ± 0.10 c÷g | 1323.20 ± 13.92 d | 2688.80 ± 86.01 d÷g |
| Cozia2 × IR2 × OR | 19.90 ± 0.14 cd | 13.43 ± 0.05 c÷g | 9.14 ± 0.36 a | 1382.43 ± 20.77 bcd | 2802.72 ± 107.69 c÷f |
| Cozia2 × IR1 × CH | 19.83 ± 0.10 cd | 13.61 ± 0.09 bcd | 8.91 ± 0.31 ab | 1360.35 ± 33.29 cd | 2316.76 ± 17.91 ghi |
| Cozia2 × IR2 × CH | 20.01 ± 0.13 cd | 13.56 ± 0.06 b÷e | 8.65 ± 0.04 a÷e | 1404.95 ± 22.37 bcd | 3427.60 ± 121.10 a |
| Cozia2 × IR1 × UF | 20.08 ± 0.20 bcd | 13.73 ± 0.02 abc | 8.30 ± 0.06 c÷g | 1480.92 ± 24.00 ab | 2520.31 ± 42.84 e÷i |
| Cozia2 × IR2 × UF | 20.52 ± 0.22 a÷d | 14.21 ± 0.04 a | 8.40 ± 0.11 b÷f | 1525.19 ± 57.11 a | 2289.18 ± 100.44 ghi |
| Cozia3 × IR1 × OR | 20.16 ± 0.17 bcd | 13.41 ± 0.12 c÷g | 8.05 ± 0.06 efg | 1374.30 ± 33.22 cd | 2983.48 ± 41.05 bcd |
| Cozia3 × IR2 × OR | 20.14 ± 0.01 bcd | 13.81 ± 0.02 abc | 8.07 ± 0.04 efg | 1444.20 ± 7.89 abc | 3202.23 ± 130.76 abc |
| Cozia3 × IR1 × CH | 20.11 ± 0.26 bcd | 13.52 ± 0.11 b÷f | 7.84 ± 0.05 fg | 1403.26 ± 45.89 bcd | 3327.24 ± 136.65 ab |
| Cozia3 × IR2 × CH | 20.04 ± 0.07 bcd | 14.04 ± 0.08 ab | 8.08 ± 0.16 d÷g | 1380.58 ± 59.78 bcd | 2933.51 ± 258.96 bcd |
| Cozia3 × IR1 × UF | 19.24 ± 0.99 d | 12.55 ± 0.68 h | 7.76 ± 0.38 g | 1379.51 ± 31.68 bcd | 2414.49 ± 282.39 f÷i |
| Cozia3 × IR2 × UF | 19.93 ± 0.14 cd | 13.34 ± 0.03 c÷g | 8.09 ± 0.04 d÷g | 1350.32 ± 12.28 cd | 2849.90 ± 37.39 cde |
The values are presented as mean ± standard error of individual replicates. Within each column, the different letters represent statistical differences between variants at p ≤ 0.05 according to Duncan's test, where 'a' represents the highest values. Cozia1, Cozia2, Cozia3 are beans cultivars; IR1 − 2000 m3·ha−1 irrigation; IR2 − 2500 m3·ha−1 irrigation; OR − organic fertilization; CH − chemical fertilization; UF – unfertilized.
Table 7.
The individual influences of the genotype, irrigation and fertilization on the biochemical characteristics of runner bean beans.
Table 7.
The individual influences of the genotype, irrigation and fertilization on the biochemical characteristics of runner bean beans.
| Treatment | TPC (mg GAE·100 g−1 d.w.) |
DPPH (mmol TE·100 g−1 d.w.) |
ABTS (mmol TE·100 g−1 d.w.) |
|---|---|---|---|
| Cozia1 | 0.32 ± 0.00 b | 0.12 ± 0.00 b | 0.28 ± 0.00 |
| Cozia2 | 0.31 ± 0.01 b | 0.12 ± 0.00 ab | 0.27 ± 0.01 |
| Cozia3 | 0.37 ± 0.01 a | 0.13 ± 0.00 a | 0.26 ± 0.00 |
| Signification | * | * | ns |
| IR1 | 0.33 ± 0.00 | 0.13 ± 0.00 | 0.27 ± 0.00 |
| IR2 | 0.34 ± 0.01 | 0.12 ± 0.00 | 0.27 ± 0.00 |
| Signification | ns | ns | ns |
| OR | 0.33 ± 0.01 | 0.12 ± 0.00 b | 0.27 ± 0.01 |
| CH | 0.35 ± 0.01 | 0.14 ± 0.01 a | 0.26 ± 0.00 |
| UF | 0.32 ± 0.01 | 0.12 ± 0.00 b | 0.27 ± 0.01 |
| Signification | ns | * | ns |
The values are presented as mean ± standard error of individual replicates. Within each column, and factor group: ns − statistically insignificant differences; * − statistically significant differences at p ≤ 0.05 according to Duncan's test. The different letters indicate statistical differences between variants, with 'a' representing the highest values. Cozia1, Cozia2, Cozia3 are the beans cultivars; IR1 − 2000 m3·ha−1 irrigation; IR2 − 2500 m3·ha−1 irrigation; OR − organic fertilization; CH − chemical fertilization; UF – unfertilized.
Table 8.
The influence of genotype × irrigation, genotype × fertilisation, and irrigation × fertilisation interactions on the biochemical characteristics of runner bean beans.
Table 8.
The influence of genotype × irrigation, genotype × fertilisation, and irrigation × fertilisation interactions on the biochemical characteristics of runner bean beans.
| Treatment | TPC (mg GAE·100 g−1 d.w.) |
DPPH (mmol TE·100 g−1 d.w.) |
ABTS (mmol TE·100 g−1 d.w.) |
|---|---|---|---|
| Cozia1 × IR1 | 0.28 ± 0.00 c | 0.11 ± 0.00 b | 0.27 ± 0.00 ab |
| Cozia1 × IR2 | 0.36 ± 0.01 ab | 0.13 ± 0.00 ab | 0.28 ± 0.00 a |
| Cozia2 × IR1 | 0.33 ± 0.00 bc | 0.13 ± 0.00 a | 0.27 ± 0.00 ab |
| Cozia2 × IR2 | 0.30 ± 0.02 c | 0.12 ± 0.01 b | 0.26 ± 0.01 b |
| Cozia3 × IR1 | 0.39 ± 0.01 a | 0.13 ± 0.00 a | 0.27 ± 0.01 ab |
| Cozia3 × IR2 | 0.35 ± 0.01 ab | 0.13 ± 0.00 a | 0.26 ± 0.00 b |
| Signification | * | * | * |
| Cozia1 × OR | 0.28 ± 0.00 d | 0.13 ± 0.00 bc | 0.27 ± 0.01 |
| Cozia1 × CH | 0.40 ± 0.01 ab | 0.12 ± 0.00 bcd | 0.27 ± 0.01 |
| Cozia1 × UF | 0.28 ± 0.00 d | 0.11 ± 0.00 d | 0.29 ± 0.01 |
| Cozia2 × OR | 0.30 ± 0.04 d | 0.11 ± 0.00 cd | 0.29 ± 0.02 |
| Cozia2 × CH | 0.36 ± 0.01 bc | 0.14 ± 0.01 b | 0.26 ± 0.00 |
| Cozia2 × UF | 0.31 ± 0.01 cd | 0.12 ± 0.01 bcd | 0.26 ± 0.01 |
| Cozia3 × OR | 0.44 ± 0.02 a | 0.12 ± 0.00 cd | 0.26 ± 0.00 |
| Cozia3 × CH | 0.29 ± 0.00 d | 0.16 ± 0.01 a | 0.26 ± 0.01 |
| Cozia3 × UF | 0.38 ± 0.02 b | 0.12 ± 0.00 bcd | 0.27 ± 0.00 |
| Signification | * | * | ns |
| IR1 × OR | 0.30 ± 0.00 c | 0.13 ± 0.00 ab | 0.28 ± 0.01 |
| IR1 × CH | 0.39 ± 0.00 a | 0.13 ± 0.00 ab | 0.26 ± 0.00 |
| IR1 × UF | 0.31 ± 0.01 c | 0.12 ± 0.00 bc | 0.28 ± 0.01 |
| IR2 × OR | 0.37 ± 0.03 ab | 0.11 ± 0.00 c | 0.27 ± 0.01 |
| IR2 × CH | 0.31 ± 0.01 c | 0.15 ± 0.01 a | 0.27 ± 0.01 |
| IR2 × UF | 0.33 ± 0.00 bc | 0.12 ± 0.01 bc | 0.27 ± 0.00 |
| Signification | * | * | ns |
The values are presented as mean ± standard error of individual replicates. Within each column, and for each combination of two factors: ns − statistically insignificant differences; * − statistically significant differences at p ≤ 0.05 according to Duncan's test. The different letters indicate statistical differences between variants, with 'a' representing the highest values. Cozia1, Cozia2, Cozia3 are the beans cultivars; IR1 − 2000 m3·ha−1 irrigation; IR2 − 2500 m3·ha−1 irrigation; OR − organic fertilization; CH − chemical fertilization; UF – unfertilized.
Table 9.
The influence of genotype × irrigation × fertilisation on the biochemical characteristics of runner bean beans.
Table 9.
The influence of genotype × irrigation × fertilisation on the biochemical characteristics of runner bean beans.
| Treatment | TPC (mg GAE·100 g−1 d.w.) |
DPPH (mmol TE·100 g−1 d.w.) |
ABTS (mmol TE·100 g−1 d.w.) |
|---|---|---|---|
| Cozia1 × IR1 × OR | 0.17 ± 0.00 i | 0.14 ± 0.01 bcd | 0.29 ± 0.01 abc |
| Cozia1 × IR2 × OR | 0.39 ± 0.01 bcd | 0.12 ± 0.01 c÷g | 0.25 ± 0.01 cd |
| Cozia1 × IR1 × CH | 0.47 ± 0.01 a | 0.11 ± 0.00 fgh | 0.27 ± 0.00 bcd |
| Cozia1 × IR2 × CH | 0.34 ± 0.03 def | 0.14 ± 0.01 bcd | 0.28 ± 0.01 a÷d |
| Cozia1 × IR1 × UF | 0.21 ± 0.00 hi | 0.10 ± 0.00 gh | 0.27 ± 0.01 bcd |
| Cozia1 × IR2 × UF | 0.35 ± 0.00 de | 0.12 ± 0.01 c÷f | 0.31 ± 0.01 a |
| Cozia2 × IR1 × OR | 0.28 ± 0.00 fgh | 0.14 ± 0.01 bc | 0.28 ± 0.02 a÷d |
| Cozia2 × IR2 × OR | 0.28 ± 0.03 fgh | 0.09 ± 0.00 h | 0.30 ± 0.02 ab |
| Cozia2 × IR1 × CH | 0.37 ± 0.00 cd | 0.13 ± 0.01 b÷e | 0.26 ± 0.01 bcd |
| Cozia2 × IR2 × CH | 0.35 ± 0.02 d | 0.14 ± 0.01 bc | 0.25 ± 0.00 cd |
| Cozia2 × IR1 × UF | 0.33 ± 0.00 def | 0.12 ± 0.00 c÷f | 0.28 ± 0.02 a÷d |
| Cozia2 × IR2 × UF | 0.28 ± 0.01 efg | 0.12 ± 0.01 c÷f | 0.24 ± 0.01 d |
| Cozia3 × IR1 × OR | 0.45 ± 0.01 ab | 0.12 ± 0.00 c÷f | 0.26 ± 0.01 bcd |
| Cozia3 × IR2 × OR | 0.43 ± 0.05 abc | 0.12 ± 0.00 d÷g | 0.26 ± 0.01 bcd |
| Cozia3 × IR1 × CH | 0.34 ± 0.01 def | 0.15 ± 0.00 ab | 0.25 ± 0.00 cd |
| Cozia3 × IR2 × CH | 0.24 ± 0.02 gh | 0.17 ± 0.01 a | 0.27 ± 0.02 bcd |
| Cozia3 × IR1 × UF | 0.39 ± 0.05 bcd | 0.13 ± 0.01 cde | 0.28 ± 0.00 a÷d |
| Cozia3 × IR2 × UF | 0.37 ± 0.00 cd | 0.11 ± 0.00 efg | 0.25 ± 0.01 cd |
The values are presented as mean ± standard error of individual replicates. Within each column, the different letters represent statistical differences between variants at p ≤ 0.05 according to Duncan's test, where 'a' represents the highest values. Cozia1, Cozia2, Cozia3 are beans cultivars; IR1 − 2000 m3·ha−1 irrigation; IR2 − 2500 m3·ha−1 irrigation; OR − organic fertilization; CH − chemical fertilization; UF – unfertilized.
Table 10.
Eigenvalues of the correlation matrix showing the affinities of the physiological, biometric, and biochemical traits of Cozia cultivars under fertilization treatments and irrigation regimes to PCs.
Table 10.
Eigenvalues of the correlation matrix showing the affinities of the physiological, biometric, and biochemical traits of Cozia cultivars under fertilization treatments and irrigation regimes to PCs.
| PC | Eigenvalue | Percentage of variance (%) | Cumulative percentage of variance (%) |
|---|---|---|---|
| 1 | 4.214 | 26.34 | 26.34 |
| 2 | 3.445 | 21.53 | 47.87 |
| 3 | 2.044 | 12.77 | 60.64 |
| 4 | 1.397 | 8.73 | 69.37 |
| 5 | 1.197 | 7.48 | 76.85 |
| 6 | 1.114 | 6.96 | 83.81 |
| 7 | 0.973 | 6.08 | 89.9 |
| 8 | 0.506 | 3.16 | 93.06 |
| 9 | 0.446 | 2.79 | 95.84 |
| 10 | 0.300 | 1.87 | 97.72 |
| 11 | 0.155 | 0.97 | 98.69 |
| 12 | 0.117 | 0.73 | 99.42 |
| 13 | 0.064 | 0.4 | 99.82 |
| 14 | 0.026 | 0.16 | 99.99 |
| 15 | 0.002 | 0.01 | 100 |
Disclaimer/Publisher’s Note: The statements, opinions and data contained in all publications are solely those of the individual author(s) and contributor(s) and not of MDPI and/or the editor(s). MDPI and/or the editor(s) disclaim responsibility for any injury to people or property resulting from any ideas, methods, instructions or products referred to in the content. |
© 2025 by the authors. Licensee MDPI, Basel, Switzerland. This article is an open access article distributed under the terms and conditions of the Creative Commons Attribution (CC BY) license (http://creativecommons.org/licenses/by/4.0/).
Copyright: This open access article is published under a Creative Commons CC BY 4.0 license, which permit the free download, distribution, and reuse, provided that the author and preprint are cited in any reuse.


