
Submitted:
21 June 2023
Posted:
21 June 2023
You are already at the latest version
Abstract
eDNA extracted from the gut contents of filter feeders with unique feeding habits can be used to identify biodiversity in aquatic ecosystems. In this study, we used eDNA from the gut contents of the clam Corbicula fluminea to examine estuarine ecosystem biodiversity. The field survey was conducted at three study sites in the Nakdong River Estuary, which is characterised by closed estuarine features resulting from the presence of an estuarine barrage. The collected C. fluminea samples were dissected to separate the gut contents, and the extracted eDNA was amplified using the 18S V9 primer targeting all eukaryotes. The amplified DNA was sequenced using next generation sequencing (NGS) techniques, and BLASTn was performed based on the NCBI database. We obtained 21 unique operational taxonomic units (OTUs), including fish (approximately 9.52%), copepods (approximately 14.29%), and green algae (approximately 23.81%), which represented a wide range of habitats such as marine, brackish, freshwater, and terrestrial environments. These results suggest that various organisms living in aquatic ecosystems can be identified through eDNA from the gut contents of C. fluminea and support the potential application of bivalves as eDNA samplers in diverse aquatic ecosystems.
Keywords:
Corbicula fluminea
; Nakdong River Estuary
; eDNA metabarcoding
; biodiversity
; molecular diet analysis
; next-generation sequencing
; 18S V9
1. Introduction
Estuaries are highly complex and dynamic ecosystems that provide diverse habitats, such as tidal mudflats, sandbars, marshes, and transition zones for numerous organisms [1,2,3]. However, estuaries are often subjected to serious threats from anthropogenic impacts, including overexploitation, reclamation, pollution, and barrage construction, leading to rapid declines in habitat and biodiversity [4,5]. Thus, monitoring and detecting significant changes in estuarine ecosystems and biodiversity are important [6]. Traditional aquatic species monitoring methods that rely on direct detection or capture are time-consuming and labour-intensive [7,8]. Morphological identification using the naked eye or a microscope is skill-dependent and can result in misidentification [9]. Furthermore, the dynamic environment and high biodiversity of estuarine ecosystems complicate monitoring [10].
Environmental DNA (eDNA) metabarcoding is a promising alternative to traditional monitoring methods [11]. This molecular technique enables the identification of the entire community from a single environmental sample (for example, water, soil, air, faeces, or gut contents) without directly observing or capturing the organisms. Through polymerase chain reaction (PCR) using universal or group specific primer and next-generation sequencing (NGS) techniques, researchers can identify the presence of various organisms, including rare, elusive, or endangered species [11,12]. This method provides a noninvasive and efficient way to assess biodiversity in different habitats [13]. Consequently, studies employing eDNA metabarcoding for biodiversity assessment have gained significant attention in recent years and have explored various potential eDNA sources, such as biofilms, faeces, or gut contents [14,15,16].
Filter feeders, which filter water and ingest organic particles, may accumulate eDNA within their bodies without an artificial filtering process and can be used to identify biodiversity in aquatic ecosystems [15,17,18]. Their unique and effective feeding habit makes them potential eDNA samplers [15,19]. In particular, bivalves such as clams and mussels are widely distributed across aquatic ecosystems, including lakes, rivers, and estuaries, demonstrating broader applicability than other filter feeders [20]. However, few studies have extracted eDNA from bivalves, and its potential has rarely been investigated, especially in specific ecosystems, such as closed estuaries.
In this study, we conducted a first-of-its-kind investigation applying bivalve eDNA metabarcoding for diversity monitoring in a closed estuary, using the Nakdong River Estuary as a case study. This estuary exemplifies an artificially regulated ecosystem due to the presence of an estuarine barrage, which was constructed in 1987 and reopened in 2022 to restore a brackish ecosystem [21]. The bivalve C. fluminea is widely distributed in the Nakdong River Estuary. We hypothesised that eDNA analysis of C. fluminea gut contents could reveal the biodiversity of the Nakdong River Estuary.
To test this hypothesis, (1) we extracted eDNA from the gut contents of C. fluminea collected from an estuary and investigated its biodiversity using metabarcoding analysis. Then (2) we compared the results of the three study sites in the Nakdong River Estuary. Finally, the potentials and limitations of this case study are discussed.
2. Materials and Methods
2.1. Study sites
The Nakdong River is the second-largest river system in South Korea and maintains a well-developed estuarine system (35° 05' N, 128° 55' E). It is also recognised as an important biodiversity conservation area, including winter bird habitats and stopover sites on the East Asia-Australasian Flyway [22]. Another important feature of the estuary is flood control activities, mainly through the estuarine barrage built in 1987. This structure divides the brackish areas into distinct freshwater and saline zones. This division is believed to influence biodiversity changes [21], necessitating more detailed and efficient monitoring methods to address growing concerns regarding regional biodiversity protection. In the present study, we selected three sites within a brackish area, each with different salinity levels (Figure 1). Site 1 is closest from the barrage), with Site 3 situated between the two (approximately 2.0 and 3.9 km from the barrage, respectively) and Site 2 situated between the two (approximately 2.7 km from the barrage).
2.2. Water quality survey
A field survey was conducted in September 2021 concurrently with the sampling of C. fluminea. Water samples were collected from the surface layer (at a depth of approximately 0.5 m) using a 10 L polypropylene bucket. Dissolved oxygen (D.O., mg L-1, %) and water temperature (°C) were measured with a YSI 550A Dissolved Oxygen Instrument (YSI, Ohio, USA). The pH levels were determined using a YSI Model 60 handheld pH–temperature system (YSI, Ohio, USA). Electrical conductivity (μS cm-1) and salinity (ppt) were assessed using a YSI Pro30 Conductivity Meter (YSI, Ohio, USA). Following the field survey, the water samples were transported to the laboratory in refrigerated storage for turbidity and alkalinity analyses. Turbidity (NTU) was measured using an APERA TN500 Portable White Light Turbidity Meter (APERA, Ohio, USA), and alkalinity (mg L-1) was determined using the neutralisation method in accordance with standard procedures [23].
2.3. C. fluminea sampling and pretreatment
C. fluminea samples were collected using a fishing dredge with a width of 123 cm and height of 22 cm (Figure A1). The dredge net was made of polyethylene and was 320 cm long with an 11 × 11 mm mesh size. Collected C. fluminea samples were placed in separate polyethylene bags at each site and transported to the laboratory for refrigerated storage. The samples were stored at -80 °C until further analysis.
From the collected C. fluminea samples, ten individuals per site were randomly selected (totalling 30 individuals; shell length (cm), 2.0–3.0; shell height (cm), 1.9–2.4; shell width (cm), 1.1–1.5; and total weight (g), 2.990–6.051). The gut was eviscerated and dissected to obtain the contents. During the dissection process, scalpels, tweezers, and scissors were flame-sterilised between samples to minimise contamination. The extracted gut contents were placed in 1.5 mL microtubes separately (n=30) and stored at -20 °C until further analysis.
2.4. DNA extraction and amplification
The gut contents from the C. fluminea samples were homogenised with sterilised homogeniser pestle, and gDNA was extracted using ‘DNeasy Blood & Tissue Kit’ (Qiagen, Hilden, Germany), according to manufacturer’s instructions. The extracted gDNA samples were stored at -20 °C.
We implemented two consecutive PCR steps for next-generation sequencing (NGS) process. The 1st PCR was performed using primer sets targeting universal eukaryotes to amplify the V9 regions of 18S rRNA (18S V9 primer). The forward primer sequence is 5’-TCGTCGGCAGCGTCAGATGTGTATAAGAGACAGCCCTGCCHTTTGTACACAC-3’, and the reverse is 5‘-GTCTCGTGGGCTCGGAGATGTGTATAAGAGACAGCCTTCYGCAGGTTCACCTAC-3’. We used ‘AccuPower HotStart PCR PreMix’ (Bioneer, Deajeon, Korea), and the volume of the PCR reaction solution was total 20 uL (DNA template 1 uL, forward primer 1 uL, reverse primer 1 uL, and distilled water [D.W.] 17 uL). The PCR condition consist of 1 cycle of initial denaturation (94 °C, 10 min) and 35 cycles of Denaturation (94 °C, 1 min), Annealing (50 °C, 1.5 min), extension (72 °C, 1 min) and 1 cycle of final extension (72 °C, 10 min). After 1st PCR, we confirmed the size of the products using 1.5% agarose gel electrophoresis and stored them at -20 °C.
The 2nd PCR was performed using ‘KAPA HiFi HotStart ReadyMix’ (KAPA Biosystems, Wilmington, MA, USA) and ‘Nextera XT Index Kit v2’ (Illumina, San Diego, CA, USA). The volume of the PCR reaction solution was total 25 uL (1st PCR product 2.5 uL, Forward index 2.5 uL, Reverse index 2.5 uL, KAPA mix 12.5 uL, D.W. 5 uL). The PCR condition consist of 1 cycle of initial denaturation (95 °C, 3 min) and ten cycles of denaturation (95 °C, 30 s), annealing (55 °C, 30 s), extension (72 °C, 30 s), and 1 cycle of final extension (72 °C, 5 min). Subsequently, we confirmed the size of the products by 1.5% agarose gel electrophoresis and stored them at -20 °C.
The PCR products were purified by beads clean-up process using ‘AMPure XP Reagent’ (Beckman Coulter, Indianapolis, IN, USA) and then pooled in equal concentration (10nM) using ‘DeNovix QFX Fluorometer’ and ‘Denovix dsDNA Ultra High Sensitivity Assay’ (Denovix, Wilmington, DE, USA) according to the manufacturer's protocol. The generated library was stored at -20 °C until DNA sequencing.
2.5. DNA sequence analysis and statistics
We sequenced library samples using NGS and performed taxonomic identification. The library was sequenced on an Illumina iSeq platform (Illumina, San Diego, CA, USA) and data processing was performed using USEARCH (v11.0.667) [24]. Demultiplexed raw sequences (FASTQ files) were merged into one sequence, allowing a maximum of ten mismatches. Merged reads with expected errors>3.0 were discarded after quality filtering. The remaining sequences were dereplicated and clustered into operational taxonomic units (OTUs) at a 97% OTU cutoff value, removing chimeric and singleton sequences.
The resulting OTUs sequences were searched against the NCBI database (Release 250.0; July 2022) using BLASTn [25]. We obtained a list of the top 100 taxa for each OTU with the highest identity percentage. Considering the known characteristics and distribution of each taxon, we excluded taxa that were not present at the study sites. If all taxa found in the search results had low scores (query cover<80%, identity <90%) or were regarded as not inhabited, the OTUs were deleted. Finally, the one with the highest identity was assigned to each OTU. OTUs with 97% or higher identity were identified at the species level, and the rest (93–97%) were identified at the gene level. OTUs identified as C. fluminea were considered ‘self-DNA’ and excluded from the subsequent process. Obtained sequences were deposited in the NCBI repository under accession number SAMN35796656.
Next, we categorised the OTUs identified through taxonomic classification and general habitat based on the 2022 World Register of Marine Species (WoRMS) database (https://www.marinespecies.org/) and additional references (Table A1). The number of OTUs was visualised as pie charts and bar graphs using Microsoft Excel 2019 (Microsoft, Redmond, WA, USA) based on the phylum and habitat categories. The taxon composition at each study site was visualised using a Venn diagram. The number of OTUs and taxa composition at each study site were analysed based on the phylum and habitat categories. Rarefaction analysis was performed using Past 3.01 (Natural History Museum – University of Oslo, USAOSLO Norway) to determine the sample size required to obtain a sufficient number of OTUs.
3. Results
3.1. Water parameters
The three study sites at the Nakdong River Estuary exhibited salinity values ranging 10.0–14.2 ppt, indicative of a brackish area (Table 1). Salinity increased in the following order: Site 2, Site 3, and Site 1, regardless of the distance from the estuarine barrage. Electrical conductivity showed a trend similar to that of salinity, as it was also affected by dissolved salts. The other parameters (that is, dissolved oxygen, pH, water temperature, alkalinity, and turbidity) were not significantly different among the study sites.
3.2. eDNA from the gut contents of C. fluminea
DNA metabarcoding analysis generated 17,272 paired-end reads from 30 samples. After quality filtering, 16,980 (98.3 %) sequences were obtained, comprising 21 OTUs. OTUs were identified as 21 eukaryotic taxa (ten phyla, 14 classes, 17 orders, 19 families, and 20 genera) belonging to Animalia, Chromista, Fungi, and Plantae. We identified 12 OTUs at the species level (that is, identity ≥ 97%) and nine OTUs at the genus level (94.41–97%) (Table 2). Cyclops sp., Neocercomonas sp., and Nannochloris sp. were identified at the genus level despite having an identity higher than 97%, as the search results from the database were already at the genus level.
The OTUs identified in the gut contents of C. fluminea recovered taxonomically diverse species and genera. Among the results, Animalia accounted for the highest percentage at 38.1% (eight OTUs), followed by Chromista (28.6%; six OTUs), Plantae (23.8%; five OTUs), and Fungi (9.5%; two OTUs) (Figure 2). Animalia comprises the phyla Arthropoda, Chordata, and Platyhelminthes and includes Mytilicola orientalis, a species known to be parasitic in the intestines of bivalves. Fish accounted for 9.52% (two OTUs) of the total, and copepods accounted for 14.29% (three OTUs). The OTUs in the kingdom Chromista spanned four phyla, with Ochrophyta representing the highest proportion. Fungi contained the lowest number of OTUs detected. All Plantae OTUs belonged to the phylum Chlorophyta (green algae).
The OTUs recovered from the various habitat environments were marine, brackish, freshwater, and terrestrial. The freshwater habitat group had the highest percentage of 52.4% (11 OTUs), followed by the terrestrial (19.0%; four OTUs), marine (19.0%; four OTUs), and brackish (9.5%; two OTUs) groups (Figure 2). The freshwater group comprised six Animalia OTUs and four Plantae OTUs (green algae). Marine and brackish groups primarily included Chromista species and genera. Terrestrial species and genera, including Liposcelis sp. (booklice), Aspergillus penicillioides, Trichosporon asahii (fungi), and Neocercomonas sp. (Cercozoa), were also detected.
3.3. Comparison between study sites
We compared the number and composition of OTUs among the three study sites representing different salinity levels. Of the 21 OTUs, 16 OTUs were detected at Site 1, nine OTUs at Site 2, and 14 OTUs at Site 3 (Figure 3), indicating that the number of OTUs at Sites 1 and 3 was 25% higher than that at Site 2.
We compared the number of OTUs based on taxonomic classification (Phylum). Sites 1 and 3 recovered eight and nine of the ten phyla, respectively (Figure 3). At Site 2, where the number of OTUs was the lowest, only five phyla were recovered, and the kingdom Chromista was undetectable. Although Site 3 had fewer OTUs than Site 1, it had the largest number of phyla among the sites.
In addition, we compared the number of OTUs based on the general habitat. Sites 1 and 3 included species and genera inhabiting terrestrial, freshwater, brackish, and marine environments, whereas Site 2 did not include a brackish group (Figure 3). At all sites, the freshwater group had the highest percentage (56.3%, 77.8%, and 64.3% at the three sites, respectively) and the percentage of brackish water was the lowest (6.3%, 0.0%, and 7.1%, respectively).
We also compared the OTU compositions of the three sites. Of the 21 detected OTUs, we identified 11 “common OTUs” (OTUs detected in more than one site; 52.4% of the total) and ten “site-specific OTUs” (OTUs detected in only one site; 47.6% of the total) (Figure 4). Sites 1 and 3 recovered five site-specific OTUs, whereas Site 2 did not contain any site-specific OTUs. Thus, all OTUs detected at Site 2 were common OTUs.
3.4. Relationship between sample size and number of OTUs
A rarefaction analysis was conducted to determine the sample size required to detect sufficient OTUs for biodiversity monitoring. After analysing 30 samples, the expected number of OTUs did not converge, although the sample size reached its maximum value (Figure 5). However, the curve exhibited a gradually decreasing slope, suggesting an approximate trend in the number of OTUs.
4. Discussion
In this study, we detected 21 OTUs in the gut contents of 30 C. fluminea samples collected from the Nakdong River Estuary. These results suggest that species and genera are present at the study sites and support the applicability of C. fluminea as an eDNA sampler for estuarine diversity monitoring. The gut contents of C. fluminea contained taxonomically diverse organisms, including the phyla Arthropoda, Chordata, Ochrophyta, and Chlorophyta, and successfully recovered diverse habitats in the estuaries. Moreover, this is the first study to apply bivalve eDNA to a closed estuary, providing a perspective on eDNA metabarcoding in regulated estuarine ecosystems.
To examine biodiversity through faeces or gut contents, the characteristics of both the habitat and the sample species should be carefully considered. Our sample species, C. fluminea, has an efficient filter-feeding mechanism and has potential as a biological indicator of microplastic or heavy metal pollution and for environmental applications, such as eutrophication alleviation [26,27]. They do not represent strong selectivity for food [28], enabling the detection of diverse species, and are widely distributed in aquatic ecosystems worldwide [29], indicating broad application. Importantly, as C. fluminea can accumulate eDNA in its body without an artificial filtration process, they may serve a complementary role for filtered water samples, particularly in environments where it is difficult to use water samples due to high sediment loads and elevated turbidity, such as estuaries [30].
However, C. fluminea is a typical benthic filter feeder [31], and the possibility of the dominant detection of benthic organisms cannot be ruled out. In addition, as freshwater and seawater are mixed, seawater with a high-density flows forms a vertical salinity gradient in the brackish zone [32,33]. Salinity is an important factor that determines the distribution of aquatic organisms [34,35]; therefore, salinity stratification can influence the biological community, suggesting that species that prefer saltwater may be detected dominantly in eDNA analysis. However, in the present study, the OTUs did not tend to be biased toward benthic or marine organisms. The exact reason for this is unknown, but the biological distribution by depth or salinity does not seem to have a significant impact on eDNA detection using C. fluminea. These results suggest a positive effect of the availability of C. fluminea eDNA in estuarine ecosystems. However, a more detailed investigation of the relationship among water depth, salinity gradient, and eDNA detection is required.
Our study site, the Nakdong River Estuary, represented the ecosystem of a typical closed estuary [21]. This artificial regulatory system may exhibit different singularities from those of natural estuaries (open estuaries) in biodiversity monitoring using eDNA metabarcoding. The major distinction is that the estuary barrage separates freshwater from seawater and blocks the water flow. These features make it more difficult to filter water for eDNA analysis because of the accumulation of more floating organic matter and sediments than in natural environments [30]. However, eDNA transport and dispersal from the origin may also be prevented, thereby enabling more efficient eDNA sampling. Our study has yet to address this issue; therefore, it is impossible to suggest an effect on eDNA metabarcoding in C. fluminea. However, it will be possible to investigate and compare these with natural estuaries in future studies.
In the present study, 18S V9 primers were used to target universal eukaryotes. The 18S rRNA V9 barcode is suited to DNA metabarcoding for diet analysis because of potential to amplify degraded DNA and detect a relatively broad range of eukaryotic organisms [36,37]. However, because the targeting region is relatively short, the 18S rRNA region is considered limited for distinguishing taxonomically close species [38,39]. To compensate for this, we investigated the known characteristics and geographical distribution of each taxon identified using BLASTn, and directly excluded taxa that did not inhabit South Korea. This process minimises the risk of false positives that can be caused by short amplicons, compared to a simple program that selects the taxa with the most similar sequences from the BLASTn results. For efficiency, it is possible to use AI or program codes to make this process more convenient.
We also detected various species and genera inhabiting estuarine habitats, but obtained only 21 OTUs, which was less than expected. This is probably a limitation of eDNA sampling through direct gut content extraction. According to Heo, et al. [40], the gut content of Asian clams (C. fluminea) recovered relatively fewer OTUs than the pseudo-faeces. Jeunen, et al. [18] reported that eDNA could not be obtained from the gills of blue mussels (Mytilus galloprovincialis). Since there are few cases of eDNA extraction from bivalves and no established protocols exist, various sample processing methods are needed to examine their potential.
DNA metabarcoding using faeces or gut contents usually poses the risk of excessive detection of self-DNA (that is, DNA of the sample species itself) or the DNA of the species interacting with the sample species (for example, parasites and symbionts) [41,42,43]. It can be excessively amplified during DNA processing and detected in much larger amounts than pre-DNA, leading to non-informative results [42,44]. Our study also identified ten OTUs as C. fluminea and the OTU of Mytilicola orientalis, which is known to be parasitic in the intestines of bivalves. Therefore, to avoid these biases, it is necessary to consider alternatives, such as blocking oligonucleotides that prevent self-DNA amplification, in further studies.
5. Conclusions
In this study, we investigated the potential use of C. fluminea as an eDNA sampler to assess the biodiversity of the Nakdong River Estuary. We extracted eDNA from the gut contents of C. fluminea and used the 18S V9 primer to examine overall biodiversity at the study sites. The metabarcoding results recovered 21 taxa belonging to different kingdoms, including Animalia, Chromista, Fungi, and Plantae, and represented a wide range of environments, including marine, brackish, freshwater, and terrestrial environments. These findings indicate the potential use of C. fluminea in eDNA metabarcoding for biodiversity investigations. This is the first case study to apply bivalve eDNA metabarcoding in a closed estuarine system, supporting the potential application of bivalves as eDNA samplers in diverse aquatic ecosystems.
Author Contributions
Conceptualization, H.J.; methodology, H.J. and K.K.; investigation, K.K., Y.L., D.H., and H.J; writing—original draft preparation, K.K., K.-S.J., and H.J.; writing—review and editing, G.-J.J.; visualization, K.K.; supervision, H.J.; project administration, H.J.; funding acquisition, H.J. All authors have read and agreed to the published version of the manuscript.
Funding
This research was funded by the National Research Foundation of Korea (grant number NRF- 2020R1C1C1009066).
Institutional Review Board Statement
Ethical review and approval were waived due to this study is dealing with lower invertebrates, Asian clam (Corbicula fluminea), that is not targeted for involving humans or animals. Please see the attached the letter.
Data Availability Statement
The datasets generated and/or analysed during the current study are available in the NCBI repository under accession number SAMN35796656.
Acknowledgments
This research was funded by the National Research Foundation of Korea (grant number NRF- 2020R1C1C1009066).
Conflicts of Interest
The authors declare no conflict of interest.
Appendix A
Figure A1.
Illustration of the C. flumina sampling method: (A) Schematic diagram of C. fluminea sampling using fishing dredge; (B) Schematic diagram of fishing dredge used for C. fluminea sampling.
Figure A1.
Illustration of the C. flumina sampling method: (A) Schematic diagram of C. fluminea sampling using fishing dredge; (B) Schematic diagram of fishing dredge used for C. fluminea sampling.
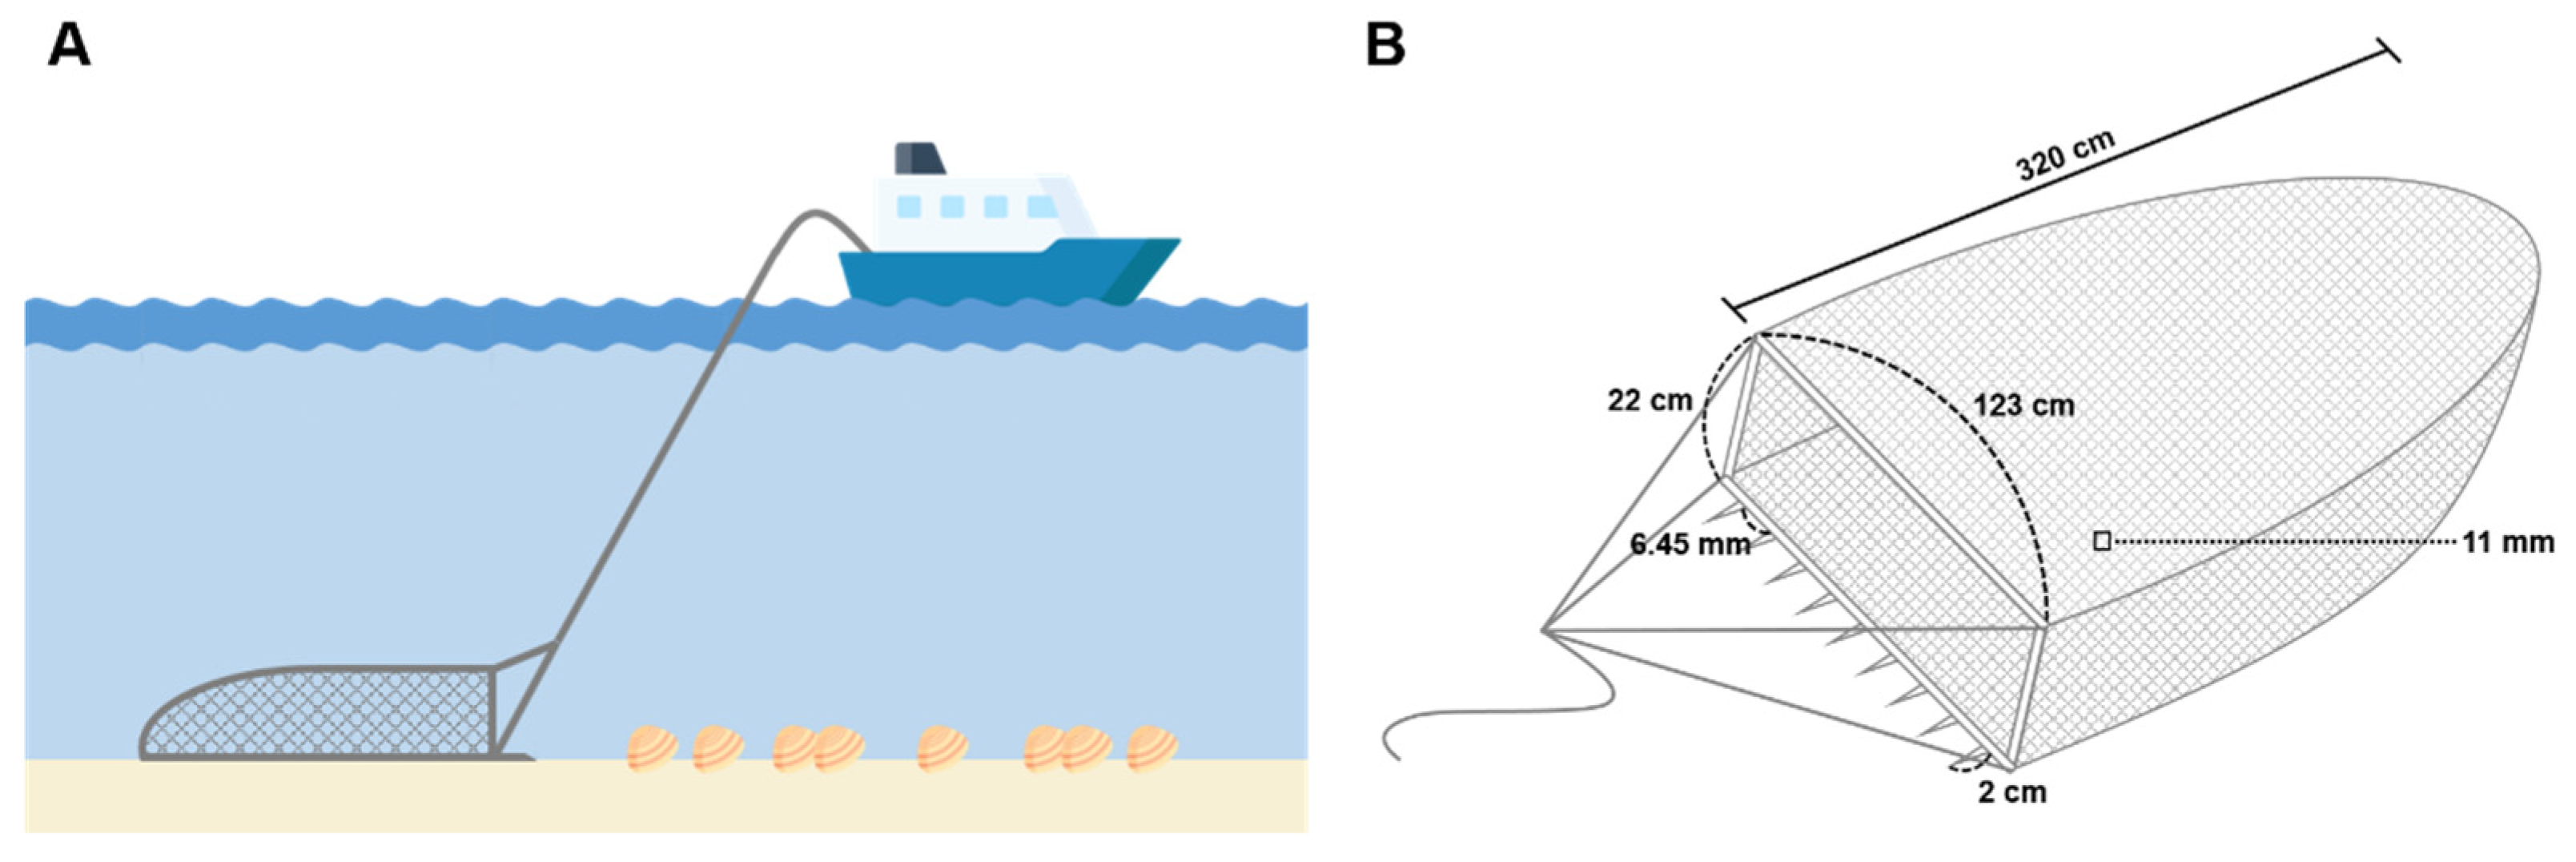

Table A1.
Table of references for habit environment investigations.
| Identified taxa | General habitat environments |
References |
|---|---|---|
| Hydrachna sp. | Freshwater | [45,46] |
| Cyclops sp. | Freshwater | WoRMS |
| Microcyclops sp. | Freshwater | WoRMS |
| Mytilicola orientalis | Marine | [47] |
| Liposcelis sp. | Terrestrial | [48] |
| Hemibarbus labeo | Freshwater | WoRMS |
| Oncorhynchus mykiss | Freshwater | [49] |
| Alloglossidium sp. | Freshwater | WoRMS |
| Navicula arenaria | Brackish | AlgaeBase |
| Skeletonema sp. | Marine | AlgaeBase |
| Neocercomonas sp. | Terrestrial | [50] |
| Katablepharis japonica | Marine | AlgaeBase |
| Azadinium sp. | Marine | [51,52,53] |
| Nannochloropsis oculata | Brackish | AlgaeBase |
| Aspergillus penicillioides | Terrestrial | [54] |
| Trichosporon asahii | Terrestrial | [55] |
| Mychonastes homosphaera | Freshwater | AlgaeBase |
| Mychonastes rotundus | Freshwater | AlgaeBase |
| Desmodesmus communis | Freshwater | AlgaeBase |
| Messastrum gracile | Freshwater | AlgaeBase |
| Nannochloris sp. | Freshwater | AlgaeBase |
References
- Levin, L.A.; Boesch, D.F.; Covich, A.; Dahm, C.; Erséus, C.; Ewel, K.C.; Kneib, R.T.; Moldenke, A.; Palmer, M.A.; Snelgrove, P.; et al. The Function of Marine Critical Transition Zones and the Importance of Sediment Biodiversity. Ecosystems 2001, 4, 430–451. [Google Scholar] [CrossRef]
- John, W. Day, J.; Crump, B.C.; Kemp, W.M.; Yáñez-Arancibia, A. Estuarine Ecology, 2nd, John Wiley & Sons, 2012. [Google Scholar]
- McLusky, D.S.; Elliott, M. The Estuarine Ecosystem: Ecology, Threats and Management; OUP Oxford: 2004.
- Lotze, H.K.; Lenihan, H.S.; Bourque, B.J.; Bradbury, R.H.; Cooke, R.G.; Kay, M.C.; Kidwell, S.M.; Kirby, M.X.; Peterson, C.H.; Jackson, J.B.C. Depletion, Degradation, and Recovery Potential of Estuaries and Coastal Seas. Science 2006, 312, 1806–1809. [Google Scholar] [CrossRef]
- Kennish, M.J. Environmental threats and environmental future of estuaries. Environmental Conservation 2002, 29, 78–107. [Google Scholar] [CrossRef]
- Cloern, J.E.; Jassby, A.D. Drivers of change in estuarine-coastal ecosystems: Discoveries from four decades of study in San Francisco Bay. Reviews of Geophysics 2012, 50. [Google Scholar] [CrossRef]
- Hobbs, J.; Bright, D. Environmental DNA: implementation for resource development projects in BC and beyond. 2016.
- Zimmermann, J.; Glöckner, G.; Jahn, R.; Enke, N.; Gemeinholzer, B. Metabarcoding vs. morphological identification to assess diatom diversity in environmental studies. Molecular Ecology Resources 2015, 15, 526–542. [Google Scholar] [CrossRef] [PubMed]
- Ko, H.-L.; Wang, Y.-T.; Chiu, T.-S.; Lee, M.-A.; Leu, M.-Y.; Chang, K.-Z.; Chen, W.-Y.; Shao, K.-T. Evaluating the Accuracy of Morphological Identification of Larval Fishes by Applying DNA Barcoding. PLOS ONE 2013, 8, e53451. [Google Scholar] [CrossRef]
- Polanco F., A.; Mutis Martinezguerra, M.; Marques, V.; Villa-Navarro, F.; Borrero Pérez, G.H.; Cheutin, M.-C.; Dejean, T.; Hocdé, R.; Juhel, J.-B.; Maire, E.; et al. Detecting aquatic and terrestrial biodiversity in a tropical estuary using environmental DNA. Biotropica 2021, 53, 1606–1619. [Google Scholar] [CrossRef]
- Ruppert, K.M.; Kline, R.J.; Rahman, M.S. Past, present, and future perspectives of environmental DNA (eDNA) metabarcoding: A systematic review in methods, monitoring, and applications of global eDNA. Global Ecology and Conservation 2019, 17, e00547. [Google Scholar] [CrossRef]
- Taberlet, P.; Bonin, A.; Zinger, L.; Coissac, E. Environmental DNA: For Biodiversity Research and Monitoring; Oxford University Press: 2018.
- Beng, K.C.; Corlett, R.T. Applications of environmental DNA (eDNA) in ecology and conservation: opportunities, challenges and prospects. Biodiversity and Conservation 2020, 29, 2089–2121. [Google Scholar] [CrossRef]
- Rivera, S.F.; Rimet, F.; Vasselon, V.; Vautier, M.; Domaizon, I.; Bouchez, A. Fish eDNA metabarcoding from aquatic biofilm samples: Methodological aspects. Molecular Ecology Resources 2022, 22, 1440–1453. [Google Scholar] [CrossRef]
- Weber, S.; Junk, I.; Brink, L.; Wörner, M.; Künzel, S.; Veith, M.; Teubner, D.; Klein, R.; Paulus, M.; Krehenwinkel, H. Molecular diet analysis in mussels and other metazoan filter feeders and an assessment of their utility as natural eDNA samplers. Molecular Ecology Resources 2023, 23, 471–485. [Google Scholar] [CrossRef]
- Nørgaard, L.; Olesen, C.R.; Trøjelsgaard, K.; Pertoldi, C.; Nielsen, J.L.; Taberlet, P.; Ruiz-González, A.; De Barba, M.; Iacolina, L. eDNA metabarcoding for biodiversity assessment, generalist predators as sampling assistants. Scientific Reports 2021, 11, 6820. [Google Scholar] [CrossRef] [PubMed]
- Siegenthaler, A.; Wangensteen, O.S.; Soto, A.Z.; Benvenuto, C.; Corrigan, L.; Mariani, S. Metabarcoding of shrimp stomach content: Harnessing a natural sampler for fish biodiversity monitoring. Molecular Ecology Resources 2019, 19, 206–220. [Google Scholar] [CrossRef] [PubMed]
- Jeunen, G.-J.; Cane, J.S.; Ferreira, S.; Strano, F.; von Ammon, U.; Cross, H.; Day, R.; Hesseltine, S.; Ellis, K.; Urban, L.; et al. Assessing the utility of marine filter feeders for environmental DNA (eDNA) biodiversity monitoring. bioRxiv, 2012; 2021.2012.2021.473722. [Google Scholar] [CrossRef]
- Mariani, S.; Baillie, C.; Colosimo, G.; Riesgo, A. Sponges as natural environmental DNA samplers. Current Biology 2019, 29, R401–R402. [Google Scholar] [CrossRef] [PubMed]
- Gutiérrez, J.L.; Jones, C.G.; Strayer, D.L.; Iribarne, O.O. Mollusks as ecosystem engineers: the role of shell production in aquatic habitats. Oikos 2003, 101, 79–90. [Google Scholar] [CrossRef]
- Yoon, J.-D.; Jang, M.-H.; Jo, H.-B.; Jeong, K.-S.; Kim, G.-Y.; Joo, G.-J. Changes of fish assemblages after construction of an estuary barrage in the lower Nakdong River, South Korea. Limnology 2016, 17, 183–197. [Google Scholar] [CrossRef]
- Lee, C.-W.; Jang, J.-D.; Jeong, K.-S.; Kim, D.-K.; Joo, G.-J. Patterning habitat preference of avifaunal assemblage on the Nakdong River estuary (South Korea) using self-organizing map. Ecological Informatics 2010, 5, 89–96. [Google Scholar] [CrossRef]
- Rice, E.W.; Baird, R.B.; Eaton, A.D.; Clesceri, L.S. Standard Methods for the Examination of Water and Wastewater; American public health association Washington, DC: 2012; Volume 10.
- Edgar, R.C. Search and clustering orders of magnitude faster than BLAST. Bioinformatics 2010, 26, 2460–2461. [Google Scholar] [CrossRef]
- Altschul, S.F.; Gish, W.; Miller, W.; Myers, E.W.; Lipman, D.J. Basic local alignment search tool. Journal of Molecular Biology 1990, 215, 403–410. [Google Scholar] [CrossRef]
- Su, L.; Cai, H.; Kolandhasamy, P.; Wu, C.; Rochman, C.M.; Shi, H. Using the Asian clam as an indicator of microplastic pollution in freshwater ecosystems. Environmental Pollution 2018, 234, 347–355. [Google Scholar] [CrossRef]
- Li, Z.; He, X.; Feng, C. A review of freshwater benthic clams (Corbicula fluminea): Accumulation capacity, underlying physiological mechanisms and environmental applications. Science of The Total Environment 2023, 857, 159431. [Google Scholar] [CrossRef] [PubMed]
- Way, C.M.; Hornbach, D.J.; Miller-Way, C.A.; Payne, B.S.; Miller, A.C. Dynamics of filter feeding in Corbicula fluminea (Bivalvia: Corbiculidae). Canadian Journal of Zoology 1990, 68, 115–120. [Google Scholar] [CrossRef]
- Crespo, D.; Dolbeth, M.; Leston, S.; Sousa, R.; Pardal, M.Â. Distribution of Corbicula fluminea (Müller, 1774) in the invaded range: a geographic approach with notes on species traits variability. Biological Invasions 2015, 17, 2087–2101. [Google Scholar] [CrossRef]
- Nagarajan, R.P.; Bedwell, M.; Holmes, A.E.; Sanches, T.; Acuña, S.; Baerwald, M.; Barnes, M.A.; Blankenship, S.; Connon, R.E.; Deiner, K.; et al. Environmental DNA Methods for Ecological Monitoring and Biodiversity Assessment in Estuaries. Estuaries and Coasts 2022, 45, 2254–2273. [Google Scholar] [CrossRef]
- Lauritsen, D.D. Filter-Feeding in Corbicula fluminea and Its Effect on Seston Removal. Journal of the North American Benthological Society 1986, 5, 165–172. [Google Scholar] [CrossRef]
- Telesh, I.V.; Khlebovich, V.V. Principal processes within the estuarine salinity gradient: A review. Marine Pollution Bulletin 2010, 61, 149–155. [Google Scholar] [CrossRef] [PubMed]
- Cloern, J.E.; Jassby, A.D.; Schraga, T.S.; Nejad, E.; Martin, C. Ecosystem variability along the estuarine salinity gradient: Examples from long-term study of San Francisco Bay. Limnology and Oceanography 2017, 62, S272–S291. [Google Scholar] [CrossRef]
- Franco, T.P.; Neves, L.M.; Araújo, F.G. Better with more or less salt? The association of fish assemblages in coastal lagoons with different salinity ranges. Hydrobiologia 2019, 828, 83–100. [Google Scholar] [CrossRef]
- Matela, M.; Obolewski, K. Structural diagnosis of benthic invertebrate communities in relation to salinity gradient in Baltic coastal lake ecosystems using biological trait analysis. Scientific Reports 2022, 12, 12750. [Google Scholar] [CrossRef]
- Amaral-Zettler, L.A.; McCliment, E.A.; Ducklow, H.W.; Huse, S.M. A Method for Studying Protistan Diversity Using Massively Parallel Sequencing of V9 Hypervariable Regions of Small-Subunit Ribosomal RNA Genes. PLOS ONE 2009, 4, e6372. [Google Scholar] [CrossRef]
- Albaina, A.; Aguirre, M.; Abad, D.; Santos, M.; Estonba, A. 18S rRNA V9 metabarcoding for diet characterization: a critical evaluation with two sympatric zooplanktivorous fish species. Ecol Evol 2016, 6, 1809–1824. [Google Scholar] [CrossRef] [PubMed]
- Hugerth, L.W.; Muller, E.E.L.; Hu, Y.O.O.; Lebrun, L.A.M.; Roume, H.; Lundin, D.; Wilmes, P.; Andersson, A.F. Systematic Design of 18S rRNA Gene Primers for Determining Eukaryotic Diversity in Microbial Consortia. PLOS ONE 2014, 9, e95567. [Google Scholar] [CrossRef]
- Questel, J.M.; Hopcroft, R.R.; DeHart, H.M.; Smoot, C.A.; Kosobokova, K.N.; Bucklin, A. Metabarcoding of zooplankton diversity within the Chukchi Borderland, Arctic Ocean: improved resolution from multi-gene markers and region-specific DNA databases. Marine Biodiversity 2021, 51, 4. [Google Scholar] [CrossRef]
- Heo, Y.-J.; Jo, H.; Kim, J.Y.; Kim, G.-Y.; Joo, G.-J.; Kim, H.-W. Application of DNA Metabarcoding for Identifying the Diet of Asian Clam (Corbicula fluminea, Müller, 1774). Sustainability 2023, 15, 441. [Google Scholar] [CrossRef]
- Vestheim, H.; Jarman, S.N. Blocking primers to enhance PCR amplification of rare sequences in mixed samples – a case study on prey DNA in Antarctic krill stomachs. Frontiers in Zoology 2008, 5, 12. [Google Scholar] [CrossRef]
- Leray, M.; Agudelo, N.; Mills, S.C.; Meyer, C.P. Effectiveness of Annealing Blocking Primers versus Restriction Enzymes for Characterization of Generalist Diets: Unexpected Prey Revealed in the Gut Contents of Two Coral Reef Fish Species. PLOS ONE 2013, 8, e58076. [Google Scholar] [CrossRef]
- Blankenship, L.E.; Yayanos, A.A. Universal primers and PCR of gut contents to study marine invertebrate diets. Molecular Ecology 2005, 14, 891–899. [Google Scholar] [CrossRef] [PubMed]
- Piñol, J.; Mir, G.; Gomez-Polo, P.; Agustí, N. Universal and blocking primer mismatches limit the use of high-throughput DNA sequencing for the quantitative metabarcoding of arthropods. Molecular Ecology Resources 2015, 15, 819–830. [Google Scholar] [CrossRef]
- Smit, H. Australian water mites of the genus Hydrachna Müller, with the description of five new species (Acari: Hydrachnidia: Hydrachnidae). Zootaxa 2014, 3827, 170–186. [Google Scholar] [CrossRef]
- Di Sabatino, A.; Gerecke, R.; Martin, P. The biology and ecology of lotic water mites (Hydrachnidia). Freshwater Biology 2000, 44, 47–62. [Google Scholar] [CrossRef]
- Borkens, Y.; Koppe, P. Mytilicola orientalis. Aquaculture International 2022, 30, 2741–2749. [Google Scholar] [CrossRef]
- Mockford, E.L.; Krushelnycky, P.D. New species and records of Liposcelis Motschulsky (Psocoptera: Liposcelididae) from Hawaii with first description of the male of Liposcelis bostrychophila Badonnel. Zootaxa 2008, 1766, 53–68. [Google Scholar] [CrossRef]
- Jang, M.-H.; Lucas, M.C.; Joo, G.-J. The fish fauna of mountain streams in South Korean national parks and its significance to conservation of regional freshwater fish biodiversity. Biological Conservation 2003, 114, 115–126. [Google Scholar] [CrossRef]
- Flues, S.; Blokker, M.; Dumack, K.; Bonkowski, M. Diversity of Cercomonad Species in the Phyllosphere and Rhizosphere of Different Plant Species with a Description of Neocercomonas epiphylla (Cercozoa, Rhizaria) a Leaf-Associated Protist. Journal of Eukaryotic Microbiology 2018, 65, 587–599. [Google Scholar] [CrossRef] [PubMed]
- Tillmann, U.; Soehner, S.; Nézan, E.; Krock, B. First record of the genus Azadinium (Dinophyceae) from the Shetland Islands, including the description of Azadinium polongum sp. nov. Harmful Algae 2012, 20, 142–155. [Google Scholar] [CrossRef]
- Krock, B.; Tillmann, U.; Potvin, É.; Jeong, H.J.; Drebing, W.; Kilcoyne, J.; Al-Jorani, A.; Twiner, M.J.; Göthel, Q.; Köck, M. Structure Elucidation and in Vitro Toxicity of New Azaspiracids Isolated from the Marine Dinoflagellate Azadinium poporum. Marine Drugs 2015, 13, 6687–6702. [Google Scholar] [CrossRef]
- Luo, Z.; Krock, B.; Mertens, K.N.; Nézan, E.; Chomérat, N.; Bilien, G.; Tillmann, U.; Gu, H. Adding new pieces to the Azadinium (Dinophyceae) diversity and biogeography puzzle: Non-toxigenic Azadinium zhuanum sp. nov. from China, toxigenic A. poporum from the Mediterranean, and a non-toxigenic A. dalianense from the French Atlantic. Harmful Algae 2017, 66, 65–78. [Google Scholar] [CrossRef]
- Micheluz, A.; Manente, S.; Tigini, V.; Prigione, V.; Pinzari, F.; Ravagnan, G.; Varese, G.C. The extreme environment of a library: Xerophilic fungi inhabiting indoor niches. International Biodeterioration & Biodegradation 2015, 99, 1–7. [Google Scholar] [CrossRef]
- Sugita, T.; Nishikawa, A.; Ichikawa, T.; Ikeda, R.; Shinoda, T. Isolation of Trichosporon asahii from environmental materials. Medical Mycology 2000, 38, 27–30. [Google Scholar] [CrossRef]
Disclaimer/Publisher’s Note: The statements, opinions, and data contained in all publications are solely those of the individual author(s) and contributor(s) and not of MDPI and/or the editor(s). MDPI and/or the editor(s) disclaim responsibility for any injury to people or property resulting from any ideas, methods, instructions, or products referred to in the content. |
Figure 1.
Map of the study sites in the Nakdong River Estuary.
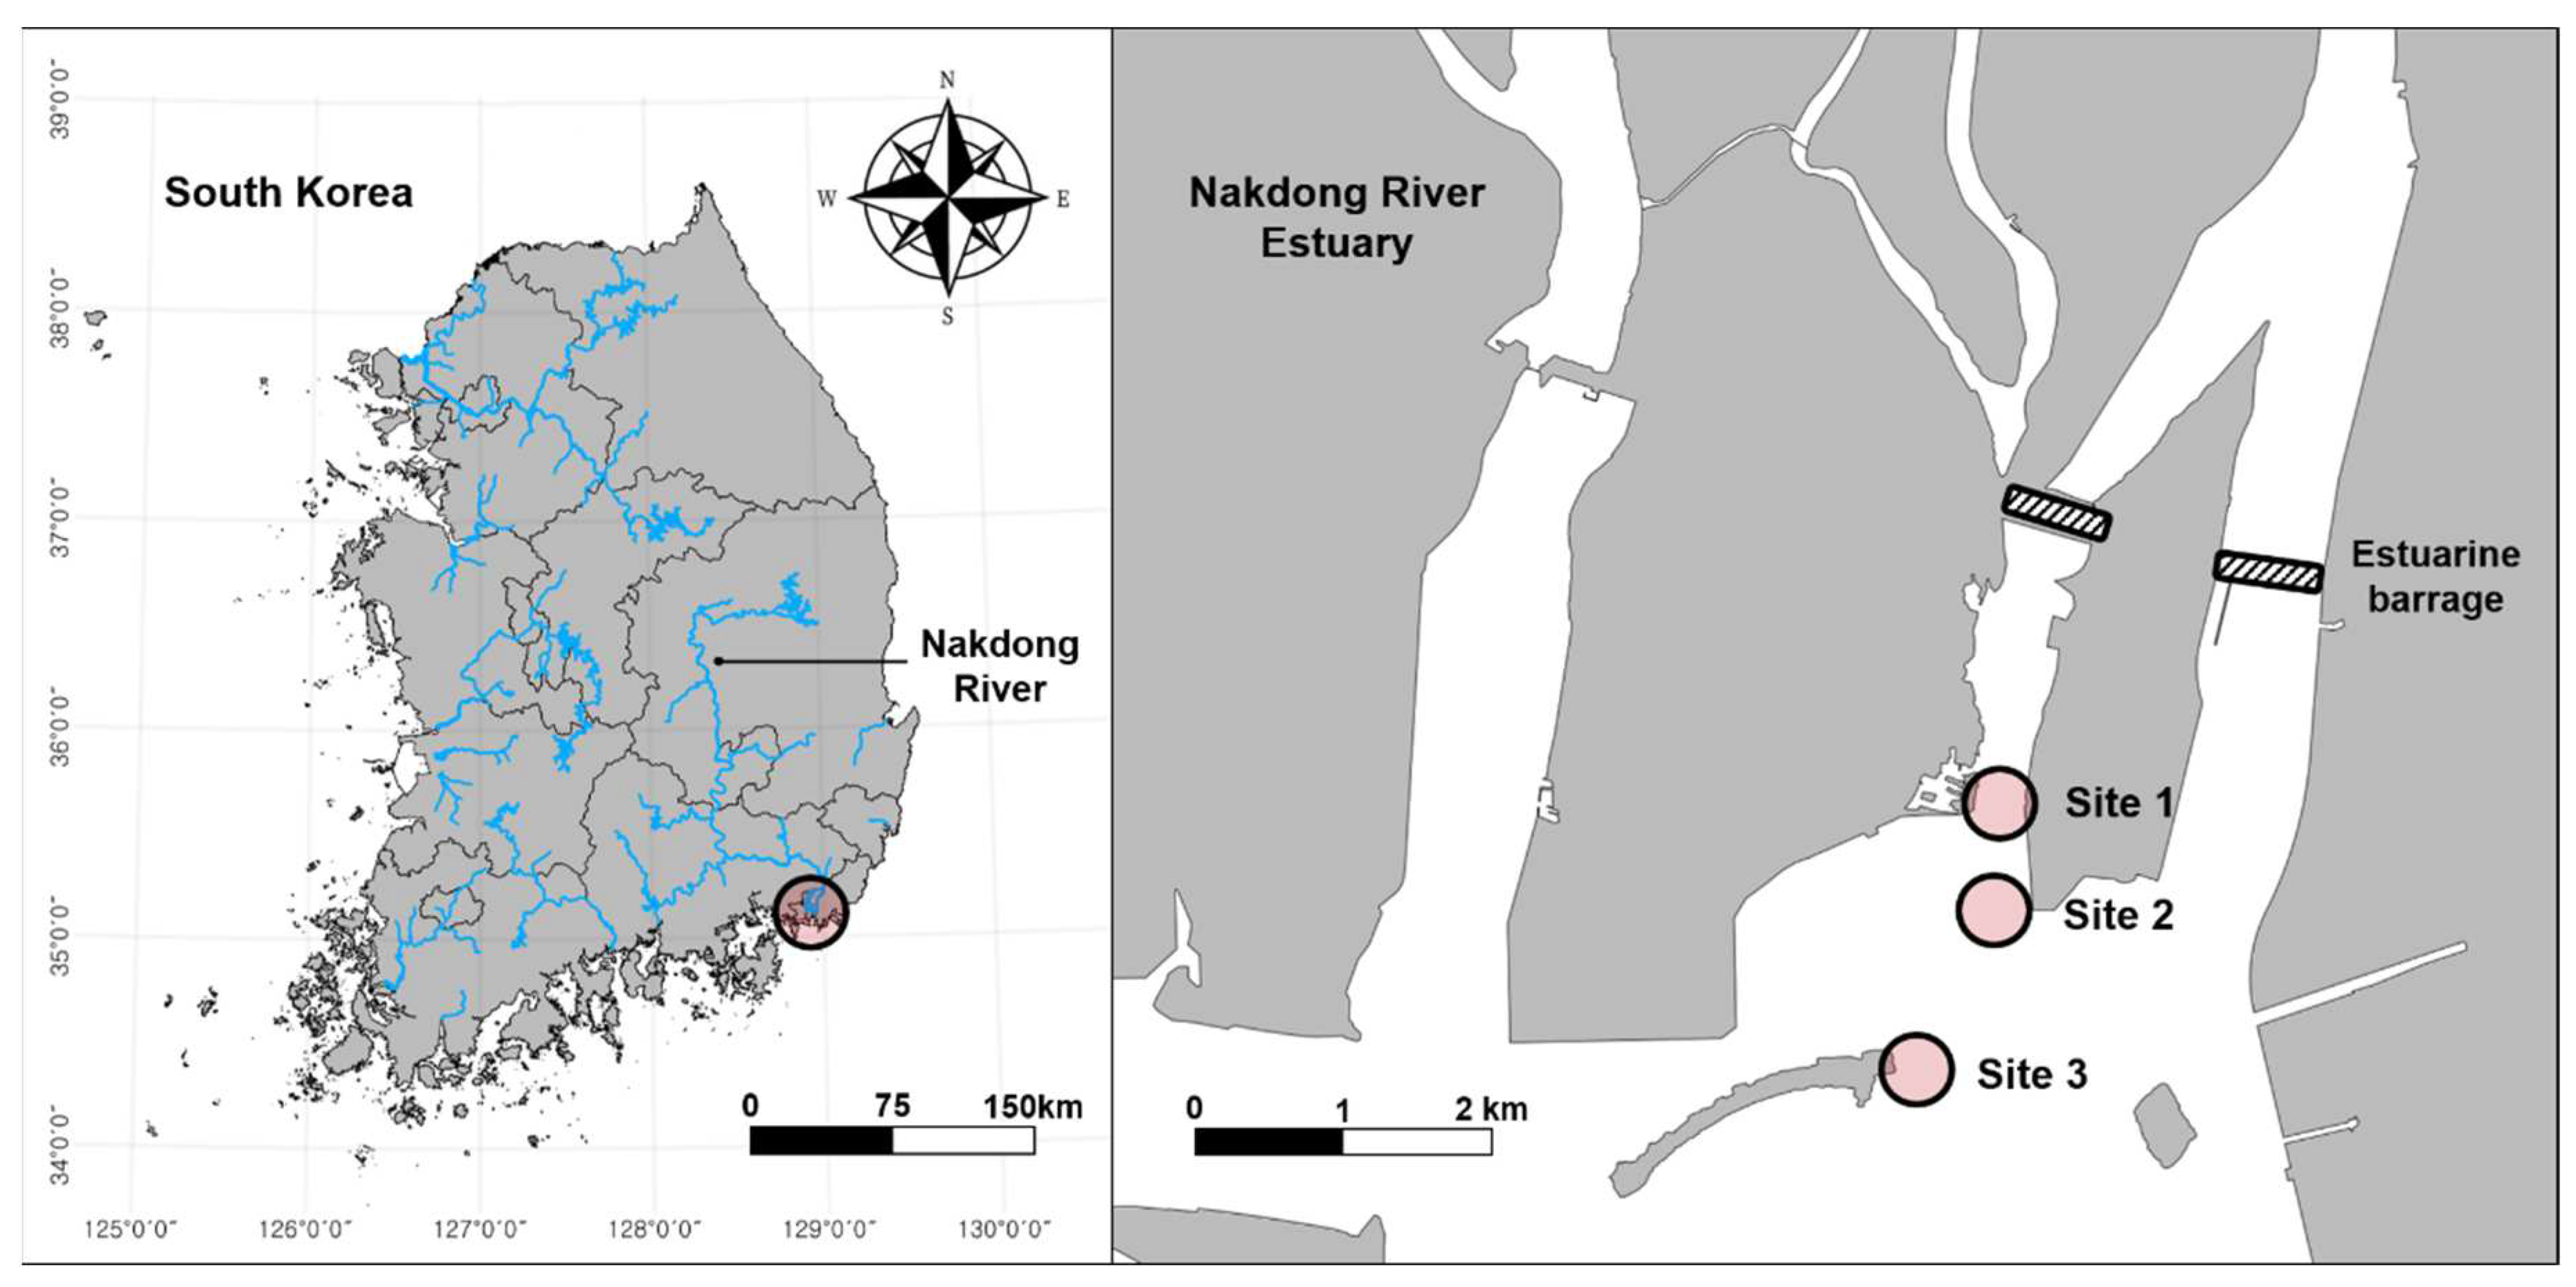
Figure 2.
The proportion of OTUs based on phylum and habitat environments. (A) Pie chart illustrating the proportion of OTUs for each phylum. The blue sector represents Animalia, the yellow sector represents Chromista, the black sector represents Fungi, and the green sector represents Plantae. (B) Pie chart illustrating the proportion of OTUs for each habitat environment.
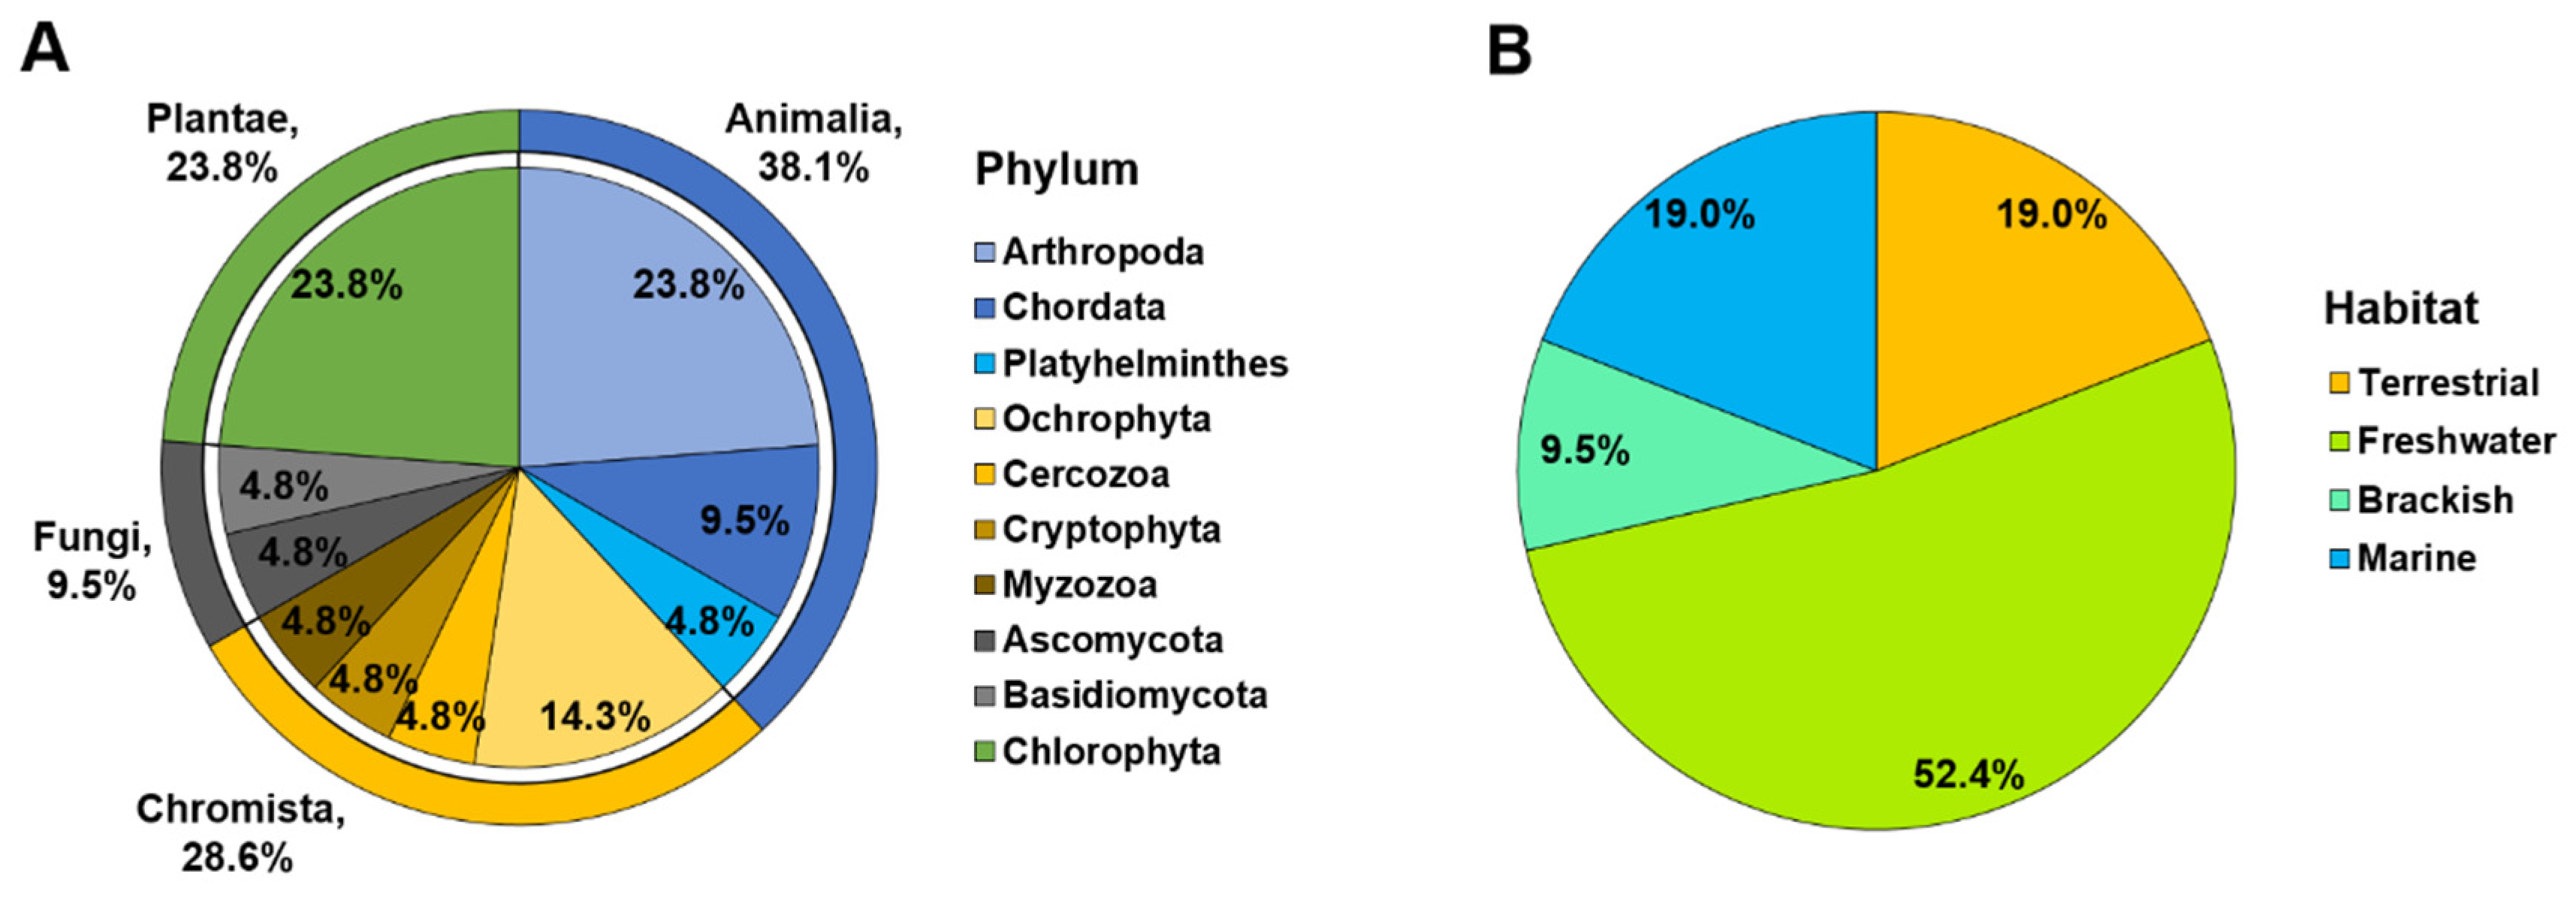
Figure 3.
The proportion of OTUs in each the study sites based on phylum and habitat environments. (A) Bar graph illustrating the proportion of OTUs in the study sites for each phylum. The blue sector represents Animalia, the yellow sector represents Chromista, the black sector represents Fungi, and the green sector represents Plantae. (B) Bar graph illustrating the proportion of OTUs in the study sites for each habitat environment.
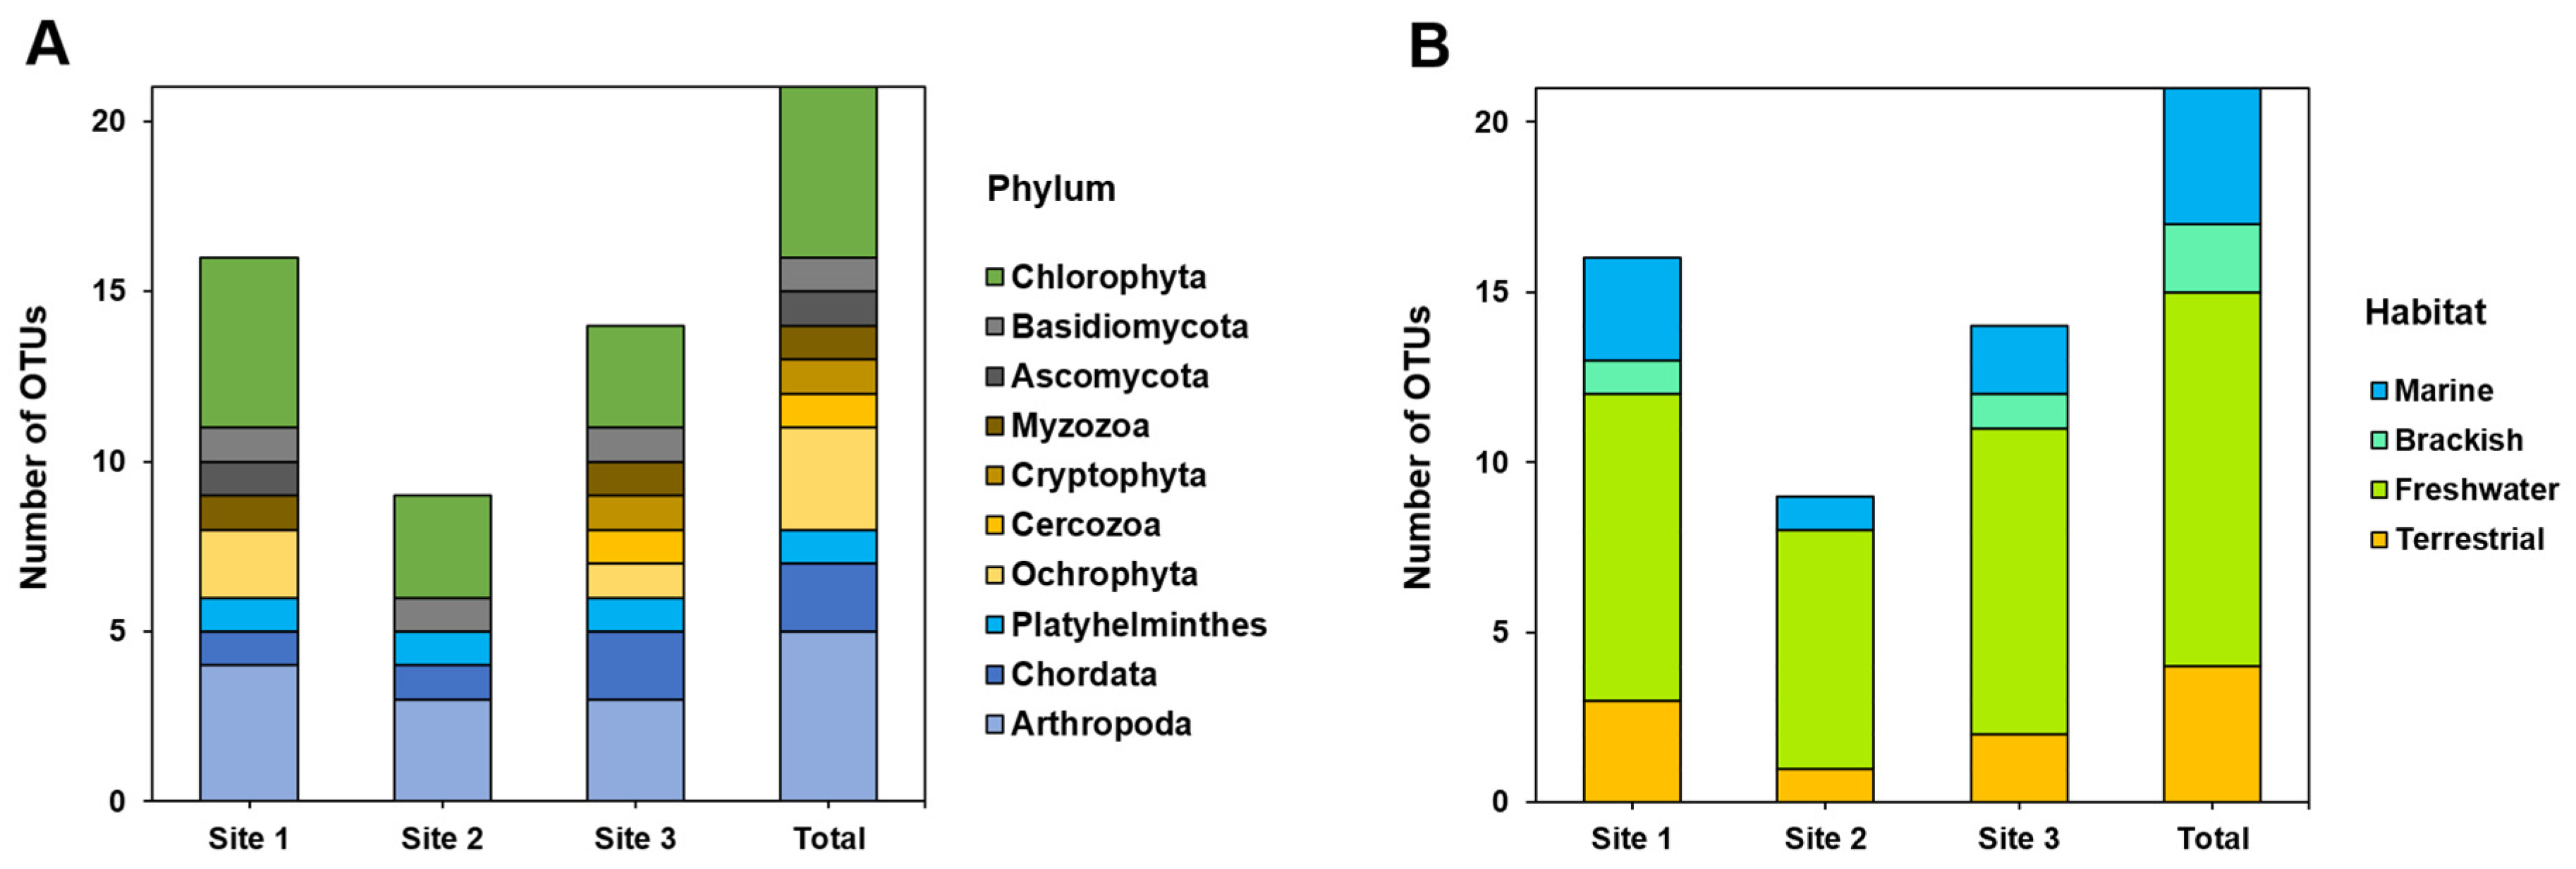
Figure 4.
Vann diagram illustrating the taxa detected at each study site. The blue figures represent Animalia, the yellow figures represent Chromista, the black figures represent Fungi, and the green figures represent Plantae.
Figure 4.
Vann diagram illustrating the taxa detected at each study site. The blue figures represent Animalia, the yellow figures represent Chromista, the black figures represent Fungi, and the green figures represent Plantae.
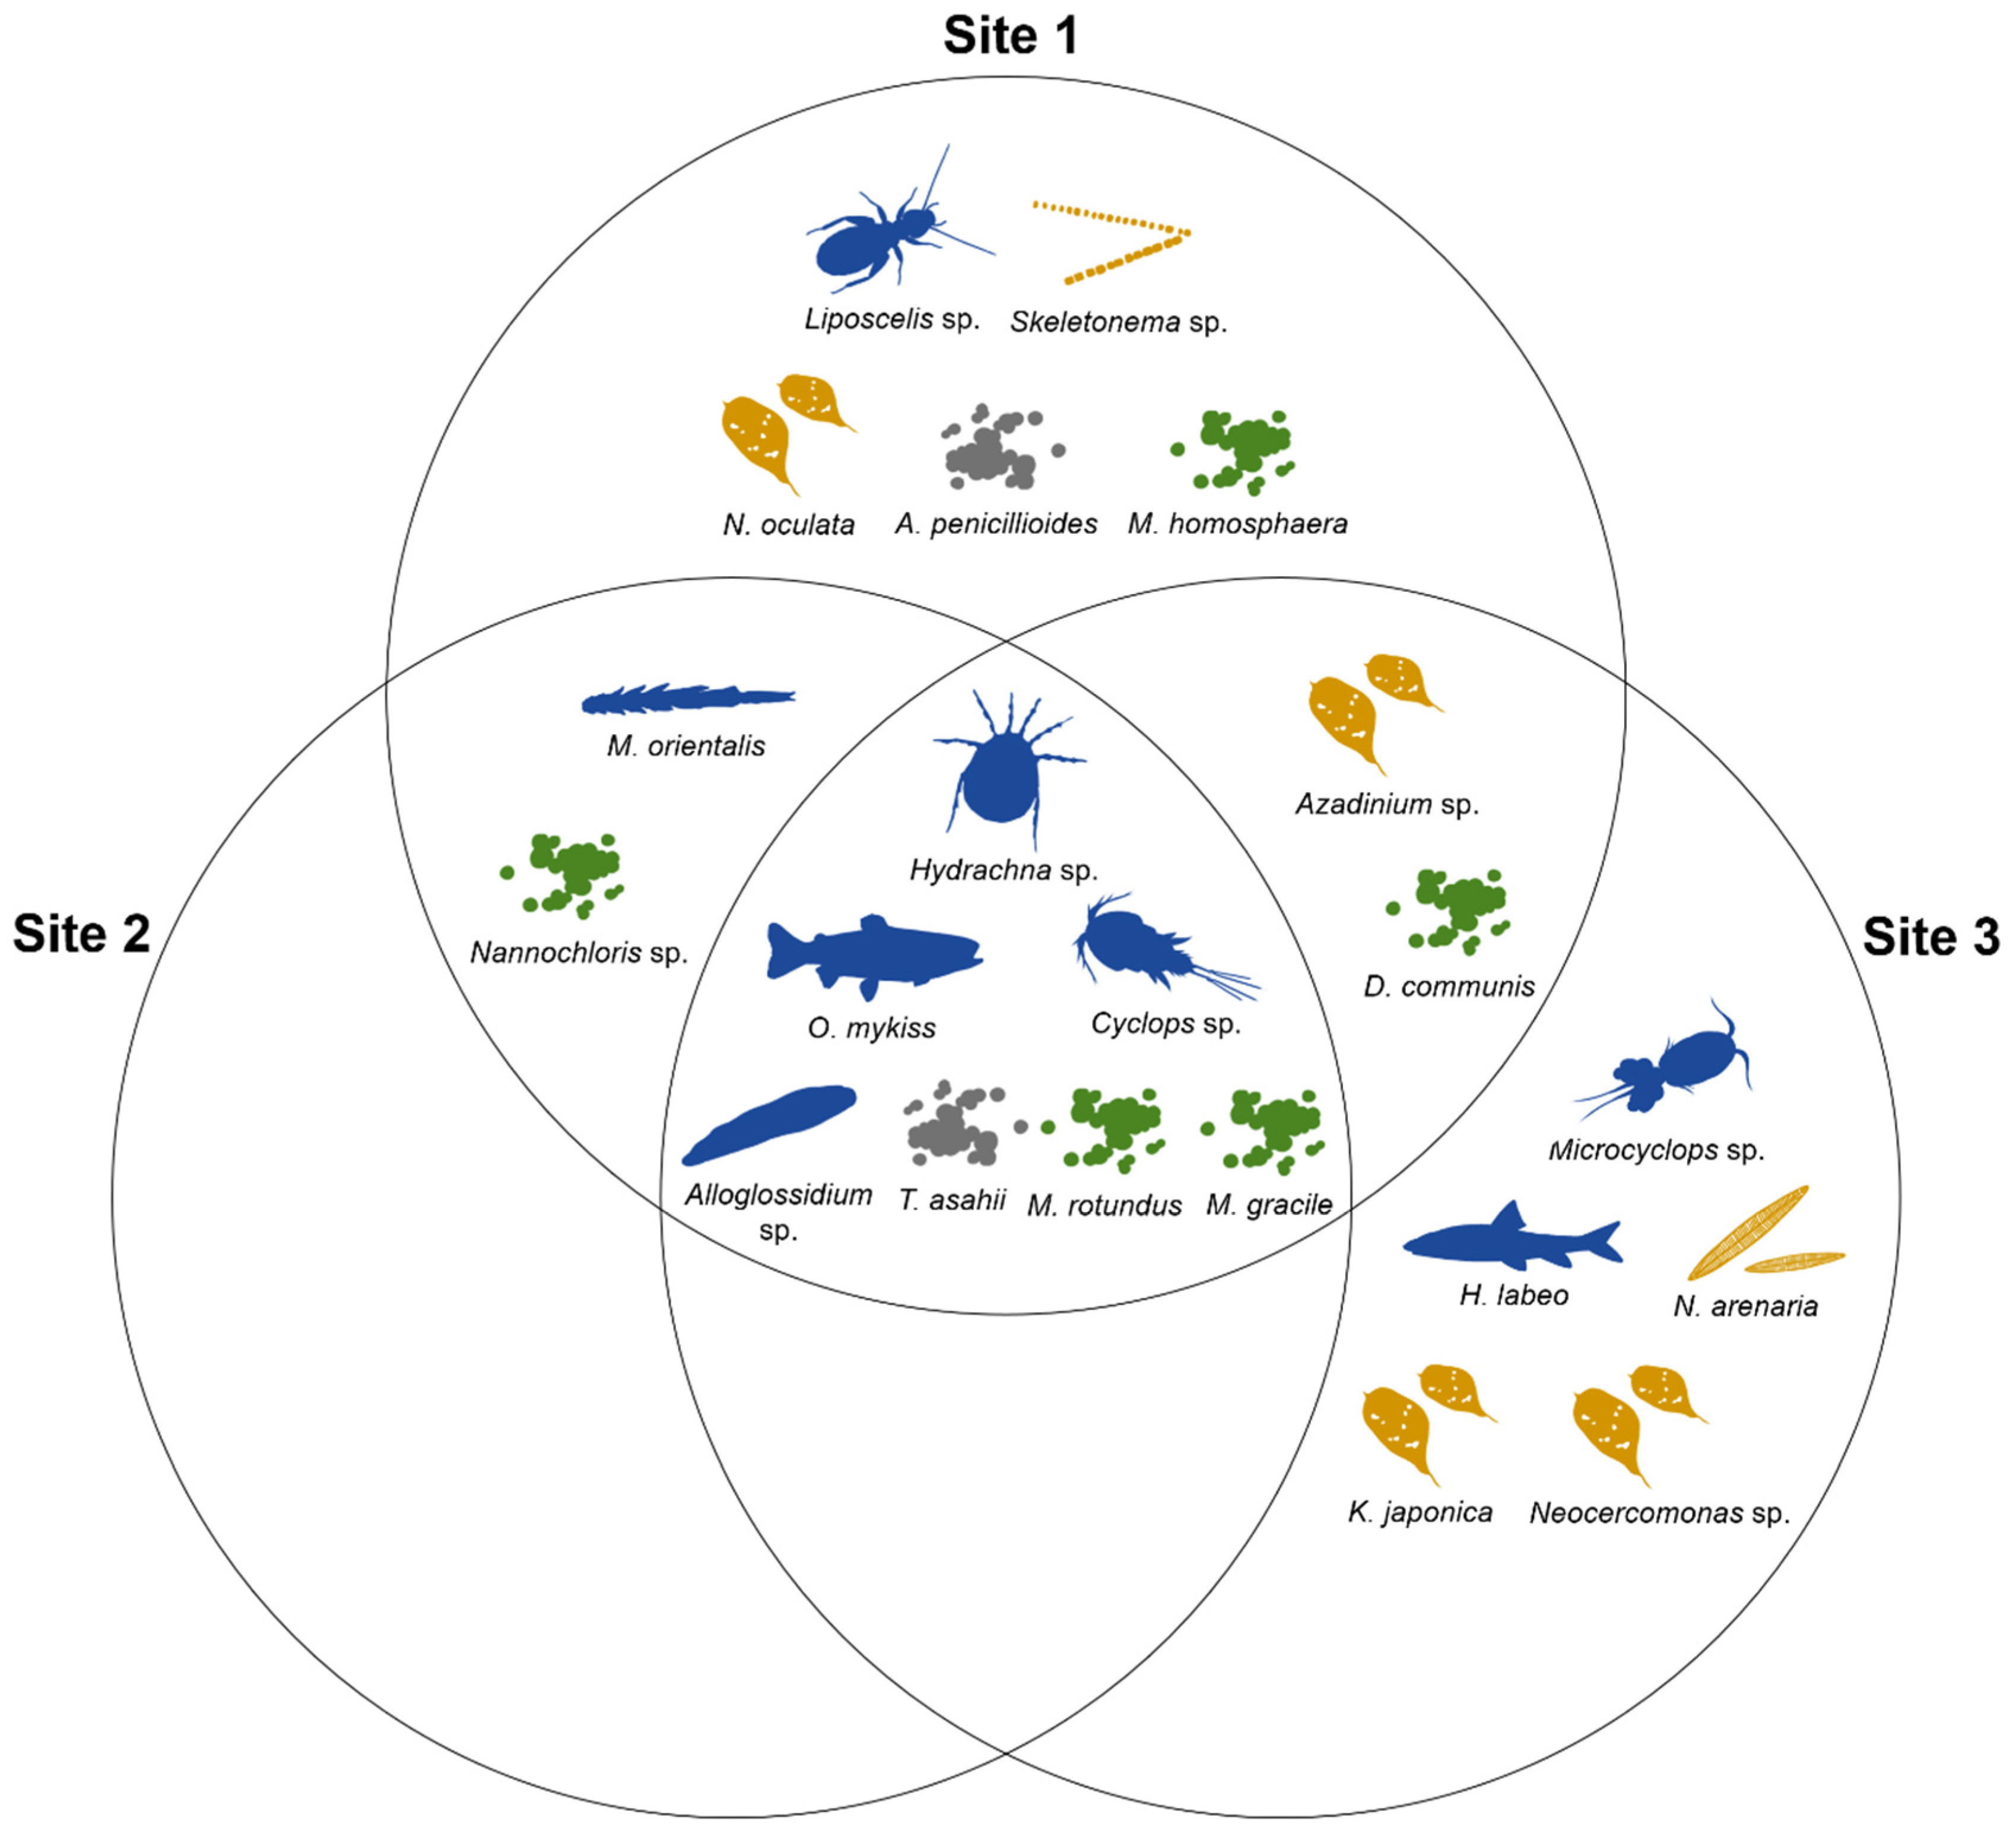
Figure 5.
Rarefaction curve based on number of OTUs and sample size.
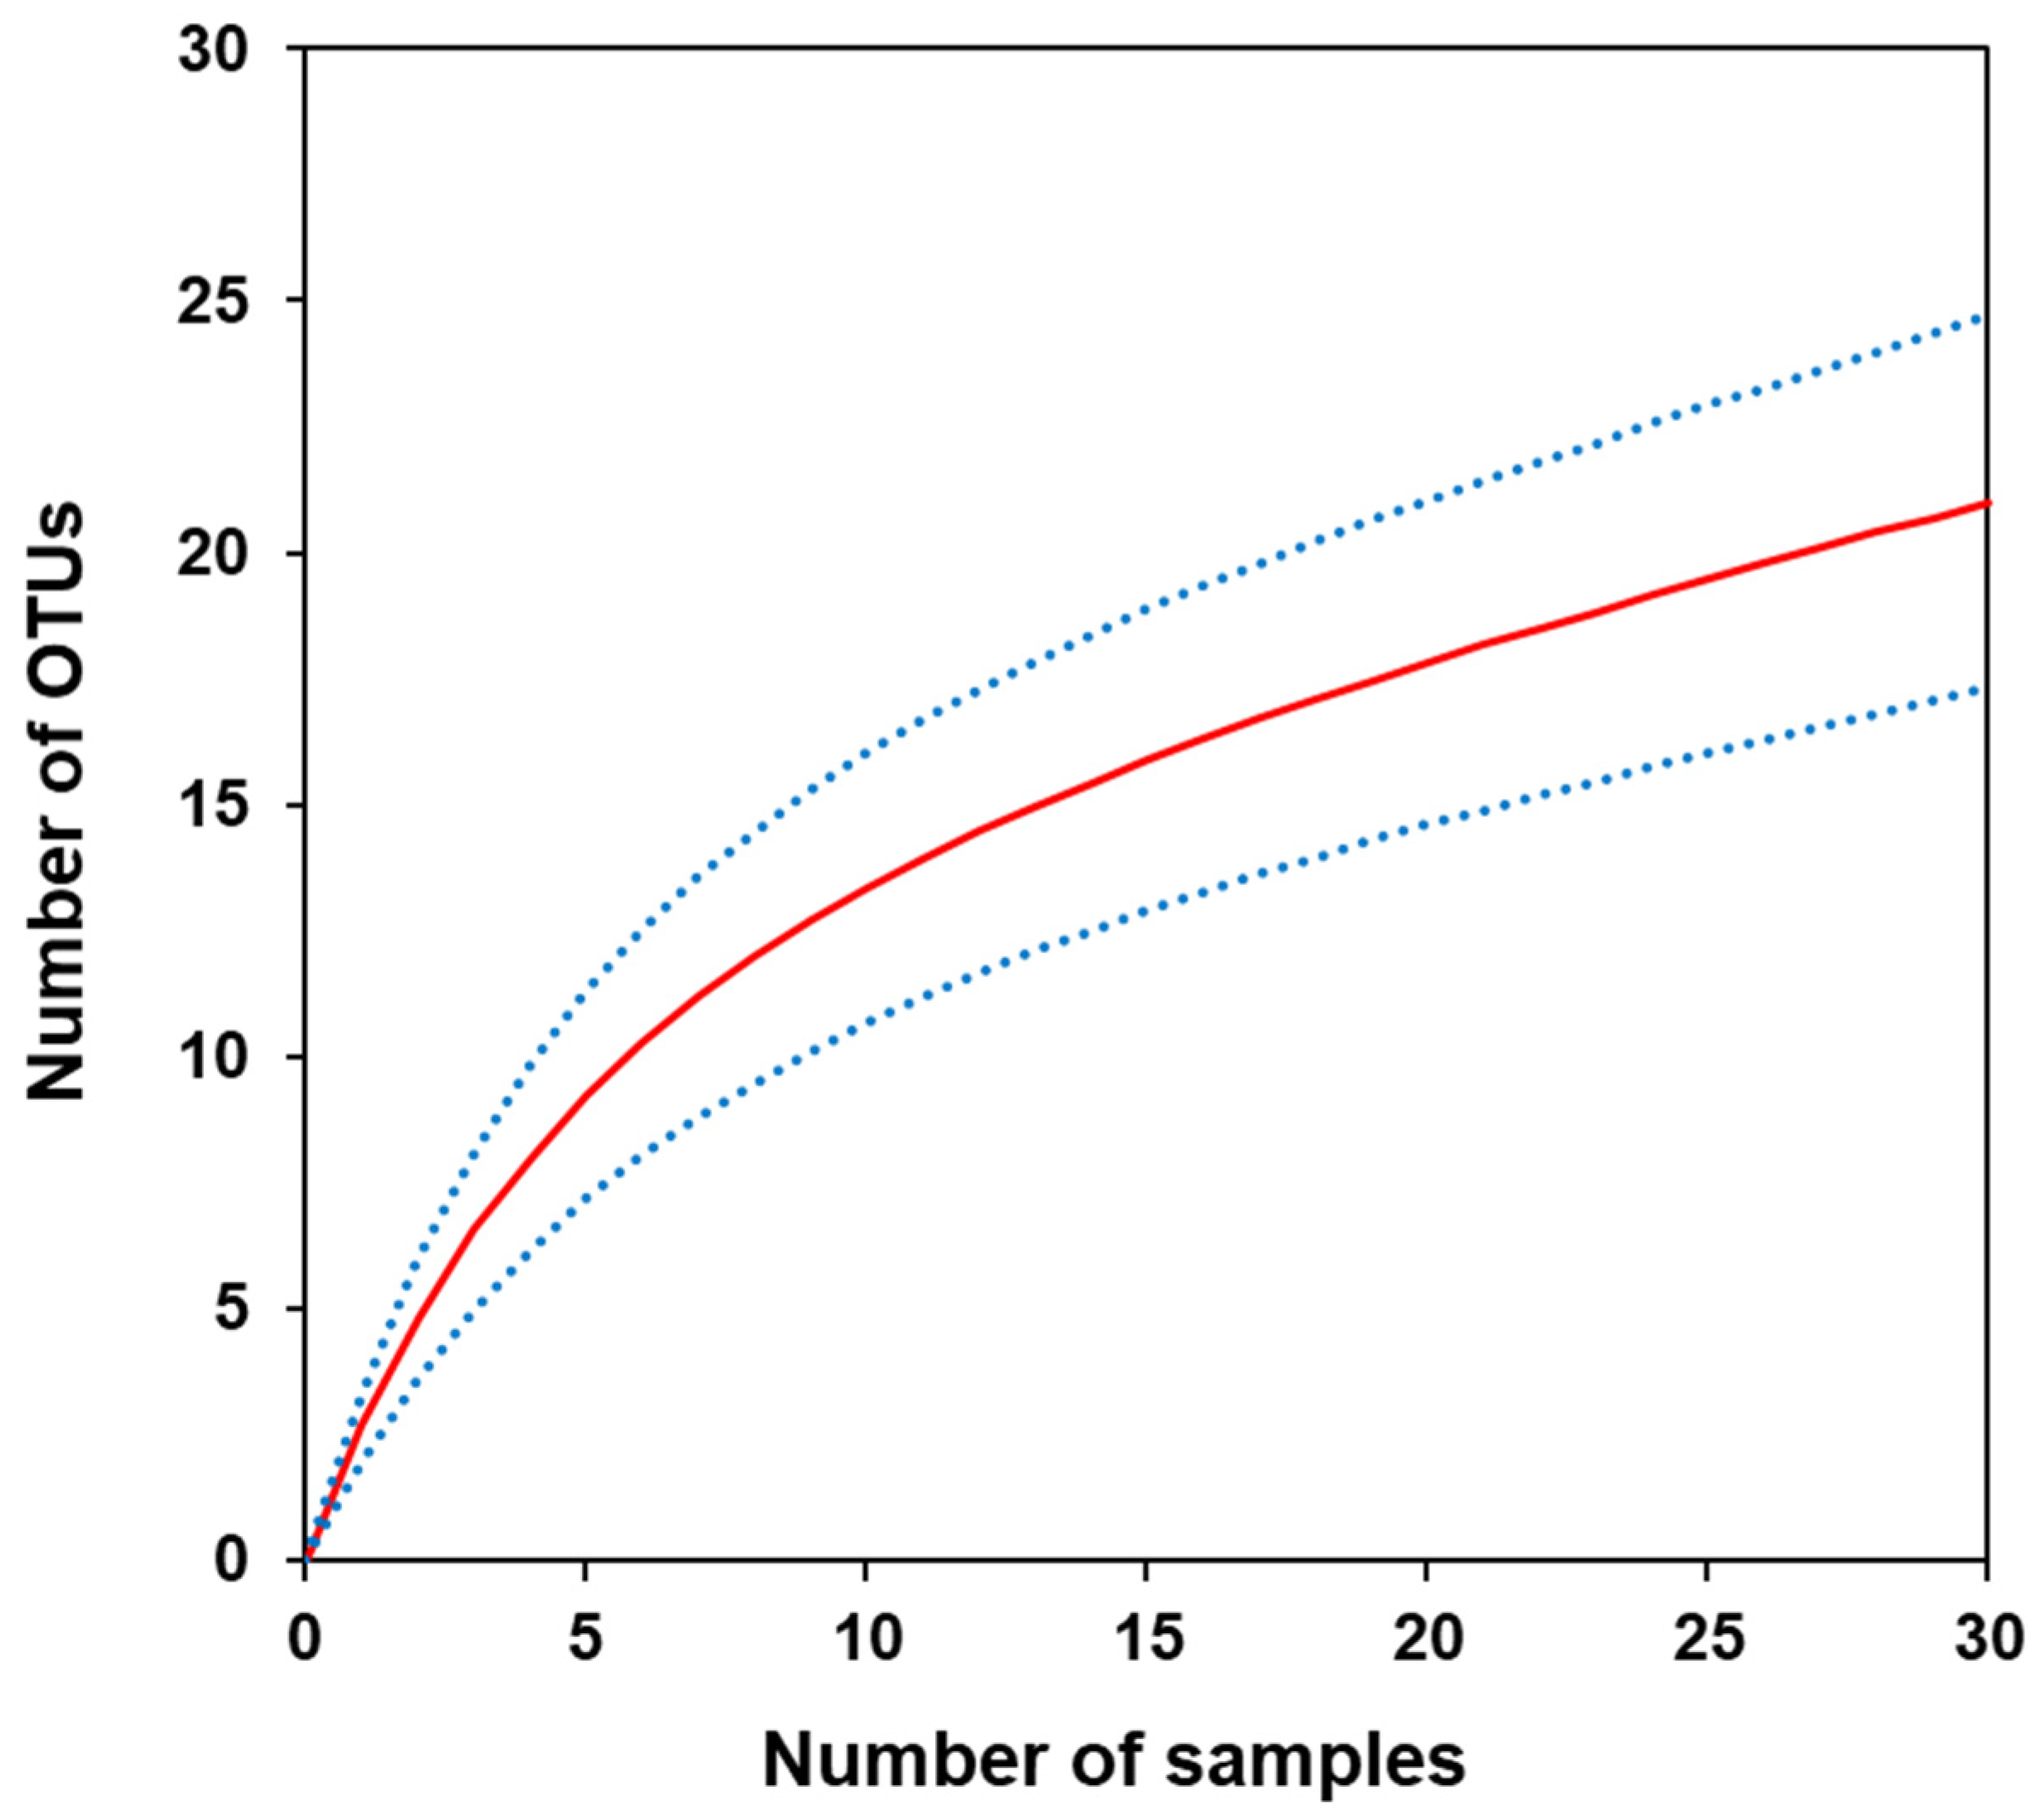
Table 1.
Table of water parameters for each study site in the Nakdong River Estuary.
| D.O. (mg L-1) |
D.O. (%) |
pH | Temp. (℃) |
Conduc. (μS cm-1) |
Salinity (ppt) |
Alkal. (mg L-1) |
Tur. (NTU) |
|
|---|---|---|---|---|---|---|---|---|
| Site 1 | 7.00 | 83.5 | 7.83 | 24.1 | 16,716 | 10.0 | 84 | 3.68 |
| Site 2 | 6.46 | 77.5 | 7.97 | 24.3 | 21,666 | 14.2 | 90 | 3.68 |
| Site 3 | 6.73 | 80.7 | 7.99 | 24.5 | 20,436 | 12.3 | 84 | 3.97 |
Table 2.
Identified taxa in the gut contents of C. fluminea (n = 30, ten individuals from each site).
Table 2.
Identified taxa in the gut contents of C. fluminea (n = 30, ten individuals from each site).
| Identified taxa | Site 1 | Site 2 | Site 3 | Total | Identity (%) | Query (%) | Genbank accession |
Level of identification |
|---|---|---|---|---|---|---|---|---|
| Hydrachna sp. | 4 | 17 | 121 | 142 | 94.41 | 100 | MT921251.1 | genus |
| Cyclops sp. | 2 | 1 | 14 | 17 | 97.73 | 100 | AY626998.1 | genus |
| Microcyclops sp. | 0 | 0 | 1 | 1 | 93.18 | 100 | MK106114.1 | genus |
| Mytilicola orientalis | 27 | 30 | 0 | 57 | 98.82 | 96 | HM775190.1 | species |
| Liposcelis sp. | 1 | 0 | 0 | 1 | 96.00 | 81 | AY077779.1 | genus |
| Hemibarbus labeo | 0 | 0 | 1 | 1 | 97.24 | 100 | MH843153.1 | species |
| Oncorhynchus mykiss | 3 | 12 | 63 | 78 | 99.44 | 100 | XR_005038417.1 | species |
| Alloglossidium sp. | 397 | 4 | 1 | 402 | 96.13 | 100 | MH041398.1 | genus |
| Navicula arenaria | 0 | 0 | 1 | 1 | 100.00 | 100 | KJ961668.1 | species |
| Skeletonema sp. | 4 | 0 | 0 | 4 | 94.83 | 100 | KY817216.1 | genus |
| Neocercomonas sp. | 0 | 0 | 2 | 2 | 100.00 | 91 | MG775596.1 | genus |
| Katablepharis japonica | 0 | 0 | 1 | 1 | 97.19 | 100 | LT993783.1 | species |
| Azadinium sp. | 1 | 0 | 2 | 3 | 94.83 | 100 | LS974157.1 | genus |
| Nannochloropsis oculata | 2 | 0 | 0 | 2 | 99.40 | 100 | KU900229.1 | species |
| Aspergillus penicillioides | 1 | 0 | 0 | 1 | 99.43 | 100 | NG_063229.1 | species |
| Trichosporon asahii | 2 | 2 | 2 | 6 | 99.43 | 100 | MN268783.1 | species |
| Mychonastes homosphaera | 1 | 0 | 0 | 1 | 99.43 | 100 | X73996.1 | species |
| Mychonastes rotundus | 22 | 3 | 12 | 37 | 98.85 | 100 | GQ477053.1 | species |
| Desmodesmus communis | 6 | 0 | 4 | 10 | 99.43 | 100 | KF864475.1 | species |
| Messastrum gracile | 10 | 2 | 1 | 13 | 98.84 | 100 | KT833589.1 | species |
| Nannochloris sp. | 26 | 1 | 0 | 27 | 98.06 | 88 | AB058309.1 | genus |
| Total reads of OTUs | 509 | 72 | 226 | 807 | ||||
| Total number of OTUs | 16 | 9 | 14 | 21 |
Disclaimer/Publisher’s Note: The statements, opinions and data contained in all publications are solely those of the individual author(s) and contributor(s) and not of MDPI and/or the editor(s). MDPI and/or the editor(s) disclaim responsibility for any injury to people or property resulting from any ideas, methods, instructions or products referred to in the content. |
© 2023 by the authors. Licensee MDPI, Basel, Switzerland. This article is an open access article distributed under the terms and conditions of the Creative Commons Attribution (CC BY) license (http://creativecommons.org/licenses/by/4.0/).
Copyright: This open access article is published under a Creative Commons CC BY 4.0 license, which permit the free download, distribution, and reuse, provided that the author and preprint are cited in any reuse.


