
Submitted:
24 September 2025
Posted:
26 September 2025
You are already at the latest version
Abstract
Shrimp aquaculture ponds are dynamic ecosystems in which water quality and microbial interactions play a central role in animal health. This study aimed to investigate the relationship between the intestinal microbiota of Penaeus monodon and the microbial community of mixed-culture pond water. Water quality indicators showed progressive changes from July to September, with pH decreasing from 8.1 to 7.5 but remaining within a suitable range. Nitrogen compounds, including ammonia, nitrite, and nitrate, increased steadily, with total nitrogen rising from 0.71 to 1.86 mg·L⁻¹, while phosphate and total phosphorus reached 0.31 and 0.36 mg·L⁻¹, respectively, exceeding thresholds commonly associated with algal bloom risk. Microbial community profiling using Illumina MiSeq sequencing revealed 166 OTUs shared between shrimp intestine and pond water, while both habitats contained more than 350 OTUs overall. Alpha diversity analysis showed higher microbial richness in water than in shrimp intestines, dominated by unclassified taxa, whereas shrimp guts were enriched in specific genera such as Vibrio. Cluster analysis indicated partial overlap but distinct grouping of gut and water microbiota, with the PMB intestinal community diverging most strongly. These findings highlight a close link between water quality and microbial composition, emphasizing the importance of pond management for maintaining ecological stability and shrimp health.
Keywords:
Penaeus monodon
; intestinal flora
; water bacterial flora
; Illumina MiSeq sequencing
; diversity analysis
1. Introduction
Shrimp aquaculture is one of the fastest growing and most valuable sectors of global seafood production, contributing significantly to food security, livelihoods, and international trade. While the Litopenaeus vannamei is the most widely cultivated species, the Penaeus monodon remain of high economic importance in Asia due to their large size, preferred taste, and premium market value [1,2]. Global production of farmed shrimp now exceeds five million metric tons annually, with P.monodon contributing around 0.6-0.7 million tons in recent years, underscoring the continued relevance of these species [1,3]. Ensuring sustainable production requires improved understanding of pond ecosystem processes, particularly the microbial communities that regulate water quality and influence shrimp health.
Aquaculture ponds are complex ecosystems in which microorganisms perform essential ecological functions. Bacteria, archaea, algae, and fungi mediate nutrient cycling, organic matter degradation, and detoxification of nitrogenous wastes such as ammonia and nitrite [4,5]. Beneficial bacteria in biofloc or recirculating aquaculture systems have been shown to assimilate excess nitrogen, convert waste into microbial biomass, and stabilize pond water parameters [6]. Such processes directly support shrimp survival and growth [7]. Conversely, imbalances in microbial communities can lead to water quality deterioration, phytoplankton crashes, or proliferation of pathogenic taxa, thereby increasing disease risk [8].
The shrimp gut microbiota has emerged as a critical determinant of host nutrition, immunity, and overall performance. Studies using high-throughput 16S rRNA gene sequencing have shown that healthy shrimp guts are dominated by Proteobacteria, with additional representation of Firmicutes, Bacteroidetes, and Actinobacteria [9,10]. These communities aid digestion, produce vitamins and enzymes, and enhance immune function [11]. Dysbiosis, or imbalance of the gut microbiota, is associated with major shrimp diseases including acute hepatopancreatic necrosis disease (AHPND), white feces syndrome, and white spot disease [2,12]. Chang et al. [13] demonstrated that Vibrio infection disrupts the gut microbiome of shrimp, reducing bacterial diversity and increasing the relative abundance of pathogenic taxa. Similarly, viral infections such as white spot syndrome virus (WSSV) alter gut microbiota composition and reduce beneficial taxa [14]. Collectively, these findings indicate that gut microbial balance is closely linked to shrimp disease resistance and production outcomes.
Environmental factors strongly influence shrimp gut microbiota. Salinity, temperature, diet, and stocking density have all been reported to shape gut bacterial communities [7,15]. Hou et al. [16] found that salinity significantly alters gut microbiome structure, with high salinity enriching Vibrionaceae and cyanobacteria in P.monodon intestines. Developmental stage is another driver: Cicala et al. [17] observed predictable shifts in gut community composition from larval to adult stages of P.monodon. Host genetic factors also contribute, with selective breeding lines of shrimp showing distinct gut microbial profiles [18]. These findings highlight the plasticity of the shrimp gut microbiome and the potential to harness it for health management.
Manipulating shrimp microbiomes has become an emerging strategy for improving culture outcomes. Probiotics, prebiotics, and synbiotics introduced via feed or water have been shown to modulate gut communities, enhance immunity, and improve feed efficiency [19]. Lin et al. [20] reported that probiotic and herbal treatments significantly shifted gut microbiota over time, increasing the abundance of beneficial bacteria. Meta-analyses confirm that microbiome-based interventions can reduce pathogen load and improve shrimp performance across multiple culture systems [19,21]. Furthermore, the microbiome itself has been proposed as a determinant of aquaculture productivity, with specific bacterial taxa correlating with growth performance [22].
Beyond the host, interactions between gut and environmental microbiota are increasingly recognized as critical to shrimp aquaculture. Zeng et al. [23] reported distinct but interconnected microbial communities in shrimp intestines, pond water, and sediments, suggesting reciprocal exchanges. Li et al. [24] documented strong correlations between environmental microbial dynamics and shrimp gut community assembly in greenhouse farming systems. Similarly, Wang et al. [25] recently showed that gut, water, and sediment microbiota are interrelated, with environmental conditions influencing gut colonization and vice versa. Such studies underscore the need to consider host–environment microbial interactions in aquaculture management.
Despite these advances, little is known about the gut-water microbiota relationship in Penaeus monodon, particularly under mixed-culture pond systems. Polyculture practices, where shrimp are co-reared with fish or other aquatic organisms, create complex microbial milieus that may affect both water quality and host microbiota. To date, few studies have explicitly examined gut and water microbial communities concurrently in P.monodon under polyculture. Addressing this gap is essential for understanding microbial ecology in traditional pond systems and for developing microbiome-based strategies to improve shrimp health and sustainability. Therefore, the present study aims to characterize bacterial communities in the intestines of P.monodon and in pond water across multiple culture stages in mixed-culture ponds, and to evaluate the degree of overlap, correlation, and temporal dynamics between these microbiomes. By integrating host and environmental microbiome data, this research provides new insights into the microbial ecology of P.monodon aquaculture and informs ecosystem-based approaches for sustainable shrimp production.
2. Materials and Methods
2.1. Materials
2.1.1. Sample
Water samples of mixed culture koi and “Nanhai No.1” spotted prawn pond and the cultured “Nanhai No. 1” spotted prawn pond were collected from Jingwu Town, Xiqing.
2.1.2. Experimental Supplies and Instruments
Thermo Fisher Sorvall ST16R bench high speed refrigerated centrifuge, vacuum grinder, filter extractor, pipette gun, electronic balance, 0.22µm filter membrane, centrifuge tube, 0.9% sterile saline.
2.2. Methods
The first experiment started on July 20, 2018, followed by the collection of prawn (PMA, PMB, PMC, PMD) and its aquaculture water samples (SH1, SH2, SH3, SH4) on August 3, August 18, and September 2.
2.2.1. Extraction of Intestinal Bacteria from Penaeus Monodon
The “Nanhai No.1” spotted shrimp was oxygenated and transported to the laboratory, and 20 shrimp were collected and disinfected in a sterile environment. The back of the spotted shrimp was cut with sterilizing scissors, and the intact intestinal tract of the shrimp was picked up with tweezers and put into a centrifuge tube, adding 1 mL sterile normal saline and then transferred to a vacuum grinder for full grinding. All the samples were divided into three parts. The samples were placed in a bench centrifuge with an electronic balance, and 2000 r/s centrifuge was performed 2-3 times. After the precipitation was abandoned, the supernatant which was no longer turbidity was extracted. Then the supernatant was abandoned by a 5000 r/s centrifuge and deposited at -80℃for DNA extraction.
2.2.2. Extraction of Bacteria from Water Samples of Mixed Culture Pond
The water samples of mixed culture koi and prawn ponds in Jingwu Town of Xiqing were collected (5 moffshore and 0.5 m away from the water surface), and the bacteria were extracted on the filter membrane using a vacuum filter and divided into three parts into a centrifuge tube. The bacteriological samples on the filter membrane were rinsed and coated cleanly into the centrifuge tube using a pipette to absorb sterile normal saline. The samples were also centrifuged and deposited at - 80 ° C for DNA extraction.
2.2.3. Extraction, PCR Amplification and Purification of Total DNA of Thesample and Sequence Determination
Take the samples of Penaeus monodon and water respectively, and extract the total DNA genome of the samples according to the product instructions of the kit. The total DNA genome was electrophoretic in 0.8% agarose gel to detect the quality of its extraction, and then the total DNA genome was quantified by ultraviolet spectrophotometer. The corresponding primers were designed according to the conserved regions in the 16SrRNA target sequence and amplified in a 50µL system. After the amplification products were quantified, the DNA concentration was adjusted to 25 ng/µL, all samples were mixed in equal proportions, and the library was constructed and sequenced using Illumina miseq sequencing platform (entrusted to Innoson Biotechnology Co., LTD.).
2.2.4. Water Quality Index Testing
During each sampling phase, pH, dissolved oxygen, and salinity were recorded on-site using a calibrated multi-parameter probe. Total nitrogen (TN) was determined using alkaline potassium persulfate digestion-UV spectrophotometry, which converts all nitrogen-containing compounds in the water sample into nitrates through high-temperature and high-pressure digestion before measurement. Ammonia nitrogen (NH3-N) was determined using Nessler’s reagent spectrophotometry, which utilizes the principle that ammonia forms a colored complex with specific reagents. Nitrite nitrogen (NO2--N) was determined using N-(1-naphthyl)-ethylenediamine spectrophotometry, which is diazotized with p-aminobenzenesulfonamide and then coupled to form a purple-red dye. Nitrate nitrogen (NO3--N) was determined indirectly by reducing it to nitrite using a cadmium column reduction method. Total phosphorus (TP) and total phosphate are determined using ammonium molybdate spectrophotometry (molybdenum antimony method). High-temperature digestion using an oxidizing agent such as potassium persulfate converts all forms of phosphorus into orthophosphate, which is then followed by color development to produce phosphomolybdenum blue. The determination of active phosphate (i.e., orthophosphate) follows the same principle, but without the digestion step. The color development reaction is performed directly on the filtered water sample. Each parameter is measured three times at each stage.
2.2.5. Data Processing
A high-throughput sequencing platform was used for double-ended sequencing of total DNA genome fragments, and the original double-ended sequence (FASTQ format) was integrated and screened for quality by sliding window method. FLASH software (v1.2.7) is used to pair and connect the former according to overlapping bases. According to a limited segment of base sequence corresponding to each sample for identifying the sample, the connected sequence recognition is assigned to the corresponding sample, and high-quality Tags data are obtained through strict filtering, that is, effective sequences (Clean Tags). QIIME software (v1.8.0) was used to call USEARCH(2.236) to check and eliminate the chimera sequence Sequences with 97% or more similarity were classified as an OTUs, and the Ribosomal data base project (RDP) was used to classify the sequences representing OTUs to the species level. Sparse curve and Alpha diversity (Chao1 index, ACE index) were used to evaluate species richness, Shannon and Simpson diversity index were used to evaluate species diversity, and Wynn Diagram was produced by Wynn Diagram online software. Origin software was used to build the bar chart.
3. Results
3.1. Water Quality Index Data
Water quality indicators in aquaculture ponds showed a clear trend of change from July to September (sampling stages SH1 to SH4), with the pH gradually decreasing from 8.1±0.02 to 7.5±0.02, remaining within the suitable range for aquatic animals. Although ammonia nitrogen, nitrite nitrogen, and nitrate nitrogen did not reach acute toxic levels throughout the entire process, they increased as sampling progressed, with total nitrogen continuously increasing from 0.71±0.02 mg·L−1 to 1.86±0.02 mg·L−1. Phosphate and total phosphorus concentrations also gradually increased, reaching 0.27±0.06 and 0.34±0.07 mg·L−1 in the SH3 and SH4 stages, and 0.31±0.03 and 0.36±0.02 mg·L−1, respectively. These levels exceed the common thresholds for algal bloom prevention and control in aquaculture ponds, significantly increasing the risk of eutrophication and algal blooms in the later stages.

Table 1.
Water quality index data.
| Sampling Phase | pH | NH3-N (mg·L−1) |
NO2--N (mg·L−1) |
NO3--N (mg·L−1) |
PO43--P (mg·L−1) |
TN (mg·L−1) | TP (mg·L−1) |
| SH1 | 8.1±0.02 | 0.11±0.01 | 0.01±0.02 | 0.51±0.02 | 0.05±0.012 | 0.71±0.02 | 0.08±0.05 |
| SH2 | 7.8±0.01 | 0.25±0.01 | 0.02±0.02 | 0.75±0.03 | 0.11±0.02 | 1.34±0.02 | 0.15±0.02 |
| SH3 | 7.6±0.04 | 0.33±0.02 | 0.02±0.01 | 1.18±0.01 | 0.27±0.06 | 1.53±0.02 | 0.31±0.03 |
| SH4 | 7.5±0.02 | 0.51±0.02 | 0.04±0.02 | 1.22±0.02 | 0.34±0.07 | 1.86±0.02 | 0.36±0.02 |
3.2. High-Throughput Sequencing Data
After obtaining the original sequence data of the shrimp and water samples by Illumina high-throughput sequencing, and referring to the analysis content of FastQ, the sequence quality control results of the samples were statistically statistically shown in Table 2. It was revealed that the valid sequences of each sample ranged from 79,681 to 89,203, and their average length was stable at 253 bp. Among them, the sequences within the range of effective sequence length reached about 90% of the total number of effective sequences.
Table 2 also lists the proportion of base Q20 and Q30 with sample sequencing mass greater than 20 and 30. The closer the percentage of these two groups is to 100%, the more the quality of sequencing meets the quality control standards. The proportion of Q20 and Q30 in all samples reached more than 99.12% and 98.24%, indicating that the sequencing was in full compliance with the quality control standards, which laid a reliable revealedation for subsequent experimental data.
3.3. OTU Cluster Analysis
3.3.1. OTU Clustering and Annotation Analysis
According to the cluster analysis of the sample sequences, the OTU bioinformation statistics at 97% similarity level demonstrated that the number of intestinal bacterial-like OTU ranged from 638 to 1119. The lowest number of OTU in PMC group was 638, while the highest number of OTU in PMB group was 1119. The number of OTU of bacteria in water ranged from 812 to 1071, among which the lowest number of OTU of SH1 and SH4 groups was 812 and 821, respectively, and the highest number of OTU of SH2 group was 1071 (Table 3). According to the above clustering results, the OTU number in group 2 of Penaeus monodon flora was the largest. It can be seen that Penaeus monodon flora was in the flourishing period during this period, that is, the most active period of intestinal flora. The group with limited OTU number was the third group. At this time, Penaeus monodon had grown into adult shrimp, and its intestinal flora environment had stabilized and gradually decreased to a fixed number. In addition to the OTU number in the second group, the OTU number in the other three groups was relatively stable. It can be seen that the interaction between the intestinal flora and the bacterial flora in the water body was obvious.
3.3.2. Analysis of OTU Petal Diagram and Wayne Diagram
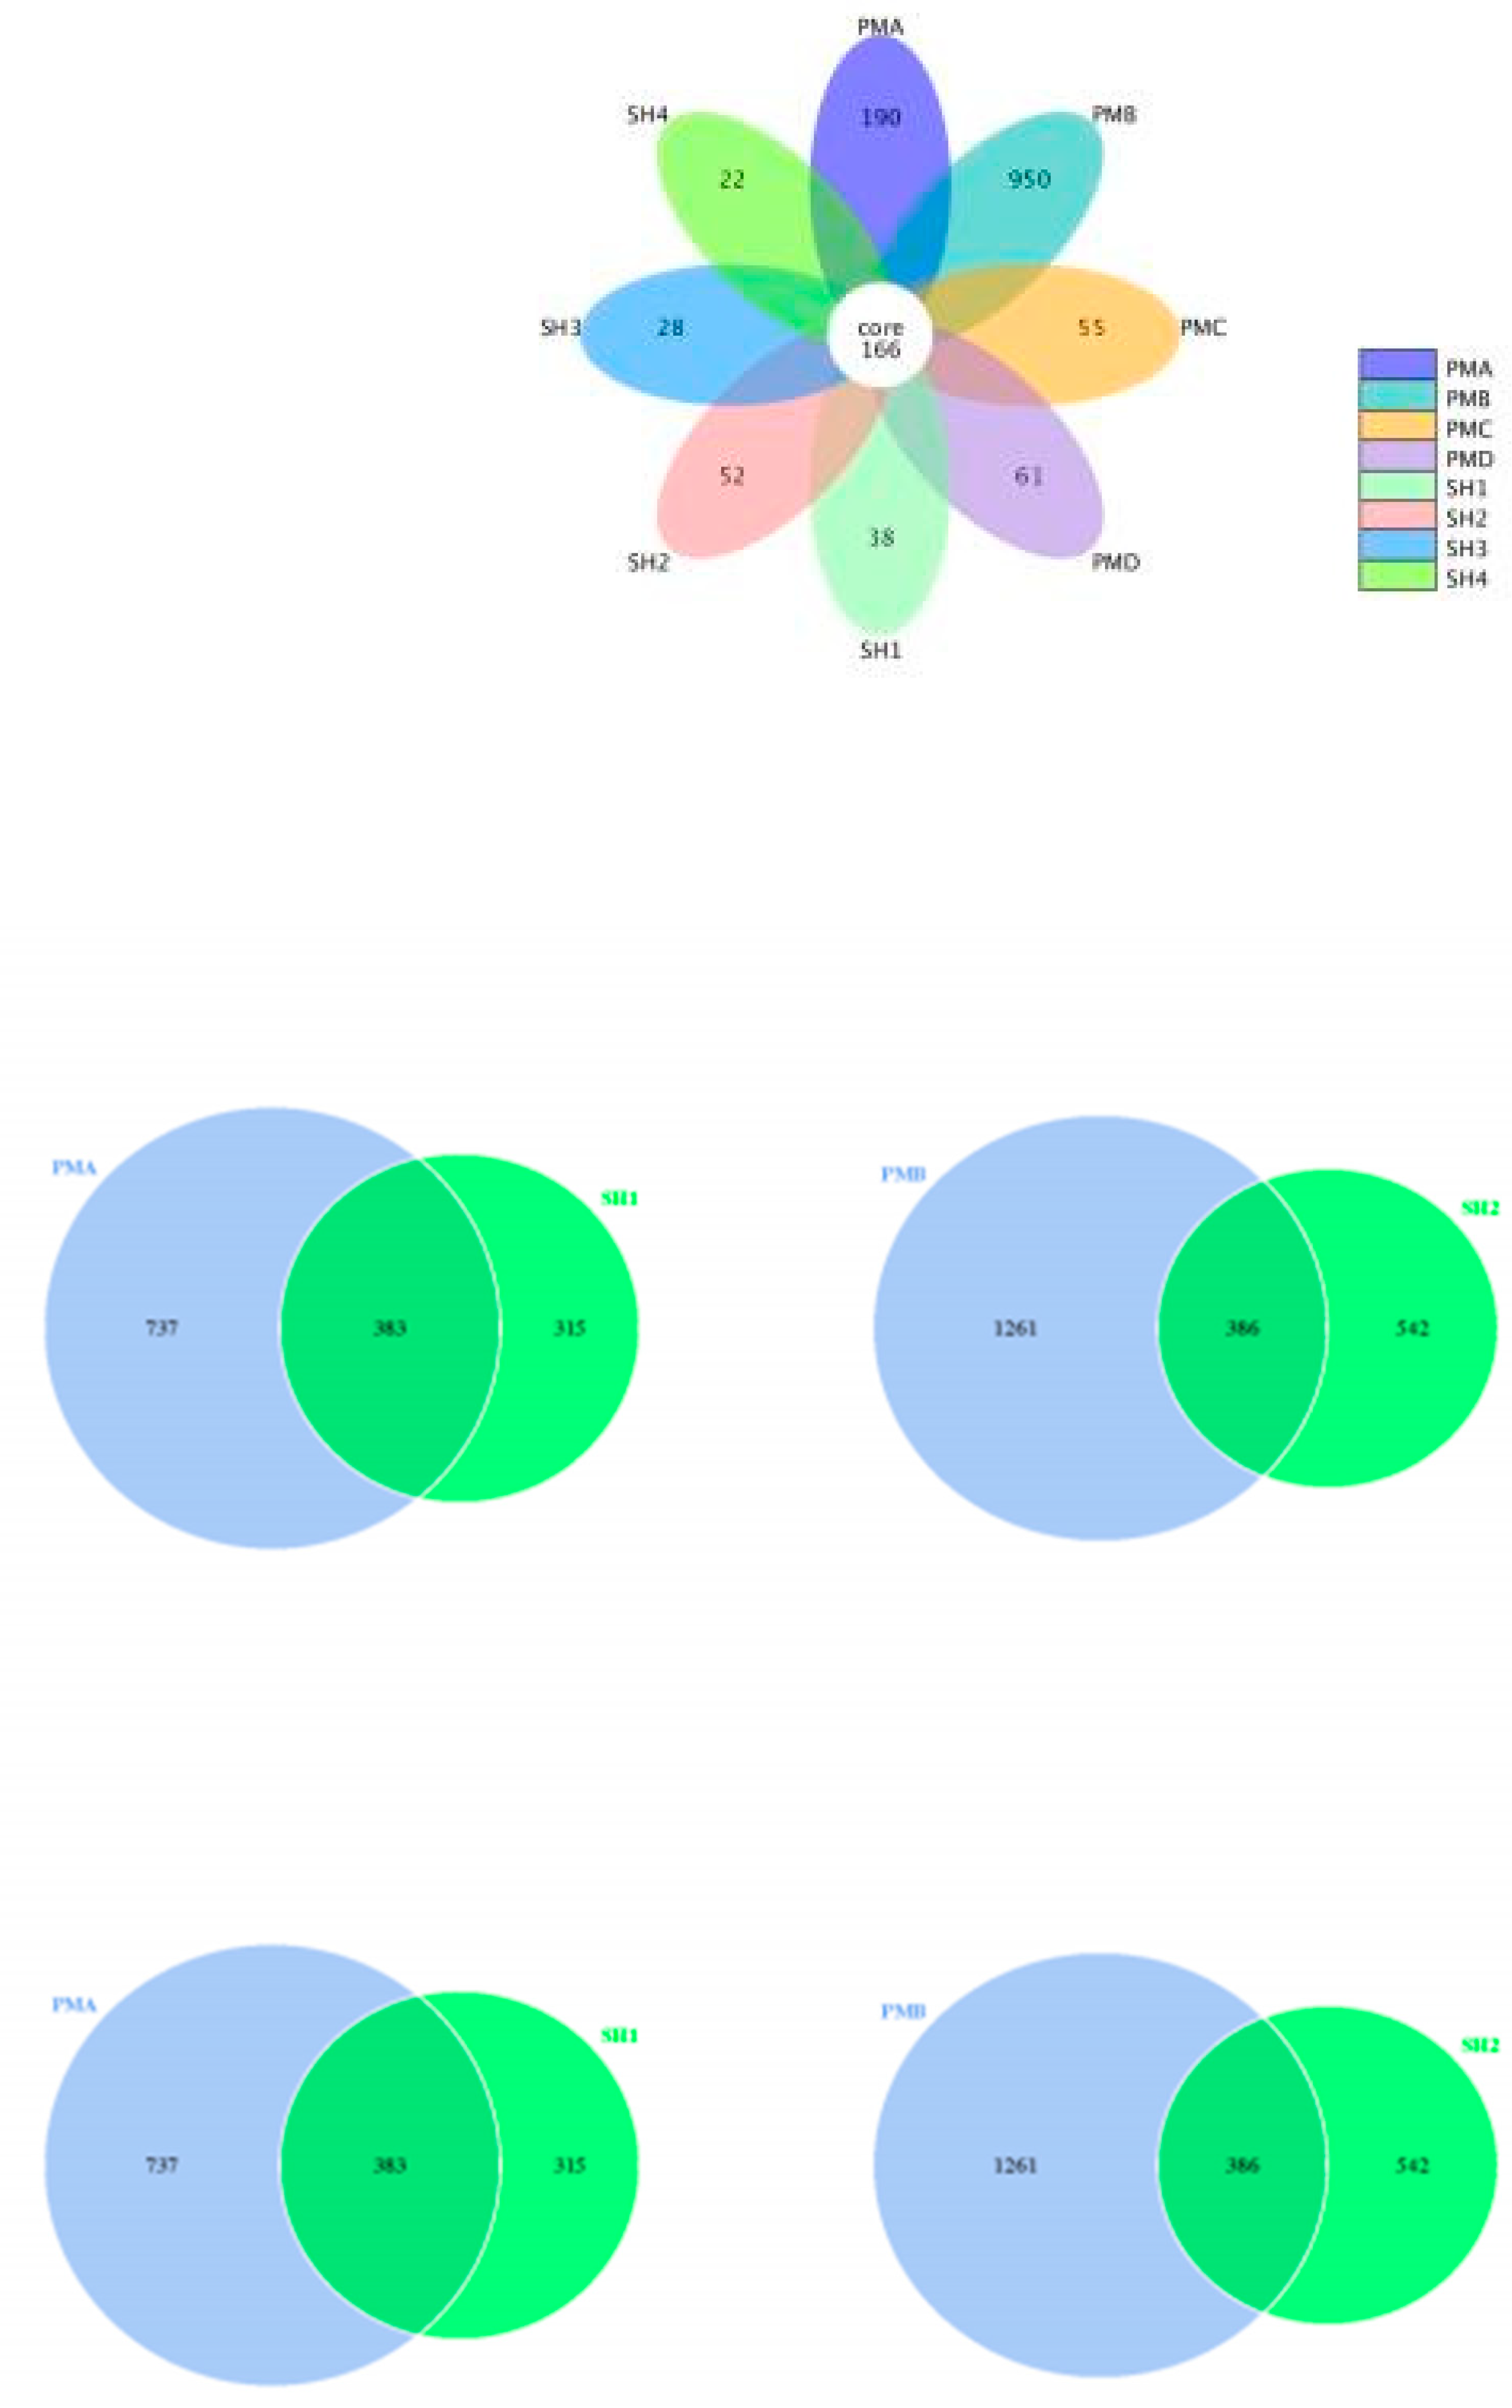
In order to analyze in more detail the similarities and differences of the intestinal tract and the microflora in the living water of Penaeus speculatus, the petal diagram (Figure. 1), which can analyze more than five samples, was used to analyze the OTU distribution characteristics among each group of samples. According to the petal diagram, the number of OTU shared between the gut and aquatic flora of Penaeus penaeus was 166, while each group had its own unique OTU. The number of OTU unique to PMB group was the highest, followed by PMA group, and the number of OTU unique to the other two groups was much limiteder than that of PMA and B group. In comparison with the PM group, the number of unique OTU in SH1~SH4 groups was basically stable at about 50, and the number of unique OTU in SH1 and SH2 groups was slightly higher. The above results indicated that the intestinal flora of Penaeus prawns was active during the development period, and due to their mutual influence, the bacterial flora in the water body was also more active during the same period. This phenomenon can also be reflected in the following Wynn diagram of individual shrimp and water samples in each group. In all the OTU numbers of PMA and SH1, PMB and SH2, PMC and SH3, PMD and SH4, the number of OTU shared by shrimp - water samples reached 383, 386, 395 and 352. This further confirmed the interaction between the intestinal flora of prawn and the bacterial flora in water.
Figure 1.
Flower petal diagram and Wayne diagram.
3.4. Analysis of Flora Structure and Abundance
3.4.1. Microflora Structure Under Phyla Classification Level
At the phylum level, 44 and 27 bacterial phyla were detected in the gut of Penaeus monodon and its living water, respectively, and 19 identical bacterial phyla were revealed in both samples. Figure 2 analyzes the top ten dominant phyla in the 8 sample groups in terms of relative species abundance. Proteobacteria is the main dominant phyla in this group, with the highest proportions in PMD group (93.03%) and SH1 group (74.31%). Next to Proteobacteria, the top three dominant bacteria in the intestinal flora of Penaeus monodon are Tenericutes, Firmicutes and Acidobacteria respectively. Among them, Tenericutes and Firmicutes are particularly dominant in PMB group of intestinal flora of Penaeus monodon. They reached 13.89% and 5.29%; In the aquatic flora, Actinobaeteria, Bacteroidetes and Chloroflexi were the top three dominant bacteria. Compared with chloroflexi, the relative abundance of dominant bacteria in aquatic flora was more evenly distributed in all groups.
3.4.2. Flora Structure at the Order Classification Level
The heat map can be used to reflect the change of flora abundance, and the depth of its color represents the magnitude of abundance. The similarity and difference of flora composition can be understood through the difference of the color of the heat map. A heat map of species abundance at the eye level is drawn, and the results are shown in Figure 3.
At the target level, the color distribution of bacterial group-like heat maps of intestinal flora and aquatic flora of prawn were significantly different, and the two groups clustered separately. In the sample group of shrimp intestinal flora, the color distribution of Vibrionales was not significant but uniform, and then, the abundance was only significant in a single sample of shrimp flora: Fusobacteriales, Clostridiales and Desulfovibrionales are desulfovibrionales grouped in color in the PMA group. Lactobacillales and Mycoplasmatales are color clustered in PMB group; In the water flora sample group, the heat map color distribution of most bacteriales was uniform, especially in SH2 group, the cluster color was significant, while in SH1 group, Pseudomonadales and Neisseriales cluster color wasthe most significant, that is, the bacteriales had the largest abundance. In addition, there existed no significant characteristics in the color distribution of heat maps between the two shrimp samples and the water sample group.
3.4.3. Microflora Structure at Genus Classification Level
At the genus level, the relative distribution and proportion of dominant bacteria in each sample are shown in Figure 4. Compared with the relative abundance of dominant bacteria at the phylum level, the composition and relative abundance of dominant bacteria in the two sample groups are significantly different. The most obvious trend in the abundance of dominant bacteria genera was Vibrio and an unclassified genus of bacteria, among which Vibrio accounted for 61.48%, 46.51%, 66.48% and 66.52% in the intestinal flora samples of shrimp, respectively (Table 4). However, in water samples, Vibrio only accounted for 9.04%, 2.45%, 7.83% and 13.15%. The above unclassified bacteria genera accounted for 45.25%, 82.92%, 63.03% and 58.62% in the water flora, while the proportion of the intestinal flora samples of prawn were 24.70%, 21.63%, 15.75% and 17.21%. In addition to the two main dominant bacteria genera, Shewanella, as a common dominant bacteria genus, had a relatively uniform distribution ratio of relative abundance in the intestinal and water samples of shrimp, accounting for 2.54%, 2.88%, 1.99%, 9.10% and 1.71%, 0.59%, 1.96% and 9.07%, respectively. Next to the above three dominant bacteria genera, the dominant bacteria with the highest abundance in the intestinal flora samples of penaeus was Candidatus_Bacilloplasma, which appeared in the PMB period and accounted for 13.87%. The other two genera were Aeromonas and Pseudomonas, which were evenly distributed in each group of shrimp intestinal flora. The bacteria with the highest abundance in the water flora samples was Vogesella, which appeared in SH1 period and accounted for 20.92%, followed by Microcystis, which appeared in SH3 group. The others were Pseudomonas and Acinetobacter, which took up a large proportion and were evenly distributed. The abundance ratio of dominant bacteria genera in SH2 period was all at a low level, indicating that the active period of shrimp intestinal flora had a certain effect on the water flora, which was sufficient to indicate that the composition of bacteria flora in the water and intestine in the same aquaculture pond was closely related.
3.5. Analysis of Flora Diversity and Similarity
3.5.1. Alpha Diversity Index Analysis
Alpha diversity analysis reflects the abundance and diversity of microbial communities.index and sample coverage goods_coverage. As can be seen from the table, the sequencing coverage rate of all samples reached above 0.994, indicating that the sequencing coverage rate of bacteria in the samples was high, and the sequencing depth was appropriate, so the bacterial diversity analysis of each sample could be carried out without concern. chao1 index and ACE index reflect the flora richness, the larger the value, the higher the flora richness; The shannon index and Simpson index reflect the flora diversity, and the higher the value, the higher the species diversity. In Table 5, the shannon index and Simpson index of water samples were significantly higher than that of shrimp samples, indicating that the species diversity of water samples was richer. In addition to PMB group and SH2 group with abnormally active flora, chao1 and ACE index also show that the flora richness of water samples is higher than that of shrimp gut flora richness.
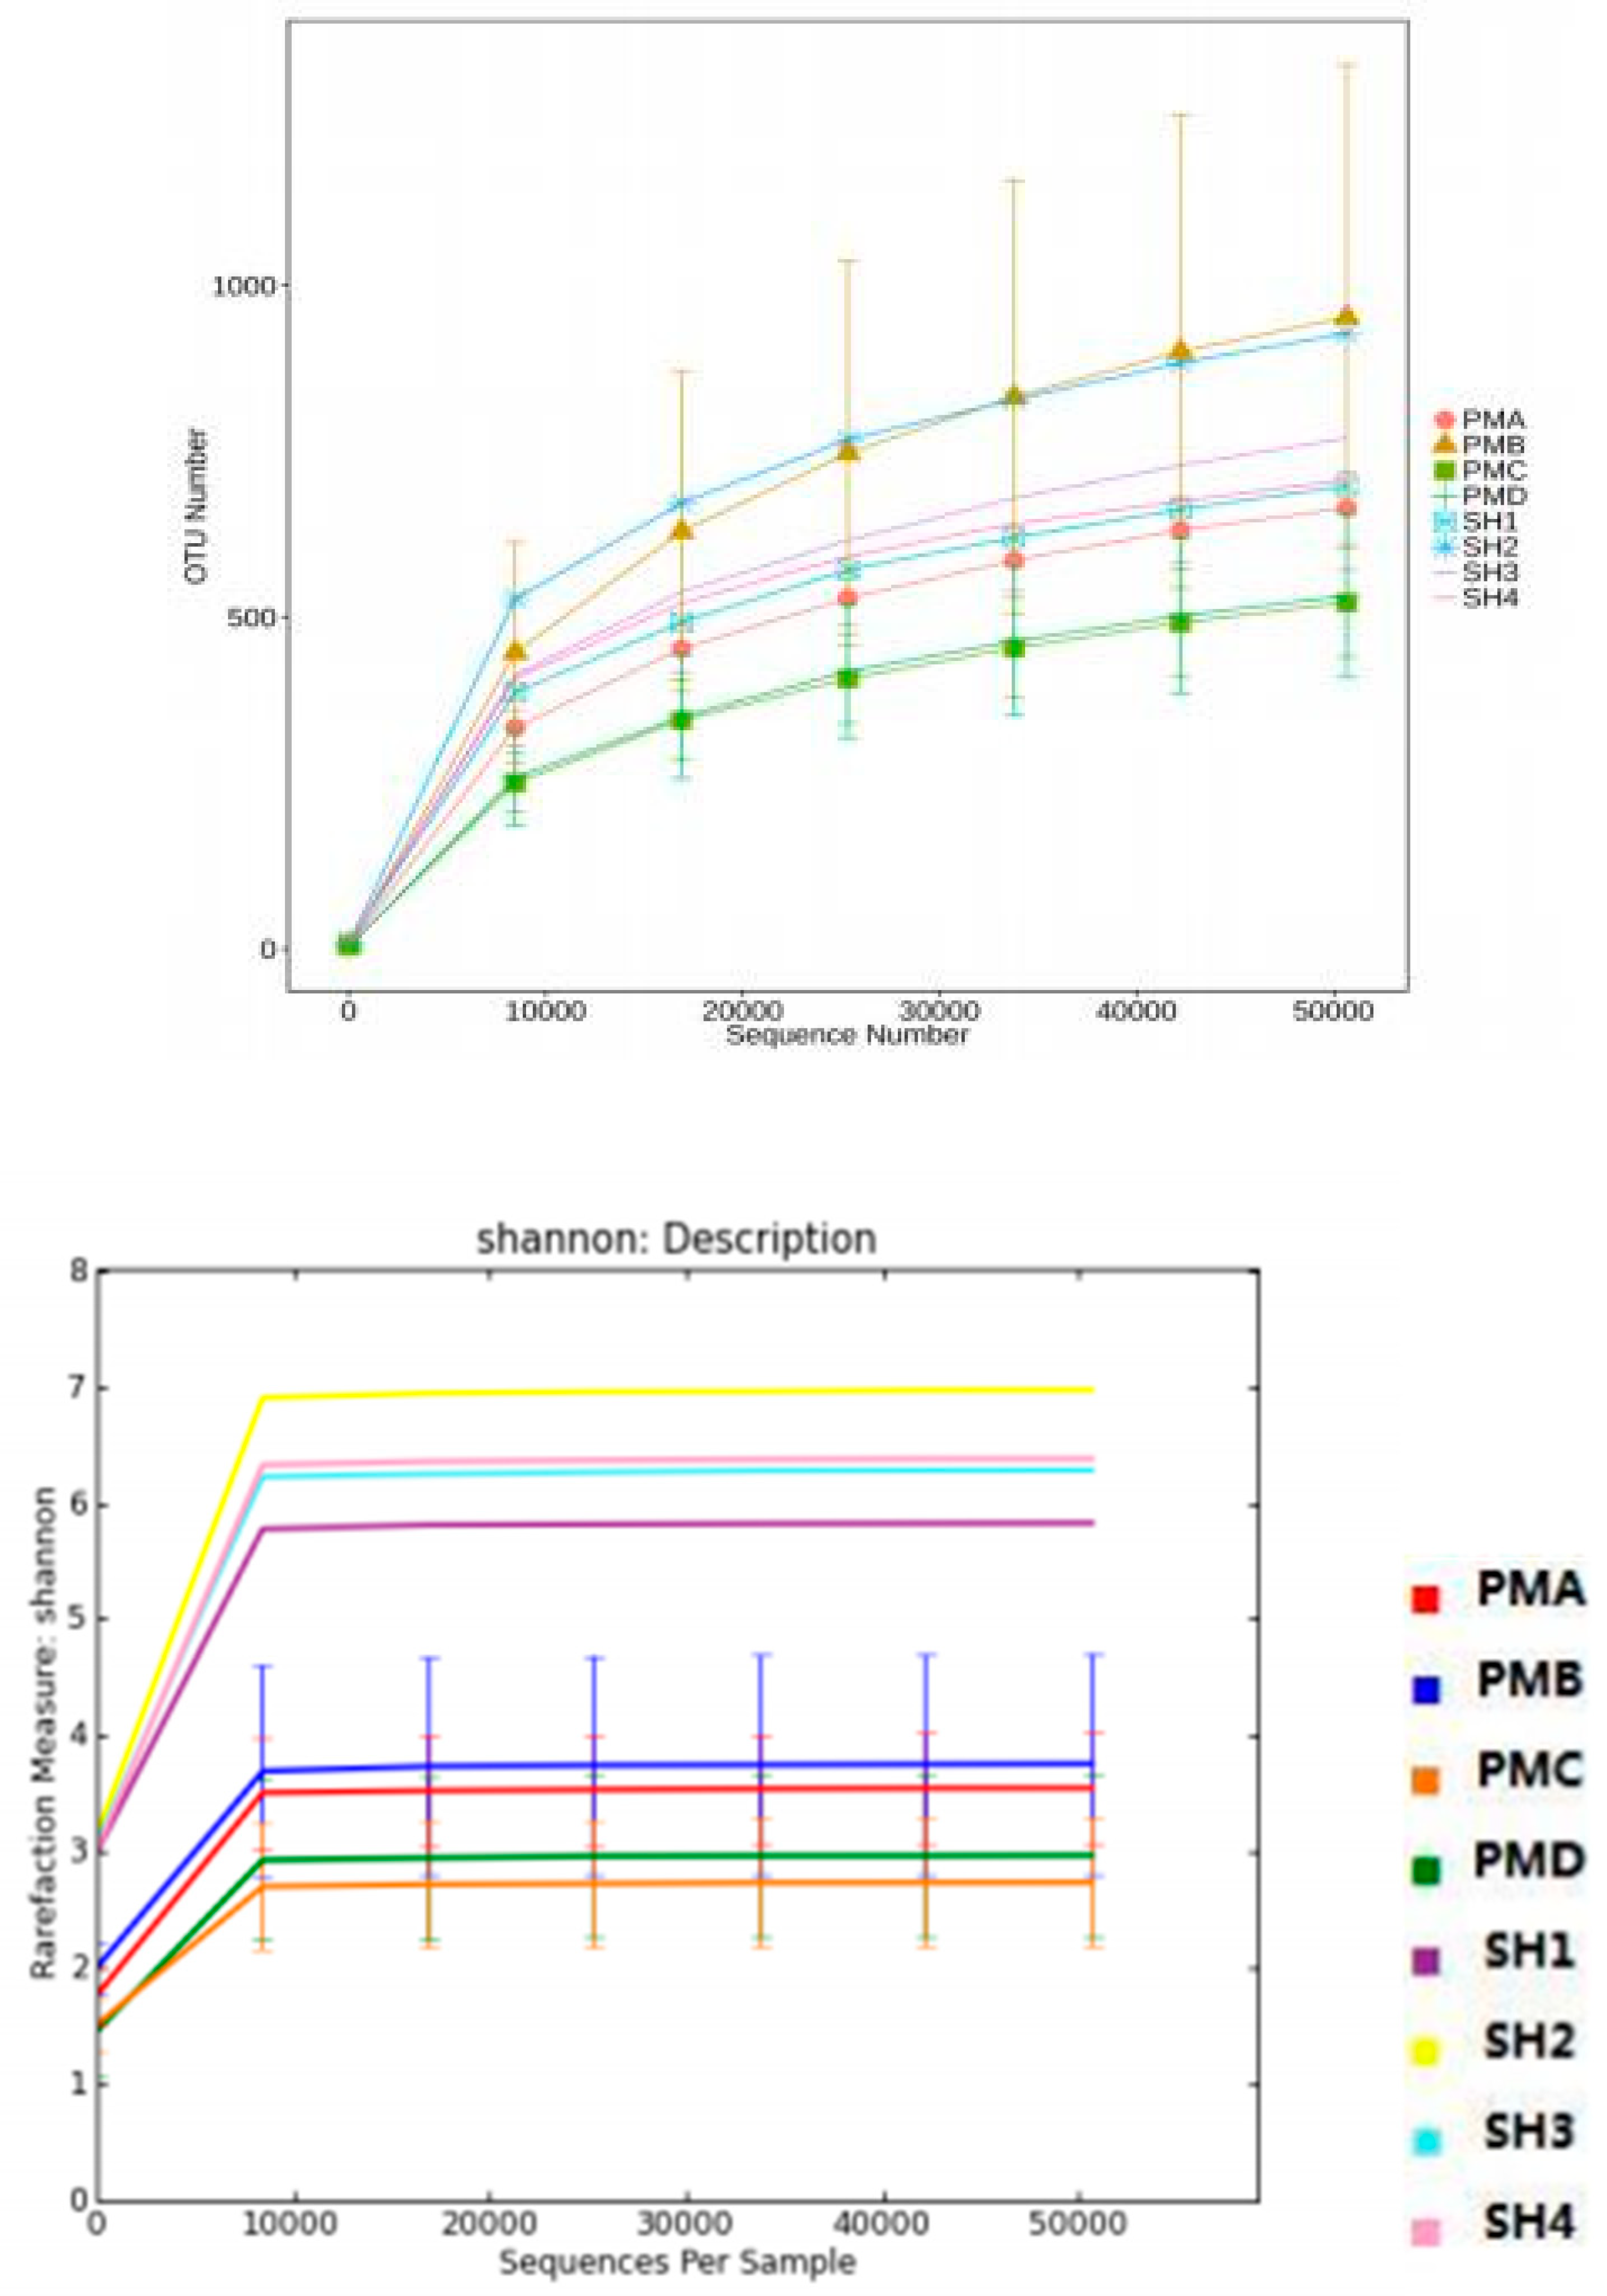
3.5.2. Alpha Diversity Curve Analysis
The dilution curve was drawn based on OTU with 97% similarity (Figure. 5 -A). When Sequence Number was greater than 40000, the dilution curve of each sample gradually leveled off, indicating that the amount of sample sequencing data was reasonable. Further increase in sequencing data would only find a few new OTUs, which would not affect the results. The Shannon curve (Figure.5-B) also stopped changing when the sequencing result of samples reached 10000, indicating that the abundance of sequencing data was sufficient and the vast majority of microbial information in the samples could be reflected. The above statements all indicate that even with the increase of sequencing amount, no other strains will appear in the sample, and the diversity of the flora will not change significantly, and the results of flora analysis are sufficient and reasonable.
Figure 5.
Analysis of dilution curve (A) and Shannon curve (B).
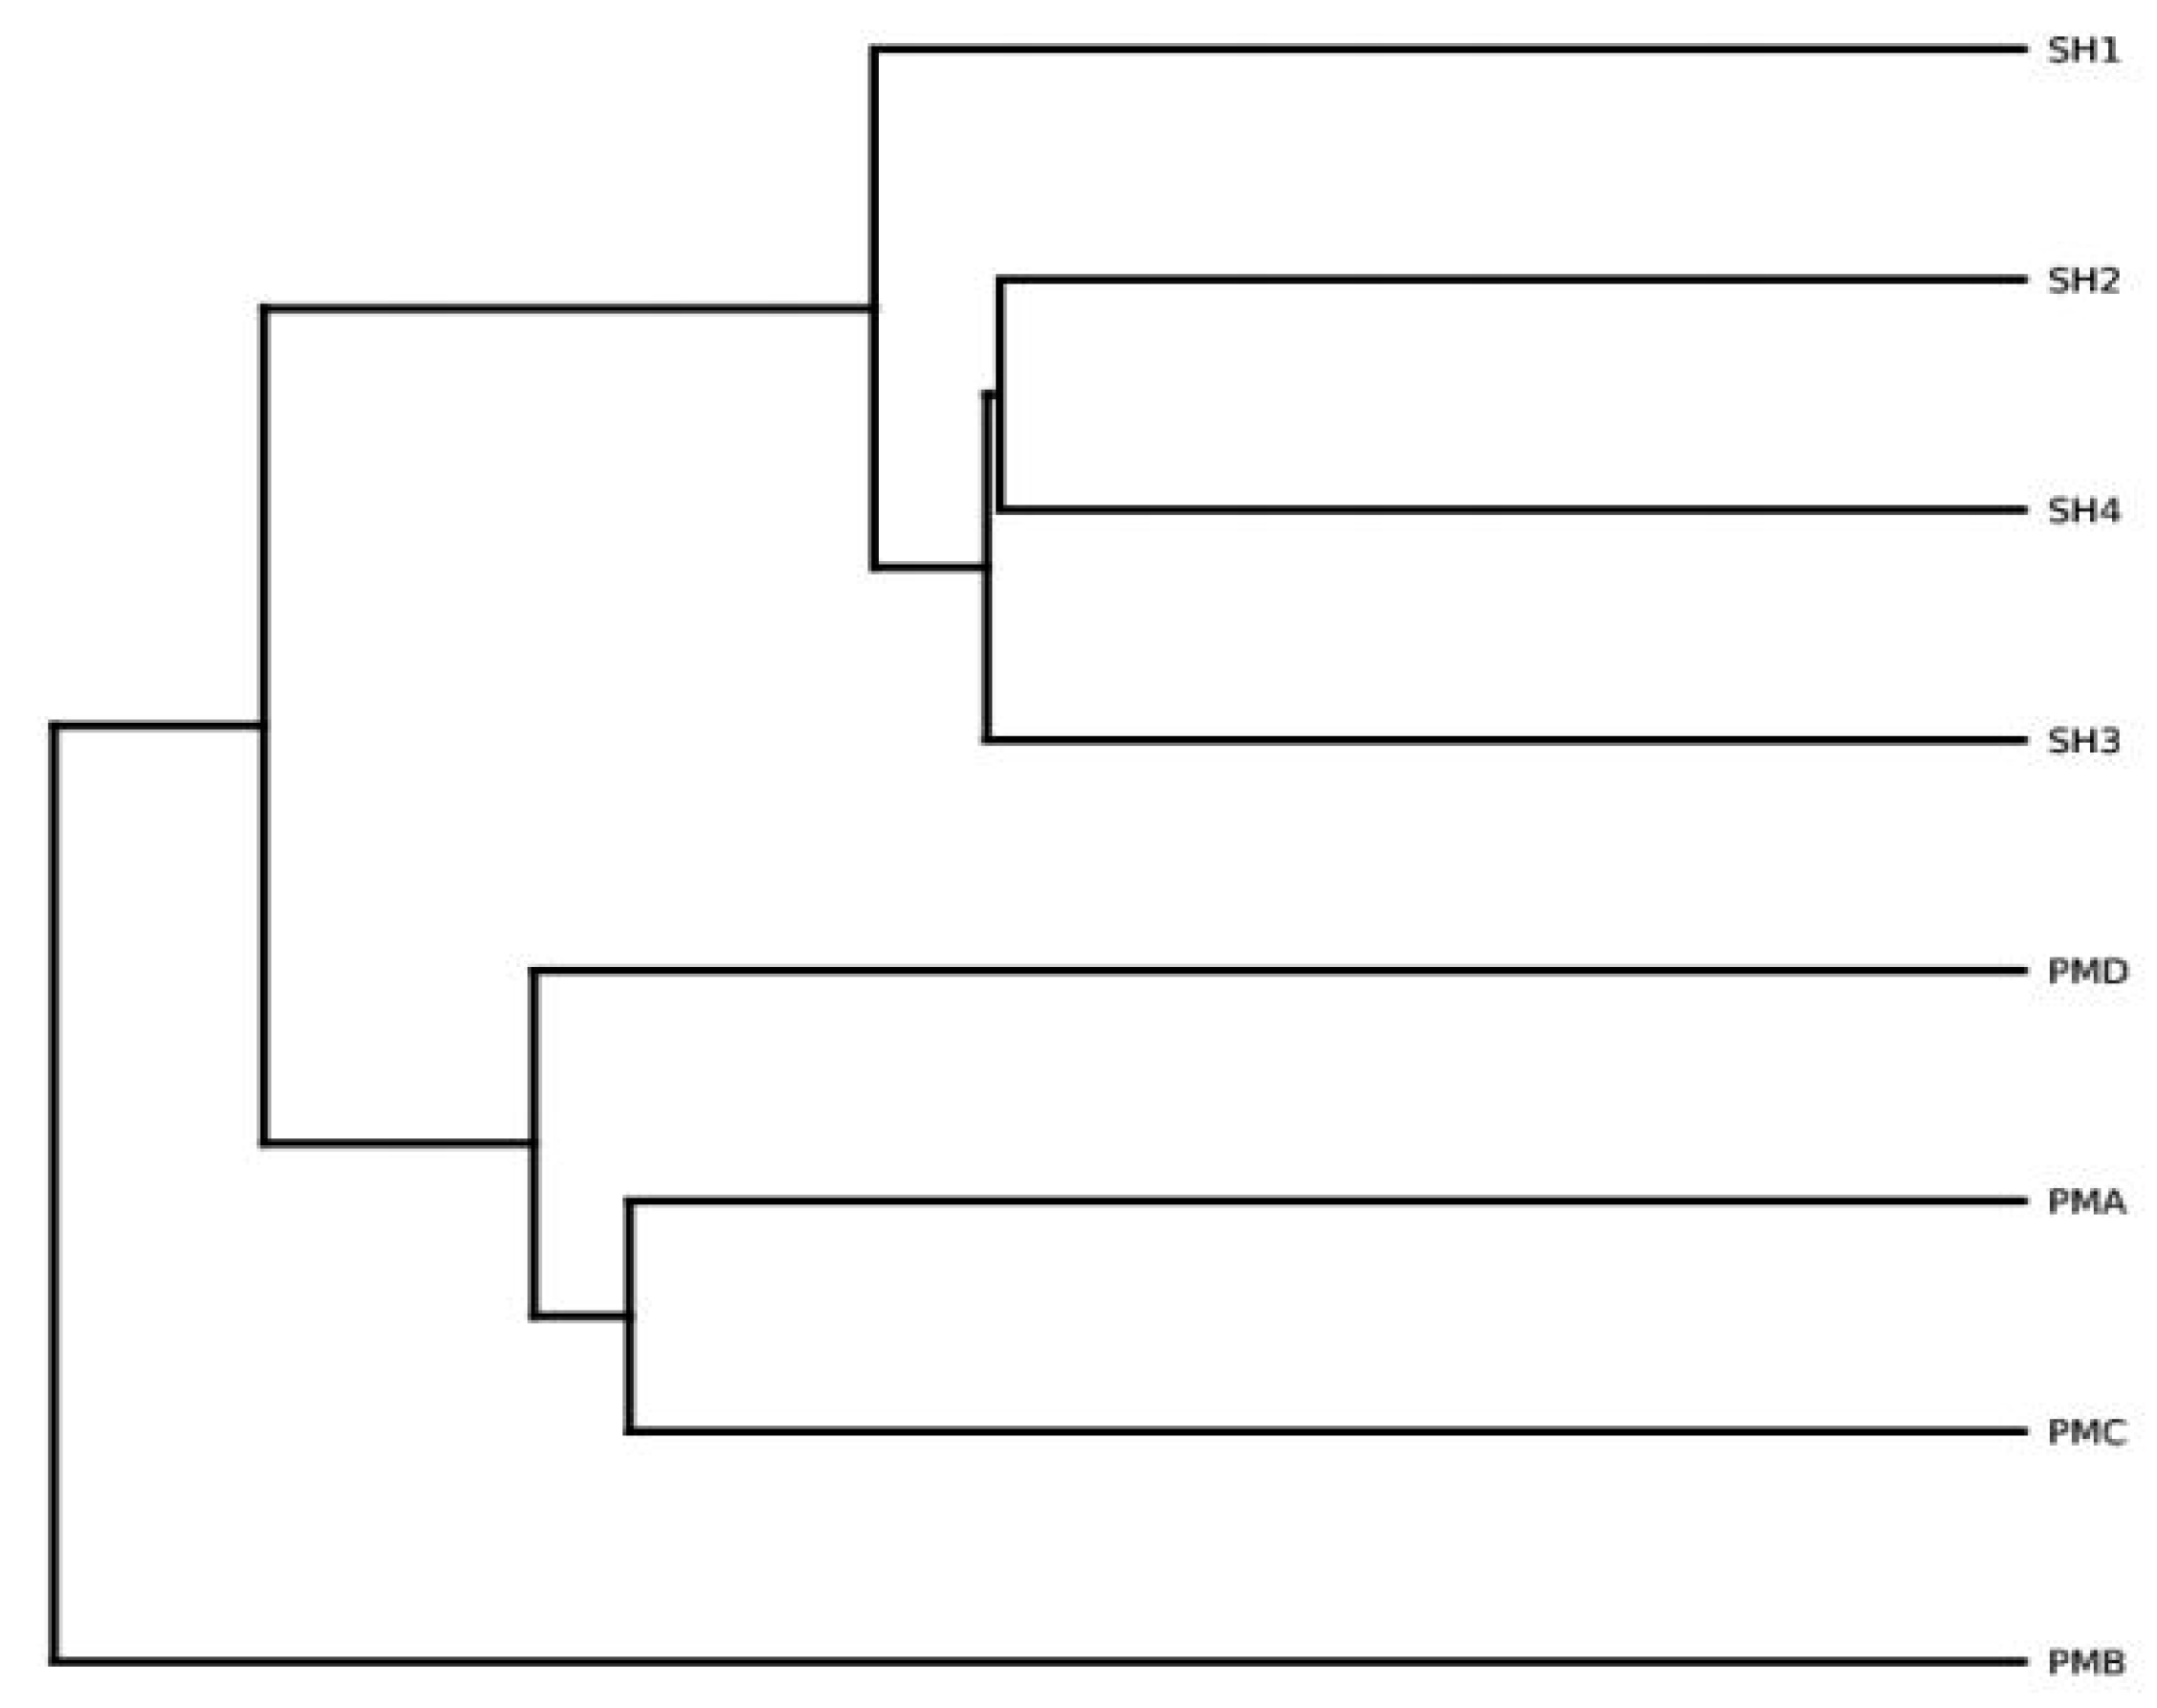
3.5.3. Species Similarity Analysis
Based on the unweighted unifrac distance matrix for multiple communities, an Unweighted species evolutionary tree showing the evolutionary relationship between the samples was constructed (Figure.6). Figure. 6 shows the species similarity between samples of intestinal flora of PenaeusPMB and its cultured water body. In the figure, the PMB group branched first from other groups, and the PMB group was significantly different from other groups. Then the water group branched off with the other three groups in the gut of penaeus prawn. It can be seen that the species evolution of microflora between the two groups was similar to some extent, but there existed also some differences. SH2 and SH4 as well as PMA and PMC had the most similar branches, that is, the species similarity was the largest.
Figure 6.
Unweighted species evolutionary tree.
4. Discussion
4.1. Water Quality Index Data Analysis
From the changes in water quality indicators in the aquaculture ponds from July to September, although the pH showed a slow downward trend, it always remained in the range of 7.5-8.1, which is suitable for aquatic animals, ensuring the basic living environment of aquatic organisms; however, the nutrient indicators such as ammonia nitrogen, nitrite nitrogen, nitrate nitrogen, total nitrogen, phosphate, and total phosphorus continued to increase with the sampling period (SH1 to SH4), especially total nitrogen (from 0.71±0.02 mg・L−1 to 1.86±0.02 mg・L−1), phosphate (from 0.05±0.012 mg・L−1 to 0.34±0.07 mg・L−1), and total phosphorus (from 0.08±0.05 mg・L−1 to 0.36±0.02 mg・L−1) accumulates more significantly in the later stages (SH3 and SH4), which is closely related to the continuous input of leftover bait and feces during the aquaculture process and the relatively insufficient self-purification capacity of the water body. Excessive accumulation of nutrients not only increases the risk of eutrophication and algal blooms in ponds, but can also affect the health and growth of aquaculture organisms through dissolved oxygen fluctuations and the secondary metabolism of harmful substances. Therefore, in the later stages of aquaculture, measures such as regular bottom soil improvement, supplementation of beneficial microorganisms, and rational regulation of feed intake are necessary to enhance water purification and nutrient balance, reduce ecological risks, and ensure aquaculture profitability.
4.2. OTU Cluster Analysis of Prawn Gut and Its Aquaculture Water Body
At the OTU level, the intestinal and water-associated microbial communities of Penaeus monodon showed clear clustering separation. Previous studies have demonstrated that the gut microbiota of shrimp is significantly different from the microbial assemblages of pond water, often forming distinct groups in clustering analyses [26,27]. The rearing water generally harbors a more complex and diverse microbiota, whereas the intestinal community undergoes host-driven selection and colonization, leading to relatively lower diversity [26]. For example, comparisons between indoor and outdoor pond systems revealed that water samples displayed higher richness and diversity than gut samples [26]. Nevertheless, the gut and water microbiota are not completely independent and share a number of common OTUs. Several dominant bacterial genera are consistently detected in both habitats, suggesting that the rearing water contributes to the intestinal community as a potential source of colonists [27,28]. Studies of the early developmental stages of P. monodon confirmed that the gut and water shared several major genera across time, though some groups remained unique to either the intestine or water [28]. This indicates that the pond environment strongly shapes the composition of intestinal microbes, but host filtering ensures that only a subset of environmental taxa can successfully colonize the gut [26,28]. Overall, while gut and water samples tend to cluster separately at the OTU level, the presence of shared OTUs highlights microbial exchange between the host and its environment [27,28]. This close relationship emphasizes the importance of water quality management: a stable and balanced pond microbiome can provide beneficial sources for the shrimp gut, whereas dysbiosis in the environment may disrupt intestinal microbial stability [27,33].
4.3. Analysis and Discussion on the Structure of Intestinal Flora of Penaeus Prawn and Its Aquaculture Water
In this paper, the high-throughput technology of the Illumina platform was used to determine the structural characteristics of the microbial communities in the intestines of Penaeus monodon and its aquaculture water. The results showed that there was a significant interaction between the intestinal flora of Penaeus monodon and its aquaculture water. A number of common bacterial genera were detected between the intestinal flora samples of Penaeus monodon and the flora samples of the polyculture pond water (Table 3), including Vibrio, Shewanella, Aeromonas, Pseudomonas, Actinobacter and other bacterial genera that were in the top ten in abundance, and other common genera that were in the top thirty bacterial genera, such as Hydrogenophaga, Photobacterium, and Brevinema. The above genera contain a variety of potential pathogenic genera, among which Vibrio accounts for the largest proportion and is the most common.
Bacteria of the genus Vibrio play a dual role in the shrimp gut, acting as both commensals and opportunistic pathogens. Under normal conditions, Vibrio constitutes a natural and often abundant component of the intestinal microbiota. In healthy P. monodon, Vibrio is frequently reported as a dominant taxon, accounting for a large proportion of the community [28,35]. For example, one study found that over 90% of the γ-Proteobacteria in healthy black tiger shrimp intestines belonged to Vibrio [35]. Similarly, Vibrio remains common across the larval and post-larval developmental stages [28]. These findings suggest that Vibrio is an integral resident taxon, potentially contributing to digestion and nutrient processing while establishing a commensal relationship with the host [29,40].
However, under adverse environmental conditions or when host immunity is weakened, commensal Vibrio can shift into an opportunistic pathogen. Many shrimp diseases-including acute hepatopancreatic necrosis disease (AHPND) and white spot syndrome virus (WSSV)-are associated with dramatic increases in intestinal Vibrio abundance [32,38]. In AHPND-infected shrimp, the gut community structure becomes highly imbalanced, with Vibrio exceeding 90% of total reads and beneficial taxa largely disappearing [38]. Stress conditions such as low salinity or pathogen challenge further accelerate Vibrio proliferation and virulence expression, damaging host health [32,38].
On the other hand, sufficient levels of beneficial commensals and host immune factors can suppress Vibrio pathogenicity. Shrimp secrete antimicrobial peptides and rely on innate immunity to prevent uncontrolled Vibrio expansion in the gut [29,31]. For instance, the crustin peptide in Litopenaeus vannamei regulates Vibrio parahaemolyticus colonization; silencing the gene encoding this peptide leads to rapid increases in intestinal Vibrio and disease onset [31]. Moreover, microbial interactions themselves contribute to control, as commensals such as lactic acid bacteria and Bacillus species can antagonize pathogenic Vibrio through competitive exclusion or production of inhibitory metabolites [40]. Collectively, Vibrio represents a paradoxical but central member of the gut microbiota: beneficial under balanced conditions, yet capable of driving disease outbreaks when dysbiosis occurs [29,32,38]. Maintaining gut homeostasis and enhancing host immune regulation are therefore critical for mitigating Vibrio-associated risks [31,40].
4.4. Analysis of Microbial Diversity in Prawn Intestine and Its Aquaculture Water
The alpha diversity of the shrimp gut microbiota was strongly influenced by host developmental stage and environmental conditions. During normal growth, intestinal diversity generally increased with age [30,36]. Longitudinal studies demonstrated that the gut community undergoes dynamic establishment in early life stages, followed by a gradual increase in richness and stability as shrimp matured [28,36]. For example, Kawasaki et al. [30] reported that the intestinal microbiota of black tiger shrimp exhibited higher richness and diversity in adults compared to juveniles, consistent with a more resilient and stable gut ecosystem.
Conversely, environmental stressors or disease outbreaks can sharply reduce gut diversity [32,38]. Sudden changes in salinity or temperature lead to significant declines in richness and diversity indices [32,33]. Under salinity stress, shrimp exhibited fewer microbial taxa and reduced Shannon diversity, coinciding with overgrowth of potential pathogens [32,33]. Similarly, diseased shrimp displayed markedly lower diversity compared to healthy individuals. In AHPND cases, the Shannon index of infected shrimp dropped by more than 50% relative to controls, indicating severe dominance by a single group (Vibrio) [38]. Reduced diversity disrupts gut ecological stability, diminishes functional redundancy, and weakens host resilience against pathogens and environmental fluctuations [38,40].
In contrast, more diverse microbiota confer functional breadth and stability, enabling suppression of opportunistic bacteria and providing comprehensive metabolic support for the host [29,40]. Thus, maintaining higher gut microbial diversity is widely regarded as a cornerstone of shrimp health and disease resistance. From a farming perspective, avoiding sudden environmental changes and applying probiotics or prebiotics to sustain community diversity are practical strategies to stabilize shrimp gut ecosystems [32,40]. In summary, the alpha diversity of P. monodon intestinal microbiota increases during host development, but declines under environmental stress or disease. Maintaining diversity and stability is critical for host resilience and aquaculture sustainability [30,32,38].
5. Conclusions
This study demonstrated that the intestinal microbiota of Penaeus monodon and the bacterial communities in mixed-culture pond water are closely linked yet distinct. Water quality parameters showed gradual changes across the culture cycle, with increasing nitrogen and phosphorus compounds indicating a higher risk of eutrophication in later stages. High-throughput sequencing revealed more than 350 OTUs in both gut and water samples, with 166 OTUs shared, reflecting both environmental seeding and host selection. Water samples exhibited higher richness and complexity, while shrimp intestines were dominated by specific taxa such as Vibrio, which play both commensal and opportunistic roles depending on environmental and host conditions. Alpha diversity patterns indicated that gut microbial diversity peaked during active growth stages and declined under stress or potential dysbiosis. Together, these findings underscore the ecological importance of gut–water microbial interactions in aquaculture systems. Effective pond management, including the maintenance of stable water quality and microbial balance, is therefore essential for sustaining shrimp health, reducing the risk of opportunistic pathogen outbreaks, and promoting the sustainable development of P. monodon culture.
Author Contributions
Conceptualization, methodology, and writing-original draft preparation, X.S. and Z.Z.; investigation, H.Y.; formal analysis, H.Z. and Y.Y.; visualization, data curation and project administration, F.Z., Y.G. and C.C.; writing-review and editing,validation, resources, supervision and funding acquisition, L.Z. and Y.T.All authors have read and agreed to the published version of the manuscript.
Funding
This study was funded by the Supported by China Agriculture Research System (CARS-47),Tianjin Marine Aquaculture Industry Technology System Innovation Team Development Project (ITTMRS2021000),Tianjin Science and Technology Plan Project (19YFZCSN00430) and Tianjin Higher Education Basic Research Funding (2021DZ006).
Institutional Review Board Statement
The study was conducted in accordance with National Standard of the People’s Republic of China:Laboratory animal - Guideline for ethical review of animal welfare(GB/T 35892-2018) on 2020-02-06.
Data Availability Statement
The data from this study are available from the corresponding author upon reasonable request.
Acknowledgments
We thank all the students whom participated the field works and laboratory analysis.
Conflicts of Interest
The authors declare no conflict of interest.
References
- Naylor, R.L.; Hardy, R.W.; Buschmann, A.H.; Bush, S.R.; Cao, L.; Klinger, D.H.; Little, D.C.; Lubchenco, J.; Shumway, S.E.; Troell, M. A 20-year retrospective review of global aquaculture. Nature. 2021, 591, 551–563. [Google Scholar] [CrossRef] [PubMed]
- Zeng, S.; Huang, Z.; Hou, D.; He, J. Intestinal Microbiota Dysbiosis and Its Association with Disease in Shrimp: A Review. Appl. Microbiol. Biotechnol. 2024, 108, 13213–13228. [Google Scholar] [CrossRef]
- Asmild, M.; Hukom, V.; Nielsen, R.; Nielsen, M. Is economies of scale driving the development in shrimp farming from Penaeus monodon to Litopenaeus vannamei?The case of Indonesia. Aquaculture. 2024, 579, 740178. [Google Scholar] [CrossRef]
- Emmanuel, A.; Wei, Y.; Ramzan, M.N.; Yang, W.; Zheng, Z. Dynamics of Bacterial Communities and Their Relationship with Nutrients in a Full-Scale Shrimp Recirculating Aquaculture System in Brackish Water. Animals. 2025, 15, 1400. [Google Scholar] [CrossRef]
- Zoqratt, M.Z.H.M.; Eng, W.W.H.; Thai, B.T.; Austin, C.M.; Gan, H.M. Microbiome Analysis of Pacific White Shrimp Gut and Rearing Water from Malaysia and Vietnam. PeerJ. 2018, 6, e5826. [Google Scholar] [CrossRef]
- Abakari, G.; Wu, X.; He, X.; Fan, L.; Luo, G. Bacteria in Biofloc Technology Aquaculture Systems: Roles and Mediating Factors. Rev. Aquaculture. 2022, 14, 1260–1284. [Google Scholar] [CrossRef]
- Holt, C.C.; Bass, D.; Stentiford, G.D.; van der Giezen, M. Understanding the Role of the Shrimp Gut Microbiome in Aquaculture. J. Fish Dis. 2021, 44, 1109–1123. [Google Scholar] [CrossRef]
- Fan, J.; Wang, J.; Chen, L.; et al. Dynamics of the Gut Microbiota in Developmental Stages of Shrimp. Sci. Rep. 2019, 9, 5182. [Google Scholar] [CrossRef]
- Imaizumi, K.; Sakamoto, R.; Inoue, Y.; et al. Analysis of Microbiota in the Stomach and Midgut of Two Penaeid Shrimps during Probiotic Feeding. Sci. Rep. 2021, 11, 9936. [Google Scholar] [CrossRef]
- Cardona, E.; Gueguen, Y.; Magré, K.; et al. Bacterial Community Characterization of Water and Intestine of the Shrimp Litopenaeus stylirostris in a Biofloc System. BMC Microbiol. 2016, 16, 157. [Google Scholar] [CrossRef]
- Lin, X.Y.; Wang, J.; Zhao, L.; et al. Temporal Dynamics of Shrimp Gut Microbiota Following Probiotic/Herbal Treatment. Front. Mar. Sci. 2024, 10, 1332585. [Google Scholar] [CrossRef]
- Chang, Y.T.; Chen, I.T.; Li, C.Y.; et al. Gut Microbiota Dynamics in Shrimp Infected with Pathogenic vs. Non-Pathogenic Vibrio parahaemolyticus. mSystems. 2023, 8, e00447–23. [Google Scholar] [CrossRef]
- Angthong, P.; Uengwetwanit, T.; Uawisetwathana, U.; et al. Investigating Host–Gut Microbial Relationship in Penaeus monodon upon Exposure to Vibrio harveyi. Aquaculture. 2023, 567, 739252. [Google Scholar] [CrossRef]
- Hou, D.; Huang, Z.; Zeng, S.; et al. Intestine Bacterial Community Composition of Shrimp Varies under Low- and High-Salinity Culture Conditions. Front. Microbiol. 2020, 11, 589164. [Google Scholar] [CrossRef] [PubMed]
- Cicala, F.; Lago-Lestón, A.; Gomez-Gil, B.; et al. Gut Microbiota Shifts in the Giant Tiger Shrimp Penaeus monodon during Ontogenetic Development. Aquac. Int. 2020, 28, 1421–1433. [Google Scholar] [CrossRef]
- Cornejo-Granados, F.; Lopez-Zavala, A.A.; Gallardo-Becerra, L.; et al. Host Genome Drives the Microbiota Enrichment of Beneficial Shrimp Strains. Anim. Microbiome. 2025, 7, 14. [Google Scholar] [CrossRef]
- Li, H.; Zhou, L.; Xu, W.; et al. Dynamic Changes of Environment and Gut Microbial Community of Litopenaeus vannamei in Greenhouse Farming. Fishes. 2024, 9, 155. [Google Scholar] [CrossRef]
- Khanjani, M.H.; Ghaedi, A.; Rastegar, M.; et al. Probiotics, Prebiotics, and Synbiotics in Shrimp Aquaculture: Growth, Immunity, and Disease Resistance. Aquaculture. 2024, 580, 738651. [Google Scholar] [CrossRef]
- Raza, B.; Zhang, K.; Wang, L.; et al. Microbes and Their Effect on Growth Performance of Litopenaeus vannamei in Biofloc Systems: A Review. Microorganisms. 2024, 12, 1013. [Google Scholar] [CrossRef]
- Shan, X.; Zhang, W.; Wang, Y.; et al. Microbiome Determinants of Productivity in Shrimp Aquaculture. Appl. Environ. Microbiol. 2025, 91, e02420–24. [Google Scholar] [CrossRef]
- Li, M.; Xu, H.; Zhang, C.; et al. Profile of the Gut Microbiota of Pacific White Shrimp under Industrial Indoor Farming System. Appl. Microbiol. Biotechnol. 2024, 108, 225–239. [Google Scholar] [CrossRef] [PubMed]
- Zhang, S.; Xiong, J.; Li, C.; et al. Core Gut Microbiota of Shrimp Function as a Regulator to Maintain Intestinal Homeostasis and Promote Health. Microbiol. Spectr. 2022, 10, e02465–21. [Google Scholar] [CrossRef] [PubMed]
- Zhou, Z.; Huang, Z.; Zhang, Y.; et al. Postlarval Shrimp-Associated Microbiota and Ecological Processes over AHPND Progression. Microorganisms. 2025, 13, 720. [Google Scholar] [CrossRef] [PubMed]
- Wang, Y.; Wang, X.; Gai, C.; et al. WSSV Infection in the Gut Microbiota of the Black Tiger Shrimp Penaeus monodon. Fishes. 2025, 10, 440. [Google Scholar] [CrossRef]
- Huang, Z.; Zeng, S.; Hou, D.; et al. Microecological Koch’s Postulates Reveal that Intestinal Microbiota Dysbiosis Contributes to Shrimp White Feces Syndrome. ISME J. 2020, 14, 1630–1641. [Google Scholar] [CrossRef]
- Duan, Y.; Huang, J.; Wang, Y.; Zhang, J. Characterization of bacterial community in intestinal and rearing water of Penaeus monodon differing growth performances in outdoor and indoor ponds. Aquaculture Research 2020, 51, 4376–4387. [Google Scholar] [CrossRef]
- Angthong, P.; Uengwetwanit, T.; Arayamethakorn, S.; Chaitongsakul, P.; Karoonuthaisiri, N.; Rungrassamee, W. Bacterial analysis in the early developmental stages of the black tiger shrimp (Penaeus monodon). Scientific Reports 2020, 10, 4896. [Google Scholar] [CrossRef]
- Garibay-Valdez, E.; Martínez-Córdova, L.R.; López-Torres, M.A.; Almendariz-Tapia, F.J.; Martínez-Porchas, M.; Calderón, K. The implication of metabolically active Vibrio spp. in the digestive tract of Litopenaeus vannamei for its post-larval development. Scientific Reports 2020, 10, 11428. [Google Scholar] [CrossRef]
- Kawasaki, M.; Lo, T.H.W.; Lazzarotto, V.; Briggs, M.; Smullen, R.P.; Barnes, A.C. Biodiversity of the intestinal microbiota of black tiger prawn (Penaeus monodon) increases with age and is only transiently impacted by major ingredient replacement in the diet. Aquaculture Reports 2022, 22, 100948. [Google Scholar] [CrossRef]
- Lv, X.; Li, S.; Yu, Y.; Zhang, X.; Li, F. Crustin Defense against Vibrio parahaemolyticus Infection by Regulating Intestinal Microbial Balance in Litopenaeus vannamei. Marine Drugs 2023, 21, 130. [Google Scholar] [CrossRef]
- Chang, Y.-T.; Huang, W.-T.; Wu, P.-L.; Kumar, R.; Wang, H.-C.; Lu, H.-P. Low salinity stress increases the risk of Vibrio parahaemolyticus infection and gut microbiota dysbiosis in Pacific white shrimp. BMC Microbiology 2024, 24, 275. [Google Scholar] [CrossRef]
- Mat Deris, Z.; Iehata, S.; Gan, H.M.; Ikhwanuddin, M.; Najiah, M.; Asaduzzaman, M.; et al. Understanding the effects of salinity and Vibrio harveyi on the gut microbiota profiles of Litopenaeus vannamei. Frontiers in Marine Science 2022, 9, 974217. [Google Scholar] [CrossRef]
- Liao, M.; Liao, X.; Long, X.; Zhao, J.; He, Z.; Zhang, J.; Wu, T.; Sun, C. Vibrio alginolyticus Infection Induces Coupled Changes of Bacterial Community and Metabolic Phenotype in the Gut of Swimming Crab. Aquaculture 2019, 499, 251–259. [Google Scholar] [CrossRef]
- Rungrassamee, W.; Klanchui, A.; Maibunkaew, S.; Chaiyapechara, S.; Jiravanichpaisal, P.; Karoonuthaisiri, N. Bacterial population in intestines of the black tiger shrimp (Penaeus monodon) under different growth stages. PLoS ONE, 2013, 8, e60802. [Google Scholar] [CrossRef] [PubMed]
- Fan, J.; Qi, L.; Fu, L.; Tian, M.; Zhang, X.; Bao, Y.; Zhao, Y. Dynamics of the gut microbiota in developmental stages of Litopenaeus vannamei and its association with body weight. Scientific Reports 2019, 9, 734. [Google Scholar] [CrossRef] [PubMed]
- Xiong, J.; Zhu, J.; Dai, W.; Dong, C.; Qiu, Q.; Li, C. The underlying ecological processes of gut microbiota among cohabitating retarded, overgrown and normal shrimp. Microbial Ecology 2017, 73, 988–999. [Google Scholar] [CrossRef] [PubMed]
- Dong, P.; Guo, H.; Wang, Y.; Wang, R.; et al. Gastrointestinal microbiota imbalance is triggered by the enrichment of Vibrio in subadult Litopenaeus vannamei with acute hepatopancreatic necrosis disease. Aquaculture 2021, 533, 736199. [Google Scholar] [CrossRef]
- Zhang, S.; Sun, X. Core Gut Microbiota of Shrimp Function as a Regulator to Maintain Immune Homeostasis in Response to WSSV Infection. Microbiology Spectrum 2023, 11(3), e01180–23. [Google Scholar] [CrossRef]
- Zhou, K.; Liu, P.-P.; Yao, J.-Y.; Vasta, G.R.; Wang, W.; Zhang, X. Shrimp Intestinal Microbiota Homeostasis: Dynamic Interplay Between the Microbiota and Host Immunity. Reviews in Aquaculture 2025, 17(1), e12986. [Google Scholar] [CrossRef]
Figure 2.
Histogram of the relative abundance of top10 species at the phylum level.
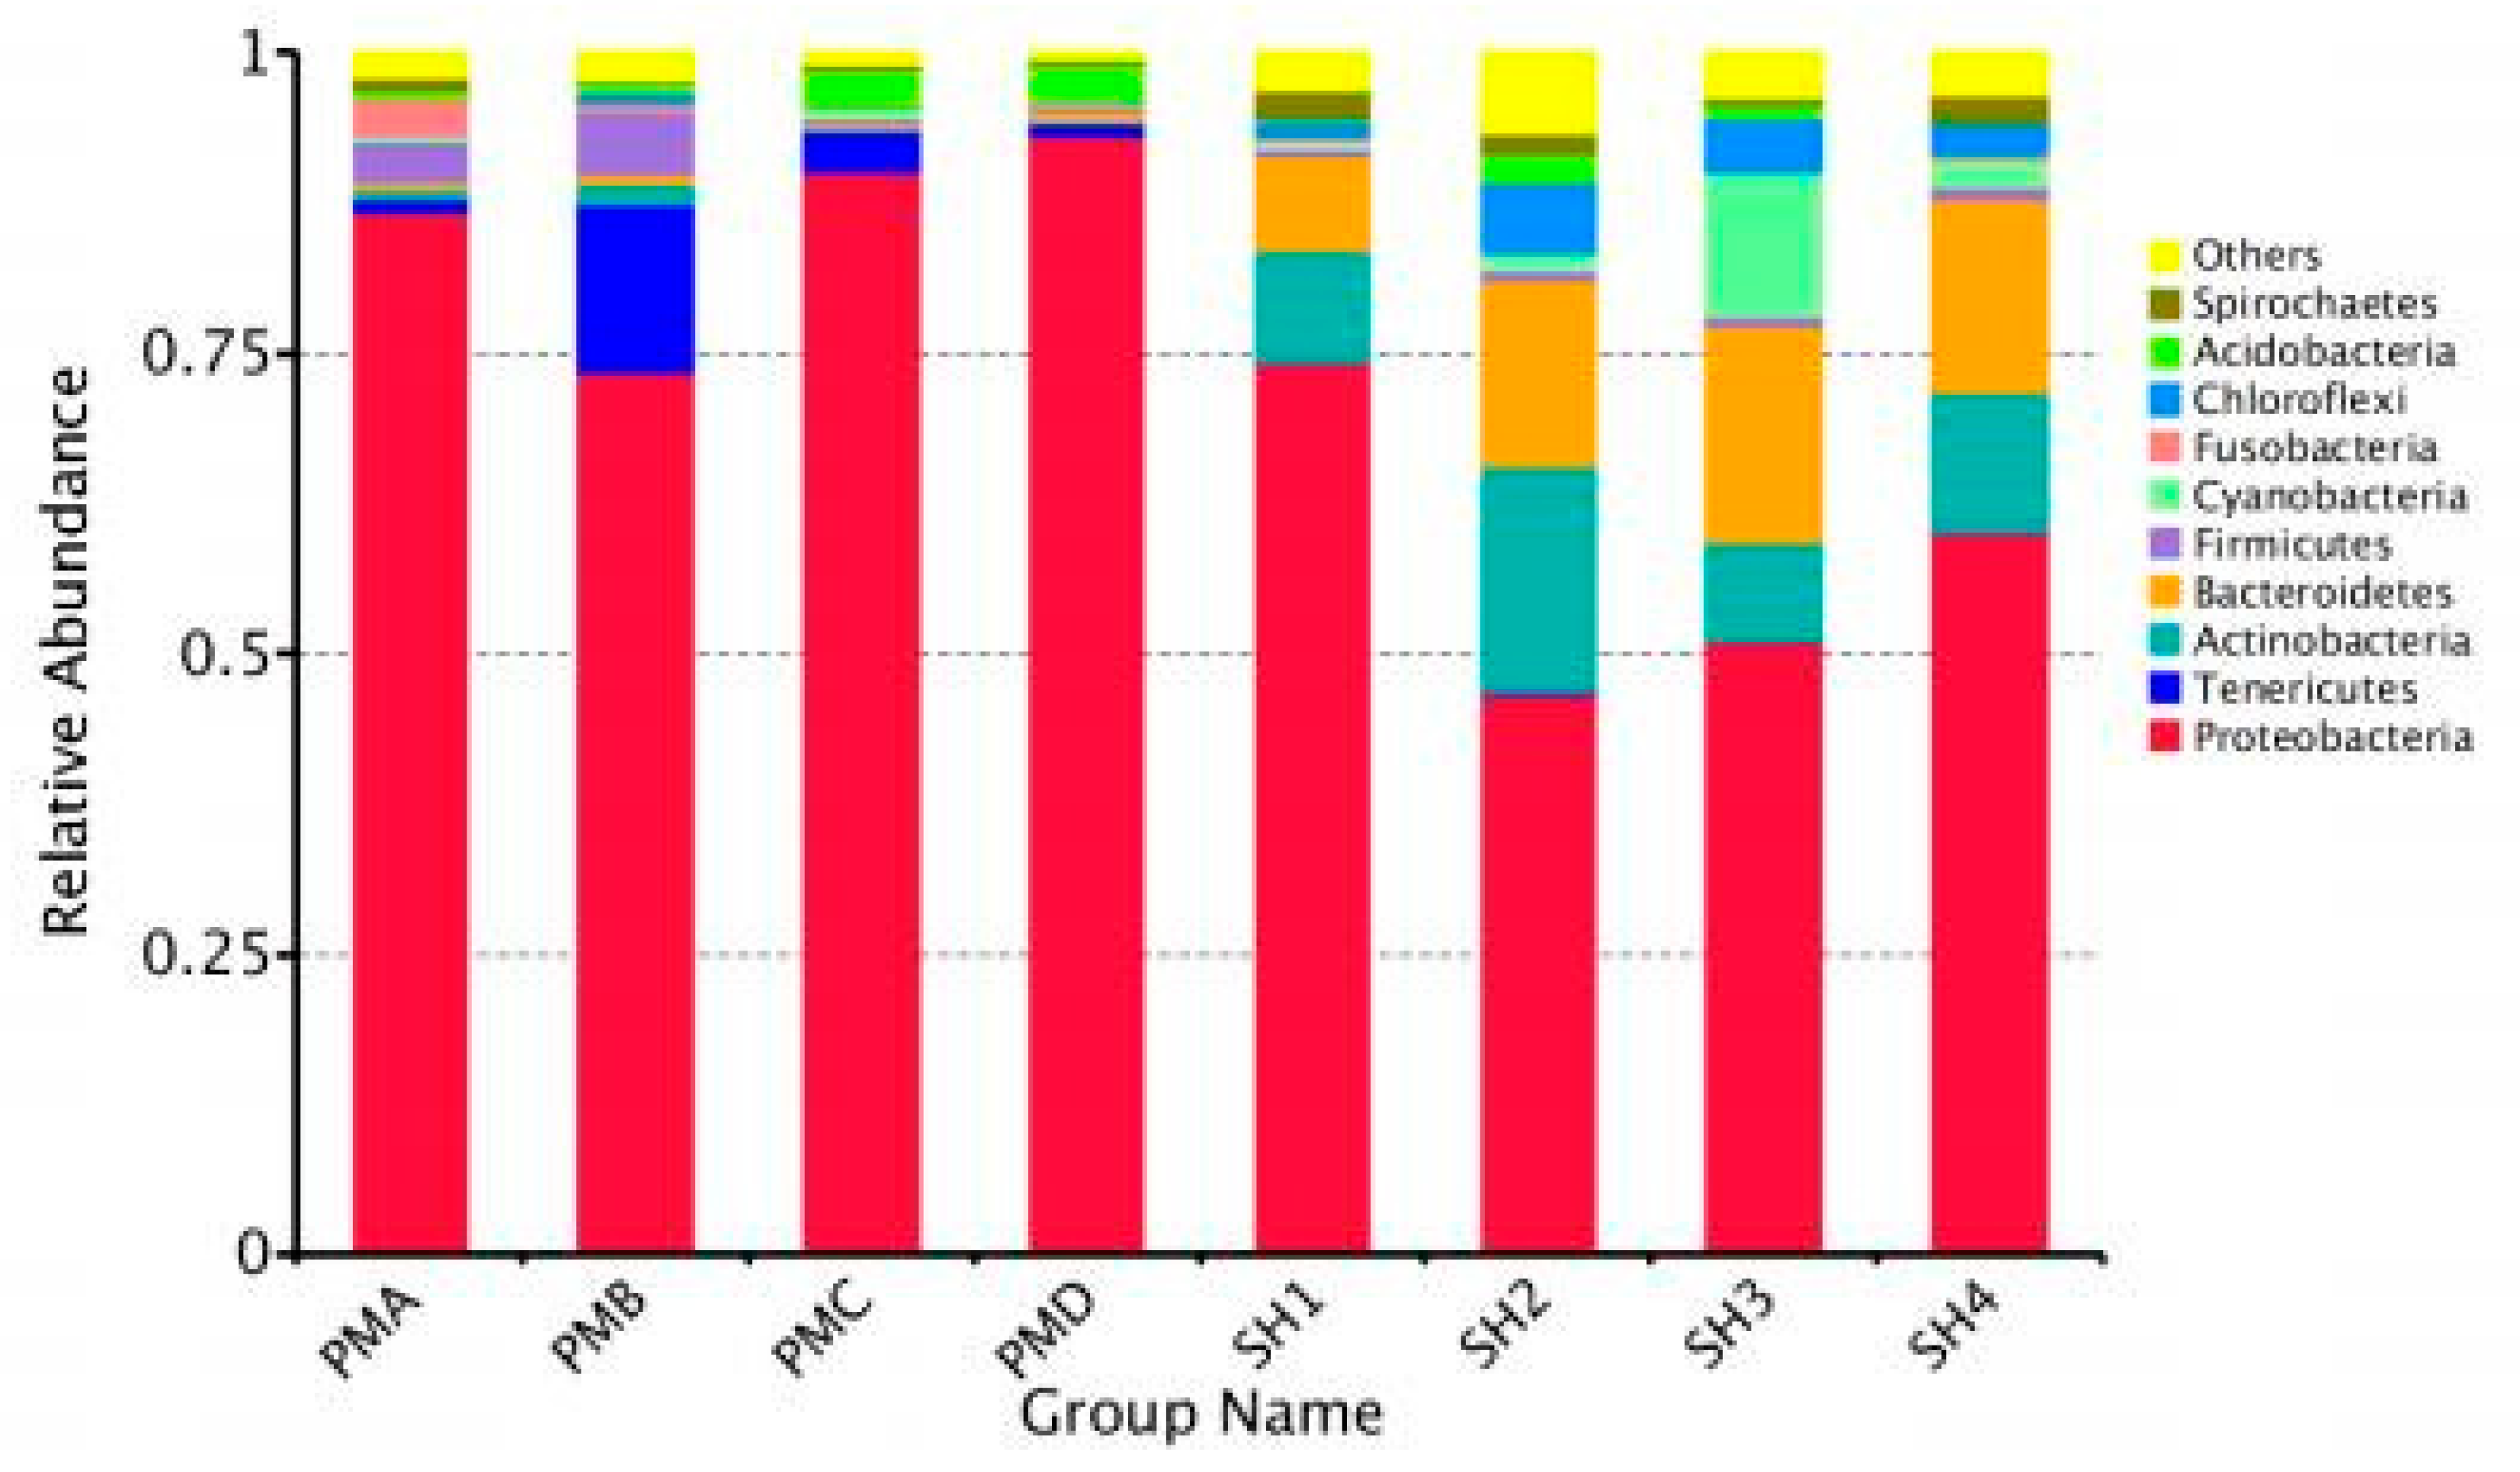
Figure 3.
Clustering heat map of species abundance at order level.
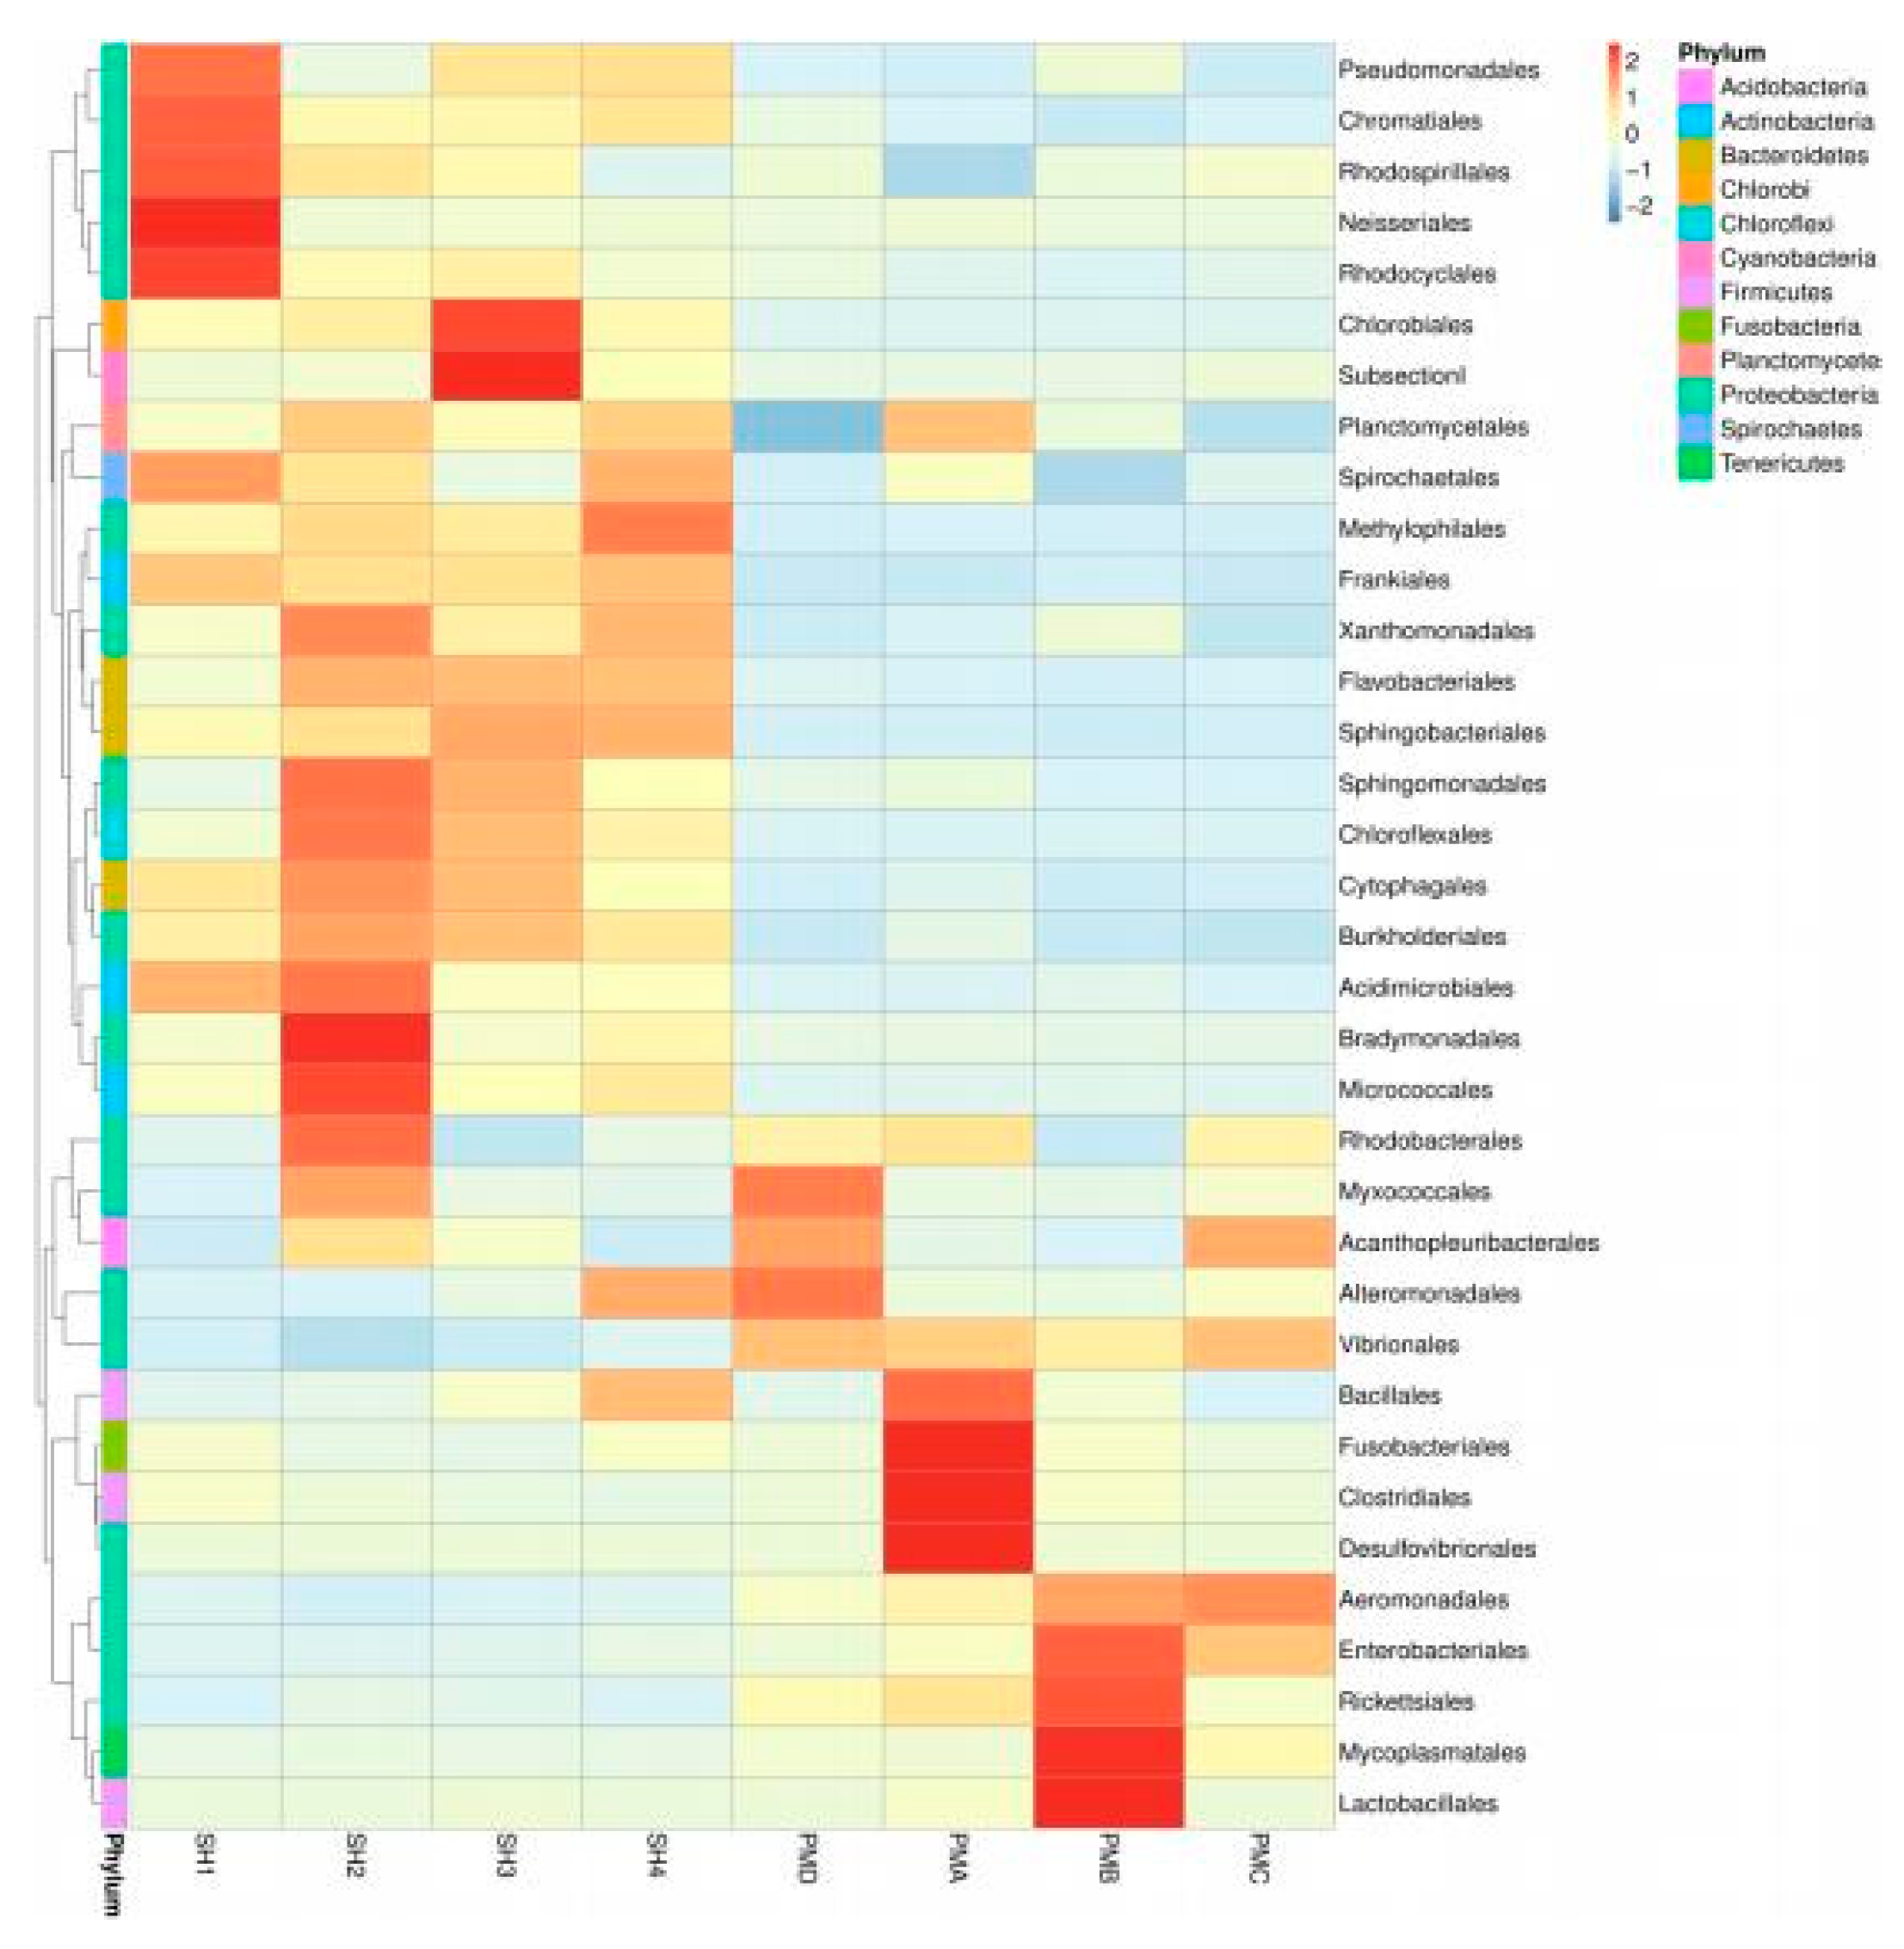
Figure 4.
Histogram of relative abundance of top30 species at the genus level.
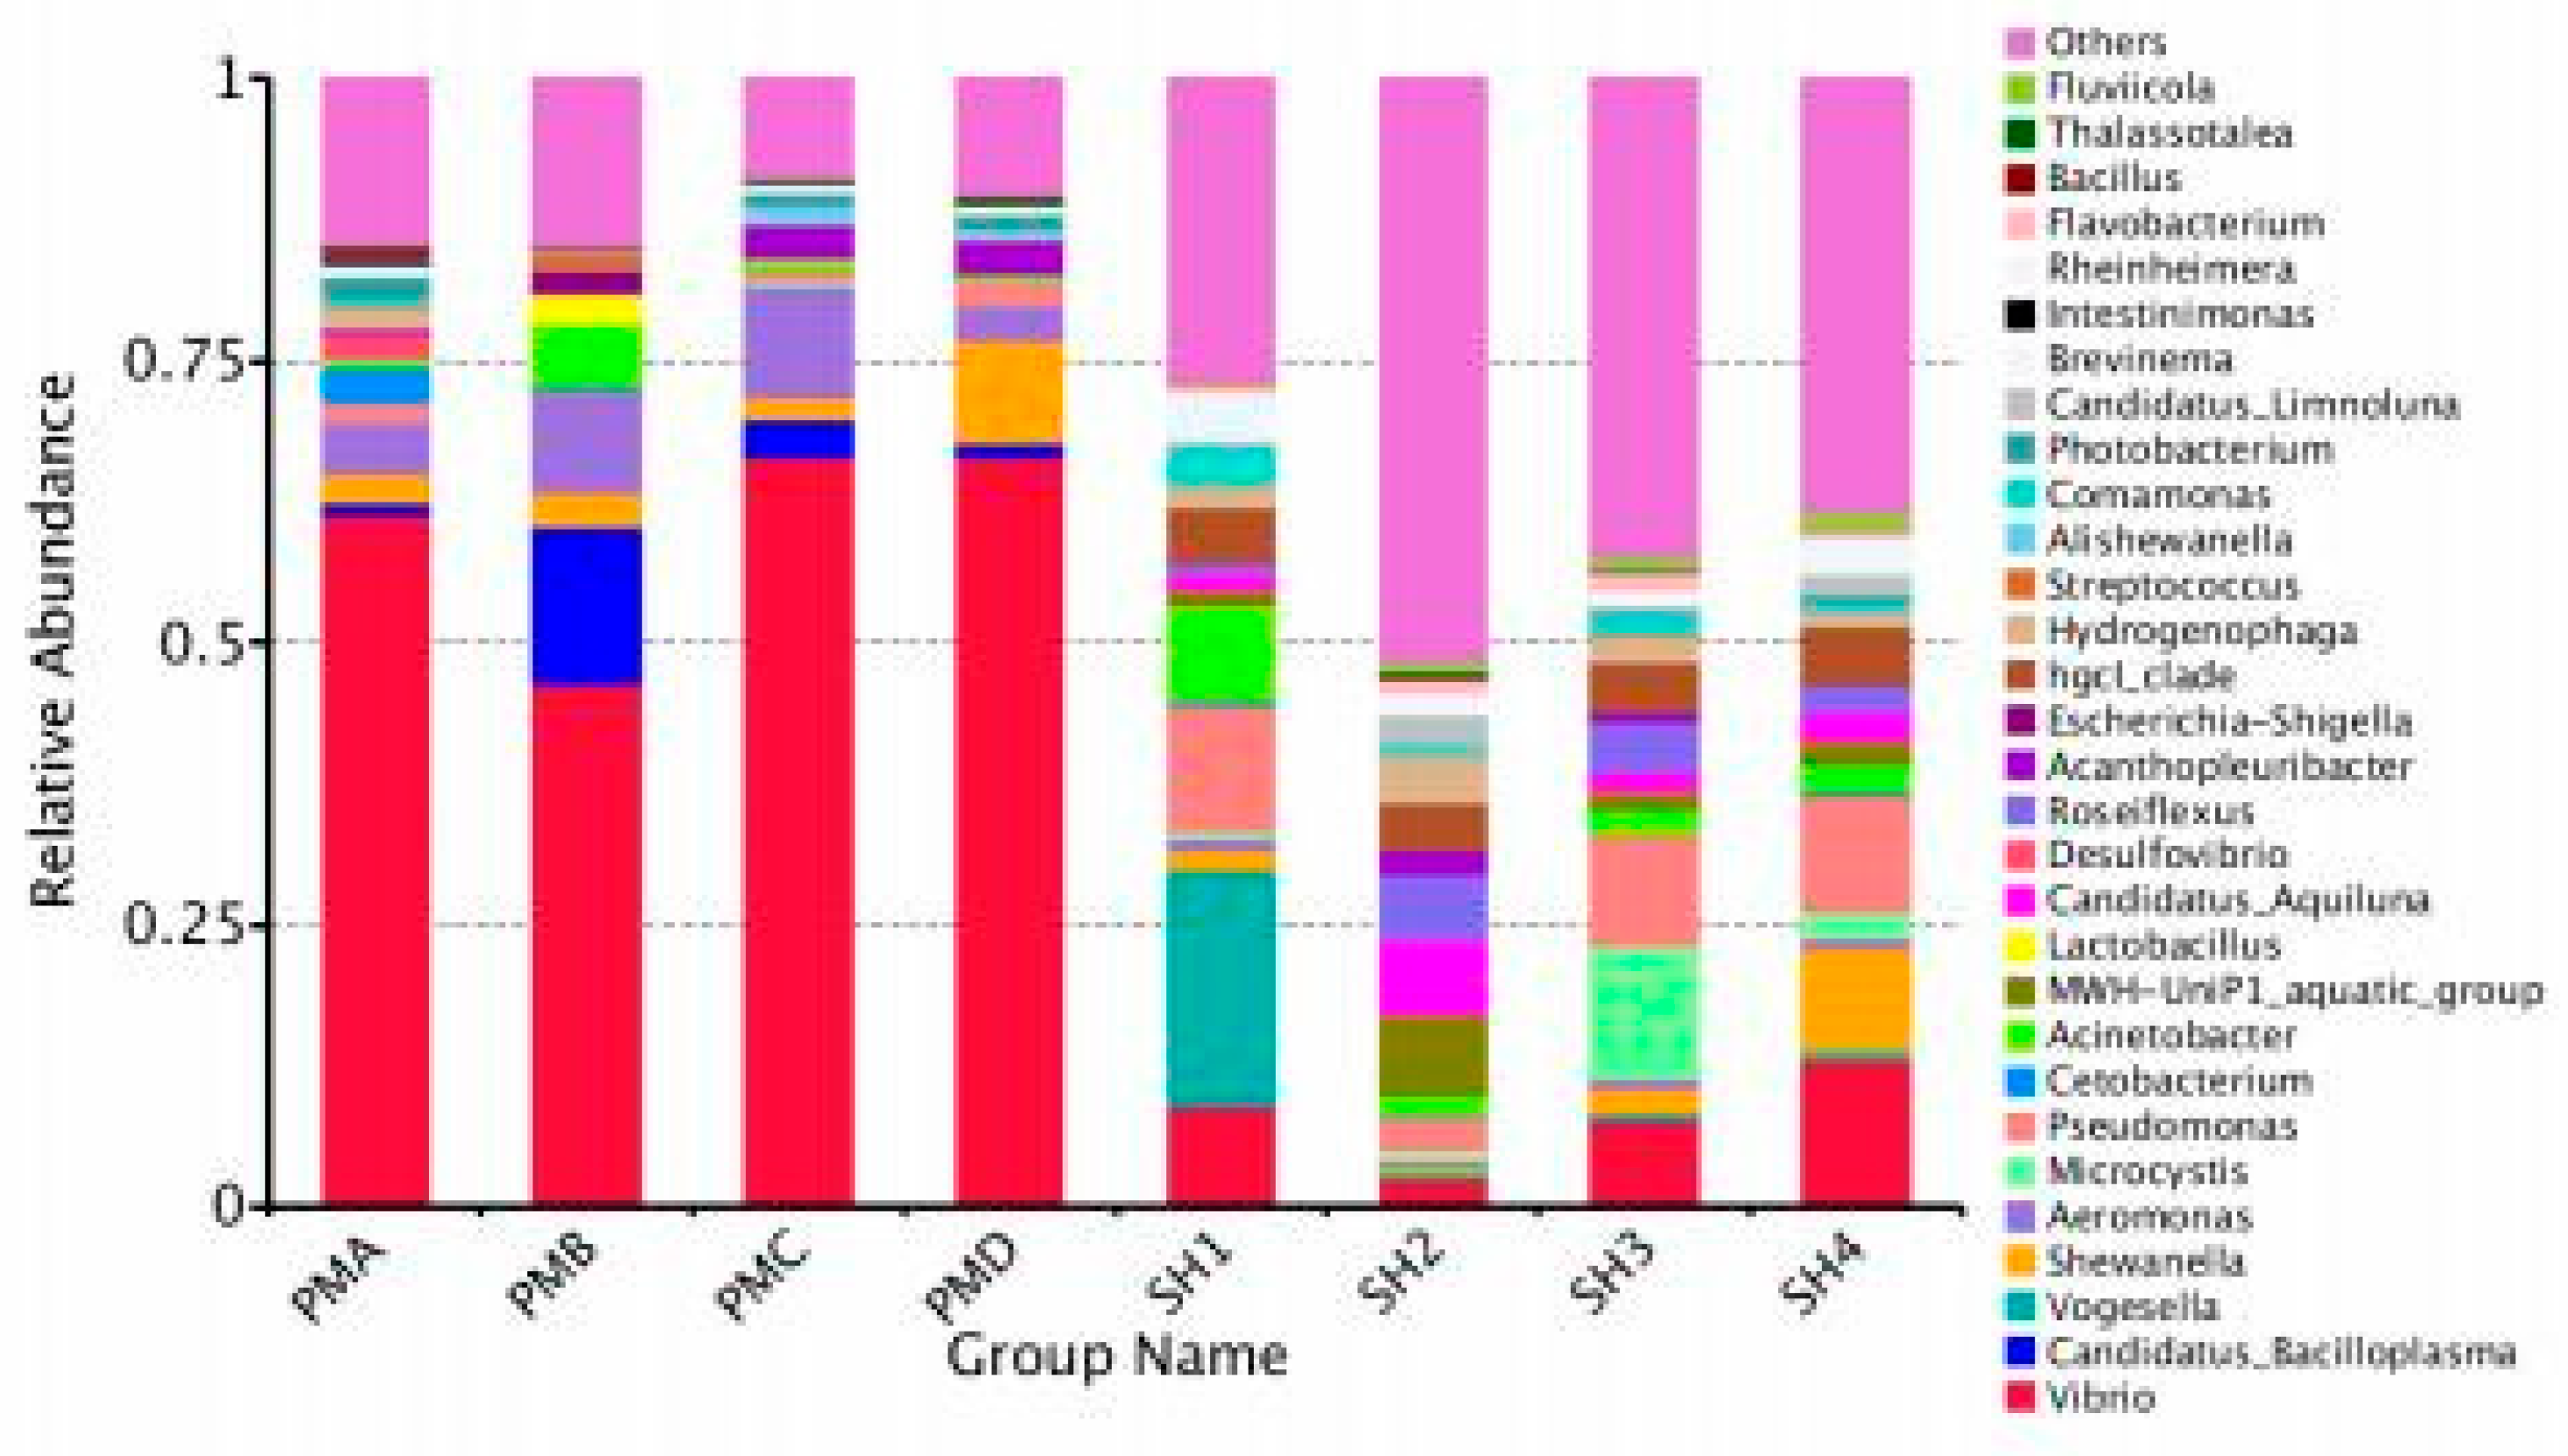
Table 2.
Statistical table of sample sequence.
|
Sample Names |
Valid sequence | Avg Len (nt) | Q20 | Q30 | GC% | Effective% |
| PMA | 84067 | 253 | 99.12 | 98.23 | 52.90 | 88.77 |
| PMB | 85093 | 253 | 99.29 | 98.58 | 52.32 | 89.15 |
| PMC | 84922 | 253 | 99.34 | 98.65 | 52.94 | 92.32 |
| PMD | 84456 | 253 | 99.30 | 98.59 | 53.10 | 90.51 |
| SH1 | 89203 | 253 | 99.34 | 98.60 | 53.80 | 91.43 |
| SH2 | 84365 | 253 | 99.34 | 98.61 | 53.57 | 94.68 |
| SH3 | 87808 | 253 | 99.31 | 98.58 | 53.49 | 93.27 |
| SH4 | 79681 | 253 | 99.31 | 98.57 | 53.33 | 90.74 |
Table 3.
Statistical table of OTUs clustering and annotation.
| Sample Names | Total_tag | Taxon_Tag | Unique_Tag | OTU_num |
| PMA | 81853 | 80778 | 1069 | 784 |
| PMB | 75182 | 73775 | 1407 | 1119 |
| PMC | 79882 | 79326 | 555 | 638 |
| PMD | 81857 | 81259 | 596 | 651 |
| SH1 | 83173 | 80554 | 2617 | 812 |
| SH2 | 81583 | 79317 | 2266 | 1071 |
| SH3 | 83688 | 81546 | 2142 | 881 |
| SH4 | 73983 | 71725 | 2258 | 821 |
Table 4.
The proportion of the top ten dominant bacteria genera in the gut of Penaeus monodon and cultured water.
Table 4.
The proportion of the top ten dominant bacteria genera in the gut of Penaeus monodon and cultured water.
| Classification | PMA | PMB | PMC | PMD | SH1 | SH2 | SH3 | SH4 |
| Vibrio genus Candidatus_Bacilloplasma |
61.48% | 46.51% | 66.48% | 66.52% | 9.04% | 2.45% | 7.83% | 13.15% |
| Candidatus | 0.99% | 13.87% | 3.38% | 1.19% | 0.00% | 0.01% | 0.00% | 0.00% |
| Vogesella | 0.01% | 0.00% | 0.00% | 0.00% | 20.92% | 0.66% | 0.67% | 0.72% |
| Shewanella | 2.54% | 2.88% | 1.99% | 9.10% | 1.71% | 0.59% | 1.96% | 9.07% |
| Aeromonas SPP | 4.61% | 8.87% | 9.76% | 3.12% | 1.09% | 0.42% | 0.95% | 1.02% |
| Microcystis | 0.03% | 0.02% | 0.51% | 0.03% | 0.69% | 0.93% | 11.76% | 2.21% |
| Pseudomonas | 1.65% | 0.32% | 1.01% | 2.09% | 11.21% | 3.05% | 10.04% | 10.43% |
| Cetobacterium sporomonas | 3.27% | 0.44% | 0.16% | 0.20% | 0.36% | 0.03% | 0.01% | 0.46% |
| Acinetobacter Actinomyces | 0.70% | 5.46% | 0.94% | 0.54% | 8.39% | 1.71% | 2.11% | 2.17% |
| Others Others | 24.70% | 21.63% | 15.75% | 17.21% | 45.25% | 82.92% | 63.03% | 58.62% |
Table 5.
Analysis of Alpha diversity index.
| Sample Group | shannon | Simpson | chao1 | ACE | goods_coverage |
| PMA | 3.549 | 0.674 | 784.482 | 829.319 | 0.996 |
| PMB | 3.758 | 0.744 | 1192.509 | 1226.536 | 0.994 |
| PMC | 2.738 | 0.577 | 691.362 | 694.126 | 0.997 |
| PMD | 2.97 | 0.625 | 687.119 | 709.296 | 0.997 |
| SH1 | 5.825 | 0.94 | 915.686 | 900.221 | 0.996 |
| SH2 | 6.971 | 0.981 | 1114.667 | 1133.218 | 0.996 |
| SH3 | 6.279 | 0.967 | 1060.011 | 1036.474 | 0.995 |
| SH4 | 6.378 | 0.971 | 801.375 | 830.585 | 0.997 |
Disclaimer/Publisher’s Note: The statements, opinions and data contained in all publications are solely those of the individual author(s) and contributor(s) and not of MDPI and/or the editor(s). MDPI and/or the editor(s) disclaim responsibility for any injury to people or property resulting from any ideas, methods, instructions or products referred to in the content. |
© 2025 by the authors. Licensee MDPI, Basel, Switzerland. This article is an open access article distributed under the terms and conditions of the Creative Commons Attribution (CC BY) license (http://creativecommons.org/licenses/by/4.0/).
Copyright: This open access article is published under a Creative Commons CC BY 4.0 license, which permit the free download, distribution, and reuse, provided that the author and preprint are cited in any reuse.


