
Submitted:
01 June 2023
Posted:
01 June 2023
You are already at the latest version
Abstract
Urban spatial perception critically influences human behavior and emotional reactions, emphasizing the necessity of aligning urban spaces with human needs for enhanced urban living. However, functionality-based categorization of urban architecture is prone to biases, stemming from disparities between objective mapping and subjective perception. These biases can result in urban planning and designs that fail to cater adequately to the needs and preferences of city residents, negatively impacting their quality of life and the city's overall functionality. In this study, we apply machine learning to elucidate these biases within urban spatial perception research, utilizing a three-step methodology: objective mapping, subjective perception analysis, and perception deviation assessment. Our findings reveal that machine learning can expose hidden patterns within this research field, bearing substantial implications for urban planning and design. Of particular note, the study revealed significant discrepancies in the distribution centroids between commercial buildings and residential or public buildings. This result illuminates the spatial organization characteristics of urban architectural functions, serving as a valuable reference for urban planning and development. Moreover, it uncovers the advantages and disadvantages of different data sources and techniques in interpreting urban spatial perception, paving the way for a more comprehensive understanding of the subject. These findings underscore the importance of integrating both objective mapping and subjective perspectives in urban architectural functionality classification.
Keywords:
Urban spatial perception
; building function classification
; objective mapping
; subjective perception
; machine learning
; point of interest (POI)
; street view images
1. Introduction
Urban spatial perception, an intricate interplay between individuals and their urban environment, significantly shapes human behavior and emotional reactions within the spheres of architecture and urban design. This psychological process, rooted in the perception of forms, structures, colors, and aesthetics, underscores the importance of aligning urban spaces with the human biological structure and satisfying human needs, thereby enhancing the quality of urban life [1]. Within the research of spatial perception, the phenomenon of 'bias' is commonplace, referring to a discrepancy between the output of a certain process and its anticipated outcome [2]. When classifying urban architecture based on functionality, the statistical results derived from objective data may differ from those based on people's subjective perceptions, illustrating an instance of bias between observed and true values within the process of urban perception. Bias carries considerable research significance, enabling us to delve deeper into data and phenomena, and to uncover the patterns and characteristics concealed therein. For instance, the semantic differences in the soundscapes of open urban spaces can be explored by understanding the variations in sound perception among different demographics [3]. F. Zhang et al. decipher the discrepancy between perceived safety and actual crime rates in urban areas. F. Zhang found that high-traffic daytime neighborhoods appear safer than they are, while the reverse is true for nighttime areas, highlighting the need for balanced urban management strategies. Both of these studies scrutinized the rules underlying urban phenomena from the perspective of perceptual bias [4]. This research builds on the objective mapping and subjective perceptual biases of architectural classification to explore the phenomena and characteristics of urban architectural classification in depth. The value of deviation study lies in its power to reveal insightful disparities between anticipated and actual outcomes. Particularly in urban science, scrutinizing deviations can deepen our understanding of urban perception and behavior, thus guiding urban planning decisions. Applying this to architectural function distribution can highlight discrepancies between intended and actual use, offering valuable insights for more effective, responsive urban planning, thereby enhancing urban functionality and livability.
Objective mapping with statistical methodologies typically employs public datasets of the city. For instance, multi-source data, such as Geographic Information System (GIS) data and Points of Interest (POI), can be utilized facilitating the classification and spatial distribution analysis of urban architecture [5]. Such data are usually classified and analyzed based on geographical location, architectural types, and other indices related to urban functionality. In addition, subjective perception refers to the awareness of urban architecture, environment, and functionality shaped by individual experiences, knowledge, emotions, values, and other factors as people perceive and evaluate urban spaces. This perception arises from actual experiences, observations, and feelings, as demonstrated in subjective evaluation of thermal comfort in urban open spaces [6]. Within the realm of subjective perception studies, a machine learning model was constructed to assist in mapping the perception distribution of humans towards new urban regions throughout the city [7]. Moreover, street images encapsulate the overall landscape of urban regions, and this novel source of image data has advantages not only in the fine observation of the physical environment but also in social perception [8].
By summarizing the aforementioned studies, it becomes evident that POI data can accurately carry out objective mapping for architectural classification, while analysis based on street view images can reflect people's subjective perception of architectural classification. Hence, this research probes into the roles and corresponding influencing factors of objective mapping and subjective perception of urban architectural functionality in urban perception by comparing the objective mapping architectural classification method based on POI data with the subjective classification method based on street view images.
Despite an abundance of research on the classification and spatial distribution of urban architectural functionality, considerable challenges persist. Current studies primarily focus on methods stemming from a single data source. However, within the domain of urban perception, a singular data source often falls short in fully unveiling the bias between observed and true values, as well as the diverse characteristics and patterns within the process of urban perception. Multi-source data aids in deeply investigating the meanings and patterns underlying phenomena. For instance, multi-source data can be employed to examine the correlation between human perception and architectural environment indices and socio-economic data, encompassing visual elements, facility attributes, and socio-economic indices [9]. Sampling and spatial analysis methods can be utilized on social media data to probe into the missing elements of social media within smart cities [10], [11]. Furthermore, F. Zhang et al. used information from scenes and objects within social media photos to identify similarities between urban street views and cities. These studies collectively demonstrate that the use of multi-source data, along with novel perspectives and methodologies, allows for a more comprehensive dissection of urban characteristics and patterns.
This study acknowledges potential disparities in urban architectural functionality classification and spatial distribution when employing objective mapping versus subjective perception methodologies. Objective mapping, the 'true values' in urban perception, mirrors the actual circumstances of architectural structures or spaces. In contrast, subjective perception, the corresponding 'observed values', embodies the individual sentiment evoked by these structures or spaces. A comprehensive exploration of the deviation between these 'true' and 'observed' values in urban perception can uncover sources of bias and refine measurement techniques, thereby affirming the efficacy of extant urban planning and design models. Concurrently, the elucidation of underlying patterns and characteristics can spotlight novel issues and challenges, supplying more comprehensive data to optimize decision-making and strategy formation.
This research endeavors to probe into the disparities and the causative factors between the actual and observed values of objective mapping and subjective perception in the classification of urban architectural functionality. This approach facilitates a more comprehensive understanding of urban spatial perception. Moreover, the study seeks to explore the commonalities and differences between these two methodologies across diverse spatial scales, while thoroughly dissecting the underlying factors instigating these variances. To fulfil this objective, we will employ the objective mapping method based on POI data and the subjective perception method reliant on street-view images to analyze the functional classification and spatial distribution of urban buildings. This research aims to contribute to providing a more comprehensive theoretical foundation and practical guidance in fields such as architectural design, urban planning, and spatial analysis.
The core methodologies of this study encompass: (1) Functionally classifying urban architecture via the application of frequency density ratio and inverse distance-weighted frequency density methods to POI data. (2) Leveraging a Deep Convolutional Neural Network (DCNN) model to carry out functional classification of urban architecture using street-view imagery. (3) Employing spatial clustering analysis and grid-structure spatial pattern similarity analysis to discern discrepancies between objective mapping and subjective perception methodologies regarding urban architectural functionality categorization and spatial distribution. (4) Probing potential factors contributing to the variances between objective mapping and subjective perception, thereby enriching our understanding of urban perception.
The structure of this paper is as follows: Section One, the introduction, delineates the research context, relevance, and objectives, and outlines the central methodologies. Section Two offers a literature review, investigating the roles of subjective perception and objective mapping in urban perception, alongside the deployment of machine learning in urban image recognition studies. Section Three delves into the research methodology, covering the study area, urban architectural functionality classification based on POI data, functional categorization of buildings via visual perception employing street-view images, and the analysis of disparities between objective mapping and subjective perception of architectural functionality at the urban scale. Section Four unveils the experimental results, including building categorization outcomes based on POI data and street-view images, and the variances between objective mapping and subjective perception of architectural functionality. Section Five, the discussion, examines the experimental findings and the relevance of the discrepancies between objective mapping and subjective perception. Section Six encapsulates the study's conclusions.
2. Related works
2.1. Overview of subjective perception in urban cognition
Subjective perception is an integral part of urban cognition, encompassing an individual's subjective understanding, experiences, and sensations of the urban environment. The users of urban landscapes largely experience them through visual sensations [12].
Spatial subjective perception, based on objective environmental perception, forms an essential part of urban image-related research. This subjective perception can be investigated through questionnaires, revealing urban residents' behaviors and intentions, thereby providing more accurate evidence for urban planning and decision-making [13]. In the age of big data, numerous urban data sources, represented by street view images, are documenting the evolution of people's lifestyles in various ways. With the rapid development of image processing technology, street view images have emerged as a new data source for urban research [14].
This research provides a theoretical and methodological foundation for exploring urban images, revealing the interaction between subjective perception and objective environment. A meticulous field survey was conducted, utilizing Baidu Street View (BSV) imagery of the Macau Peninsula, to assess key features of street spaces, such as openness, greenery, interface coverage, and road area ratio. The study further explored the correlation of these physical aspects with the physical and social well-being of the senior population [15]. Research was undertaken to evaluate urban walkability through the lens of cognitive mapping, deepening understanding of spatial cognition in pedestrian environments [16]. An advanced deep learning framework was leveraged, together with an extensive collection of panoramas from Baidu Street View, to visualize and quantify three paramount indices of street-level scene perception: Greenery, Sky, and Building Landscape Indices, abbreviated as GVI, SVI, and BVI, respectively. [17].
However, existing subjective perception research has overlooked the focus on street view architecture. The elements in the street view, such as buildings, streets, parks, etc., have a significant impact on people's cognition [7]. Even though architecture is a critical component of the urban environment, current research on the subjective visual perception of architectural classification is relatively scarce. Therefore, this study, building upon previous research, delves into the subjective visual perception of space to explore the methodology of subjective architectural classification.
2.2. Overview of objective mapping in urban cognition
Objective mapping refers to the process of providing an objective description and analysis of the urban environment, based on statistical methods, offering significant reference for urban planning and design. Objective mapping can encompass a multitude of facets, such as the data resource statistical approach by [18]. Investigations into the city-population-industry (UPI) system were conducted, where the coupling coordination degree was employed to assess the level of urbanization in city-industry integration, offering a novel perspective on urban development and planning. [19].
In the field of transportation statistics, a comprehensive experiential dataset, consisting of billions of vehicle observations derived from static traffic detectors, was utilized to identify critical points. These observations were then juxtaposed with the OpenStreetMap network, elucidating the interplay between network topology and the emergence of these critical points. This approach has broadened the understanding of transport dynamics and network influences [20]. Geospatial data can be utilized to describe the usage of urban parks, analyzing three categories and nine variables affecting park utilization, identifying their relationship with park utilization through geospatial data [21].
Nonetheless, in research pertaining to objective urban mapping, there is a noticeable deficiency in the application of POI data. POI encompasses various geographic information elements within a city, such as locations, facilities, attractions, among others. The lack of objective statistics regarding POI suggests a shortfall in the comprehensive representation of these urban elements. Further, POI data serve as a pivotal source of information for analyzing urban issues. For example, during poverty assessments, spatial autocorrelation of poverty displayed significant positivity, which was more pronounced at the town level than at the county level. Among the chosen factors, the cost distance of POI was identified as the most significant determinant for poverty assessment [22].
2.3. Application of machine learning in urban perception
With the ongoing advancements in computer technology and data processing techniques, machine learning technologies are being employed across a myriad of domains, from healthcare and intelligent power grids to vehicular communications [23]. Machine learning is extensively applied in urban planning studies, with algorithms like Random Forest (RF), Convolutional Neural Networks (CNN), deep learning methodologies, and Support Vector Machines (SVM) proving ideal for classification and pattern analysis of geo-observed data. Generative Adversarial Networks (GAN) have been utilized for simulating urban patterns [24]. Contributions from deep learning (DL) and machine learning (ML) methods to the evolution of models in various aspects of prediction, planning, and uncertainty analysis in smart cities and urban development have been notable [25], providing support for urban planning and decision-making.
Soheil Fathi have employed machine learning for predicting a building's energy performance. Beyond physics-based energy modeling, machine learning techniques can offer faster and more accurate estimates based on historical energy consumption data of buildings [26]. Goldhammer et al. have proposed a machine learning-based motion model to classify current motion states and predict future trajectories of vulnerable road users [27]. Constantine E. Kontokosta have introduced a novel analytical method that combines machine learning with small-area estimation techniques to predict weekly and daily waste generation at the building scale [28].
With the continuous breakthroughs in artificial intelligence technology, research into urban planning evaluation based on street view images has become feasible. This provides a more precise, efficient, and economical data source and research approach for urban planning and management. For instance, in studies of the Urban Landscape Index, traditional methods of measuring urban greening involve limitations on the coverage of various forms of greening and cannot reflect actual exposure to pedestrians. Google Street View (GSV) and deep learning can be utilized to calculate the Green View Index (GVI) through semantic segmentation, referencing greenery from a pedestrian's visual perspective [29].
3. Methodology
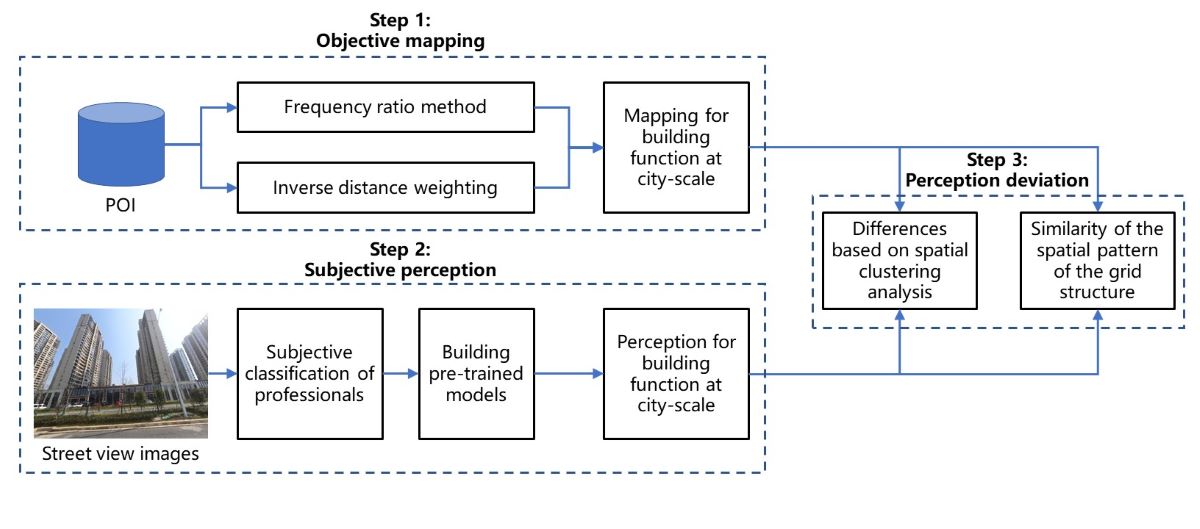
The workflow of the study comprises three primary steps (Figure 1). Objective mapping, Subjective perception, and Perception deviation. Firstly, the distribution of building functions at a city-scale is determined by employing the POI mapping technique in conjunction with the Frequency Ratio method and Inverse Distance Weighting. Different types of buildings are identified and classified based on their functions using the available POI data. Secondly, subjective perception is conducted by evaluating the building functions. Street view images are utilized as a tool for subjective assessment, and domain experts subjectively classify the buildings based on these images. Additionally, pre-trained models are employed to enhance the perception of building functions within the urban context. The final step involves calculating the perception deviation, which quantifies the disparity between objective mapping and subjective perception. Spatial clustering analysis is employed to identify differences in the distribution of building functions between the objective and subjective datasets. Furthermore, the spatial pattern similarity of the grid structure is assessed to determine the degree of agreement between the results obtained from objective mapping and subjective perception.
3.1. Study area
Figure 2 designates the central urban district of Shanghai as the research locus, encompassing an area of approximately 126.4 square kilometers. As China's economic nexus and a prominent global metropolis, Shanghai has experienced a rapid urbanization trajectory. However, in the course of urban progression, perceptual discrepancies concerning the urban environment and the irrationality of architectural function distribution have emerged as salient issues. Therefore, intertwining the studies of urban perceptual bias and architectural functionality distribution bears profound significance for the sustainable evolution of Shanghai's central urban district. By comprehending the perceptual needs of the residents in depth, we can optimize the distribution of architectural functions, enhance the quality of the urban environment, and engineer a more habitable and sustainable urban space.
3.2. Functional classification of urban buildings based on POI data
3.2.1. POI data acquisition and pre-processing
This study predominantly classifies architectural types based on POI data. Despite the wealth of spatial information contained within POI data, inconsistencies in data quality and positional shifts pose significant issues. Therefore, prior to initiating the architectural classification experiment, it is imperative to process the obtained POI data. Initial steps involve the selection of POI data from Shanghai, vectorizing it on an online map, and extracting the necessary POI data within the research ambit.
Post data validation, data cleansing is undertaken; the 12-category POI Excel files are converted into vector data, and low public recognition POI data such as newsstands and public toilets in the original data are eliminated. The processed POI data are then reclassified according to the type and function of buildings. In compliance with the "China National Standard - Current Land Use Classification (GB/T 21010-2017)", all building functions are bifurcated into commercial, public, and residential categories (as shown in Figure 3). Given that the classification of the architectural type extends to the Area of Interest (AOI) of the building, it is also necessary to acquire the building area data required within the research scope. Finally, the geographical coordinate system of all files is converted into a projected coordinate system, and the spatial coordinates of the collected data are uniformly converted into the WGS-84 coordinate system for subsequent overall spatial-structural analysis.
3.2.2. Frequency ratio method
Primarily, frequency methodology is employed for computation. The fundamental principle of the frequency method is the calculation of the quantity of disparate POI data on the architectural facade, classifying architectural functions based on frequency density and the proportion of architectural facade POI types within a spatial scope.
In these equations, denotes the architectural type, signifies the count of architectural types, and represents the quantity of the ith POI type within the architecture. Furthermore, signifies the total count of the ith POI category within the POI data, represents the frequency density considering the number POI type, and signifies the proportion of the frequency density of the ith POI category to the frequency density of all types of POI data within the architectural object area.
Calculations for three categories of POIs are performed via the frequency density ratio method, yielding the quantity of three categories of POIs on each architectural facade file. Observations of the computational outcomes of the frequency density ratio method reveal that a substantial number of architectural facade files have not attained statistical results of POI data. This is primarily due to the absence of POI point data on the architectural facade file. The strength of the frequency density ratio method lies in its ability to account for the quantity of POIs within each building facade. However, its weakness is its relatively high demand for the quality of POI point data. The POI point data obtained are often hard to ensure quality, primarily manifested as spatial position offsets, data losses, and the like. For facade files with POI point values, computations can be made via the frequency density ratio method. However, for facades where the quantity is not accounted for, supplementary computations must be made via the kernel density method, or the frequency density method weighted by the inverse distance method.
3.2.3. Inverse distance weighting
Due to inherent qualitative biases in POI data, certain architectural facade files fail to obtain POI values. These gaps necessitate employing the inverse distance weighted frequency density method to supplement architectural surface area, as conventional frequency density coefficient computation methods prove insufficient for architectural typology studies. The frequency density method weighted by inverse distance incorporates a Gaussian function that offers rapid decay for a given distance factor, thereby considerably mitigating the influence of distant POI data on outcomes. Initially, architectural facade data that can be calculated using the frequency density factor method are discarded in favor of employing the inverse distance weighted frequency density method for computation.
The key distinction between the inverse distance weighted frequency density method and the frequency density ratio method lies in the treatment of unaccounted architectural facade data. For these data, the surrounding POI data is leveraged to infer type classification. For architectural areas devoid of POI data, POIs within a surrounding 100-meter buffer are tallied, and the POI's weight is restricted. Hence, areas nearer to the architectural facade possess greater weight.
In comparison to the commonly used inverse form of the inverse function, the Gaussian function presents a smoother curve and is more applicable to the given POI data characterized by high uncertainty. The one-dimensional form of the Gaussian function is a bell-shaped curve, where represents the peak value, indicates the value of the independent variable at the peak ( = also serves as the bell's axis of symmetry), and signifies the standard deviation, depicting the bell's breadth. The true meaning of the independent variable is the distance from the POI to the geometric center of the building polygon. As the POI is nearer to the architectural facade, the weight approaches 1, and as the POI is farther from the architectural surface, the weight decreases, infinitesimally approaching 0 but never reaching a negative value, as Figure 4 shown. Therefore, we assign = 1 and = 0.
For built-up areas devoid of POI within their scope, this study calculates the POI categories within a 100-meter built-up buffer zone and evaluates the type classifications of the built-up areas.
3.3. Functional classification of buildings based on visual perception of street view images
3.3.1. Street view image acquisition and pre-processing
In this study, we extract images from street view platforms, procuring a broad coverage of city street photographs. Initially, urban road networks, equipped with geographical coordinate information, are selected and obtained from OpenStreetMap (OSM). Following this, we simplify the road network into linear forms with an average distance of 25 meters between adjacent points, based on the urban street design method proposed by J. Gehl [30]. Subsequently, we acquired sampling points with geographical coordinate information, exhibited within the spatial distribution. It is noteworthy that not all sampling points within street view services possess corresponding street view images. Ultimately, to procure building façades, we download two images perpendicular to the road from street view services for each sampling point (respectively on the left and right, with a viewpoint of 90 degrees, a horizontal angle of 0 degrees, and image size of 760 × 480 pixels), as illustrated in Figure 5. We have obtained a total of 102,046 street view images of the central urban streets of Shanghai.
This study employs a methodology that segments building facades from street view images, enhancing the accuracy of facade color recognition and building function classification. In recent years, high-precision semantic segmentation models based on convolutional neural networks, such as U-Net [31], PSPNet [32], and DeepLabv3 [33], and , have been extensively developed. We employ the DeepLabv3 to segment building facades from street view images, owing to its high accuracy and ease of implementation. DeepLabv3 achieved an IoU accuracy of 93.5% for buildings on the Cityscapes test set. Figure 6 demonstrates the building segmentation results of street view images by the trained DeepLabv3. However, in some street view images, the proportion of buildings is relatively low, and these images are unable to reflect the color features of the buildings. To enhance experimental accuracy, we need to exclude images with a small proportion of buildings, as the computer cannot identify the features of the buildings through these images. By inputting street view images into a pre-trained semantic segmentation model, we can measure the area ratio of building facades. After calculating the proportion of buildings in each sampled image, we exclude images with a building proportion below 15%, as shown in Figure 3c.
3.3.2. Building semantic segmentation and image classification
Figure 7 Four types of building functions are included. The first line is single-label class, from left to right: residence, commerce, public, and other facilities. The second line is the multi-label class, from left to right: residence and commerce, commerce and public, residence and public, no data.
Considering urban architecture from the perspective of street facades, the built environment primarily exhibits four types of architectural functions, namely residential (R), commercial services (C), public services (P), and other facilities (O), as shown in Figure 7. For the purpose of effective classification of these architectural types, we employed deep learning techniques to automatically recognize architectural functions in the street-view images of our study area. In previous research, a single-label approach was commonly utilized to classify architectural categories, where each photograph corresponded to one label. However, the single-label method was incapable of accurately segregating street-view images reflecting multiple architectural functions, resulting in imprecise experimental outcomes. To circumvent this limitation, we adopted a multi-label image classification approach to identify multiple architectural categories within street-view images.
To train the multi-label architecture classifier, we initially established a corresponding street-view benchmark dataset using semantically segmented architectural images. This dataset encompassed 6000 images from four basic categories: residential, commercial services, public services, and other facilities. Within these training images, approximately 4000 images were single-label, and 2000 images were multi-label. We partitioned these street-view images into a training set (80%), a testing set (10%) and a validation set (10%). Importantly, all test images differed from those employed during training. Subsequently, we trained the state-of-the-art deep learning model, EfficientNetV2 [34]. To enhance the learning rate, we performed 100 epochs of training on these models, with a learning rate decay of 0.1 every 25 epochs. Each training batch consisted of 64 images. All other numerical values were set to default. The experiment was implemented using Pytorch and executed on an NVIDIA GeForce RTX 3090 24 GB GPU.
3.4. The deviation between objective mapping and subjective perception of building functions at city scale
3.4.1. Spatial distribution variance analysis based on K-means clustering
This research aims to conduct cluster analysis on pixels in an image that correspond with a target color, with a subsequent visualization of the results. Initially, to locate pixels in an image matching a given target color, we swiftly identified all pixel coordinates congruent with the target color utilizing the NumPy library [35]. Following this, the MiniBatchKMeans algorithm, part of the scikit-learn library [36], was employed to perform a cluster analysis on the target color pixels. MiniBatchKMeans, a variant of the K-means algorithm, employs a subset of data samples (referred to as a mini-batch) during each iteration process, thereby accelerating computations. This algorithm endeavors to find optimal cluster centers, thereby minimizing the subsequent objective function:
J(C) = Σ(Σ‖xᵢ - μⱼ‖²), where xᵢ ∈ Cⱼ
In this context, J(C) signifies the clustering error, Cⱼ represents the jth cluster, xᵢ denotes a data point, and μⱼ is the center of Cⱼ. By minimizing J (C), we can achieve more compact and representative clusters.
Finally, we utilize the seaborn library [37] to generate a scatter plot to visualize the clustering outcomes. For each cluster, a dashed circular frame is drawn, the radius of which equals the distance from the center to the farthest point within the cluster. Additionally, the center point of each cluster is also illustrated. The calculation of distance employs the Euclidean distance formula:
Through the implementation of these methods, we can match and conduct cluster analysis of architectural functions in both subjective perceptions and objective statistics.
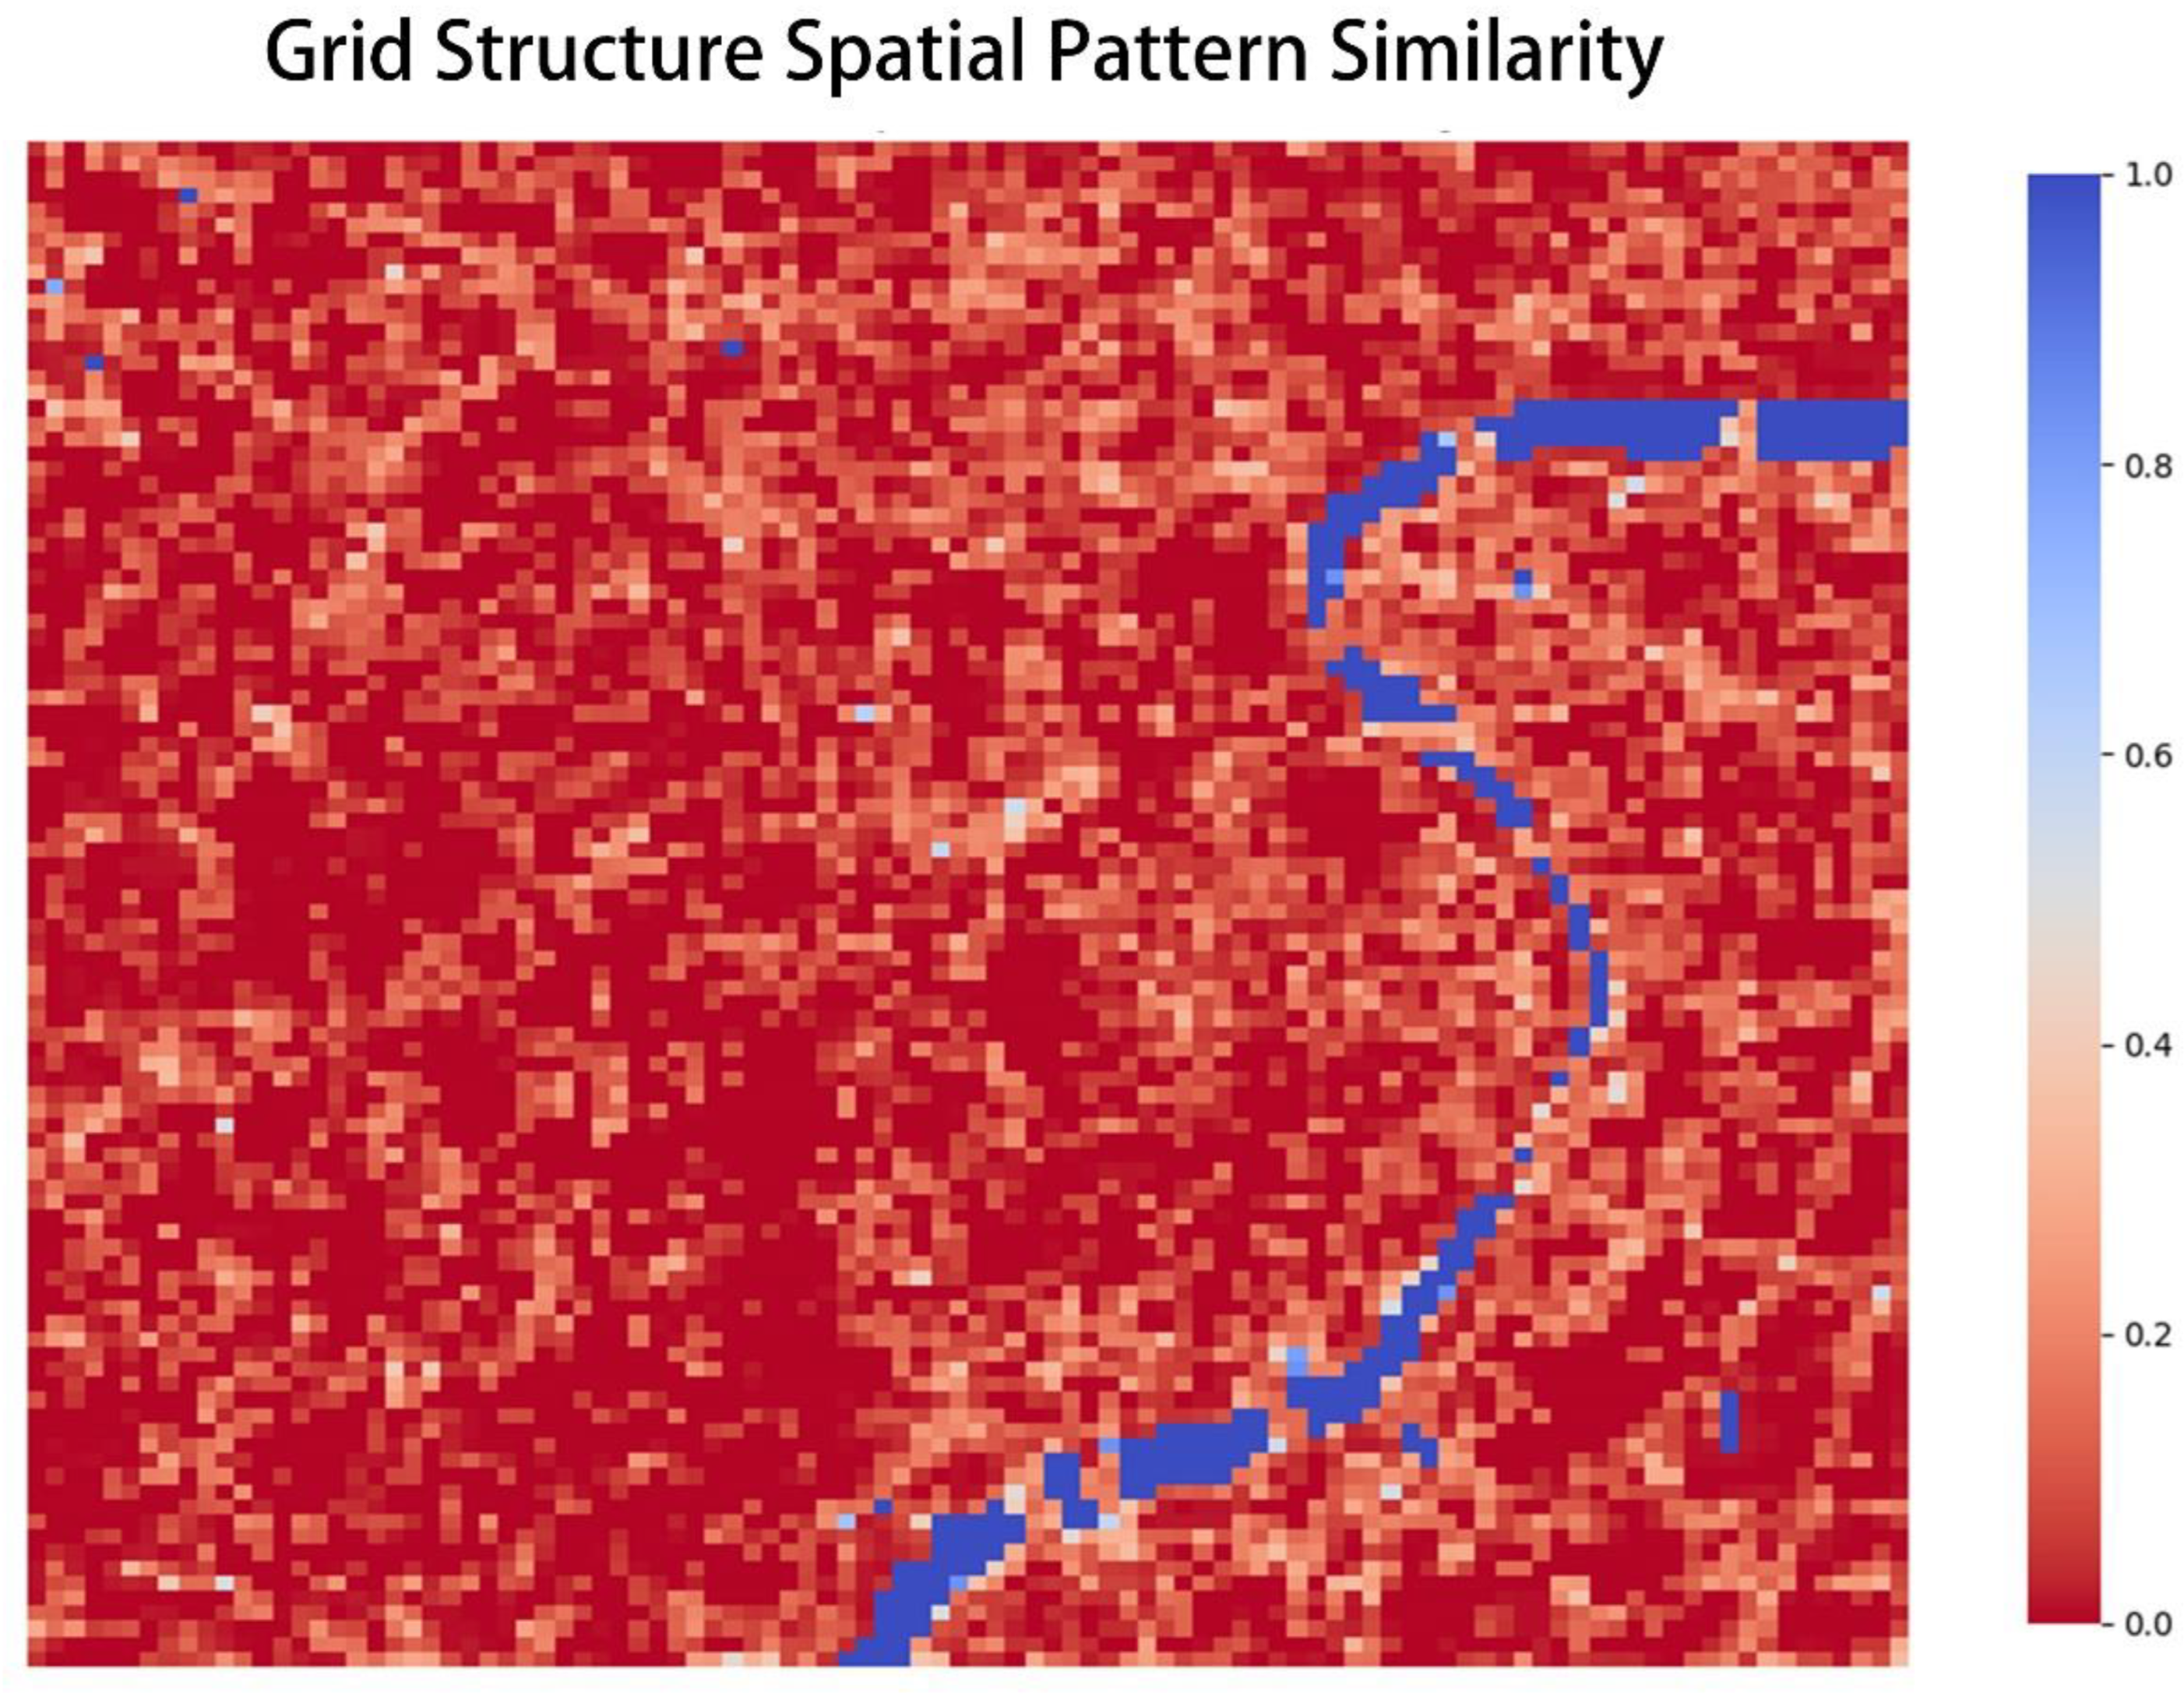
3.4.2. Analysis of the similarity of the spatial pattern of the grid structure
In this study, we proposed a methodology predicated on the spatial overlap metric, Jaccard Similarity [38], for the analysis and visualization of differences between two city-scale spatial distribution RGB images. Below, we elaborate on the detailed steps employed in implementing this approach:
Initially, we adjusted the two input RGB images to an appropriate size to facilitate their subdivision into a specified quantity of grids. Each image was segmented into 100x100 grids. To accomplish this, we first split the images along the vertical axis (axis=0), subsequently concatenating the divided image blocks and further partitioning them along the horizontal axis (axis=1).
For each pair of corresponding grids, we calculated their Jaccard similarity. The specific steps are as follows: firstly, calculate the unique colors within each grid and their occurrence frequencies. Secondly, identify the colors appearing in both grids. For each common color, calculate its minimum occurrence in each grid. Add these minimum counts to ascertain the size of the intersection. Thirdly, compute the total color occurrences in both grids and subtract the size of the intersection to determine the size of the union. Compute the Jaccard Similarity according to the formula:
Where A and B denote the two sets, indicates the size of the intersection of sets A and B, and represents the size of the union of sets A and B. The Jaccard Similarity serves as an index of the similarity between two sets, with values ranging between 0 and 1. The closer the similarity value is to 1, the more similar the two sets; conversely, the closer the similarity value is to 0, the greater the disparity between the two. Store the computed Jaccard Similarities in a matrix, the row and column numbers of which coincide with the number of grids. Finally, visualize the Jaccard Similarity matrix as a heatmap using the heatmap function of the Seaborn library.
Through these steps, we can generate a heatmap illustrating the similarities between the two-input city-scale spatial distribution RGB images. This method enables us to compare and analyze the similarities and differences in urban spatial structures in a quantitative manner.
4. Experiments and results
4.1. POI-based building classification results
Implementing the aforementioned Frequency Density Ratio and Inverse Distance Weighted Frequency Density methods, we categorized the structures within the epicenter of Shanghai, thereby culminating in an urban architectural classification map predicated on AOI data (Figure 8).
To facilitate an ensuing comparison with subjective visual perception, we incorporated reference to established standards pertaining to architectural façade observation. Ordinarily, individuals can discern the overall form and intricate features of a building at close range (approximately 25 meters). Conversely, at a greater distance (approximately 250 meters), one's focus primarily gravitates toward the building's prominence and spatial relations within the urban milieu. Recognizing that individuals may scrutinize architecture from varied distances during actual observation, we opted for a median distance of 50 meters (with a field of view extending 25 meters on either side) as an appropriate measuring standard. This distance sufficiently accounts for both the overall shape and partial intricate characteristics of a building while reflecting its spatial relations within the urban environment. Accordingly, a 50-meter buffer analysis was conducted on the buildings, and a spatial distribution visualization of the architectural classification results based on POI data was performed (Figure 9).
Commercial buildings within the range are typically situated in areas with optimal transportation access, often at the heart of district clusters. The majority of residential structures exhibit group distribution within the range, which is consistent with the aggregated distribution characteristics of living spaces in most Chinese cities, taking the form of residential communities. Apart from large public service institutions such as hospitals and schools concentrated in clusters, public buildings in the central research area of Shanghai are rather dispersed, primarily constituting administrative offices and cultural and sports facilities, often situated within standalone structures. These cover extensive land areas and are plentiful in number.
4.2. Building classification results based on street view images
4.2.1. Classification accuracy of deep learning models
Figure 10 illustrates the normalized confusion matrices of the seven architectural function classifications, evaluated via our testing data with the trained EfficientNetV2 model. The F1 score (F1), a robust criterion for gauging classification accuracy, is a harmonic mean that encapsulates both precision (p) and recall (r). It is formulated as:
F1 score = 2 * (p * r) / (p + r).
The determined F-score value for the trained EfficientNetV2 model registers at 0.82.
4.2.2. Building function classification results and spatial distribution
The research area under scrutiny encompasses 102,046 inferred street view images. Figure 11 exhibits the distribution of building functionalities within these street view images of the investigated area.
From a subjective human perspective, the primary functionalities of buildings in Shanghai's core region are predominantly residential and commercial. These two functions occupy significant positions within the visual landscape. Residential buildings likely represent the dominant function, reflecting the high population density and urban residential zones in the core area. Commercial structures, such as shopping centers and retail stores, are also prevalent, reflecting the vibrant economic activity and commercial hubs within the city.
Contrasting with the previous figure, it is noteworthy that office buildings may be mistakenly identified as commercial buildings. This misperception could arise due to various factors such as architectural design, signage, and visual saliency, all of which influence the perceived distribution of different functionalities within the urban environment.
4.3. The result of deviation between objective statistics and subjective perception of building functions
The comparison between the centroids of different building functionality color blocks in two diagrams illustrates the spatial distribution differences between objective statistics and subjective perception. We computed the disparities in the distribution of architectural functionalities between spatial clustering analysis of subjective perception and objective statistics, as shown in Figure 12. Particular attention was devoted to the centroid differences in the distribution of residential, commercial, and public buildings.
The results reveal the greatest centroid difference in the distribution of commercial buildings, suggesting substantial variability in the spatial dispersion of commercial functionality within the core area of Shanghai. Further analysis indicates that this centroid difference in the distribution of commercial buildings could be closely associated with factors such as urban planning, land utilization, and market demand. This divergence may reflect the agglomeration tendencies of commercial activities and alterations in urban development.
In addition, the centroid differences in the distribution of residential and public buildings are relatively minimal, implying a stable spatial distribution of these two functions within the core area. The exploration of these discrepancies facilitates a deeper understanding of the spatial organization characteristics of urban architectural functionalities, providing a reference for urban planning and development. Further research could delve into underlying causes and influencing factors, including the economic dynamics of commercial activities, changes in citizens' needs, and the orientation of government planning, to promote more rational and sustainable urban development.
4.3.2. Results of spatial pattern similarity analysis of grid structure
The subjective perception results and objective mapping results of building functionalities were retrieved, and their grid-based spatial pattern similarities were visualized on a novel image. Grid areas with higher similarity are depicted in blue, while those with lower similarity are illustrated in red. The results of spatial pattern similarity analysis of grid structure are shown in Figure 13.
In terms of overall similarity, subjective perception and objective statistics demonstrate a certain degree of resemblance in their spatial distribution on an urban scale. For instance, areas proximate to the Huangpu River generally exhibit higher similarity. Regarding local differences, despite an overarching similarity between the two maps, significant disparities persist in certain local areas.
Through the analysis of grid-based spatial pattern similarity, we can glean a deeper understanding of the characteristics of these two spatial perception distributions and the differences between them. This assists urban planners and relevant stakeholders in better comprehending the development patterns of the city, thereby enabling the formulation of top-down planning strategies and intervention measures.
5. Discussion
5.1. The significance of perceptual deviations for urban science
The significance of perceptual deviations in urban science lies in its challenge to perceive human activities and the socio-economic environment of cities using traditional computer vision features. Conventional image analysis techniques and automated algorithms often struggle to accurately capture the subjectivity of perception, multicultural backgrounds, and the intricate layout of urban functions. This limitation necessitates the development of superior computational tools and methods capable of holistically learning and interpreting the visual content of urban environments.
By understanding perceptual deviations, researchers can aspire to more precise and quantitative measurements of architectural functional layout and socio-economic conditions. The extraction of high-level representations from street view imagery is pivotal in this pursuit. These representations provide insights into the functional distribution of urban architecture. By analyzing visual data and considering perceptual deviations, researchers can identify indicators that capture people's perceptions of the functional distribution of architecture, such as commercial vibrancy and residential experience. This information is paramount for the optimization of transportation planning and infrastructure development. Understanding perceptual deviations propels the integration of urban science with data science, opening up new possibilities for innovative solutions in evidence-based decision-making, efficient resource allocation, and sustainable urban development.
5.2. Potential applications of perceptual deviations on improving urban planning and development
The assessment of perceptual deviations in urban environments has the potential to foster more livable cities that embody the unique characteristics of their communities, attracting new investments and stimulating economic growth. These deviations provide crucial insights into individuals' interactions with and perceptions of their environment, informing urban planning decisions. For instance, should there be a perceived sense of insecurity in a particular urban area, regardless of low crime statistics, urban planners may address this perception through actions like increased lighting or heightened police surveillance. Similarly, if residents feel a lack of green spaces within their vicinity, urban planners could prioritize the development of parks and green expanses. By integrating these perceptual deviations, urban planning and development can align more closely with the needs and desires of residents, thus fostering more sustainable and livable urban environments.
Further integrating advanced computational tools and methodologies to extract high-level data from street-level imagery can help illuminate mobility patterns within cities and provide detailed socio-economic data for diverse urban regions. This information serves as an invaluable resource for urban planners and social scientists involved in urban observation, research, and design. Notably, it can assist in identifying high pedestrian traffic areas or potential locales suitable for specific business establishments, such as grocery outlets. A deeper understanding of the relationship between the physical environment and human activities can inform decisions on land use, transportation, and infrastructure development. The ability to offer comprehensive and precise information about the urban landscape anchors the potential applications of perceptual deviations in enhancing urban planning and development.
The potential applications of perceptual deviations in urban planning are extensive. Detailed analyses of these deviations can reveal regions where architectural design may be misaligned with the needs and preferences of local communities. This valuable insight can guide urban planning decisions towards more effectively meeting residents' needs and expectations, contributing to the development of more sustainable and livable cities. For instance, if a park sees little utilization due to safety concerns or a lack of amenities, planners can leverage this information to enact improvements, making the space more appealing. Moreover, understanding perceptual deviations can foster more effective communication between planners, designers, and community members, providing a nuanced understanding of how different groups perceive the same space. This can facilitate a more collaborative decision-making process, better reflecting the needs and expectations of all stakeholders.
5.3. Potential limitations and future research
The present study's limitations merit additional examination and warrant elevated attention in future investigative endeavors. First, it is imperative to address the constraints tied to the quality and volume of the underlying data. The faithful categorization of building functionalities utilizing POI data and street-view imagery is highly dependent on the trustworthiness of these data sources. A lack of comprehensive data coverage can jeopardize the accuracy of classification results. Furthermore, the applicability of these methodologies across diverse cities or regions may necessitate considerable adjustments due to variations in architectural styles, patterns of urban development, and spatial configurations.
Secondly, deploying deep learning models in this research introduces difficulties concerning interpretability and resource demands. The models in use are intrinsically non-transparent and devoid of interpretability, rendering the elucidation of their decision-making processes laborious and obstructing the validation and refinement of results. Additionally, the training of these models requires substantial computational resources and expertise, rendering their application across all scenarios impractical. Moreover, the objective and subjective measurements of urban attributes might oversimplify the complex and multi-faceted nature of urban settings. For instance, quantifying building functionalities solely based on POI data and street-view images overlooks temporal elements such as the evolution of building functionalities over time or the dynamic character of urban activities.
Lastly, while the spatial pattern similarity analysis and spatial distribution difference analysis employed in this study provide significant insights into disparities between objective and subjective perceptions of urban spaces, these methods could potentially neglect other influential factors, including socio-economic considerations, cultural contexts, and individual experiences. Further, the validation of results heavily hinges on field validation, which could introduce biases due to logistical hurdles and possibly inadequate sample sizes in the validation data. The mathematical formulas utilized to quantify differences in spatial distribution and grid structure spatial pattern similarity might not sufficiently capture the nuances of urban spatial patterns, suggesting a need for more advanced statistical or geospatial techniques.
6. Conclusions
In summary, this study illuminates the impact of the discrepancy between objective mapping and subjective perception on the functional classification of urban architecture. By employing machine learning methodologies to unravel latent patterns and salient features within urban spatial perception studies, we have effectively addressed this challenge and achieved a more comprehensive understanding of urban design and planning. The implications of these discoveries reside in their capacity to guide the formulation of more effective and sustainable urban strategies. In particular, by integrating both objective mapping and subjective perception, we can secure a more profound grasp of the needs and preferences of heterogeneous communities within an urban context, thereby promoting the development of more inclusive and livable urban plans. Collectively, this research underscores the crucial role of interdisciplinary investigation in confronting complex issues related to urban spatial perception and design.
Author Contributions
Conceptualization, Jiaxin Zhang and Yunqin Li; methodology, Jiaxin Zhang, Yunqin Li and Zhilin Yu; data curation, Jiaxin Zhang and Xueqiang Wang; writing—original draft preparation, Jiaxin Zhang and Zhilin Yu; writing—review and editing, Jiaxin Zhang, Xueqiang Wang and Zhilin Yu. All authors have read and agreed to the published version of the manuscript.
Funding
This research received no external funding.
Data Availability Statement
Not applicable.
Acknowledgments
We would like to thank the editors and anonymous reviewers for their constructive suggestions and comments, which helped improve this paper’s quality.
Conflicts of Interest
The authors declare no conflict of interest.
References
- L. Porzi, S. Rota Bulò, B. Lepri, and E. Ricci, “Predicting and Understanding Urban Perception with Convolutional Neural Networks,” in Proceedings of the 23rd ACM international conference on Multimedia, in MM ’15. New York, NY, USA: Association for Computing Machinery, Oct. 2015, pp. 139–148. [CrossRef]
- F. Zhang and X. Ye, “What Can We Learn from ‘Deviations’ in Urban Science?,” in New Thinking in GIScience, B. Li, X. Shi, A.-X. Zhu, C. Wang, and H. Lin, Eds., Singapore: Springer Nature, 2022, pp. 301–308. [CrossRef]
- J. Kang and M. Zhang, “Semantic differential analysis of the soundscape in urban open public spaces,” Building and Environment, vol. 45, no. 1, pp. 150–157, Jan. 2010. [CrossRef]
- F. Zhang, Z. Fan, Y. Kang, Y. Hu, and C. Ratti, “‘Perception bias’: Deciphering a mismatch between urban crime and perception of safety,” Landscape and Urban Planning, vol. 207, p. 104003, Mar. 2021. [CrossRef]
- Y. Deng et al., “Identify urban building functions with multisource data: a case study in Guangzhou, China,” International Journal of Geographical Information Science, vol. 36, no. 10, pp. 2060–2085, Oct. 2022. [CrossRef]
- S. B. Ali and S. Patnaik, “Thermal comfort in urban open spaces: Objective assessment and subjective perception study in tropical city of Bhopal, India,” Urban Climate, vol. 24, pp. 954–967, Jun. 2018. [CrossRef]
- Y. Zhang and R. Dong, “Impacts of Street-Visible Greenery on Housing Prices: Evidence from a Hedonic Price Model and a Massive Street View Image Dataset in Beijing,” ISPRS International Journal of Geo-Information, vol. 7, no. 3, Art. no. 3, Mar. 2018. [CrossRef]
- F. Zhang, L. Wu, D. Zhu, and Y. Liu, “Social sensing from street-level imagery: A case study in learning spatio-temporal urban mobility patterns,” ISPRS Journal of Photogrammetry and Remote Sensing, vol. 153, pp. 48–58, Jul. 2019. [CrossRef]
- H. Ji, L. Qing, L. Han, Z. Wang, Y. Cheng, and Y. Peng, “A New Data-Enabled Intelligence Framework for Evaluating Urban Space Perception,” ISPRS International Journal of Geo-Information, vol. 10, no. 6, Art. no. 6, Jun. 2021. [CrossRef]
- Y. Tang, J. Zhang, R. Liu, and Y. Li, “Exploring the Impact of Built Environment Attributes on Social Followings Using Social Media Data and Deep Learning,” IJGI, vol. 11, no. 6, p. 325, May 2022. [CrossRef]
- Y. Yuan, Y. Lu, T. E. Chow, C. Ye, A. Alyaqout, and Y. Liu, “The Missing Parts from Social Media–Enabled Smart Cities: Who, Where, When, and What?,” Annals of the American Association of Geographers, vol. 110, no. 2, pp. 462–475, Mar. 2020. [CrossRef]
- T. Rossetti, H. Lobel, V. Rocco, and R. Hurtubia, “Explaining subjective perceptions of public spaces as a function of the built environment: A massive data approach,” Landscape and Urban Planning, vol. 181, pp. 169–178, Jan. 2019. [CrossRef]
- T. Chen, W. Lang, and X. Li, “Exploring the Impact of Urban Green Space on Residents’ Health in Guangzhou, China,” Journal of Urban Planning and Development, vol. 146, no. 1, p. 05019022, Mar. 2020. [CrossRef]
- N. He and G. Li, “Urban neighbourhood environment assessment based on street view image processing: A review of research trends,” Environmental Challenges, vol. 4, p. 100090, Aug. 2021. [CrossRef]
- L. Meng, K.-H. Wen, Z. Zeng, R. Brewin, X. Fan, and Q. Wu, “The Impact of Street Space Perception Factors on Elderly Health in High-Density Cities in Macau—Analysis Based on Street View Images and Deep Learning Technology,” Sustainability, vol. 12, no. 5, Art. no. 5, Jan. 2020. [CrossRef]
- J. A. Vallejo-Borda, V. Cantillo, and A. Rodriguez-Valencia, “A perception-based cognitive map of the pedestrian perceived quality of service on urban sidewalks,” Transportation Research Part F: Traffic Psychology and Behaviour, vol. 73, pp. 107–118, Aug. 2020. [CrossRef]
- X. Fu, T. Jia, X. Zhang, S. Li, and Y. Zhang, “Do street-level scene perceptions affect housing prices in Chinese megacities? An analysis using open access datasets and deep learning,” PLOS ONE, vol. 14, no. 5, p. e0217505, May 2019. [CrossRef]
- S. Hugh and M. S. Fox, “Homelessness and Open City Data: Addressing a Global Challenge,” in Open Cities | Open Data: Collaborative Cities in the Information Era, S. Hawken, H. Han, and C. Pettit, Eds., Singapore: Springer Nature, 2020, pp. 29–55. [CrossRef]
- L. Gan, H. Shi, Y. Hu, B. Lev, and H. Lan, “Coupling coordination degree for urbanization city-industry integration level: Sichuan case,” Sustainable Cities and Society, vol. 58, p. 102136, Jul. 2020. [CrossRef]
- A. Loder, L. Ambühl, M. Menendez, and K. W. Axhausen, “Understanding traffic capacity of urban networks,” Sci Rep, vol. 9, no. 1, Art. no. 1, Nov. 2019. [CrossRef]
- F. Lyu and L. Zhang, “Using multi-source big data to understand the factors affecting urban park use in Wuhan,” Urban Forestry & Urban Greening, vol. 43, p. 126367, Jul. 2019. [CrossRef]
- K. Shi, Z. Chang, Z. Chen, J. Wu, and B. Yu, “Identifying and evaluating poverty using multisource remote sensing and point of interest (POI) data: A case study of Chongqing, China,” Journal of Cleaner Production, vol. 255, p. 120245, May 2020. [CrossRef]
- I. U. Din, M. Guizani, J. J. P. C. Rodrigues, S. Hassan, and V. V. Korotaev, “Machine learning in the Internet of Things: Designed techniques for smart cities,” Future Generation Computer Systems, vol. 100, pp. 826–843, Nov. 2019. [CrossRef]
- V. Chaturvedi and W. T. de Vries, “Machine Learning Algorithms for Urban Land Use Planning: A Review,” Urban Science, vol. 5, no. 3, Art. no. 3, Sep. 2021. [CrossRef]
- S. Nosratabadi, A. Mosavi, R. Keivani, S. Ardabili, and F. Aram, “State of the Art Survey of Deep Learning and Machine Learning Models for Smart Cities and Urban Sustainability,” in Engineering for Sustainable Future, A. R. Várkonyi-Kóczy, Ed., in Lecture Notes in Networks and Systems. Cham: Springer International Publishing, 2020, pp. 228–238. [CrossRef]
- S. Fathi, R. Srinivasan, A. Fenner, and S. Fathi, “Machine learning applications in urban building energy performance forecasting: A systematic review,” Renewable and Sustainable Energy Reviews, vol. 133, p. 110287, Nov. 2020. [CrossRef]
- M. Goldhammer, S. Köhler, S. Zernetsch, K. Doll, B. Sick, and K. Dietmayer, “Intentions of Vulnerable Road Users—Detection and Forecasting by Means of Machine Learning,” IEEE Transactions on Intelligent Transportation Systems, vol. 21, no. 7, pp. 3035–3045, Jul. 2020. [CrossRef]
- C. E. Kontokosta, B. Hong, N. E. Johnson, and D. Starobin, “Using machine learning and small area estimation to predict building-level municipal solid waste generation in cities,” Computers, Environment and Urban Systems, vol. 70, pp. 151–162, Jul. 2018. [CrossRef]
- D. Ki and S. Lee, “Analyzing the effects of Green View Index of neighborhood streets on walking time using Google Street View and deep learning,” Landscape and Urban Planning, vol. 205, p. 103920, Jan. 2021. [CrossRef]
- J. Gehl, Cities for people. Island press, 2013.
- G. Du, X. Cao, J. Liang, X. Chen, and Y. Zhan, “Medical image segmentation based on u-net: A review,” Journal of Imaging Science and Technology, vol. 64, no. 2, pp. 20508–1, 2020. [CrossRef]
- H. Zhao, J. Shi, X. Qi, X. Wang, and J. Jia, “Pyramid scene parsing network,” in Proceedings of the IEEE conference on computer vision and pattern recognition, 2017, pp. 2881–2890.
- L.-C. Chen, G. Papandreou, I. Kokkinos, K. Murphy, and A. L. Yuille, “Deeplab: Semantic image segmentation with deep convolutional nets, atrous convolution, and fully connected crfs,” IEEE transactions on pattern analysis and machine intelligence, vol. 40, no. 4, pp. 834–848, 2017.
- M. Tan and Q. Le, “EfficientNetV2: Smaller Models and Faster Training,” in Proceedings of the 38th International Conference on Machine Learning, PMLR, Jul. 2021, pp. 10096–10106. Accessed: May 29, 2023. [Online]. Available: https://proceedings.mlr.press/v139/tan21a.html.
- T. E. Oliphant, A guide to NumPy, vol. 1. Trelgol Publishing USA, 2006.
- F. Pedregosa et al., “Scikit-learn: Machine learning in Python,” the Journal of machine Learning research, vol. 12, pp. 2825–2830, 2011.
- M. L. Waskom, “Seaborn: statistical data visualization,” Journal of Open Source Software, vol. 6, no. 60, p. 3021, 2021.
- J. Ji, J. Li, S. Yan, Q. Tian, and B. Zhang, “Min-max hash for jaccard similarity,” in 2013 IEEE 13th International Conference on Data Mining, IEEE, 2013, pp. 301–309.
Figure 1.
Research framework for the present study.
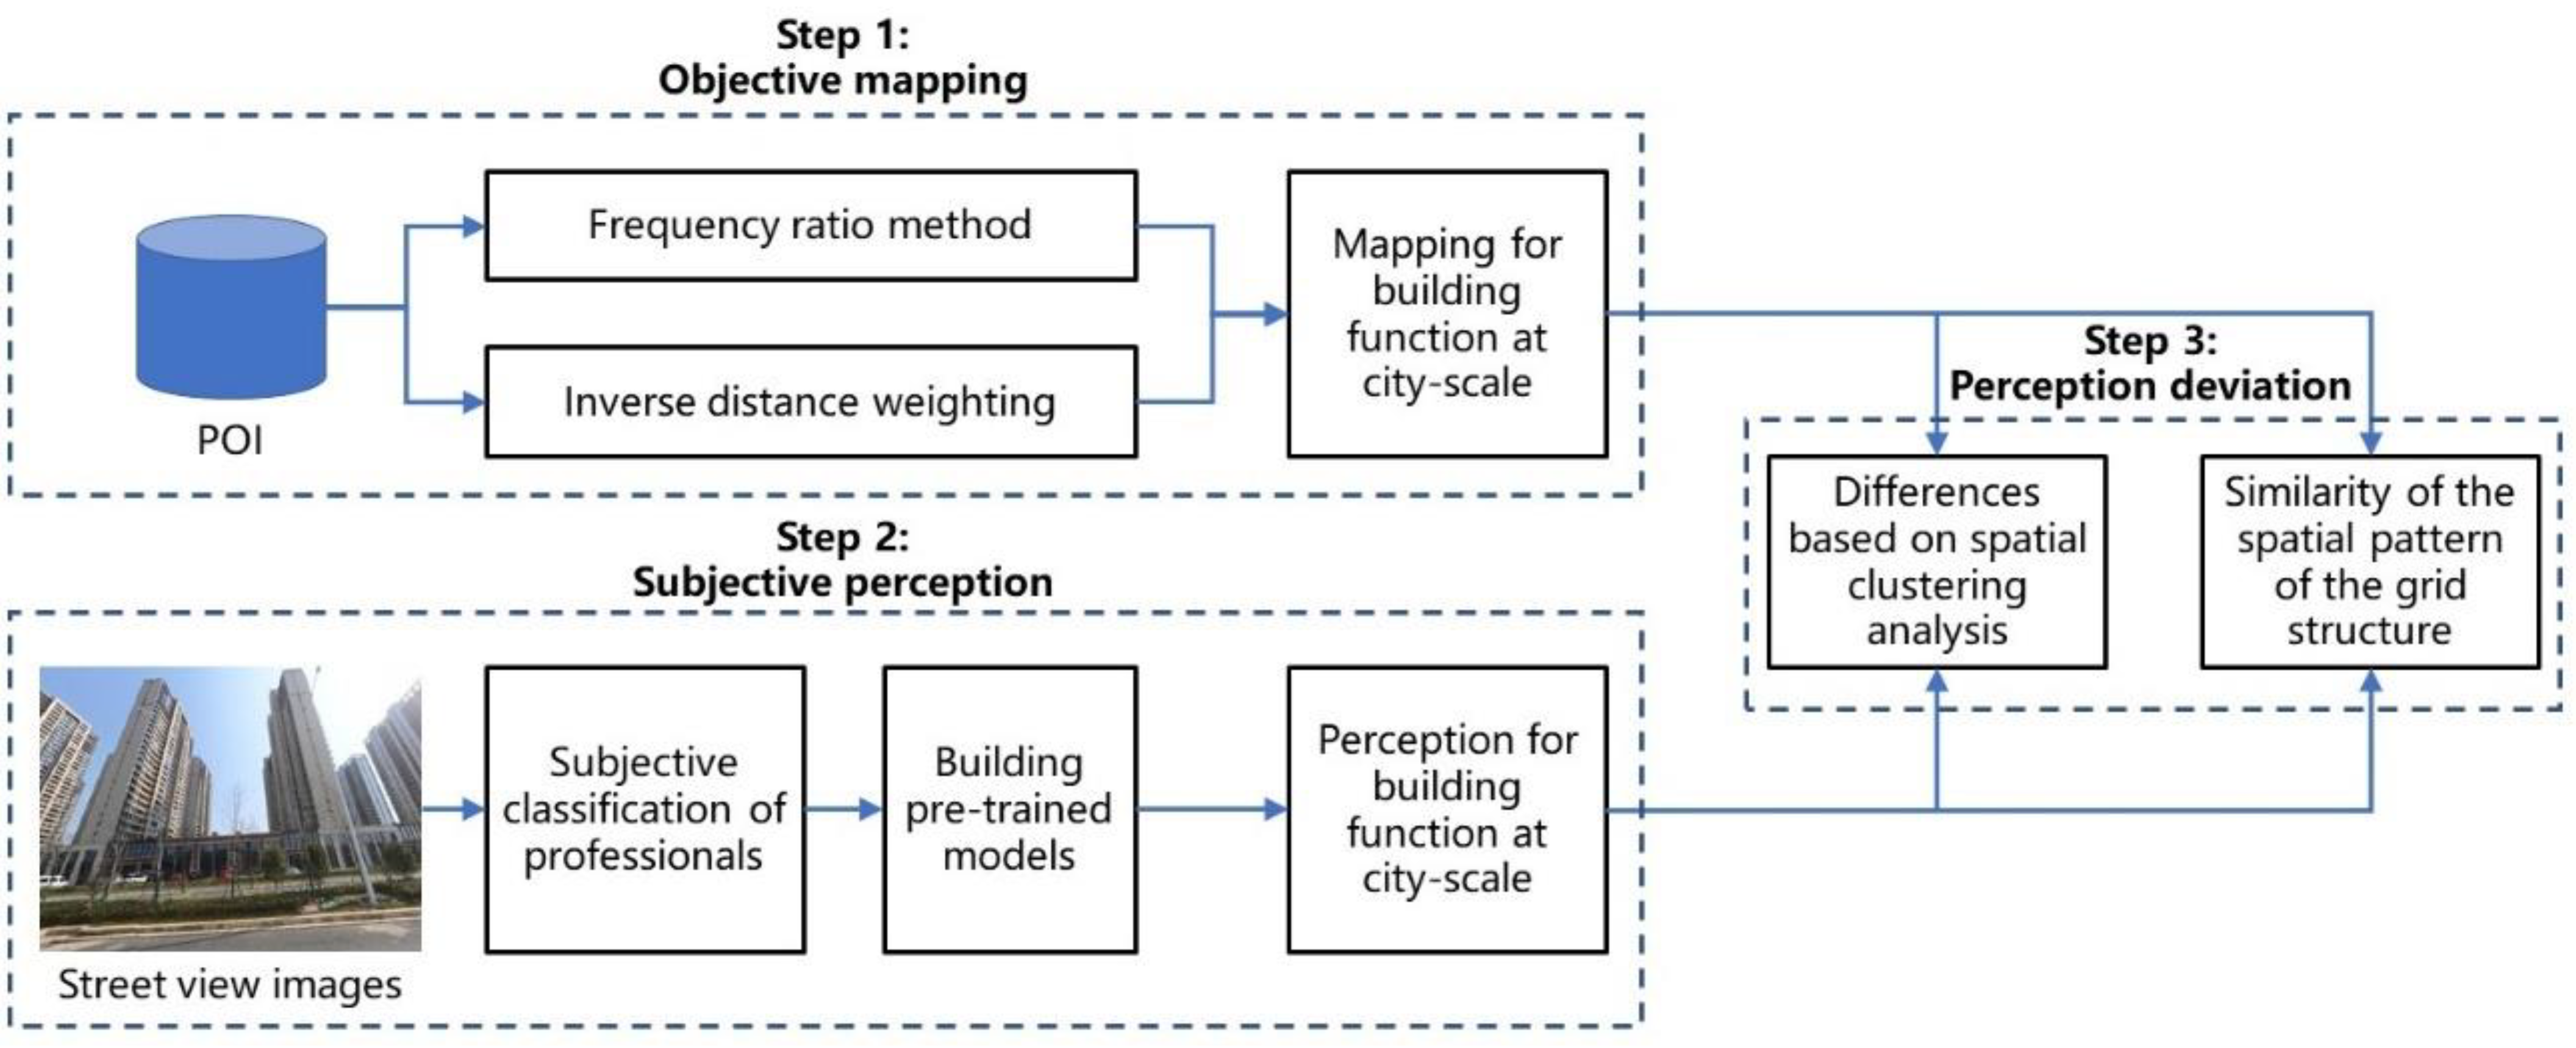
Figure 2.
Overview of the study area for the present study: (a) location of Shanghai, (b) location of Shanghai's central urban district, (c) the road network in Shanghai's central urban district.
Figure 2.
Overview of the study area for the present study: (a) location of Shanghai, (b) location of Shanghai's central urban district, (c) the road network in Shanghai's central urban district.
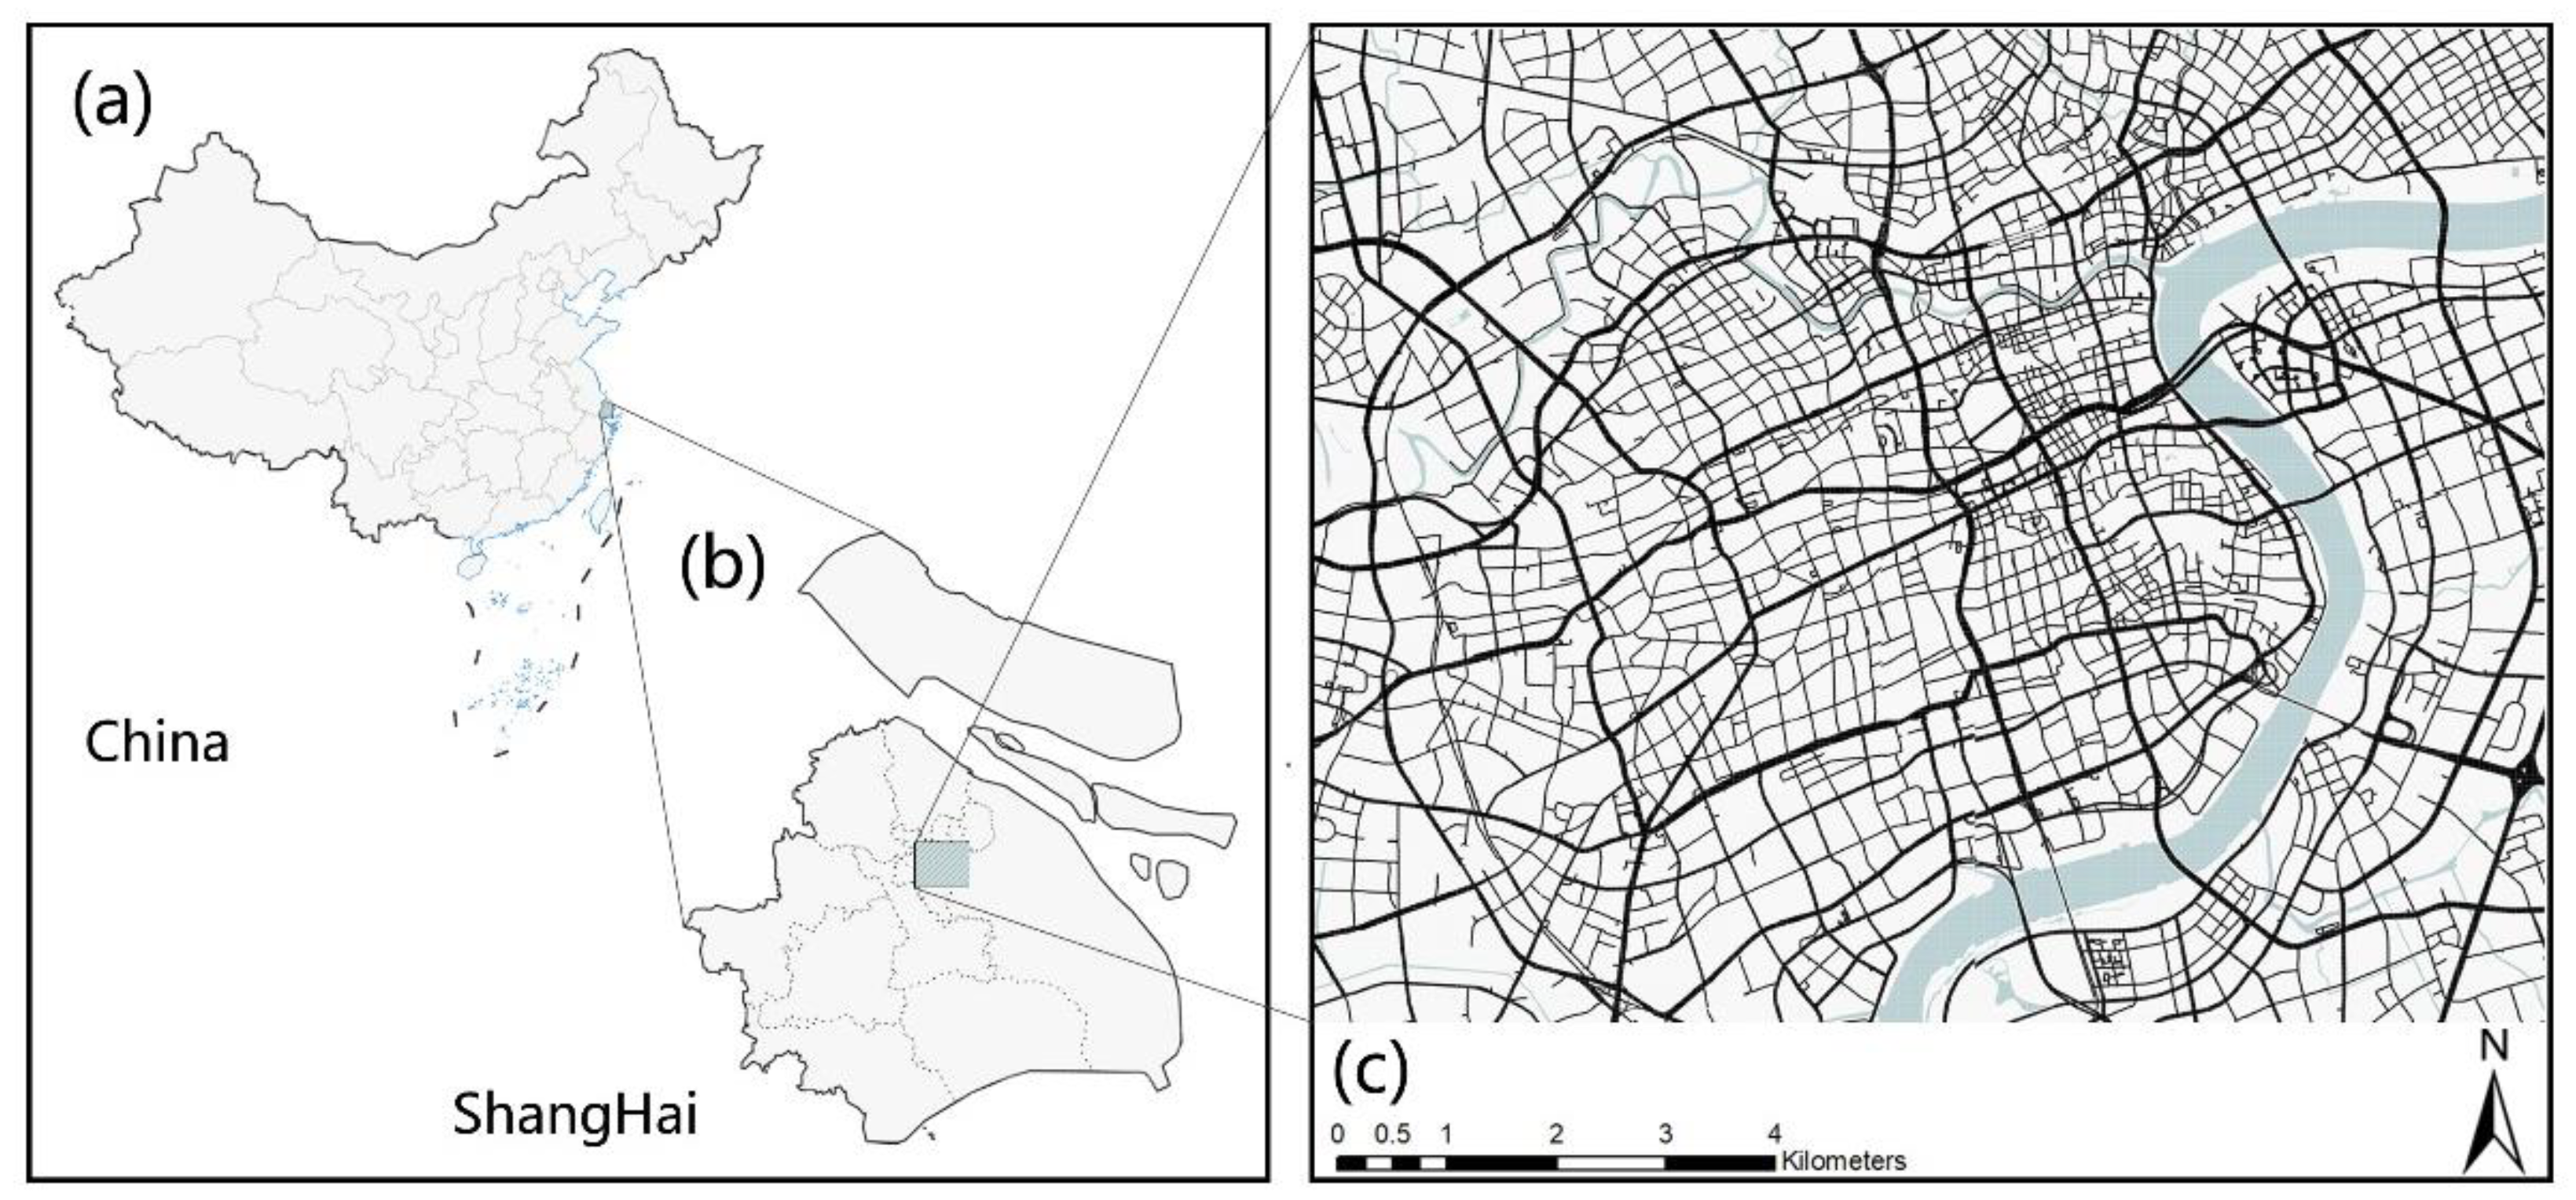
Figure 3.
Building function and building categories
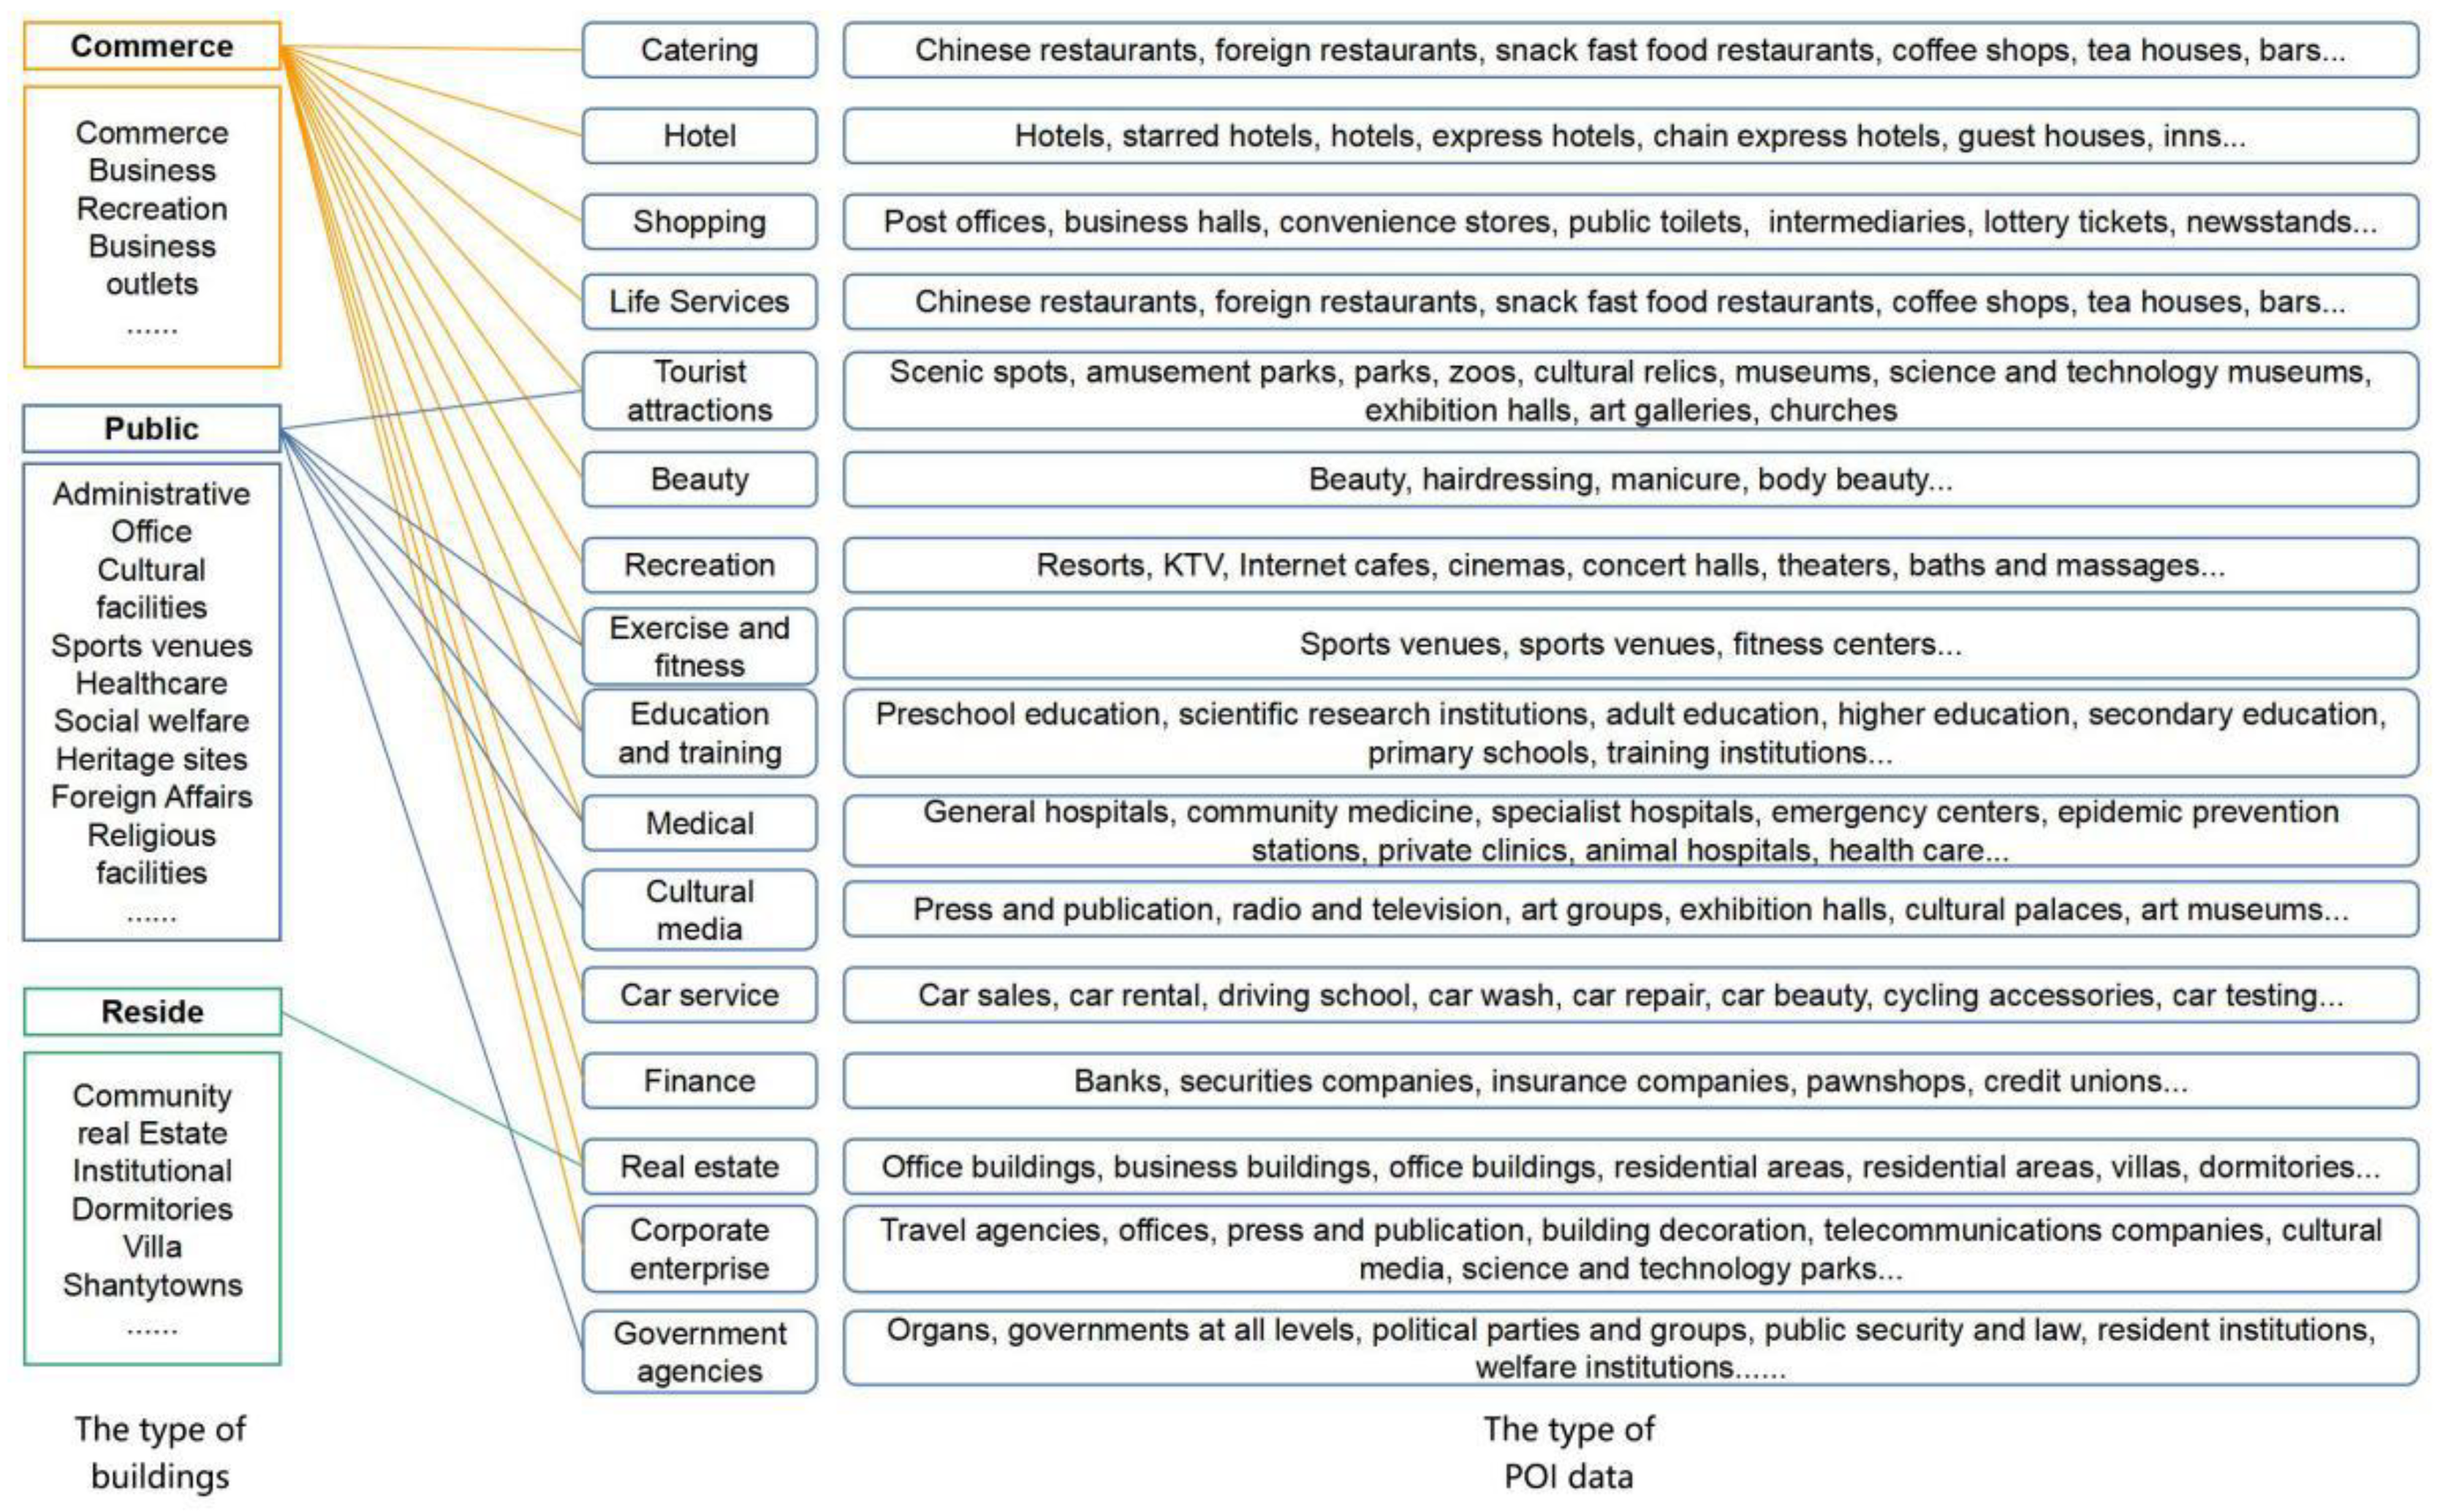
Figure 4.
Inverse distance weighting
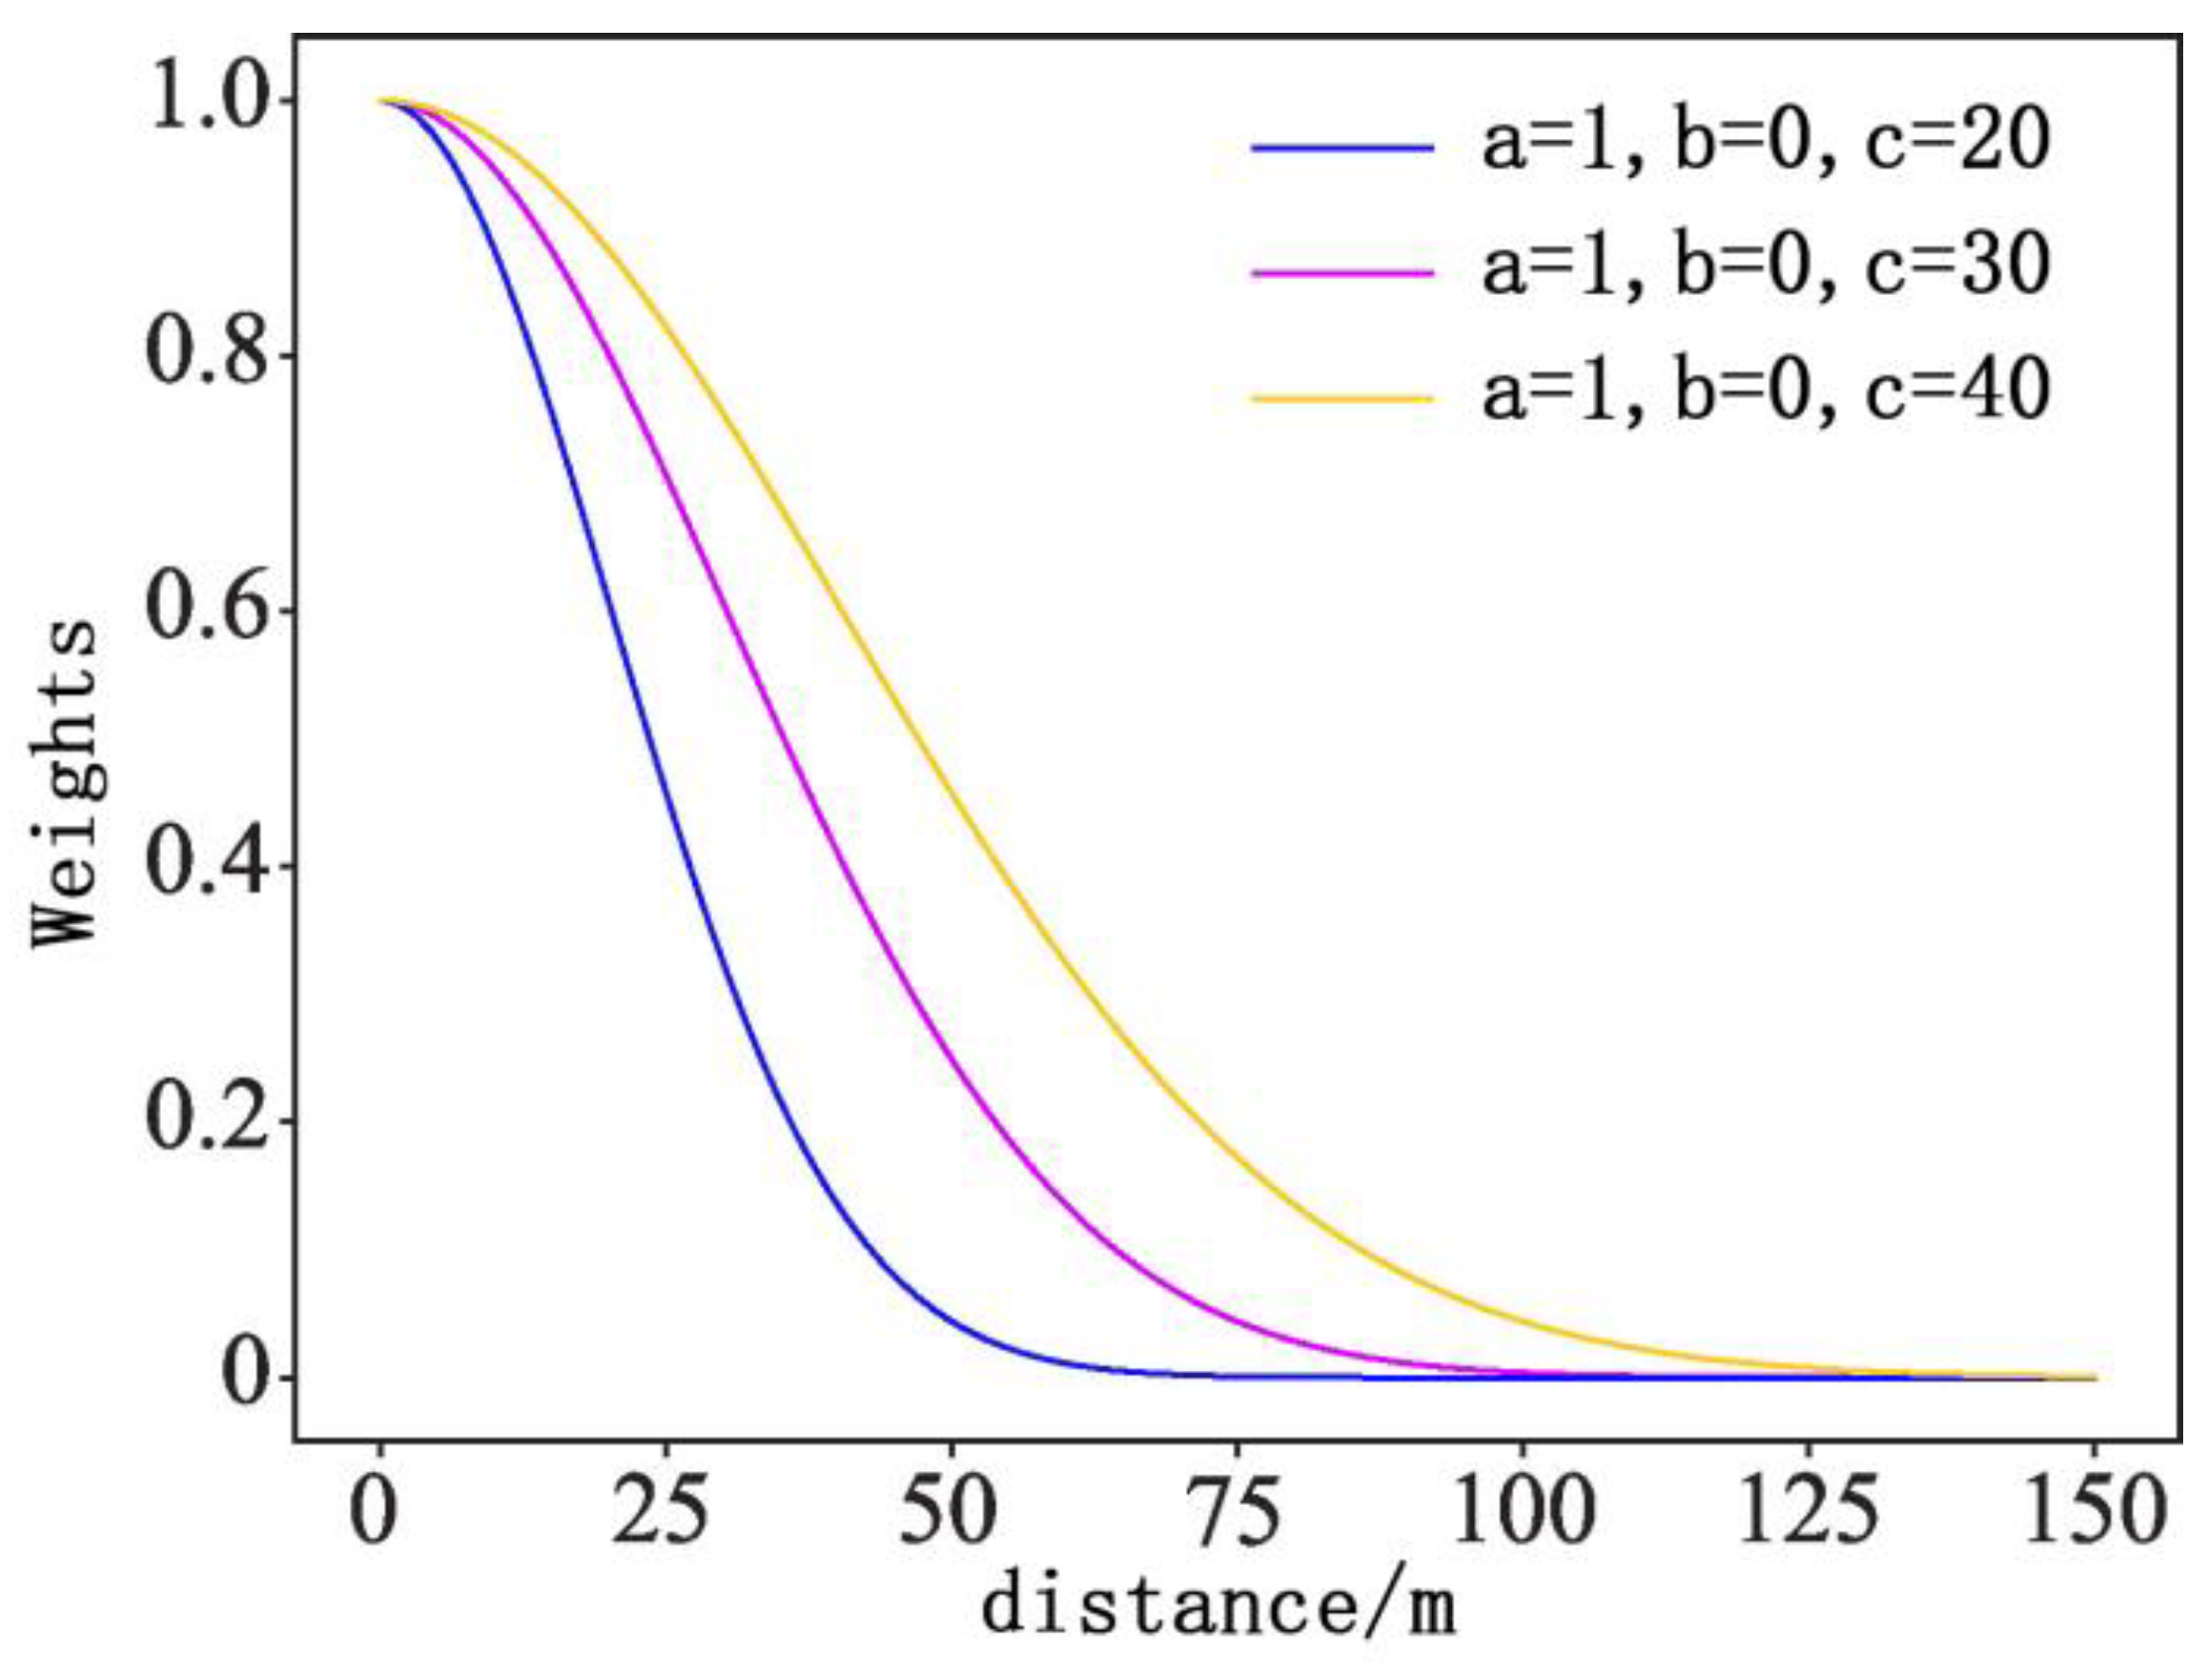
Figure 5.
Street view images acquisition at the sampling point.
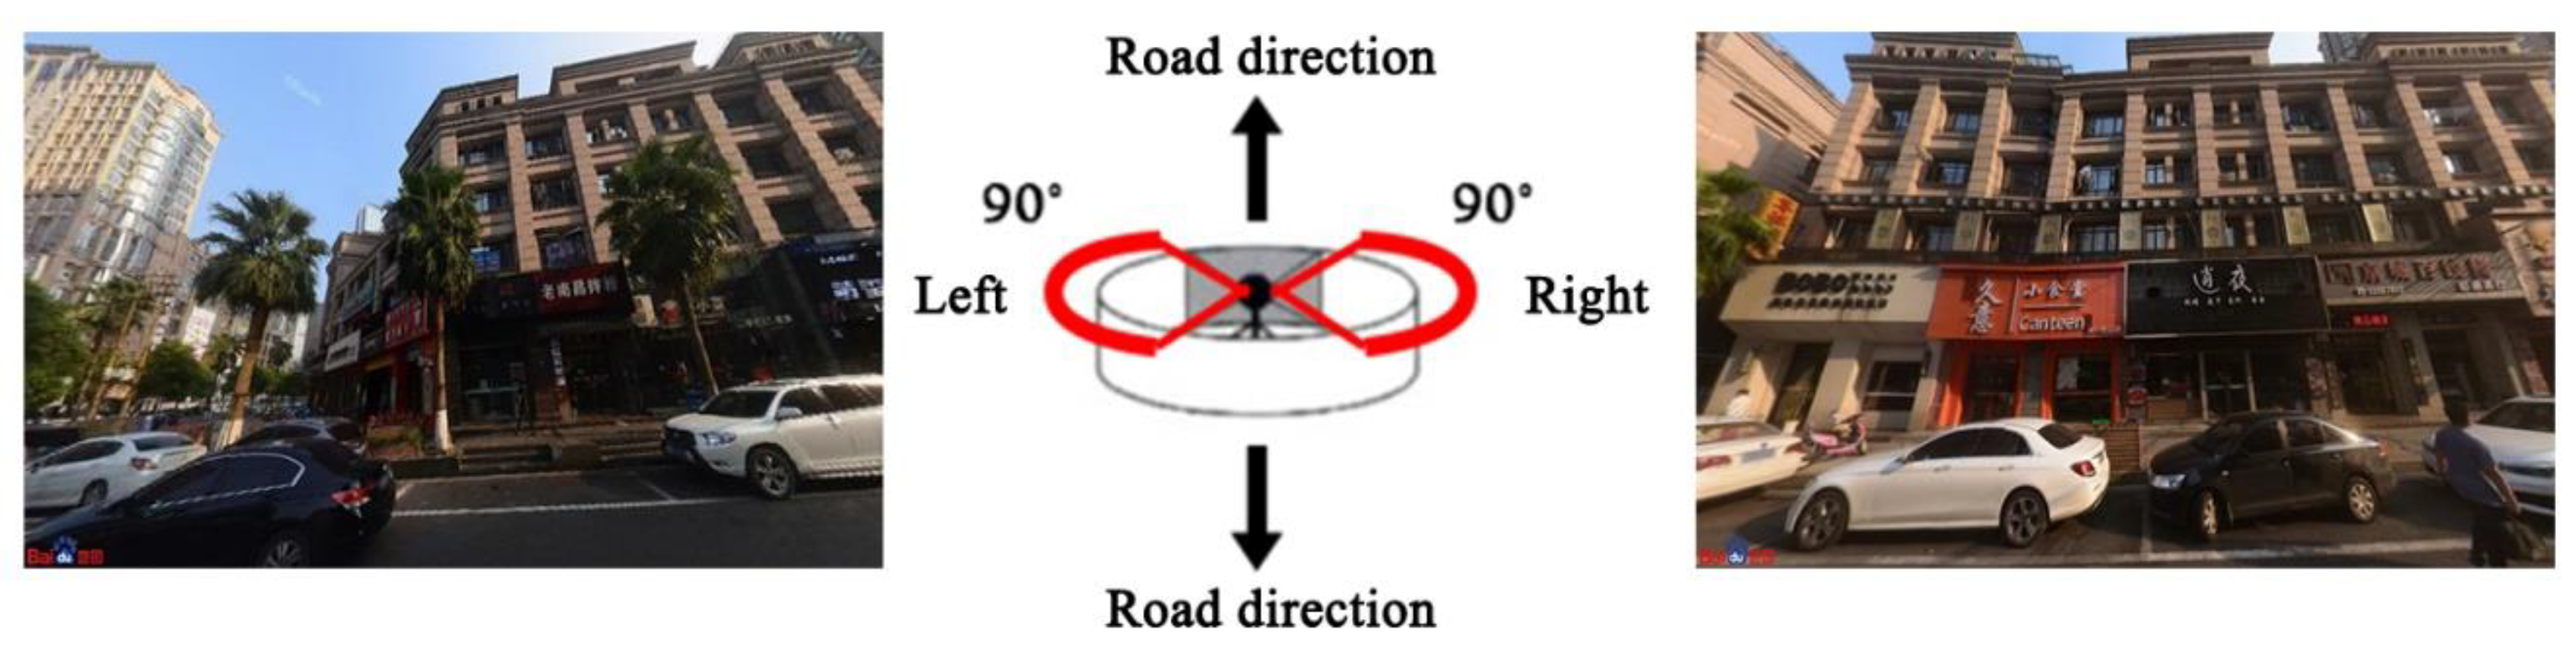
Figure 6.
Street view image segmentation through Deeplabv3. (a) Commercial buildings, (b) public buildings, (c) a low building proportion.
Figure 6.
Street view image segmentation through Deeplabv3. (a) Commercial buildings, (b) public buildings, (c) a low building proportion.
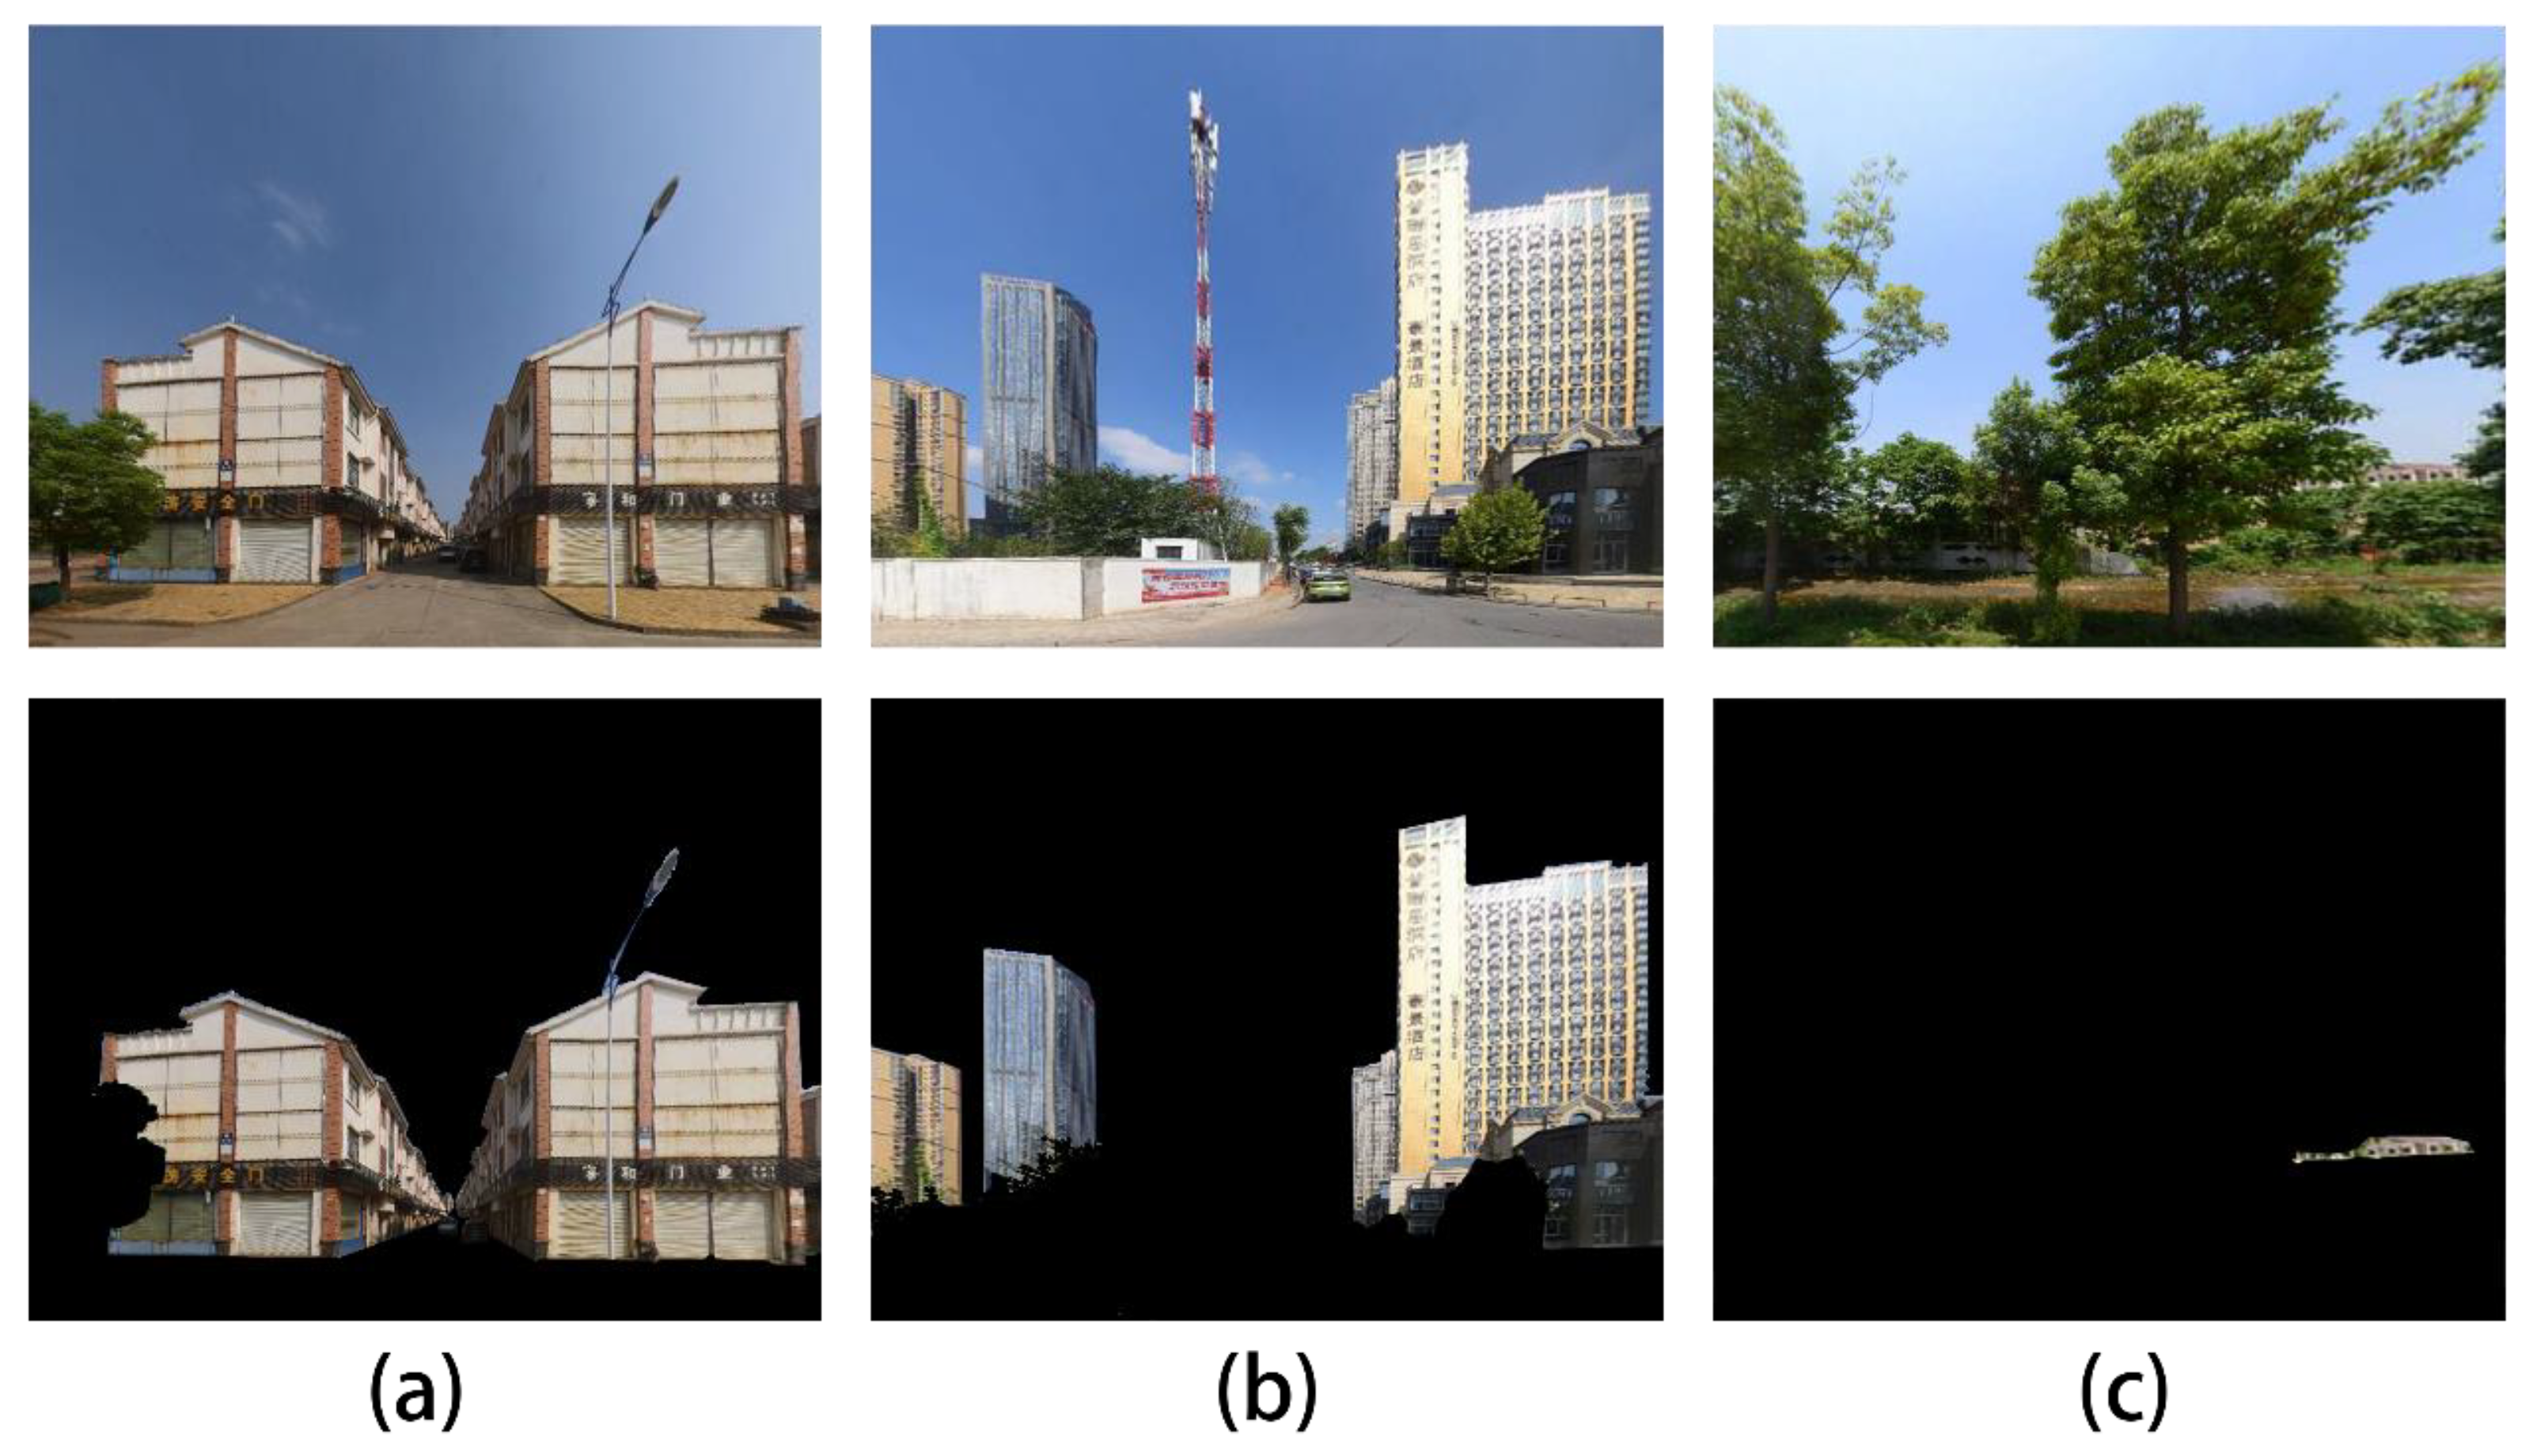
Figure 7.
Four types of building functions are included. The first line is single-label class, from left to right: residence, commerce, public, and other facilities. The second line is the multi-label class, from left to right: residence and commerce, commerce and public, residence and public, no data.
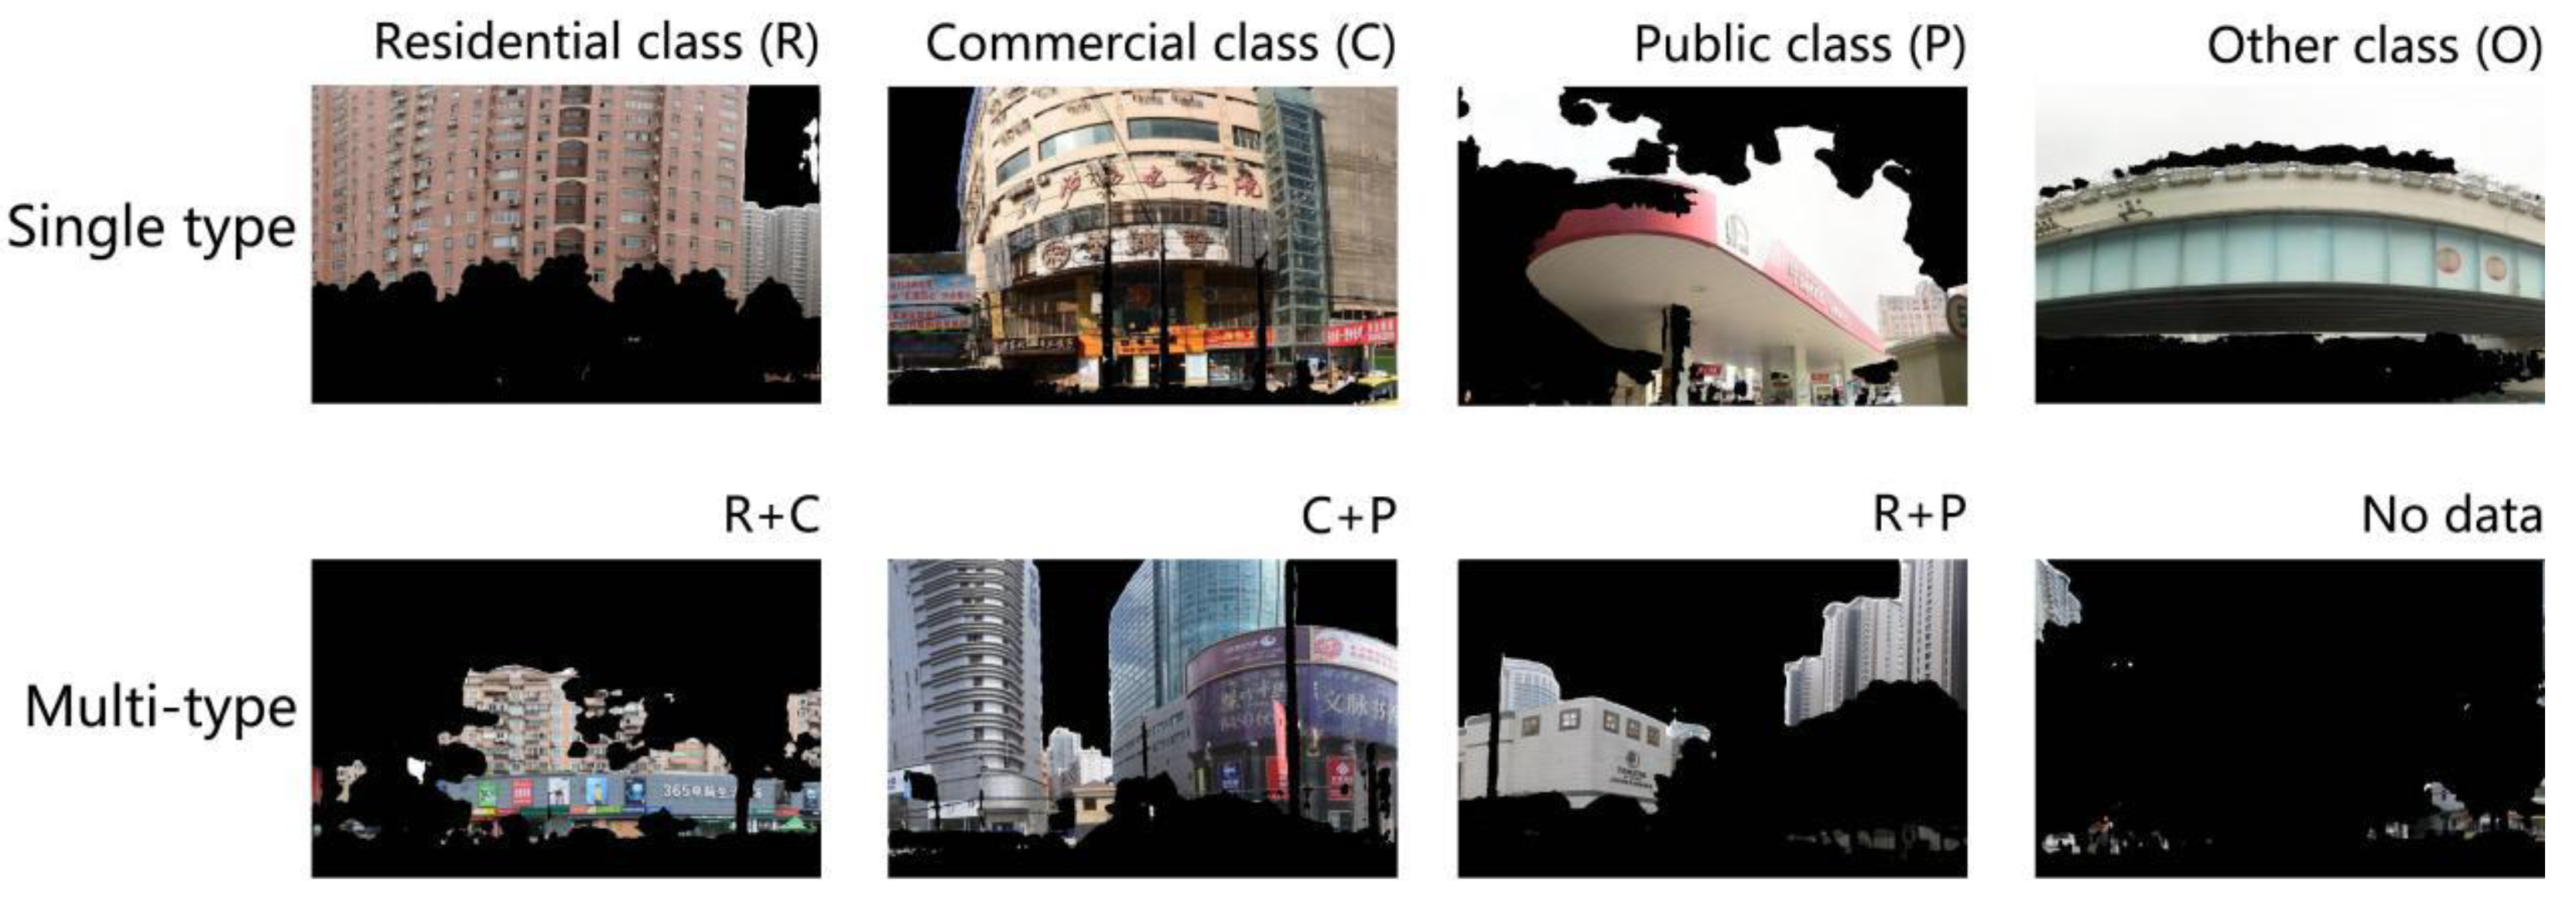
Figure 8.
Urban building classification map based on AOI data.
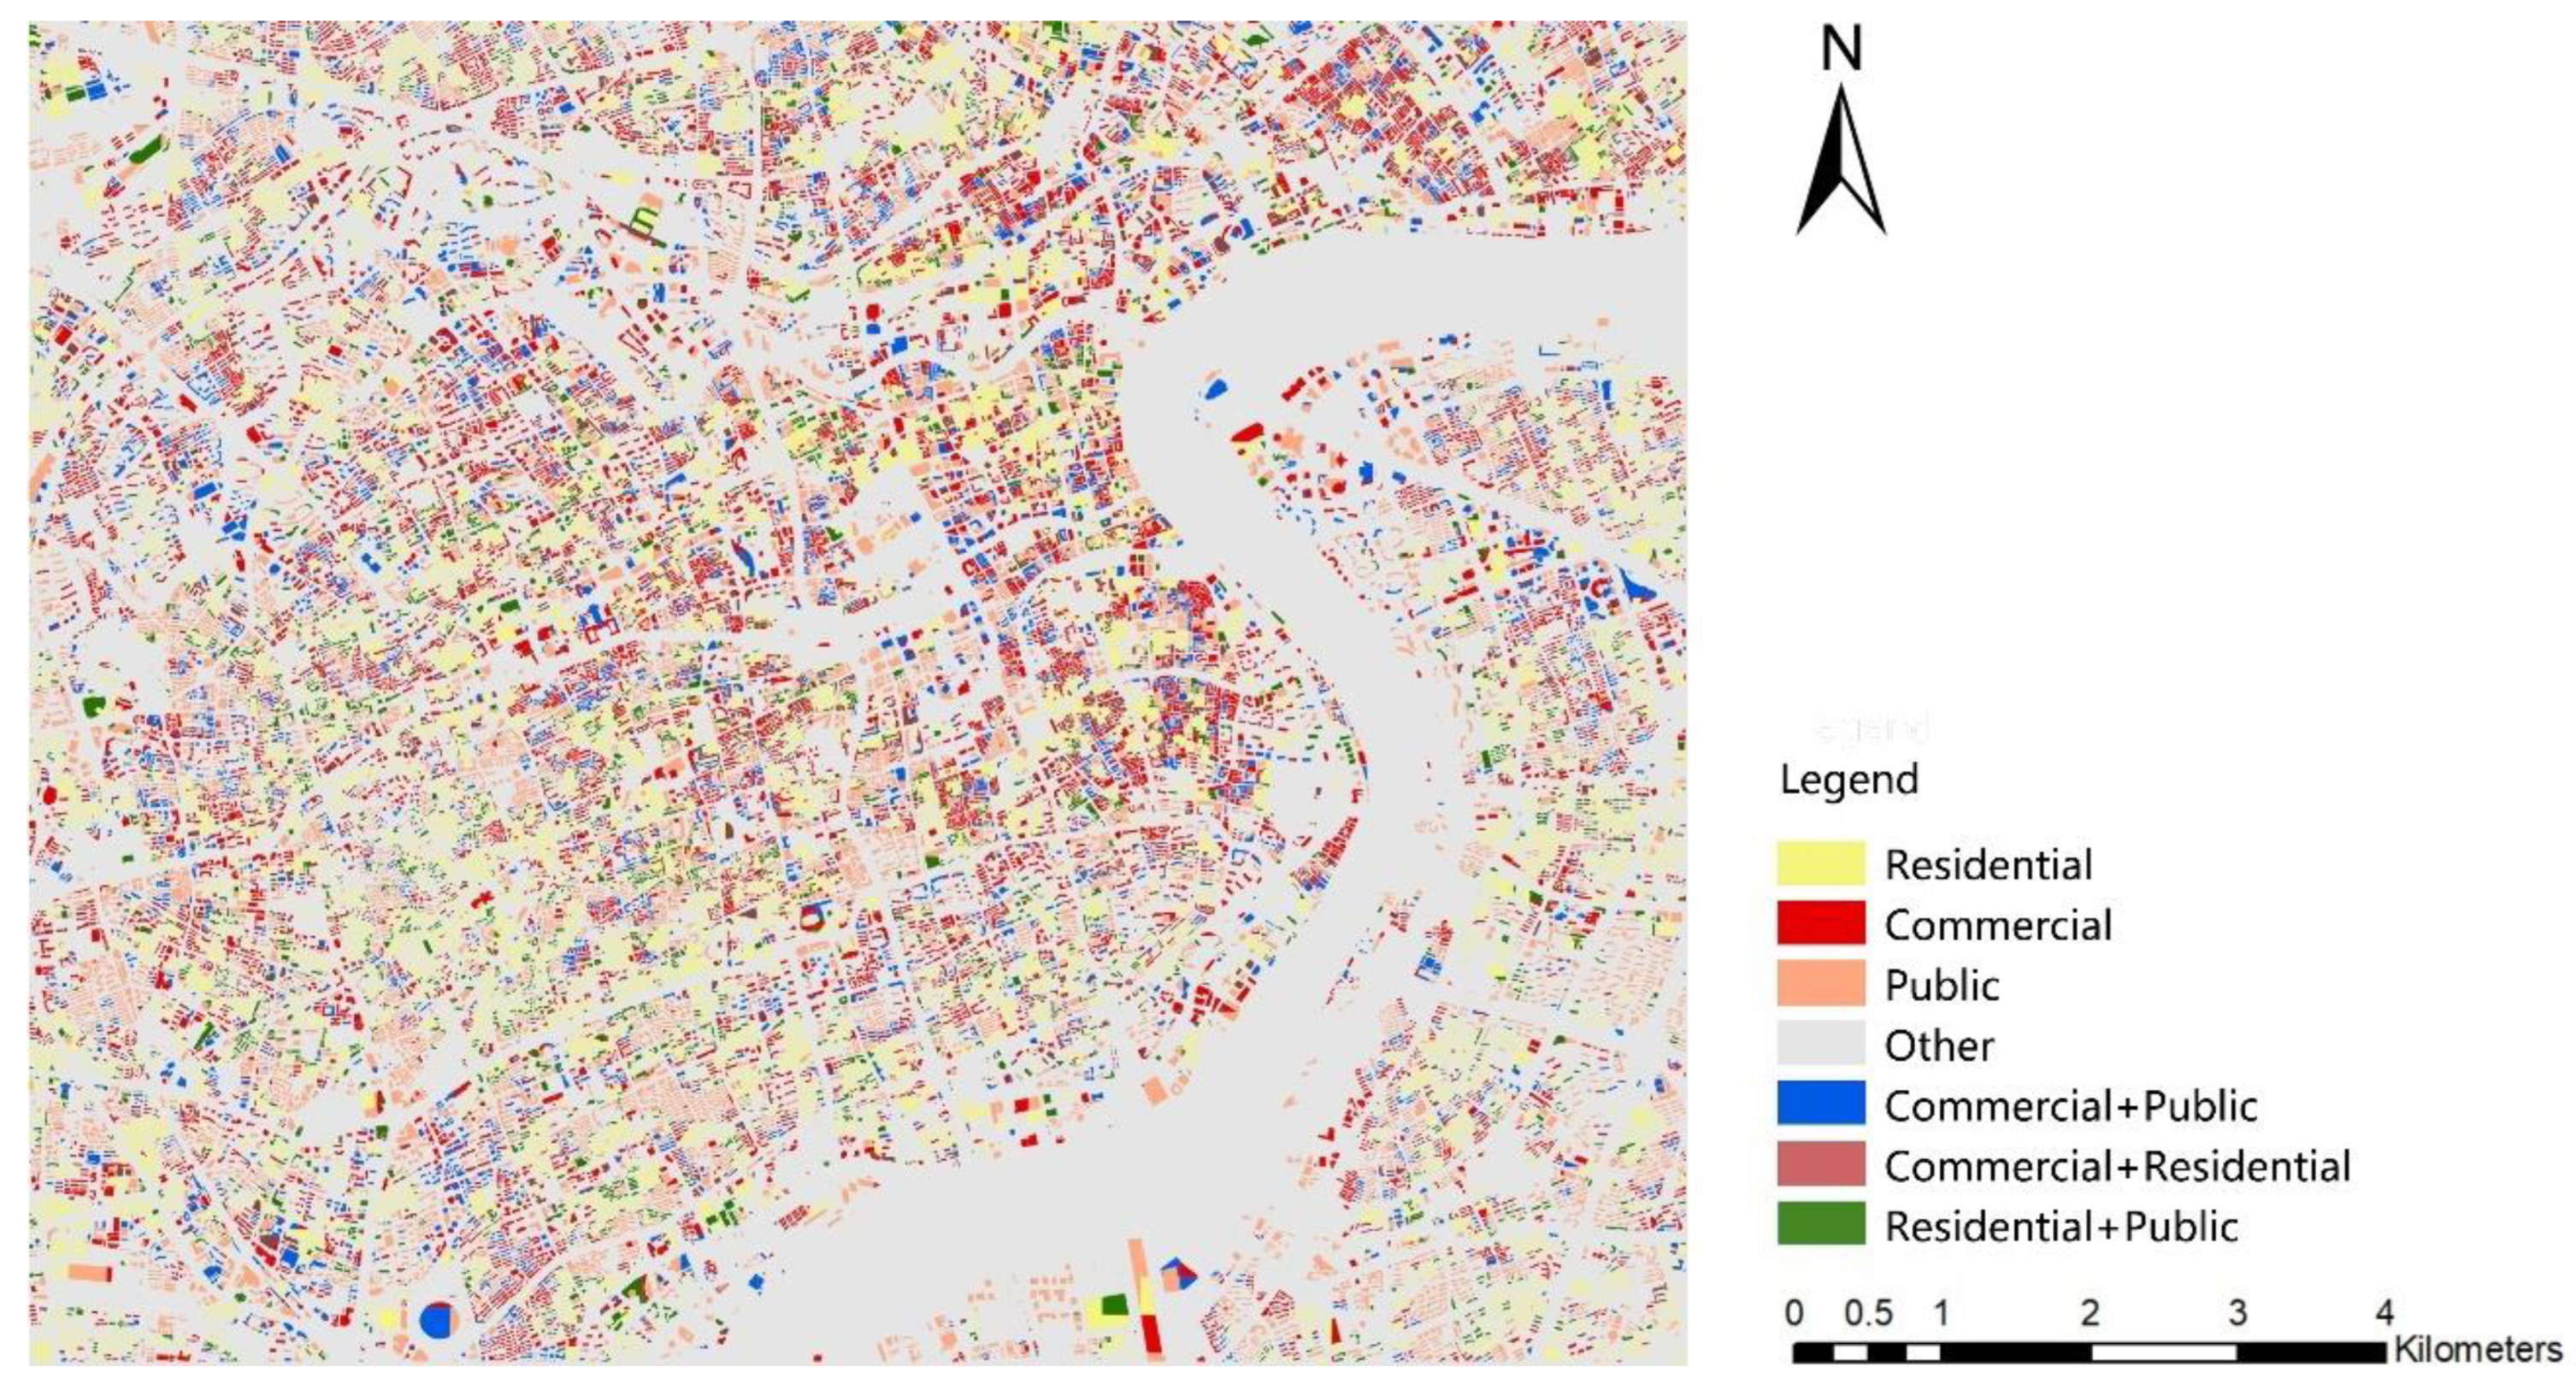
Figure 9.
Results of building classification based on POI data.
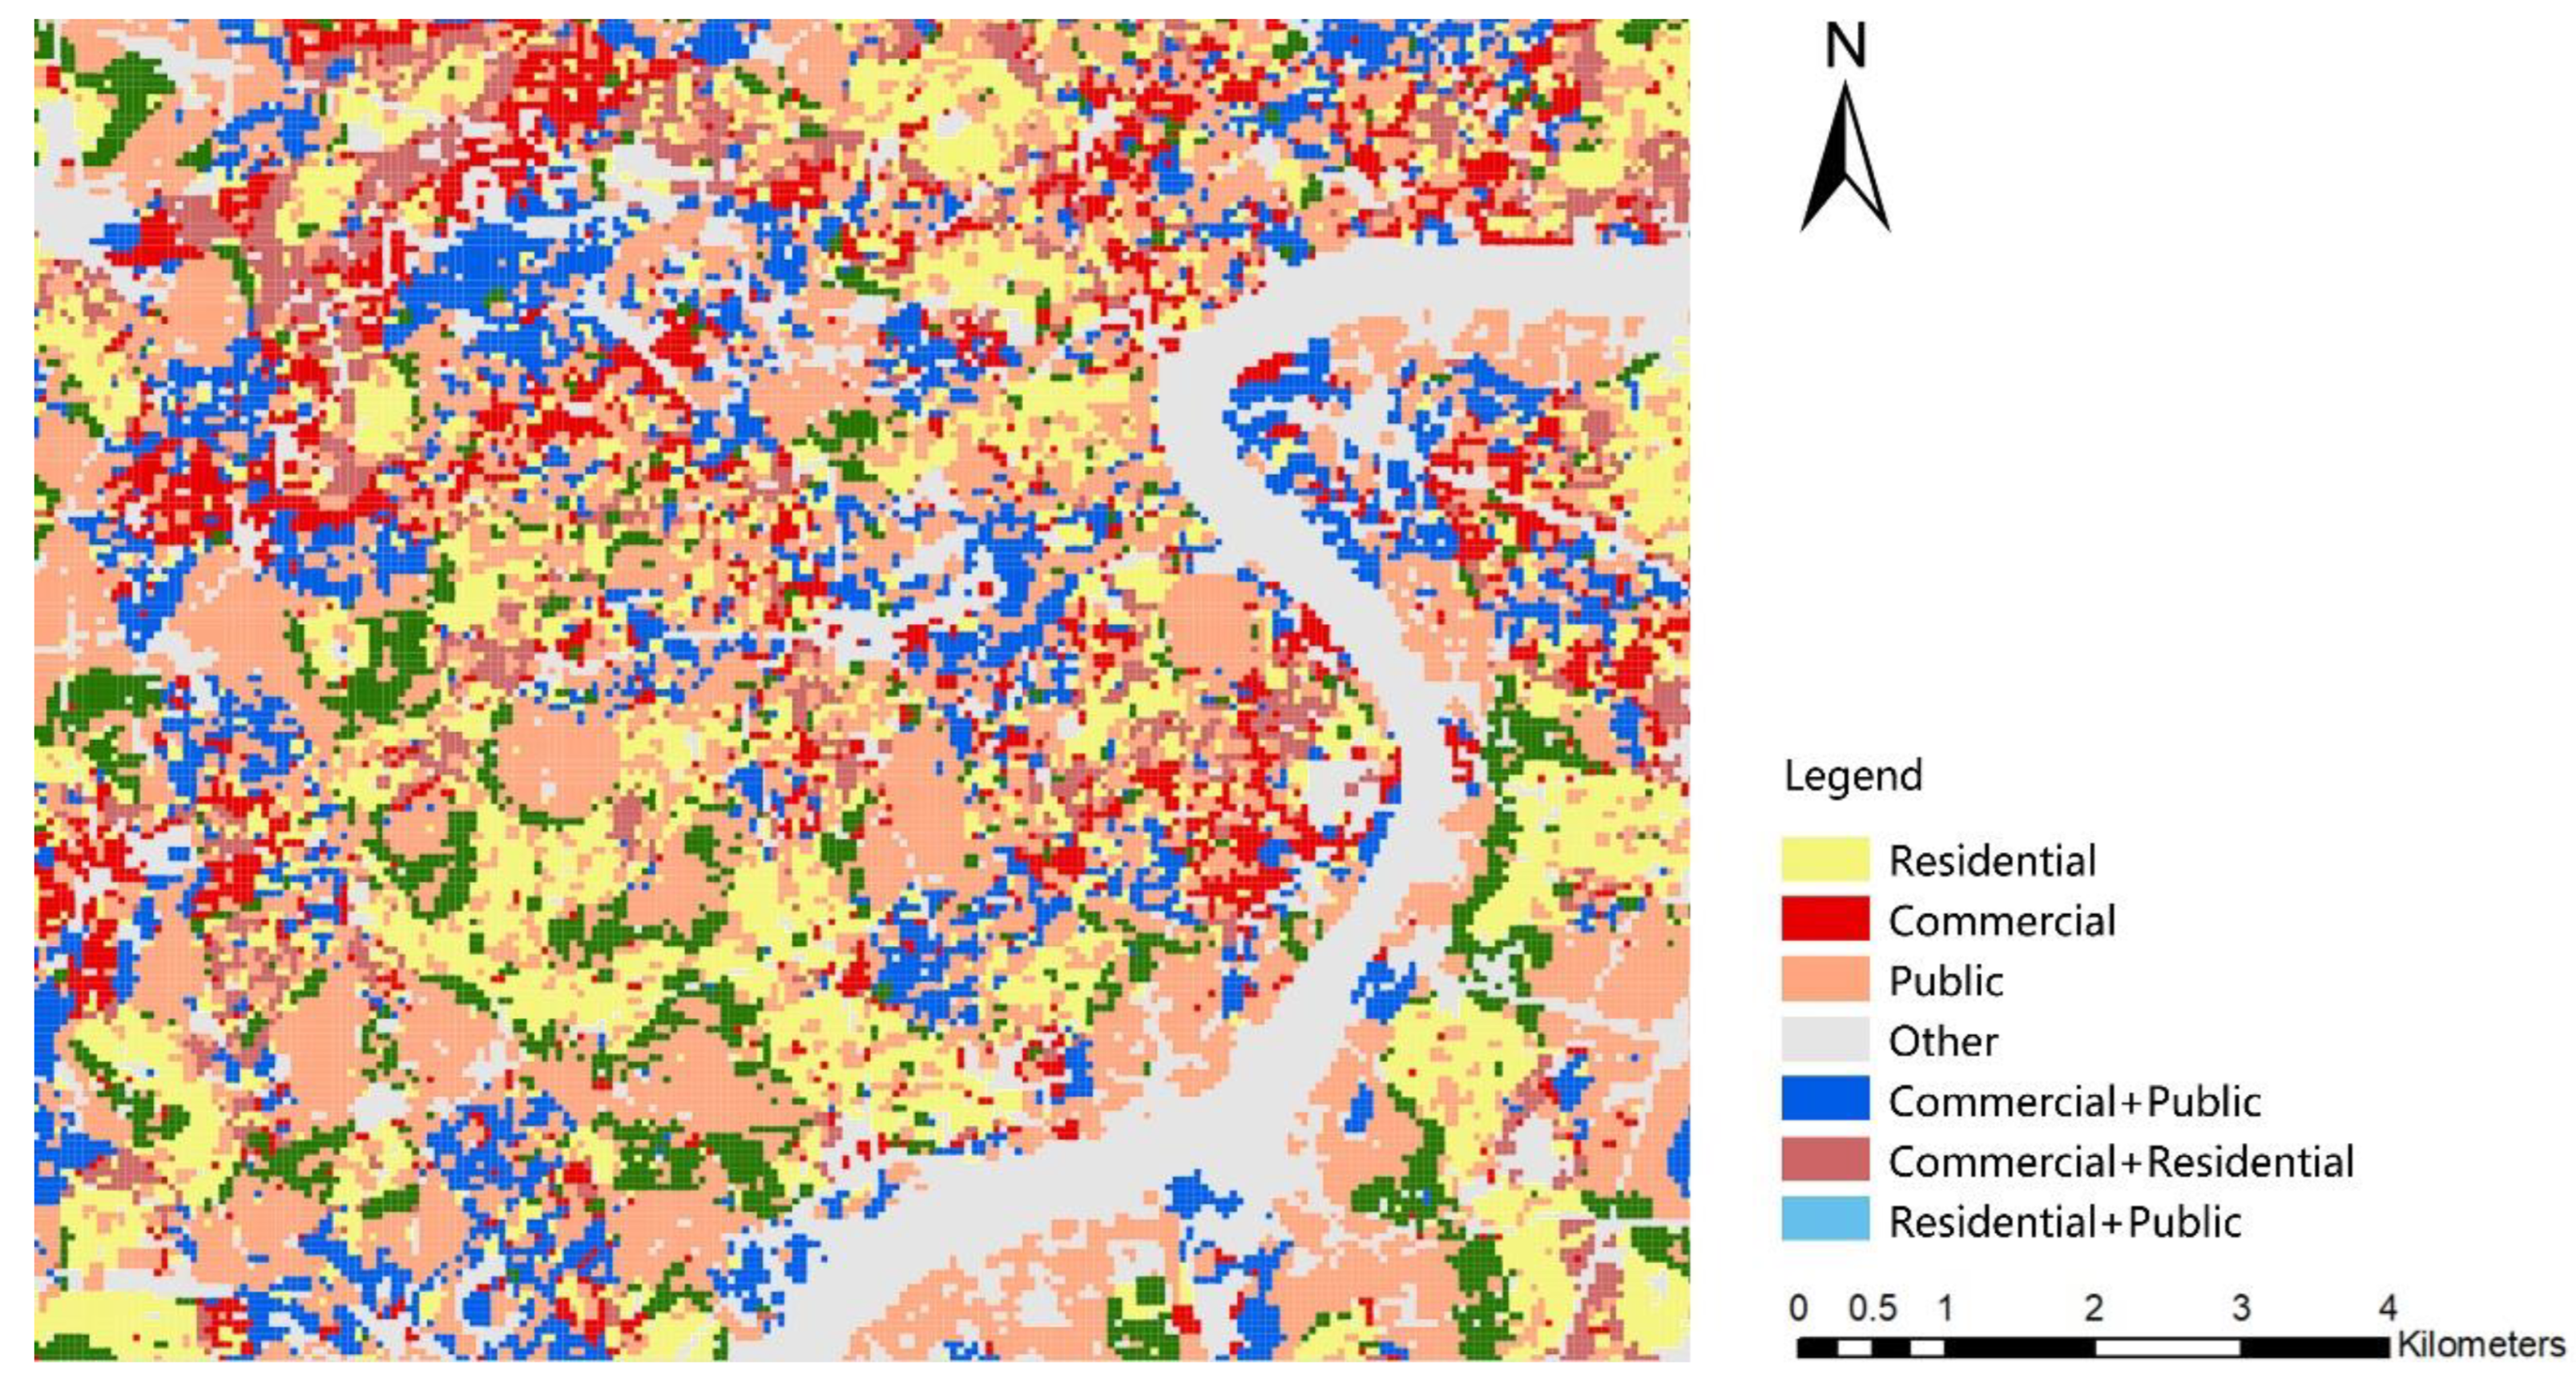
Figure 10.
illustrates the normalized confusion matrices of the seven architectural function classifications.
Figure 10.
illustrates the normalized confusion matrices of the seven architectural function classifications.
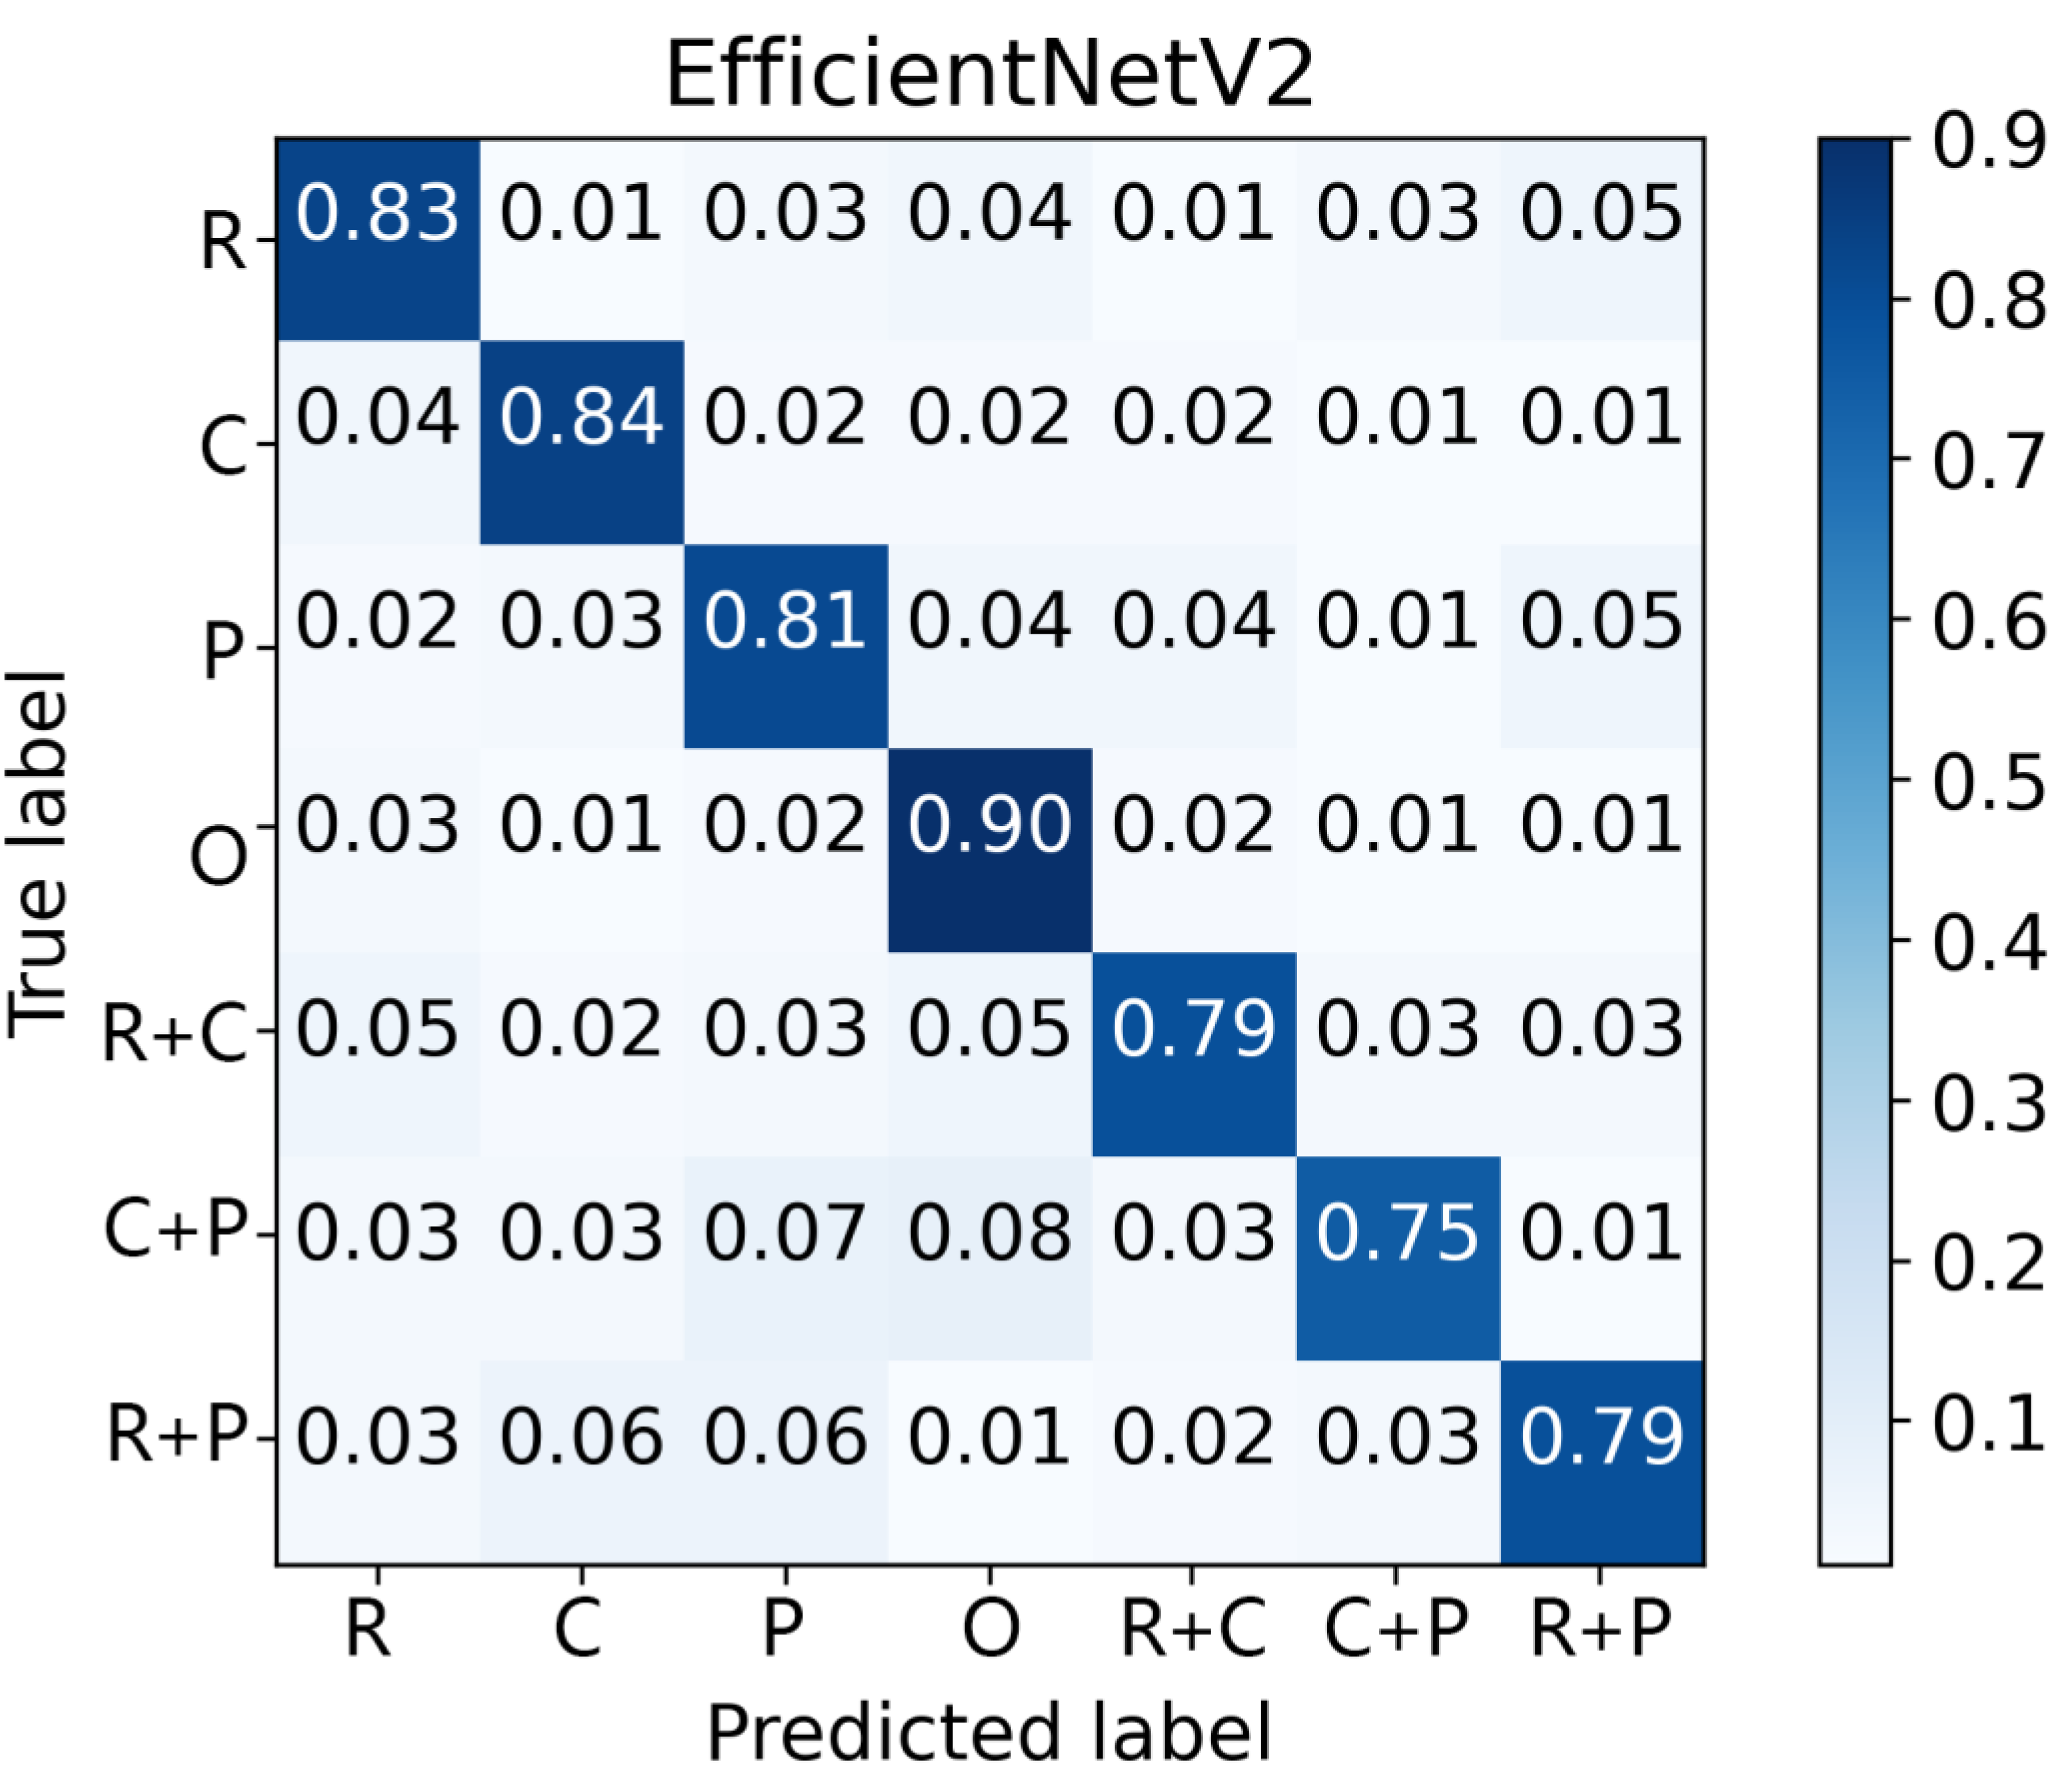
Figure 11.
Results of visual perception of urban building function classification of streetscape pictures at street scale.
Figure 11.
Results of visual perception of urban building function classification of streetscape pictures at street scale.
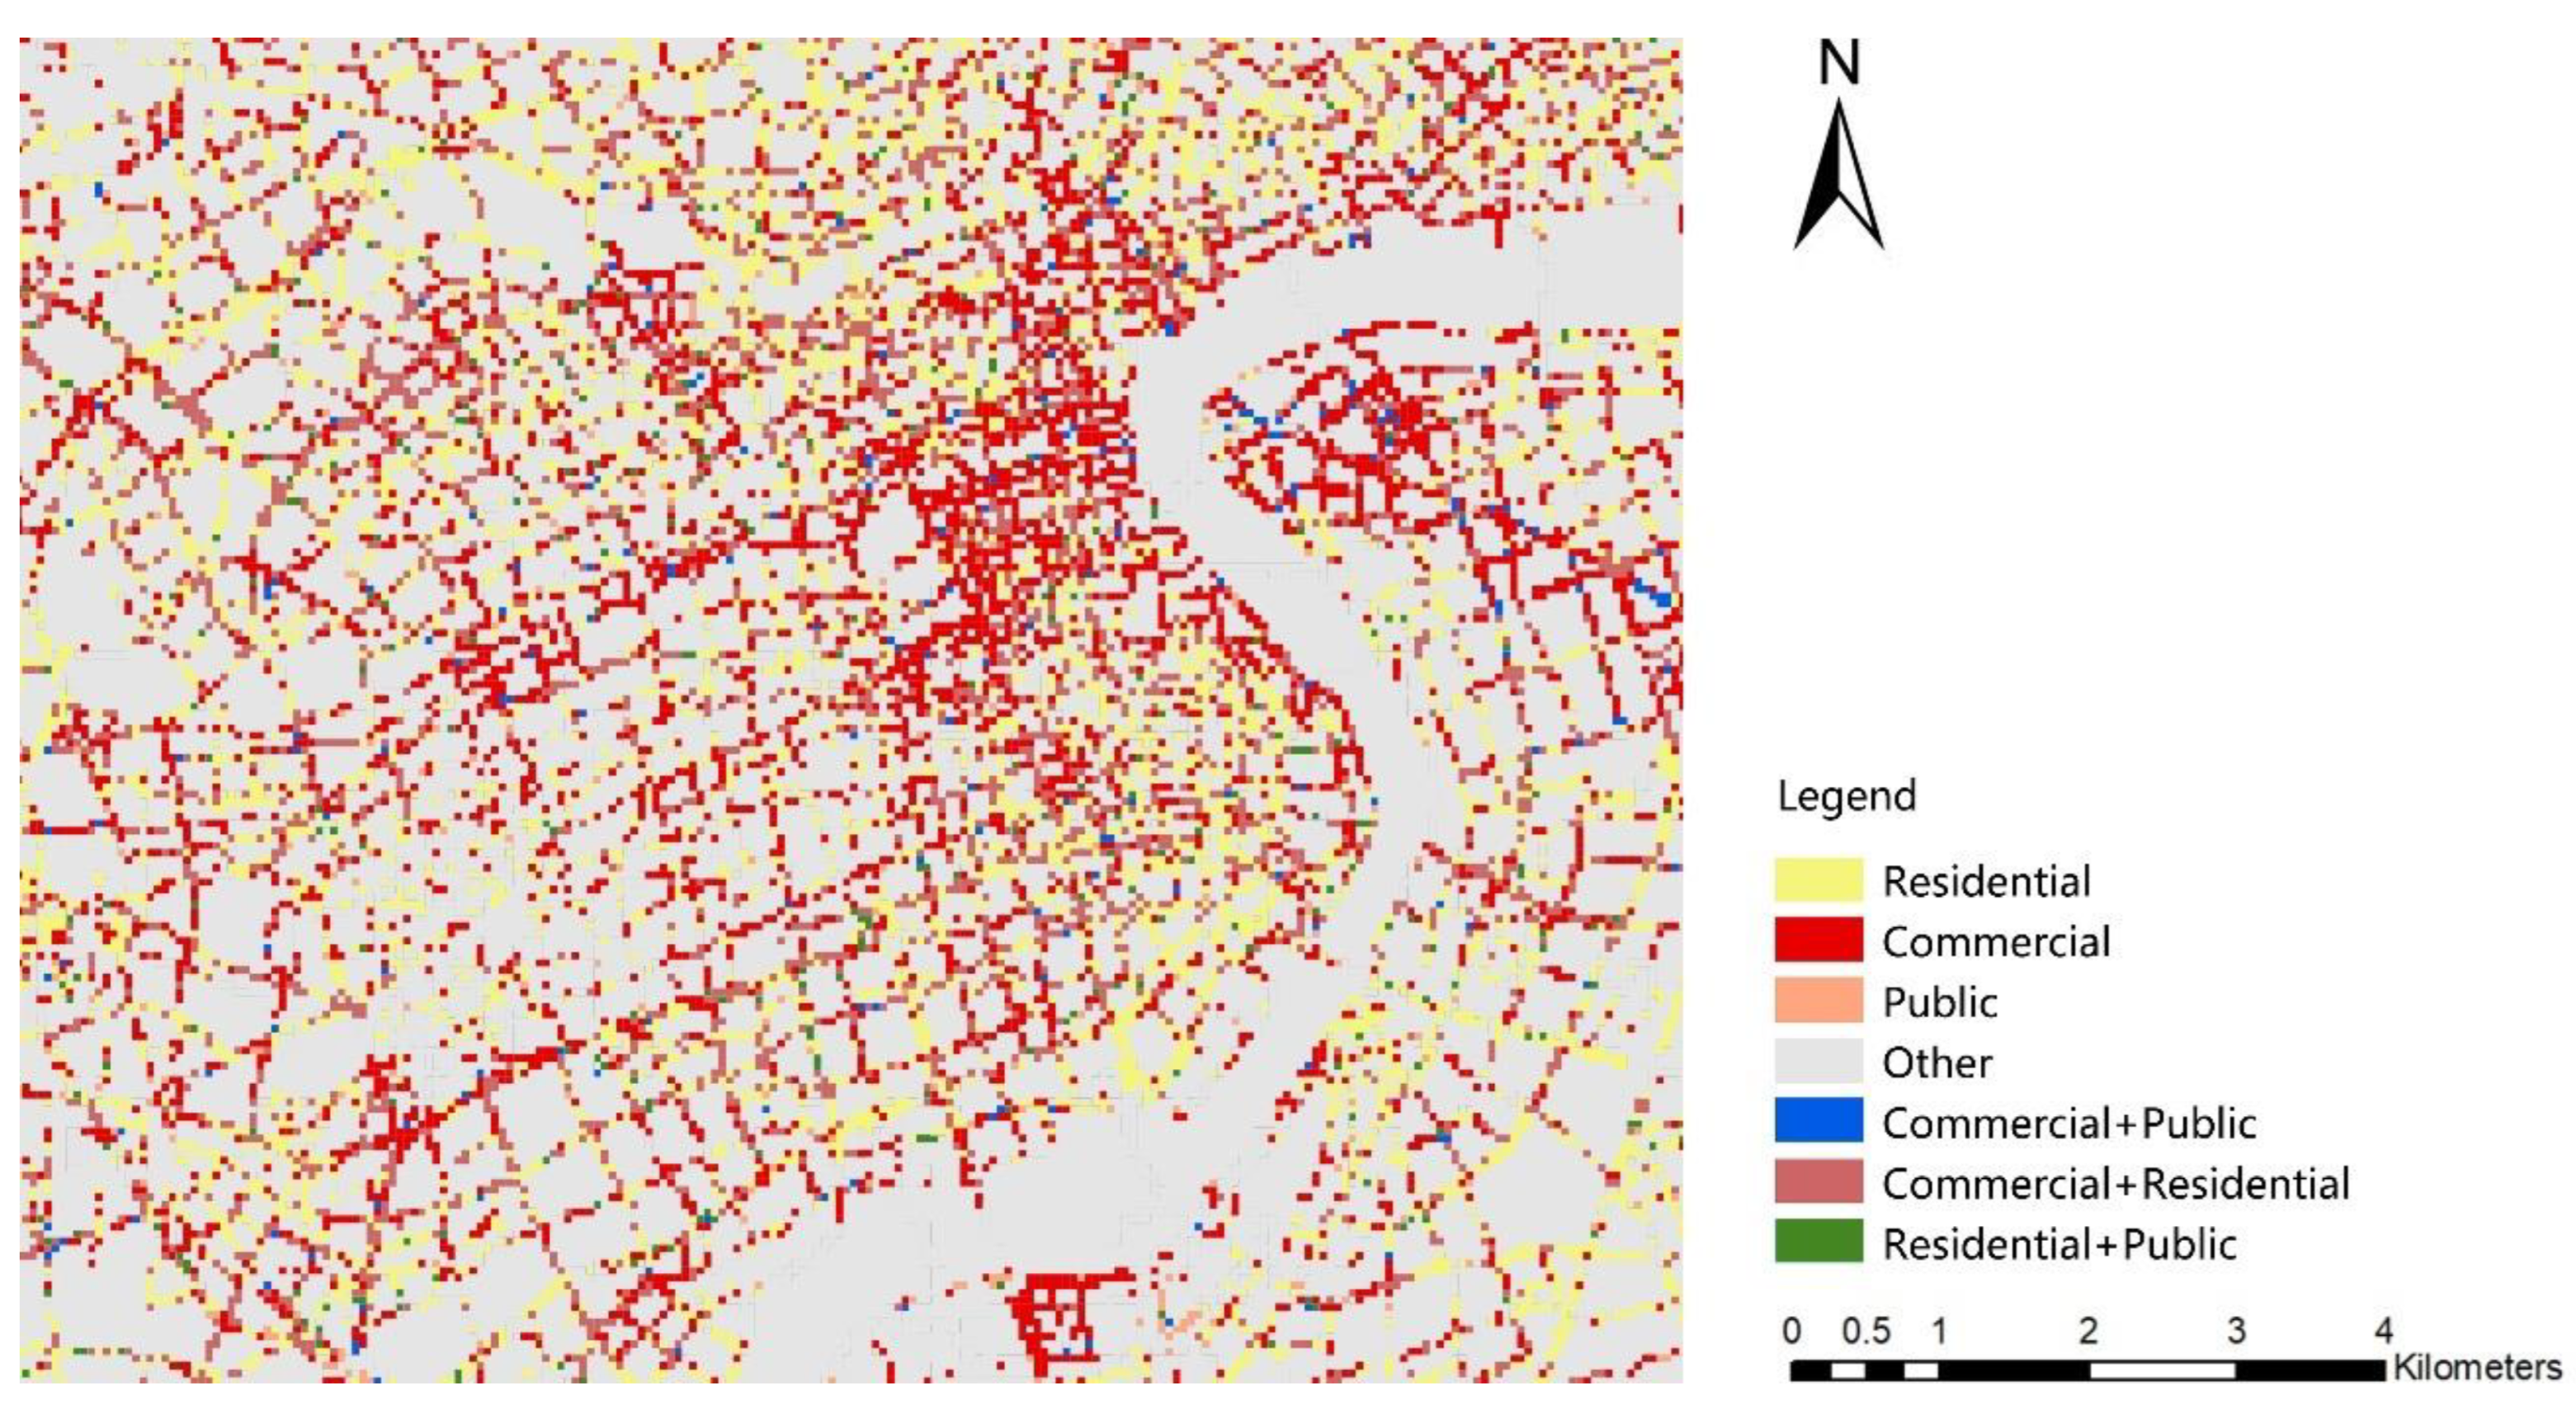
Figure 12.
Differences in building function distribution based on spatial clustering analysis.
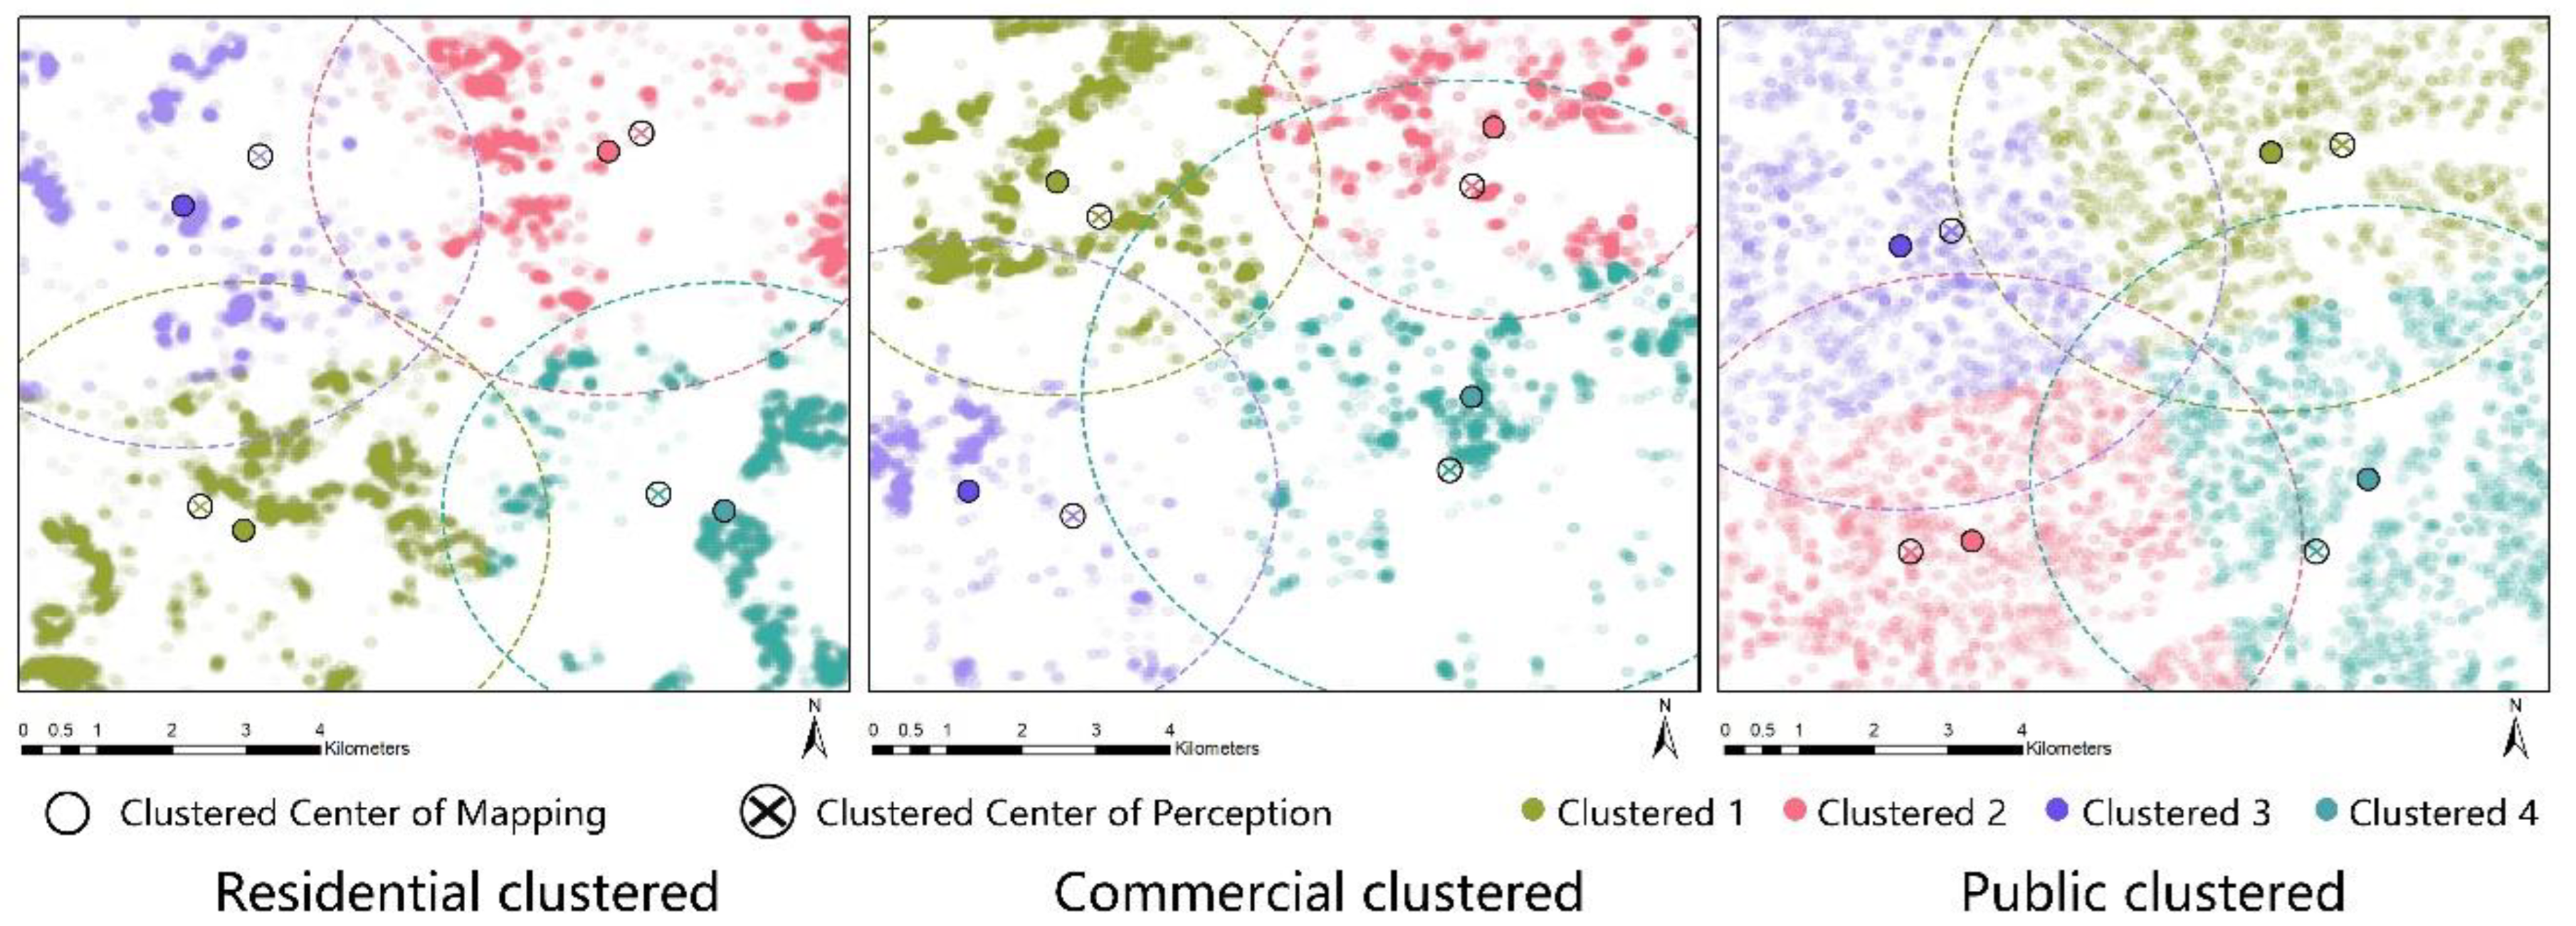
Figure 13.
Grid structure spatial pattern similarity.
Disclaimer/Publisher’s Note: The statements, opinions and data contained in all publications are solely those of the individual author(s) and contributor(s) and not of MDPI and/or the editor(s). MDPI and/or the editor(s) disclaim responsibility for any injury to people or property resulting from any ideas, methods, instructions or products referred to in the content. |
© 2023 by the authors. Licensee MDPI, Basel, Switzerland. This article is an open access article distributed under the terms and conditions of the Creative Commons Attribution (CC BY) license (http://creativecommons.org/licenses/by/4.0/).
Copyright: This open access article is published under a Creative Commons CC BY 4.0 license, which permit the free download, distribution, and reuse, provided that the author and preprint are cited in any reuse.


