Submitted:
26 February 2025
Posted:
26 February 2025
You are already at the latest version
Abstract
Street vitality is crucial for sustainable urban development, yet current understanding of how built environment perceptions influence vitality remains limited by global statistical approaches and the lack of interpretable frameworks for analyzing spatial heterogeneity. This study proposes a novel multi-level interpretative framework combining Multiscale Geographically Weighted Regression (MGWR) with SHAP values to examine spatial variations in perception-vitality relationships. Using multi-source data from Hohhot, China, including mobile phone signals, POI data, and street view imagery, we analyzed how four dimensions of environmental perception influence street vitality across different urban contexts. The analysis reveals significant spatial heterogeneity in perception-vitality relationships, with varying effects across urban locations. Pleasure perception shows the strongest positive influence (SHAP values 0.072-0.103), while convenience perception exhibits an unexpected inverse U-shaped relationship with vitality. The machine learning approach (R² = 0.421) outperforms traditional methods in capturing nonlinear effects and complex interactions. The findings demonstrate the importance of considering both spatial heterogeneity and nonlinear relationships in understanding street vitality, suggesting the need for context-sensitive approaches to urban design and planning interventions.
Keywords:
street vitality
; built environment perception
; spatial heterogeneity
; MGWR
; SHAP values
; machine learning
1. Introduction
Street vitality, as a fundamental indicator of urban quality, has become increasingly critical amid rapid global urbanization [1,2]. The unprecedented pace of urbanization in developing countries, particularly China, has fundamentally transformed traditional street life patterns and challenged our understanding of how built environments shape urban vitality [3,4]. Recent studies have made significant progress in understanding this relationship, yet several critical challenges persist in current approaches.
The first major challenge lies in the widespread adoption of global statistical models that assume spatial stationarity [5]. While recent studies utilizing big data have revealed significant spatial variations in vitality patterns [6,7], most analyses fail to capture how identical built environment features may generate varying levels of vitality across different urban contexts. This limitation is particularly evident in Chinese cities, where rapid expansion has created diverse urban fabrics within single cities, leading to complex spatial heterogeneity in street vitality patterns [8].
The second challenge stems from the predominant focus on objective physical measurements while neglecting the crucial role of human perception [9,10]. Environmental psychology research has established perception’s significant influence on behavior [11], and recent advances in computer vision have enabled large-scale perceptual assessment of urban environments [12,13]. However, few studies have examined how these perceptions vary spatially across urban contexts, creating a significant gap in our understanding of the perception-vitality relationship.
Furthermore, the interpretability of spatial variations in perception-vitality relationships remains largely unexplored [14]. While local regression techniques like GWR have emerged in urban studies [15], their applications rarely extend to examining perception-vitality relationships across different spatial scales. Recent developments in machine learning interpretation, particularly SHAP values, offer promising opportunities for understanding these complex spatial relationships [16].
The case of Hohhot, a rapidly urbanizing Chinese city, exemplifies these challenges. Its urban expansion has prioritized vehicular efficiency over human-scale considerations, resulting in declining street vitality despite similar built environment configurations across different areas [17,18]. This phenomenon highlights the need for a more nuanced understanding of how environmental perceptions influence street vitality in different urban contexts.
To address these challenges, we propose a novel multi-level interpretative framework combining Multiscale Geographically Weighted Regression (MGWR) with SHAP values. This framework enables us to: (1) quantify spatial heterogeneity in perception-vitality relationships, (2) reveal varying importance of perceptual dimensions across space, and (3) provide interpretable insights into local contextual factors [19,20].
The theoretical foundation for this research builds upon evolving understanding of street vitality. Early urban theorists like Jacobs [1] and Gehl [2] implicitly acknowledged spatial variation through case studies, while recent research utilizing mobile phone data [21,22] and social media check-ins [23] has provided empirical evidence of spatial heterogeneity in vitality patterns. Environmental psychology studies have further demonstrated how built environment perception significantly influences behavior and space utilization [24,25], while advances in computer vision have enabled large-scale assessment of these perceptions [26,27].
This spatial heterogeneity becomes particularly pronounced in rapidly urbanizing Chinese cities, where traditional urban fabrics intersect with modern development patterns [28,29]. The potential of combining local regression methods with interpretable machine learning techniques offers new opportunities for understanding how and why built environment-vitality relationships vary across space [30,31].
Through this integrated approach, we aim to advance both theoretical understanding and practical applications in urban design. The findings provide empirical evidence for developing context-sensitive interventions that can effectively enhance street vitality while acknowledging the spatial heterogeneity of urban environments. This research contributes to creating more vibrant, livable urban spaces that respond to local contexts while supporting sustainable urban development.
2. Data and Methods
This study employs a multi-source data integration approach combined with advanced spatial-statistical methods to investigate the relationship between built environment perceptions and street vitality in Hohhot’s central urban area. Our methodological framework (Figure 1) consists of three main components: (1) comprehensive data collection and processing from multiple sources including mobile phone signaling, POI data, and street view imagery, (2) systematic measurement of street vitality and built environment perceptions through carefully designed indices, and (3) integrated analysis using both spatial statistical methods (MGWR) and machine learning techniques (XGBoost-SHAP). This framework enables us to capture both the spatial heterogeneity and nonlinear characteristics of perception-vitality relationships while maintaining interpretability for practical applications.
2.1. Study Area
Hohhot, the capital city of Inner Mongolia Autonomous Region, serves as an ideal case study for examining spatial heterogeneity in street vitality for several reasons. First, as a typical rapidly developing Chinese city, Hohhot has experienced significant urban transformation over the past decades, with its urban built-up area expanding from 138 km² in 2000 to 243 km² in 2020, and its urban population growing from 1.12 million to 2.35 million. This rapid development provides a unique context for studying how built environment perceptions influence street vitality during urban transformation.
The study area focuses on the central urban area of Hohhot (111°35’0"E-111°45’0"E, 40°45’0"N-40°50’0"N), encompassing approximately 218 km² of urban core area. As shown in Figure 2. This area is characterized by diverse urban fabrics, including the historical old town centered around Dazhao Temple (dating back to the Qing Dynasty), the modern commercial districts along Zhongshan Road and Xinhua Street, and newly developed mixed-use areas in the eastern districts. The variety of urban contexts within the study area provides rich samples for analyzing spatial variations in street vitality.
The street network in the study area exhibits a hierarchical structure, comprising 1,643 street segments with a total length of 680.3 kilometers. This network includes traditional organic patterns in the historical core, grid-like layouts in planned districts, and contemporary street designs in newly developed areas. The diversity in street patterns and urban functions makes Hohhot an excellent laboratory for investigating how built environment perception influences street vitality across different spatial and functional contexts. The study area’s climate and cultural characteristics also contribute to its significance for street vitality research. With a semi-arid continental climate (annual average temperature 6.7°C, annual precipitation 400mm), the area experiences distinct seasonal variations that affect street life patterns. Furthermore, as a city where traditional Mongolian culture meets modern urban development, Hohhot offers unique insights into how cultural heritage and contemporary urban functions interact to shape street vitality.
2.2. Data Sources and Processing
This study primarily utilizes multi-source urban data collected in 2023 to construct a comprehensive database for analyzing street vitality and built environment perceptions. The data sources include road network data, mobile phone signaling data, POI data, and street view imagery, each processed through specific protocols to ensure data quality and compatibility.
2.2.1 Road Network Data
The street network data was obtained from OpenStreetMap (2023 version) and verified against local planning documents from the Hohhot Urban Planning Bureau. The dataset comprises 1,643 street segments with a total length of 680.3 kilometers, including detailed attributes such as street hierarchies, intersection densities, and network connectivity information. Through comprehensive data cleaning and topology correction procedures, we ensured both spatial accuracy and attribute consistency of the network data.
2.2.2 Mobile Phone Signaling Data
Mobile phone signaling data was collected during typical weekdays and weekend in June 2023, covering 24-hour periods to capture the full daily cycle of urban activities. The dataset includes anonymized location records from China Mobile users, with a temporal resolution of 1 hour and a spatial accuracy of approximately 50 meters. Our data processing workflow incorporated systematic filtering of invalid records and signal drift, followed by spatial aggregation to street segments. We then normalized activity density by street length and calculated temporal activity patterns for each segment to ensure comparable measurements across the study area.
2.2.3 POI Data
We collected Point of Interest (POI) data through the Gaode Maps API in June 2023, encompassing 18 primary categories and 97 subcategories of urban facilities. The dataset includes 54,828 valid POIs within the study area, representing a diverse range of urban functions. The data covers commercial establishments ranging from retail and dining to entertainment venues, public service facilities including educational institutions and healthcare centers, cultural amenities such as museums and historical sites, and various transportation facilities. Through systematic classification and spatial matching procedures, we ensured accurate representation of urban functions along street segments.
2.2.4 Street View Imagery
Street view images were systematically collected in April 2023 using the Baidu Street View API, following a comprehensive sampling strategy designed to capture the complete urban environment. Our collection methodology established sampling points at 50-meter intervals along all street segments, with four horizontal viewing angles at each point to ensure comprehensive coverage. The resulting dataset of 57,532 high-resolution images (1024 × 768 pixels) underwent sophisticated deep learning analysis to extract various environmental features, including visual elements of the streetscape, environmental quality indicators, infrastructure conditions, and cultural-aesthetic characteristics. This multi-dimensional visual analysis provides rich insights into the physical and perceptual qualities of the street environment. An example of the downloaded Street View image is shown in Figure 3.
All these data sources were systematically integrated into a unified spatial database using street segments as the basic analytical unit. This integration enables comprehensive analysis of the relationships between built environment perceptions and street vitality while maintaining spatial and temporal consistency across different data types.
2.3. Methodology
2.3.1. Street Vitality and Built Environment Perception Measurement
We developed a comprehensive measurement framework incorporating multiple dimensions of both street vitality and built environment perceptions, as detailed in Table 1. Street vitality is conceptualized as a multi-dimensional construct encompassing social, economic, and cultural aspects.
For each street segment , we calculate a composite vitality index (VI) using the entropy method [32,33]:
where represents the entropy-derived weight for dimension , and is the normalized score of dimension for street segment .
Social vitality is primarily measured through mobile phone signaling data. We calculate the hourly activity density (AD) for each street segment:
where represents the number of unique users in street segment during time period , and is the length of the street segment. Temporal variations are analyzed across different periods to capture dynamic activity patterns.
Economic vitality is assessed through POI density and diversity [34,35,36]. We employ Shannon’s entropy index to measure commercial diversity:
where represents the proportion of POIs in category within the street segment’s buffer zone.
Cultural vitality is evaluated through a weighted combination of cultural facility density and historical element presence, normalized to ensure comparability across different street segments.
Built environment perception is measured through a systematic integration of objective spatial metrics and computer vision analysis of street view imagery. For each perception dimension, we construct composite indices that capture both physical characteristics and human-scale perceptual qualities:
where represents the perception index for dimension , are weights derived from factor analysis, and are the standardized scores of individual perception metrics.
2.3.2 MGWR Analysis
To capture spatial heterogeneity in perception-vitality relationships, we employ MGWR with an adaptive bandwidth selection approach [31]. The model is specified as:
whererepresents the spatial coordinates of location , are locally varying coefficients, and are the built environment perception measures.
The optimal bandwidth for each variable is determined through cross-validation:
where is the fitted value for observation using bandwidth with observation omitted from the calibration.
2.3.3 XGBoost-SHAP Framework
To explore nonlinear relationships and complex interactions, we implement an XGBoost model, a gradient boosting framework that excels at capturing nonlinear patterns in data [37,38,39]. The model is configured with carefully tuned hyperparameters to balance model complexity and generalization ability, including the number of trees, learning rate, and tree depth. This configuration enables the model to capture complex nonlinear relationships while avoiding overfitting.
The XGBoost model is complemented by SHAP (SHapley Additive exPlanations) analysis to interpret feature importance and interaction effects. SHAP values are calculated as:
where is the SHAP value for feature , represents all possible feature combinations, and is the prediction for feature set .
This integrated analytical framework combines multiple methodological strengths to provide comprehensive insights into the perception-vitality relationship. Through MGWR coefficients, we quantify the varying spatial relationships at different scales, while XGBoost predictions reveal complex nonlinear patterns that might be missed by traditional linear approaches. The SHAP analysis further enriches our understanding by illuminating feature interactions and their spatial manifestations. Together, these analytical components enable both detailed local analysis and broader pattern recognition, supporting the development of nuanced, context-sensitive urban design strategies [40,41].
The combination of these methods provides a robust approach for understanding the complex relationships between built environment perceptions and street vitality, while maintaining interpretability for practical applications in urban design and planning. The framework’s multi-method nature allows for cross-validation of findings and provides complementary insights into both spatial and nonlinear aspects of perception-vitality relationships, ultimately supporting more informed and effective urban design decisions.
3. Results
This section presents our empirical findings through a three-stage analysis framework. First, we examine the spatial distribution patterns of street vitality and built environment perceptions, providing a foundation for understanding their geographical characteristics. Second, we employ MGWR analysis to investigate the spatial heterogeneity in perception-vitality relationships. Finally, we utilize machine learning techniques to uncover the complex nonlinear interactions between perceptions and vitality.
3.1. Spatial Distribution Patterns
Using the entropy weight method, we constructed comprehensive indices for both street vitality and the four perception dimensions (comfort, safety, convenience, and pleasure) to capture their multifaceted nature. The spatial distribution patterns of these indices in Hohhot’s central urban area reveal distinct geographical characteristics that reflect the city’s development patterns and functional organization. Analysis of the spatial distribution provides insights into how these elements vary across the urban landscape.
Street vitality exhibits a pronounced center-periphery gradient across the study area (Figures 4). The highest vitality values are concentrated in the central business districts, particularly around the Zhongshan Road Commercial District and historical cultural areas such as the Dazhao Temple district. These areas benefit from the convergence of commercial activities, cultural facilities, and pedestrian flows. The vitality pattern shows a gradual decrease from these central nodes toward the peripheral areas, with the lowest values observed in the outer residential and industrial zones, reflecting the transition from mixed-use urban cores to more functionally specialized areas.
The spatial analysis of built environment perceptions reveals complex and varied patterns across the four dimensions examined (Figures 5). Comfort perception demonstrates higher values in the eastern and southeastern regions of the city, where better green coverage and environmental maintenance contribute to a more pleasant urban experience. However, the central commercial districts, despite their high vitality, show relatively lower comfort levels due to increased building density and interface enclosure.
Safety perception manifests a centralized pattern with peak values in the core urban area, characterized by well-maintained infrastructure and pedestrian facilities. This pattern is interrupted along major traffic arteries in the southern and peripheral areas, where higher vehicular traffic density creates perceived safety challenges. The convenience perception displays a strong centralized distribution, with highest values in areas well-served by public facilities and services, gradually diminishing toward the urban periphery.
Pleasure perception shows a distinctive pattern closely aligned with the city’s cultural and historical assets. The highest pleasure perception values are found in the central area, particularly around historical districts and cultural landmarks. This distribution reflects the rich cultural heritage and aesthetic quality of these areas, while the peripheral zones, dominated by residential and industrial functions, exhibit lower pleasure perception values, indicating potential areas for future urban design interventions.
These spatial patterns collectively demonstrate the complex interrelationships between different aspects of urban perception and their varying manifestations across the city landscape. The central areas generally exhibit strong performance across multiple perception dimensions, while peripheral areas show more varied patterns, suggesting opportunities for targeted environmental improvements in specific aspects of the built environment.
3.2. MGWR Analysis Results
To address the potential spatial non-stationarity in the relationships between built environment perceptions and street vitality, we employed the MGWR model, which allows regression coefficients to vary across space. This approach reveals significant spatial heterogeneity in how different perception dimensions influence street vitality across Hohhot’s central urban area, providing insights that would be masked by traditional global regression methods.
The MGWR model reveals distinct spatial scales of influence for different perception dimensions, as evidenced by their varying bandwidths (Table 2). Comfort perception operates at a relatively local scale with a bandwidth of 1477 meters, suggesting more localized effects on street vitality. Safety and convenience perceptions exhibit broader spatial effects with identical bandwidths of 1642 meters, indicating their influence extends over larger areas. Pleasure perception shows a slightly more localized influence with a bandwidth of 1619 meters, reflecting the importance of local cultural and aesthetic elements in shaping street vitality.
The spatial distribution of regression coefficients (Figure 6) reveals complex patterns of influence across the study area. Comfort perception exhibits a clear east-west gradient in its influence on street vitality, with positive coefficients in eastern regions indicating potential benefits from environmental improvements, while negative coefficients in western areas suggest comfort factors may have reached saturation. Safety perception demonstrates particularly strong positive influence in southeastern regions, with coefficients ranging from 0.060 to 0.085, gradually diminishing towards the northwest.Convenience perception shows an unexpected overall negative correlation with street vitality, with coefficients ranging from -0.058 to -0.046, suggesting that merely increasing convenience facilities may not directly enhance street vitality. This finding indicates a potential mismatch between service provision and actual community needs. Pleasure perception emerges as the strongest positive influence among all dimensions, with coefficients ranging from 0.072 to 0.103, particularly pronounced in eastern urban areas where cultural and historical assets are concentrated.
The constant term’s spatial distribution reveals underlying geographical variations in street vitality that persist after accounting for the four perception dimensions, suggesting the presence of other spatially varying factors. These results emphasize the importance of considering spatial heterogeneity in urban planning and design, as interventions may have varying effects across different areas of the city. The findings support the adoption of targeted, location-specific approaches to improving built environment perceptions rather than uniform city-wide policies.
3.3. Machine Learning-Based Nonlinear Analysis
While the MGWR analysis revealed important spatial variations, it assumes locally linear relationships between variables. To capture potential nonlinear effects and complex interactions, we employed an XGBoost model complemented by SHAP analysis. This machine learning approach not only achieved superior predictive performance but also provided deeper insights into the nature of perception-vitality relationships.
The SHAP summary plot (Figure 7) reveals the complex nature of each perception dimension’s influence on street vitality. Pleasure perception demonstrates the most substantial and consistent positive impact on street vitality, as indicated by the widespread distribution of SHAP values on the positive side. This finding suggests that cultural and aesthetic elements of the built environment have a fundamental role in fostering street vitality, regardless of the local context. Safety perception shows the second strongest influence, with a particularly interesting bimodal distribution of SHAP values, indicating that its impact may be threshold-dependent rather than purely linear.
The dependence plots (Figure 8) provide deeper insights into the nonlinear nature of these relationships. Comfort perception exhibits a distinctive threshold effect, where its positive influence on vitality increases sharply after reaching a certain level, suggesting that basic comfort requirements must be met before significant vitality benefits can be realized. Convenience perception shows an unexpected inverse U-shaped relationship, indicating that excessive convenience facilities might actually detract from street vitality, possibly due to the homogenization of street functions or the crowding out of other vital activities.
The spatial distribution of SHAP values (Figure 9) reveals distinct geographical patterns in how each perception dimension contributes to street vitality. Comfort perception’s influence shows strong spatial clustering, with its positive effects concentrated in areas of moderate building density and good environmental maintenance. Safety perception’s impact exhibits clear spatial variation, with stronger positive effects in areas of mixed land use and active street frontages.Convenience perception’s SHAP values display an interesting center-periphery gradient, suggesting that its influence on vitality varies significantly with urban context. In central areas, where convenience facilities are abundant, additional facilities may have diminishing or even negative returns, while in peripheral areas, modest increases in convenience can substantially boost vitality. Pleasure perception’s impact shows the most spatially homogeneous pattern among all dimensions, though with notably stronger effects in areas with historical and cultural significance.
The machine learning analysis has revealed several important insights that significantly advance our understanding of the built environment-vitality relationship. The inherently nonlinear nature of these relationships, characterized by threshold effects and complex interaction patterns, extends well beyond what traditional linear models can capture. This nonlinearity is particularly evident in how the impact of each perception dimension varies not only in magnitude but also in functional form across different urban contexts, emphasizing the necessity for carefully calibrated, location-specific interventions. The spatial distribution of SHAP values has provided unprecedented insight into how local context moderates the effectiveness of different environmental interventions, enabling more precise targeting of urban design strategies. This is further supported by the superior performance of the XGBoost model (R² = 0.421) compared to the MGWR approach, underscoring the critical importance of considering nonlinear effects in understanding street vitality dynamics.
These findings represent a significant advancement beyond traditional linear analyses, offering a more nuanced and comprehensive understanding of how built environment perceptions influence street vitality. The results strongly suggest that effective street vitality enhancement strategies must simultaneously consider both the nonlinear nature of perception-vitality relationships and their spatial variation across the urban landscape. This dual consideration is essential for developing more sophisticated and context-sensitive approaches to urban design and planning, ultimately leading to more effective interventions for enhancing street vitality in diverse urban environments.
4. Discussion
This study’s findings reveal the complex and nuanced relationships between built environment perceptions and street vitality, while also highlighting several important theoretical and methodological implications. The integration of spatial heterogeneity analysis with machine learning techniques has provided unprecedented insights into how different aspects of environmental perception influence street vitality across urban contexts.
The strong spatial variation in perception-vitality relationships, as revealed by both MGWR and SHAP analyses, challenges the conventional assumption of uniform environmental effects across urban spaces. This spatial heterogeneity suggests that the effectiveness of urban interventions may vary significantly across locations, even within the same city. For instance, while pleasure perception consistently shows positive effects on vitality, its influence is particularly pronounced in areas with rich cultural heritage, indicating the importance of context-sensitive design approaches.
The discovery of nonlinear relationships through machine learning analysis further complicates our understanding of how built environment perceptions shape street vitality. The threshold effects observed in comfort perception and the inverse U-shaped relationship of convenience perception suggest that simple linear interventions may not always yield expected results. These findings align with recent theoretical developments in urban studies that emphasize the complex, systemic nature of urban environments, where multiple factors interact in sometimes unexpected ways.
However, several limitations of this study should be acknowledged. First, while our perception measures capture important aspects of the built environment, they may not fully encompass all relevant dimensions of urban experience. Future research could incorporate additional perceptual elements, such as social interaction opportunities and temporal variations in environmental perception. Second, the cross-sectional nature of our data limits our ability to establish causal relationships between perceptions and vitality. Longitudinal studies could provide valuable insights into how changes in environmental perception influence street vitality over time.
The methodological framework developed in this study, combining MGWR with SHAP analysis, offers a promising approach for future urban studies. This integration of spatial and machine learning methods could be applied to other aspects of urban research, particularly where complex spatial relationships and nonlinear effects are expected. Furthermore, the superior performance of the XGBoost model (R² = 0.421) compared to traditional approaches suggests the potential value of machine learning techniques in urban analysis.
5. Conclusions
This study explores the relationship between built environment perceptions and street vitality through an integrated methodological approach combining spatial heterogeneity analysis with machine learning techniques. Our findings suggest that the influence of environmental perceptions on street vitality exhibits both spatial heterogeneity and nonlinear characteristics, providing new perspectives on the complex nature of urban environment-behavior relationships.
The study offers several insights for urban studies and planning practice. Our analysis indicates the importance of spatial context in understanding environmental effects, as similar interventions may produce different outcomes across urban locations. The revealed nonlinear relationships between perceptions and vitality suggest that threshold effects and interaction patterns should be carefully considered in urban design. Additionally, the combination of spatial analysis and machine learning techniques demonstrates potential for enhancing our understanding of urban dynamics.
These findings may have practical implications for urban planning and design. They suggest that strategies for enhancing street vitality might be more effective when tailored to local contexts and when accounting for the nonlinear nature of environmental effects. Rather than applying standardized solutions across urban areas, planners and designers might benefit from developing context-sensitive interventions that consider both spatial variation and threshold effects in environmental perception.
Looking forward, this research suggests several potential directions for future study. The integration of temporal dynamics, social factors, and broader urban systems could enhance our understanding of street vitality. The methodological framework developed here might also be applicable to other aspects of urban research, potentially offering new insights into various urban phenomena.
This study contributes to our ongoing understanding of urban environments and their influence on street vitality. By examining the relationships between environmental perceptions and street vitality, it adds to the growing body of knowledge aimed at creating more vibrant, livable urban spaces that respond to their local contexts while acknowledging the inherent complexity of urban systems.
Author Contributions
Conceptualization, X.L. and B.L.; methodology, X.L.; software, X.L.; validation, X.L., B.L. and Y.S.; formal analysis, X.L.; investigation, X.L., B.L. and Y.S.; resources, X.L. and B.L.; data curation, X.L. and B.L.; writing—original draft preparation, X.L.; writing—review and editing, X.L. and B.L.; visualization, X.L. and Y.S.; supervision, B.L.; project administration, B.L. All authors have read and agreed to the published version of the manuscript.
Funding
This research received no external funding.
Institutional Review Board Statement
Not applicable.
Informed Consent Statement
Not applicable.
Data Availability Statement
Restrictions apply to the availability of these data. The original data was obtained from Internet Searching Engines and are available from the authors with the permission of Internet Searching Engines.
Acknowledgments
We are grateful to the editors and anonymous reviewers for their thoughtful and helpful suggestions for improvement of the manuscript.
Conflicts of Interest
The authors declare no conflicts of interest.
References
- Jacobs, J.J.B.U.r. The death and life of great american cities. Randoms house, New York. 1961.
- Gehl, J. Life between buildings. 2011.
- Wu, C.; Ye, X.; Ren, F.; Du, Q.J.C. Check-in behaviour and spatio-temporal vibrancy: An exploratory analysis in Shenzhen, China. 2018, 77, 104-116. [CrossRef]
- Li, X.; Zhang, C.; Li, W.J.I.I.J.o.G.-I. Does the visibility of greenery increase perceived safety in urban areas? Evidence from the place pulse 1.0 dataset. 2015, 4, 1166-1183. [CrossRef]
- Zhang, L.; Ye, Y.; Zeng, W.; Chiaradia, A.J.I.j.o.e.r.; health, p. A systematic measurement of street quality through multi-sourced urban data: A human-oriented analysis. 2019, 16, 1782. [CrossRef]
- Long, Y.; Huang, C.J.E.; Analytics, P.B.U.; Science, C. Does block size matter? The impact of urban design on economic vitality for Chinese cities. 2019, 46, 406-422.
- Liu, X.; He, J.; Yao, Y.; Zhang, J.; Liang, H.; Wang, H.; Hong, Y.J.I.J.o.G.I.S. Classifying urban land use by integrating remote sensing and social media data. 2017, 31, 1675-1696. [CrossRef]
- Ye, Y.; Li, D.; Liu, X.J.U.G. How block density and typology affect urban vitality: An exploratory analysis in Shenzhen, China. 2018, 39, 631-652. [CrossRef]
- Chen, L.; Yao, X.; Liu, Y.; Zhu, Y.; Chen, W.; Zhao, X.; Chi, T.J.I.I.J.o.G.-I. Measuring impacts of urban environmental elements on housing prices based on multisource data—a case study of Shanghai, China. 2020, 9, 106. [CrossRef]
- Moser, G.; Uzzell, D.J.C.h.o.p. Environmental psychology. 2003, 5, 419-445.
- Naik, N.; Philipoom, J.; Raskar, R.; Hidalgo, C. Streetscore-predicting the perceived safety of one million streetscapes. In Proceedings of the Proceedings of the IEEE conference on computer vision and pattern recognition workshops, 2014; pp. 779-785.
- Yao, Y.; Li, X.; Liu, X.; Liu, P.; Liang, Z.; Zhang, J.; Mai, K.J.I.J.o.G.I.S. Sensing spatial distribution of urban land use by integrating points-of-interest and Google Word2Vec model. 2017, 31, 825-848. [CrossRef]
- Angel, A.; Cohen, A.; Nelson, T.; Plaut, P.J.C. Evaluating the relationship between walking and street characteristics based on big data and machine learning analysis. 2024, 151, 105111. [CrossRef]
- Oshan, T.M.; Li, Z.; Kang, W.; Wolf, L.J.; Fotheringham, A.S.J.I.I.J.o.G.-I. mgwr: A Python implementation of multiscale geographically weighted regression for investigating process spatial heterogeneity and scale. 2019, 8, 269. [CrossRef]
- Li, Z.; Zhao, G.J.I.I.J.o.G.-I. Revealing the Spatio-Temporal Heterogeneity of the Association between the Built Environment and Urban Vitality in Shenzhen. 2023, 12, 433.
- Liu, Z.; Fang, C.; Li, H.; Wu, J.; Zhou, L.; Werner, M.J.S.C.; Society. Efficiency and equality of the multimodal travel between public transit and bike-sharing accounting for multiscale. 2024, 101, 105096. [CrossRef]
- Gehl, J. Cities for people; Island press: 2013.
- Wu, F. Planning for growth: Urban and regional planning in China; Routledge: 2015.
- Zhao, K.; Guo, J.; Ma, Z.; Wu, W.J.S.o. Exploring the spatiotemporal heterogeneity and stationarity in the relationship between street vitality and built environment. 2023, 13, 21582440231152226. [CrossRef]
- Li, M.; Pan, J.J.S. Assessment of Influence Mechanisms of Built Environment on Street Vitality Using Multisource Spatial Data: A Case Study in Qingdao, China. 2023, 15, 1518. [CrossRef]
- Wangbao, L.J.F.i.E.S. Spatial impact of the built environment on street vitality: A case study of the Tianhe District, Guangzhou. 2022, 10, 966562.
- Wu, W.; Niu, X.J.J.o.U.P.; Development. Influence of built environment on urban vitality: Case study of Shanghai using mobile phone location data. 2019, 145, 04019007.
- Cranshaw, J.; Schwartz, R.; Hong, J.; Sadeh, N. The livehoods project: Utilizing social media to understand the dynamics of a city. In Proceedings of the Proceedings of the international AAAI conference on web and social media, 2012; pp. 58-65.
- Bai, X.; Zhou, M.; Li, W.J.P.o. Analysis of the influencing factors of vitality and built environment of shopping centers based on mobile-phone signaling data. 2024, 19, e0296261. [CrossRef]
- De Groot, J.I. Environmental psychology: An introduction. 2019.
- Wen, W.; Imamizu, H.J.N.R.P. The sense of agency in perception, behaviour and human–machine interactions. 2022, 1, 211-222.
- Lundberg, S.J.a.p.a. A unified approach to interpreting model predictions. 2017.
- Wu, W.; Ma, Z.; Guo, J.; Niu, X.; Zhao, K.J.I.J.o.E.R.; Health, P. Evaluating the effects of built environment on street vitality at the city level: An empirical research based on spatial panel Durbin model. 2022, 19, 1664. [CrossRef]
- McMillen, D.P. Geographically weighted regression: the analysis of spatially varying relationships. 2004. [CrossRef]
- Li, Z.J.C., Environment; Systems, U. Extracting spatial effects from machine learning model using local interpretation method: An example of SHAP and XGBoost. 2022, 96, 101845.
- Fotheringham, A.S.; Yang, W.; Kang, W.J.A.o.t.A.A.o.G. Multiscale geographically weighted regression (MGWR). 2017, 107, 1247-1265. [CrossRef]
- Zhu, Y.; Tian, D.; Yan, F.J.M.P.i.E. Effectiveness of entropy weight method in decision-making. 2020, 2020, 3564835. [CrossRef]
- Zhang, X.; Wang, C.; Li, E.; Xu, C.J.T.S.W.J. Assessment model of ecoenvironmental vulnerability based on improved entropy weight method. 2014, 2014, 797814. [CrossRef]
- Jin, A.; Ge, Y.; Zhang, S.J.L. Spatial Characteristics of Multidimensional Urban Vitality and Its Impact Mechanisms by the Built Environment. 2024, 13, 991. [CrossRef]
- Li, Q.; Cui, C.; Liu, F.; Wu, Q.; Run, Y.; Han, Z.J.I.I.J.o.G.-I. Multidimensional urban vitality on streets: Spatial patterns and influence factor identification using multisource urban data. 2021, 11, 2. [CrossRef]
- Yue, Y.; Zhuang, Y.; Yeh, A.G.; Xie, J.-Y.; Ma, C.-L.; Li, Q.-Q.J.I.J.o.G.I.S. Measurements of POI-based mixed use and their relationships with neighbourhood vibrancy. 2017, 31, 658-675. [CrossRef]
- Chen, Y.; Zhang, X.; Grekousis, G.; Huang, Y.; Hua, F.; Pan, Z.; Liu, Y.J.J.o.C.P. Examining the importance of built and natural environment factors in predicting self-rated health in older adults: an extreme gradient boosting (XGBoost) approach. 2023, 413, 137432. [CrossRef]
- Zhou, S.; Liu, Z.; Wang, M.; Gan, W.; Zhao, Z.; Wu, Z.J.S.C.; Society. Impacts of building configurations on urban stormwater management at a block scale using XGBoost. 2022, 87, 104235. [CrossRef]
- Chen, T.; Guestrin, C. Xgboost: A scalable tree boosting system. In Proceedings of the Proceedings of the 22nd acm sigkdd international conference on knowledge discovery and data mining, 2016; pp. 785-794.
- Meng, Y.; Yang, N.; Qian, Z.; Zhang, G.J.J.o.T.; Research, A.E.C. What makes an online review more helpful: an interpretation framework using XGBoost and SHAP values. 2020, 16, 466-490. [CrossRef]
- Farzipour, A.; Elmi, R.; Nasiri, H.J.D. Detection of Monkeypox cases based on symptoms using XGBoost and Shapley additive explanations methods. 2023, 13, 2391. [CrossRef]
Figure 1.
Research framework of this study.

Figure 2.
Location of the study area.
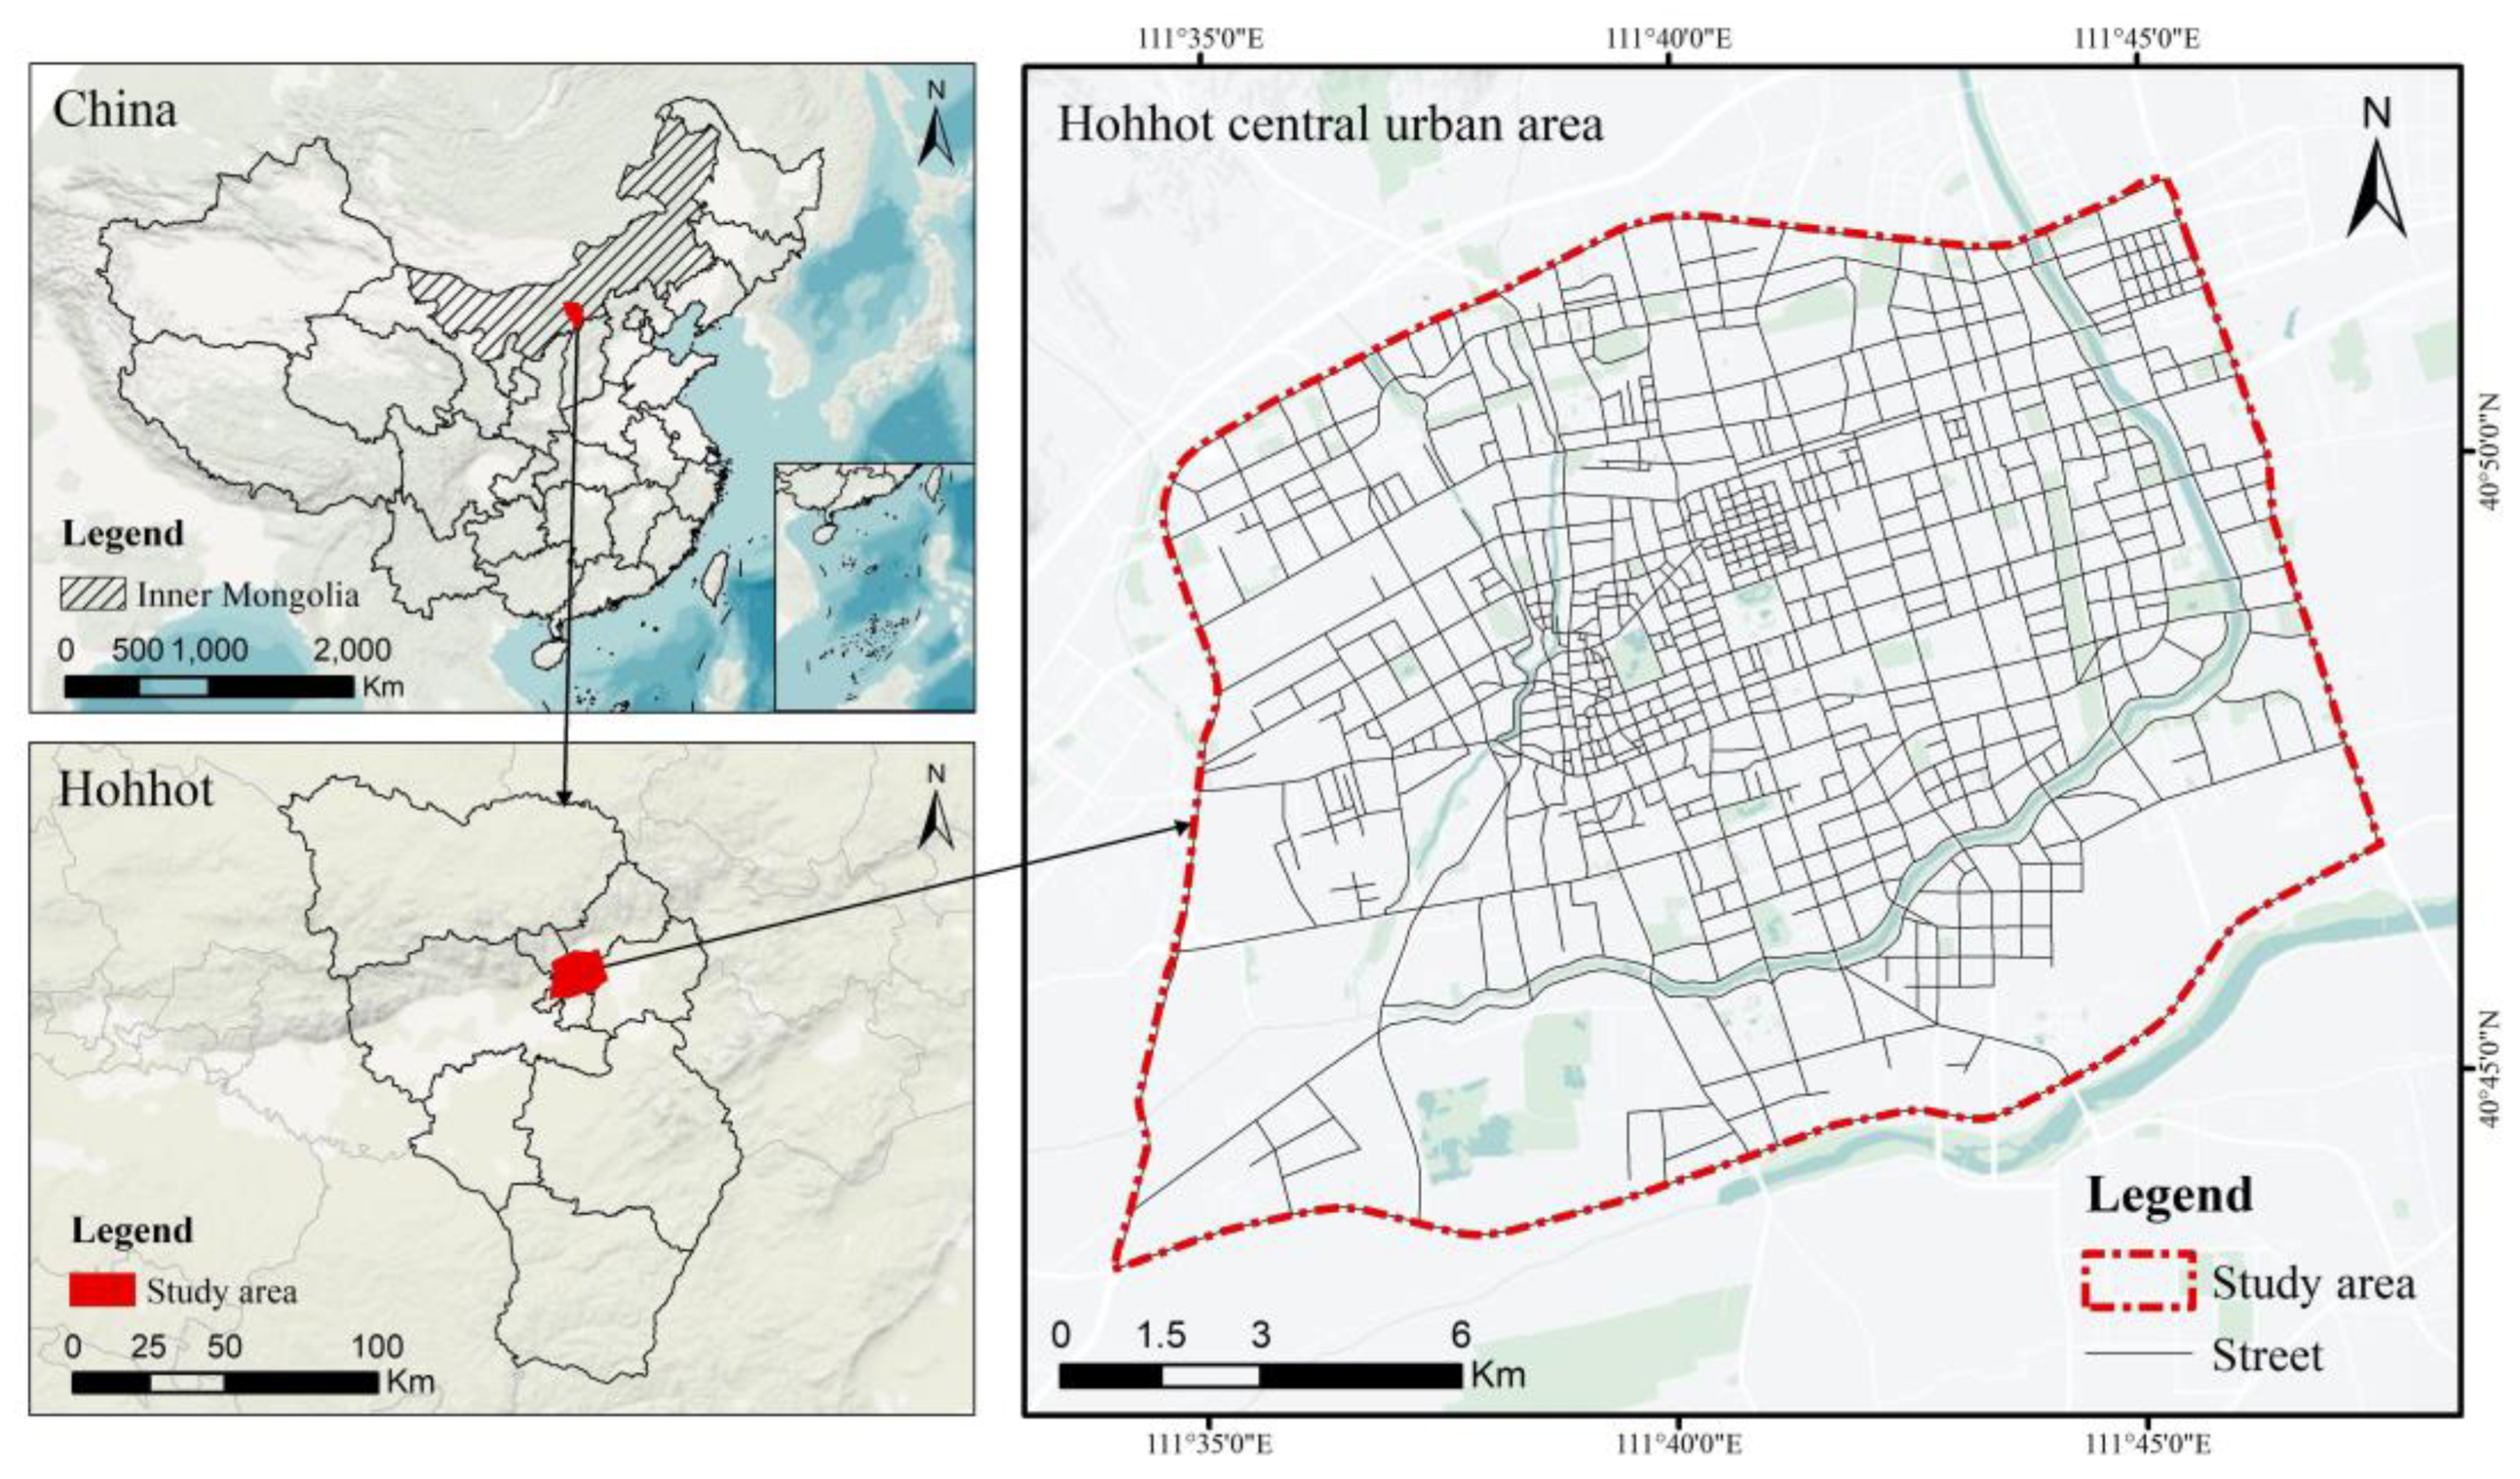
Figure 3.
Example of the BSVIs collection process.
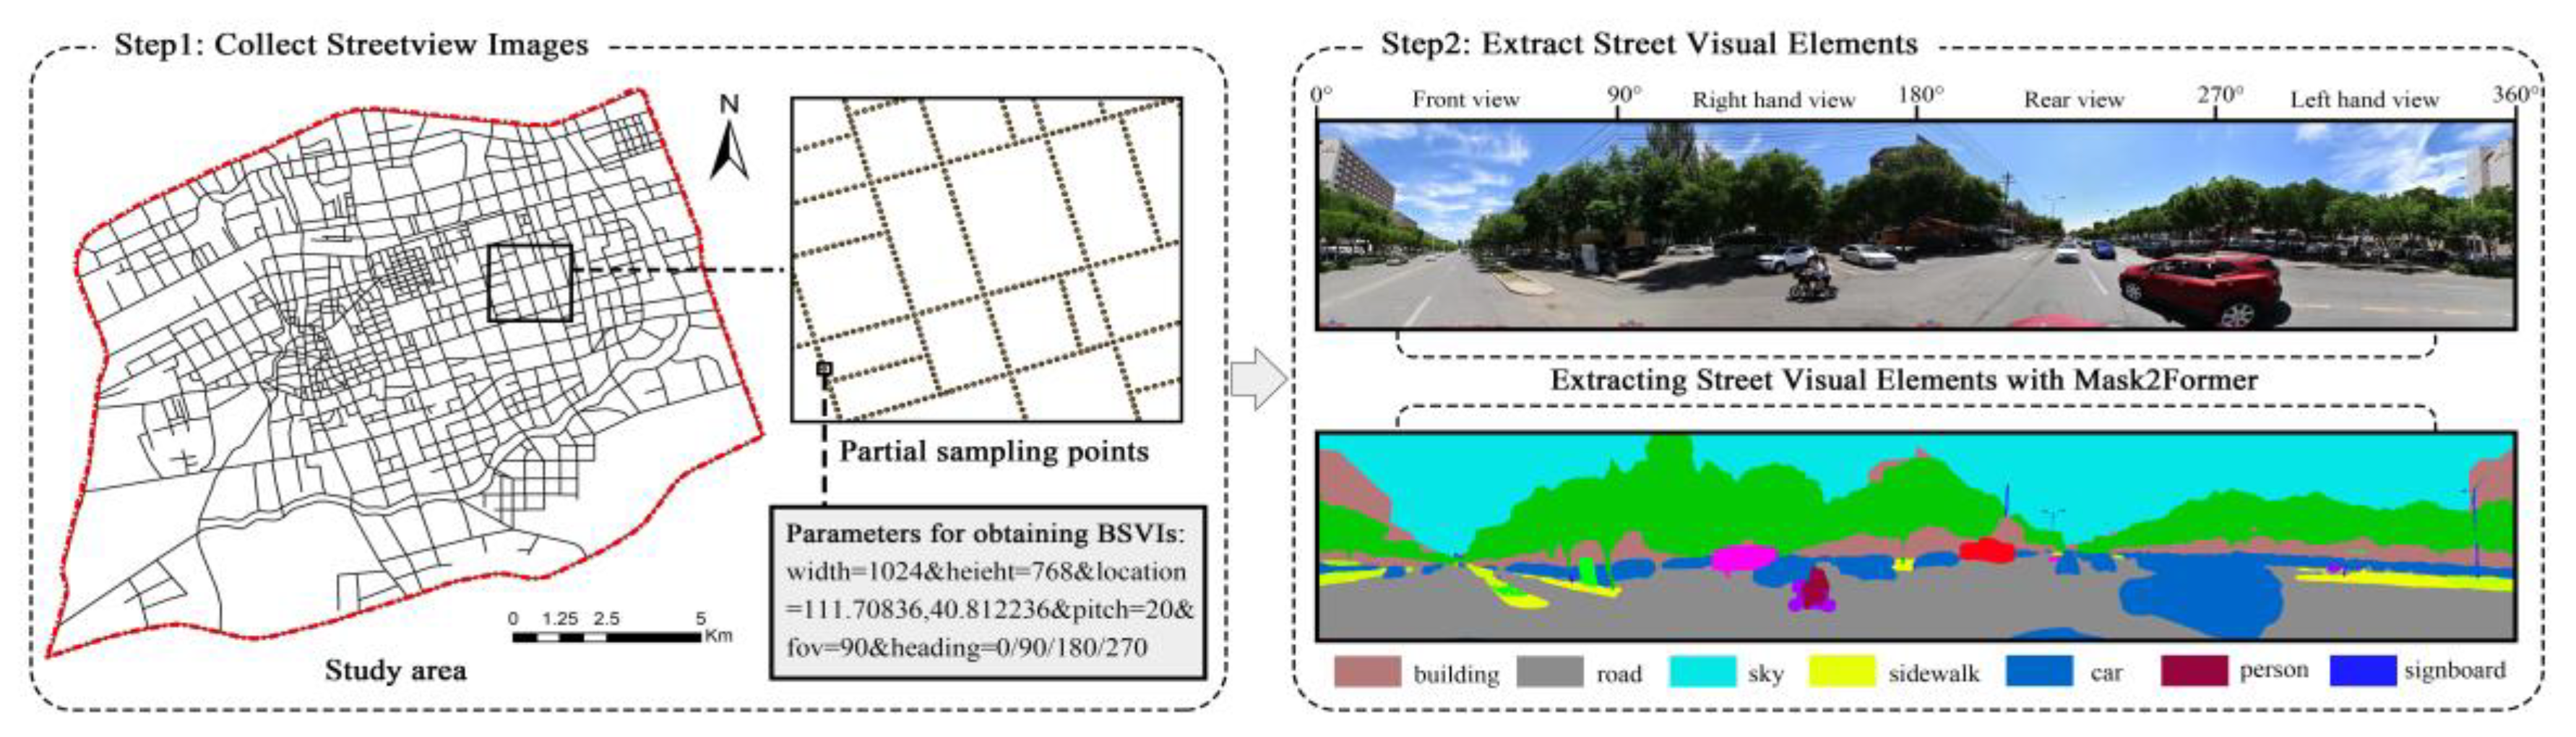
Figure 4.
Spatial distribution of street vitality in Hohhot’s central urban area. Higher values (red) indicate greater vitality, while lower values (blue) indicate less vitality.
Figure 4.
Spatial distribution of street vitality in Hohhot’s central urban area. Higher values (red) indicate greater vitality, while lower values (blue) indicate less vitality.
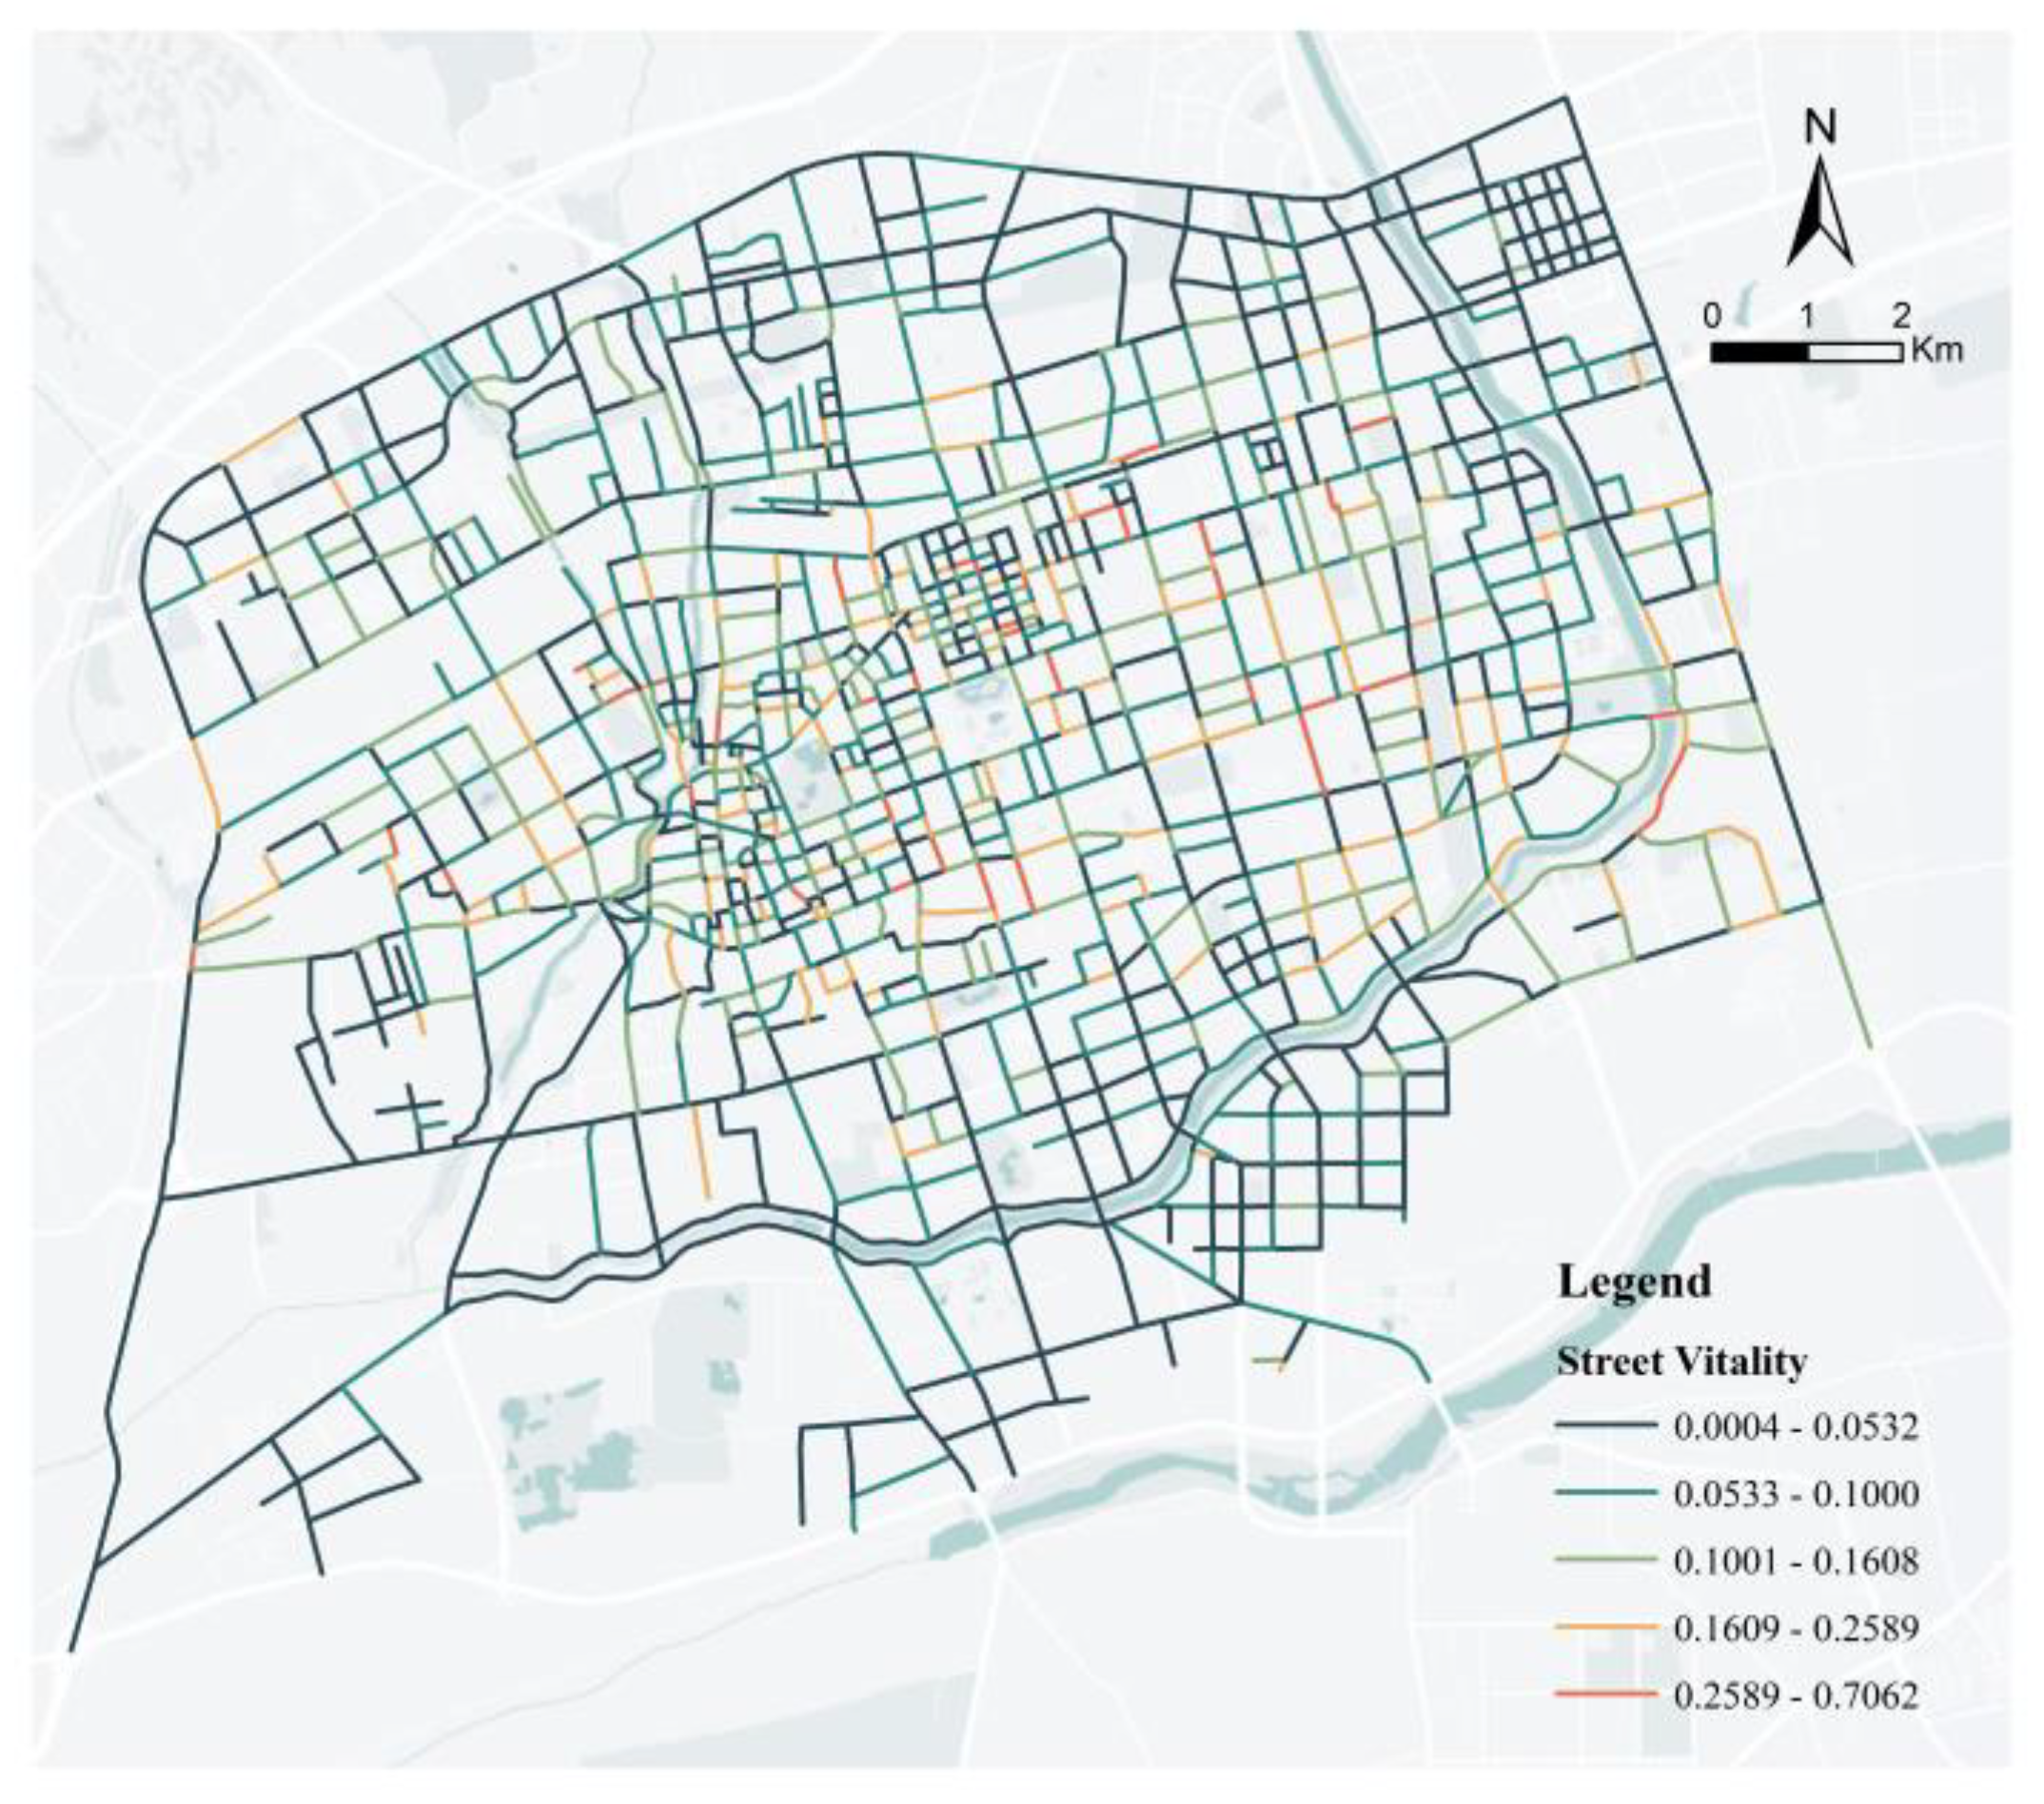
Figure 5.
Spatial distribution of built environment perceptions: (a) Comfort Perception, (b) Safety Perception, (c) Convenience Perception, and (d) Pleasure Perception.
Figure 5.
Spatial distribution of built environment perceptions: (a) Comfort Perception, (b) Safety Perception, (c) Convenience Perception, and (d) Pleasure Perception.
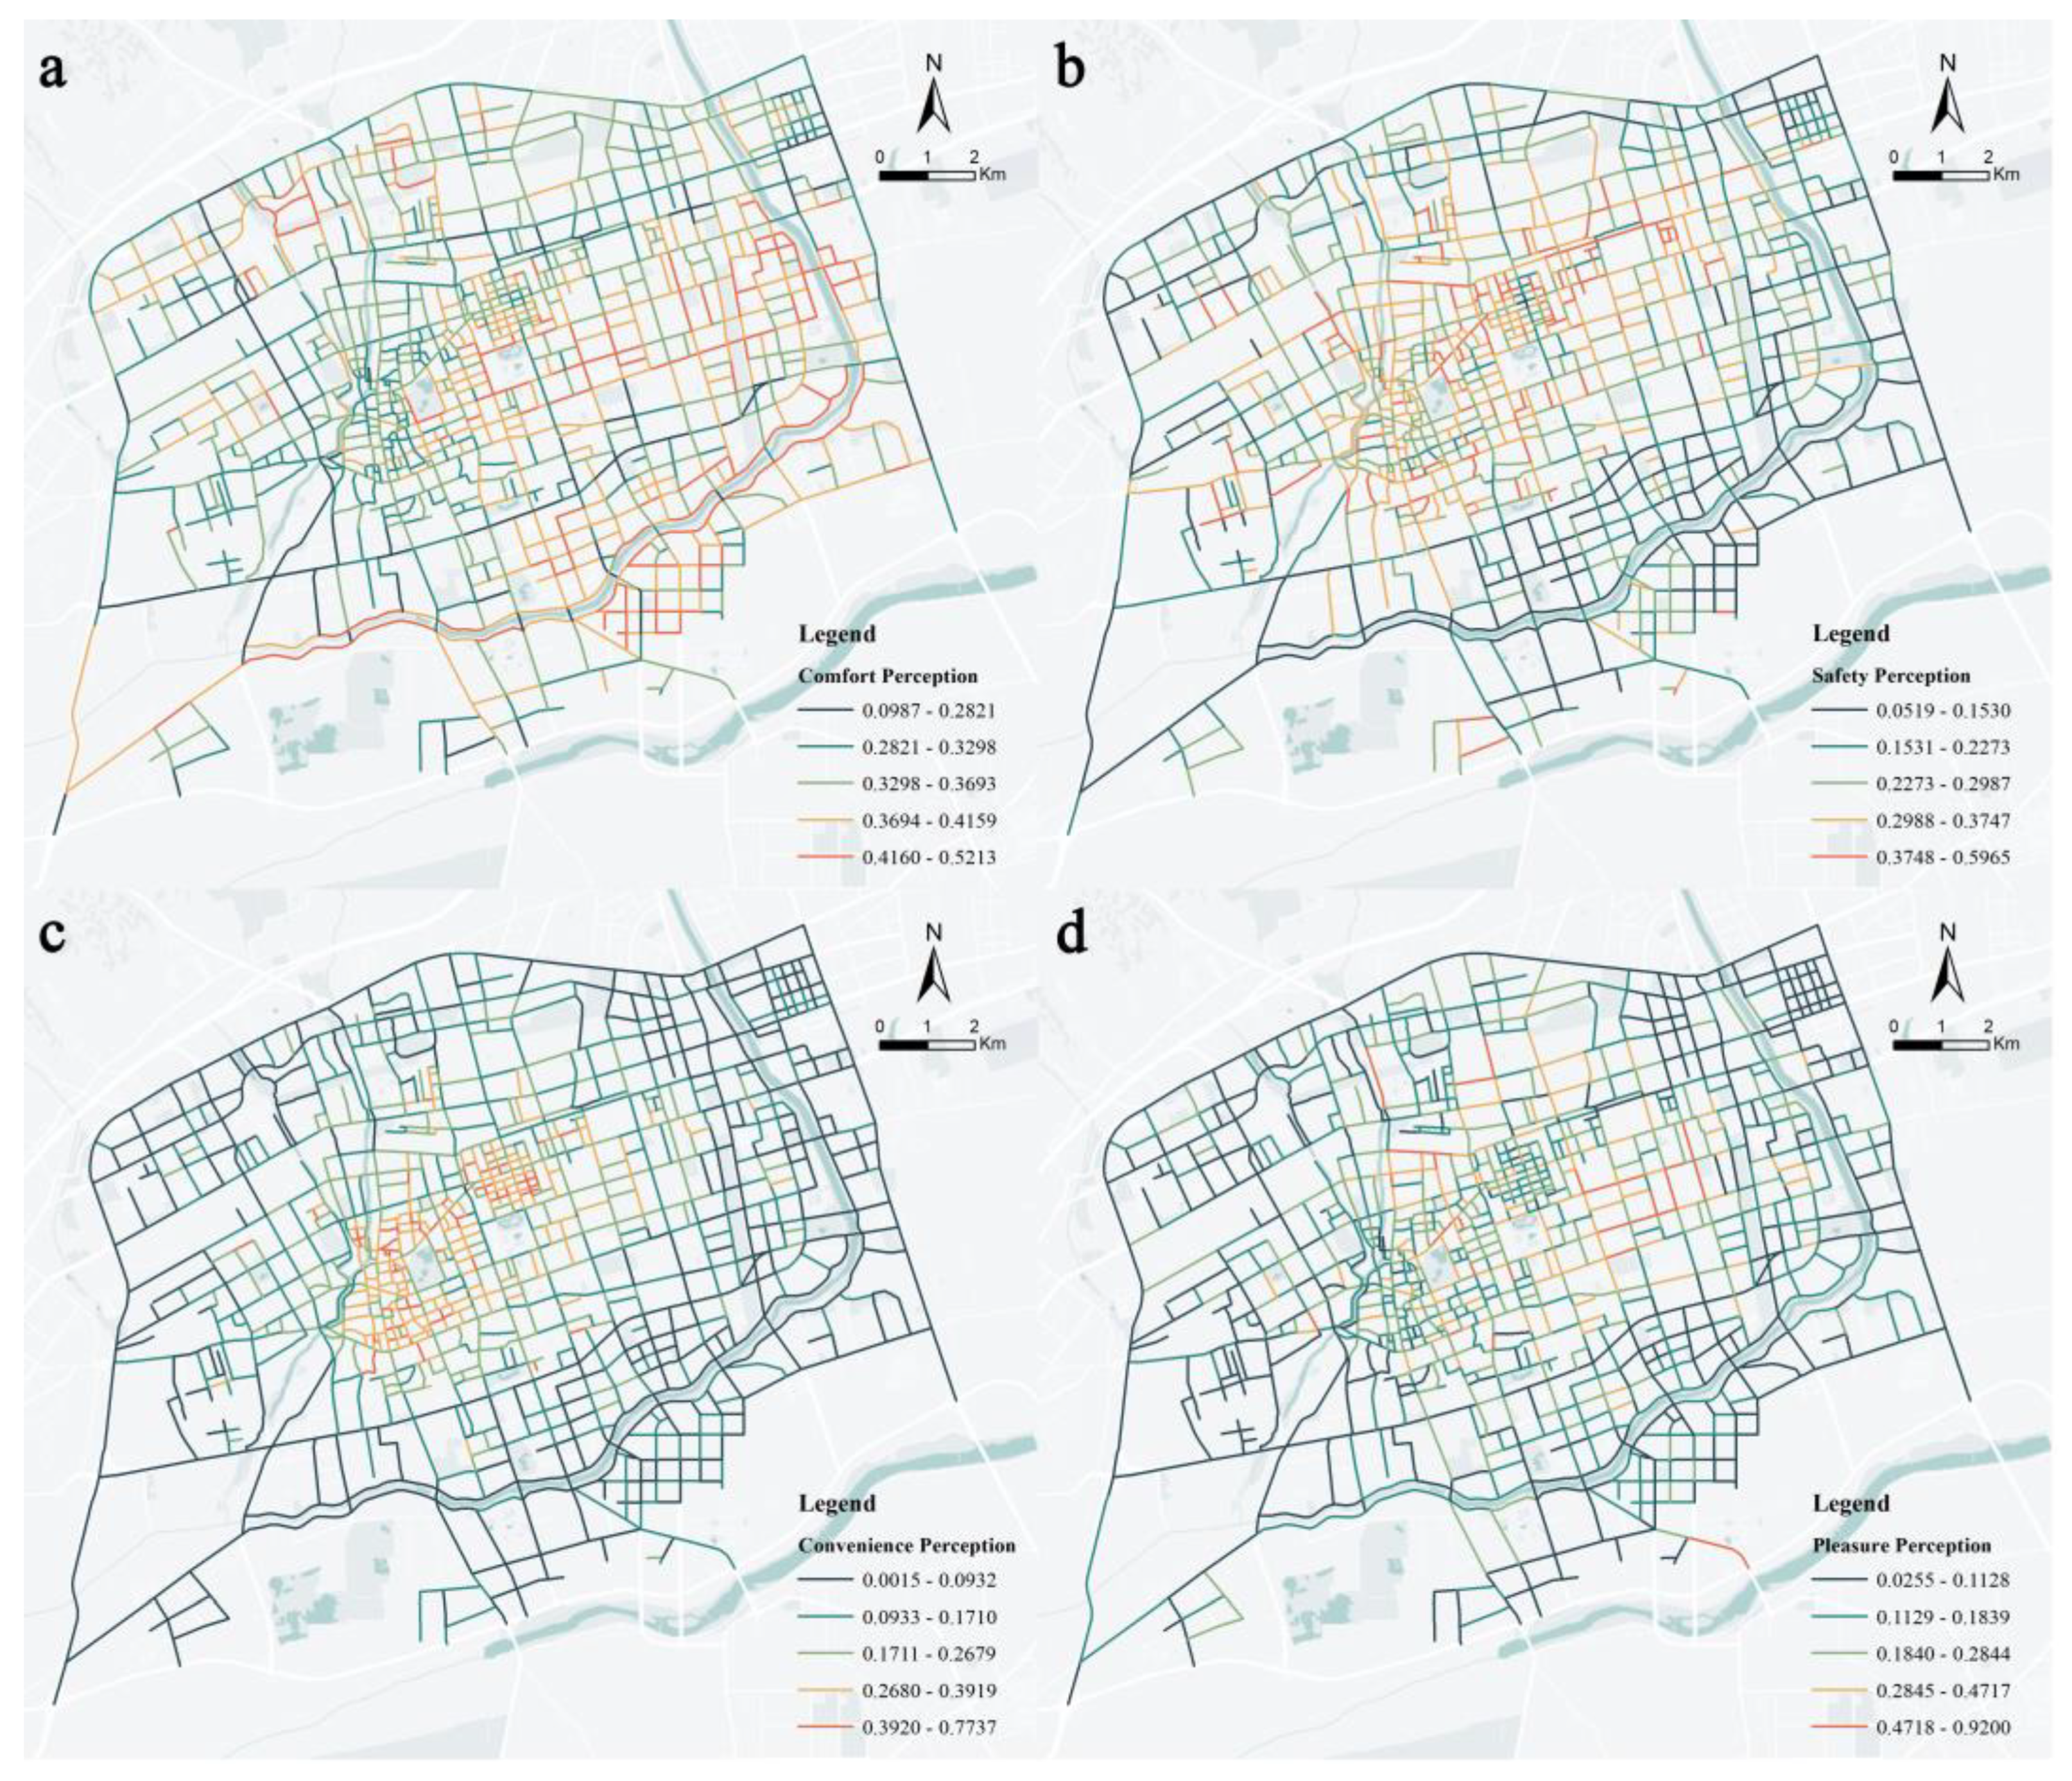
Figure 6.
Spatial distribution of MGWR coefficients: (a) Constant term, (b) Comfort Perception, (c) Safety Perception, (d) Convenience Perception, and (e) Pleasure Perception.
Figure 6.
Spatial distribution of MGWR coefficients: (a) Constant term, (b) Comfort Perception, (c) Safety Perception, (d) Convenience Perception, and (e) Pleasure Perception.
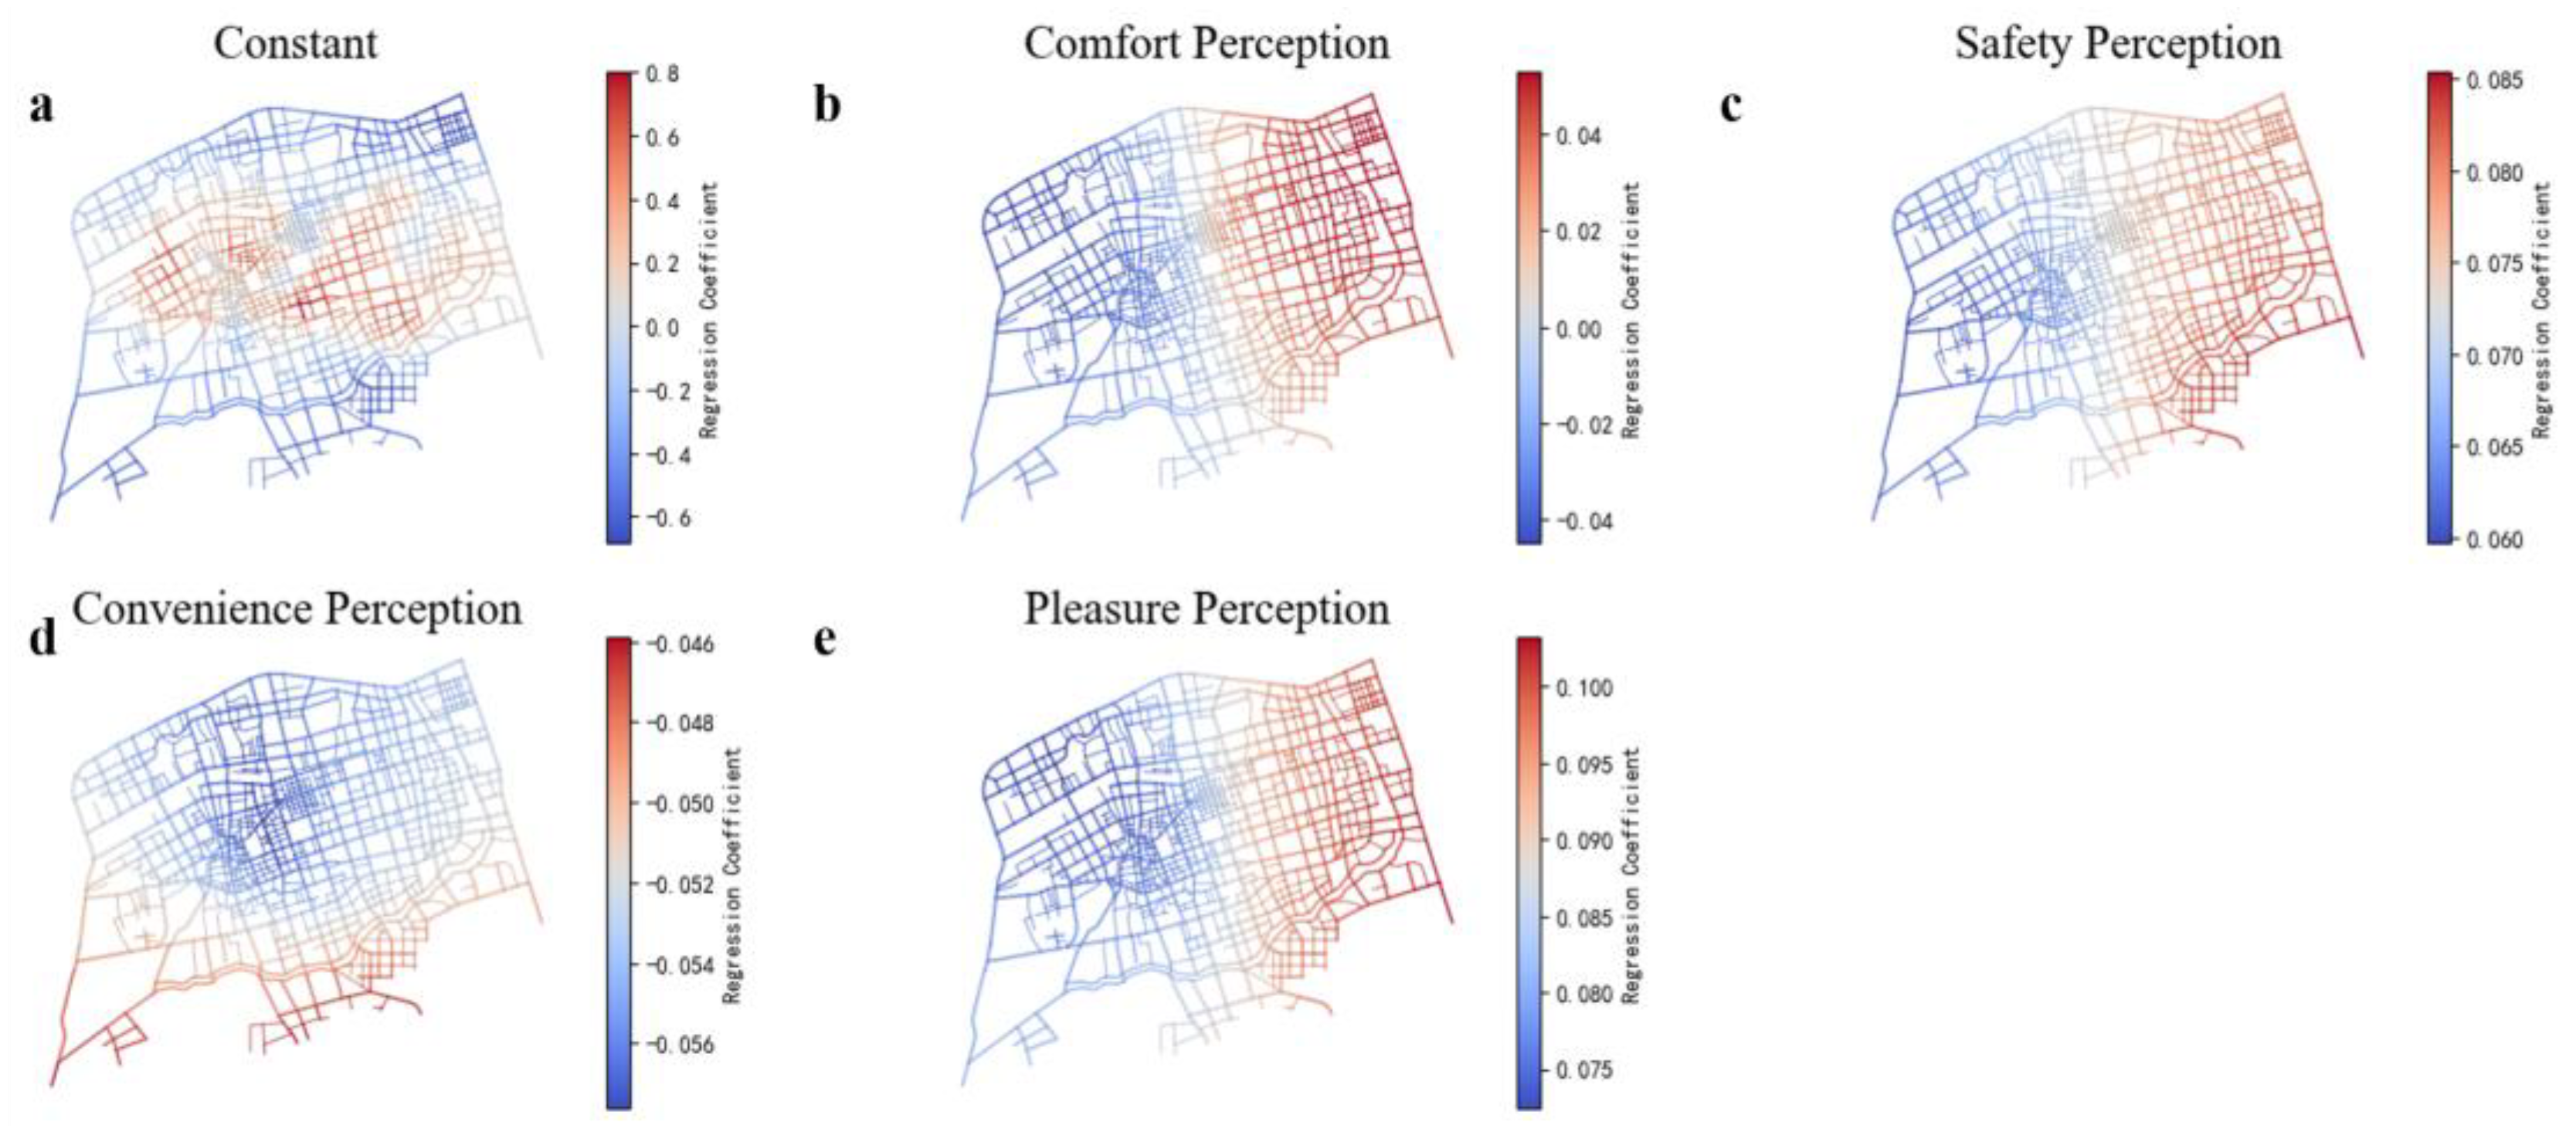
Figure 7.
SHAP value distribution for built environment perception features. The x-axis shows the SHAP value (impact on model output), and colors represent feature values (red = high, blue = low).
Figure 7.
SHAP value distribution for built environment perception features. The x-axis shows the SHAP value (impact on model output), and colors represent feature values (red = high, blue = low).
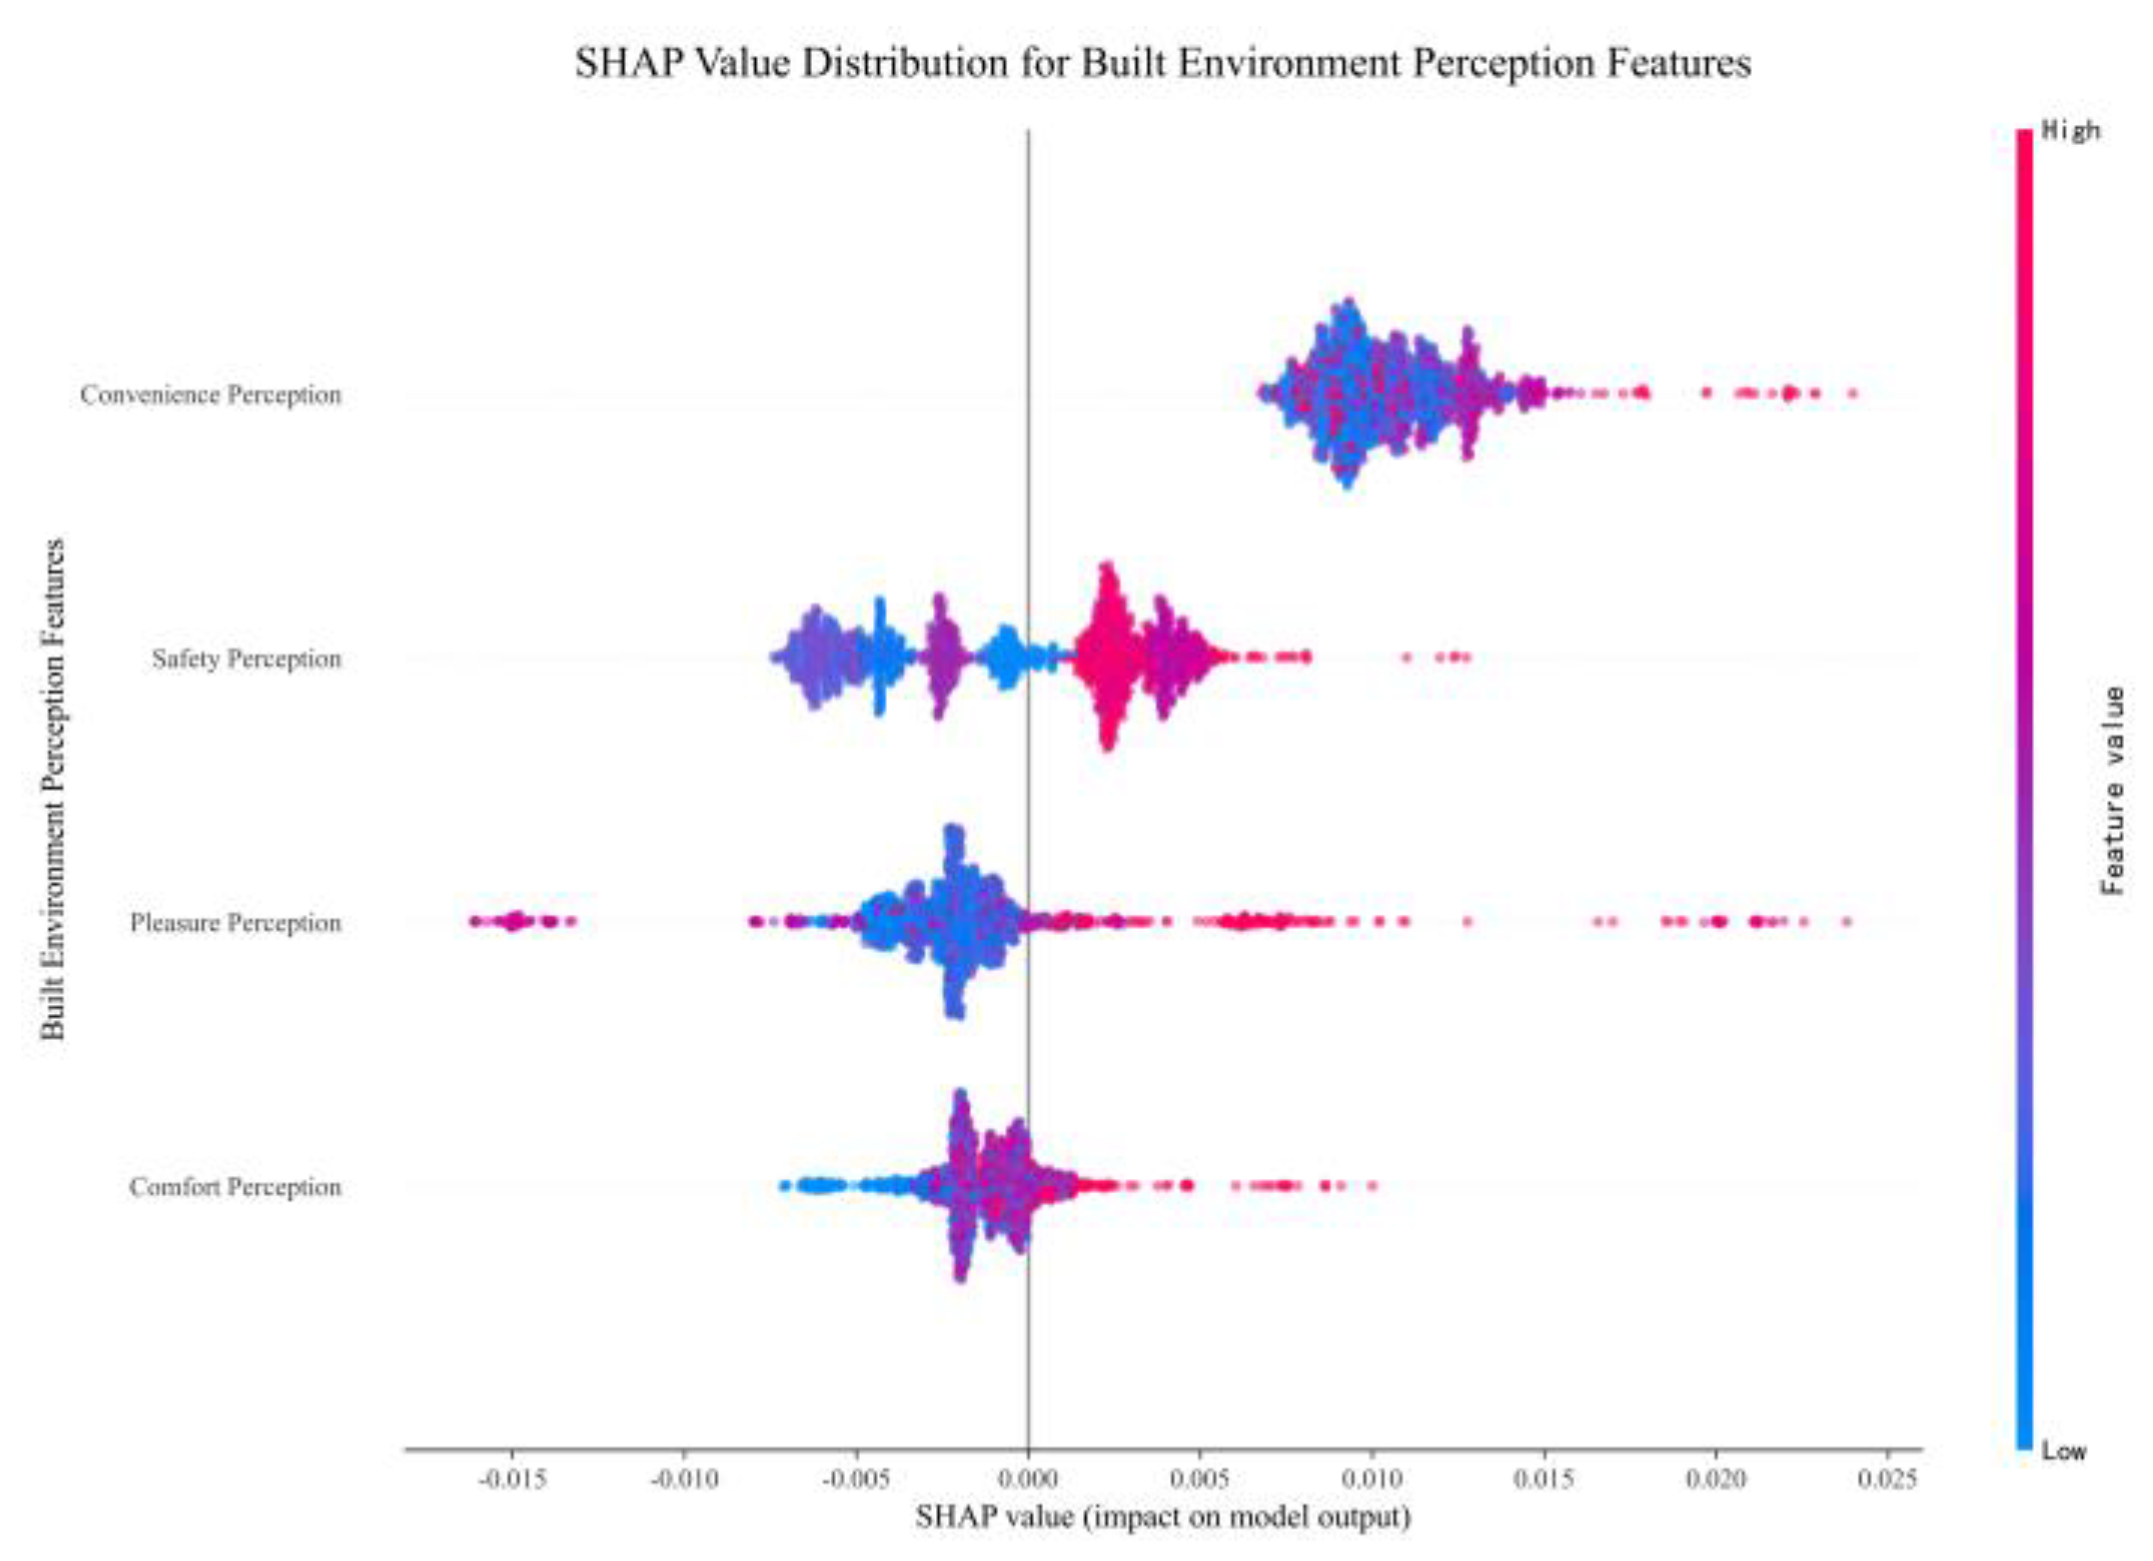
Figure 8.
SHAP dependence plots showing the nonlinear relationships between each perception dimension and street vitality. The y-axis represents the SHAP value, while the x-axis shows the feature value.
Figure 8.
SHAP dependence plots showing the nonlinear relationships between each perception dimension and street vitality. The y-axis represents the SHAP value, while the x-axis shows the feature value.
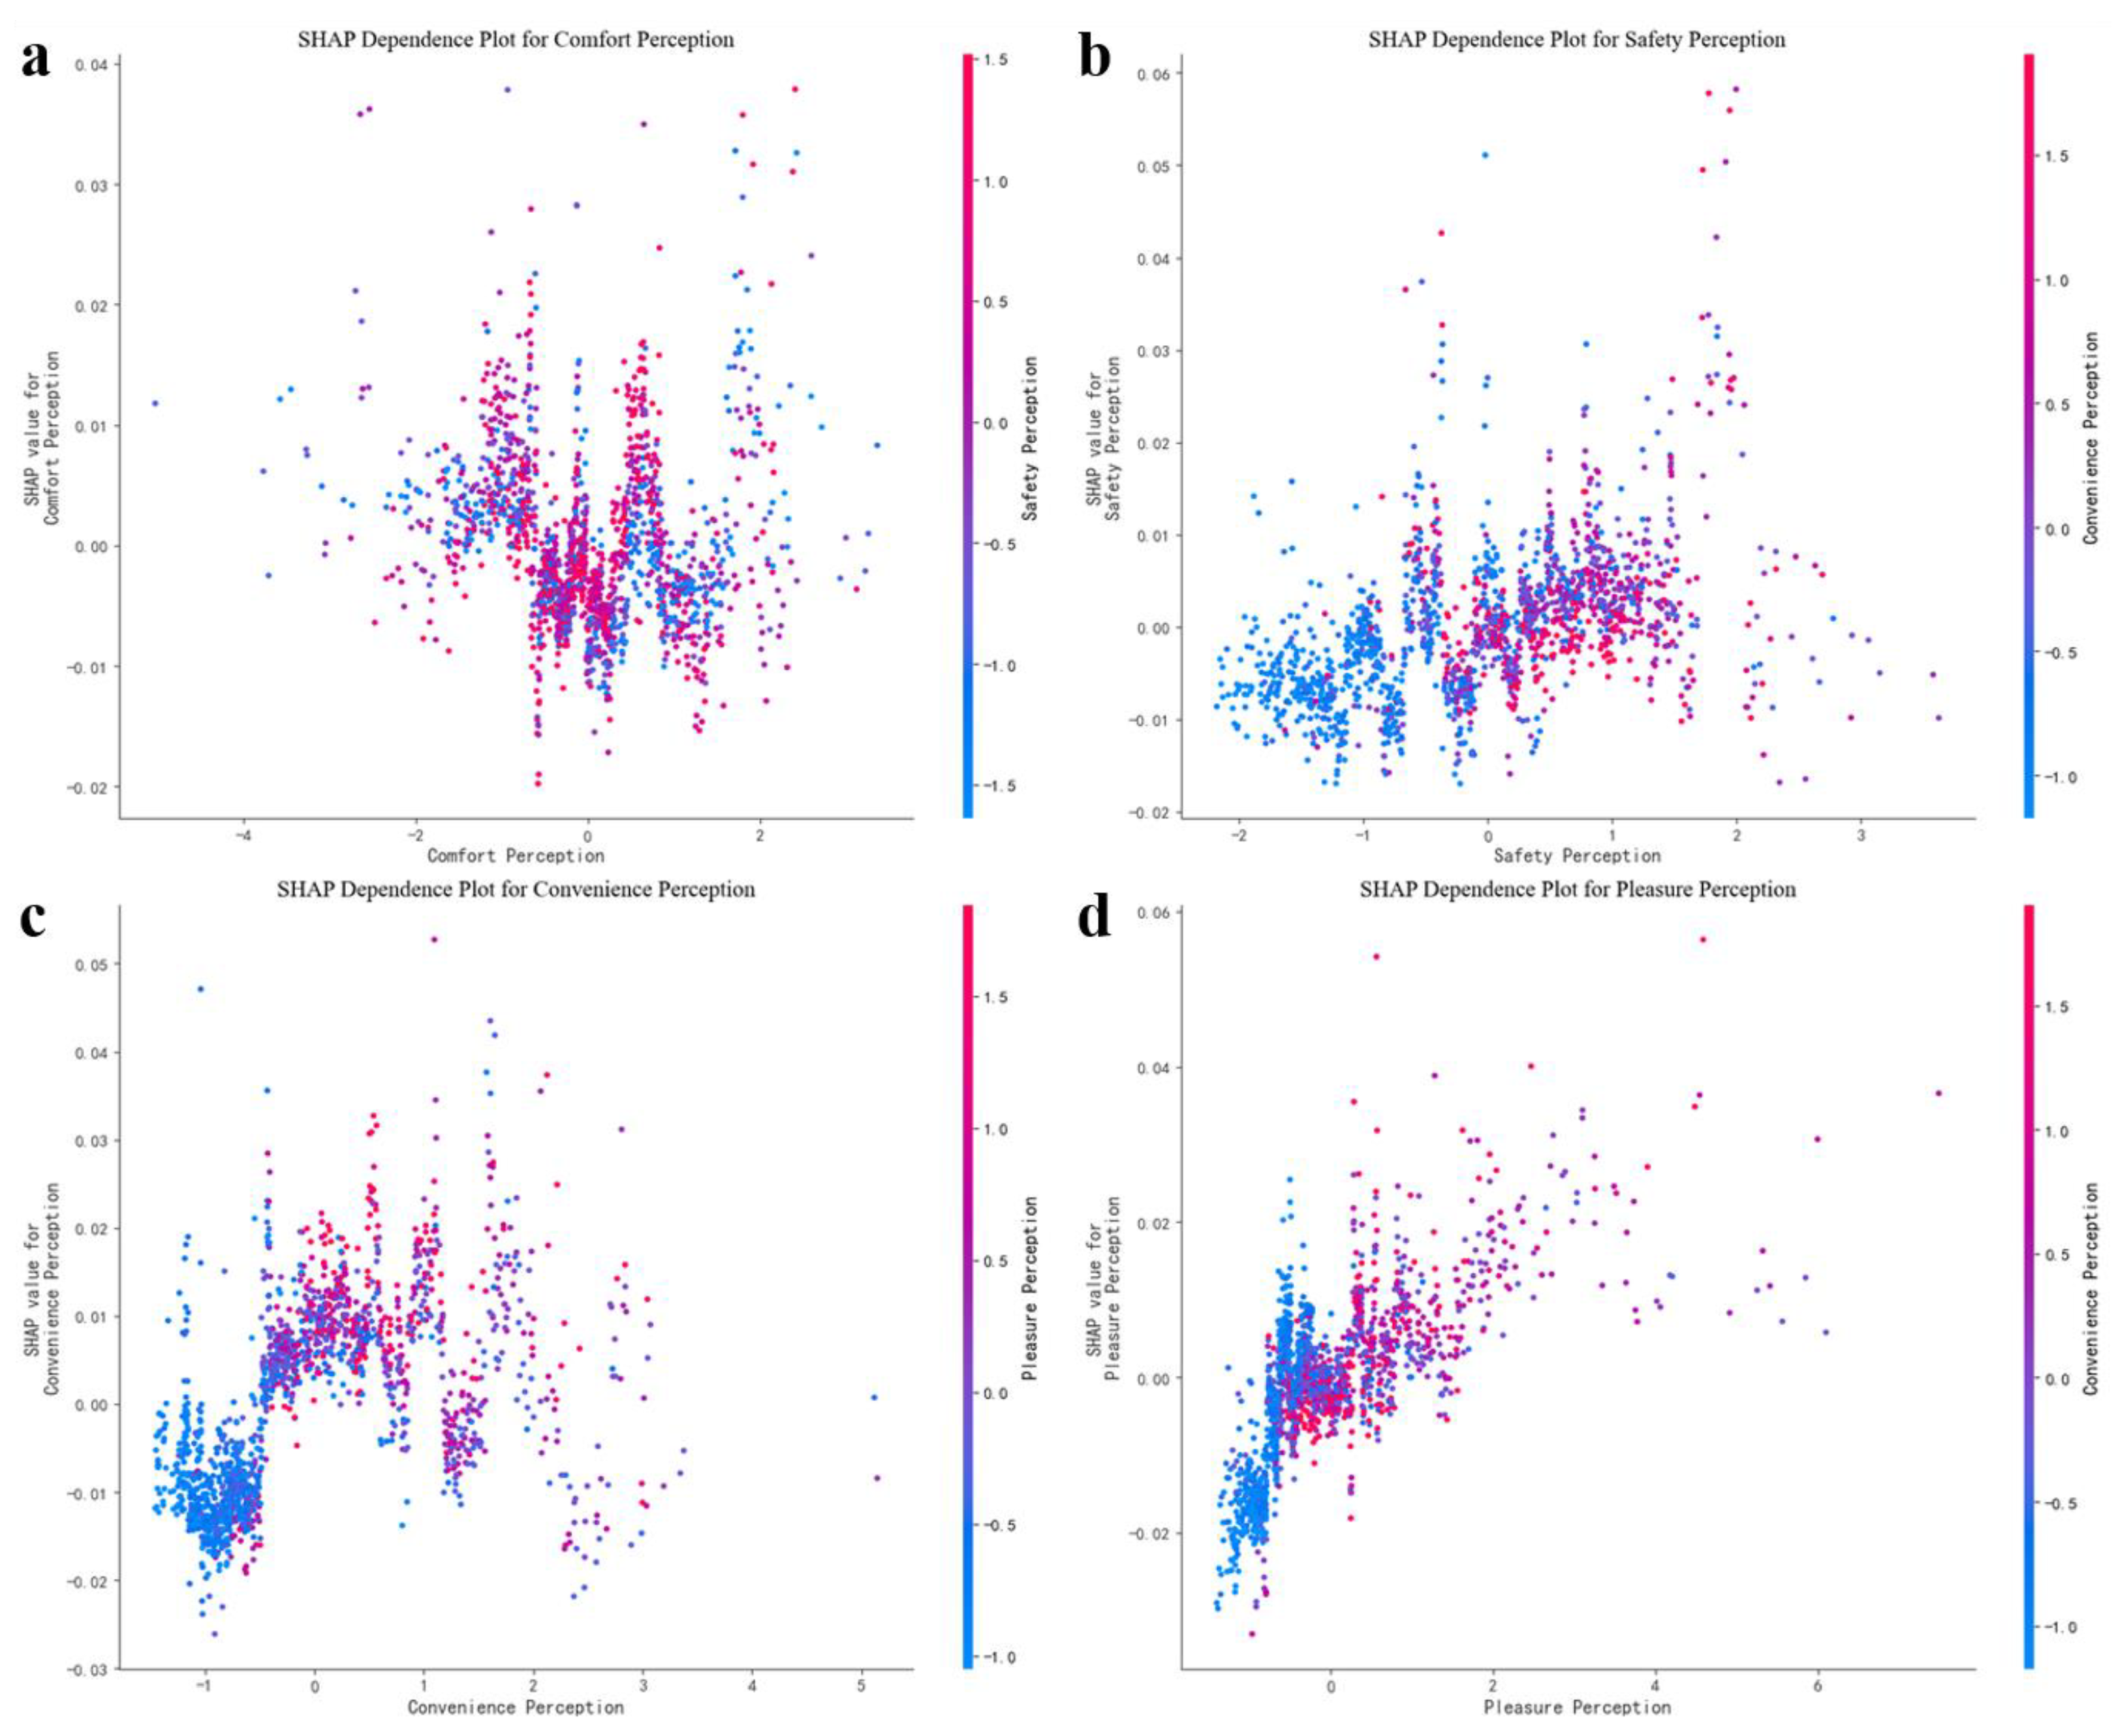
Figure 9.
Spatial distribution of SHAP values for each perception dimension: (a) Comfort Perception, (b) Safety Perception, (c) Convenience Perception, and (d) Pleasure Perception.
Figure 9.
Spatial distribution of SHAP values for each perception dimension: (a) Comfort Perception, (b) Safety Perception, (c) Convenience Perception, and (d) Pleasure Perception.
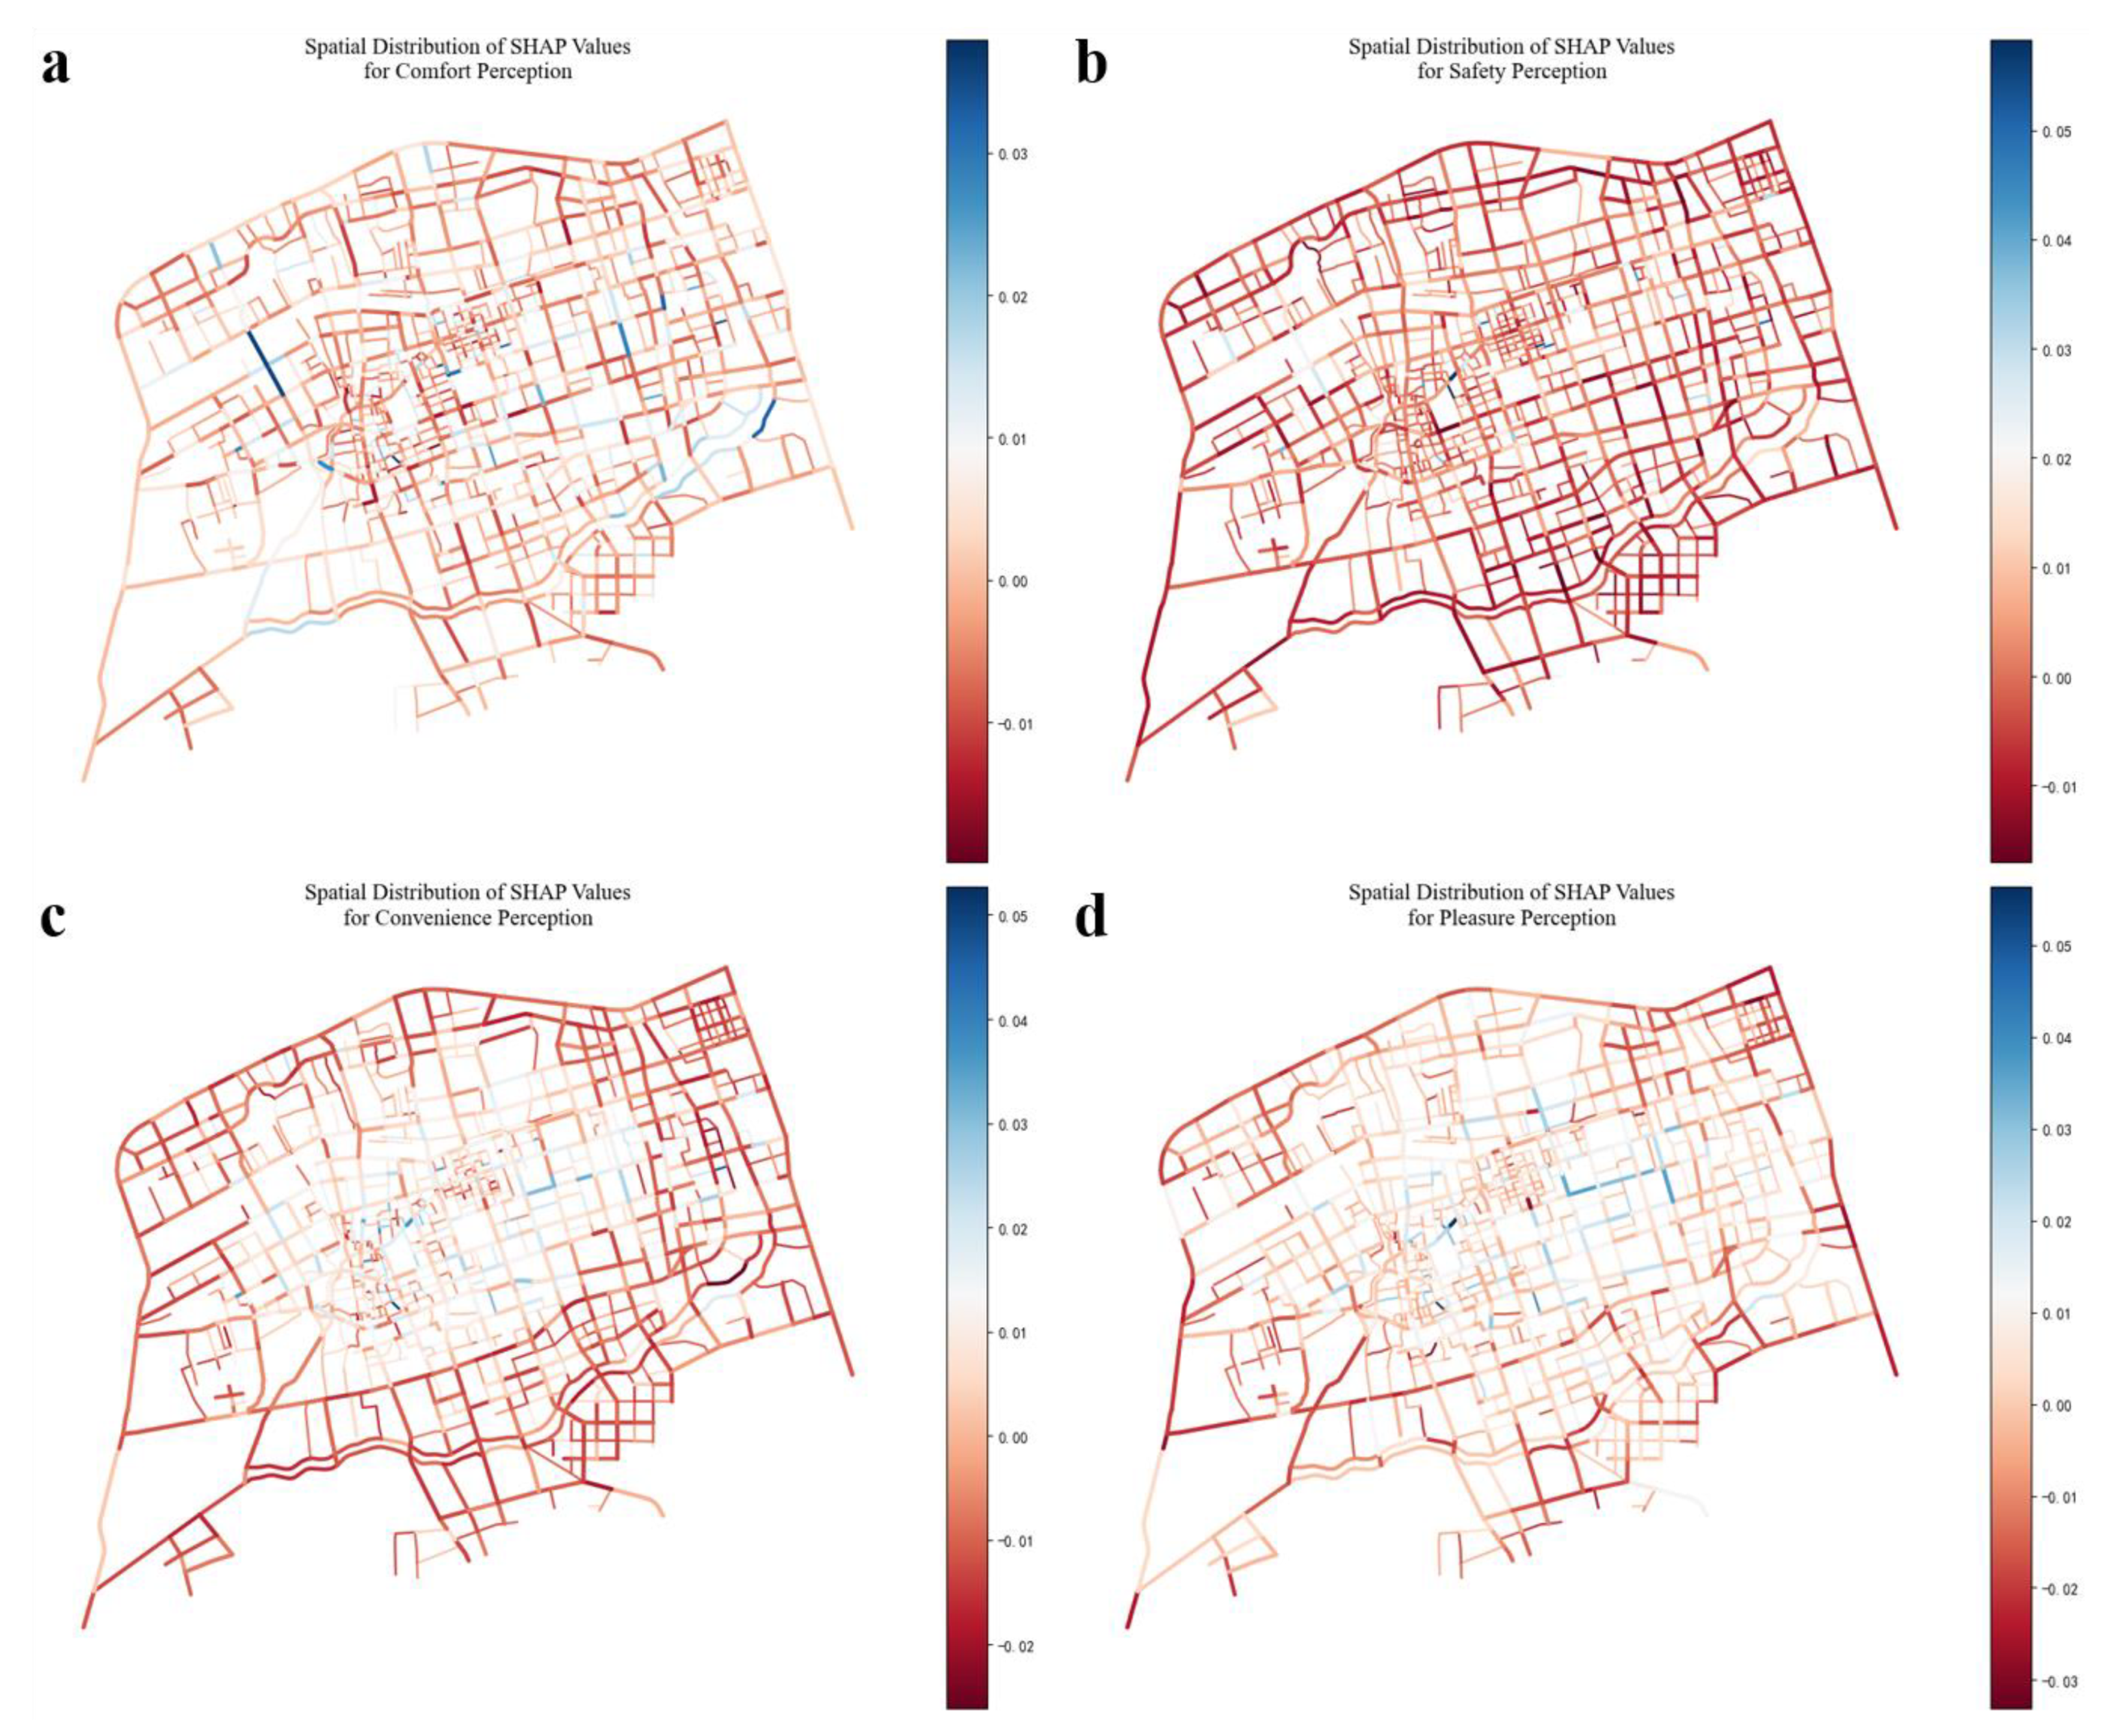

Table 1.
Calculation Methods for Street Vitality and Built Environment Perception Variables.
| Category | Variable | Sub-variable | Formula | Description |
|---|---|---|---|---|
| Street Vitality | Social Vitality | Population Density Index (PDI) | : street area | |
| Vitality Stability Index (VSI) | : number of time periods | |||
| Economic Vitality | Commercial Facility Density (CFD) | : street length | ||
| Cultural Vitality | Cultural Facility Density (CuFD) | : different types of cultural facilities | ||
| Built Environment Perception | Comfort Perception | Green View Index (GVI) | : total pixels | |
| Sky View Index (SVI) | : sky pixels | |||
| Interface Enclosure Index (IEI) | : building/wall pixels | |||
| Street Cleanliness Index (SCI) | Machine Learning Score | Based on street view image analysis | ||
| Safety Perception | Sidewalk Visibility Index (SwVI) | : sidewalk pixels | ||
| Traffic Safety Facility Index (TSFI) | : safety facility pixels | |||
| Vehicle Impact Index (VII) | : vehicle pixels | |||
| Pedestrian Safety Index (PSI) | Machine Learning Score | Based on street view image analysis | ||
| Convenience Perception | Function Density Index (FDI) | : number of POIs | ||
| Land Use Diversity Index (LDI) | POIs | |||
| Public Transit Index (PTI) | : number of transit POIs | |||
| Facility Convenience Index (FCI) | : facility pixels | |||
| Pleasure Perception | Color Richness Index (CRI) | : total analyzed area | ||
| Feature Business Index (FBI) | : number of featured businesses | |||
| Landscape Aesthetic Index (LAI) | Machine Learning Score | Based on street view image analysis | ||
| Cultural Atmosphere Index (CAI) | Machine Learning Score | Based on street view image analysis |
Note: All machine learning scores are derived from trained perception models using street view imagery analysis.
Table 2.
Summary of Multi-scale Geographically Weighted Regression Results.
| Variable | Bandwidth | ENP_j | Adj t-val (95%) | Adj alpha (95%) | Mean | STD | Min | Median | Max |
|---|---|---|---|---|---|---|---|---|---|
| Constant | 79.000 | 60.906 | 3.352 | 0.001*** | 0.003 | 0.326 | -0.683 | 0.047 | 0.802 |
| Comfort Perception | 1477.000 | 2.219 | 2.283 | 0.023* | 0.003 | 0.032 | -0.045 | 0.000 | 0.053 |
| Safety Perception | 1642.000 | 1.409 | 2.105 | 0.035* | 0.073 | 0.007 | 0.060 | 0.073 | 0.085 |
| Convenience Perception | 1642.000 | 1.145 | 2.019 | 0.044* | -0.054 | 0.003 | -0.058 | -0.054 | -0.046 |
| Pleasure Perception | 1619.000 | 1.408 | 2.104 | 0.036* | 0.086 | 0.009 | 0.072 | 0.084 | 0.103 |
Note: ENP_j represents the effective number of parameters; STD is the standard deviation of the local coefficient estimates. Significance levels: *** p < 0.001, ** p < 0.01, * p < 0.05.*.
Disclaimer/Publisher’s Note: The statements, opinions and data contained in all publications are solely those of the individual author(s) and contributor(s) and not of MDPI and/or the editor(s). MDPI and/or the editor(s) disclaim responsibility for any injury to people or property resulting from any ideas, methods, instructions or products referred to in the content. |
© 2025 by the authors. Licensee MDPI, Basel, Switzerland. This article is an open access article distributed under the terms and conditions of the Creative Commons Attribution (CC BY) license (http://creativecommons.org/licenses/by/4.0/).
Copyright: This open access article is published under a Creative Commons CC BY 4.0 license, which permit the free download, distribution, and reuse, provided that the author and preprint are cited in any reuse.


